Article

Traffic-Driven Spatial and Seasonal Variability of Rainwater Chemistry: Insights from Multivariate Analysis in Bucharest, Romania

by
Mirela Alina Sandu
1,
Denis Mihailescu
2 and
Veronica Ivanescu
1,*
1
Faculty of Land Reclamation and Environmental Engineering, University of Agronomic Sciences and Veterinary Medicine of Bucharest, 59 Marasti Blvd., District 1, 011464 Bucharest, Romania
2
National Meteorological Administration, 97 Bucharest-Ploiesti Street, District 1, 013686 Bucharest, Romania
*
Author to whom correspondence should be addressed.
Water 2026, 18(16), 1956; https://doi.org/10.3390/w18161956
Submission received: 12 June 2026 / Revised: 23 July 2026 / Accepted: 6 August 2026 / Published: 10 August 2026
(This article belongs to the Section Water Quality and Contamination)

Abstract

Urban rainwater is an increasingly important alternative water resource, but its suitability for harvesting and reuse depends on a water quality that varies strongly with local emissions and season—a variability not previously characterised for Bucharest, the Romanian capital. This study addresses that gap by evaluating the physicochemical quality of directly collected rainwater at six contrasting sites (four traffic-influenced, two urban-green) in District 1, Bucharest, over 37 rainfall events sampled between January and November 2025. Samples were analysed for pH, electrical conductivity, turbidity, true colour, total hardness, chloride, inorganic nitrogen species (NO3–N, NO2–N, NH4+–N) and trace metals (Zn, Cd, Pb), and interpreted using descriptive statistics, Pearson’s correlation and Principal Component Analysis (PCA). Traffic-influenced sites were consistently more contaminated than urban-green sites, with mean concentrations higher by 47% for electrical conductivity (EC), 64% for cadmium and 67% for zinc. PCA resolved two factors: traffic-related particulate pollution (Cd, Pb, Zn) and secondary atmospheric nitrogen processing. Cadmium reached the World Health Organisation (WHO) indicative guideline, and lead exceeded the European Union (EU) parametric value at traffic sites, while ammonium exceeded 0.50 mg/L in most traffic-site events. These findings show that harvested rainwater quality is strongly site-dependent and that high-traffic locations require targeted treatment before any potable reuse.

1. Introduction

Urban rainwater has become an increasingly important component of sustainable water management, particularly in the context of climate change, growing water demand, and the need to identify alternative water resources [1,2]. In many rapidly urbanising regions, conventional water supplies are increasingly under pressure from population growth, land-use change, and climate-driven variability in precipitation patterns, making the identification and characterisation of alternative water sources a strategic priority [2,3].
Rainwater harvesting can reduce pressure on conventional water supplies and improve water security for a wide range of non-potable uses, from roof-runoff collection to peri-urban harvesting ponds [1,4,5,6,7,8]. However, the feasibility of such approaches strongly depends on the initial quality of rainwater and its variability under different environmental conditions [9,10]. Surface water runoff in urban areas is strongly influenced by land use and urbanisation, which increase impermeable surfaces, reduce infiltration capacity, and enhance pollutant transport toward receiving water bodies; the implementation of sustainable urban drainage systems has been identified as a key strategy to mitigate these effects in Romanian cities as well [11].
The physicochemical composition of rainwater is governed by a complex combination of atmospheric processes and local emission sources. Pollutants originating from traffic, industrial activities, and urban dust resuspension are incorporated into precipitation through wet deposition processes, leading to the presence of ionic and nutrient species and trace metals [12,13,14,15]. At the same time, secondary atmospheric reactions, including the oxidation of nitrogen oxides and the neutralisation of ammonia, contribute to the formation of nitrate and ammonium species in precipitation [16]. Rainwater chemistry is further modulated by meteorological factors such as rainfall intensity, duration, seasonality, and antecedent dry periods, which control pollutant accumulation on urban surfaces and subsequent wash-off dynamics during precipitation events [17,18].
Despite extensive research, there is still no consensus regarding the relative importance of local emission sources versus atmospheric transformation processes in determining rainwater composition. Some studies emphasize the dominant role of traffic-related particulate inputs, particularly in urban environments, where heavy metals and suspended solids are closely linked to road traffic intensity [13,19,20]. In contrast, other studies highlight the importance of atmospheric chemistry and long-range transport in controlling nutrient species and overall rainwater composition, with nitrogen deposition representing a particularly significant pathway in urbanised regions with mixed emission profiles [9,21,22].
Urban areas characterised by heterogeneous land use provide an opportunity to better understand these contrasting controls on rainwater chemistry. Traffic-influenced zones and urban-green areas represent endmembers of a pollution gradient that can be systematically exploited to disentangle the contributions of local emission sources from those of regional atmospheric processes. Bucharest, one of the largest cities in Eastern Europe, presents strong spatial contrasts between high-traffic corridors and extensive urban-green spaces, making it a particularly suitable case study for investigating the influence of local conditions on wet deposition quality. Nevertheless, integrated studies combining event-based sampling, land-use differentiation, and multivariate statistical analysis remain limited for this region, and no systematic assessment of rainwater chemistry has been reported for the Romanian capital to date.
No harmonised regulatory thresholds exist for rainwater quality in Southern and Eastern Europe [23]. In the absence of dedicated regulatory standards for atmospheric precipitation, two complementary reference frameworks are commonly employed in the literature. First, results from European atmospheric monitoring networks, particularly the European Monitoring and Evaluation Programme (EMEP), provide background concentration ranges for ionic and nutrient species and trace elements in precipitation across the continent, enabling contextual comparison with urban monitoring data [24,25]. These background values, together with published data from comparable urban environments in Southern and Eastern Europe [19,20,22], serve as the primary scientific benchmark for interpreting the results of the present study. Second, drinking water quality guidelines established by the World Health Organisation [26], the European Union [27], and the United States [28,29] are widely referenced in rainwater harvesting studies as indicative thresholds for assessing the suitability of collected precipitation for potable reuse after appropriate treatment. In the present study, drinking water parametric values are therefore used solely as indicative thresholds for risk interpretation in the context of rainwater harvesting, and not as direct compliance criteria applicable to atmospheric precipitation.
Despite extensive international research on precipitation chemistry, no integrated, event-based assessment of urban rainwater quality has been reported for Bucharest, the capital of Romania, and existing Romanian and Carpathian studies have largely addressed regional or bulk-deposition patterns rather than intra-urban, land-use-resolved contrasts. The novelty of the present study lies in combining event-based sampling across four seasons, a paired traffic-influenced versus urban-green site design, and multivariate source identification to characterise, for the first time, the physicochemical quality of directly collected rainwater in the Romanian capital and its relevance for rainwater harvesting.
Accordingly, the objectives of this study are: (i) to quantify a targeted set of physicochemical and chemical quality indicators in directly collected rainwater; (ii) to test whether rainwater quality differs significantly between traffic-influenced and urban-green environments; (iii) to characterise the seasonal variability of these indicators; and (iv) to identify, through multivariate analysis, the dominant factors controlling rainwater composition. We hypothesized that (H1) traffic-influenced sites exhibit significantly higher concentrations of particulate-associated and ionic constituents than urban-green sites, and (H2) that a limited number of independent factors—associated with traffic-related particulate emissions and with secondary atmospheric nitrogen processing—govern the overall composition.

2. Materials and Methods

2.1. Study Area

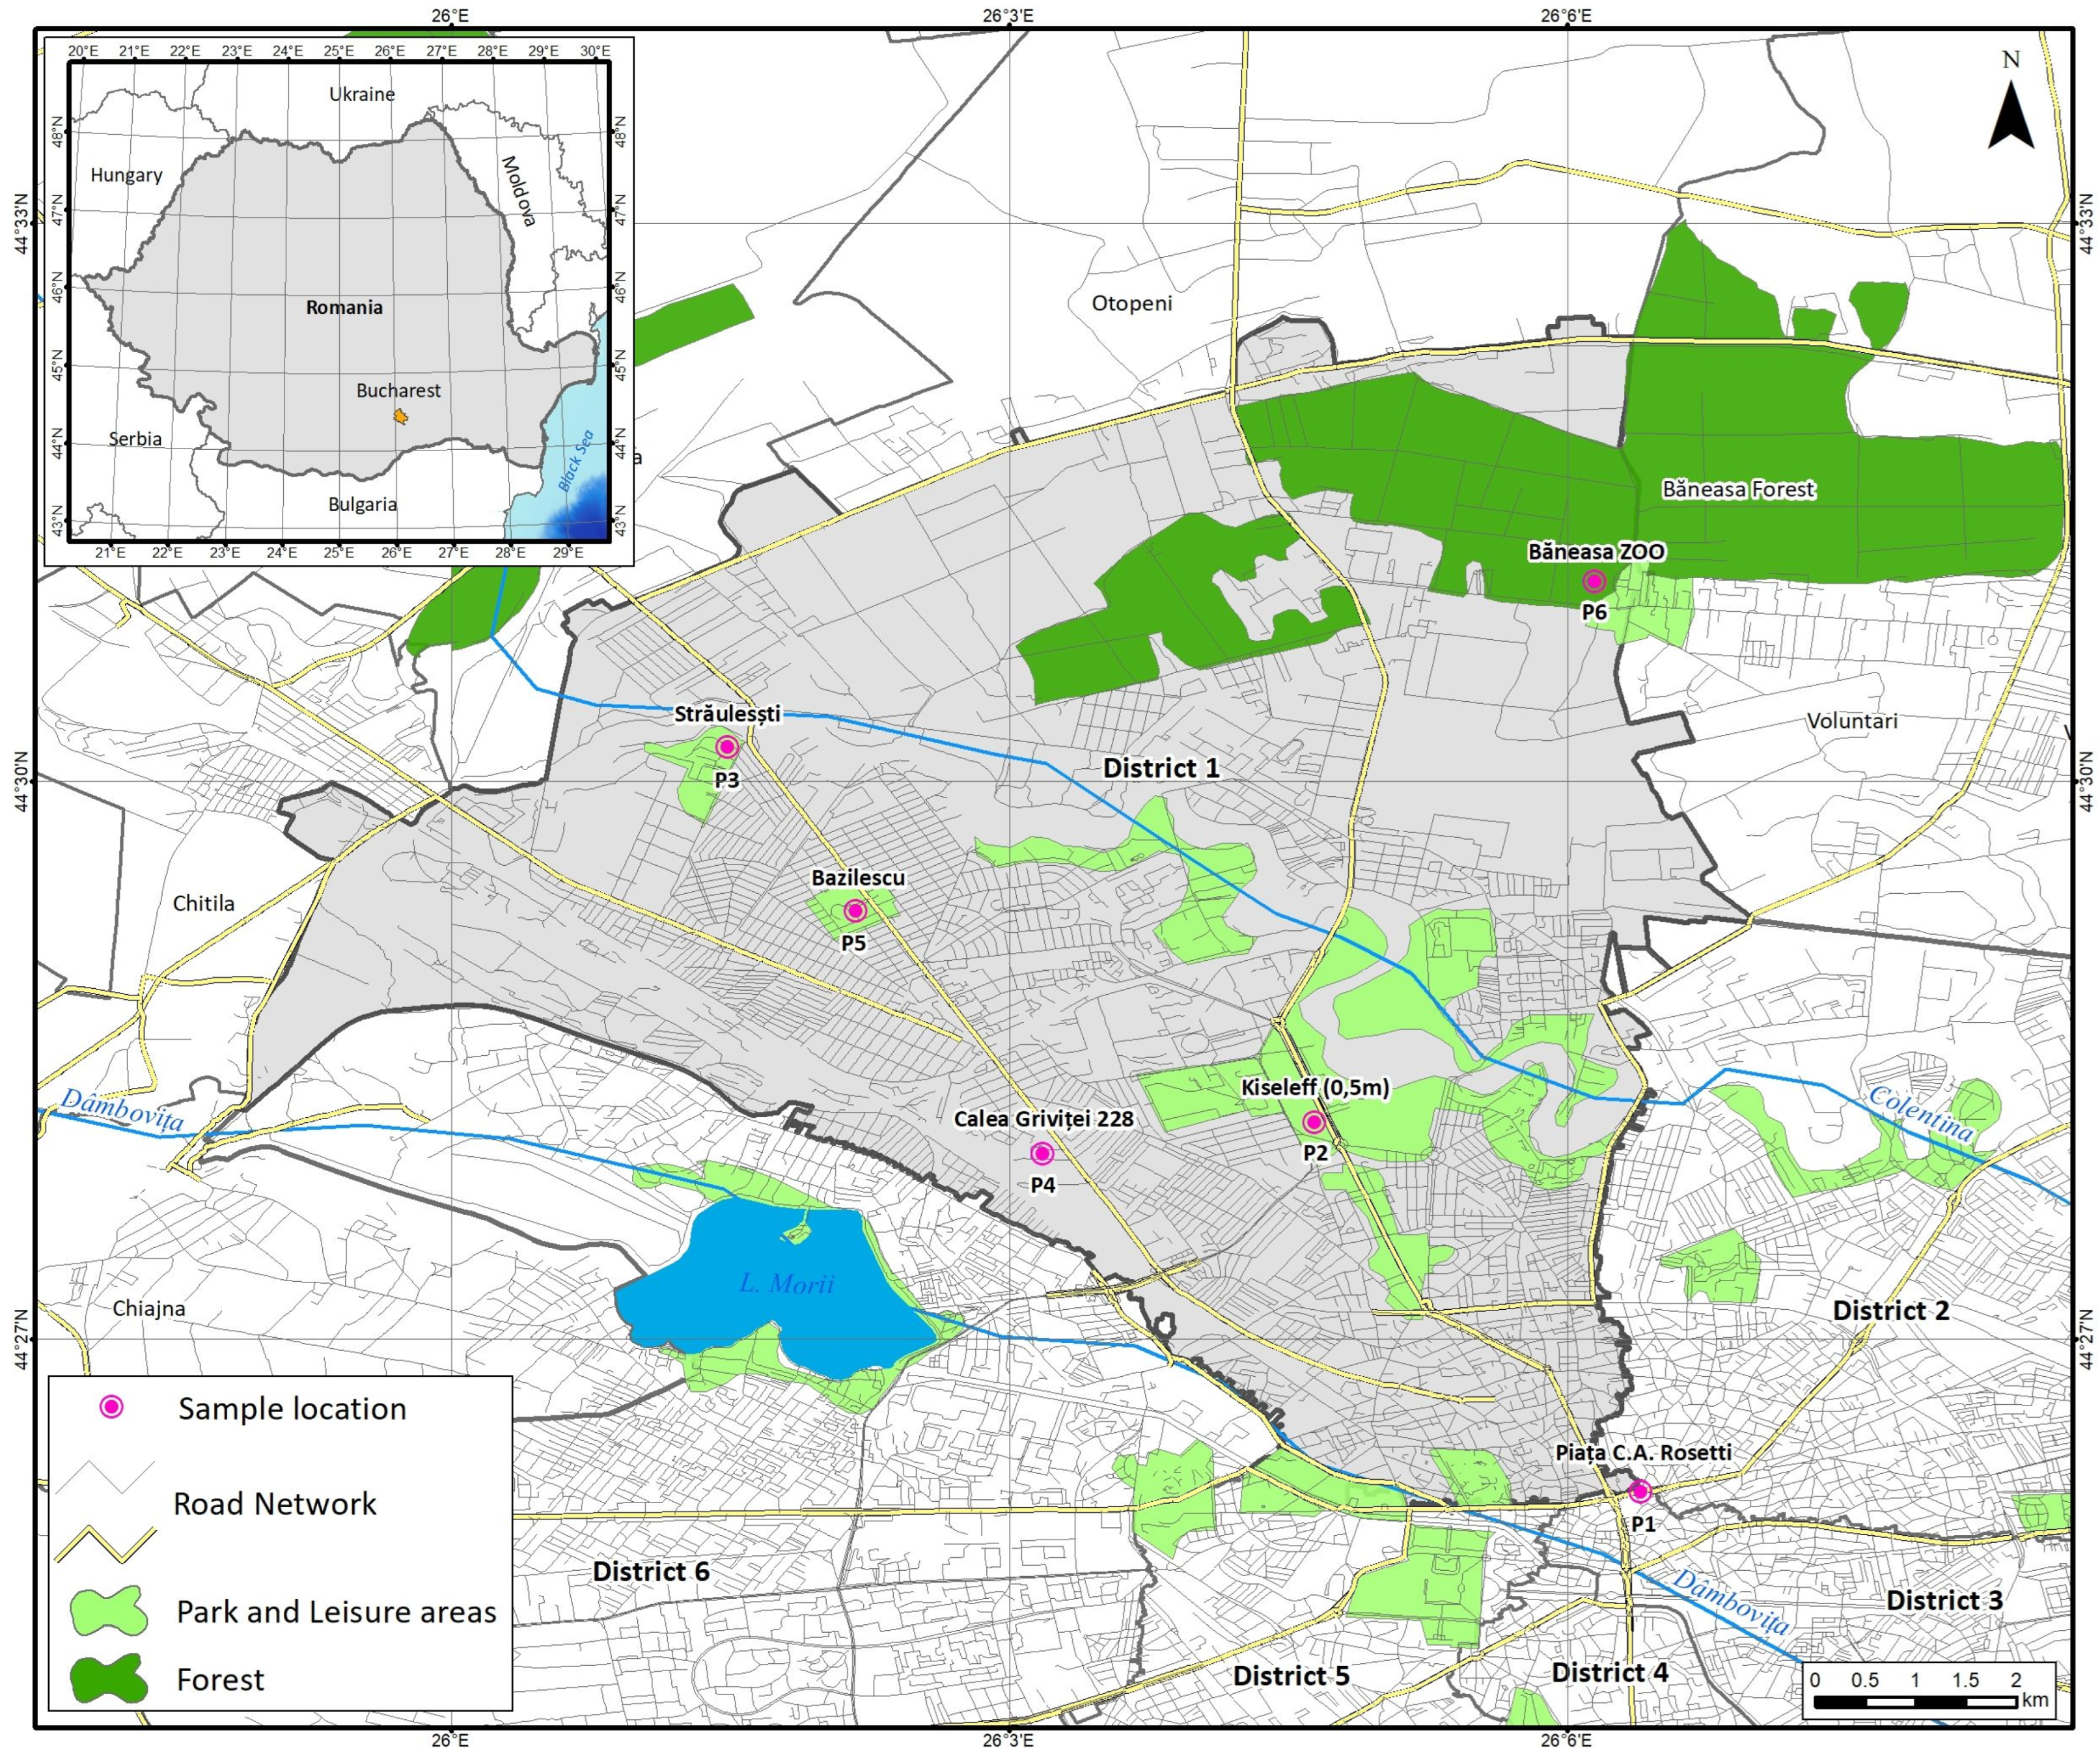
The study was conducted in Bucharest, the capital city of Romania, with sampling locations situated within District 1, located in the northern part of the metropolitan area. District 1 covers approximately 67 km2 and is characterised by a heterogeneous land-use structure including major traffic corridors, residential areas, and extensive urban-green spaces, providing a suitable framework for the comparative assessment of atmospheric wet deposition under contrasting anthropogenic influence levels. The spatial distribution of sampling sites is presented in Figure 1.
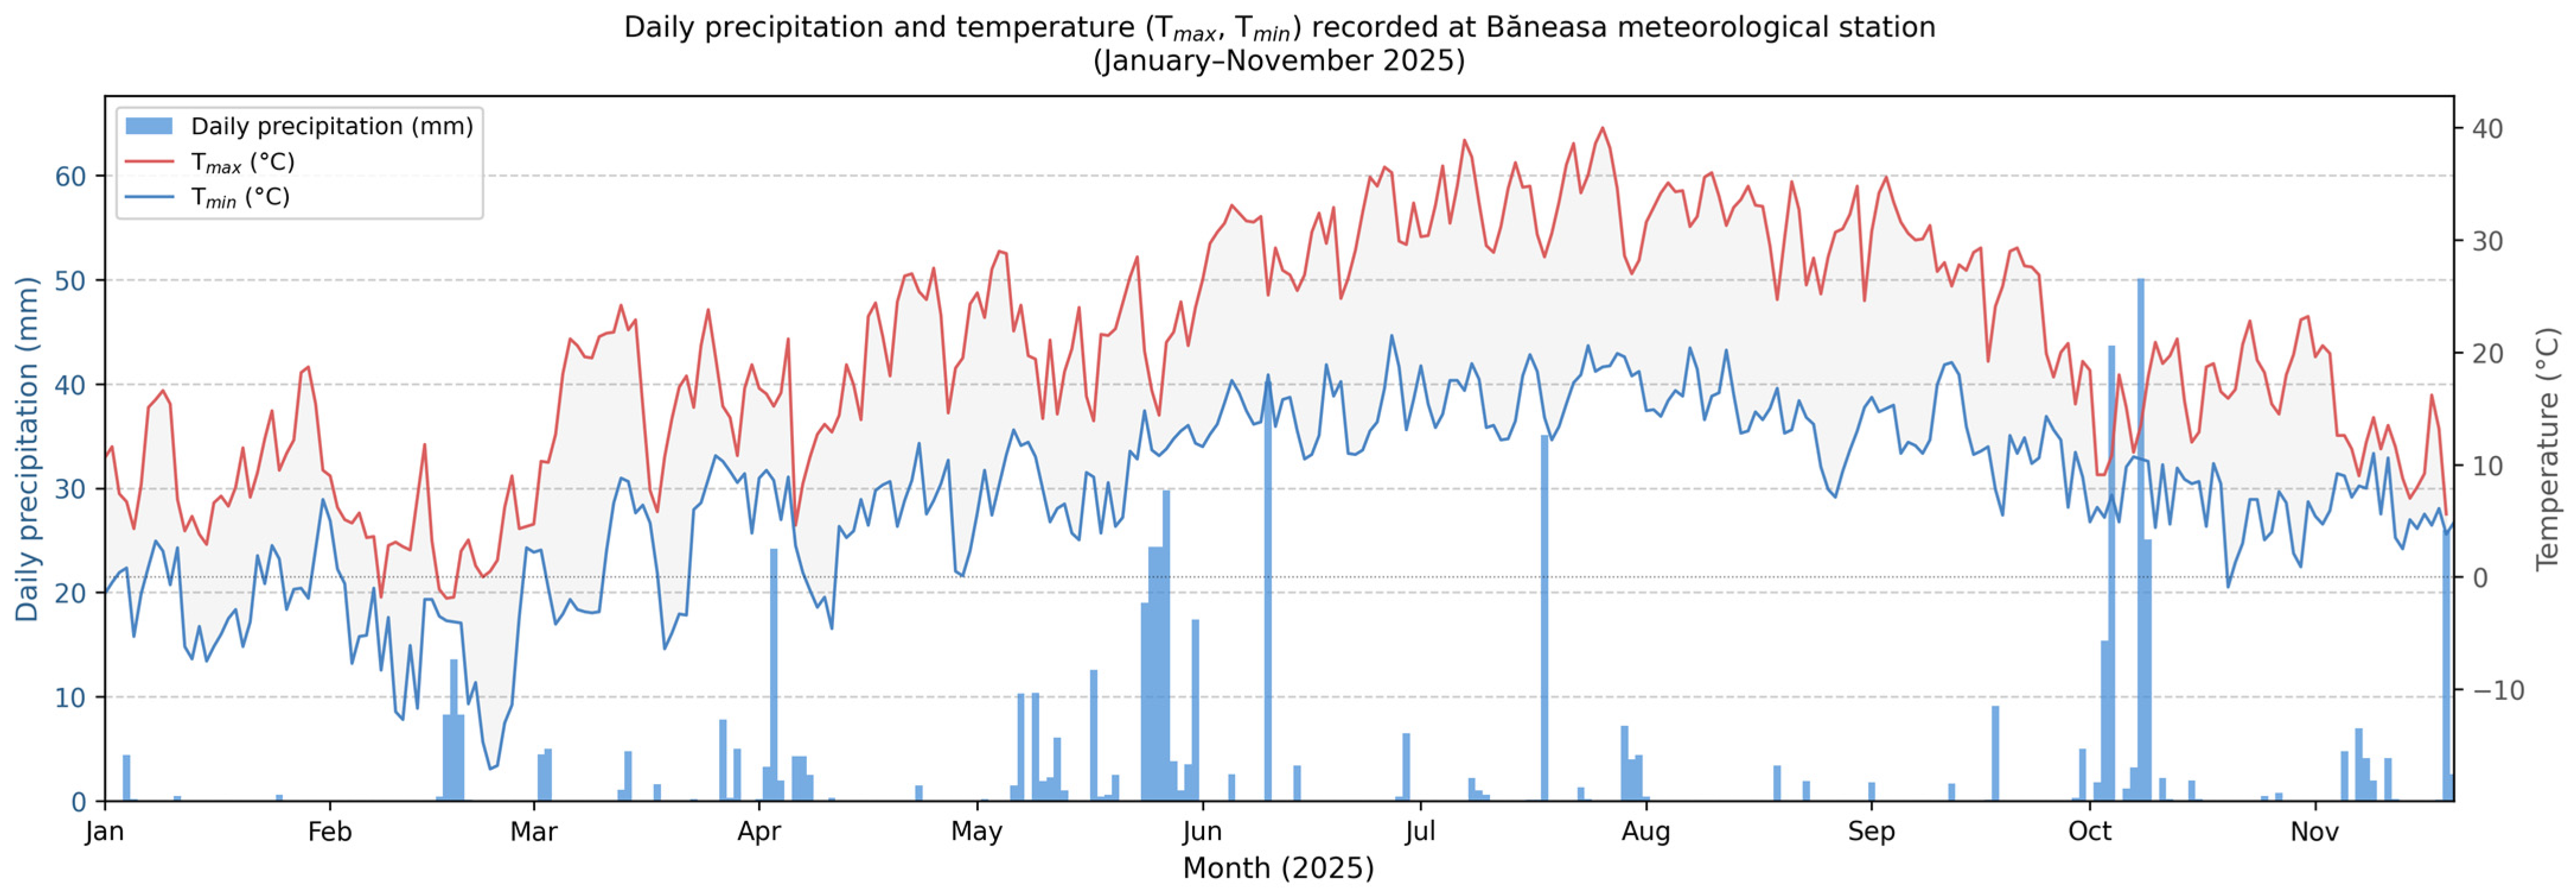
District 1 includes both highly trafficked urban environments and large vegetated areas such as Băneasa Forest and Bazilescu Park, enabling direct comparison of precipitation chemistry between traffic-influenced locations and urban-green areas with reduced direct emission exposure. The study area is located within the Romanian Plain at elevations ranging between approximately 60 and 90 m above sea level. The regional climate is temperate continental, characterised by pronounced seasonal variability with cold winters and warm summers, and mean annual precipitation of approximately 580–600 mm, distributed unevenly across seasons. During the monitoring period (January–November 2025), air temperatures recorded at the Băneasa meteorological station ranged from −17.1 °C (23 February) to 40.0 °C (26 July), reflecting the large thermal amplitude typical of continental urban environments. Precipitation during the study period comprised both stratiform cold-season events and high-intensity convective episodes occurring predominantly during spring and summer.
A total of 37 rainfall events were collected between January and November 2025, covering all four seasons. The seasonal distribution of sampling events is presented in Table 1. Seasonal precipitation characteristics indicate substantially lower rainfall amounts during winter (mean 5.95 mm/event) compared with spring, summer, and autumn. The highest event-level variability was observed during autumn, with individual events reaching up to 50.1 mm, reflecting the occurrence of high-intensity convective precipitation.
Meteorological data used to characterize atmospheric conditions during the monitoring period were obtained from the Băneasa meteorological station operated by the Romanian National Meteorological Administration (Administrația Națională de Meteorologie, ANM) and are presented in Figure 2. Several high-intensity events exceeding 40–50 mm were recorded during summer and autumn.
Six sampling sites were selected to represent contrasting exposure conditions within District 1. Four sites (P1–P4) were located in traffic-influenced urban environments characterised by high vehicular flow, while two sites (P5–P6) were positioned in urban-green areas with substantially reduced direct emission exposure. The characteristics and geographic coordinates of the sampling locations are summarised in Table 2 and illustrated in Figure 1.

2.2. Rainwater Sampling System

Rainwater samples were collected directly from atmospheric precipitation using open polyethylene bulk collectors installed at each sampling site. Bulk collectors were selected rather than wet-only samplers in order to capture the integrated atmospheric deposition signal, including contributions from both wet deposition and dry particle accumulation between rainfall events, which is particularly relevant in urban traffic-influenced environments where dry deposition of particulate-bound pollutants represents a significant pathway [23]. Analysis of the meteorological record for the study period (January–November 2025) identified 37 discrete rainfall events, which were sampled on an event basis; the antecedent dry period (ADP) between successive sampled events averaged 8.9 days (median: 7 days; range: 1–30 days), and 53% of events were preceded by dry intervals of seven or more days, conditions under which dry deposition contributions to bulk-collector loads are typically substantial. Based on ADP-to-concentration relationships reported for analogous urban bulk deposition studies, dry deposition is estimated to account for approximately 15–35% of the total ionic and trace metal load captured in the collectors, with the upper end of this range applicable to events following the longest dry intervals. It is therefore acknowledged that dissolved ion and trace metal concentrations measured in the present study may overestimate true wet-only precipitation chemistry by a corresponding margin, and this limitation is considered in the interpretation of results.
Collectors consisted of polyethylene basins with an opening diameter of approximately 20 cm and a volume capacity sufficient to collect representative sample volumes even during low-intensity events. Collectors were installed at a height of approximately 1.5 m above ground level to ensure unobstructed exposure while minimising contamination from surface splash and surrounding structures. Sampling locations were selected in open areas away from buildings, trees, and other obstacles that could interfere with precipitation collection or cause localised contamination.
Sampling was conducted on an event-by-event basis. Immediately after each bulk deposition event, collected samples were transferred into pre-cleaned polyethylene bottles and transported to the laboratory under refrigerated conditions (4 °C) to minimize chemical and biological alterations. Sample volumes varied depending on rainfall intensity and event duration.
Prior to analysis, all samples were filtered through 0.45 µm cellulose membrane filters to remove suspended particles and ensure measurement of the dissolved fraction. For trace metal analysis, dedicated sampling bottles were pre-cleaned with laboratory-grade detergent, rinsed thoroughly with deionised water, and conditioned with 5% nitric acid solution to minimize contamination and metal adsorption to bottle walls. Physicochemical parameters (pH, EC, turbidity, true colour, total hardness) and ionic and nutrient species were analysed within 24 h of collection. Trace metals were stored at 4 °C and analysed within 48 h.
During the winter season, part of the sampled events occurred as snowfall or mixed precipitation, consistent with the sub-zero air temperatures recorded (down to −17.1 °C). Solid precipitation was collected in the same open bulk collectors as liquid precipitation and was allowed to melt at room temperature in sealed, pre-cleaned polyethylene containers prior to filtration through 0.45 µm membranes and analysis, following the same protocol as rainfall samples. No dedicated wind-shielding devices were used; wind-related collection bias was limited by the collector design and by a standardised deployment identical across all six sites. Because all sites were sampled with an identical protocol, any residual wind-related bias is expected to affect all sites comparably and therefore does not bias the categorical comparison between traffic-influenced and urban-green sites.
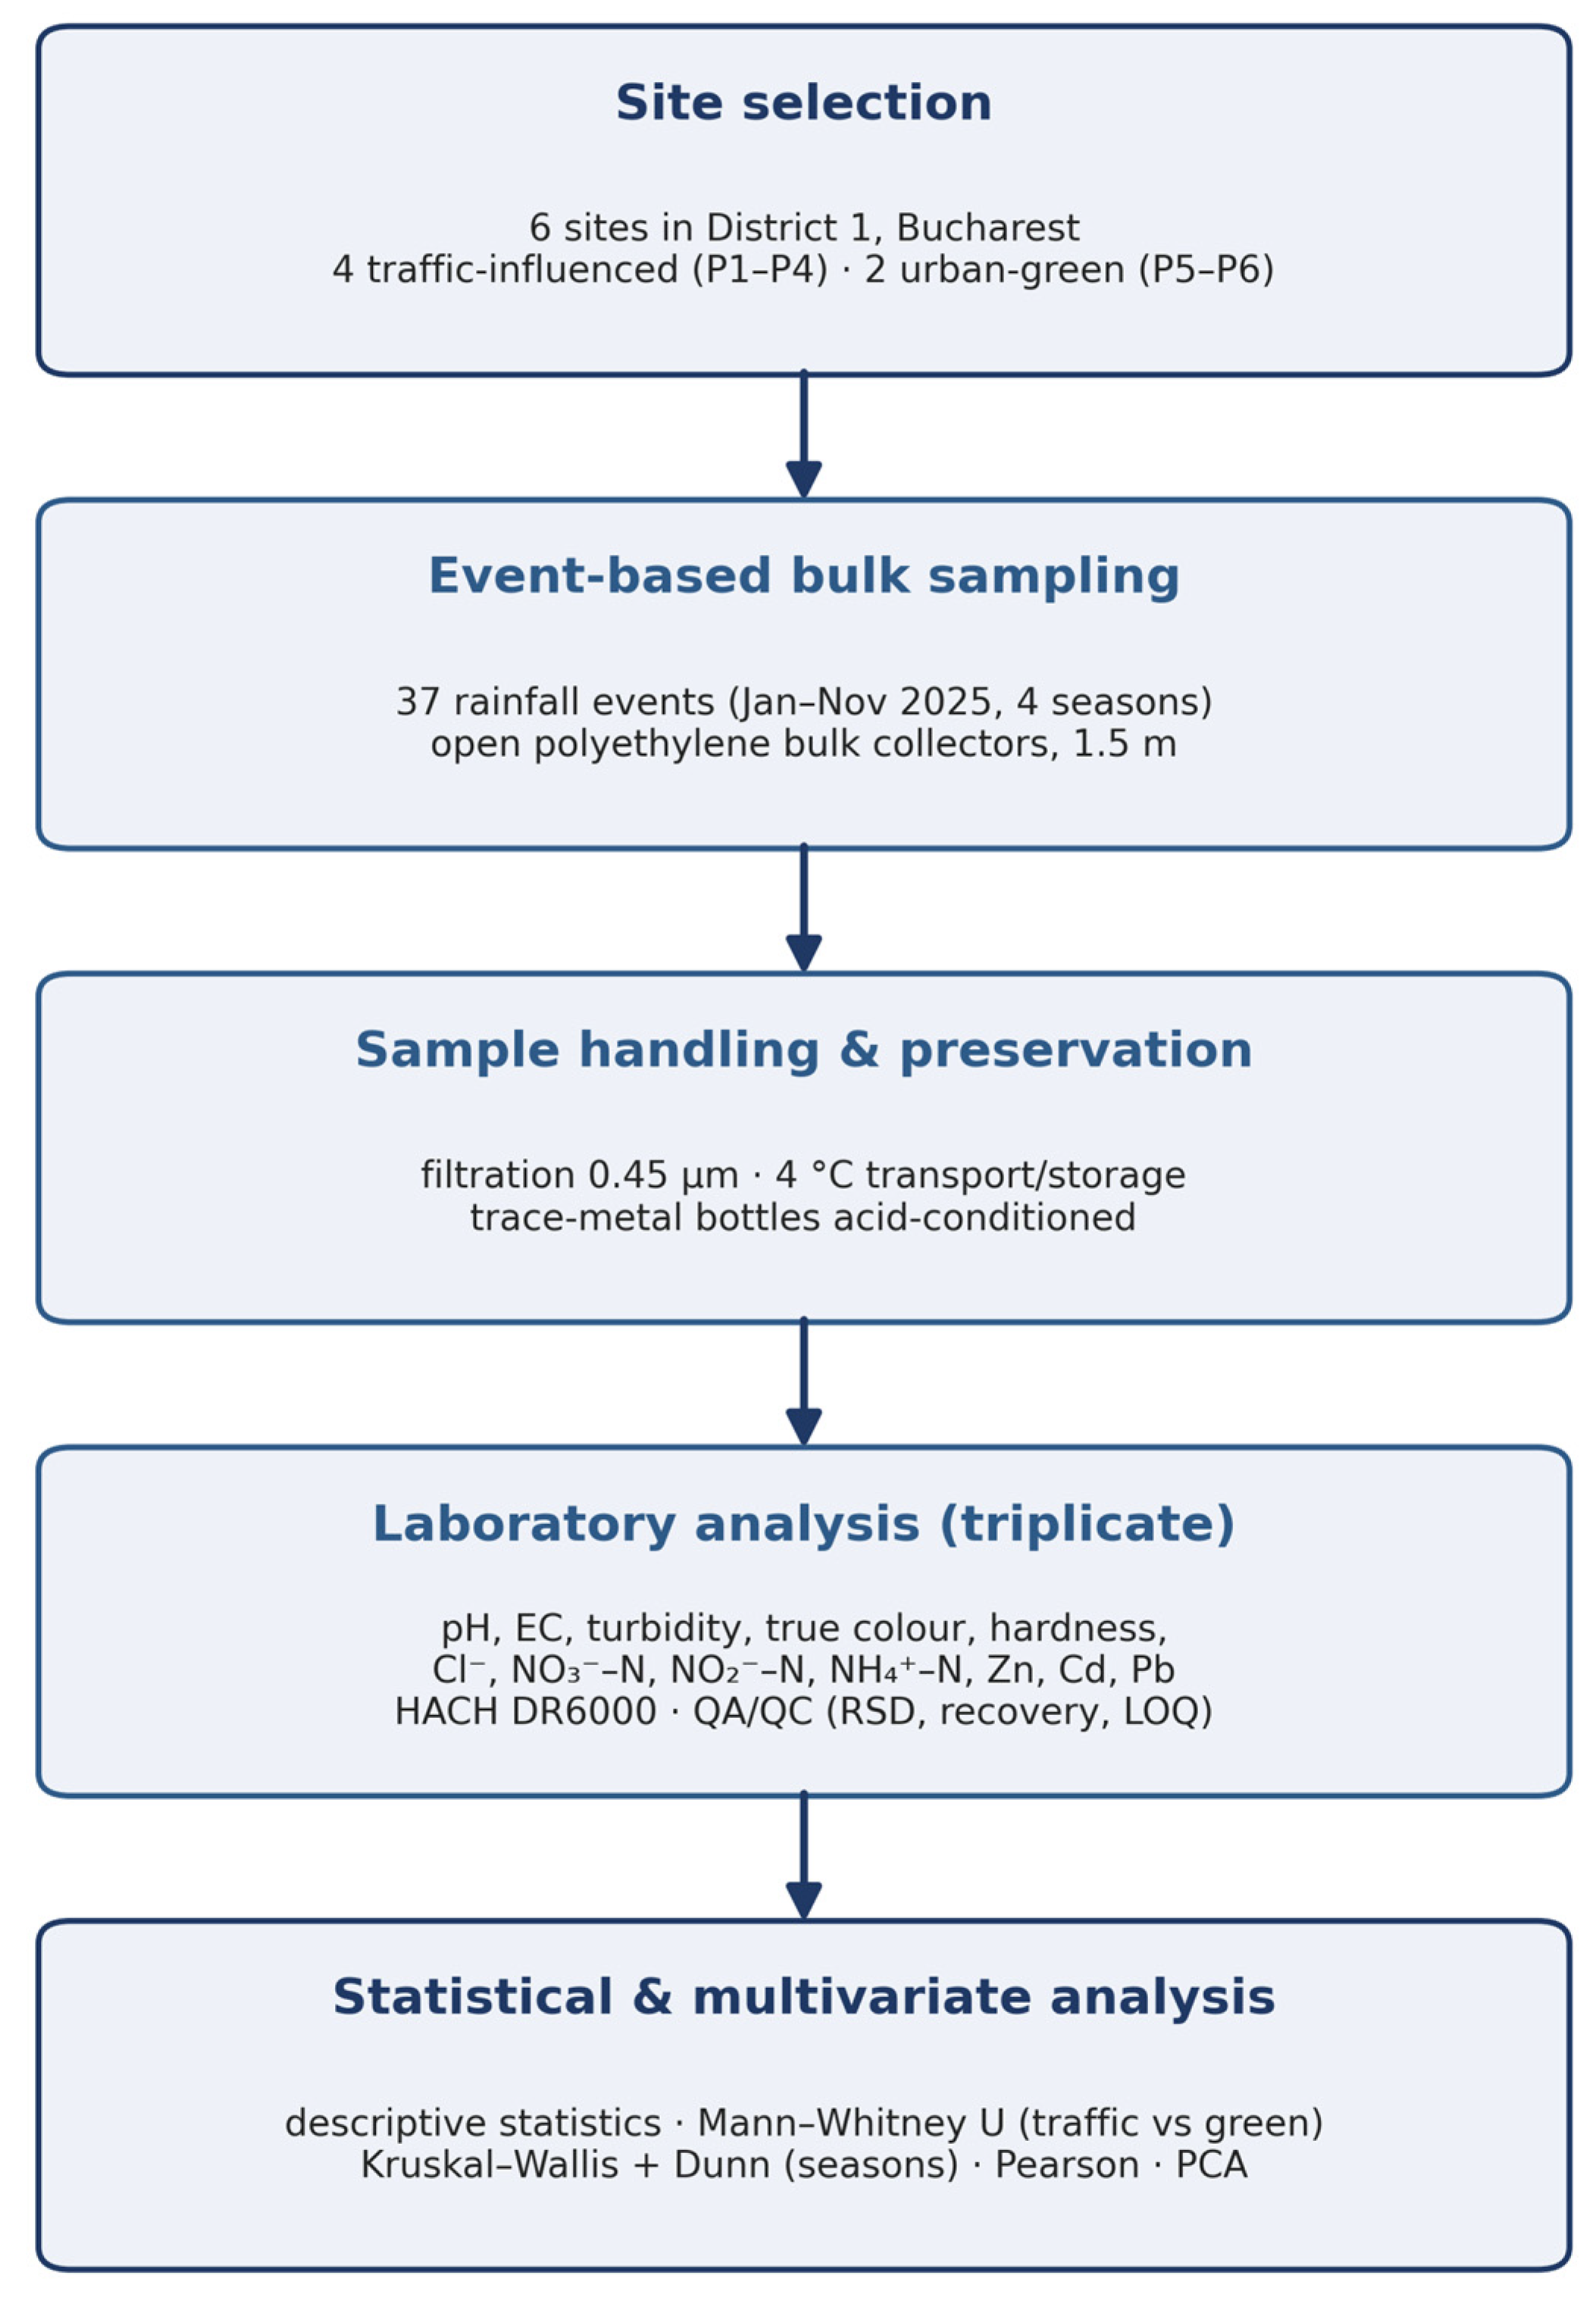
Collectors were thoroughly rinsed with deionised water after each sampling event to prevent cross-contamination between successive events. All sampling, handling, and transport procedures followed standards for precipitation monitoring from [30,31,32]. The complete methodological workflow is summarised in Figure 3.

2.3. Analytical Methods

All physicochemical and trace-metal analyses were carried out at the Environmental Engineering Laboratory of the Faculty of Land Reclamation and Environmental Engineering, University of Agronomic Sciences and Veterinary Medicine of Bucharest, Bucharest, Romania. Physicochemical analyses were performed using standardised laboratory procedures. All measurements were conducted in triplicate, and reported values represent mean concentrations. Quality control procedures included instrument calibration verification prior to each analytical session according to manufacturer specifications.
The analysed parameters were selected on two grounds: (i) their relevance to rainwater-harvesting reuse-risk assessment, allowing comparison against drinking-water reference values (pH, EC, turbidity, true colour, total hardness, chloride, inorganic nitrogen species and the trace metals Zn, Cd and Pb); and (ii) their value as established tracers of traffic-related particulate inputs and secondary atmospheric nitrogen chemistry. Sulphate and additional potentially toxic elements (e.g., arsenic) were not determined, as the kit-based colorimetric platform used here is not optimised for these analytes; a complete major-ion characterisation is identified as a priority for future work.
pH and electrical conductivity (EC) were measured using a HACH HQ Series multiparameter instrument (Hach Company, Loveland, CO, USA) following [33] and [34], respectively. Turbidity was determined nephelometrically using a HACH 2100Qis turbidimeter according to [31]. True colour was measured spectrophotometrically at 455 nm using a HACH DR6000 UV–VIS spectrophotometer.
Total hardness (as CaCO3) and chloride (Cl) were determined spectrophotometrically using pre-prepared HACH TNTplus reagent vials on the DR6000 UV–VIS spectrophotometer at 572 nm and 468 nm, respectively.
Inorganic nitrogen species were determined as follows. Nitrate (NO3–N) was measured at 345 nm using HACH TNTplus reagent vials (LOQ: 0.02 mg/L). Nitrite (NO2–N) was determined at 515 nm (LOQ: 0.001 mg/L). Ammonium (NH4+–N) was determined using HACH TNTplus reagent kit TNT830 (salicylate method, Hach Method 10205; range 0.015–2.00 mg NH4+–N/L) on the DR6000 UV–VIS spectrophotometer at 694 nm (LOQ: 0.015 mg/L). All nitrogen species determinations followed the corresponding HACH standard methods validated against APHA (2017) procedures [35].
Trace metals (Zn, Cd, Pb) were determined using pre-prepared HACH TNTplus colorimetric reagent vials on the DR6000 UV–VIS spectrophotometer at 490 nm (Zn), 600 nm (Cd), and 520 nm (Pb), respectively. Kit-based colorimetric methods were selected on the basis of three operational criteria: (i) their design is optimised for low-mineralisation water matrices such as atmospheric precipitation, ensuring adequate sensitivity in the expected concentration range; (ii) the use of pre-prepared vials with barcode-assisted method identification minimizes operator error and ensures analytical reproducibility between sessions; and (iii) the approach offers practical advantages in terms of sample throughput and reagent handling relative to alternative atomic absorption or ICP-based techniques, which would require matrix-matched calibration standards not routinely available for dilute precipitation samples. It is nonetheless acknowledged that colorimetric kits offer lower sensitivity and lower elemental specificity than ICP-MS or AAS; this trade-off is noted in Section 4.5. Potential spectral and matrix interferences are minimised by the method-specific reagent chemistry of the sealed TNTplus vials and by prior filtration of samples through 0.45 µm membranes (Merck Millipore, Darmstadt, Germany/Sartorius, Göttingen, Germany/Whatman, Cytiva, Maidstone, UK), which removes particulate material that could otherwise contribute to optical interference.
Quality assurance and quality control (QA/QC) for trace metal determinations followed procedures certified by Hach România under the applicable method validation documentation. Method performance characteristics for Zn, Cd, and Pb on the DR6000 UV–VIS spectrophotometer, as certified by the manufacturer, are summarised below. Blank samples (deionised water, 18.2 MΩ·cm) were analysed at the start of each analytical session; blank signals were consistently below the instrument detection limit for all three metals. Analytical precision, expressed as relative standard deviation (RSD%) from triplicate measurements, did not exceed 4.2% across all events and sites for Zn, 3.8% for Cd, and 4.6% for Pb, which is within the ≤5% RSD criterion specified in the Hach method documentation. Method accuracy was verified against certified performance targets provided in the Hach România method certification, with reported recoveries of 96–102% for Zn, 95–103% for Cd, and 97–104% for Pb on synthetic spike matrices. The expanded measurement uncertainty (coverage factor k = 2, ~95% confidence), estimated by combining the triplicate precision (RSD) with the recovery-based bias according to the EURACHEM/CITAC approach [36], was approximately ±9% for Zn, ±9% for Cd and ±10% for Pb.
The measurement wavelengths, instruments, and limits of quantification for all analysed parameters are summarised in Table 3.

2.4. Statistical Analyses

Statistical analyses were performed using IBM by additional particulate inputs from residential heating during the cold season Statistics 21.0 (SPSS Inc., Chicago, IL, USA) to evaluate land-use and seasonal variability of rainwater chemistry. Descriptive statistical indicators—including mean values, standard deviation (SD), minimum and maximum values, and coefficient of variation (CV)—were calculated for each parameter based on event-mean concentrations obtained from individual rainfall events across all sampling sites.
Between-site variability was assessed by comparing parameter distributions between traffic-influenced sites (P1–P4) and urban-green areas (P5–P6). Seasonal variability was evaluated according to the distribution and intensity of rainfall events across the four monitored seasons, with seasonal means calculated as averages of event-mean concentrations within each season.
Differences between the two land-use categories (traffic-influenced, P1–P4, n = 148 site-events; urban-green, P5–P6, n = 74 site-events) were tested for each parameter using the Mann–Whitney U test, the Shapiro–Wilk test having indicated departures from normality. Seasonal differences were assessed on the event-level overall means (n = 37) using the Kruskal–Wallis test followed by Dunn’s post hoc test with Bonferroni correction, with homogeneous seasonal groups denoted by superscript letters. Statistical significance was set at p < 0.05.
Pearson’s correlation analysis was applied to quantify bivariate relationships between physicochemical parameters across the dataset (37 events), providing a statistical basis for identifying co-varying parameters and inferring shared emission sources or transformation processes [37,38].
Principal Component Analysis (PCA) was applied to event-mean concentrations of twelve physicochemical parameters (n = 37 rainfall events) to identify the dominant factors governing rainwater composition. PCA is a widely used multivariate statistical method that reduces data dimensionality by transforming correlated variables into a smaller set of independent principal components, each explaining a portion of total variance [39]. Prior to PCA, the dataset was standardised using z-score normalisation to eliminate the influence of different measurement units and concentration scales. The suitability of the dataset for PCA was confirmed using the Kaiser–Meyer–Olkin (KMO) measure of sampling adequacy and Bartlett’s test of sphericity. Principal components with eigenvalues greater than 1 were retained according to the Kaiser criterion.
Between-site differences in rainwater chemistry were assessed by comparing the two land-use categories on the basis of their descriptive statistics and the between-group statistical tests described above, rather than by spatial interpolation. Formal geostatistical interpolation (Inverse Distance Weighting or Kriging) was deliberately not applied, because the limited number of discrete sampling points (n = 6) is insufficient to support a reliable continuous concentration field or a stable experimental variogram; between-site differences are therefore presented and interpreted as categorical, land-use-driven contrasts. Meteorological data obtained from the Băneasa ANM were integrated with chemical data to support the interpretation of seasonal concentration patterns and pollutant scavenging dynamics.

3. Results

3.1. General Characteristics of Rainwater Chemistry Across Sampling Sites

Descriptive statistics of all physicochemical parameters, together with the traffic-vs-green significance tests, are presented in Table 4. Concentrations were significantly higher at traffic-influenced than at urban-green sites for every parameter (Mann–Whitney U, p < 0.001), the only exception being pH, which was significantly higher at urban-green sites (p < 0.001).

3.1.1. Physical Characteristics

Rainwater pH ranged from 6.42 to 7.44, with means of 6.94 ± 0.18 at traffic-influenced sites and 7.13 ± 0.17 at urban-green sites (p < 0.001), remaining within the 6.5–9.5 drinking-water range at all sites. Electrical conductivity averaged 50.4 ± 11.1 µS/cm at traffic sites and 34.3 ± 10.7 µS/cm at green sites (+47%, p < 0.001; range 18.5–74.8 µS/cm), well below the 2500 µS/cm threshold. Turbidity ranged from 0.30 to 3.80 NTU (traffic 1.68 ± 0.72; green 1.04 ± 0.43; +61%, p < 0.001), within the <5 NTU limit. True colour was 15.5 ± 2.2 Pt–Co units at traffic sites and 8.9 ± 2.1 at green sites (+74%, p < 0.001; range 3.7–19.5), occasionally exceeding the 15 Pt–Co aesthetic limit at traffic sites. Total hardness averaged 22.5 ± 3.9 mg CaCO3/L at traffic sites and 14.9 ± 3.7 mg CaCO3/L at green sites (+51%, p < 0.001; range 6.3–28.7), indicating soft water throughout.

3.1.2. Major Anions and Nutrient Species

Chloride ranged from 0.52 to 3.12 mg/L (traffic 2.06 ± 0.41; green 1.20 ± 0.41; +71%, p < 0.001), well below the 250 mg/L guideline. Nitrate ranged from 0.56 to 1.53 mg NO3–N/L (traffic 1.22 ± 0.19; green 0.92 ± 0.19; +32%, p < 0.001) and nitrite from 0.011 to 0.040 mg NO2–N/L (traffic 0.031 ± 0.007; green 0.024 ± 0.006; +31%, p < 0.001), both below drinking-water guideline values. Ammonium ranged from 0.212 to 0.788 mg NH4+–N/L (traffic 0.594 ± 0.126; green 0.429 ± 0.123; +39%, p < 0.001); at traffic-influenced sites, the 0.50 mg NH4+–N/L indicator value was exceeded in 23 of 37 events.

3.1.3. Trace Metals

Zinc showed the highest absolute concentrations (0.024–0.112 mg/L; traffic 0.085 ± 0.014; green 0.051 ± 0.013; +67%, p < 0.001), remaining below World Health Organisation (WHO) guideline values at all sites. Cadmium ranged from 0.0005 to 0.0030 mg/L (traffic 0.00227 ± 0.00041; green 0.00138 ± 0.00042; +64%, p < 0.001); the maximum value (0.0030 mg/L) equalled the WHO drinking-water guideline of 0.003 mg/L. Lead ranged from 0.00299 to 0.00657 mg/L (traffic 0.00566 ± 0.00053; green 0.00425 ± 0.00053; +33%, p < 0.001); mean concentrations at traffic sites exceeded the European Union (EU) parametric value of 0.005 mg/L, while all values remained below the threshold of 0.010 mg/L recommended by both the WHO and the United States Environmental Protection Agency (USEPA). Coefficients of variation ranged from 2.4% (pH) to 47.9% (turbidity).

3.2. Seasonal Variability of Physicochemical Parameters

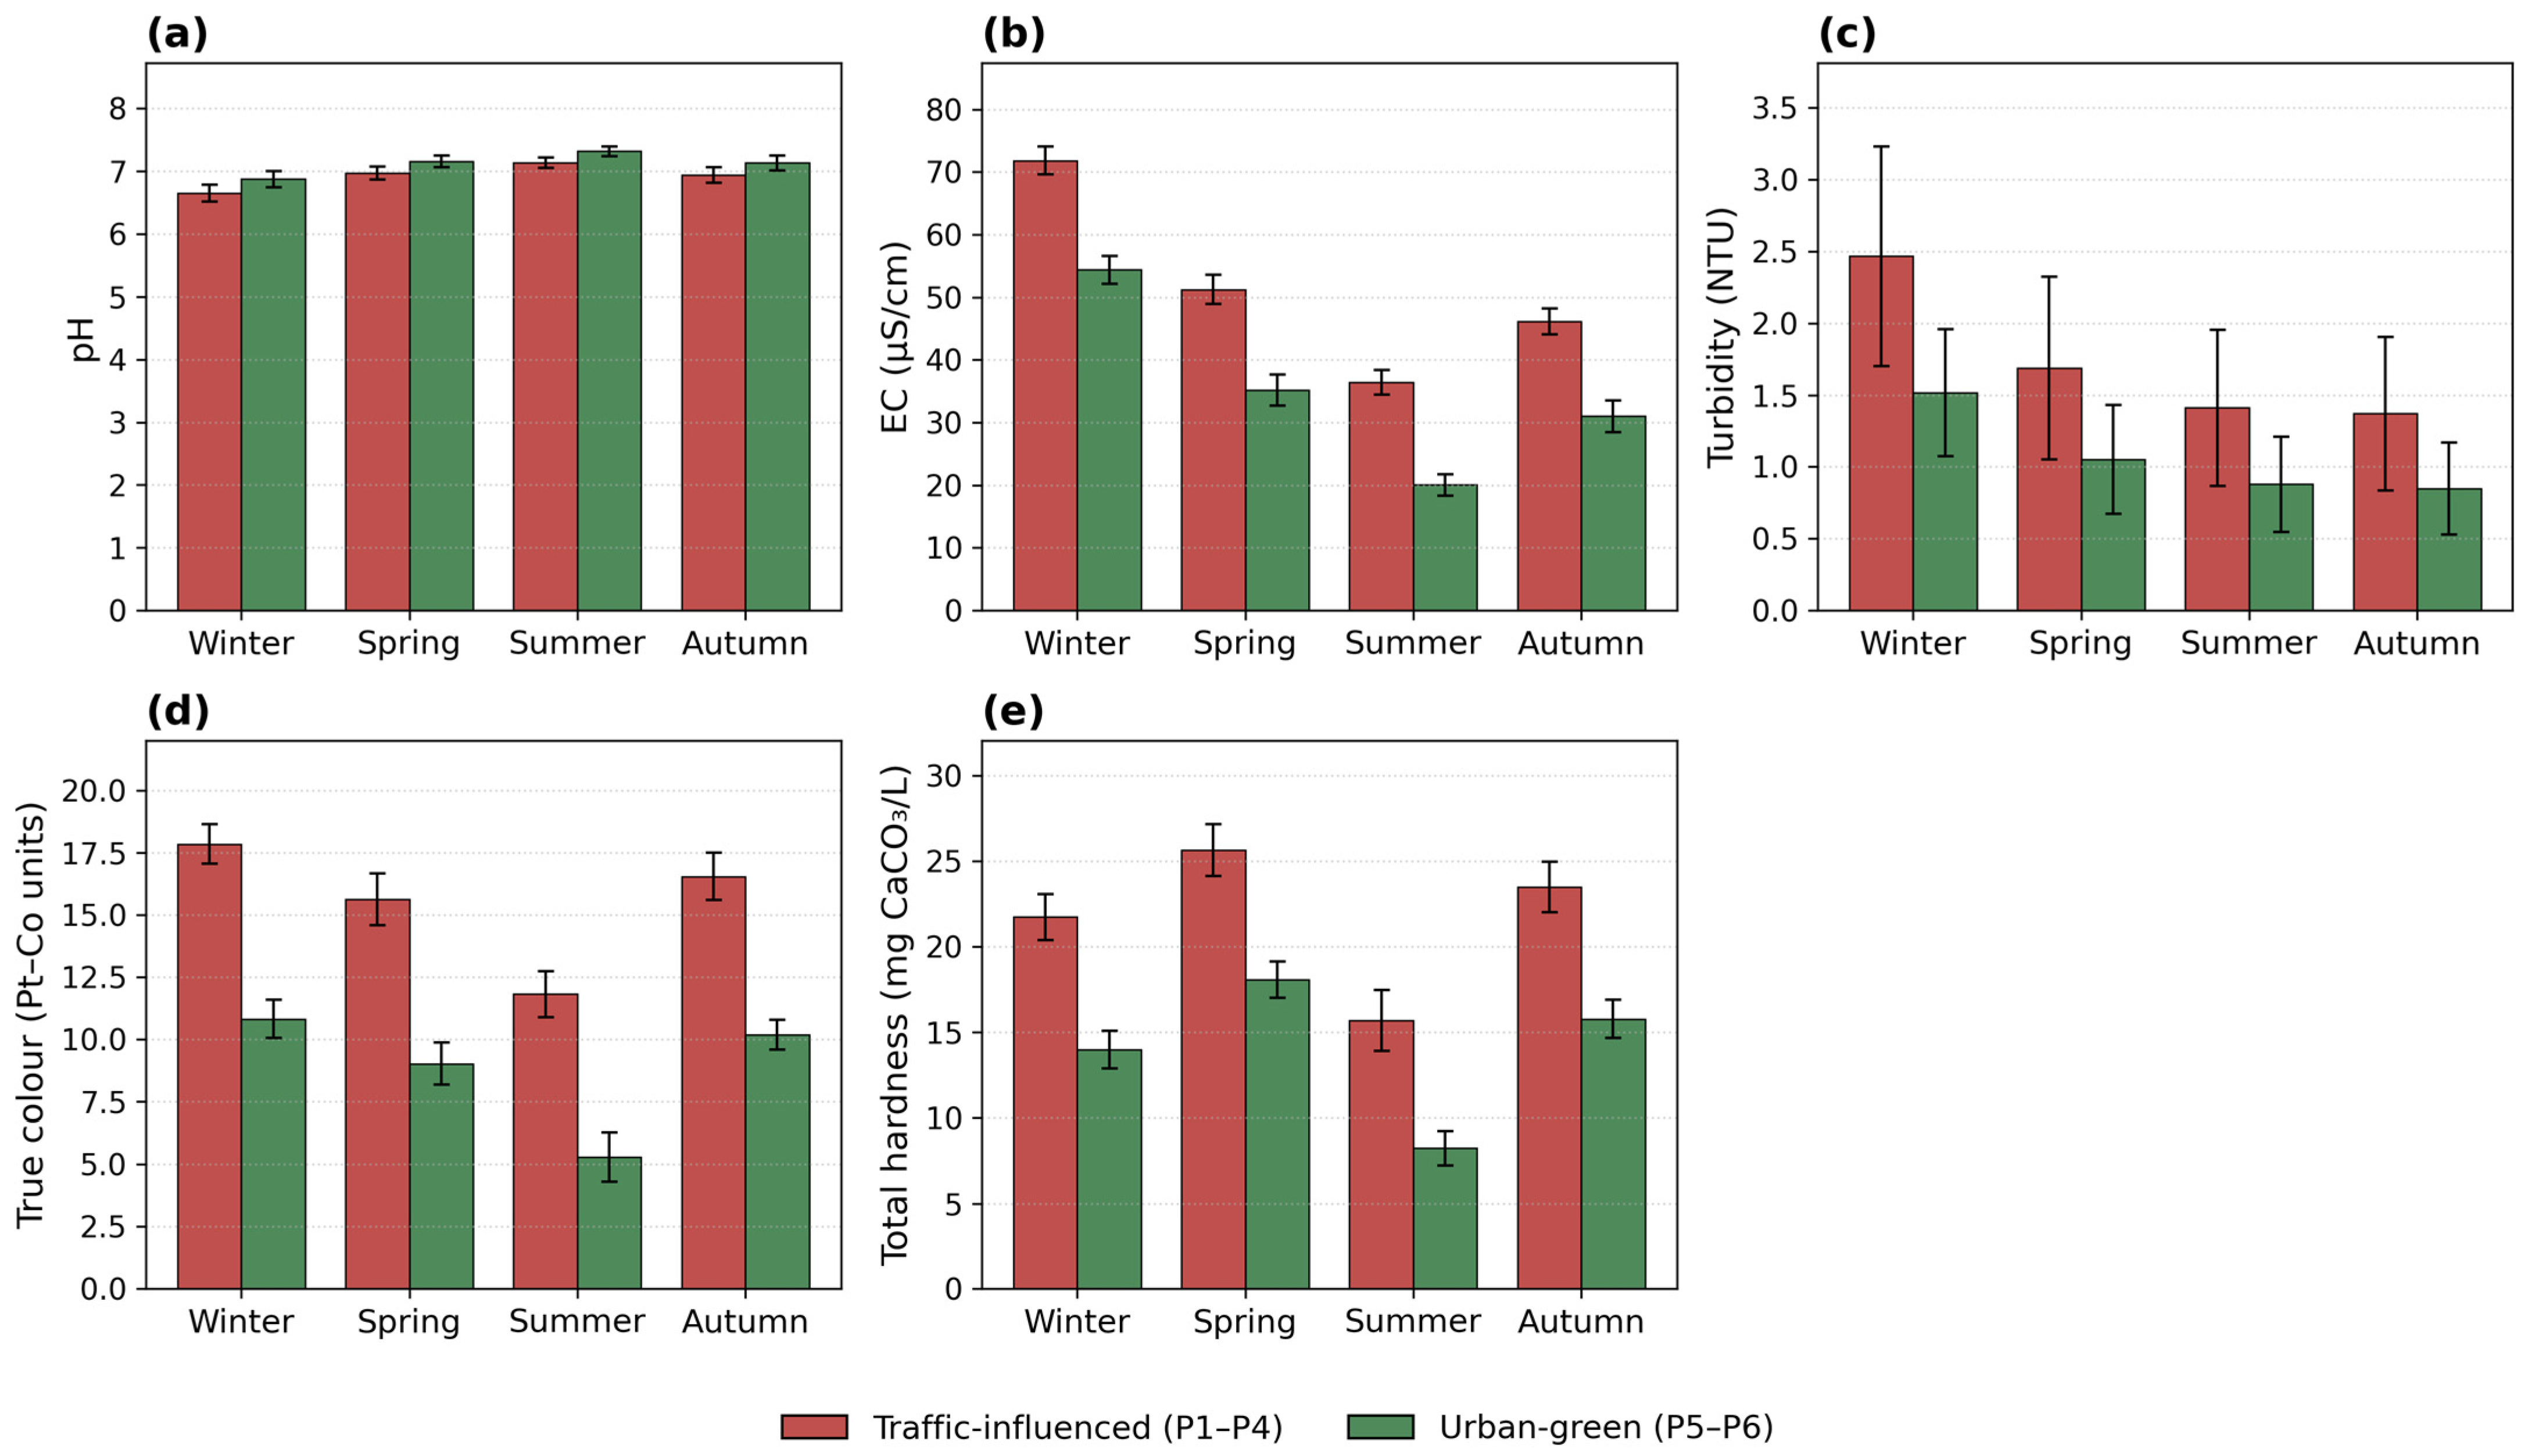
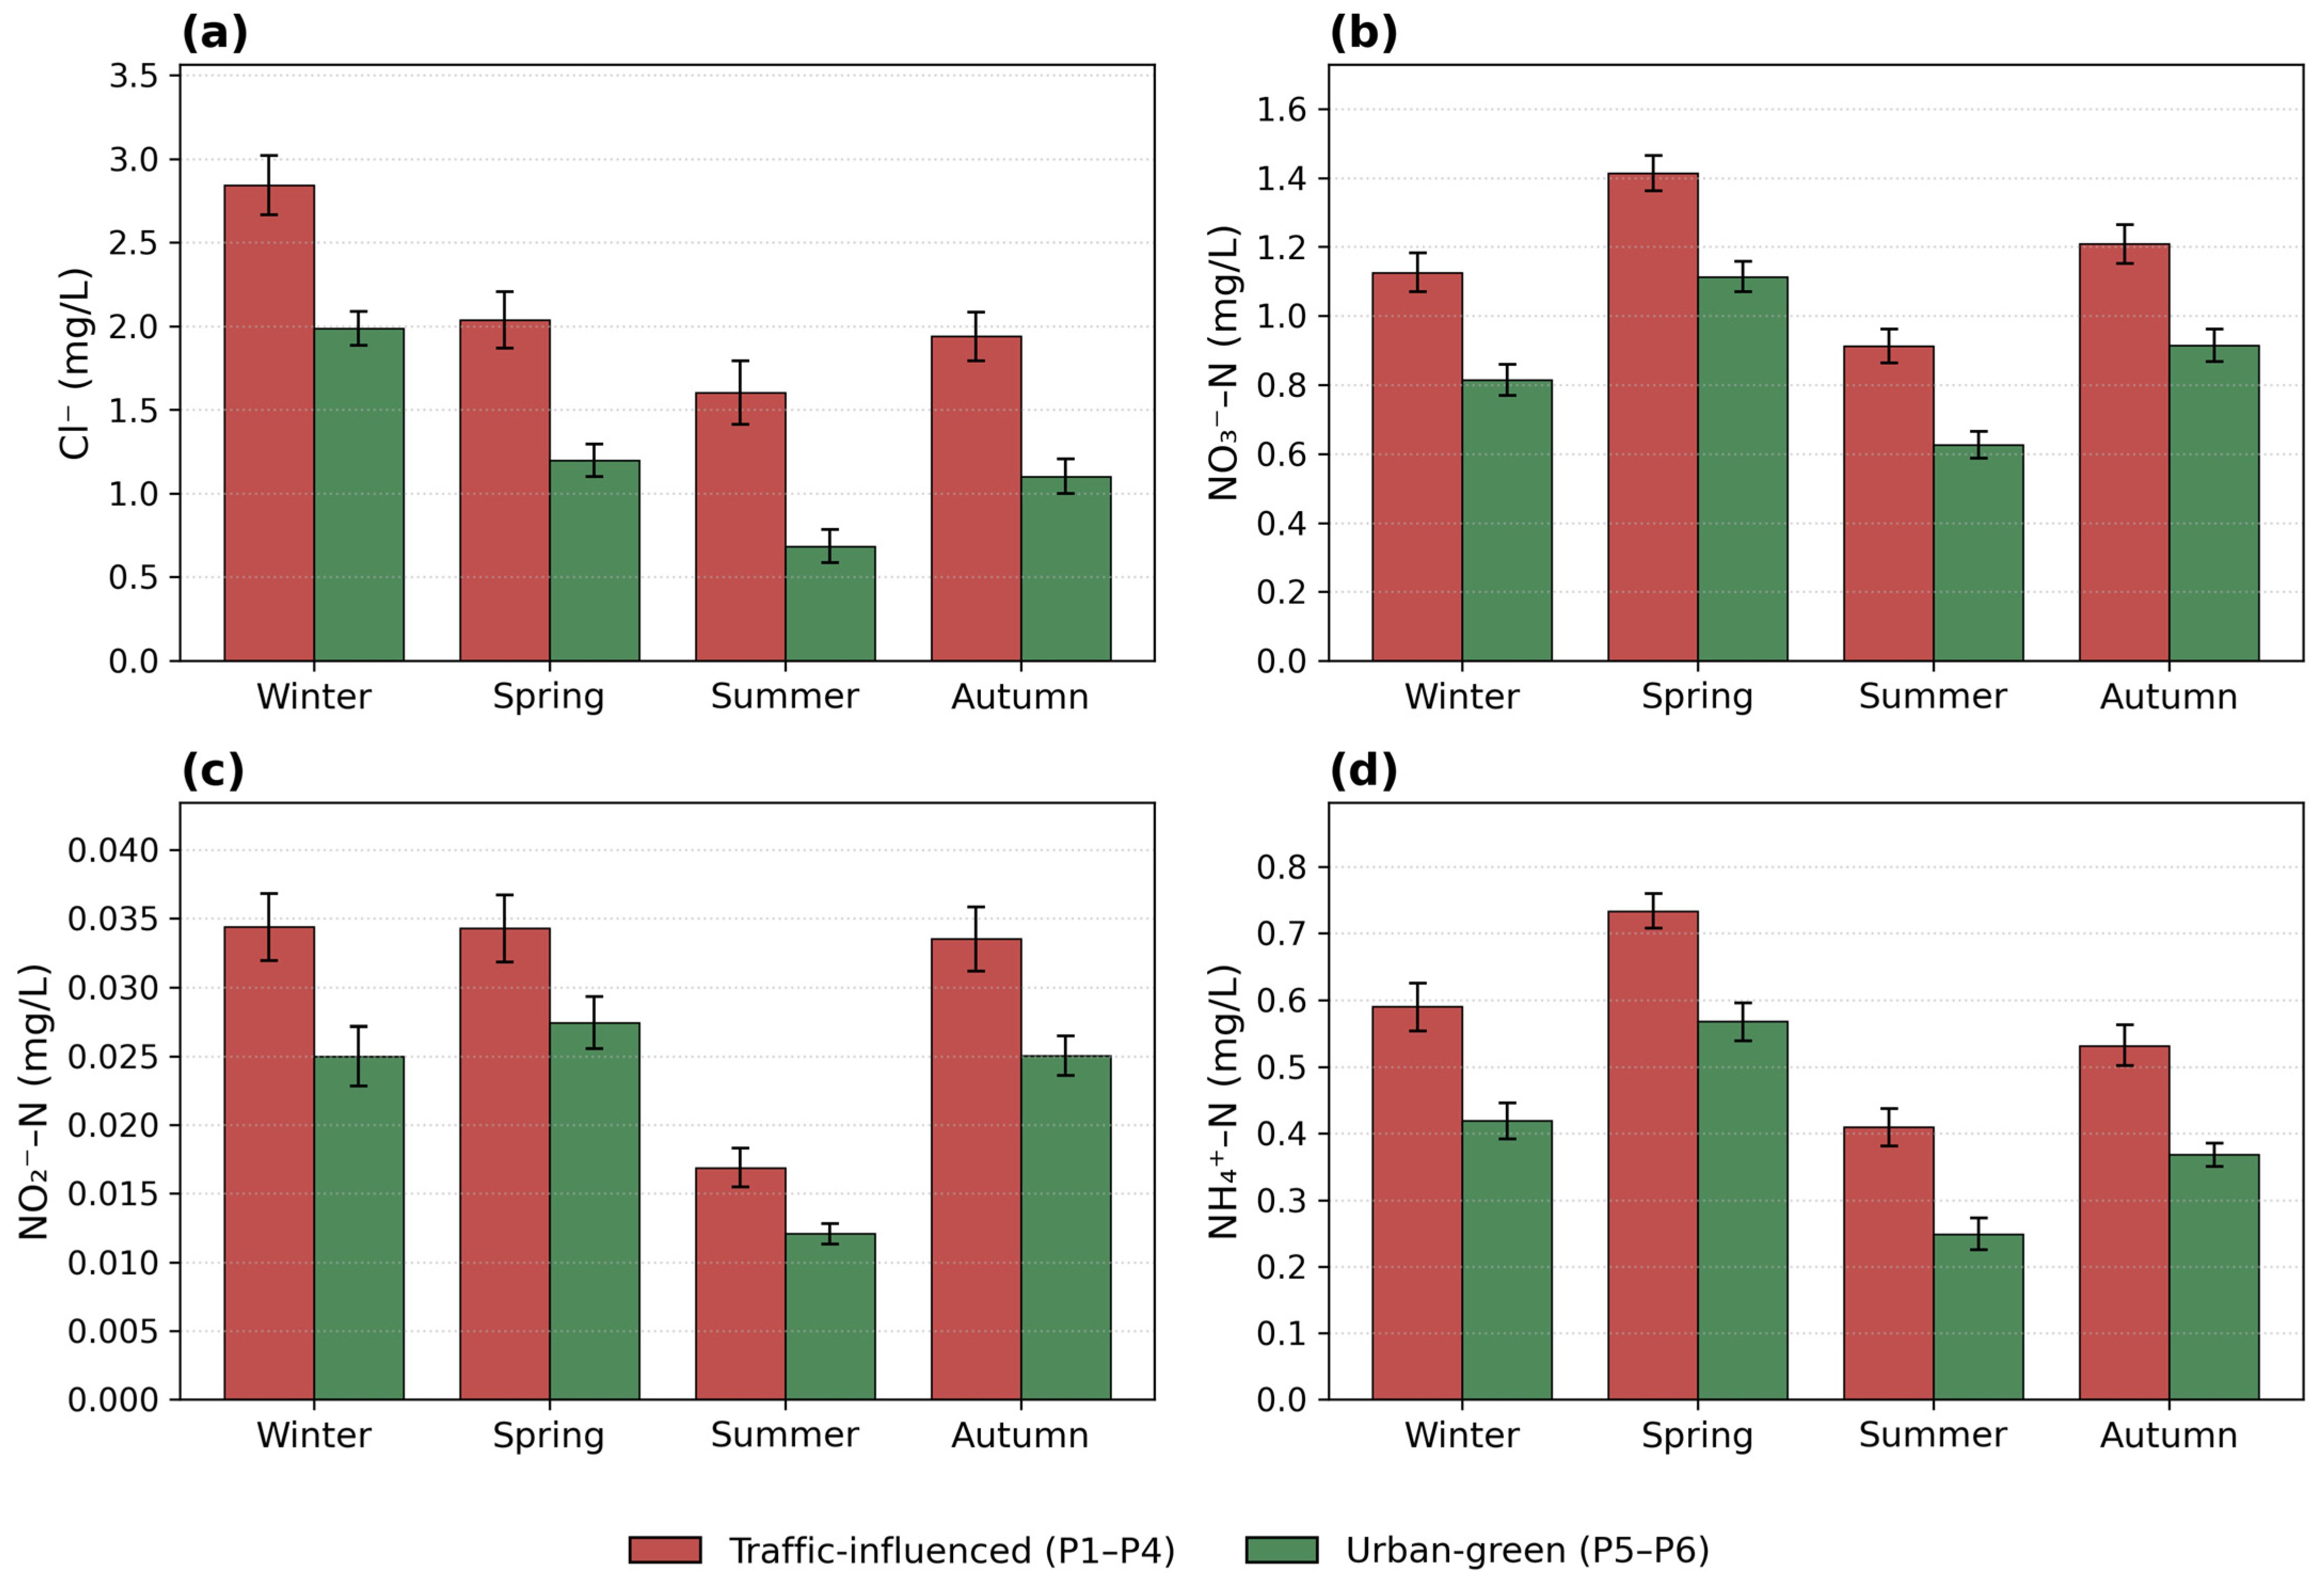
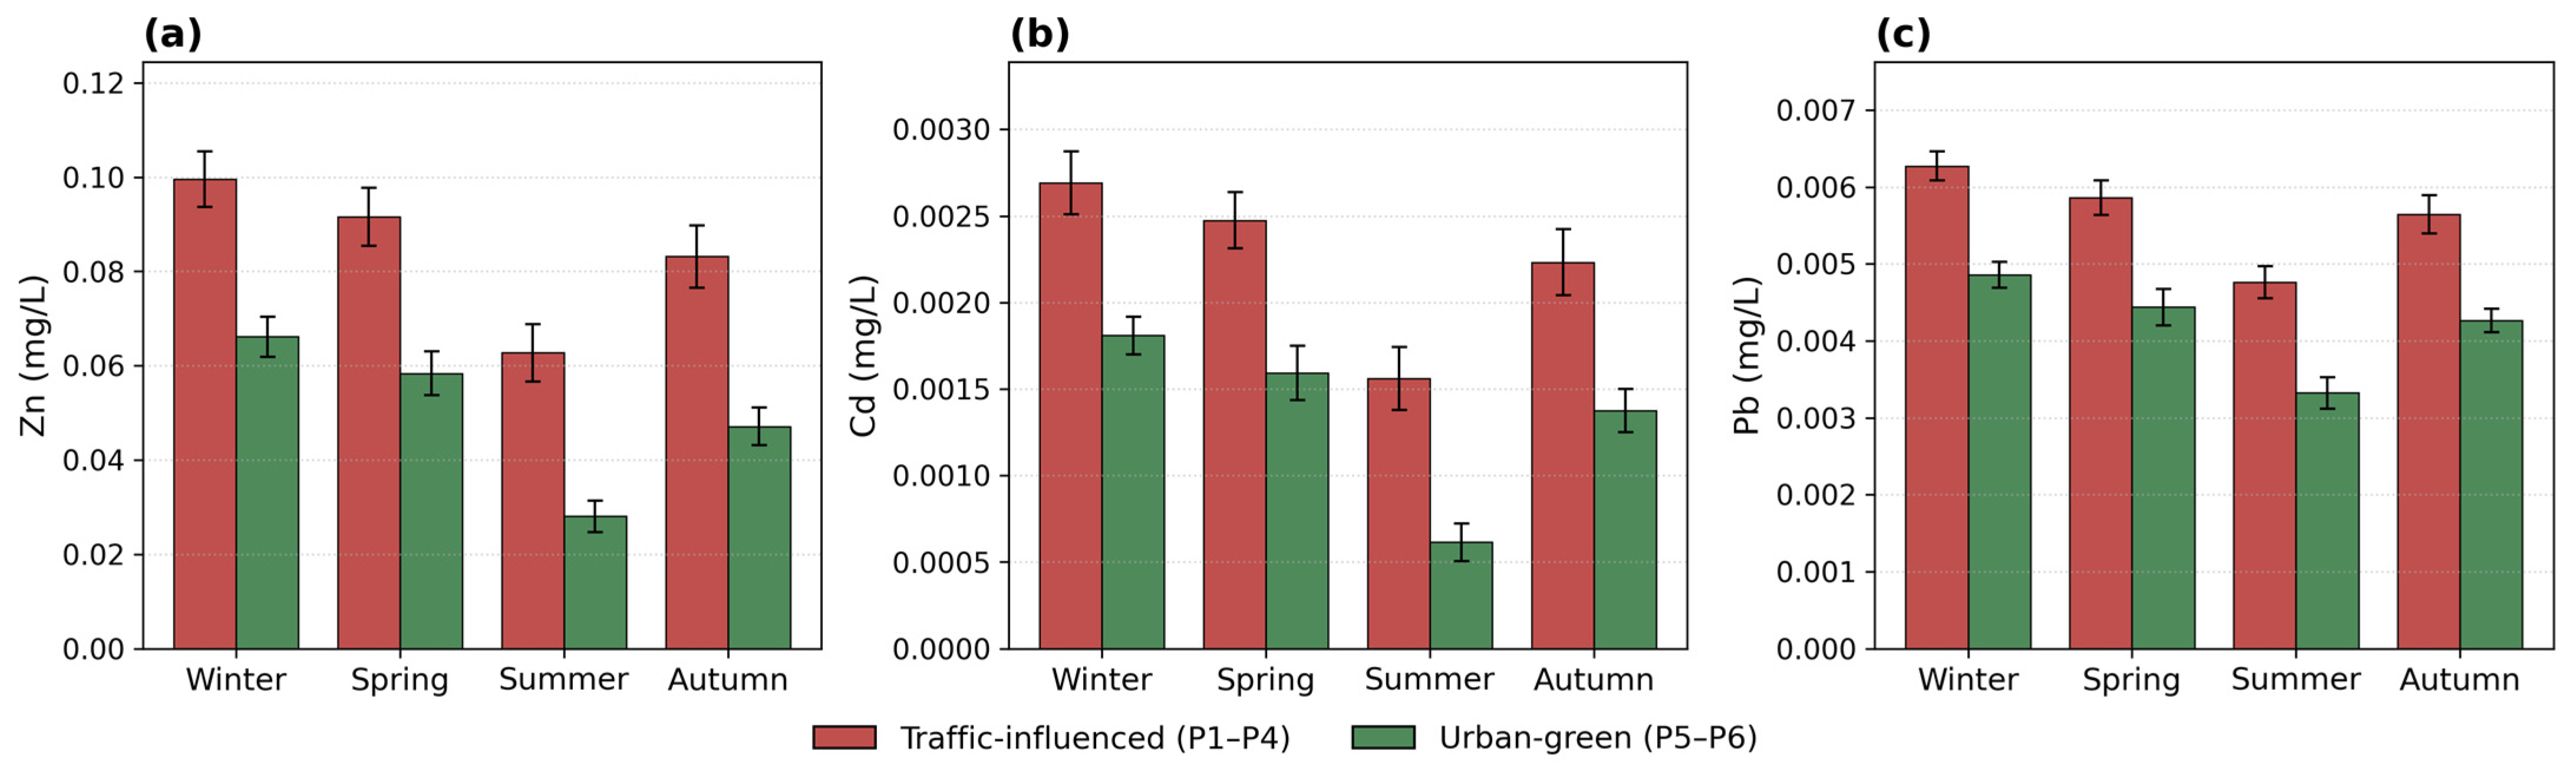
Seasonal event-level means ± SD for all parameters, together with Kruskal–Wallis tests and Dunn/Bonferroni post hoc grouping, are presented in Table 5; the corresponding seasonal means for traffic-influenced and urban-green sites are shown in Figure 4, Figure 5 and Figure 6. Seasonal variation was statistically significant for all parameters (Kruskal–Wallis, p < 0.001; turbidity p < 0.05).

3.2.1. Seasonal Variability of General Parameters

Rainwater pH increased from winter to summer, with seasonal means of 6.65–7.14 at traffic-influenced sites and 6.88–7.32 at urban-green sites (Figure 4a), remaining within the 6.5–9.5 range in all seasons. Electrical conductivity peaked in winter (71.85 µS/cm at traffic sites; 54.42 µS/cm at green sites) and reached minima in summer (36.41 and 20.05 µS/cm, respectively) (Figure 4b). Turbidity remained below 5 NTU throughout, with winter maxima (2.49 and 1.52 NTU) and summer minima (1.41 and 0.88 NTU); autumn values were intermediate (1.37 and 0.85 NTU) (Figure 4c). True colour followed the same pattern, from winter maxima (17.85 and 10.83 Pt–Co units) to summer minima (11.82 and 5.29 Pt–Co units), exceeding the 15 Pt–Co aesthetic limit at traffic sites in winter and autumn (16.56 Pt–Co units) (Figure 4d). Total hardness peaked in spring (25.66 mg CaCO3/L at traffic sites; 18.07 mg CaCO3/L at green sites) and was lowest in summer (15.67 and 8.23 mg CaCO3/L) (Figure 4e), indicating soft water in all seasons. In every season, values were higher at traffic-influenced than at urban-green sites.

3.2.2. Seasonal Variability of Ionic and Nutrient Species

Chloride ranged from 0.515 to 3.115 mg/L, with winter maxima (overall 2.56 mg/L; traffic 2.84; green 1.99 mg/L) and summer minima (Figure 5a). Nitrate (NO3–N) ranged from 0.559 to 1.525 mg/L, peaking in spring (overall 1.31 mg/L; traffic 1.41; green 1.11 mg/L) and reaching minima in summer (overall 0.82 mg/L; traffic 0.91; green 0.63 mg/L) (Figure 5b). Nitrite (NO2–N) remained low throughout (0.011–0.040 mg/L), with comparable means in winter, spring and autumn (0.031–0.032 mg/L) and a summer minimum of 0.015 mg/L (Figure 5c). Ammonium (NH4+–N) showed the widest seasonal range (0.212–0.788 mg/L), with spring maxima (overall 0.678 mg/L; traffic 0.734; green 0.568 mg/L) and summer minima (overall 0.356 mg/L; traffic 0.409; green 0.249 mg/L) (Figure 5d). Concentrations were consistently higher at traffic-influenced sites in all seasons.

3.2.3. Seasonal Variability of Trace Metals

Zinc ranged from 0.024 to 0.112 mg/L, with a maximum in winter (overall 0.099 mg/L; traffic 0.100 mg/L) and spring (0.081 mg/L), followed by autumn (0.071 mg/L) and a summer minimum (0.051 mg/L) (Figure 6a). Cadmium ranged from 0.0005 to 0.0030 mg/L, with the maximum value recorded at P3; seasonal means were highest in winter (overall 0.0024 mg/L; traffic 0.0027 mg/L) and spring (0.0022 mg/L), decreasing in autumn (0.0020 mg/L) to a summer minimum (0.0013 mg/L) (Figure 6b). Lead ranged from 0.00299 to 0.00657 mg/L and showed the lowest relative variability of the three metals (CV 9.32–12.40%), with winter maxima (overall 0.00580 mg/L; traffic 0.00627 mg/L) and summer minima (Figure 6c); at traffic-influenced sites, lead exceeded the EU parametric value of 0.005 mg/L in winter, spring and autumn. In all seasons, trace-metal concentrations were higher at traffic-influenced than at urban-green sites.

3.3. Between-Site Variability of Rainwater Quality Parameters

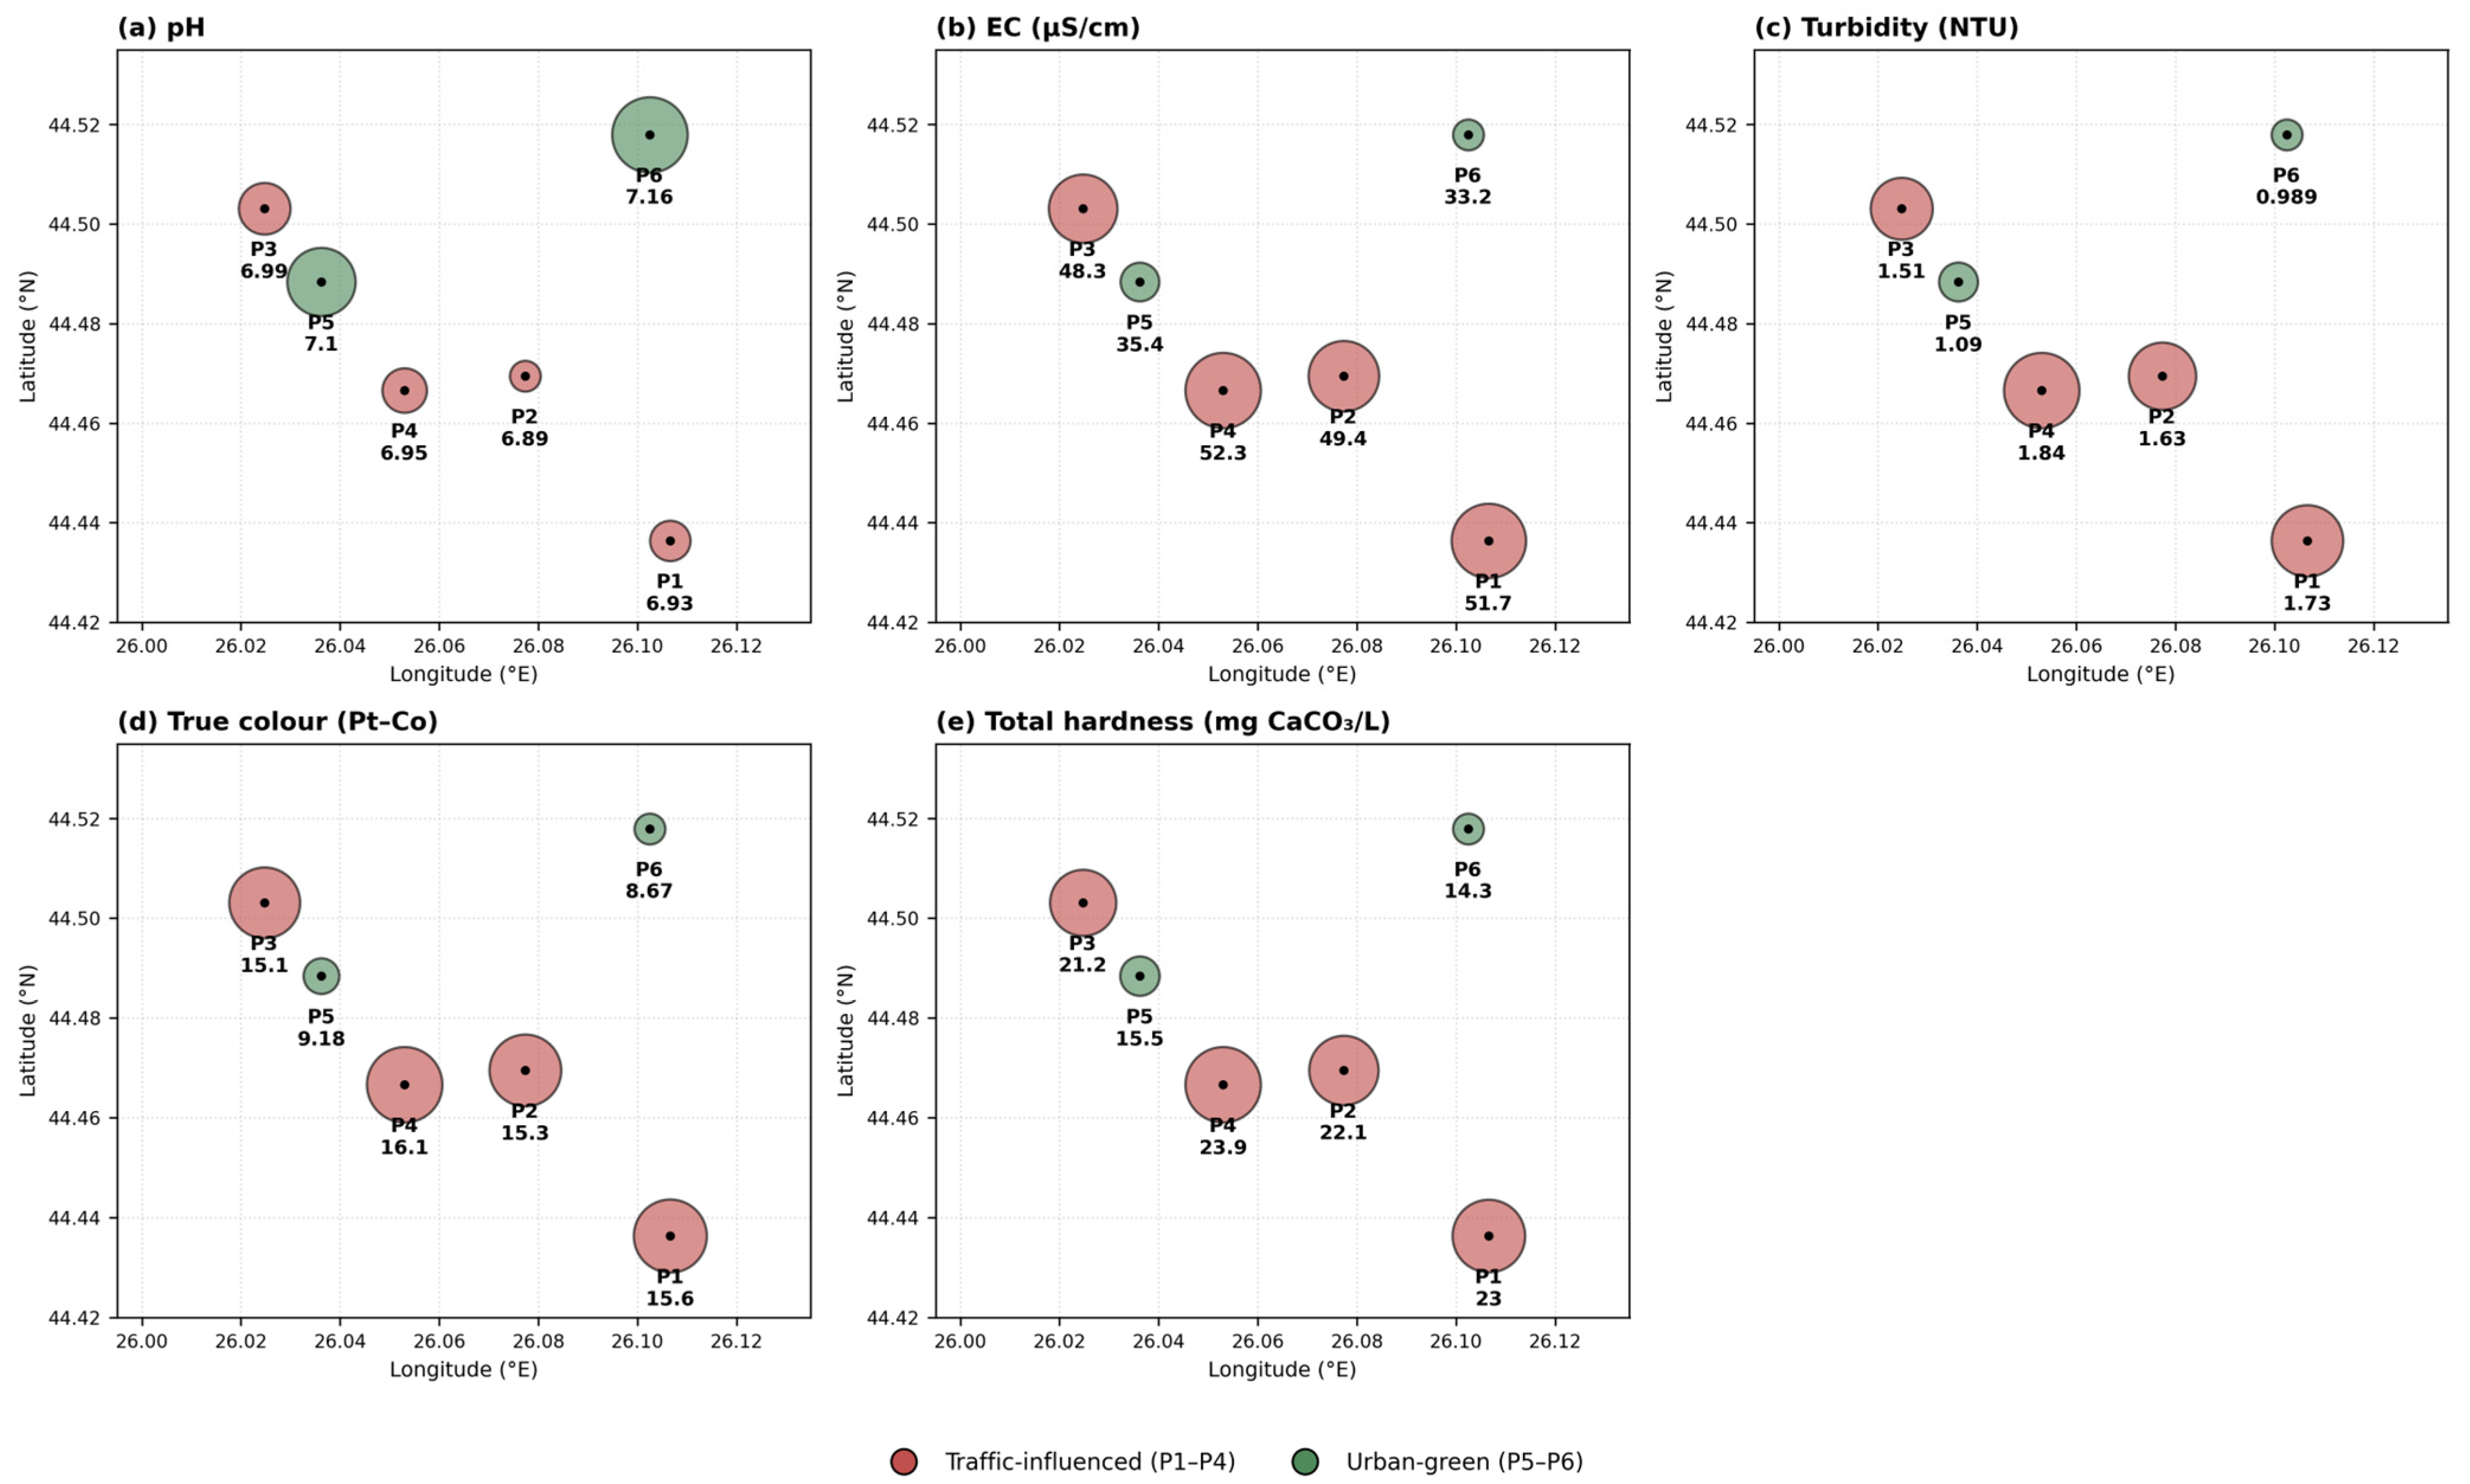
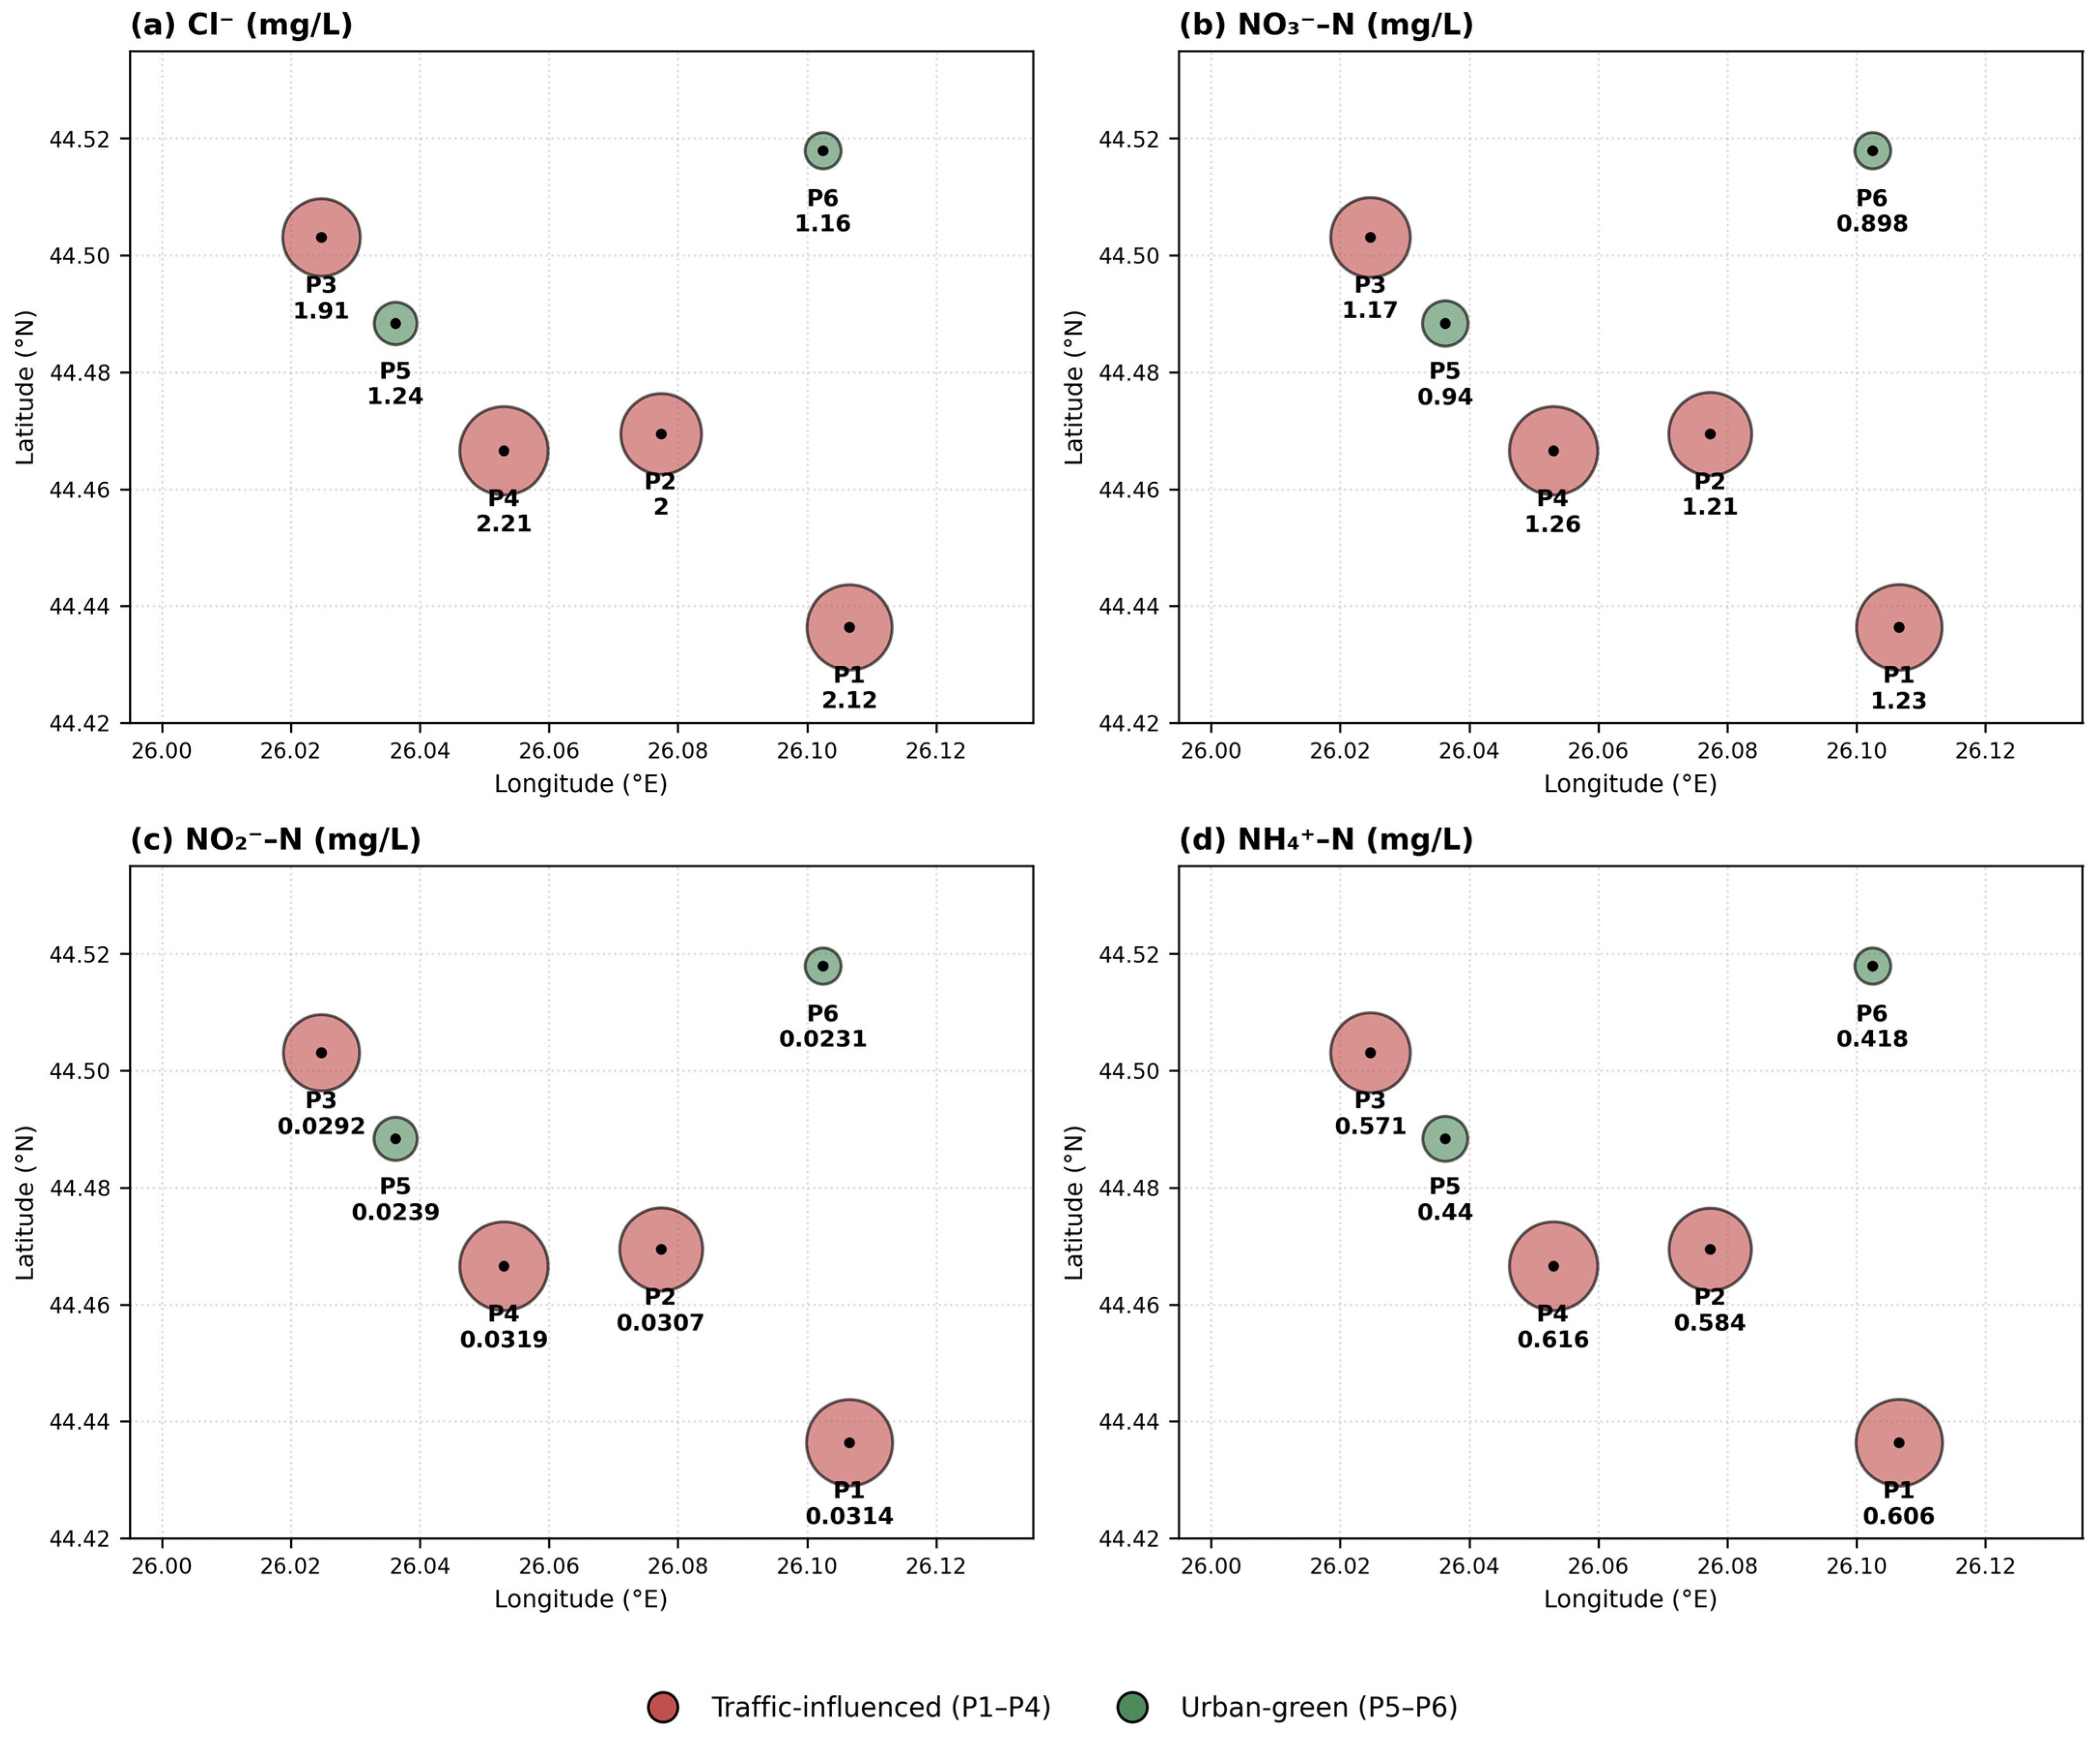
The measured site means for all parameters are displayed as proportional-symbol maps in Figure 7, Figure 8 and Figure 9, in which symbol area scales with the mean concentration recorded at each of the six monitoring points. Values are plotted only at the locations where they were measured.
Among the general physicochemical parameters (Figure 7), true colour and turbidity showed the largest differences between site categories (traffic-to-green ratios of 1.74 and 1.61, respectively), followed by total hardness (1.51) and electrical conductivity (1.47). pH was the only parameter with higher values at urban-green locations (7.13 vs. 6.94; ratio 0.97).
Ionic and nutrient species followed the same pattern (Figure 8), with traffic-to-green ratios of 1.71 for chloride, 1.32 for nitrate, 1.31 for nitrite and 1.39 for ammonium. At traffic-influenced sites, ammonium exceeded the 0.50 mg NH4+–N/L indicator value in 23 of the 37 sampling events, whereas urban-green sites approached but rarely exceeded this threshold.
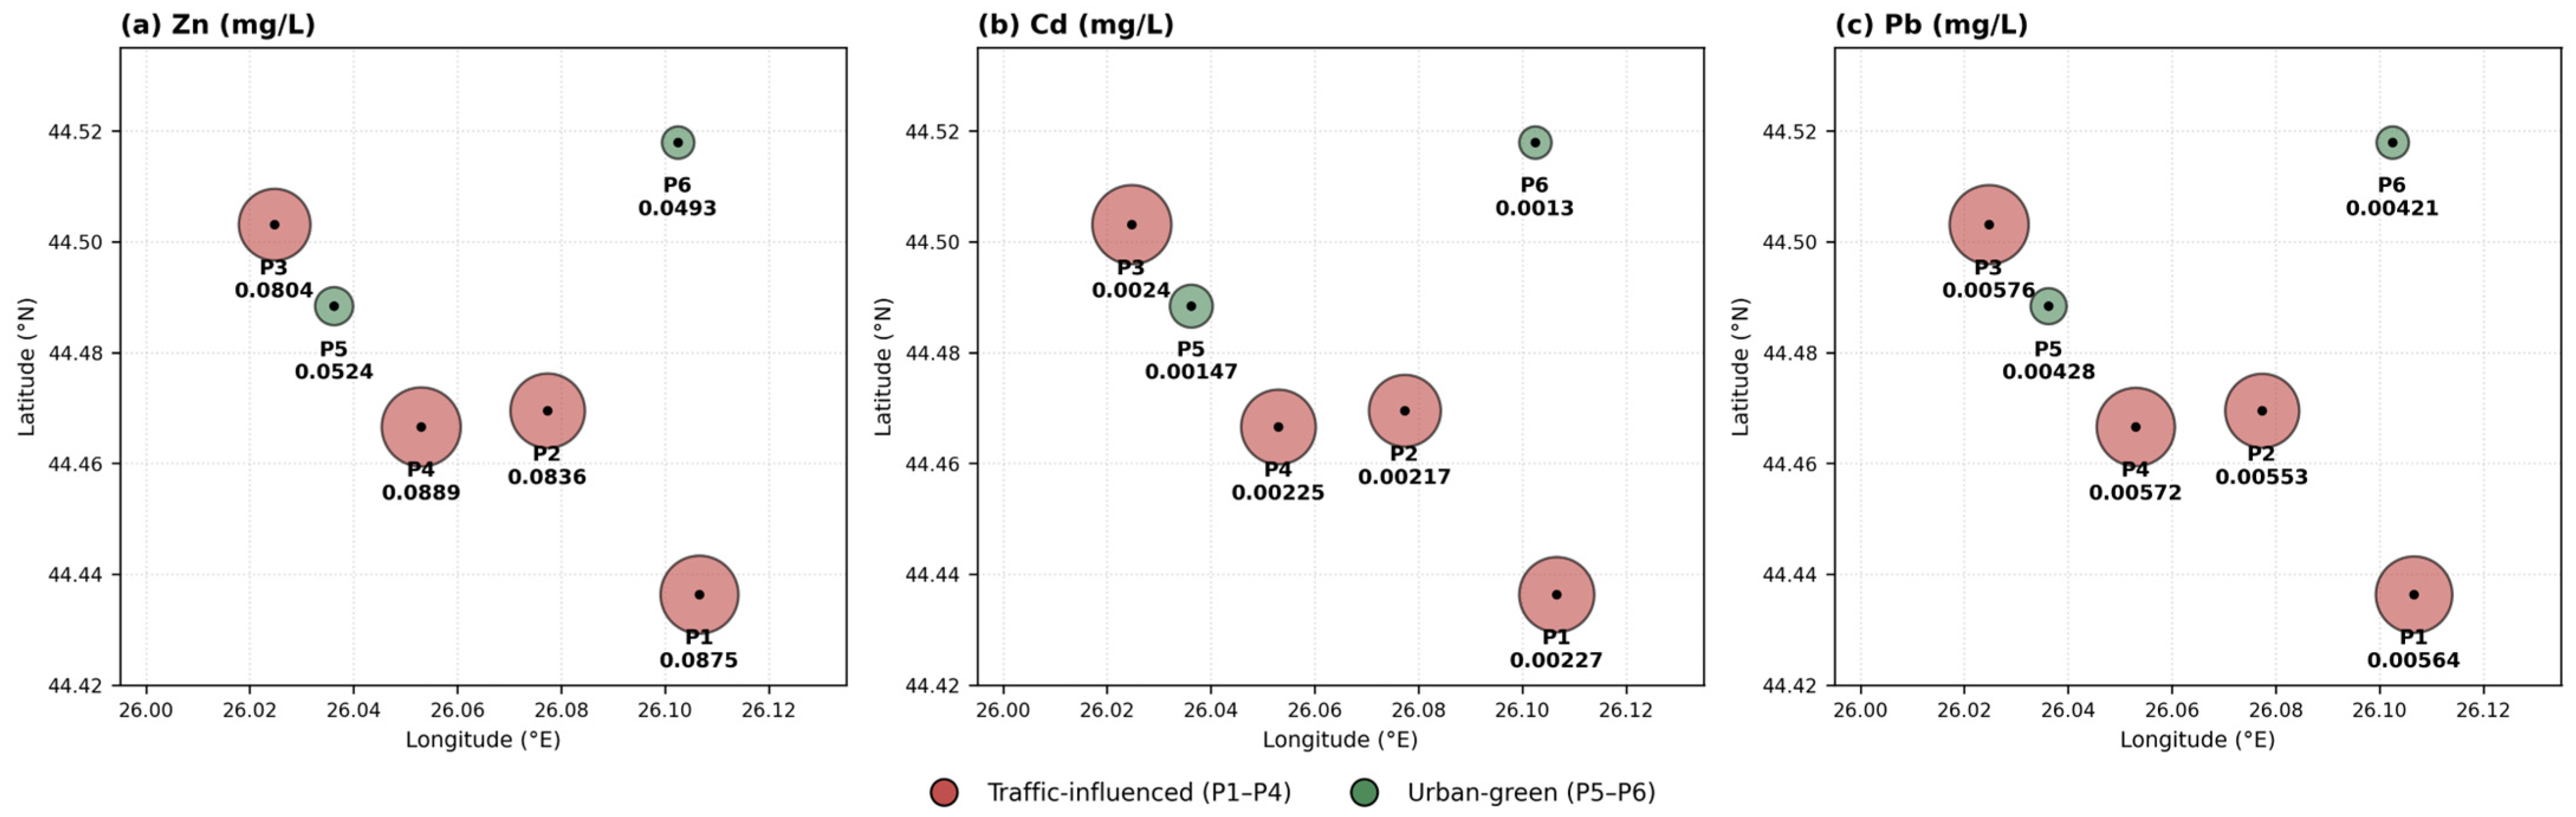
Trace metals showed the most pronounced differentiation between site categories (Figure 9), with traffic-to-green ratios of 1.67 for zinc (0.085 vs. 0.051 mg/L), 1.64 for cadmium (0.00227 vs. 0.00138 mg/L) and 1.33 for lead (0.00566 vs. 0.00425 mg/L). Cadmium at traffic sites reached the WHO indicative threshold (0.0030 mg/L) and lead exceeded the EU parametric value of 0.005 mg/L, while both remained below these values at urban-green locations.

3.4. Pearson’s Correlation

Pearson’s correlation analysis was performed on event-mean concentrations (n = 37 rainfall events), calculated as the mean of all six sampling sites per event, using IBM SPSS Statistics 21.0. Not all parameter pairs showed statistically significant correlations at p < 0.05, and significance levels are reported individually in Table 6.
The strongest positive correlation was observed between EC and Cl (r = 0.990), confirming that chloride ions are the primary contributors to ionic conductance in urban rainwater, driven by road traffic emissions, vehicular dust, and de-icing agent contributions. The heavy metals Zn, Cd, and Pb formed a tightly intercorrelated cluster (r = 0.967–0.973), indicating a common vehicular source—predominantly tyre and brake wear—and similar behaviour during wet scavenging [13,20].
Nitrogen species (NO3–N, NH4+–N, NO2–N) showed strong mutual correlations (r = 0.774–0.941), reflecting their common origin from atmospheric nitrogen chemistry and vehicular NOx and NH3 emissions. Their strong associations with total hardness (r = 0.879–0.957) suggest coupling between nitrogen species and mineral aerosol inputs; however [16,40], direct quantification of this coupling would require measurement of Ca2+ and SO42−.
pH was inversely correlated with most parameters (r = −0.809 to −0.226 for significant pairs), with the strongest negative correlations observed for EC (r = −0.789) and Cl (r = −0.809), consistent with acid deposition dynamics in urban environments where increased ionic loading from anthropogenic sources is associated with reduced pH, while alkaline crustal inputs partially buffer precipitation acidity [40]. Correlations between pH and NO3–N (r = −0.129, p = 0.447) and NH4+–N (r = −0.226, p = 0.178) were not statistically significant at the event-mean level, indicating that nitrogen species do not exert a dominant control on bulk pH when averaged across sites.
True colour showed very strong positive correlations with Pb (r = 0.907), Cd (r = 0.874), and Zn (r = 0.844), suggesting that heavy metals are predominantly associated with the dissolved and colloidal fraction of rainwater particulates, as chromophoric dissolved organic matter and metal-bearing colloids are co-deposited during precipitation scavenging of traffic-related aerosols [41].
The overall correlation structure reveals two distinct parameter clusters: a traffic-related particulate cluster comprising EC, Cl, true colour, Zn, Cd, and Pb with strong mutual correlations (r > 0.769), and a nitrogen–mineral cluster comprising NO3–N, NO2–N, NH4+–N, and total hardness, reflecting the atmospheric coupling between nitrogen deposition and mineral aerosol neutralisation processes. Turbidity showed weaker and, in some cases, non-significant correlations with several parameters (e.g., r = 0.082 with total hardness, p = 0.628; r = 0.030 with NO3–N, p = 0.861), reflecting its dependence on particle size distribution and event-specific wash-off dynamics that are not captured by ionic concentrations alone. This bipartite correlation structure is further elucidated by PCA (Section 3.5).

3.5. Principal Component Analysis

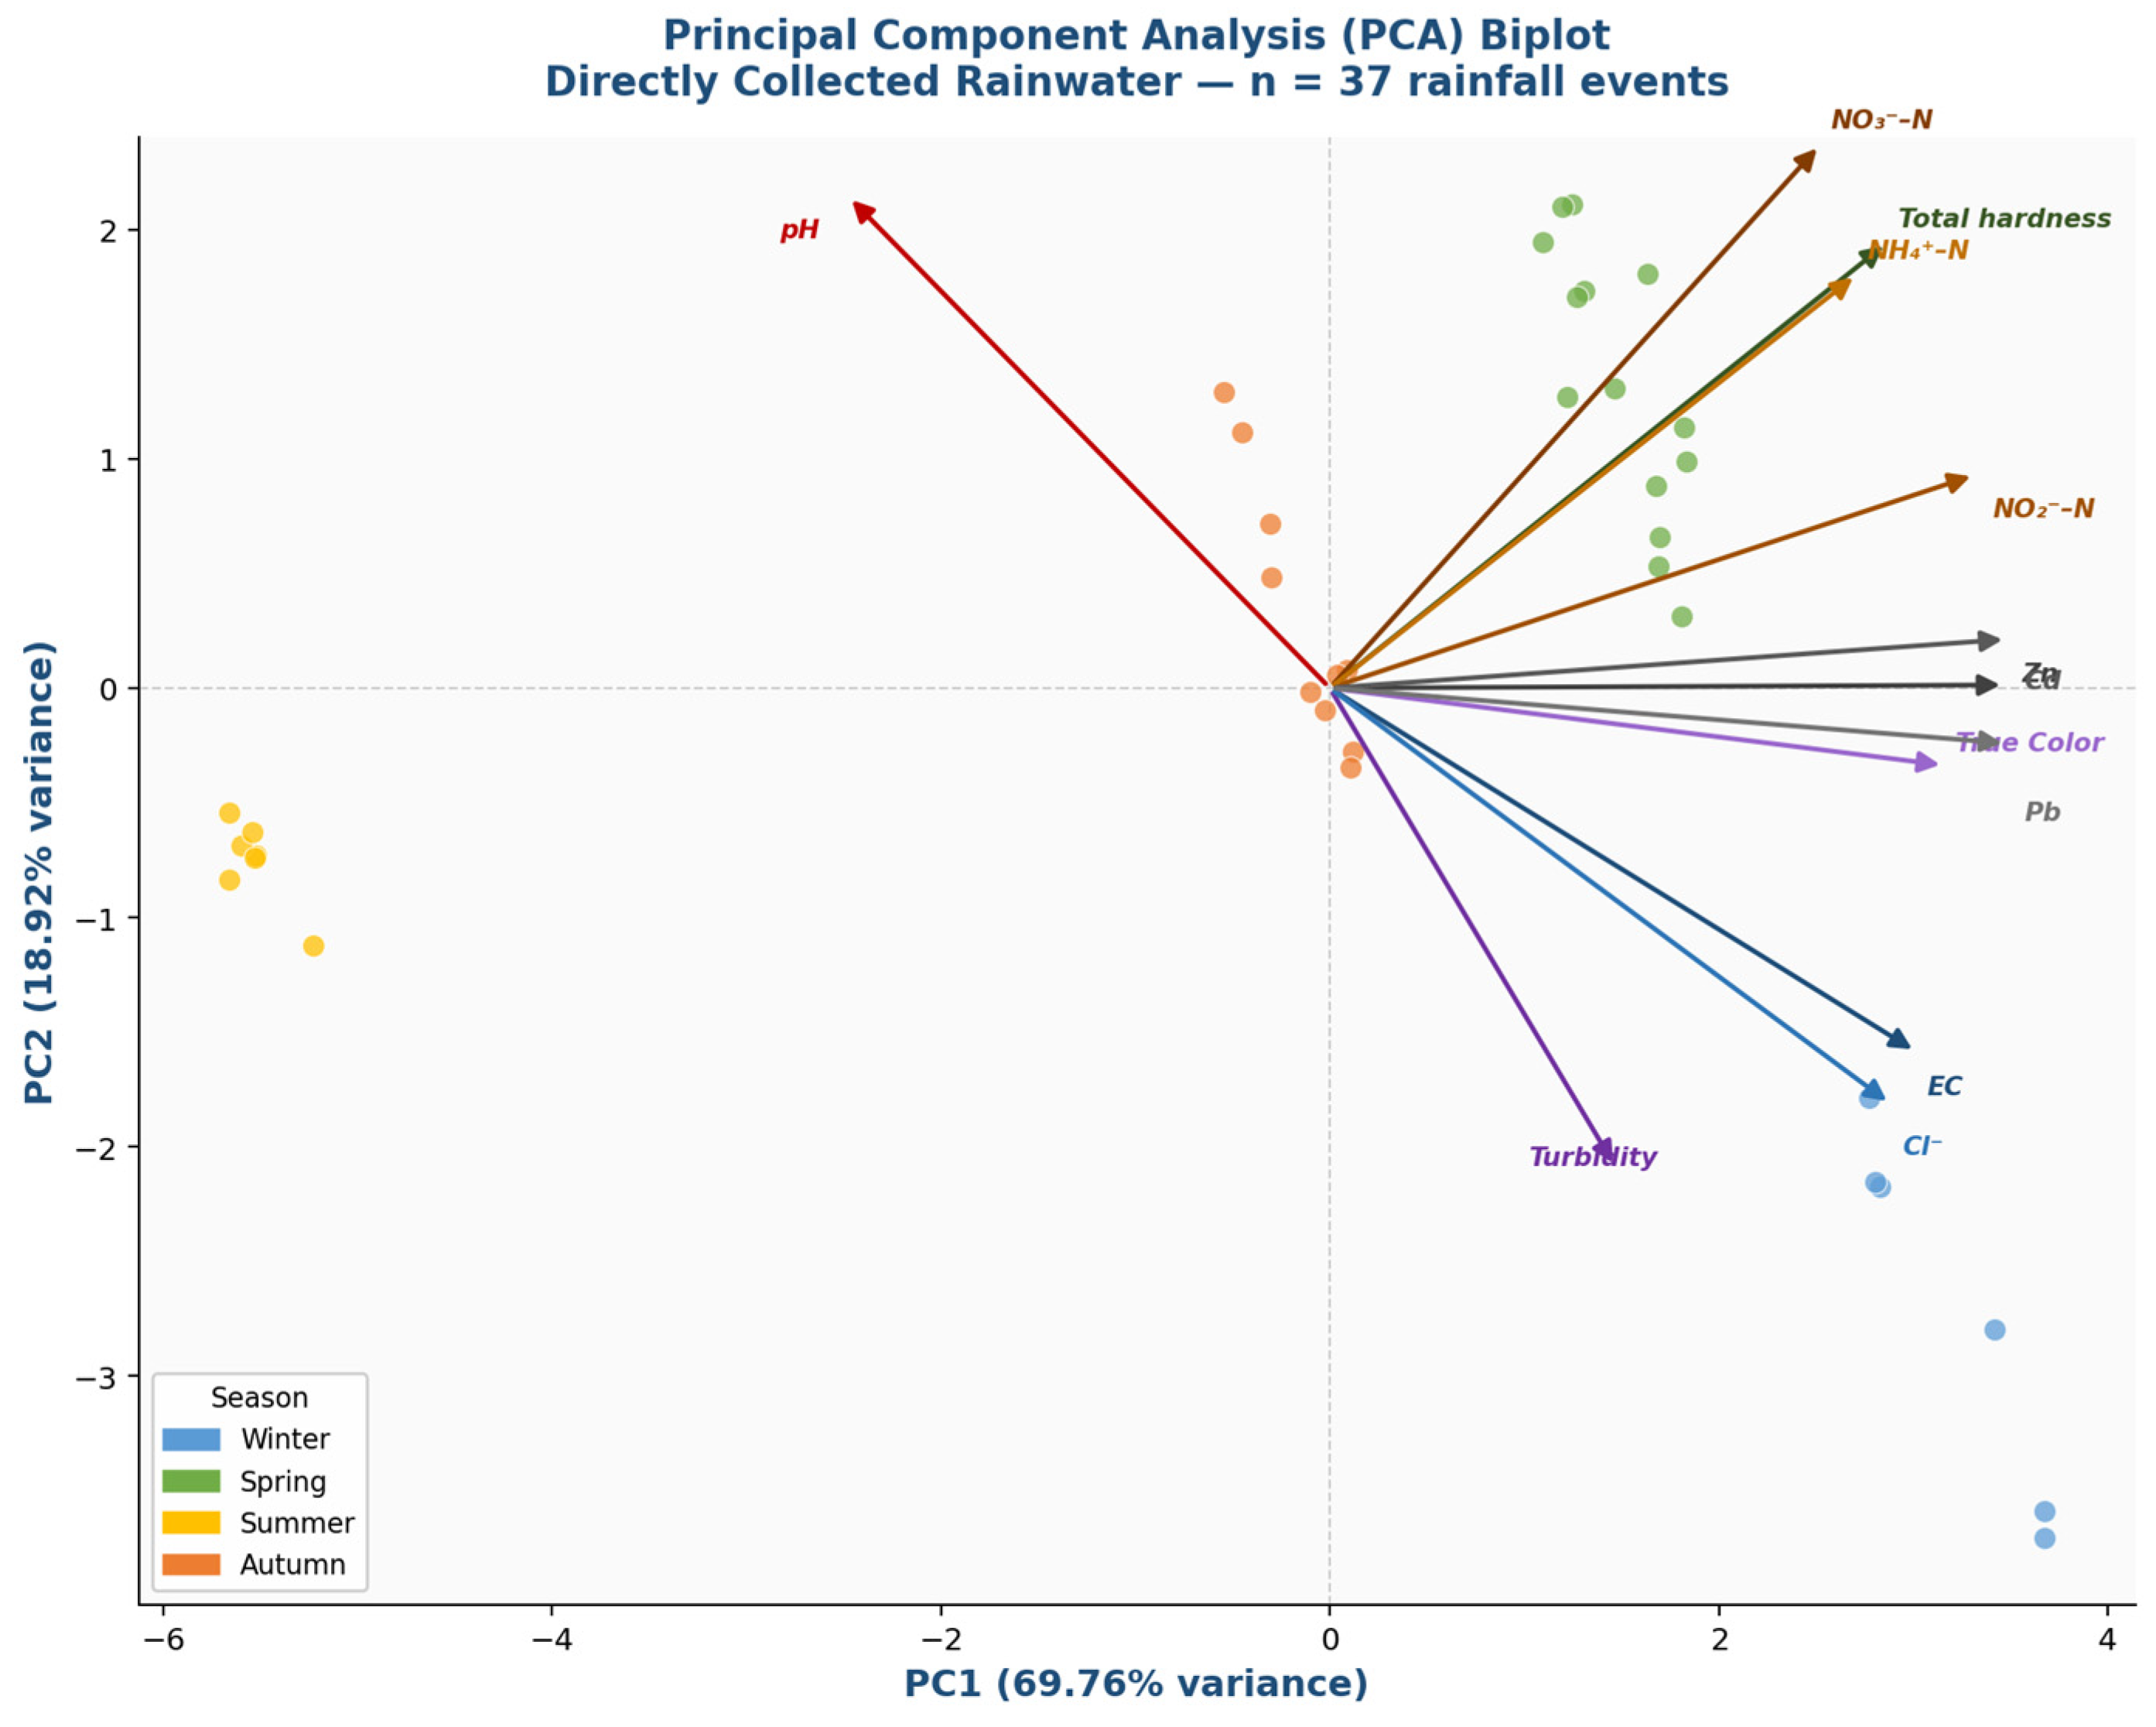
Principal Component Analysis (PCA) was applied to event-mean concentrations of all twelve physicochemical parameters (n = 37 rainfall events). Prior to analysis, the dataset was standardised using z-score normalisation. Components were extracted using principal component extraction without rotation (unrotated solution); no Varimax or oblique rotation was applied, as the two retained components were sufficiently interpretable in their unrotated form and rotation would not alter the total variance explained. The Kaiser–Meyer–Olkin measure (KMO = 0.922) confirmed excellent sampling adequacy, and Bartlett’s test of sphericity (p < 0.001) confirmed the factorability of the correlation matrix, indicating that the dataset was suitable for multivariate factor extraction [37]. Two principal components with eigenvalues greater than 1 were retained according to the Kaiser criterion, collectively explaining 88.72% of the total variance (Table 7 and Table 8).
PC1 (eigenvalue: 8.595; variance explained: 69.69%) was dominated by the strongest positive loadings in the dataset: NO2–N (0.945), Cd (0.995), Pb (0.999), Zn (0.996), true colour (0.906), EC (0.864), Cl (0.824), total hardness (0.821), NH4+–N (0.774), and NO3–N (0.721), alongside a strong negative loading for pH (−0.710).
PC2 (eigenvalue: 2.347; variance explained: 19.03%) contrasted positive loadings of pH (0.612), NO3–N (0.679), total hardness (0.558), and NH4+–N (0.517) against negative loadings of turbidity (−0.598) and Cl (−0.523).
The PCA biplot (Figure 10) illustrates the strong clustering of trace metals and ionic and nutrient species along PC1, while nitrogen species exhibit partial separation along PC2, consistent with their dual origin from both direct vehicular emissions (PC1) and secondary atmospheric chemistry (PC2).

4. Discussion

The results demonstrate that rainwater chemistry in District 1, Bucharest is controlled by the combined influence of local emission sources, secondary atmospheric processes, and seasonal meteorological variability. The integration of descriptive statistics, Pearson’s correlation analysis, and Principal Component Analysis provides a mutually consistent interpretive framework across contrasting urban land-use types. Comparisons with drinking water quality guidelines are used exclusively as indicative thresholds for rainwater harvesting risk assessment and do not imply compliance obligations applicable to atmospheric precipitation [23].

4.1. Land-Use Control and Source Contributions

The most consistent feature of the dataset is the significantly higher concentration of nearly all measured constituents at traffic-influenced sites (P1–P4) relative to urban-green sites (P5–P6) (Mann–Whitney U, p < 0.001), with the sole exception of pH. This categorical, land-use-based contrast—rather than any continuous spatial pattern—is the appropriate interpretive framework for a six-site network, and it agrees with findings from urban precipitation monitoring studies in comparable Eastern Mediterranean and European environments [19,20]. Correlation analysis (n = 37 event-means) confirms strong associations between EC, Cl, true colour and trace metals (r = 0.769–0.990), with all three metals forming a tightly intercorrelated cluster (r = 0.967–0.973) and loading near-exclusively on PC1 (Zn: 0.996; Cd: 0.995; Pb: 0.999), confirming that particulate-associated vehicular pollutants represent the dominant fraction of anthropogenic atmospheric deposition in this urban environment [36,37]. Conversely, the lower concentrations at urban-green locations reflect the combined mitigating effect of increased distance from emission sources, enhanced atmospheric dispersion in open park environments, and partial retention of particulate matter by vegetation cover.
Zinc, cadmium and lead exhibited the most pronounced land-use differentiation. Their near-unity loadings on PC1 (Pb: 0.999; Zn: 0.996; Cd: 0.995) reflect near-perfect collinearity consistent with a common and exclusive vehicular source—co-emission through tyre and brake wear, fuel combustion residues, and road surface abrasion [13,20,22]. Zinc remained below WHO guideline values across all sites. Cadmium reached the WHO drinking water guideline at traffic sites, with the highest summer contrast between site categories (traffic-to-green ratio: 2.43), confirming persistent vehicular contribution even during dilution-dominated conditions [22,40]. Lead exceeded the EU parametric value at traffic sites during winter, spring and autumn, while remaining below WHO and USEPA thresholds; this is consistent with broader EMEP trends documenting persistent urban traffic contributions to Pb wet deposition despite overall declining trends since 1980 [25]. The lower relative variability of Pb reflects the more diffuse and stable nature of its sources, consistent with findings from Central Poland where similar Pb/Zn ratios were observed at urban and forest sites [41]. The higher true colour and turbidity at roadside locations are attributable to enhanced particulate and chromophoric organic loading from vehicular activity.
The near-neutral to slightly alkaline pH observed across the study area represents a substantial deviation from the acidic background precipitation (pH 4.19–5.82) documented at EMEP monitoring stations across Europe during 2000–2017 [42]. This is consistent with the strong alkaline-buffering regime reported for Romanian precipitation [40,43]; in the present study, neutralisation is inferred from the pH range and from the strong positive correlation between pH and total hardness (r = 0.821 on PC1), rather than from a direct ion-balance computation, which would require the major cations and sulphate not determined here. The systematically higher pH at urban-green sites reflects greater availability of alkaline crustal particles derived from soil resuspension and vegetated surfaces, consistent with findings from comparable urban environments [44]. Notably, on the recalculated n = 37 dataset, pH showed no statistically significant correlation with NO3–N (r = −0.129, ns) or NH4+–N (r = −0.226, ns), indicating that nitrogen species do not exert a dominant control on bulk pH when event averaging is applied.

4.2. Seasonal Variability

Seasonal variation was statistically significant for all parameters (Kruskal–Wallis, p < 0.001; turbidity p < 0.05), with winter and spring maxima and consistent summer minima (Table 5). This pattern is governed by the interplay between pollutant accumulation during cold, dry periods and dilution during high-intensity convective summer precipitation, reflecting the inverse relationship between ionic concentration and precipitation amount documented for the Carpathian region and Central Europe [40,45]. The contrasting precipitation regimes of the study area exert strong control on atmospheric scavenging efficiency and influence rainwater chemistry through washout and rainout processes, i.e., the below-cloud and in-cloud removal of particulate and gaseous pollutants, respectively; the seasonal distribution of rainfall intensity therefore controls pollutant dilution, scavenging efficiency, and the wash-off of accumulated dry deposition.
Winter maxima in EC, chloride, turbidity, true colour and trace metals are further enhanced by prolonged antecedent dry periods (mean 8.9 days between sampled events), which allow greater accumulation of soluble aerosols and particulate matter on urban surfaces under stable boundary-layer conditions, by road de-icing agents (predominantly NaCl and MgCl2), and by additional particulate inputs from residential heating during the cold season [46,47].
The spring maxima observed for total hardness, nitrate and ammonium reflect a different set of processes. Nitrate peaked during spring, consistent with enhanced photochemical NOx oxidation under higher solar radiation and temperature [16], while ammonium showed a spring maximum consistent with the seasonal peak of agricultural NH3 emissions from the surrounding Romanian Plain, which occurs during the main March–May fertilisation period [24]. The spring hardness maximum reflects the event-driven wash-off of mineral particles accumulated during the preceding dry winter period, combined with increased agricultural activity in the surrounding plain. The strong mutual correlations among nitrogen species (r = 0.774–0.941) and their partial separation along PC2 (eigenvalue: 2.347; 19.03% of variance) confirm that secondary atmospheric nitrogen chemistry operates as a partially independent process from direct vehicular particulate emission. Importantly, the traffic-versus-green contrast persisted in every season, indicating that local emission sources dominate over meteorological modulation.

4.3. Comparison with Previous Studies

When compared with background precipitation chemistry reported by the EMEP network across 27 European countries during 2000–2017 [42], the rainwater collected in Bucharest showed three notable deviations. First, pH values (6.94–7.13) substantially exceeded the EMEP background range (4.19–5.82), consistent with the alkaline-buffering regime documented at Romanian sites. Second, among the nitrogen species and chloride measured in the present study, NH4+–N showed the highest mean concentrations at both site types, in contrast to the EMEP-documented order where NH4+ occupies fourth position after SO42−, Cl and Na+, and substantially exceeded typical EMEP volume-weighted mean values for Central and Eastern Europe—reflecting the combined influence of traffic-related NH3 emissions from catalytic converters, agricultural sources from the surrounding Romanian Plain, and secondary atmospheric neutralisation processes [24]. Third, differences between traffic and green site categories ranged from +33% (Pb) to +67% (Zn) and +64% (Cd), confirming the strong and consistent localised influence of vehicular emission sources on wet deposition quality across all measured parameters.
The two-factor structure identified here—direct traffic-related particulate emissions (PC1) versus secondary atmospheric nitrogen processing (PC2)—is consistent with PCA-based source apportionment reported from comparable urban precipitation studies [19,20,40,48]. The identification of Cd and Pb as the highest-risk trace metals likewise agrees with precipitation monitoring in the Carpathian region of Romania [22,40].
The predominance of land use and traffic intensity as the primary drivers of intra-urban variability in precipitation chemistry is consistent with monitoring studies from comparable European cities [13,19].

4.4. Additional Pollutant Sources and Regional Transport

Although local vehicular emissions dominate the land-use contrast, several additional sources contribute to the regional background common to all sampling sites. Regional and long-range atmospheric transport delivers a shared aerosol burden that is scavenged relatively uniformly across the city; such transport does not generate between-site differences but does elevate baseline concentrations at all locations, and it is one reason why intra-urban differences are better expressed as a land-use category contrast than as an interpolated concentration field. Agricultural emissions from the surrounding Romanian Plain—principally NH3 and mineral dust—represent a documented seasonal contributor, most evident in the spring ammonium and total hardness maxima [24,49]. Residential combustion of biomass and solid fuels during the heating season is a recognised secondary source of Zn, Cd and Pb in Central and Eastern European urban air and is consistent with the winter enhancement of these metals [47,50]. Industrial contributions from the wider metropolitan area cannot be entirely excluded, although the strong collinearity of the trace metals with traffic-related tracers indicates that vehicular sources remain the dominant driver of the observed variability.

4.5. Limitations

Several limitations should be considered when interpreting these results. The monitoring period covered a single 11-month interval (January–November 2025), which does not capture inter-annual variability. The network comprised only six sampling sites, which constrains generalisation to the broader metropolitan area and precludes formal spatial interpolation: with n = 6, neither Inverse Distance Weighting nor Kriging can be reliably parameterised, as a stable experimental variogram cannot be estimated from so few points. Quantitative traffic counts (vehicles/day) were not available for the individual sites, so the traffic-influenced versus urban-green classification relies on site typology and road function, and the traffic signal is characterised through the statistically significant concentration contrast between site categories rather than through a direct concentration–traffic regression. The use of bulk collectors does not allow direct differentiation between wet and dry deposition contributions, with dry deposition estimated to account for 15–35% of the total ionic and trace-metal load; no dedicated wind-shielding devices were used, although the standardised deployment across all sites means that any residual wind-related bias is expected to affect the two site categories comparably. Sulphate and additional potentially toxic elements such as arsenic were not determined, which prevents a complete ion balance, and the kit-based colorimetric platform, although validated for this matrix, offers lower sensitivity and elemental specificity than ICP-MS or AAS. Finally, the study did not include formal source-apportionment techniques (e.g., receptor modelling or isotopic analysis), PM2.5/PM10 measurements, or atmospheric dispersion modelling, which would allow a more quantitative separation of vehicular, agricultural and long-range contributions.

4.6. Implications for Rainwater Harvesting

These findings have direct implications for urban rainwater harvesting. Collection-site location is a primary determinant of harvested rainwater quality: systems in high-traffic areas require more extensive pre-treatment—particularly for trace metals and ammonium—than systems in urban-green areas, where contamination levels are considerably lower. Cadmium reached the WHO indicative guideline, and lead exceeded the EU parametric value at traffic sites, indicating that untreated roadside rainwater is unsuitable for potable reuse, whereas urban-green sites represent substantially more favourable collection environments. Climate-driven shifts in precipitation intensity may further influence harvested rainwater quality through changes in dilution and wash-off accumulation dynamics [2]. Future research should incorporate expanded monitoring networks and longer monitoring periods, wet-only sampling protocols, a complete major-ion balance, and advanced source apportionment techniques—including isotopic analysis and receptor modelling—to quantify the relative contributions of vehicular emissions, agricultural sources and long-range transport.

5. Conclusions

This study provides the first integrated, event-based assessment of directly collected rainwater chemistry for the Romanian capital, demonstrating that wet deposition quality in a highly urbanised sector of Bucharest is strongly controlled by traffic-related emissions, secondary atmospheric processes and seasonal meteorological variability. Concentrations were significantly higher at traffic-influenced than at urban-green sites for all measured parameters (p < 0.001), and multivariate analysis resolved this behaviour into two interpretable factors: traffic-related particulate pollution (69.69% of variance) and secondary atmospheric nitrogen processing (19.03%).
From a water-quality perspective, the key finding is that harvested rainwater quality is primarily determined by collection-site location. Cadmium at traffic sites equalled the WHO indicative guideline, lead exceeded the EU parametric value during winter, spring and autumn, and ammonium exceeded its indicator value in the majority of traffic-site events, whereas urban-green sites remained consistently below these thresholds.
These results translate into several practical recommendations. Harvesting systems should preferentially be located in low-traffic or vegetated areas, where contamination is considerably lower and treatment requirements are correspondingly reduced. Where collection in high-traffic environments is unavoidable, targeted pre-treatment—particularly for trace metals and ammonium—is required before any potable reuse, and first-flush diversion should be considered to limit the input of accumulated dry deposition. Site-specific quality assessment should therefore be integrated into urban water-management planning, and routine precipitation-quality monitoring is recommended to support evidence-based policy for the sustainable use of harvested rainwater.
Future research should extend the monitoring network and period, adopt wet-only sampling protocols, include a complete major-ion characterisation (SO42−, Ca2+, Mg2+, Na+, K+) enabling formal ion-balance verification, and apply source-apportionment techniques such as isotopic tracers and receptor modelling to better quantify the relative contributions of vehicular, agricultural and regional atmospheric sources.


Author Contributions

Conceptualisation, M.A.S. and V.I.; methodology, M.A.S.; software, M.A.S. and D.M.; validation, M.A.S., D.M. and V.I.; formal analysis, M.A.S.; investigation, M.A.S. and V.I.; resources, D.M.; data curation, M.A.S.; writing—original draft preparation, M.A.S.; writing—review and editing, V.I. and D.M.; visualisation, M.A.S.; supervision, V.I.; project administration, V.I.; funding acquisition, M.A.S. All authors have read and agreed to the published version of the manuscript.

Funding

This research received no external funding.

Data Availability Statement

The data presented in this study are available on request from the corresponding author.

Acknowledgments

The authors acknowledge Hach Lange S.R.L. (Romania) for providing laboratory equipment and analytical reagents used in this study. Meteorological data used in this study were obtained from the Băneasa meteorological station operated by the Romanian National Meteorological Administration (Administrația Națională de Meteorologie, ANM), whose support is gratefully acknowledged.

Conflicts of Interest

The authors declare no conflicts of interest.

References

  1. Semaan, M.; Day, S.D.; Garvin, M.; Ramakrishnan, N.; Pearce, A. Optimal Sizing of Rainwater Harvesting Systems for Domestic Water Usages: A Systematic Literature Review. Resour. Conserv. Recycl. X 2020, 6, 100033. [Google Scholar] [CrossRef]
  2. Musayev, S.; Burgess, E.; Mellor, J. A Global Performance Assessment of Rainwater Harvesting under Climate Change. Resour. Conserv. Recycl. 2018, 132, 62–70. [Google Scholar] [CrossRef]
  3. Campisano, A.; Butler, D.; Ward, S.; Burns, M.J.; Friedler, E.; DeBusk, K.; Fisher-Jeffes, L.N.; Ghisi, E.; Rahman, A.; Furumai, H.; et al. Urban Rainwater Harvesting Systems: Research, Implementation and Future Perspectives. Water Res. 2017, 115, 195–209, Correction in Water Res. 2017, 121, 386. https://doi.org/10.1016/j.watres.2017.06.002. [Google Scholar] [CrossRef] [PubMed]
  4. Grabowski, T.; Jóźwiakowski, K.; Bochniak, A.; Stachyra, P.; Radliński, B. Assessment of Rainwater Quality Regarding Its Use in The Roztocze National Park (Poland)—Case Study. Appl. Sci. 2023, 13, 6110. [Google Scholar] [CrossRef]
  5. Kaposztasova, D.; Vranayova, Z.; Markovic, G.; Purcz, P. Rainwater Harvesting, Risk Assessment and Utilization in Kosice-City, Slovakia. Procedia Eng. 2014, 89, 1500–1506. [Google Scholar] [CrossRef]
  6. Cureau, R.J.; Ghisi, E. Reduction of Potable Water Consumption and Sewage Generation on a City Scale: A Case Study in Brazil. Water 2019, 11, 2351. [Google Scholar] [CrossRef]
  7. Lempart-Rapacewicz, A.; Zakharova, J.; Kudlek, E. Rainwater Quality Analysis for Its Potential Recovery: A Case Study on Its Usage for Swimming Pools in Poland. Sustainability 2023, 15, 15037. [Google Scholar] [CrossRef]
  8. Ozbayram, E.G.; Köker, L.; Oğuz Çam, A.; Akçaalan, R.; Albay, M. Water Quality and Risk Assessment in Rainwater Harvesting Ponds. Environ. Sci. Proc. 2023, 25, 28. [Google Scholar] [CrossRef]
  9. Zdeb, M.; Zamorska, J.; Papciak, D.; Słyś, D. The Quality of Rainwater Collected from Roofs and the Possibility of Its Economic Use. Resources 2020, 9, 12. [Google Scholar] [CrossRef]
  10. Sazakli, E.; Alexopoulos, A.; Leotsinidis, M. Rainwater Harvesting, Quality Assessment and Utilization in Kefalonia Island, Greece. Water Res. 2007, 41, 2039–2047. [Google Scholar] [CrossRef] [PubMed]
  11. Vladasel(Pasarescu), A.C.; Pienaru, A.M. Assesing the Oportunities of Delivering Sustainable Drainage Systems in Romania. AgroLife Sci. J. 2022, 11, 253–258. [Google Scholar] [CrossRef]
  12. Teixidó, M.; Schmidlin, D.; Xu, J.; Scheiber, L.; Chesa, M.J.; Vázquez-Suñé, E. Contaminants in Urban Stormwater: Barcelona Case Study. Adv. Geosci. 2023, 59, 69–76. [Google Scholar] [CrossRef]
  13. Göbel, P.; Dierkes, C.; Coldewey, W.G. Storm Water Runoff Concentration Matrix for Urban Areas. J. Contam. Hydrol. 2007, 91, 26–42. [Google Scholar] [CrossRef] [PubMed]
  14. Alcolea, A.; Fernández-López, C.; Vázquez, M.; Caparrós, A.; Ibarra, I.; García, C.; Zarroca, M.; Rodríguez, R. An Assessment of the Influence of Sulfidic Mine Wastes on Rainwater Quality in a Semiarid Climate (SE Spain). Atmos. Environ. 2015, 107, 85–94. [Google Scholar] [CrossRef]
  15. Burton, G.A., Jr.; Pitt, R. Stormwater Effects Handbook: A Toolbox for Watershed Managers, Scientists, and Engineers; CRC Press: Boca Raton, FL, USA, 2002. [Google Scholar]
  16. Zhang, Y.; Zheng, L.; Liu, X.; Jickells, T.; Neil Cape, J.; Goulding, K.; Fangmeier, A.; Zhang, F. Evidence for Organic N Deposition and Its Anthropogenic Sources in China. Atmos. Environ. 2008, 42, 1035–1041. [Google Scholar] [CrossRef]
  17. Helmreich, B.; Horn, H. Opportunities in Rainwater Harvesting. Desalination 2009, 248, 118–124. [Google Scholar] [CrossRef]
  18. Shrestha, S.; Kazama, F. Assessment of Surface Water Quality Using Multivariate Statistical Techniques: A Case Study of the Fuji River Basin, Japan. Environ. Model. Softw. 2007, 22, 464–475. [Google Scholar] [CrossRef]
  19. Cukurluoglu, S. Sources of Trace Elements in Wet Deposition in Pamukkale, Denizli, Western Turkey. Environ. Forensics 2017, 18, 83–99. [Google Scholar] [CrossRef]
  20. Başak, B.; Alagha, O. Trace Metals Solubility in Rainwater: Evaluation of Rainwater Quality at a Watershed Area, Istanbul. Environ. Monit. Assess. 2010, 167, 493–503. [Google Scholar] [CrossRef] [PubMed]
  21. European Environment Agency (EEA). Air Pollution Transport and Deposition. EEA Report; European Environment Agency: Copenhagen, Denmark, 2019.
  22. Santos, P.S.M. Rainwater Quality in Southern Europe: Insights and Challenges Regarding Potential Toxic Elements. Water 2024, 16, 3640. [Google Scholar] [CrossRef]
  23. Ianiri, G.; Settimo, G.; Avino, P. Atmospheric Bulk Depositions: State-of-the-Art and European Legislative Framework with Focus on Italy. Environ. Sci. Pollut. Res. 2024, 32, 10406–10424. [Google Scholar] [CrossRef] [PubMed]
  24. Fagerli, H.; Tsyro, S.; Simpson, D.; Schulz, M.; Gauss, M.; Jonson, J.E.; Benedictow, A.; Wind, P.; Nyíri, Á.; Steensen, B.M.; et al. Transboundary Particulate Matter, Photo-Oxidants, Acidifying and Eutrophying Components. EMEP Status Report; The Norwegian Meteorological Institute: Oslo, Norway, 2016. [Google Scholar]
  25. Tørseth, K.; Aas, W.; Breivik, K.; Fjæraa, A.M.; Fiebig, M.; Hjellbrekke, A.G.; Lund Myhre, C.; Solberg, S.; Yttri, K.E. Introduction to the European Monitoring and Evaluation Programme (EMEP) and Observed Atmospheric Composition Change during 1972–2009. Atmos. Chem. Phys. 2012, 12, 5447–5481. [Google Scholar] [CrossRef]
  26. Guidelines for Drinking-Water Quality; Incorporating the 1st Addendum; World Health Organization: Geneva, Switzerland, 2021.
  27. Directive (EU) 2020/2184 of the European Parliament and of the Council of 16 Decem-Ber 2020 on the Quality of Water Intended for Human Consumption; Official Journal of the European Union: Luxembourg, 2020; pp. 1–62.
  28. United States Environmental Protection Agency. National Primary Drinking Water Regulations; U.S. Environmental Protection Agency: Washington, DC, USA, 2024.
  29. United States Environmental Protection Agency. Secondary Drinking Water Stand-Ards: Guidance for Nuisance Chemicals; U.S. Environmental Protection Agency: Washington, DC, USA, 2024.
  30. ISO 5667-3:2018; Water Quality—Sampling—Part 3: Preservation and Handling of Water Samples. International Organization for Standardization: Geneva, Switzerland, 2018.
  31. ISO 7027-1:2016; Water Quality—Determination of Turbidity—Part 1: Quantitative Methods. International Organization for Standardization: Geneva, Switzerland, 2016.
  32. ISO 5667-8:2009; Water Quality—Sampling—Part 8: Guidance on Sampling of Wet Deposition. International Organization for Standardization: Geneva, Switzerland, 2009.
  33. ISO 10523:2008; Water Quality—Determination of pH. International Organization for Standardization: Geneva, Switzerland, 2008.
  34. ISO 7888:1985; Water Quality—Determination of Electrical Conductivity. International Organization for Standardization: Geneva, Switzerland, 1985.
  35. American Public Health Association. Standard Methods for the Examination of Water and Wastewater; American Public Health Association: Washington, DC, USA, 2017. [Google Scholar]
  36. Ellison, S.L.R.; Williams, A. Eurachem/CITAC Guide CG 4: Quantifying Uncertainty in Analytical Measurement, 3rd ed.; Eurachem: Teddington, UK, 2012. [Google Scholar]
  37. Leong, J.Y.C.; Chong, M.N.; Poh, P.E.; Hermawan, A.; Talei, A. Longitudinal Assessment of Rainwater Quality under Tropical Climatic Conditions in Enabling Effective Rainwater Harvesting and Reuse Schemes. J. Clean. Prod. 2017, 143, 64–75. [Google Scholar] [CrossRef]
  38. Vialle, C.; Sablayrolles, C.; Lovera, M.; Jacob, S.; Huau, M.-C.; Montrejaud-Vignoles, M. Monitoring of Water Quality from Roof Runoff: Interpretation Using Multivariate Analysis. Water Res. 2011, 45, 3765–3775. [Google Scholar] [CrossRef] [PubMed]
  39. Demiraj, E.; Duka, I.; Brahushi, F.; Shallari, S. Principal Component Analysis: An Appropriate Tool for Trophic Parameters Interaction—Application in Largest Lake in Balkan. Sci. Pap. Ser. E Land Reclam. Earth Obs. Surv. Environ. Eng. 2024, 13, 521–526. [Google Scholar]
  40. Keresztesi, Á.; Birsan, M.-V.; Nita, I.-A.; Bodor, Z.; Szép, R. Assessing the Neutralisation, Wet Deposition and Source Contributions of the Precipitation Chemistry over Europe during 2000–2017. Environ. Sci. Eur. 2019, 31, 50. [Google Scholar] [CrossRef]
  41. Orlović-Leko, P.; Vidović, K.; Ciglenečki, I.; Omanović, D.; Sikirić, M.D.; Šimunić, I. Physico-Chemical Characterization of an Urban Rainwater (Zagreb, Croatia). Atmosphere 2020, 11, 144. [Google Scholar] [CrossRef]
  42. Benmoshe, N. A Simple Solution for the Inverse Distance Weighting Interpolation (IDW) Clustering Problem. Sci 2025, 7, 30. [Google Scholar] [CrossRef]
  43. Keresztesi, Á.; Nita, I.-A.; Birsan, M.-V.; Bodor, Z.; Szép, R. The Risk of Cross-Border Pollution and the Influence of Regional Climate on the Rainwater Chemistry in the Southern Carpathians, Romania. Environ. Sci. Pollut. Res. 2020, 27, 9382–9402. [Google Scholar] [CrossRef] [PubMed]
  44. Siudek, P.; Frankowski, M. The Effect of Sources and Air Mass Transport on the Variability of Trace Element Deposition in Central Poland: A Cluster-Based Approach. Environ. Sci. Pollut. Res. 2017, 24, 23026–23038. [Google Scholar] [CrossRef] [PubMed]
  45. Keresztesi, A.; Sandor, P.; Ghita, G.; Dumitru, F.D.; Moncea, M.A.; Ozunu, A.; Szep, R. Ammonium Neutralization Effect on Rainwater Chemistry in the Basins of the Eastern Carpathians-Romania. Rev. Chim. 2018, 69, 57–63. [Google Scholar] [CrossRef]
  46. Szép, R.; Bodor, Z.; Miklóssy, I.; Niță, I.-A.; Oprea, O.A.; Keresztesi, Á. Influence of Peat Fires on the Rainwater Chemistry in Intra-Mountain Basins with Specific Atmospheric Circulations (Eastern Carpathians, Romania). Sci. Total Environ. 2019, 647, 275–289. [Google Scholar] [CrossRef] [PubMed]
  47. Siudek, P.; Frankowski, M.; Siepak, J. Trace Element Distribution in the Snow Cover from an Urban Area in Central Poland. Environ. Monit. Assess. 2015, 187, 225. [Google Scholar] [CrossRef] [PubMed]
  48. Matta-Ortíz, A.F.; Güiza-Valdes, I.A.; Trujillo-González, J.M.; Rojas-Peña, J.I.; Torres-Mora, M.A.; García-Navarro, F.J.; Jiménez-Ballesta, R. Assessing Rainwater Quality and Harvesting Potential: A Spatial Analysis in a Medium-Sized City of Colombia. Water 2024, 16, 3411. [Google Scholar] [CrossRef]
  49. Begea, M.; Radu, N.; Constantin, M.; Zaharia, R. Impact Assessment Regarding Pollution with Nutrients of Water Resources Due to the Use of Fertilizers with Microbial Biomass. Sci. Pap. Ser. E Land Reclam. Earth Obs. Surv. Environ. Eng. 2013, 13, 678–683. [Google Scholar]
  50. Schwarz, J.; Cusack, M.; Karban, J.; Chalupníčková, E.; Havránek, V.; Smolík, J.; Ždímal, V. PM2.5 Chemical Composition at a Rural Background Site in Central Europe, Including Correlation and Air Mass Back Trajectory Analysis. Atmos. Res. 2016, 176–177, 108–120. [Google Scholar] [CrossRef]
Figure 1. Location of rainwater sampling locations in District 1, Bucharest, Romania.
Water 18 01956 g001
Figure 2. Daily precipitation and air temperature (T_max, T_min) recorded at Băneasa meteorological station (ANM) during the monitoring period (January–November 2025).
Water 18 01956 g002
Figure 3. Overview of the methodological workflow, from site selection and event-based bulk sampling to sample handling, laboratory analysis and statistical/multivariate analysis.
Water 18 01956 g003
Figure 4. Seasonal variability of general physicochemical parameters in directly collected rainwater samples from traffic-influenced and urban-green sampling sites: (a) pH, (b) electrical conductivity, (c) turbidity, (d) true colour and (e) total hardness. Bars represent seasonal means; error bars indicate ± 1 standard deviation (n = 37 events: winter 6, spring 14, summer 7, autumn 10).
Water 18 01956 g004
Figure 5. Seasonal variability of ionic and nutrient species in directly collected rainwater samples from traffic-influenced and urban-green sampling sites: (a) chloride (Cl), (b) nitrate (NO3–N), (c) nitrite (NO2–N), and (d) ammonium (NH4+–N). Bars represent seasonal mean concentrations calculated separately for traffic-influenced locations (P1–P4) and urban-green sampling sites (P5–P6). Bars represent seasonal means; error bars indicate ± 1 standard deviation (n = 37 events: winter 6, spring 14, summer 7, autumn 10).
Water 18 01956 g005
Figure 6. Seasonal variability of trace metal concentrations in directly collected rainwater samples from traffic-influenced and urban-green sampling sites: (a) zinc (Zn), (b) cadmium (Cd), and (c) lead (Pb). Bars represent seasonal mean concentrations averaged across traffic-influenced locations (P1–P4) and urban-green sampling sites (P5–P6). Bars represent seasonal means; error bars indicate ± 1 standard deviation (n = 37 events: winter 6, spring 14, summer 7, autumn 10).
Water 18 01956 g006
Figure 7. Between-site variability of general physicochemical parameters in directly collected rainwater, shown as proportional-symbol maps of measured site means: (a) pH, (b) electrical conductivity (EC), (c) turbidity, (d) true colour, (e) total hardness. Symbol area is proportional to the mean concentration; values are plotted only at the six monitoring locations. Traffic-influenced sites: P1–P4; urban-green sites: P5–P6.
Water 18 01956 g007
Figure 8. Between-site variability of ionic and nutrient species in directly collected rainwater samples: (a) chloride (Cl), (b) nitrate (NO3–N), (c) nitrite (NO2–N), and (d) ammonium (NH4+–N). Symbol area is proportional to the mean concentration. Traffic-influenced sites: P1–P4; urban-green sites: P5–P6.
Water 18 01956 g008
Figure 9. Between-site variability of trace metal concentrations in directly collected rainwater samples: (a) zinc (Zn), (b) cadmium (Cd), and (c) lead (Pb). Symbol area is proportional to the mean concentration; values are plotted only at the six monitoring locations. Traffic-influenced sites: P1–P4; urban-green sites: P5–P6.
Water 18 01956 g009
Figure 10. Principal Component Analysis (PCA) biplot of physicochemical parameters of directly collected rainwater, based on event-mean concentrations (n = 37 rainfall events). PC1 and PC2 explain 69.69% and 19.03% of the total variance, respectively.
Water 18 01956 g010
Table 1. Distribution of rainfall sampling events during the study period.
SeasonNumber of EventsSampling PeriodMin (mm)Max (mm)Mean (mm/event)Total Precipitation (mm)
Winter6January–February0.513.65.9535.7
Spring14March–May1.629.812.17170.3
Summer7June–August1.940.214.1098.7
Autumn10September–November1.850.116.70166.9
Total37471.6
Note: Rainfall events were defined as individual precipitation episodes sampled independently.
Table 2. Geographic coordinates and characteristics of rainwater sampling locations in District 1, Bucharest.
Sample CodeLocationLatitude (N)Longitude (E)Site Type
P1Piața C.A. Rosetti44.43634326.106557Traffic-influenced area
P2Kiseleff Boulevard44.46946826.077311Traffic-influenced area
P3Străulești44.50309626.024697Traffic-influenced area
P4Calea Griviței 22844.46660226.052980Traffic-influenced area
P5Bazilescu Park44.48839526.036236Urban-green area
P6Băneasa Zoo area44.51797626.102437Urban-green area
Table 3. Analytical methods, instruments, measurement units, and limits of quantification (LOQ) used for rainwater quality determination.
Parameter GroupParameterUnitMethodInstrumentLOQ
General physicochemical parameterspHPotentiometric (ISO 10523)HQ Series multiparameter0.01
Electrical conductivityµS/cmElectrometric (ISO 7888)HQ Series multiparameter1
TurbidityNTUNephelometric (ISO 7027-1)HACH 2100Qis0.01
True colourPt–Co unitsSpectrophotometric (455 nm)DR6000 UV–VIS1
Total hardness (as CaCO3)mg/LSpectrophotometric (572 nm)DR6000 UV–VIS1
Anionic and nutrient indicatorsChlorides (Cl)mg/LSpectrophotometric (468 nm)DR6000 UV–VIS0.1
Nitrates (NO3–N)mg/LSpectrophotometric (345 nm)DR6000 UV–VIS0.02
Nitrites (NO2–N)mg/LSpectrophotometric (515 nm)DR6000 UV–VIS0.001
Ammonium (NH4+–N)mg/LSpectrophotometric (694 nm)DR6000 UV–VIS0.015
Trace metalsCadmium (Cd)mg/LSpectrophotometric (600 nm)DR6000 UV–VIS0.001
Lead (Pb)mg/LSpectrophotometric (520 nm)DR6000 UV–VIS0.001
Zinc (Zn)mg/LSpectrophotometric (490 nm)DR6000 UV–VIS0.01
Note: NTU: nephelometric turbidity units; Pt–Co: platinum–cobalt colour units.
Table 4. Descriptive statistics and traffic-vs-green significance of physicochemical parameters of directly collected rainwater from traffic-influenced and urban-green sampling sites.
DatasetStatisticpHEC (µS/cm)Turbidity (NTU)True Colour (Pt–Co Units)Total Hardness (mg CaCO3/L)Cl (mg/L)NO3–N (mg/L)NO2–N (mg/L)NH4+–N (mg/L)Zn (mg/L)Cd (mg/L)Pb (mg/L)
Traffic sites (P1–P4)
Mean6.9450.411.6815.5222.542.061.220.0310.5940.0850.002270.00566
SD0.1811.050.722.173.910.410.190.0070.1260.0140.000410.00053
CV (%)2.6521.9342.7713.9717.3620.1115.7223.0721.1615.9618.269.32
Min6.4232.810.4010.1213.191.200.840.0150.3580.0500.00130.00437
Max7.2874.753.8019.5128.683.121.530.0400.7880.1120.00300.00657
Urban-green sites (P5–P6)
Mean7.1334.311.048.9214.921.200.920.0240.4290.0510.001380.00425
SD0.1710.680.432.053.720.410.190.0060.1230.0130.000420.00053
CV (%)2.3531.1240.9422.9624.9233.7320.2725.0728.7126.4130.4012.40
Min6.6818.470.303.686.280.520.560.0110.2120.0240.00050.00299
Max7.4459.902.2011.9620.112.141.190.0300.6080.0740.00200.00515
Overall dataset
Mean7.0045.041.4613.3220.001.771.120.0280.5390.0740.001980.00519
SD0.2013.300.703.775.270.580.240.0080.1470.0210.000590.00085
CV (%)2.8729.5247.9228.3126.3332.4921.1026.6027.2728.6029.8916.38
Min6.4218.470.303.686.280.520.560.0110.2120.0240.00050.00299
Max7.4474.753.8019.5128.683.121.530.0400.7880.1120.00300.00657
Difference (Traffic vs. Green) −3%+47%+61%+74%+51%+71%+32%+31%+39%+67%+64%+33%
p-value (Mann–Whitney U) <0.001 ***<0.001 ***<0.001 ***<0.001 ***<0.001 ***<0.001 ***<0.001 ***<0.001 ***<0.001 ***<0.001 ***<0.001 ***<0.001 ***
Note: SD: standard deviation; CV (%): coefficient of variation. Descriptive statistics are based on individual site-event measurements—traffic-influenced sites (P1–P4): n = 148 (37 events × 4 sites); urban-green sites (P5–P6): n = 74 (37 events × 2 sites); overall dataset: n = 222. CV: coefficient of variation. Differences between site categories were tested with the Mann–Whitney U test (Shapiro–Wilk indicated non-normality); *** p < 0.001 for all parameters. For pH, the significantly higher values occurred at urban-green sites (difference shown as −3%).
Table 5. Seasonal variability of physicochemical parameters in directly collected rainwater, with results of the Kruskal–Wallis test and Dunn post hoc grouping.
ParameterWinterSpringSummerAutumnKruskal–Wallis
pH6.72 c ± 0.1377.03 ab ± 0.0977.20 a ± 0.0757.00 bc ± 0.122H = 22.6, p < 0.001 ***
EC (µS/cm)66.04 a ± 0.69945.90 a ± 0.46430.95 b ± 0.63941.12 b ± 0.466H = 33.0, p < 0.001 ***
Turbidity (NTU)2.15 a ± 0.6831.47 ab ± 0.5541.23 ab ± 0.4891.20 b ± 0.472H = 8.0, p = 0.046 *
True colour (Pt–Co)15.51 a ± 0.38613.43 b ± 0.2639.64 b ± 0.35514.43 a ± 0.330H = 33.0, p < 0.001 ***
Total hardness (mg CaCO3/L)19.14 bc ± 0.43923.13 a ± 0.41513.19 c ± 0.66820.91 b ± 0.349H = 33.0, p < 0.001 ***
Cl (mg/L)2.56 a ± 0.0671.76 ab ± 0.0371.30 c ± 0.0401.66 bc ± 0.038H = 32.6, p < 0.001 ***
NO3–N (mg/L)1.02 bc ± 0.0111.31 a ± 0.0170.817 c ± 0.0151.11 b ± 0.017H = 33.0, p < 0.001 ***
NO2–N (mg/L)0.031 ab ± 0.000440.032 a ± 0.000910.015 c ± 0.000480.031 bc ± 0.00056H = 25.5, p < 0.001 ***
NH4+–N (mg/L)0.533 ab ± 0.0130.678 a ± 0.0110.356 c ± 0.0110.477 bc ± 0.011H = 33.0, p < 0.001 ***
Zn (mg/L)0.088 a ± 0.002150.081 a ± 0.002180.051 b ± 0.001130.071 b ± 0.00179H = 33.0, p < 0.001 ***
Cd (mg/L)0.00240 a ± 0.000060.00218 a ± 0.000060.00125 b ± 0.000030.00195 b ± 0.00007H = 32.9, p < 0.001 ***
Pb (mg/L)0.00580 a ± 0.000070.00538 ab ± 0.000080.00428 c ± 0.000070.00518 bc ± 0.00007H = 32.6, p < 0.001 ***
Note: Values are event-level means ± standard deviation, calculated from the overall mean of the six sampling sites for each rainfall event (n = 37 events: winter 6, spring 14, summer 7, autumn 10); the standard deviation therefore expresses event-to-event variability within each season rather than between-site variability (the latter is reported in Table 4). Seasonal differences were tested with the Kruskal–Wallis test followed by Dunn’s post hoc test with Bonferroni correction; within each row, means sharing the same superscript letter do not differ significantly (p ≥ 0.05). *** p < 0.001, * p < 0.05.
Table 6. Pearson’s correlation matrix between physicochemical parameters measured in directly collected rainwater samples (n = 37 event-means).
ParameterpHECTurbidityTrue ColourTotal HardnessClNO3–NNO2–NNH4+–NZnCdPb
pH1
EC−0.789 ***1
Turbidity−0.710 ***0.515 **1
True Colour−0.688 ***0.778 ***0.287 ns1
Total Hardness−0.277 ns0.396 *0.082 ns0.691 ***1
Cl−0.809 ***0.990 ***0.513 **0.769 ***0.332 *1
NO3–N−0.129 ns0.280 ns0.030 ns0.513 **0.957 ***0.198 ns1
NO2–N−0.509 **0.638 ***0.185 ns0.884 ***0.931 ***0.595 ***0.833 ***1
NH4+–N−0.226 ns0.444 **0.170 ns0.475 **0.879 ***0.359 *0.941 ***0.774 ***1
Zn−0.659 ***0.871 ***0.392 *0.844 ***0.770 ***0.827 ***0.687 ***0.889 ***0.775 ***1
Cd−0.632 ***0.846 ***0.302 ns0.874 ***0.803 ***0.798 ***0.715 ***0.926 ***0.762 ***0.967 ***1
Pb−0.698 ***0.885 ***0.378 *0.907 ***0.754 ***0.851 ***0.639 ***0.907 ***0.696 ***0.973 ***0.970 ***1
Note: n = 37 event-means. Significance: * p < 0.05, ** p < 0.01, *** p < 0.001, ns = not significant (p ≥ 0.05).
Table 7. Principal component loadings for rainwater parameters (n = 37 rainfall events).
ParameterPC1PC2
pH−0.7100.612
EC0.864−0.453
Turbidity0.421−0.598
True colour0.906−0.102
Total hardness0.8210.558
Cl0.824−0.523
NO3–N0.7210.679
NO2–N0.9450.282
NH4+–N0.7740.517
Zn0.996−0.007
Cd0.9950.053
Pb0.999−0.060
Note: loading ≥ 0.70 (strong positive), loading ≤ −0.70 (strong negative).
Table 8. Explained variance of principal components.
ComponentEigenvalueVariance Explained (%)Cumulative (%)
PC18.59569.6969.69
PC22.34719.0388.72
PC30.7636.1994.91
Disclaimer/Publisher’s Note: The statements, opinions and data contained in all publications are solely those of the individual author(s) and contributor(s) and not of MDPI and/or the editor(s). MDPI and/or the editor(s) disclaim responsibility for any injury to people or property resulting from any ideas, methods, instructions or products referred to in the content.