Article

Metagenomic Characterization of Antibiotic Resistance Genes, Mobile Genetic Elements and Virulence Factors in the Surface Water of the Baotou Section of the Yellow River

1
School of Public Health, Inner Mongolia Medical University, Hohhot 010110, China
2
State Key Laboratory of Environmental Criteria and Risk Assessment, Chinese Research Academy of Environmental Sciences, Beijing 100012, China
3
Baotou Branch, Inner Mongolia Environmental Monitoring Center, Baotou 014060, China
4
Environmental Standards Institute, Chinese Research Academy of Environmental Sciences, Beijing 100012, China
5
School of Public Health, Baotou Medical College, Inner Mongolia University of Science and Technology, Baotou 014040, China
*
Author to whom correspondence should be addressed.
Water 2026, 18(15), 1780; https://doi.org/10.3390/w18151780
Submission received: 5 June 2026 / Revised: 18 July 2026 / Accepted: 21 July 2026 / Published: 23 July 2026

Abstract

Antibiotic resistance genes (ARGs) have been widely recognized as emerging environmental contaminants due to their potential threats to public health and ecosystems. Owing to the extensive use of antibiotics in clinical, agricultural, and aquaculture settings, large quantities of ARGs are continuously introduced into the natural environment. As a result, aquatic environments—particularly surface waters—act as important reservoirs and transmission pathways for ARGs. However, despite the Yellow River being a major surface river in northern China, the occurrence and sources of ARGs in this river remain poorly understood. In this study, shotgun metagenomic sequencing was applied to investigate the composition of ARGs, mobile genetic elements (MGEs), and virulence factors (VFs) in three water sources in the Baotou section of the Yellow River. A total of 35 types of ARGs, 3 types of MGEs, and 14 categories of VFs were identified across all samples. Among them, multidrug resistance genes, peptide resistance genes and glycopeptide resistance genes exhibited relatively high abundances, indicating their widespread distribution in the study area. In terms of MGEs, recombinases and transposases were dominant, suggesting their important roles in gene mobilization. Meanwhile, VFs were mainly associated with metabolic functions, immune modulation, and adherence, reflecting the potential pathogenic risks in the aquatic environment. Co-occurrence networks revealed extensive associations between ARGs and MGEs, as well as ARGs and VFs. Many positive correlations were observed, suggesting possible ecological associations between ARGs and MGEs and potential co-selection between ARGs and VFs. Overall, this study provides valuable insights into the distribution patterns and co-occurrence patterns of ARGs, MGEs, and VFs in the Yellow River and offers a scientific basis for the management and control of antibiotic resistance pollution in large river systems.

1. Introduction

The World Health Organization (WHO) and the Centers for Disease Control and Prevention (CDC) [1,2] have recognized antibiotic resistance as a critical global threat to human and environmental health. A major factor contributing to this threat is the presence of antibiotic resistance genes (ARGs), which are considered emerging environmental pollutants [3] and are closely linked to the propagation and evolution of antibiotic resistance. ARGs have been identified across diverse environmental settings. These include water bodies contaminated by untreated or insufficiently treated sewage and pharmaceutical waste [4], farmlands impacted by manure application or irrigation with runoff containing antimicrobial compounds [5], as well as airborne particles released from livestock facilities and wastewater treatment plants [6]. Collectively, these environments serve as important reservoirs that facilitate the dissemination of resistance determinants. In particular, environmental ARGs can be mobilized and transmitted to human pathogens through horizontal gene transfer (HGT), often mediated by mobile genetic elements (MGEs) [7]. In a similar manner, virulence factors (VFs) may also spread among bacterial populations via genetic vehicles such as plasmids and bacteriophages [8,9]. The co-transfer of these genetic elements can enhance bacterial adaptability and pathogenicity, thereby posing potential risks to public health [10].
The aquatic environment is recognized as one of the most important reservoirs for ARGs [11], especially for rivers [12]. Compared with sediment-associated ARGs, ARGs in the water column are more closely linked to actively circulating microbial communities and ongoing horizontal gene transfer processes. Comparative metagenomic analyses of ARG profiles between river surface water and sediments have demonstrated that surface water generally harbors higher diversity and abundance of ARG subtypes than sediment environments. These differences have been attributed to variations in microbial community composition and the distribution of mobile genetic elements, highlighting the importance of water-column samples for assessing the active dissemination potential of ARGs in aquatic ecosystems [13]. Similarly, previous investigations have revealed that ARGs in surface water exhibit greater abundance and diversity compared with those in sediments, suggesting that water-phase samples may provide a more direct representation of the current distribution patterns and transmission potential of ARGs in aquatic ecosystems [14]. Therefore, water samples were selected in this study to characterize the active aquatic resistome and evaluate the potential dissemination of ARGs. At present, ARGs have been detected in Yellow River, Yangtze River, Huaihe River, among others. In the current studies, commonly detected ARGs included sulfonamide resistance genes such as sul1 and sul2, tetracycline resistance genes including tetA, tetC, tetM, tetO, tetQ, and tetX, as well as genes conferring resistance to β-lactams, aminoglycosides, quinolones, macrolides, glycopeptides, and multiple antibiotics. In surface drinking-water sources, β-lactam, multidrug, bacitracin, and tetracycline resistance genes were especially prevalent, while livestock density, medical facilities, hydrogeological conditions, and specific bacterial hosts were identified as important determinants of resistome composition [15]. In estuarine waters, the widespread occurrence of sul and tet genes was strongly associated with seasonal changes, wastewater-treatment-plant effluents, urban runoff, water temperature, dissolved oxygen, and shifts in microbial communities [16]. Similar patterns were observed in the Yellow River, where warmer temperatures and increased precipitation were linked to higher ARG and mobile genetic element abundances, while tnpA1, IS26, and IS630 were identified as potential hubs facilitating horizontal gene transfer among bacterial hosts [17]. The persistence of ARGs from river water to treated tap water, together with the high proportion of ARGs shared between water samples and the human gut, further suggests that conventional treatment processes may reduce but not completely eliminate resistance determinants [18]. Although ARG contamination has been studied in other sections of the Yellow River, research on the Baotou section is currently lacking. Therefore, further investigation is necessary.
Previous studies have typically employed real-time quantitative PCR (qPCR) or high-throughput qPCR to profile ARGs. However, these methods are inherently constrained by the reliance on specific primer sets and predefined target genes, which limits their ability to detect novel or divergent ARGs, MGEs, and VFs [19]. Consequently, such approaches may underestimate the diversity and abundance of resistance determinants in environmental samples. In contrast, metagenomic sequencing offers a fundamentally different and more comprehensive strategy. By directly extracting total DNA from environmental samples, metagenomics enables the unbiased acquisition of genome sequence information from all microorganisms present, thereby allowing simultaneous and holistic characterization of ARGs, MGEs, and VFs [20]. This capability is particularly valuable because MGEs facilitate the horizontal transfer of ARGs, and VFs often co-occur with resistance genes, collectively influencing the spread and pathogenicity of antibiotic-resistant bacteria. Therefore, metagenomics has been increasingly applied to better understand the variation in ARG and MGE profiles across different environmental niches [21]. Numerous studies have demonstrated the advantages of metagenomic techniques in exploring the prevalence, diversity, and mobility of ARGs, MGEs, VFs, and the broader resistome from diverse habitats such as soil, water, wastewater, and the human gut [22,23,24,25]. Therefore, the use of metagenomic approaches facilitates a more systematic elucidation of the compositional characteristics and interactions among ARGs, MGEs, and VFs in environmental samples.
The Yellow River serves as the main water source for Baotou City, providing drinking and domestic water for local residents as well as water for agricultural irrigation. However, little is known about the contamination of water quality by antibiotics and ARGs in the Baotou section of the Yellow River. To fill this knowledge gap, our study employs metagenomic sequencing technology to quantify the spatial dynamics of ARGs, MGEs, and VFs in the monitoring points for surface water quality of the Yellow River; furthermore, we assess potential connections between ARGs and MGEs through network analysis. The results of this study will provide a scientific basis for managing and controlling antibiotic resistance pollution in large river systems.

2. Materials and Methods

2.1. Study Sites and Sampling

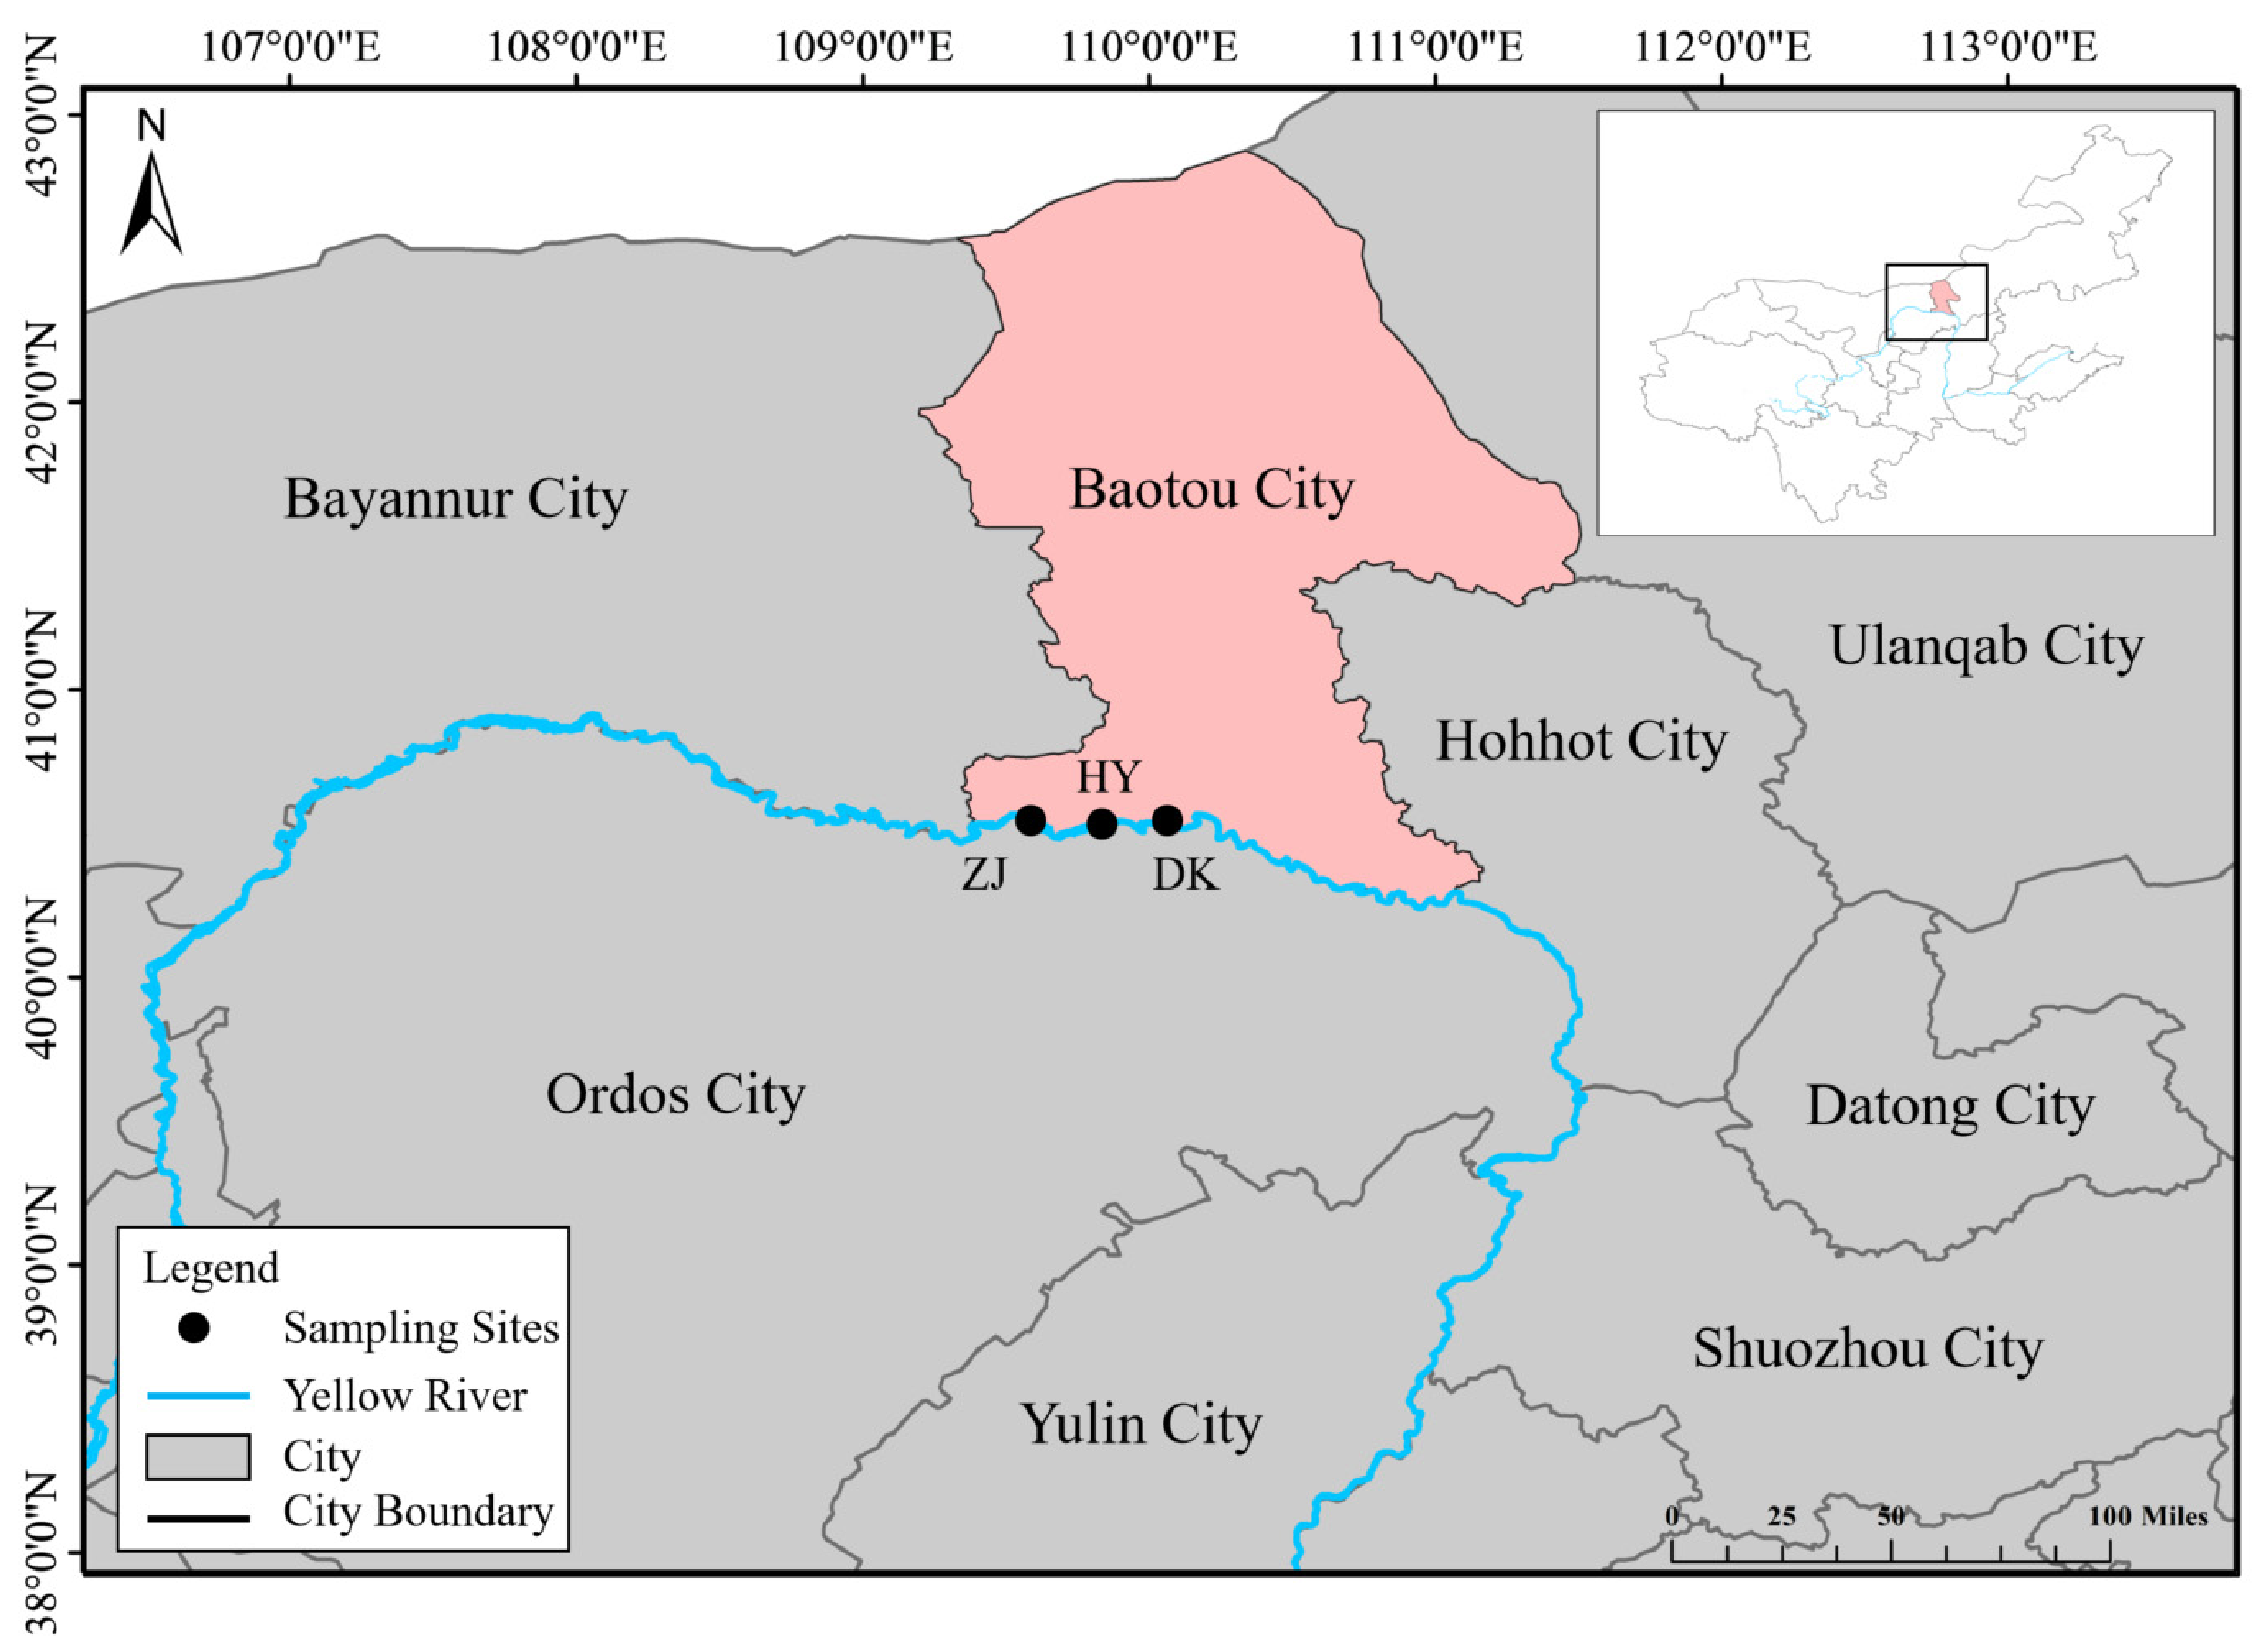
The Baotou region (N 40°37′, E 109°57′) is located in the upper reaches of the Yellow River and represents an important section where natural river processes interact with increasing anthropogenic influences. The Yellow River mainstream within Baotou serves as a major water resource for agricultural irrigation, industrial activities, and domestic use [26]. As shown in Figure 1, three sampling sites were selected along the mainstream of the Yellow River Baotou reach, including Zhaojunfen (ZJ), Huajiangyingzi (HY), and Dengkou (DK). These sites are key surface water environmental quality monitoring sections in the Baotou section of the Yellow River, and they represent the longitudinal environmental gradient along this river reach [27]. Specifically, ZJ is located at the upstream portion of the Baotou reach and represents the river conditions entering Baotou; HY is located in the central section of the Baotou reach and is an important drinking water source area influenced by urban activities; DK is located at the downstream portion where the river exits Baotou and integrates cumulative inputs from upstream and surrounding anthropogenic activities.
Water samples were collected in November 2024 at three sites along the Baotou section of the Yellow River. November corresponds to the normal-flow period in the Baotou section of the Yellow River, when hydrological conditions are relatively stable and less influenced by seasonal flooding events [28]. Previous studies have demonstrated that hydrological fluctuations and seasonal environmental factors strongly regulate microbial community composition and assembly processes in the Yellow River [29]. Furthermore, a comparative study of ARG distribution during flood and non-flood periods revealed that floodwaters carried significantly higher ARG abundance and diversity, substantially altering the overall load and diversity of ARGs in river systems [30]. Therefore, sampling during November can minimize the confounding effects of flood-induced disturbances and provides a suitable period for spatial comparisons of microbial communities among different sampling sites. In line with this spatial survey strategy, previous studies in the Yellow River and Fenhe River basins have also employed single-season sampling designs to characterize the spatial distribution patterns of ARGs and identify potential environmental drivers [31,32]. Surface water from a depth of 0–50 cm was collected as independent grab samples using sterile sampling bags (Labshark, Changde BKMAM Biotechnology Co., Ltd., Changde, Hunan, China). At each site, three independent 500 mL water samples were collected, resulting in a total of nine samples. The samples were not pooled, and each sample was individually used for subsequent metagenomic sequencing analysis. At the time of sampling, the water quality parameters were measured using a portable multi-parameter water quality analyzer. All samples were stored at 4 °C and immediately transported to the laboratory for processing.

2.2. Sample Processing and DNA Extraction

Water samples were filtered through a sterile 0.22 μm membrane (Jinteng, Tianjin Jinteng Experimental Equipment Co., Ltd., Tianjin, China) filter using a diaphragm vacuum pump (GM-1.0A, Tianjin Jinteng Experimental Equipment Co., Ltd., Tianjin, China). DNA was extracted from the membrane using the PowerWater DNA Isolation Kit (MOBIO Laboratories, Inc., Carlsbad, CA, USA). The concentration and purity of the extracted DNA were assessed by 1% agarose gel electrophoresis. DNA that met the quality criteria was stored at −80 °C until subsequent metagenomic sequencing analysis.

2.3. Metagenome Analysis

Metagenomic sequencing was conducted by Majorbio Bio-Pharm Technology Co., Ltd. (Shanghai, China). DNA extracted from nine surface water samples collected from three sampling sites along the Yellow River was sequenced on the Illumina NovaSeq 6000 platform using paired-end 150 bp reads (Illumina, Inc., San Diego, CA, USA). An average of 10 Gb clean data was obtained for each sample, with an average Q20 score above 98%. Raw reads were quality-filtered using fastp (v0.23.0) to remove adapters, low-quality sequences, and short reads. High-quality reads were assembled de novo using MEGAHIT (v1.1.2), and contigs shorter than 300 bp were discarded. The average assembly N50 was 529 bp, and the maximum contig length was 183 kb. Open reading frames (ORFs) were predicted using Prodigal (v2.6.3) in metagenomic mode. Redundant ORFs were clustered using CD-HIT (v4.6.1) with 90% sequence identity threshold and 90% alignment coverage threshold. Clean reads were mapped back to the gene catalog using SOAPaligner (v2.21), and gene abundance was normalized as transcripts per million (TPM). ARGs were identified using the CARD database (v3.2.9). MGEs were identified using the MGEs90 database implemented in the Majorbio Cloud platform, which is a nonredundant reference database clustered at 90% sequence identity. VFs were annotated against the Virulence Factor Database (VFDB, release 1 March 2024). Reads were mapped to the non-redundant gene set with an identity threshold of ≥0.95 for gene abundance calculation.

2.4. Statistical Analysis

Statistical analyses were performed using the Majorbio Cloud platform (https://www.majorbio.com, accessed on 15 May 2026) [33]. The relative abundance of ARGs, MGEs, and VFs was normalized by the total number of clean reads per sample. Alpha diversity was assessed using the Shannon index to evaluate the diversity of functional genes. Beta diversity was assessed using Bray–Curtis distances, and principal coordinate analysis (PCoA) was applied to visualize the dissimilarities in gene composition among samples. Hierarchical clustering was performed using the unweighted pair group method with arithmetic mean (UPGMA) and displayed as heatmaps. Co-occurrence network analysis between ARGs, MGEs, and VFs was conducted based on Spearman’s rank correlation coefficient (ρ > 0.5, adjusted p < 0.05), and the resulting networks were visualized using network plots. Circos plots were used to illustrate the distribution and relative abundance of each gene category across samples. Abundance bar plots were generated using OriginPro (v2024).

3. Results

3.1. Data Quality Control and Assembly Assessment

This study analyzed nine metagenomic surface water samples collected from the Yellow River with a total number of 690,604,954 sequence reads. After filtering the quality control of raw data with the Fastq criteria, we were able to obtain a dataset consisting of a total (682,704,546; 98.86%) high-quality sequence reads, including 10.34% in ZJ1, 10.49% in ZJ2, 10.38% in ZJ3, 11.03% in HY1, 11.06% in HY2, 11.95% in HY3, 11.31% in DK1, 12.03% in DK2, and 11.41% in DK3. The quality control comparison information of raw and filtered reads is presented in Table S1 with the total and average length in base pairs (bp) of each sample.

3.2. Abundance, Resistance Mechanisms, and Potential Hosts of ARGs

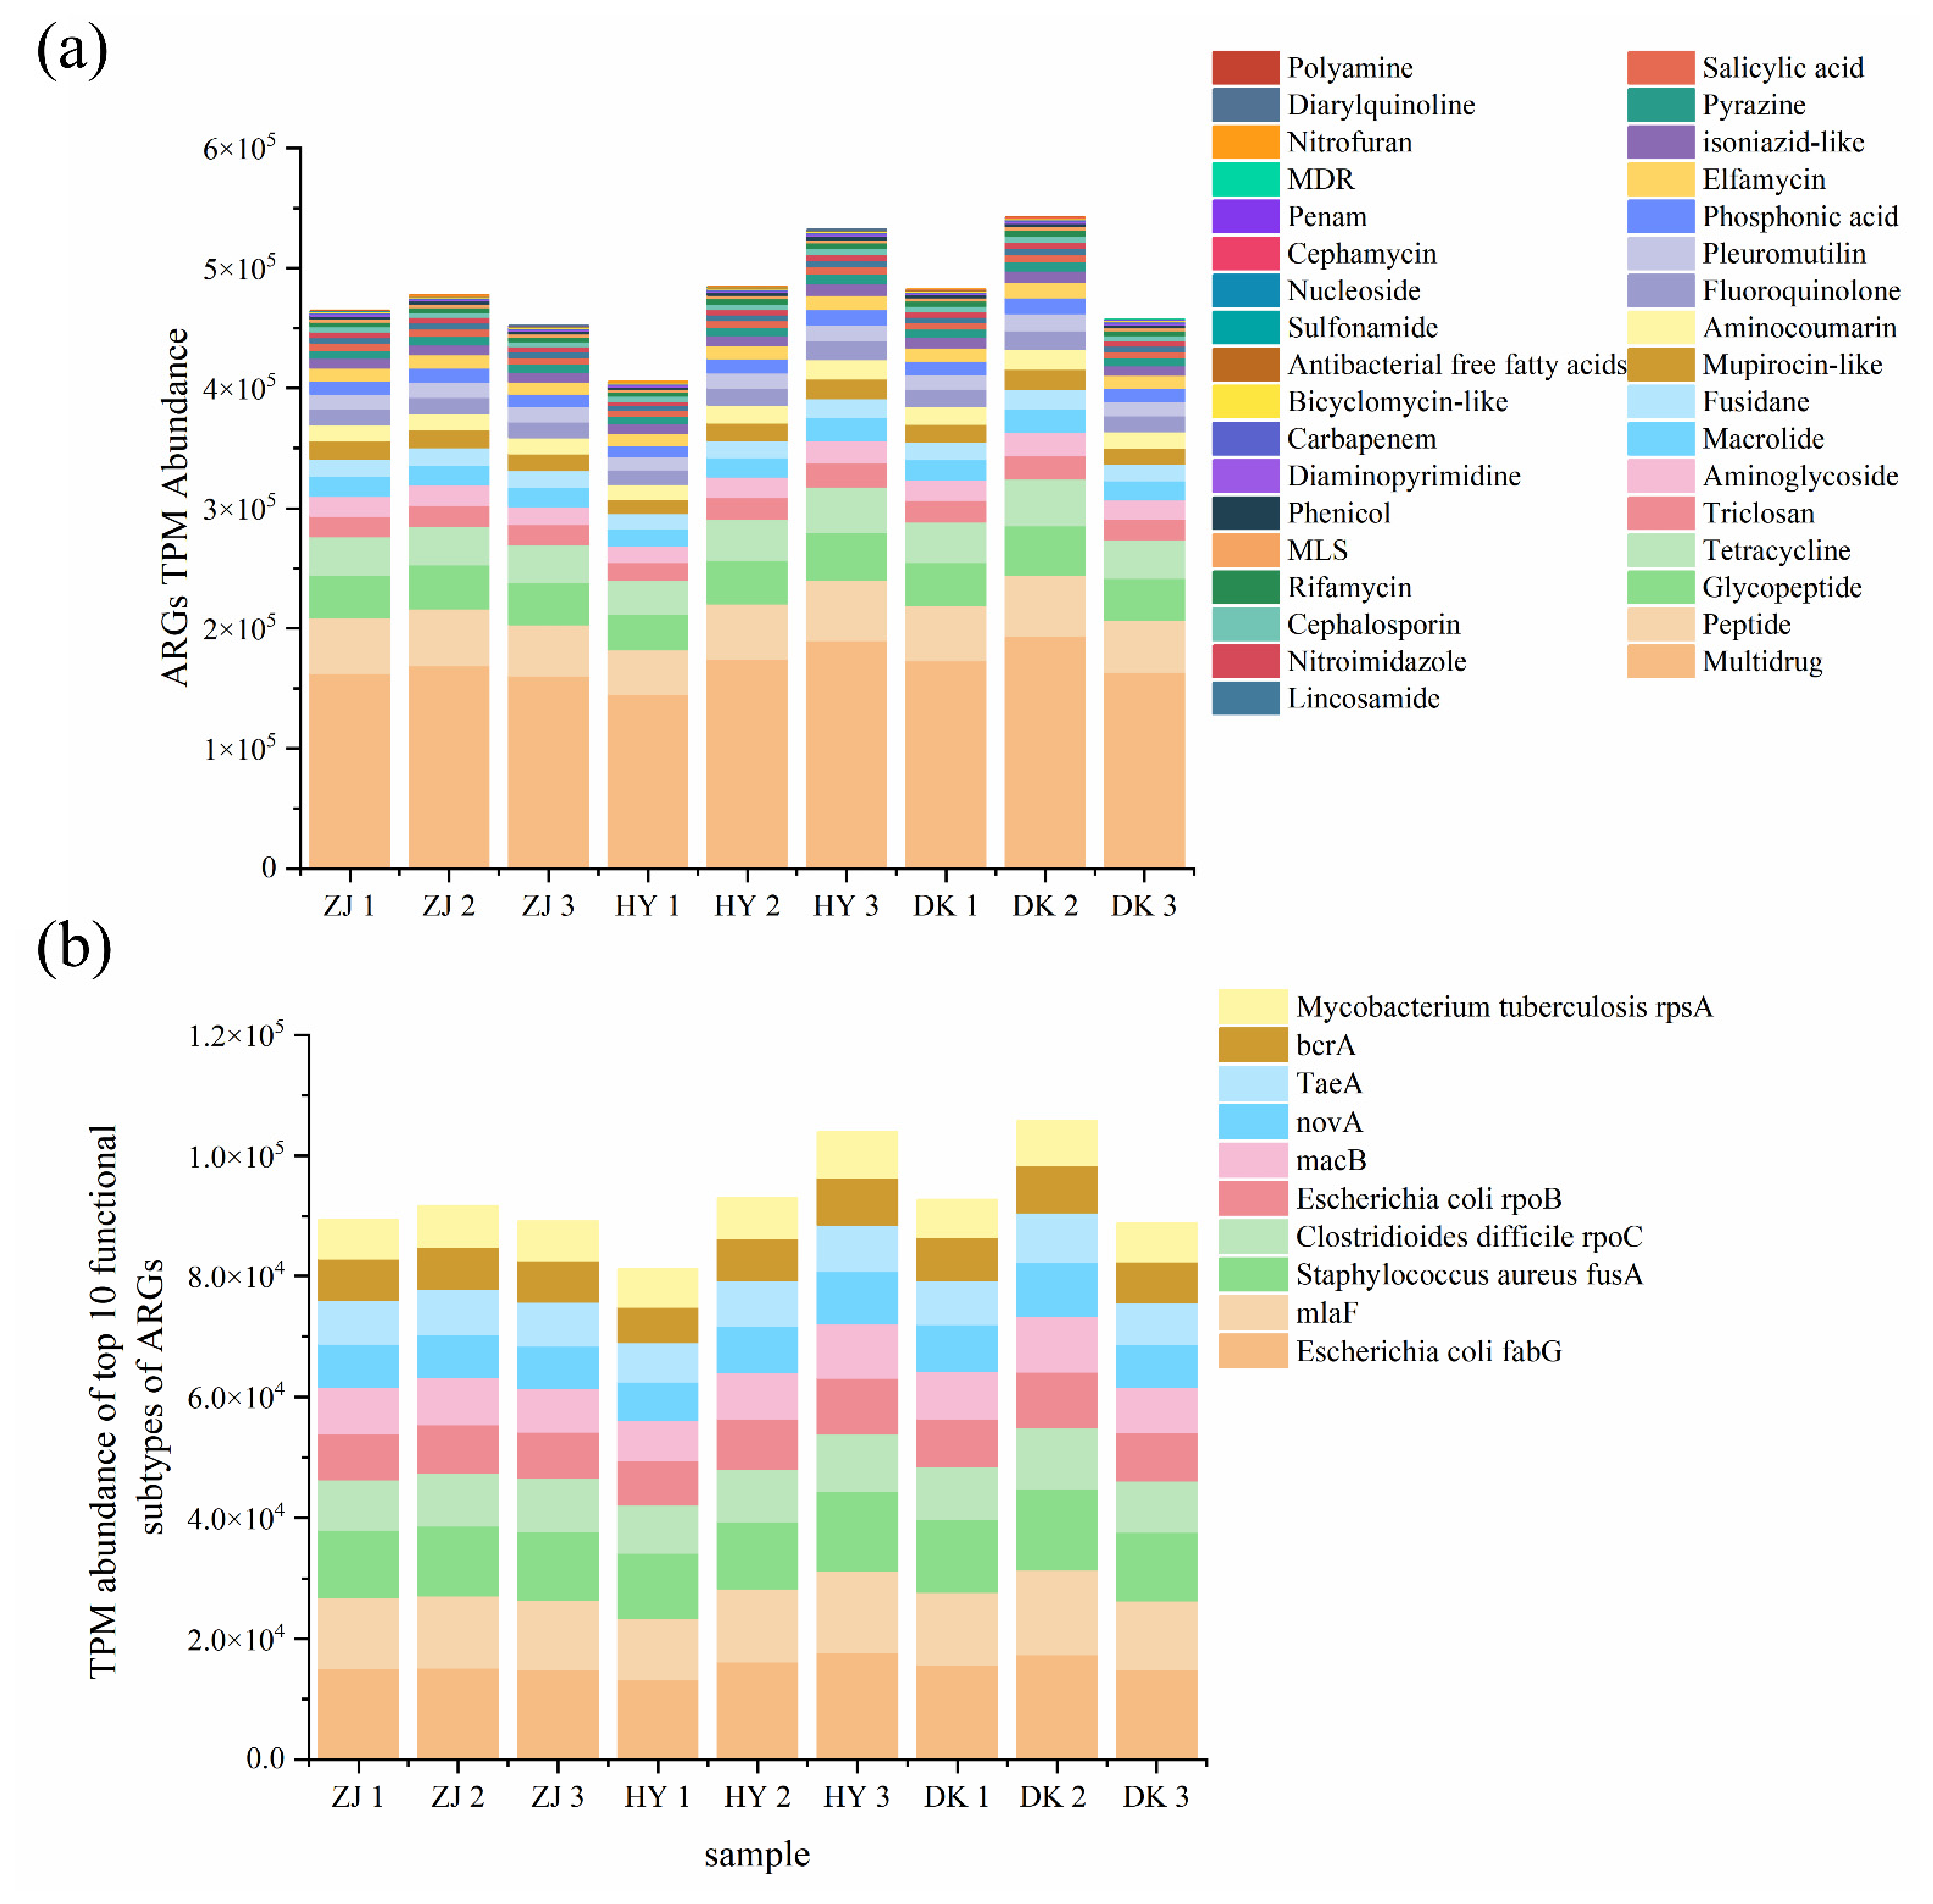
Metagenomics analysis revealed that a total of 1060 unique ARG annotations based on the Antibiotic Resistance Ontology (ARO) were identified across all sequenced samples. They were sorted into 35 ARG types. The ARG types of abundances in each sample are shown in Figure 2a. Per sample distribution, the average abundance of ARGs was calculated as follows: (4.65 × 10⁵ TPM; for ZJ1), (4.78 × 10⁵ TPM; for ZJ2), (4.52 × 10⁵ TPM; for ZJ3), (4.05 × 10⁵ TPM; for HY1), (4.85 × 10⁵ TPM; for HY2), (5.32 × 10⁵ TPM; for HY3), (4.83 × 10⁵ TPM; for DK1), (5.43 × 10⁵ TPM; for DK2), and (4.58 × 10⁵ TPM; for DK3), respectively. Multidrug, peptide, glycopeptide and tetracycline resistance genes dominated all samples, with the rest consisting of triclosan, aminoglycoside, macrolide, fusidane, mupirocin-like, aminocoumarin, fluoroquinolone, pleuromutilin and other categories. Among these, multidrug resistance genes exhibited the highest abundance in sample DK2, reaching 1.94 × 10⁵ TPM. As shown in Figure 2b, the top 10 ARG functional subtypes across all samples included Escherichia coli fabG, malF, Staphylococcus aureus fusA, Clostridioides difficile rpoC, Escherichia coli rpoB and other ARG functional subtypes. Notably, the abundance of Escherichia coli fabG was highest in sample HY3, with a value of 1.77 × 10⁵ TPM.
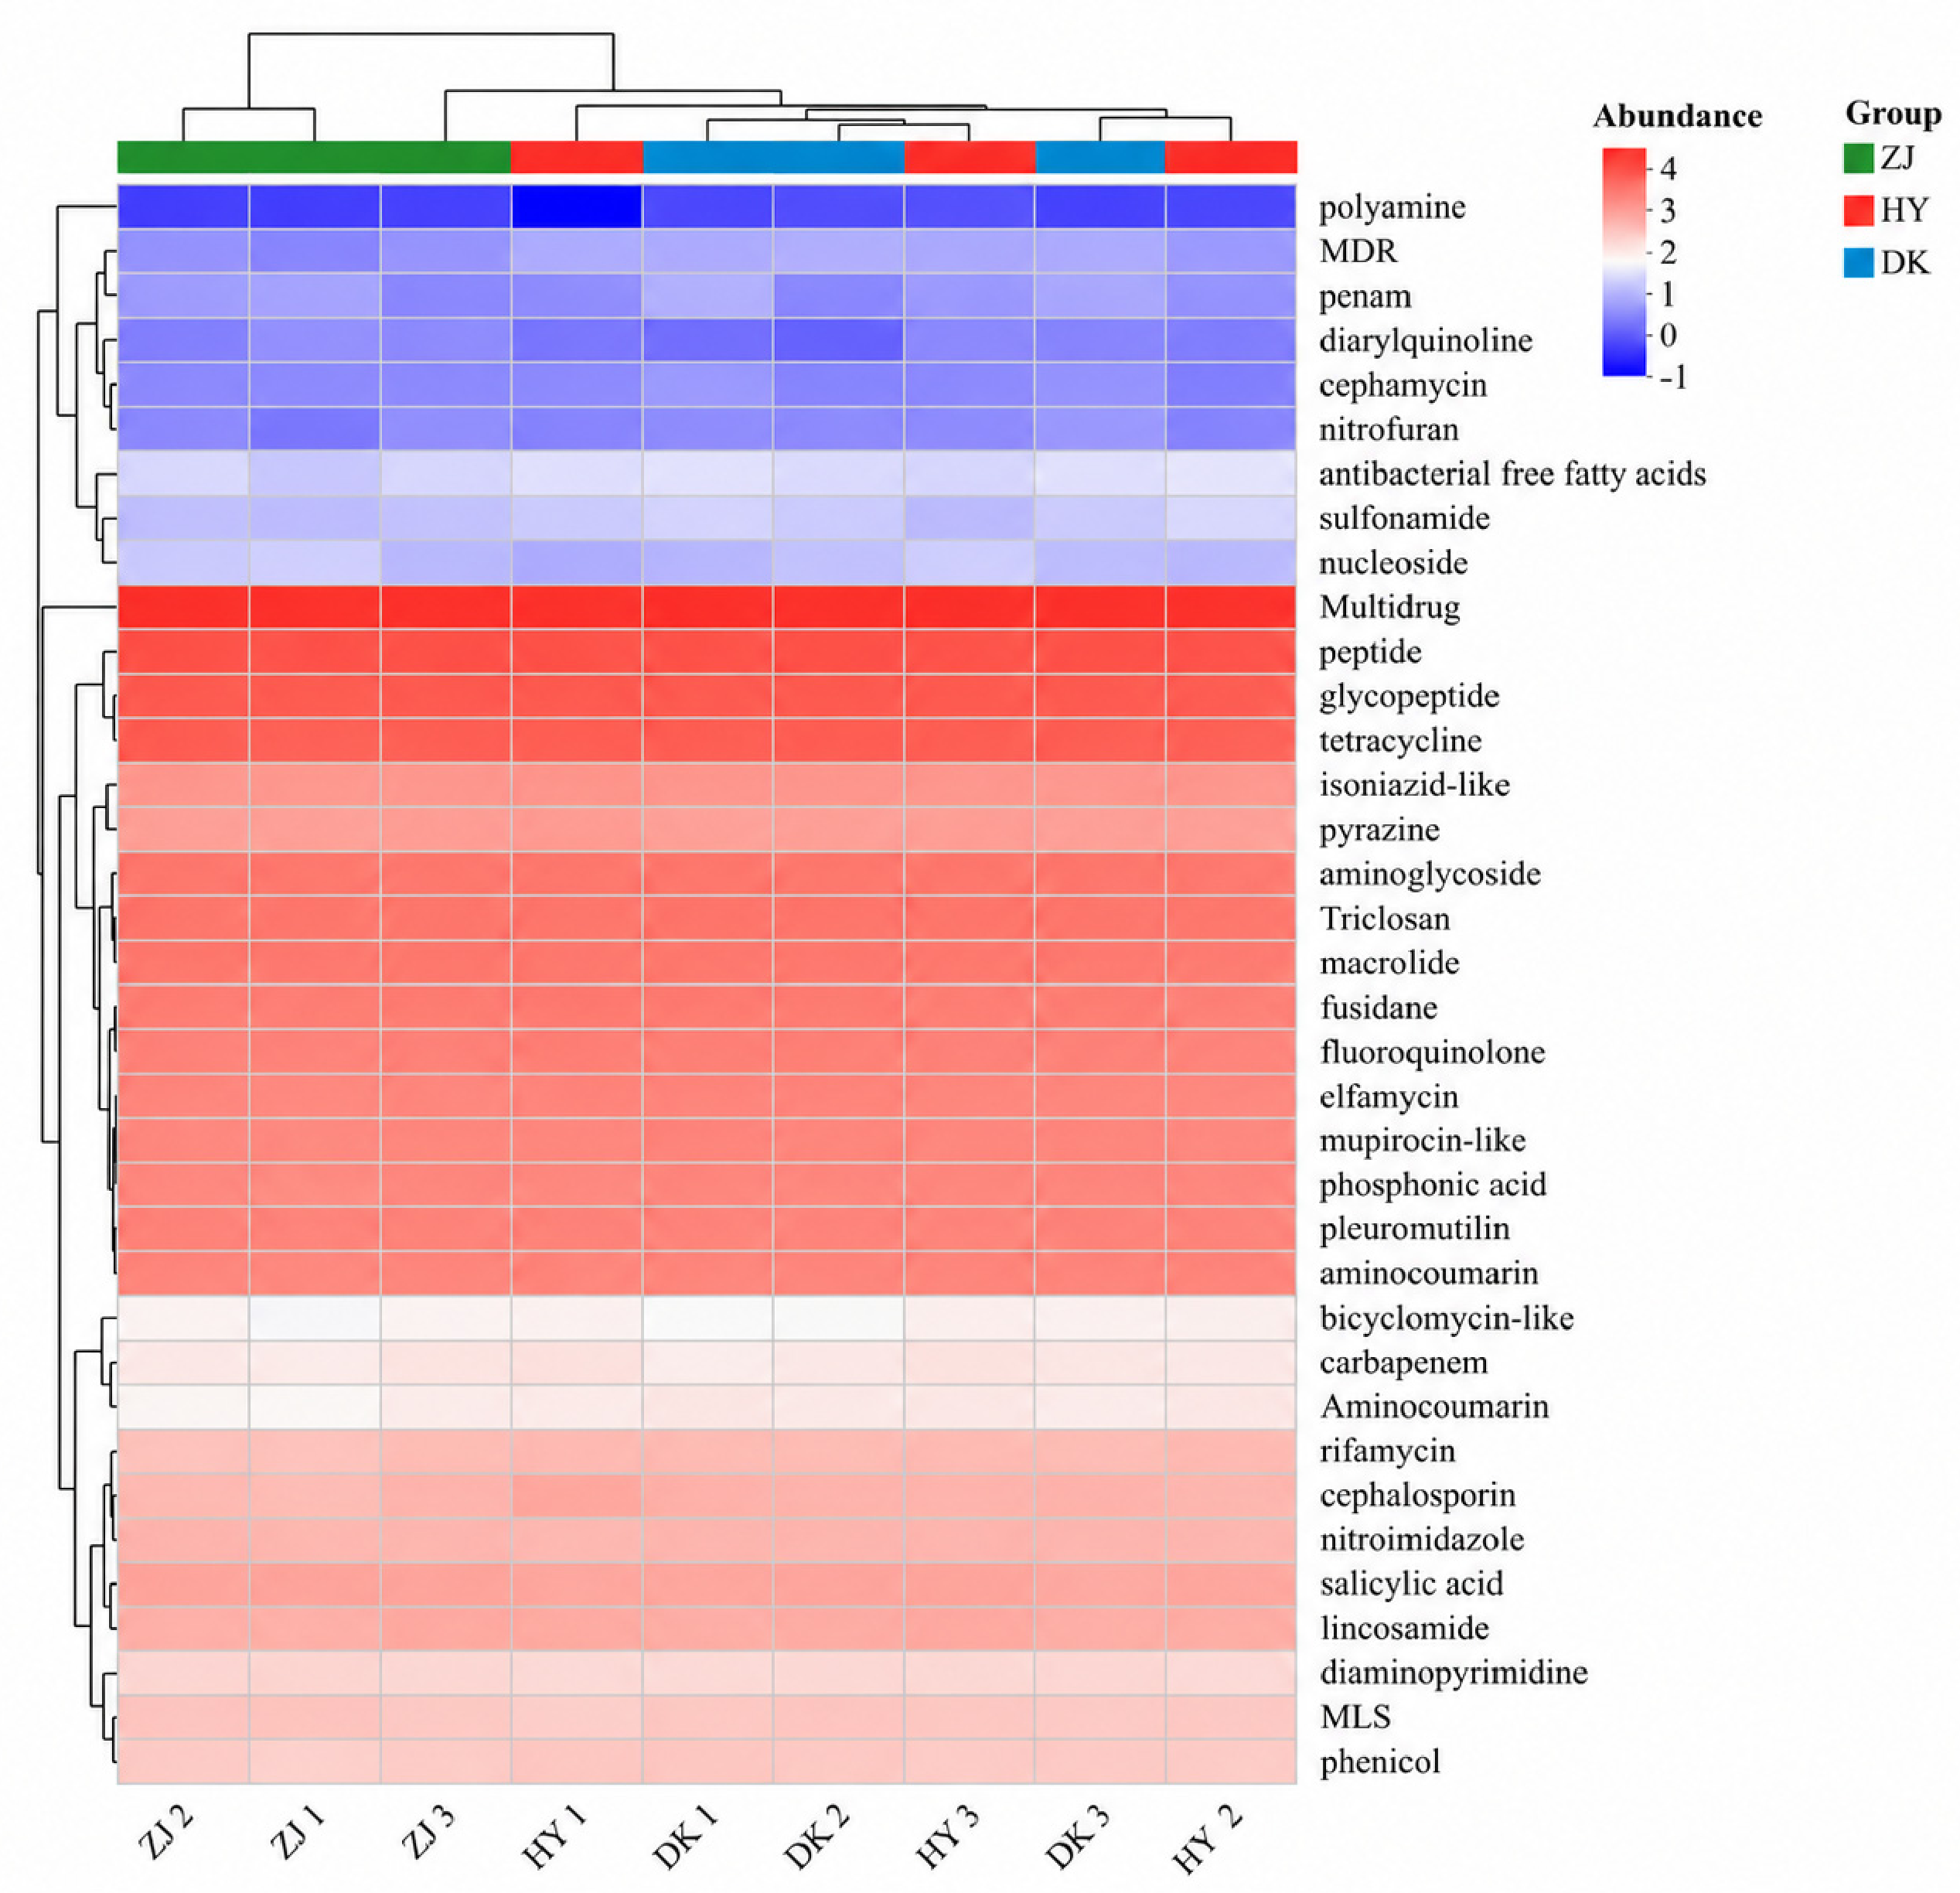
The abundance clustered heatmap of ARGs with each sample was presented in Figure 3, which revealed the distribution patterns of ARGs across all samples and groups (ZJ, HY, and DK). Hierarchical clustering analysis divided the ARGs into two main clusters, a high-abundance cluster and a low-abundance cluster. The high-abundance cluster included resistance genes for multidrug, peptide, glycopeptide, tetracycline, isoniazid, aminoglycoside, triclosan, and macrolide, which were dominant across all samples and showed relatively low variation among groups. The low-abundance cluster comprised genes such as polyamine, MDR, penam, diarylquinoline, cephamycin, nitrofuran, antimicrobial fatty acid, sulfonamide, and nucleoside. Notably, the abundance of these genes in the ZJ group was significantly lower than that in the HY and DK groups, resulting in marked inter-group differences. In this study, the Shannon diversity index was used to represent community α-diversity, and Figure S1a shows the α-diversity of ARGs at different sampling sites. The results indicated that there was no significant difference in ARGs α-diversity among the three sites (p = 0.3932). Figure S1b presents the β-diversity of ARGs obtained from PCoA. The samples from different sites showed partial separation along the PC1 axis, which explained 46.83% of the variance. Samples from the ZJ group were clearly distinguished from those of the HY and DK groups, while samples from the HY and DK groups partially overlapped. This suggests that the composition of resistance genes in ZJ differs from that in the other two sites (R = 0.457, p = 0.005).
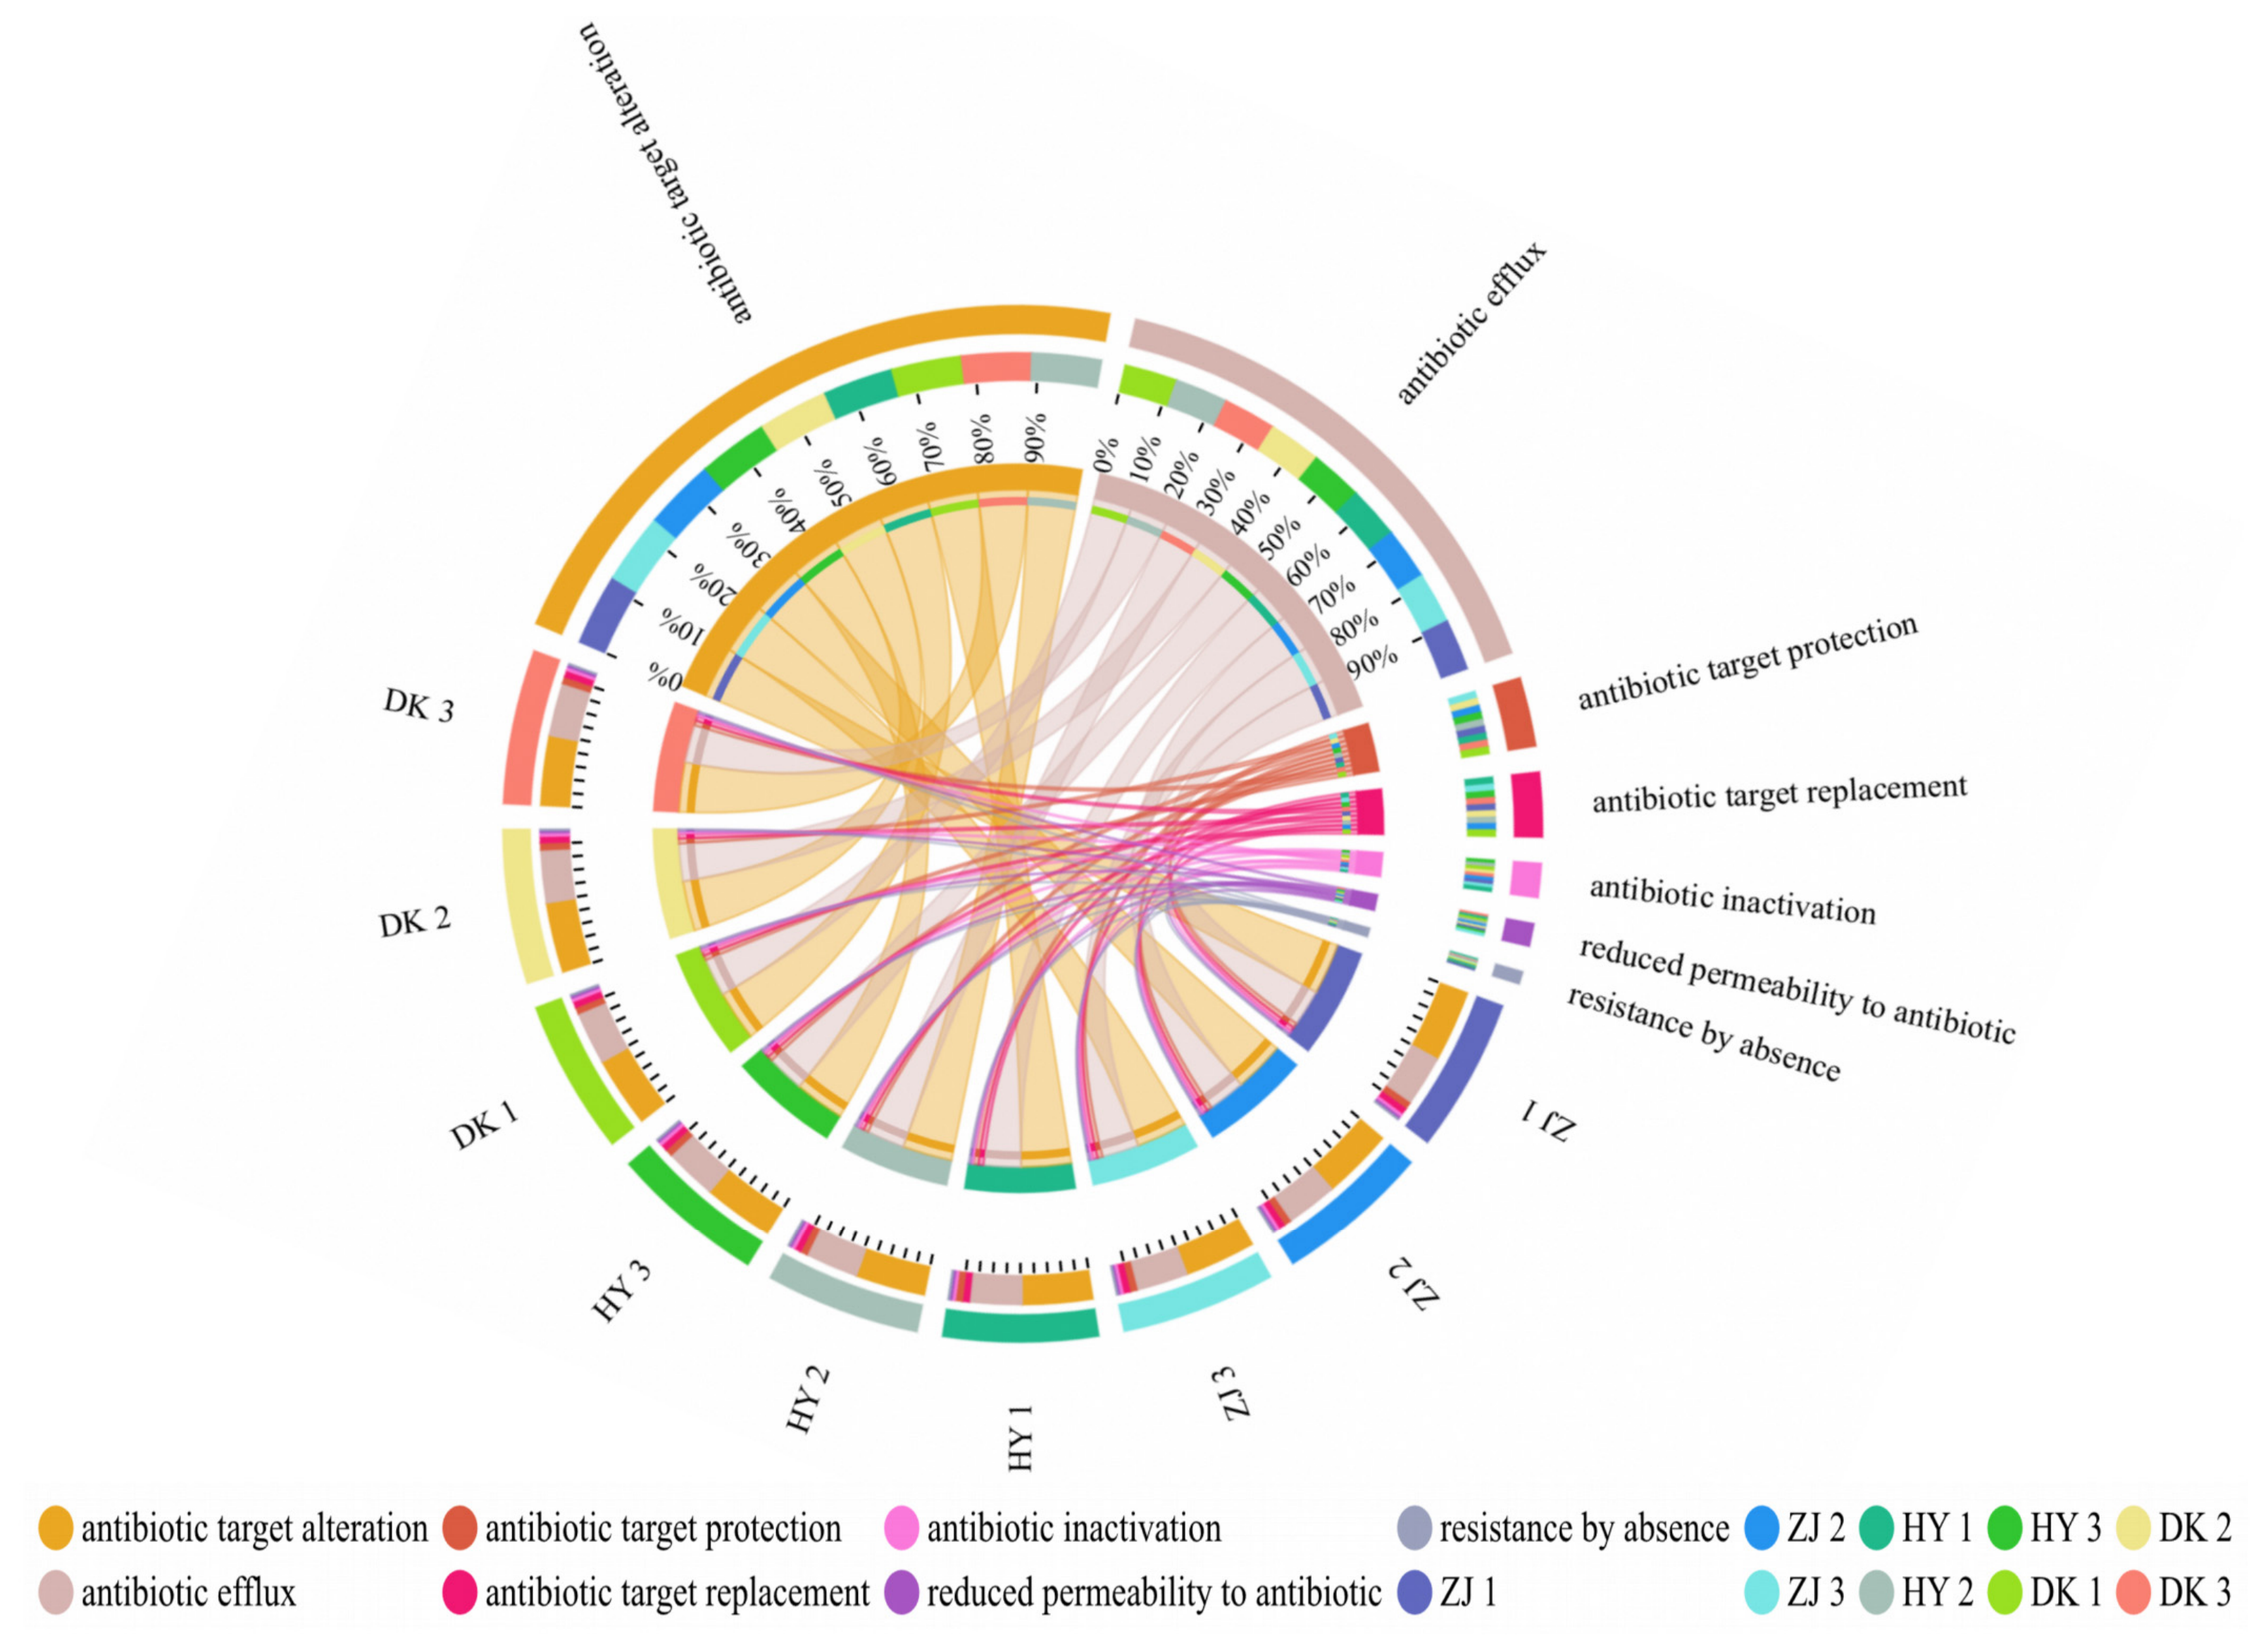
In addition to investigating the abundance of the ARG, we also examined the resistance mechanisms within the study area, categorizing them into seven major classes, as shown in Figure 4, namely, antibiotic target alteration, antibiotic efflux, antibiotic target protection, antibiotic target replacement, antibiotic inactivation, reduced permeability to antibiotic, and resistance by absence. From our results, an antibiotic target alteration (49%) was identified as the dominant resistance mechanism in all samples, followed by antibiotic efflux (36%) and antibiotic target protection (5%).
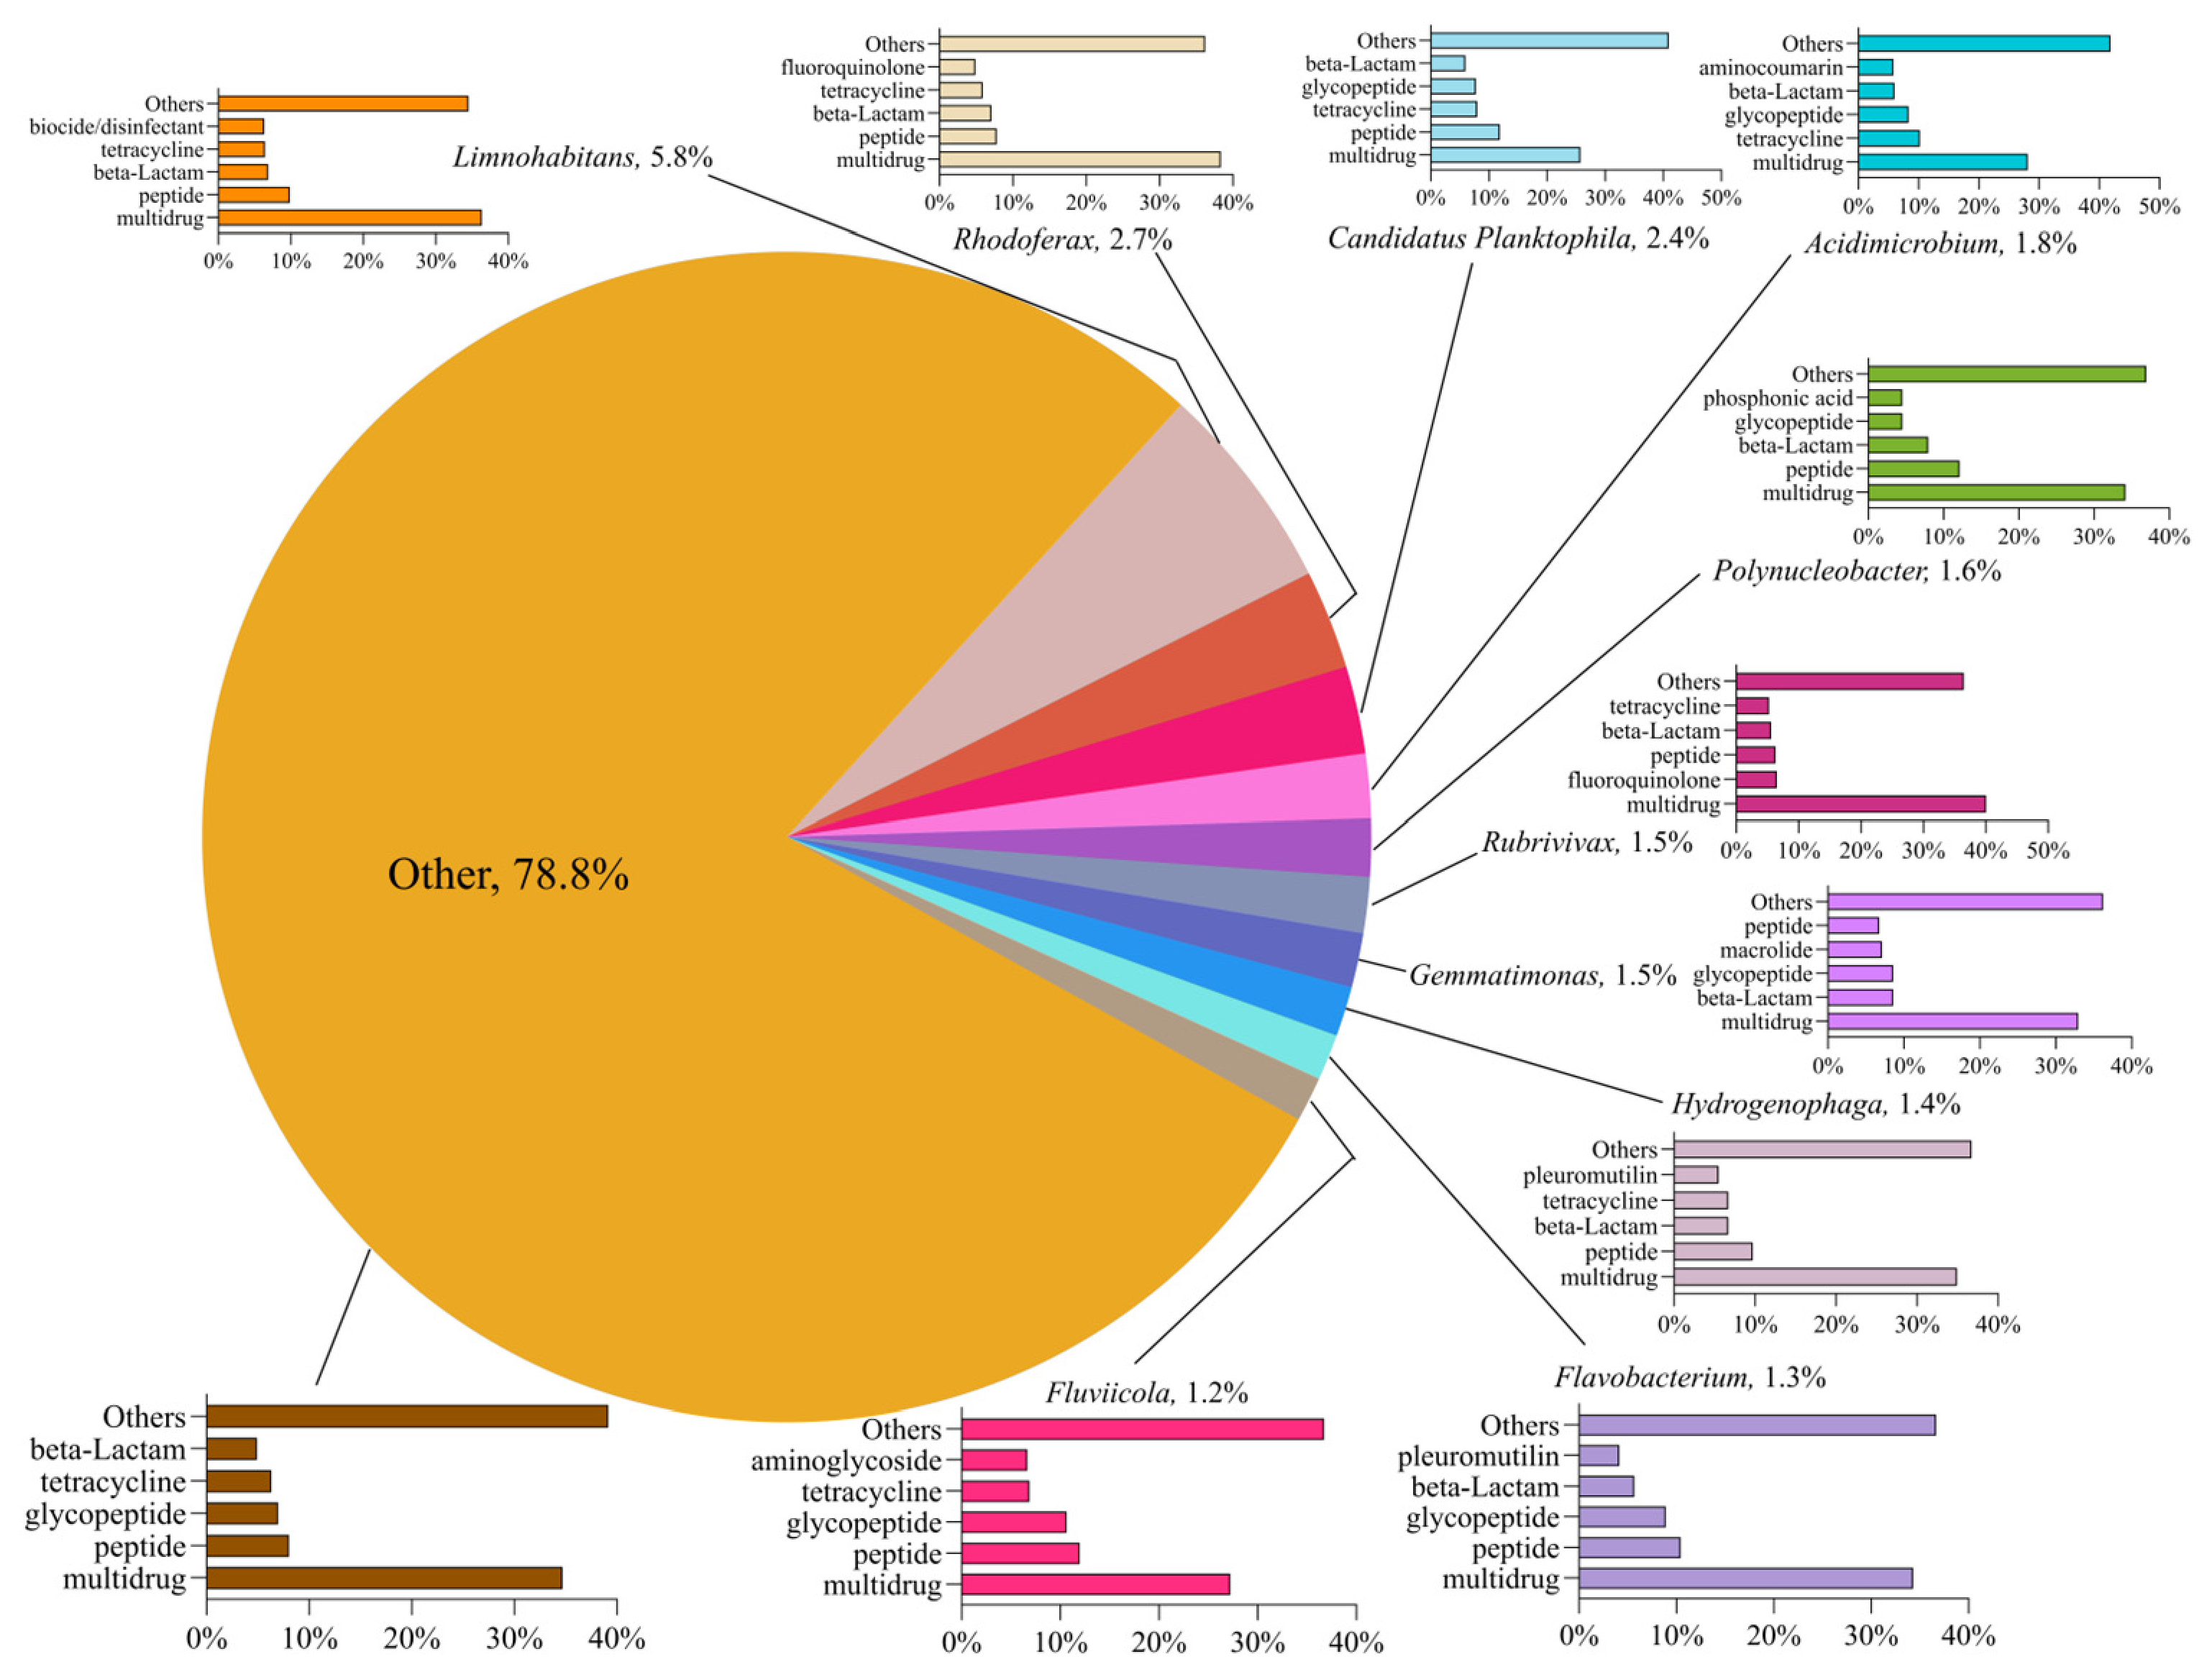
To identify the potential bacterial hosts of ARGs, taxonomic annotation of ARG-associated sequences was performed at the genus level (Figure 5). The top 10 genera with the highest relative abundances were selected for visualization, while the remaining genera were grouped as “Others”. Overall, the “Others” category accounted for 78.8% of the total ARG-associated bacterial community, indicating that ARGs were broadly distributed among numerous low-abundance bacterial genera. Among the identified dominant genera, Limnohabitans was the most abundant potential ARG host (5.8%), followed by Rhodoferax (2.7%), Candidatus Planktophila (2.4%), Acidimicrobium (1.8%), Polynucleobacter (1.6%), Rubrivivax (1.5%), Gemmatiomonas (1.5%), Hydrogenophaga (1.4%), Flavobacterium (1.3%), and Fluviicola (1.2%). Multidrug resistance genes were the predominant ARG category across most genera, whereas resistance genes conferring beta-lactam, tetracycline, peptide, glycopeptide, and fluoroquinolone resistance showed genus-specific distribution patterns.
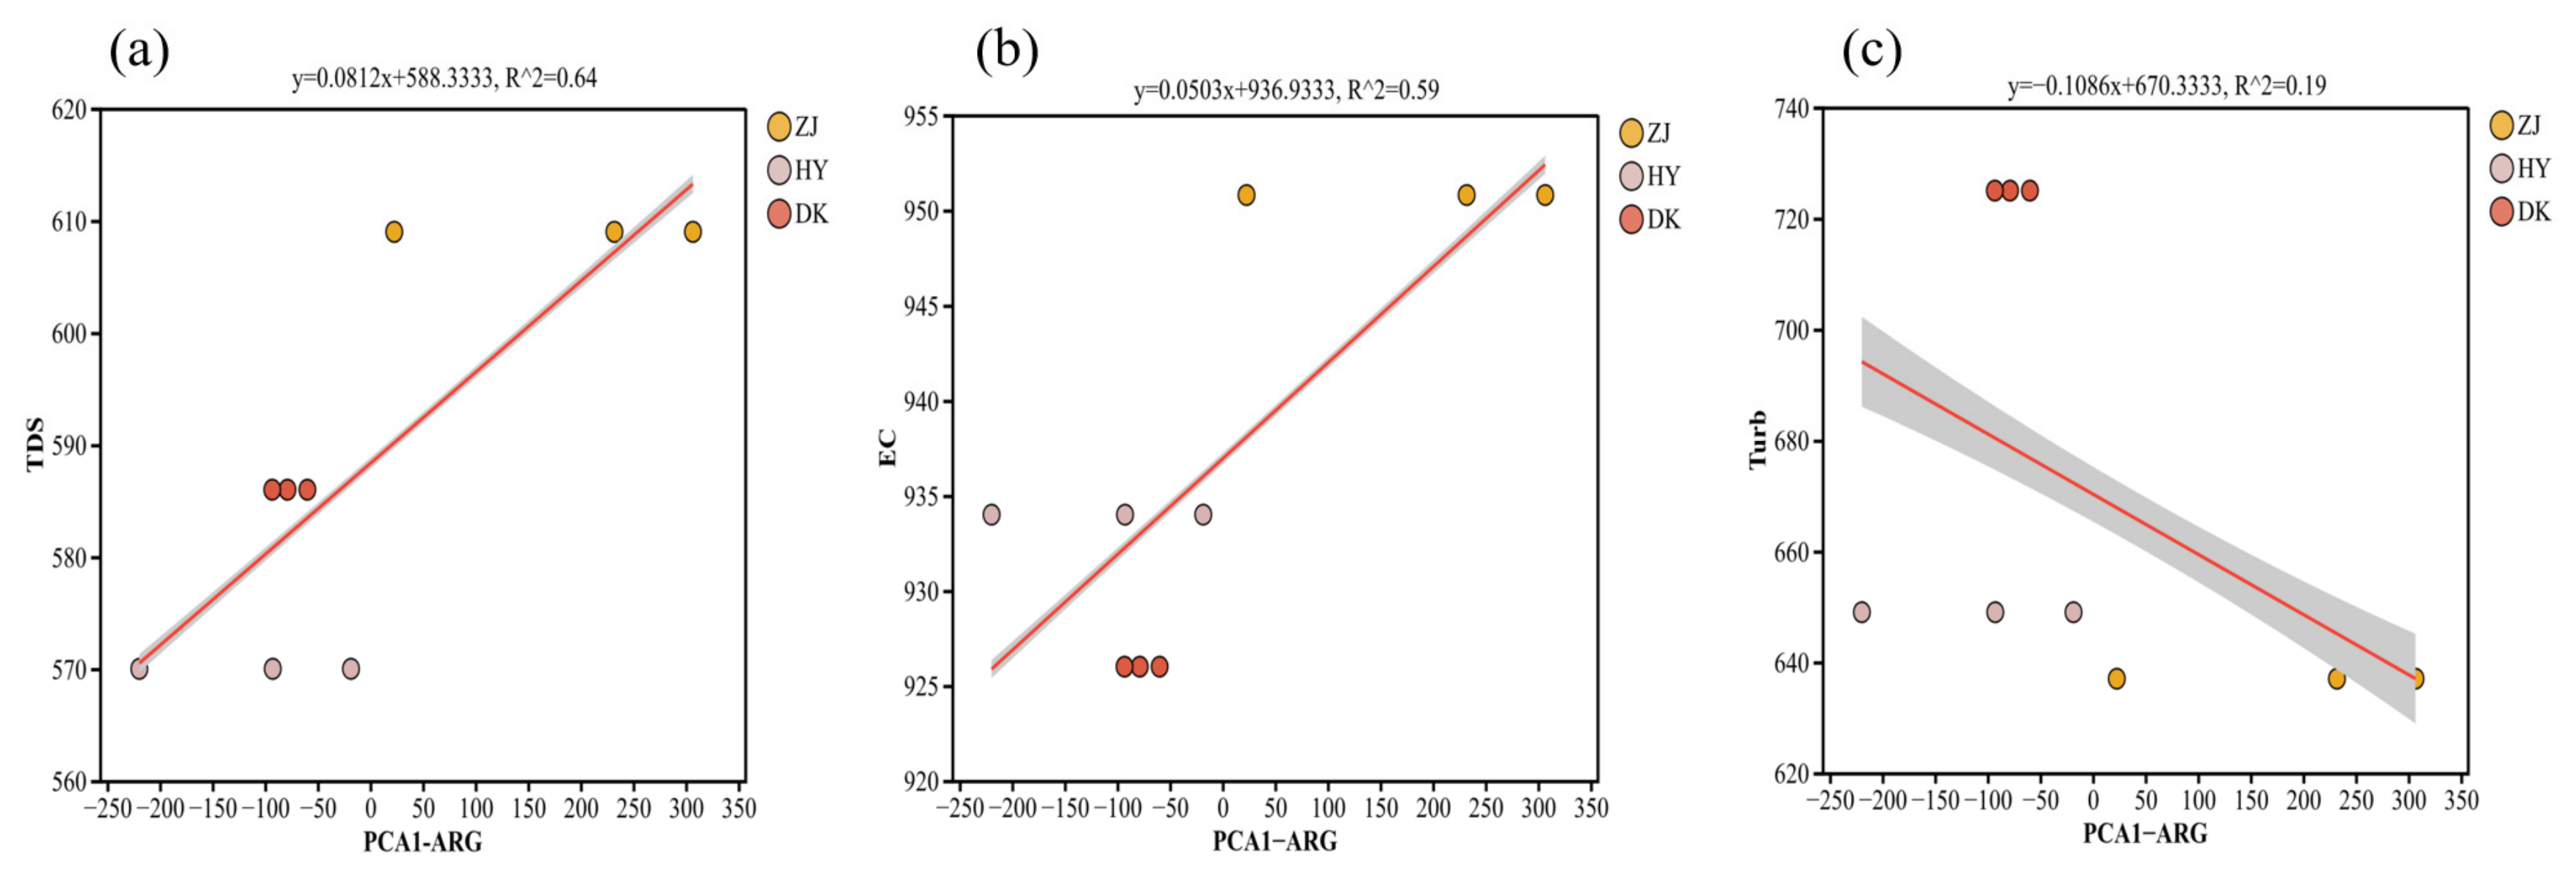
To investigate the potential influence of water quality parameters on ARG distribution, linear regression analyses were performed between environmental variables and ARG-associated PCA1 scores. Among the evaluated water quality parameters, as shown in Figure 6, total dissolved solids (TDS) and electrical conductivity (EC) exhibited significant positive correlations with ARG variation, whereas turbidity (Turb) showed only a weak and non-significant association.

3.3. Distribution Characteristics of MGEs

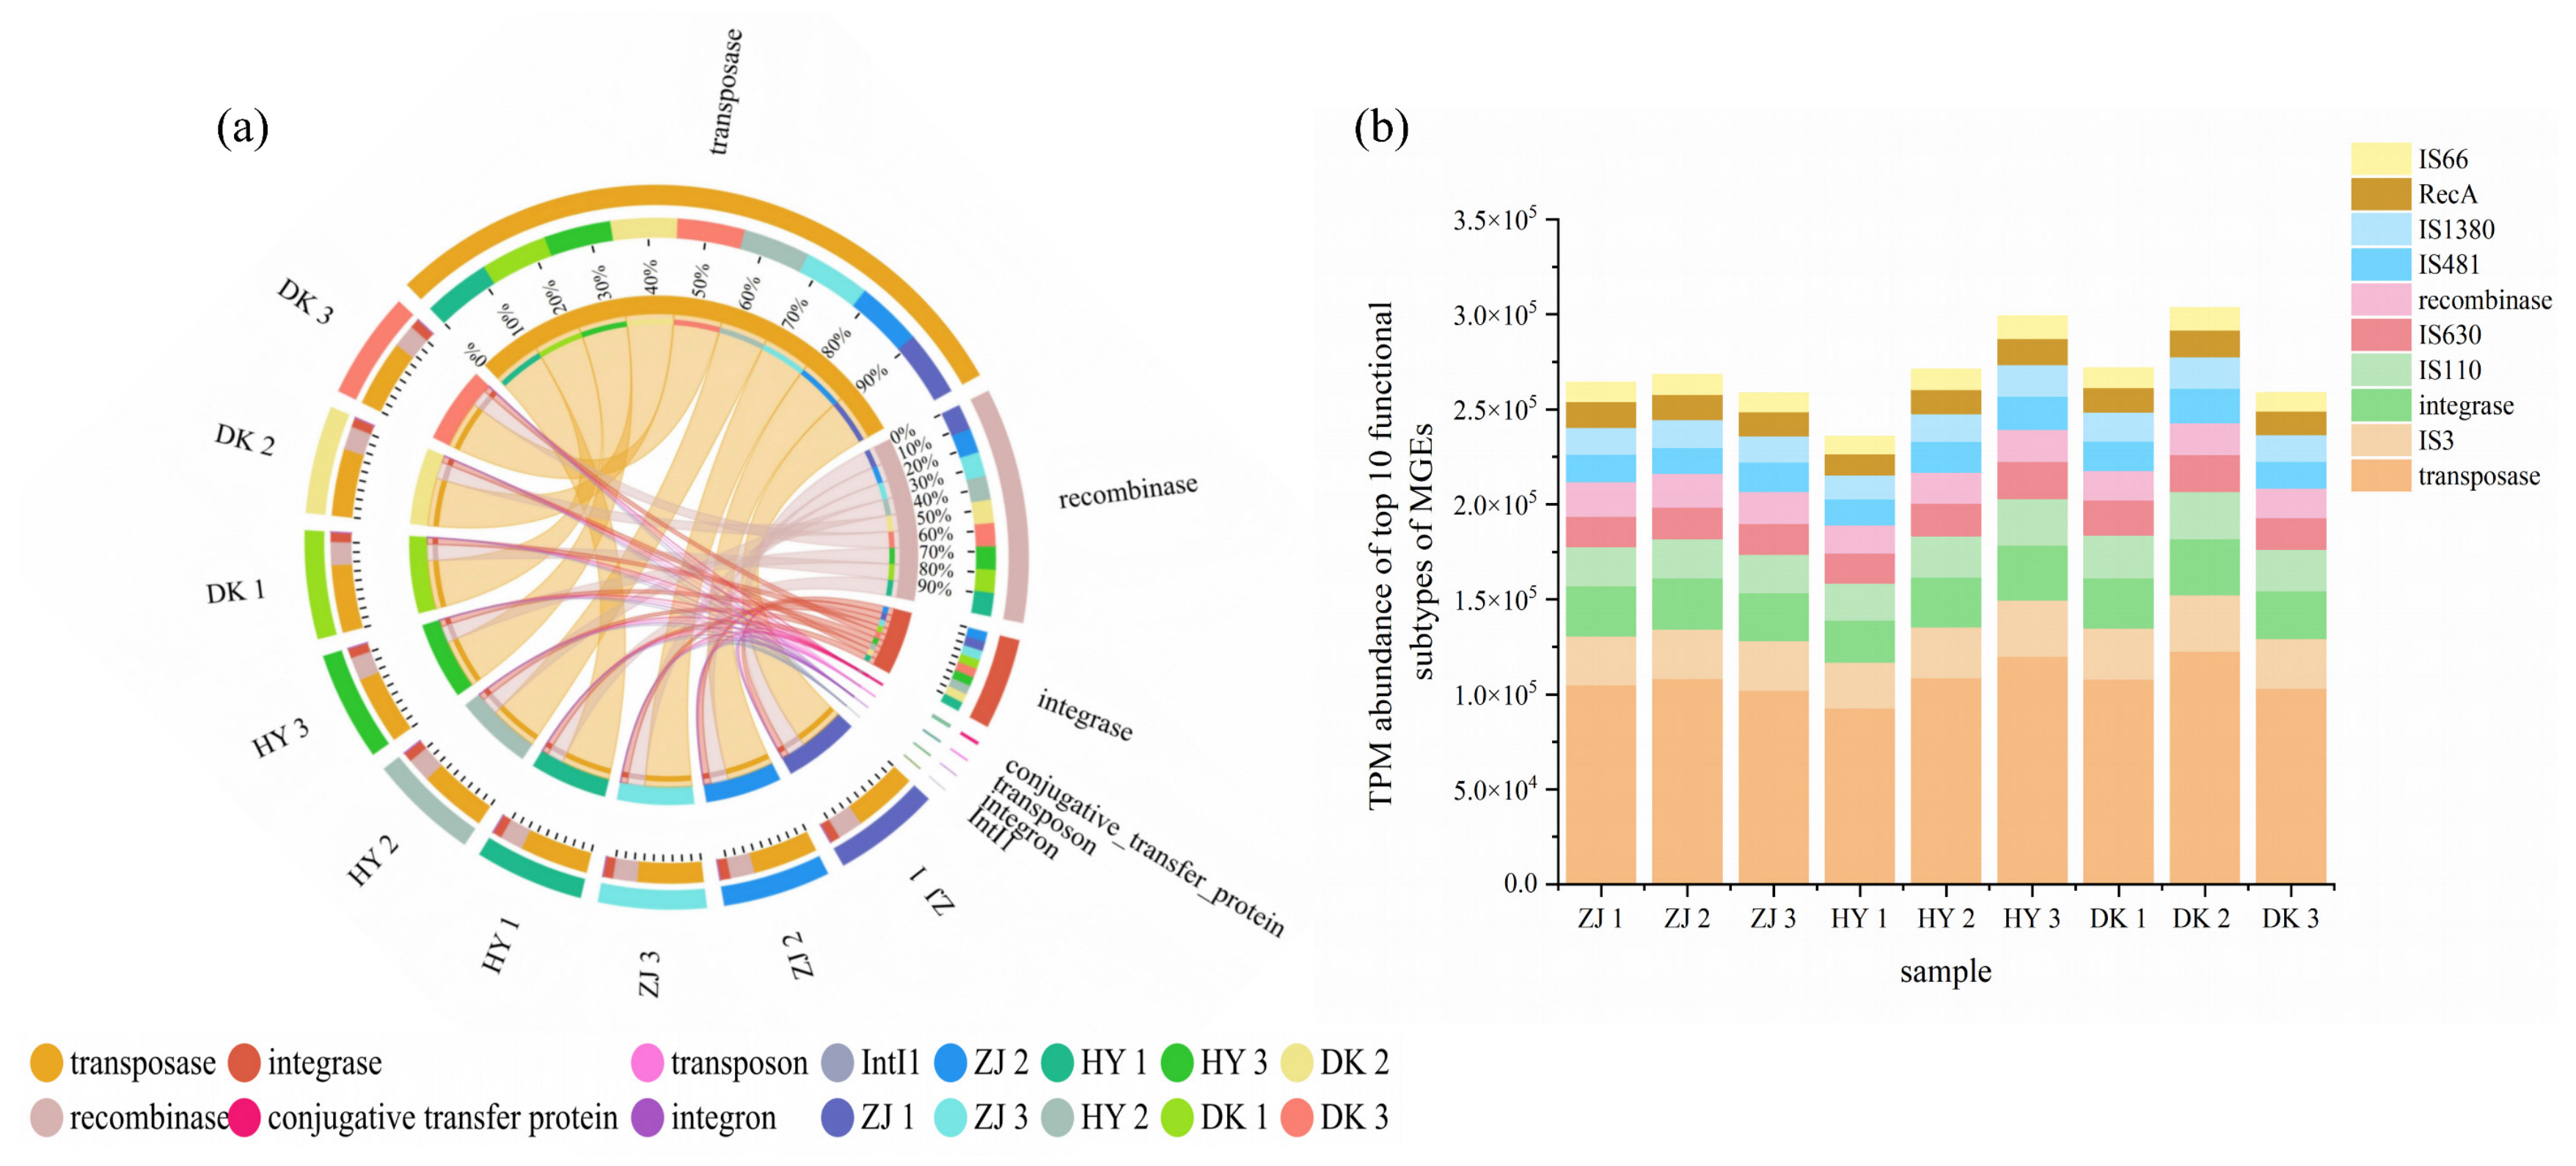
In this study, three major types of MGEs were identified across all samples. As shown in Figure 7a, transposases were the most dominant, accounting for 65.82% of the total MGEs and being widely distributed in all samples. At the site level, transposases accounted for 64.45%, 66.57%, and 66.42% of the total MGEs at the ZJ, HY, and DK sites, respectively. Within this category, IS3 (6.29%), IS110 (5.13%), and IS630 (4.09%) exhibited relatively high abundances. Their relative abundances also showed similar distribution patterns among the three sampling sites. Specifically, IS3 accounted for 6.25%, 6.46%, and 6.63% of the total MGEs at the ZJ, HY, and DK sites, respectively, followed by IS110 (4.94%, 5.17%, and 5.27%) and IS630 (3.96%, 4.17%, and 4.14%). The second most abundant category was recombinases, which comprised 25.23% of the total MGEs. At the site level, recombinases represented 26.32%, 24.69%, and 24.71% of the total MGE abundance at the ZJ, HY, and DK sites, respectively. Among the major recombinase-associated subtypes, RecA (3.04%), RmuC (2.37%), and RecG (2.30%) exhibited comparatively high relative abundances across all samples. Specifically, RecA accounted for 3.21%, 2.95%, and 2.97% of the total MGEs at the ZJ, HY, and DK sites, respectively, followed by RmuC at 2.41%, 2.33%, and 2.35%, and RecG at 2.31%, 2.28%, and 2.30%, respectively. Finally, integrases accounted for 8.57% of the total MGEs. At the site level, integrases accounted for 8.85%, 8.37%, and 8.50% of the total MGEs at the ZJ, HY, and DK sites, respectively. Within this category, phage integrase was the most abundant subtype, although its proportion was low at 0.11%. Its abundance also showed a similar distribution pattern among the three sampling sites. Specifically, phage integrase accounted for 0.12%, 0.09%, and 0.10% of the total MGEs at the ZJ, HY, and DK sites, respectively. As shown in Figure 7b, the top 10 functional subtypes of MGEs across all samples included transposase, IS3, integrase, IS110, IS630, and other MGEs functional subtypes. Notably, transposase exhibited the highest abundance among all subtypes, with the mean clean reads exceeding 1.23 × 10⁵ TPM in the DK2 sample. The α-diversity results of MGEs showed no significant difference among the three sampling sites (p = 0.3012, Figure S2a). PCoA based on Bray–Curtis distances of MGEs revealed that the differences among the three sites were not statistically significant (R = 0.358, p = 0.059). PC1 and PC2 explained 70.41% and 8.39% of the total variation, respectively. Along the PC1 axis, the ZJ site was clearly separated from the HY and DK sites, whereas the HY and DK sites partially overlapped (Figure S2b).

3.4. Distribution Characteristics of VFs

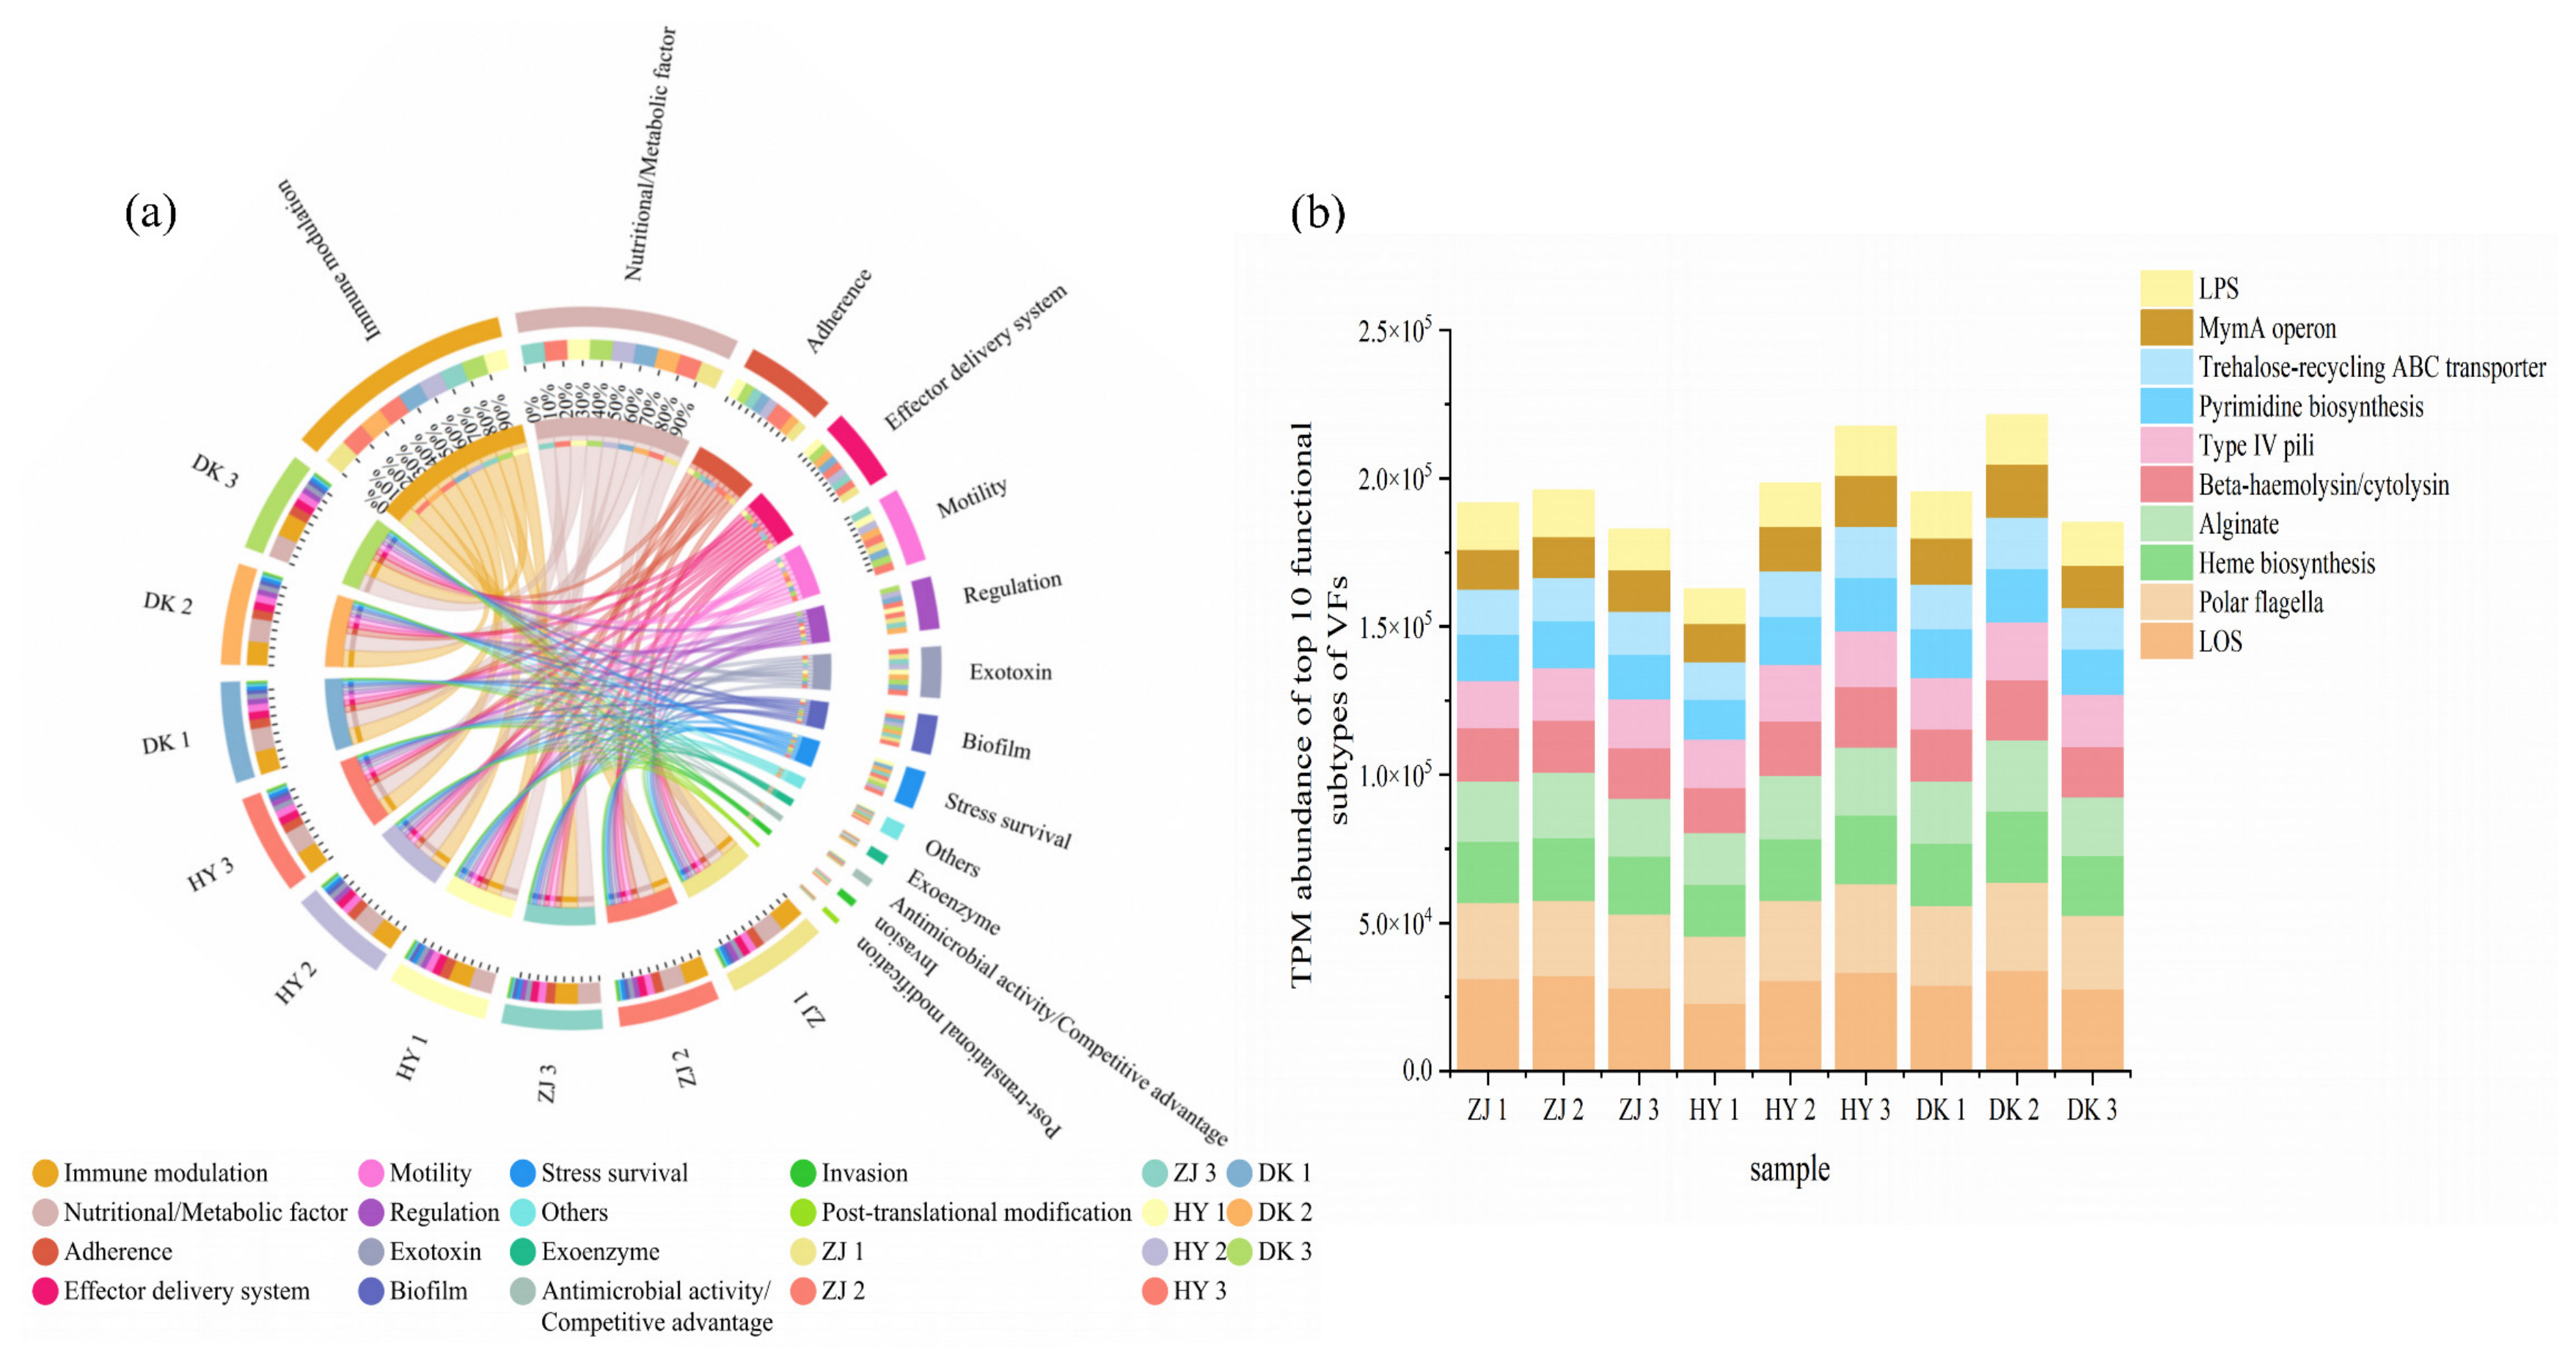
A total of 915 VF genes were identified across all samples based on the VFDB database. As shown in Figure 8a, these genes were classified into multiple functional categories, with distinct differences in their relative abundances. Among all categories, nutritional/metabolic factors-related virulence factors exhibited the highest relative abundance (25.29%), followed by immune modulation (24.53%), adherence (9.86%), effector delivery systems (7.78%), and motility (7.56%). Similar distribution patterns were observed across the three sampling sites. Specifically, nutritional/metabolic factors-related virulence factors accounted for 25.21%, 25.37%, and 25.28% of the total VF abundance at the ZJ, HY, and DK sites, respectively. The proportions of immune modulation-related virulence factors were 24.85%, 24.05%, and 24.59%, while adherence-related virulence factors accounted for 9.82%, 9.99%, and 9.83% at the ZJ, HY, and DK sites, respectively. Likewise, effector delivery systems represented 7.57%, 7.89%, and 7.90%, and motility-related virulence factors accounted for 7.55%, 7.65%, and 7.49% of the total VF abundance at the three sampling sites, respectively. As shown in Figure 8b, the top 10 functional subtypes of VFs across all samples included lipooligosaccharide (LOS), polar flagella, heme biosynthesis, alginate, beta-haemolysin/cytolysin, and other VFs functional subtypes. Notably, the abundance of LOS was the highest among all subtypes, with the mean clean reads exceeding 3.39 × 10⁴ TPM in the ZJ2 sample. The α-diversity results of VFs showed no significant difference among the three sampling sites (p = 0.1931, Figure S3a). PCoA based on Bray–Curtis distances of VFs revealed significant differences among the three sampling sites (R = 0.374, p = 0.044). PC1 and PC2 explained 57.84% and 17.02% of the total variation, respectively. Along the PC1 axis, the ZJ site was clearly separated from the HY and DK sites, whereas the HY and DK sites partially overlapped (Figure S3b).

3.5. Co-Occurrence Analysis

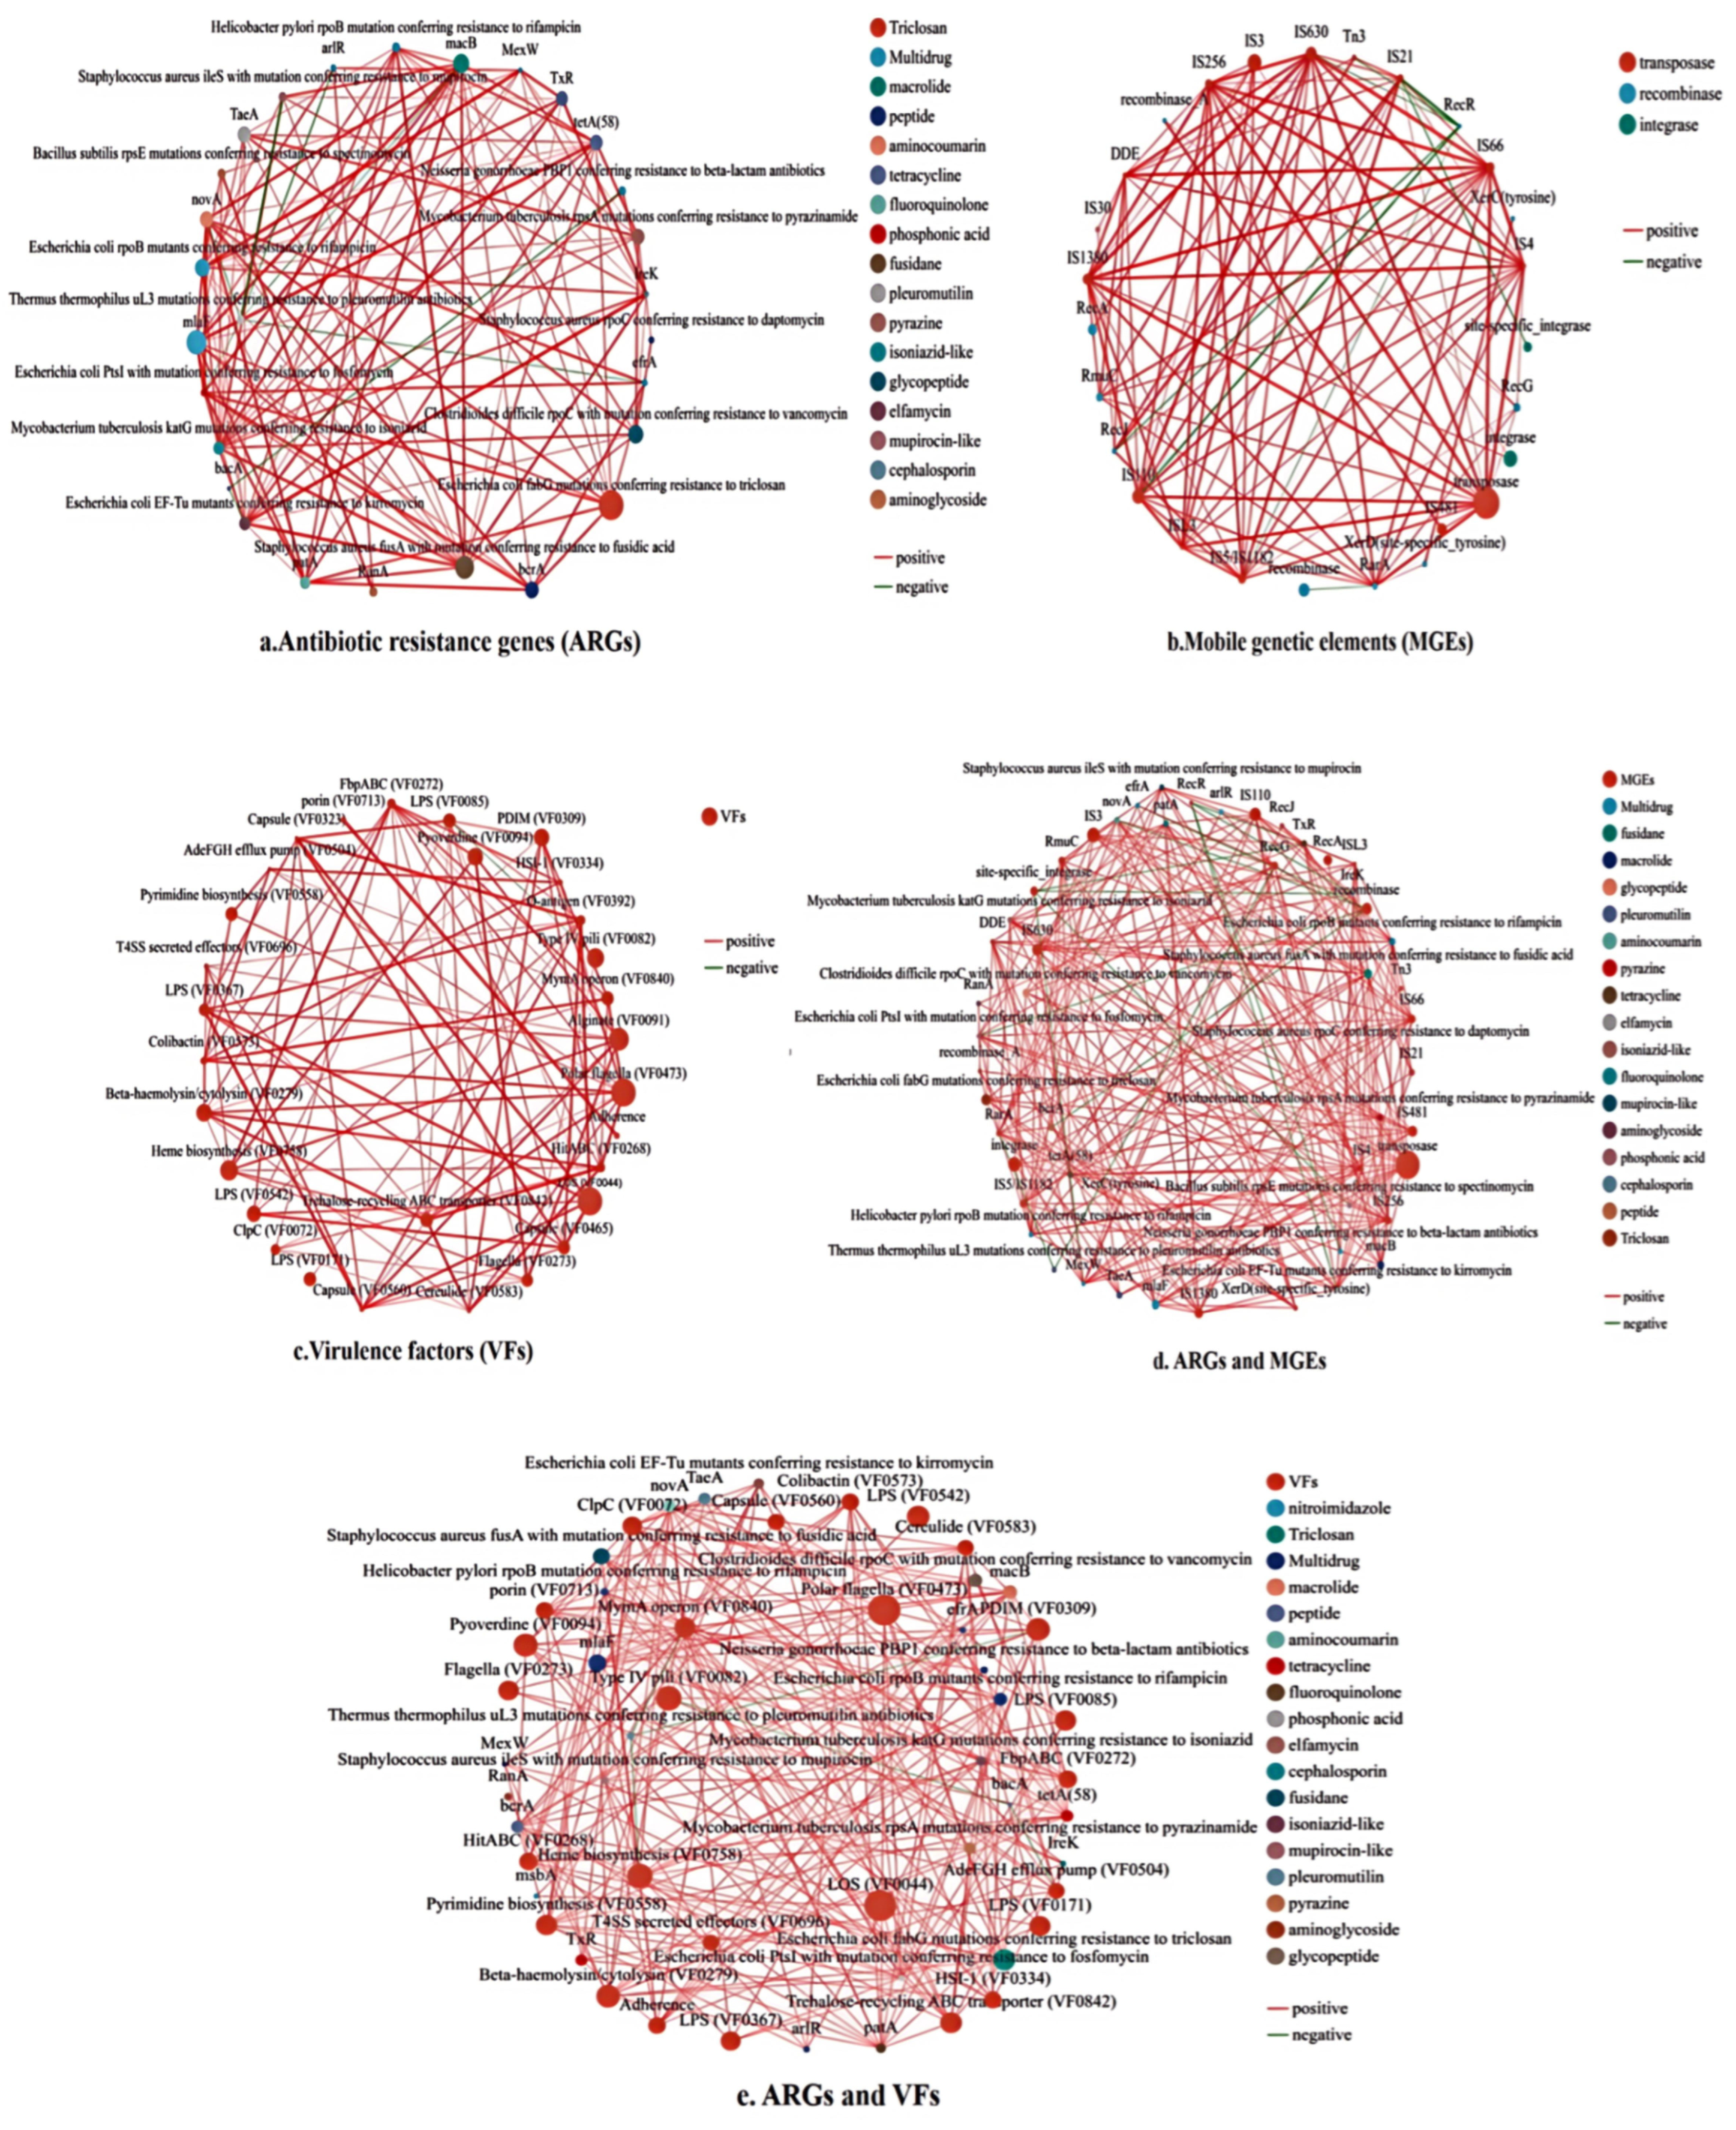
To reveal the co-occurrence patterns of ARGs, a network was constructed based on strong and significant correlations between ARG subtypes (Figure 9a). Table S2 presents the topological characteristics of the ARGs network. The ARG co-occurrence network consisted of 28 nodes (belonging to 17 ARG types) and 121 edges. The ARGs from the same type or different types presented a clear significant correlation. The Escherichia coli fabG gene (conferring resistance to triclosan) was identified as one of the largest and most central nodes, displaying widespread positive correlations with ARGs of multiple classes, including multidrug, peptide, tetracycline, and macrolide resistance genes, such as mlaF, bcrA, tetA (58), and macB. In addition, several multidrug resistance genes, including mlaF and Escherichia coli rpoB, formed large hubs in the network and were positively correlated with ARGs from various classes. In contrast, only a small number of negative correlations were observed. For example, the Thermus thermophilus uL3 gene showed negative correlations with Staphylococcus aureus ileS and other ARGs.
Figure 9b clearly shows the correlations among the three major types of MGEs, including transposases, recombinases, and integrases. Table S3 presents the topological characteristics of the MGEs network. The MGE co-occurrence network consisted of 27 nodes and 102 edges. The network revealed that transposases dominated the MGE community, exhibiting the largest node sizes and highest connectivity. Insertion sequence (IS) elements, such as IS110, IS630, IS3, and IS481, were highly abundant and exhibited positive correlations with each other. Recombinase-related genes (RecA and RecG) were also widely distributed and showed positive correlation with transposases, with all correlations between RecR and transposases being negative. Although integrases were less abundant, they were still involved in the network.
The network analysis of VFs revealed a highly interconnected structure dominated by positive correlations (Figure 9c). Table S4 presents the topological characteristics of the VFs network. The VF co-occurrence network consisted of 30 nodes and 100 edges. Most VF nodes, including key components such as LOS, capsule-related genes, and flagella-associated factors, exhibited strong co-occurrence patterns, forming a tightly linked interaction network. Several nodes, such as polar flagella, alginate, and adherence-related factors, showed relatively larger sizes and higher connectivity, suggesting their central roles in the VF network. In contrast, negative correlations were rare and sparsely distributed, occurring only between lipopolysaccharide (LPS) and Type IV pili.
In addition to the individual co-occurrence networks of ARGs, MGEs, and VFs, ARGs–MGEs and ARGs–VFs networks were constructed to further investigate their associations. As shown in Figure 9d, the co-occurrence network revealed complex interaction patterns among ARGs and MGEs. Multiple ARGs exhibited strong positive correlations with transposases and IS elements. For example, Escherichia coli rpoB mutants were positively correlated with IS elements including IS110, IS3, and IS630, while Mycobacterium tuberculosis katG mutations showed positive associations with integrases and DDE-type transposases. In addition, Escherichia coli ptsI and fabG mutants were positively linked to recombination-related genes and IS elements such as IS5 and IS1182. β-lactam- and spectinomycin-related resistance genes (e.g., pbp1 and rpsE) also displayed positive correlations with transposases (IS256 and IS481) and site-specific recombinases (XerD), further supporting the widespread association between ARGs and MGEs. In contrast, negative correlations were relatively limited and mainly involved recombination-related genes such as RecR, suggesting that antagonistic interactions were less common in the network.
As shown in Figure 9e, the co-occurrence network revealed complex interaction patterns among ARGs and VFs. Multiple ARGs showed consistent positive associations with key virulence determinants, particularly those related to cell surface structures and secretion systems. For example, Escherichia coli rpoB mutants were positively correlated with polar flagella, LPS, and capsule. Similarly, Mycobacterium tuberculosis katG mutations were associated with LPS, LOS, and the AdeFGH efflux pump. In addition, Escherichia coli ptsI and fabG mutants displayed positive correlations with transport- and secretion-related factors, including HSI and trehalose-recycling ABC transporters. In contrast, negative correlations were relatively limited and scattered across the network, occurring between a small number of ARGs–VFs pairs without forming clear clusters.

4. Discussion

In this study, metagenomic analysis revealed the presence of 35 ARG types, among which multidrug resistance genes were particularly abundant, with peptide, glycopeptide, and tetracycline resistance genes also showing relatively high levels. The abundance of multidrug resistance genes peaked in sample DK2 (1.94 × 10⁵). A similar ARG composition has been reported in the Lanzhou section of the Yellow River, where multidrug resistance genes constituted the largest proportion of the resistome, followed by tetracycline and peptide resistance genes, and efflux pumps represented the predominant resistance mechanism [34]. Likewise, a study on three rivers in northeast China also identified multidrug resistance genes as the major ARG type [35]. The primary reason for their high prevalence may be attributed to their broad-spectrum resistance mechanisms, wherein efflux pump systems enable bacteria to tolerate various antibiotics and different environmental stresses [36]. Additionally, DK2 is located at the Yellow River agricultural irrigation water intake in Baotou, where intensive agricultural activities may increase the input of nutrients, manure-associated microorganisms, and residual antibiotics through agricultural runoff, thereby facilitating the introduction of ARGs into the aquatic environment [37]. Moreover, DK2 may receive cumulative pollutants transported from upstream sections of the Yellow River, resulting in the continuous input of ARGs and resistant microorganisms [38]. Similar anthropogenic gradients have been observed in other river systems. For example, ARGs and clinically relevant resistant bacteria were less abundant at the relatively undisturbed source of the Bogotá River than at downstream sites affected by urban, agricultural, industrial, and hospital-related discharges [39]. Likewise, metagenomic analysis of an urban watershed showed that river samples collected within 5 km downstream of wastewater-treatment-plant discharges had an approximately 140-fold higher ARG abundance than less directly affected sites [40]. Among all genes associated with antibiotic resistance (including both canonical ARGs and resistance-related metabolic genes), the most abundant functional subtype was Escherichia coli fabG, reaching 1.77 × 10⁵ in sample HY3. As an essential gene involved in fatty acid synthesis [41], the association of fabG with antibiotic resistance may be achieved through metabolic fitness cost compensation [42]. Notably, resistance mechanism analysis revealed that antibiotic target alteration (49%) was the dominant mechanism, followed by antibiotic efflux pumps (36%). This result is consistent with the previous metagenomic observations made in un-contaminated soil as well as in various clinical/storage samples [43,44,45]. Target alteration mechanisms (rpoB and rpoC mutations) are typically associated with chromosomal mutations [42], which may be associated with long-term exposure to low concentrations of antibiotics [46]. The significant positive relationships between TDS and EC and the ARG-associated PCA1 scores indicate that dissolved chemical characteristics may partially explain the spatial variation of ARG profiles among sampling sites. Higher TDS and EC values may reflect increased inputs of dissolved substances associated with anthropogenic activities, which could influence microbial community composition and promote ARG persistence and dissemination through potential co-selection mechanisms [47,48]. Conversely, the weak association between turbidity and ARG variation suggests that suspended particles may play a relatively limited role in determining ARG distribution within the studied river system. Overall, these findings provide important insights into the diversity, abundance, and resistance mechanisms of ARGs in the Yellow River, highlighting its role as a critical environmental reservoir for antibiotic resistance. The results suggest that ARGs can persist and disseminate within the investigated reach of the Yellow River, highlighting the need for continued monitoring and risk assessment at the regional scale.
Recent metagenomic investigations from river ecosystems worldwide indicate that the occurrence of ARGs is not unique to the Yellow River but represents a widespread feature of aquatic resistomes. In European rivers, shotgun metagenomic studies have demonstrated that wastewater-impacted systems frequently contain elevated levels of multidrug, tetracycline, and β-lactam resistance genes, with anthropogenic inputs, particularly wastewater discharge, serving as important drivers of resistome variation [49,50]. Similarly, studies from North America have reported increased ARG abundance downstream of wastewater treatment plants, whereas relatively less impacted river systems still harbor diverse resistance determinants, suggesting the existence of an environmental resistome background [51,52]. In highly urbanized rivers in Asia, such as the Yamuna and Ganges Rivers, multidrug resistance genes, efflux pump-associated mechanisms, and target alteration genes including rpoB, rpoC, and gyrA have also been frequently detected [53,54]. The similar resistance categories and mechanisms observed across these global river systems suggest that the major ARG types identified in the Baotou section of the Yellow River in this study, particularly multidrug resistance genes, represent widely distributed aquatic resistance traits rather than river-specific signatures. It should be noted, however, that the observed differences in specific ARG subtypes may be shaped by local anthropogenic pressures, hydrological dynamics, and sediment characteristics. Future research incorporating these dimensions would contribute to a broader international understanding of the ecological relevance of ARG distributions within river ecosystems.
Taxonomic annotation of ARG-associated sequences revealed that resistance determinants were distributed among diverse freshwater bacterial taxa, highlighting the important role of indigenous microbial communities as environmental reservoirs of ARGs. The dominant ARG-associated genera identified in this study, including Limnohabitans, Rhodoferax, Candidatus Planktophila, Acidimicrobium, and Polynucleobacter, are widely distributed in freshwater ecosystems and play important roles in aquatic biogeochemical processes. Although these taxa are not considered major human pathogens, their capacity to harbor diverse resistance determinants suggests that environmental bacteria may contribute to the persistence and circulation of ARGs in river ecosystems [55]. The widespread occurrence of multidrug resistance genes across different bacterial hosts further indicates that resistance traits are broadly maintained within environmental microbial communities, potentially driven by long-term exposure to anthropogenic pressures and ecological selection [56]. These findings emphasize that non-clinical environmental bacteria should be considered important components of the environmental resistome and should be incorporated into antibiotic resistance risk assessments.
Transposases dominated the composition of MGEs, accounting for 65.82%, suggesting that transposition-related elements may serve as important genetic vehicles for the potential dissemination of ARGs in this aquatic environment. Previous studies have demonstrated that MGEs, including transposons, integrons, bacteriophages, and plasmids, play a central role in mediating the horizontal transfer of ARGs, with transposable elements being recognized as key drivers of ARG mobility [57,58]. The high relative abundance of IS families such as IS3, IS110, and IS630 further indicates the potential occurrence of active DNA recombination and transposition processes in the surface water of the Baotou section of the Yellow River. In addition, recombinases and integrases accounted for 25.23% and 8.57%, respectively, implying that site-specific recombination and integration processes may also contribute to ARG transfer. It should be noted that phage integrases were detected at a relatively low abundance (0.11%). Nevertheless, their presence suggests that phage-mediated transduction may represent a potential pathway for ARG dissemination [59,60]. Furthermore, the Yellow River is characterized by high sediment loads and strong water–sediment interactions, which can shape unique microbial communities. Such sediment-associated microbiota may provide ecological niches that facilitate the preservation, accumulation, and exchange of diverse MGEs. Therefore, the relatively high diversity of IS elements observed in this study may be associated with the distinct sedimentary environment and the microbial assemblages it supports. However, this hypothesis requires further validation through sediment sampling, host tracking, and co-occurrence network analysis. Overall, these findings demonstrate that the dominance and diversity of MGEs, particularly transposases and IS elements, may act as key driving forces underlying ARG mobility in the Yellow River, highlighting the mechanistic importance of recombination- and transposition-mediated processes in riverine ecosystems.
A total of 915 VF genes were identified, with nutritional/metabolic factors and immune modulation factors representing the most abundant categories. This distribution suggests that the microbial community in this aquatic environment may enhance its ecological fitness by optimizing nutrient acquisition and modulating host immune responses. Similar patterns have been reported in environmental microbiomes, where virulence-associated traits can contribute to microbial survival and adaptation under complex environmental pressures [61]. Notably, LOS exhibited the highest abundance in sample ZJ2 (3.39 × 10⁴). As a structurally simplified form of LPS found in Gram-negative bacteria, LOS is a key component of bacterial endotoxins and is known to trigger strong host immune responses, including inflammation and sepsis-related pathways [62]. The elevated abundance of LOS-related genes may therefore indicate a potential risk associated with endotoxin-mediated effects in this river section. In addition, the frequent detection of VFs such as polar flagella, alginate biosynthesis, and beta-haemolysin/cytolysin suggests the possible enrichment of opportunistic pathogenic bacteria, including Pseudomonas aeruginosa and Aeromonas spp. These virulence traits are commonly associated with bacterial motility, biofilm formation, and host cell damage, which collectively enhance colonization capacity and pathogenic potential [63,64]. However, it should be noted that the presence of VF genes in environmental samples does not necessarily indicate active pathogenicity, and further investigations (e.g., expression analysis and host association studies) are required to assess their actual health risks. Overall, the observed virulence-factor profiles at the investigated sites suggest possible associations with local environmental conditions and potential opportunistic pathogens; however, their broader ecological and public health significance requires further investigation.
The ARGs network exhibited dense and predominantly positive correlations, suggesting strong co-occurrence patterns and possible co-selection processes. Notably, Escherichia coli fabG emerged as one of the most central nodes, displaying extensive positive correlations with multiple ARG classes, including multidrug, peptide, tetracycline, and macrolide resistance genes (e.g., mlaF, bcrA, tetA (58), and macB). Although fabG is primarily involved in fatty acid biosynthesis, its central position in the network supports the idea that metabolic genes may be indirectly linked to antibiotic resistance through fitness compensation and adaptive responses under antimicrobial pressure [65]. Similarly, multidrug resistance genes such as mlaF and rpoB also formed key hubs, indicating their potential role in maintaining network stability and facilitating resistance dissemination.
The MGE network was dominated by transposases, which exhibited the largest node sizes and highest connectivity, highlighting their central role in genetic mobility. IS elements such as IS110, IS630, IS3, and IS481 were highly interconnected, suggesting active transposition processes. This observation is consistent with previous studies indicating that IS are major drivers of genome plasticity and play a critical role in mobilizing ARGs [57,58]. Recombinase-related genes (RecA and RecG) were also widely distributed and showed multiple associations with transposases, further supporting the importance of homologous recombination in facilitating gene exchange. Although integrases were less abundant, their involvement in the network suggests that site-specific recombination and integron-mediated gene capture may also contribute to ARG dissemination [66]. The predominance of positive correlations among MGEs indicates potential cooperative interactions, which may enhance the efficiency of HGT.
The VF co-occurrence network in the Yellow River was similarly densely connected and dominated by positive correlations, indicating strong associations among different virulence determinants. Key components such as LOS, capsule-related genes, and flagella-associated factors formed central nodes, suggesting their important roles in maintaining microbial ecological fitness and potential colonization capabilities. Nodes with high connectivity, including polar flagella, alginate biosynthesis, and adherence-related factors, likely contribute to motility, biofilm formation, and host interaction, which collectively enhance the adaptability of opportunistic bacteria in the river environment. The predominance of positive correlations and the rarity of negative associations indicate that virulence traits may function synergistically rather than antagonistically within these microbial communities. These observations are consistent with previous metagenomic studies of environmental microbiomes, which reported co-occurrence of virulence genes as a mechanism for microbial adaptation under complex ecological pressures [10,67,68].
The ARG–MGE co-occurrence network indicates close associations between MGEs and ARGs, suggesting that MGEs may contribute to the distribution and potential dissemination of ARGs at the investigated sites. The widespread positive associations between ARGs and transposases or IS elements suggest that transposition-related mechanisms may be the dominant drivers of ARG mobility in this system. This finding is consistent with previous studies demonstrating that IS elements and transposons are key mediators of HGT and contribute significantly to the spread of resistance genes across diverse bacterial communities [57,69]. However, compared with studies focusing on clinical or wastewater environments where plasmid-mediated transfer is often dominant, the present results highlight the particularly prominent role of IS-associated transposition in riverine ecosystems. The observed associations between ARGs and recombination-related genes further indicate that homologous recombination and site-specific integration processes may contribute to ARG reshuffling and stabilization within microbial genomes. This pattern supports the idea that cooperative interactions among MGEs may enhance gene exchange efficiency [70].
The ARGs-VFs co-occurrence network further reveals potential links between antibiotic resistance and virulence traits. The consistent positive correlations between ARGs and virulence determinants, particularly those associated with cell surface structures and secretion systems, suggest that these functional traits may be co-selected under environmental pressures. This observation is in agreement with large-scale genomic analyses showing that ARGs and VFs frequently coexist across bacterial taxa and may be co-maintained through shared ecological advantages [10]. In addition, the enrichment of ARGs in association with factors related to adhesion, transport, and secretion suggests that microbial strategies for environmental adaptation—such as biofilm formation and resource acquisition—may indirectly promote the persistence of antibiotic resistance [71]. Similar patterns have been reported in aquatic environments where environmental stressors, including nutrient fluctuations and anthropogenic inputs, drive the co-selection of resistance and virulence traits [72,73].
Notably, negative correlations across all networks were relatively rare and did not form distinct clusters, indicating that antagonistic interactions among ARGs, MGEs, and VFs are limited. This contrasts with some studies reporting competitive exclusion among functional genes in highly selective environments, suggesting that the Yellow River system may support a more permissive ecological niche for gene coexistence. Overall, this study provides a comprehensive network-based perspective on the interactions among ARGs, MGEs, and VFs in the Yellow River, highlighting the combined roles of mobile genetic elements and environmental selection in shaping resistance and virulence patterns. The integration of ARGs-MGEs and ARGs-VFs networks provides further insight into the potential interactions between resistance and virulence. Our integrated analysis reveals their coordinated organization within riverine microbial communities, emphasizing the importance of large river systems as key hotspots for the persistence and potential dissemination of antibiotic resistance.
Several aspects of this study provide directions for future research. First, considering the high sediment loads and strong hydrodynamic interactions in the Yellow River, future studies should incorporate paired water and sediment sampling to investigate ARG partitioning, persistence, and mobility across different environmental compartments. Such investigations should integrate quantitative ARG profiling, characterization of MGEs, identification of potential microbial hosts, and comprehensive environmental parameter analyses to determine whether sediments serve as long-term reservoirs or transient sources of ARGs. Furthermore, assessing ARG mobility and their associations with potential pathogenic hosts at the water–sediment interface will provide a more comprehensive evaluation of potential public health risks. Second, our sampling was confined to a single season, providing only a temporally constrained snapshot of ARG and microbial community profiles, without capturing their seasonal variability. Repeat sampling across different seasons and hydrological conditions is necessary to better assess temporal dynamics. Third, this study aimed to provide an initial characterization of the spatial distribution patterns of ARGs, MGEs, and VFs in the Baotou section of the Yellow River. Future investigations incorporating targeted validation approaches, such as quantitative PCR (qPCR) or reverse transcription quantitative PCR (RT-qPCR), will further verify the abundance and expression patterns of representative ARGs and enhance the understanding of their ecological significance. Moreover, investigations involving pathogen isolation, viability assessment, and functional validation will be essential for determining the actual ecological and public health risks posed by these genetic elements.

5. Conclusions

This study provides a comprehensive overview of the distribution patterns and ecological interactions of ARGs, MGEs, and VFs in surface waters of the Yellow River within the Baotou section through metagenomic profiling. Although the overall composition of ARGs, MGEs, and VFs was relatively conserved across sampling sites, their abundance variations reflected the influence of spatially heterogeneous environmental pressures and anthropogenic inputs. The predominance of multidrug resistance genes and transposases highlights the important role of genetic mobility in shaping the environmental resistome. Moreover, the widespread co-occurrence and positive correlations among ARGs, MGEs, and VFs suggest potential co-selection processes linking antibiotic resistance dissemination with virulence evolution in bacterial communities. These findings indicate that river systems receiving cumulative anthropogenic impacts may serve as important reservoirs and transmission pathways for resistance determinants and pathogenic traits.

Supplementary Materials

The following supporting information can be downloaded at https://www.mdpi.com/article/10.3390/w18151780/s1. Figure S1. (a) The α diversity of ARGs. (b)The β diversity of ARGs based on the Bray–Curtis distance matrix; Figure S2. (a) The α diversity of MGEs. (b)The β diversity of MGEs based on the Bray–Curtis distance matrix; Figure S3. (a) The α diversity of VFs. (b)The β diversity of VFs based on the Bray–Curtis distance matrix; Table S1. Samples information with their reads, Contigs, ORFs and length; Table S2. Topological features of the ARGs network; Table S3. Topological features of the MGEs network; Table S4. Topological features of the VFs network.

Author Contributions

C.L.: Writing—original draft, Data curation. Q.Y., Q.L. and Y.J.: Investigation (water sample collection), Writing—review and editing. X.Z., T.L., W.Y. and Q.S.: Investigation (laboratory sample processing). F.W.: Conceptualization, Supervision, Funding acquisition, Writing—review and editing. All authors have read and agreed to the published version of the manuscript.

Funding

This work was supported by the National Key Research and Development Program of China (2023YFC3205802).

Data Availability Statement

The original contributions presented in this study are included in the article and Supplementary Material. Further inquiries can be directed to the corresponding author. The raw metagenomic sequencing data generated in this study have been deposited in the NCBI Sequence Read Archive (SRA) database under accession number SUB16331102.

Conflicts of Interest

The authors declare no conflicts of interest.

References

  1. World Health Organization (Ed.) Antimicrobial Resistance: Global Report on Surveillance; World Health Organization: Geneva, Switzerland, 2014. [Google Scholar]
  2. Centers for Disease Control and Prevention (U.S.). Antibiotic Resistance Threats in the United States, 2019; Centers for Disease Control and Prevention (U.S.): Atlanta, GA, USA, 2019.
  3. Pruden, A.; Pei, R.; Storteboom, H.; Carlson, K.H. Antibiotic Resistance Genes as Emerging Contaminants: Studies in Northern Colorado. Environ. Sci. Technol. 2006, 40, 7445–7450. [Google Scholar] [CrossRef] [PubMed]
  4. Obayiuwana, A.; Ibekwe, A.M.; Eze, C. Resistome Profile of Treated Wastewater Using Metagenomic Approach. Water 2025, 17, 867. [Google Scholar] [CrossRef]
  5. Liu, B.; Shen, Z.; Zhou, Q.; Ren, J.; Wang, H.; Zhang, D.; Pan, X. Antibiotic Resistance Genes in the Animal Manure-Amended Soil-Plant System: Occurrence, Transmission, Bacterial Hosts, and Human Health Risks. Ecotoxicol. Environ. Saf. 2025, 303, 118890. [Google Scholar] [CrossRef] [PubMed]
  6. Kormos, D.A.; Isaacman-VanWertz, G.; Ogejo, J.A.; Pruden, A.; Marr, L.C. Quantifying Dissemination of Antibiotic Resistance Genes in Air from a Dairy Farm and Swine Farm. ACS EST Air 2025, 2, 1552–1564. [Google Scholar] [CrossRef] [PubMed]
  7. Napit, R.; Gurung, A.; Poudel, A.; Chaudhary, A.; Manandhar, P.; Sharma, A.N.; Raut, S.; Pradhan, S.M.; Joshi, J.; Poyet, M.; et al. Metagenomic Analysis of Human, Animal, and Environmental Samples Identifies Potential Emerging Pathogens, Profiles Antibiotic Resistance Genes, and Reveals Horizontal Gene Transfer Dynamics. Sci. Rep. 2025, 15, 12156. [Google Scholar] [CrossRef] [PubMed]
  8. Wagner, P.L.; Waldor, M.K. Bacteriophage Control of Bacterial Virulence. Infect. Immun. 2002, 70, 3985–3993. [Google Scholar] [CrossRef] [PubMed]
  9. Kim, H.; Kim, M.; Kim, S.; Lee, Y.M.; Shin, S.C. Characterization of Antimicrobial Resistance Genes and Virulence Factor Genes in an Arctic Permafrost Region Revealed by Metagenomics. Environ. Pollut. 2022, 294, 118634. [Google Scholar] [CrossRef] [PubMed]
  10. Pan, Y.; Zeng, J.; Li, L.; Yang, J.; Tang, Z.; Xiong, W.; Li, Y.; Chen, S.; Zeng, Z. Coexistence of Antibiotic Resistance Genes and Virulence Factors Deciphered by Large-Scale Complete Genome Analysis. mSystems 2020, 5, e00821-19. [Google Scholar] [CrossRef] [PubMed]
  11. Zhang, X.-X.; Zhang, T.; Fang, H.H.P. Antibiotic Resistance Genes in Water Environment. Appl. Microbiol. Biotechnol. 2009, 82, 397–414. [Google Scholar] [CrossRef] [PubMed]
  12. Czekalski, N.; Sigdel, R.; Birtel, J.; Matthews, B.; Bürgmann, H. Does Human Activity Impact the Natural Antibiotic Resistance Background? Abundance of Antibiotic Resistance Genes in 21 Swiss Lakes. Environ. Int. 2015, 81, 45–55. [Google Scholar] [CrossRef]
  13. Chen, Y.; Li, P.; Huang, Y.; Yu, K.; Chen, H.; Cui, K.; Huang, Q.; Zhang, J.; Gin, K.Y.-H.; He, Y. Environmental Media Exert a Bottleneck in Driving the Dynamics of Antibiotic Resistance Genes in Modern Aquatic Environment. Water Res. 2019, 162, 127–138. [Google Scholar] [CrossRef] [PubMed]
  14. Jiang, H.; Zhou, R.; Zhang, M.; Cheng, Z.; Li, J.; Zhang, G.; Chen, B.; Zou, S.; Yang, Y. Exploring the Differences of Antibiotic Resistance Genes Profiles between River Surface Water and Sediments Using Metagenomic Approach. Ecotoxicol. Environ. Saf. 2018, 161, 64–69. [Google Scholar] [CrossRef] [PubMed]
  15. Bai, Y.; Ruan, X.; Xie, X.; Yan, Z. Antibiotic Resistome Profile Based on Metagenomics in Raw Surface Drinking Water Source and the Influence of Environmental Factor: A Case Study in Huaihe River Basin, China. Environ. Pollut. 2019, 248, 438–447. [Google Scholar] [CrossRef] [PubMed]
  16. Xu, Q.; Liu, S.; Lou, S.; Tu, J.; Li, X.; Jin, Y.; Yin, W.; Radnaeva, L.D.; Nikitina, E.; Makhinov, A.N.; et al. Typical Antibiotic Resistance Genes and Their Association with Driving Factors in the Coastal Areas of Yangtze River Estuary. Environ. Sci. Pollut. Res. 2024, 31, 30440–30453. [Google Scholar] [CrossRef]
  17. Zhang, S.; Yang, G.; Zhang, Y.; Yang, C. High-Throughput Profiling of Antibiotic Resistance Genes in the Yellow River of Henan Province, China. Sci. Rep. 2024, 14, 17490. [Google Scholar] [CrossRef]
  18. Yu, Q.; Feng, T.; Yang, J.; Su, W.; Zhou, R.; Wang, Y.; Zhang, H.; Li, H. Seasonal Distribution of Antibiotic Resistance Genes in the Yellow River Water and Tap Water, and Their Potential Transmission from Water to Human. Environ. Pollut. 2022, 292, 118304. [Google Scholar] [CrossRef] [PubMed]
  19. Qian, X.; Gunturu, S.; Guo, J.; Chai, B.; Cole, J.R.; Gu, J.; Tiedje, J.M. Metagenomic Analysis Reveals the Shared and Distinct Features of the Soil Resistome across Tundra, Temperate Prairie, and Tropical Ecosystems. Microbiome 2021, 9, 108. [Google Scholar] [CrossRef] [PubMed]
  20. Wang, X.; Lin, Y.; Li, S.; Wang, J.; Li, X.; Zhang, D.; Duan, D.; Shao, Z. Metagenomic Analysis Reveals the Composition and Sources of Antibiotic Resistance Genes in Coastal Water Ecosystems of the Yellow Sea and Yangtze River Delta. Environ. Pollut. 2025, 371, 125923. [Google Scholar] [CrossRef] [PubMed]
  21. Meneghine, A.K.; Nielsen, S.; Varani, A.M.; Thomas, T.; Carareto Alves, L.M. Metagenomic Analysis of Soil and Freshwater from Zoo Agricultural Area with Organic Fertilization. PLoS ONE 2017, 12, e0190178. [Google Scholar] [CrossRef]
  22. Segata, N.; Waldron, L.; Ballarini, A.; Narasimhan, V.; Jousson, O.; Huttenhower, C. Metagenomic Microbial Community Profiling Using Unique Clade-Specific Marker Genes. Nat. Methods 2012, 9, 811–814. [Google Scholar] [CrossRef] [PubMed]
  23. Ma, L.; Li, B.; Zhang, T. Abundant Rifampin Resistance Genes and Significant Correlations of Antibiotic Resistance Genes and Plasmids in Various Environments Revealed by Metagenomic Analysis. Appl. Microbiol. Biotechnol. 2014, 98, 5195–5204. [Google Scholar] [CrossRef] [PubMed]
  24. Bashiardes, S.; Zilberman-Schapira, G.; Elinav, E. Use of Metatranscriptomics in Microbiome Research. Bioinform. Biol. Insights 2016, 10, BBI.S34610. [Google Scholar] [CrossRef]
  25. Sukumar, S.; Roberts, A.P.; Martin, F.E.; Adler, C.J. Metagenomic Insights into Transferable Antibiotic Resistance in Oral Bacteria. J. Dent. Res. 2016, 95, 969–976. [Google Scholar] [CrossRef] [PubMed]
  26. Wu, Y.; Wen, T.; Yin, J.; Liu, J.; Xing, Y.; Yang, Z.; Wang, M.; Lu, L.; Ma, Y. Heavy Metal Content and Bacterial Diversity in Heavily Polluted Baotou Region of Yellow River. Mater. Express 2020, 10, 1661–1667. [Google Scholar] [CrossRef]
  27. Ministry of Ecology and Environment of the People’s Republic of China. China National Environmental Monitoring Centre. National Surface Water Quality Report, May 2026. 2026. Available online: https://www.mee.gov.cn/ (accessed on 16 July 2026).
  28. Liu, F.; Li, X.-Q.; Dong, G.-C.; Qin, Y.-G.; Chen, Y.-G.; Wang, Z.-Z.; Wang, F. Water Pollution of Yellow River Estuary Coastal Wetland. China Environ. Sci. 2011, 31, 1705–1710. [Google Scholar]
  29. Wang, X.; Zhang, G.; Meng, P.; Xu, Y.; Ai, X.; Xu, C.; Wang, Y. Seasonal Changes Drive Shifts in Bacterial Community Structure and Functional Composition in the Yellow River (Zhengzhou Section). Curr. Microbiol. 2026, 83, 28. [Google Scholar]
  30. Spurr, M.; Hart, A.; Schmidt, W. Antimicrobial Resistance in the River Trent under Flood and Non-Flood Conditions. Sci. Total Environ. 2026, 1044, 181965. [Google Scholar] [CrossRef] [PubMed]
  31. Lu, J.; Tian, Z.; Yu, J.; Yang, M.; Zhang, Y. Distribution and Abundance of Antibiotic Resistance Genes in Sand Settling Reservoirs and Drinking Water Treatment Plants across the Yellow River, China. Water 2018, 10, 246. [Google Scholar] [CrossRef]
  32. Ma, S.; Han, W.; Ma, Y.; Jiang, B.; Shen, J.; Hou, S.; Wang, L. Spatial Distribution and Drivers of Antibiotics and Resistance Genes in a Key Yellow River Tributary. Environ. Toxicol. Chem. 2026, 45, 1158–1171. [Google Scholar] [CrossRef] [PubMed]
  33. Ren, Y.; Yu, G.; Shi, C.; Liu, L.; Guo, Q.; Han, C.; Zhang, D.; Zhang, L.; Liu, B.; Gao, H.; et al. Majorbio Cloud: A One-Stop, Comprehensive Bioinformatic Platform for Multiomics Analyses. iMeta 2022, 1, e12. [Google Scholar] [CrossRef] [PubMed]
  34. Yu, Q.; Han, Q.; Shi, S.; Sun, X.; Wang, X.; Wang, S.; Yang, J.; Su, W.; Nan, Z.; Li, H. Metagenomics reveals the response of antibiotic resistance genes to elevated temperature in the Yellow River. Sci. Total Environ. 2023, 859, 160324. [Google Scholar] [CrossRef] [PubMed]
  35. Zhao, C.; Li, C.; Wang, X.; Cao, Z.; Gao, C.; Su, S.; Xue, B.; Wang, S.; Qiu, Z.; Wang, J.; et al. Monitoring and Evaluation of Antibiotic Resistance Genes in Three Rivers in Northeast China. Environ. Sci. Pollut. Res. 2022, 29, 44148–44161. [Google Scholar] [CrossRef]
  36. Subirats, J.; Sharpe, H.; Tai, V.; Fruci, M.; Topp, E. Metagenome Meta-Analysis Reveals an Increase in the Abundance of Some Multidrug Efflux Pumps and Mobile Genetic Elements in Chemically Polluted Environments. Appl. Environ. Microbiol. 2023, 89, e01047-23. [Google Scholar] [CrossRef] [PubMed]
  37. Sun, Z.; Hong, W.; Xue, C.; Dong, N. A Comprehensive Review of Antibiotic Resistance Gene Contamination in Agriculture: Challenges and AI-Driven Solutions. Ecotoxicol. Environ. Saf. 2024, 289, 117464. [Google Scholar]
  38. Zheng, S.; Han, B.; Wang, Y.; Ding, Y.; Zhao, R.; Yang, F. Occurrence and Dissemination of Antibiotic Resistance Genes in the Yellow River Basin: Focused on Family Farms. Environ. Sci. Pollut. Res. 2024, 31, 16328–16341. [Google Scholar] [CrossRef]
  39. Posada-Perlaza, C.E.; Ramírez-Rojas, A.; Porras, P.; Adu-Oppong, B.; Botero-Coy, A.-M.; Hernández, F.; Anzola, J.M.; Díaz, L.; Dantas, G.; Reyes, A.; et al. Bogotá River Anthropogenic Contamination Alters Microbial Communities and Promotes Spread of Antibiotic Resistance Genes. Sci. Rep. 2019, 9, 11764. [Google Scholar] [CrossRef] [PubMed]
  40. Thornton, C.N.; Tanner, W.D.; VanDerslice, J.A.; Brazelton, W.J. Localized Effect of Treated Wastewater Effluent on the Resistome of an Urban Watershed. GigaScience 2020, 9, giaa125. [Google Scholar] [CrossRef] [PubMed]
  41. Hu, Z.; Ma, J.; Chen, Y.; Tong, W.; Zhu, L.; Wang, H.; Cronan, J.E. Escherichia coli FabG 3-Ketoacyl-ACP Reductase Proteins Lacking the Assigned Catalytic Triad Residues Are Active Enzymes. J. Biol. Chem. 2021, 296, 100365. [Google Scholar] [CrossRef] [PubMed]
  42. Pearcy, N.; Hu, Y.; Baker, M.; Maciel-Guerra, A.; Xue, N.; Wang, W.; Kaler, J.; Peng, Z.; Li, F.; Dottorini, T. Genome-Scale Metabolic Models and Machine Learning Reveal Genetic Determinants of Antibiotic Resistance in Escherichia coli and Unravel the Underlying Metabolic Adaptation Mechanisms. mSystems 2021, 6, e00913-20. [Google Scholar] [CrossRef] [PubMed]
  43. Lambert, P. Bacterial Resistance to Antibiotics: Modified Target Sites. Adv. Drug Deliv. Rev. 2005, 57, 1471–1485. [Google Scholar] [CrossRef] [PubMed]
  44. Anderson, J.R.; Lam, N.B.; Jackson, J.L.; Dorenkott, S.M.; Ticer, T.; Maldosevic, E.; Velez, A.; Camden, M.R.; Ellis, T.N. Progressive Sub-MIC Exposure of Klebsiella pneumoniae 43816 to Cephalothin Induces the Evolution of Beta-Lactam Resistance without Acquisition of Beta-Lactamase Genes. Antibiotics 2023, 12, 887. [Google Scholar] [CrossRef] [PubMed]
  45. Poshvina, D.V.; Balkin, A.S.; Dilbaryan, D.S.; Vasilchenko, A.S. Unravelling the Response of the Soil Microbiome to Macrolactin A: A Metagenomic Study. Chemosphere 2025, 387, 144645. [Google Scholar] [CrossRef] [PubMed]
  46. Wistrand-Yuen, E.; Knopp, M.; Hjort, K.; Koskiniemi, S.; Berg, O.G.; Andersson, D.I. Evolution of High-Level Resistance during Low-Level Antibiotic Exposure. Nat. Commun. 2018, 9, 1599. [Google Scholar] [CrossRef] [PubMed]
  47. Inuwa, A.B.; Mahmood, Q.; Iqbal, J.; Widemann, E.; Shafiq, S.; Irshad, M.; Irshad, U.; Iqbal, A.; Hafeez, F.; Nazir, R. Removal of Antibiotic Resistance Genes, Class 1 Integrase Gene and Escherichia coli Indicator Gene in a Microalgae-Based Wastewater Treatment System. Antibiotics 2022, 11, 1531. [Google Scholar] [CrossRef] [PubMed]
  48. Zhang, Y.-J.; Hu, H.-W.; Yan, H.; Wang, J.-T.; Lam, S.K.; Chen, Q.-L.; Chen, D.; He, J.-Z. Salinity as a Predominant Factor Modulating the Distribution Patterns of Antibiotic Resistance Genes in Ocean and River Beach Soils. Sci. Total Environ. 2019, 668, 193–203. [Google Scholar] [CrossRef] [PubMed]
  49. Kneis, D.; Berendonk, T.U.; Forslund, S.K.; Hess, S. Antibiotic Resistance Genes in River Biofilms: A Metagenomic Approach toward the Identification of Sources and Candidate Hosts. Environ. Sci. Technol. 2022, 56, 14913–14922. [Google Scholar] [CrossRef] [PubMed]
  50. Lee, J.; Ju, F.; Maile-Moskowitz, A.; Beck, K.; Maccagnan, A.; McArdell, C.S.; Dal Molin, M.; Fenicia, F.; Vikesland, P.J.; Pruden, A.; et al. Unraveling the Riverine Antibiotic Resistome: The Downstream Fate of Anthropogenic Inputs. Water Res. 2021, 197, 117050. [Google Scholar] [CrossRef] [PubMed]
  51. Murphy, A.; Barich, D.; Fennessy, M.S.; Slonczewski, J.L. An Ohio State Scenic River Shows Elevated Antibiotic Resistance Genes, Including Acinetobacter Tetracycline and Macrolide Resistance, Downstream of Wastewater Treatment Plant Effluent. Microbiol. Spectr. 2021, 9, e00941-21. [Google Scholar] [CrossRef] [PubMed]
  52. Shahar, S.; Sant, K.E.; Allsing, N.; Kelley, S.T. Metagenomic Analysis of Microbial Communities and Antibiotic Resistant Genes in the Tijuana River, and Potential Sources. Environ. Pollut. 2024, 342, 123067. [Google Scholar] [CrossRef] [PubMed]
  53. Mittal, P.; Prasoodanan, P.K.; Dhakan, D.B.; Kumar, S.; Sharma, V.K. Metagenome of a Polluted River Reveals a Reservoir of Metabolic and Antibiotic Resistance Genes. Environ. Microbiome 2019, 14, 5. [Google Scholar] [CrossRef] [PubMed]
  54. Zhang, S.-Y.; Tsementzi, D.; Hatt, J.K.; Bivins, A.; Khelurkar, N.; Brown, J.; Tripathi, S.N.; Konstantinidis, K.T. Intensive Allochthonous Inputs along the Ganges River and Their Effect on Microbial Community Composition and Dynamics. Environ. Microbiol. 2019, 21, 4817–4832. [Google Scholar]
  55. Berendonk, T.U.; Manaia, C.M.; Merlin, C.; Fatta-Kassinos, D.; Cytryn, E.; Walsh, F.; Bürgmann, H.; Sørum, H.; Norström, M.; Pons, M.-N.; et al. Tackling Antibiotic Resistance: The Environmental Framework. Nat. Rev. Microbiol. 2015, 13, 310–317. [Google Scholar] [CrossRef] [PubMed]
  56. Li, D.; Dai, H.; Zhang, H.; Wang, C.; Zou, C.; Huang, S.; Wang, Y.; Yao, J. Anthropogenic Pressures Amplify High-Risk Antibiotic Resistome via Co-Selection among Biocide Resistance, Virulence, and Antibiotic Resistance Genes in the Ganjiang River Basin: Drivers Diverge in Densely versus Sparsely Populated Reaches. J. Hazard. Mater. 2025, 497, 139632. [Google Scholar] [CrossRef] [PubMed]
  57. Razavi, M.; Kristiansson, E.; Flach, C.-F.; Larsson, D.G.J. The Association between Insertion Sequences and Antibiotic Resistance Genes. mSphere 2020, 5, e00418-20. [Google Scholar] [CrossRef] [PubMed]
  58. Partridge, S.R.; Kwong, S.M.; Firth, N.; Jensen, S.O. Mobile Genetic Elements Associated with Antimicrobial Resistance. Clin. Microbiol. Rev. 2018, 31, e00088-17. [Google Scholar] [CrossRef] [PubMed]
  59. Muniesa, M.; Colomer-Lluch, M.; Jofre, J. Potential Impact of Environmental Bacteriophages in Spreading Antibiotic Resistance Genes. Future Microbiol. 2013, 8, 739–751. [Google Scholar] [CrossRef] [PubMed]
  60. Debroas, D.; Siguret, C. Viruses as Key Reservoirs of Antibiotic Resistance Genes in the Environment. ISME J. 2019, 13, 2856–2867. [Google Scholar] [CrossRef] [PubMed]
  61. Casadevall, A.; Pirofski, L. Virulence Factors and Their Mechanisms of Action: The View from a Damage–Response Framework. J. Water Health 2009, 7, S2–S18. [Google Scholar] [CrossRef] [PubMed]
  62. Steimle, A.; Autenrieth, I.B.; Frick, J.-S. Structure and Function: Lipid A Modifications in Commensals and Pathogens. Int. J. Med. Microbiol. 2016, 306, 290–301. [Google Scholar] [CrossRef] [PubMed]
  63. Flemming, H.-C.; Wingender, J. The Biofilm Matrix. Nat. Rev. Microbiol. 2010, 8, 623–633. [Google Scholar] [CrossRef] [PubMed]
  64. Janda, J.M.; Abbott, S.L. The Genus Aeromonas: Taxonomy, Pathogenicity, and Infection. Clin. Microbiol. Rev. 2010, 23, 35–73. [Google Scholar] [CrossRef] [PubMed]
  65. Andersson, D.I.; Hughes, D. Antibiotic Resistance and Its Cost: Is It Possible to Reverse Resistance? Nat. Rev. Microbiol. 2010, 8, 260–271. [Google Scholar] [CrossRef]
  66. Gillings, M.R. Integrons: Past, Present, and Future. Microbiol. Mol. Biol. Rev. 2014, 78, 257–277. [Google Scholar] [CrossRef] [PubMed]
  67. Wozniak, R.A.F.; Waldor, M.K. Integrative and Conjugative Elements: Mosaic Mobile Genetic Elements Enabling Dynamic Lateral Gene Flow. Nat. Rev. Microbiol. 2010, 8, 552–563. [Google Scholar] [CrossRef] [PubMed]
  68. Wang, B.; Liang, Y.; Lian, K.; Zhang, C.; Han, M.; Wang, M.; Shao, H.; McMinn, A.; Wang, H. Correlation with Viruses Enhances Network Complexity and Stability of Co-Occurrence Prokaryotes across the Oceans. mSystems 2025, 10, e00539-25. [Google Scholar] [CrossRef] [PubMed]
  69. Ebmeyer, S.; Kristiansson, E.; Larsson, D.G.J. A Framework for Identifying the Recent Origins of Mobile Antibiotic Resistance Genes. Commun. Biol. 2021, 4, 8. [Google Scholar] [CrossRef] [PubMed]
  70. Bengtsson-Palme, J.; Kristiansson, E.; Larsson, D.G.J. Environmental Factors Influencing the Development and Spread of Antibiotic Resistance. FEMS Microbiol. Rev. 2018, 42, fux053. [Google Scholar] [PubMed]
  71. Balcázar, J.L.; Subirats, J.; Borrego, C.M. The Role of Biofilms as Environmental Reservoirs of Antibiotic Resistance. Front. Microbiol. 2015, 6, 1216. [Google Scholar] [CrossRef] [PubMed]
  72. Li, B.; Yang, Y.; Ma, L.; Ju, F.; Guo, F.; Tiedje, J.M.; Zhang, T. Metagenomic and Network Analysis Reveal Wide Distribution and Co-Occurrence of Environmental Antibiotic Resistance Genes. ISME J. 2015, 9, 2490–2502. [Google Scholar] [CrossRef] [PubMed]
  73. Zou, Y.; Xiao, Z.; Wang, L.; Wang, Y.; Yin, H.; Li, Y. Prevalence of Antibiotic Resistance Genes and Virulence Factors in the Sediment of WWTP Effluent-Dominated Rivers. Sci. Total Environ. 2023, 897, 165441. [Google Scholar] [CrossRef] [PubMed]
Figure 1. Sample sites of the Yellow River in the Baotou section.
Water 18 01780 g001
Figure 2. (a) Abundance distribution of ARG types. (b) TPM abundance of top 10 functional subtypes of ARGs.
Water 18 01780 g002
Figure 3. Clustered heatmap of ARG types.
Water 18 01780 g003
Figure 4. Circos plot of the distribution of antibiotic resistance mechanisms.
Water 18 01780 g004
Figure 5. Potential bacterial hosts carrying antibiotic resistance genes and the distribution of associated resistance categories.
Water 18 01780 g005
Figure 6. Correlations between PCA1-ARG profiles and key water quality parameters: (a) TDS, (b) EC, and (c) turbidity.
Water 18 01780 g006
Figure 7. (a) Circos plot of the distribution of MGEs. (b) TPM abundance of top 10 functional subtypes of MGEs.
Water 18 01780 g007
Figure 8. (a) Circos plot of the distribution of VFs. (b) TPM abundance of top 10 functional subtypes of VFs.
Water 18 01780 g008
Figure 9. Co-occurrence network analysis pattern.
Water 18 01780 g009
Disclaimer/Publisher’s Note: The statements, opinions and data contained in all publications are solely those of the individual author(s) and contributor(s) and not of MDPI and/or the editor(s). MDPI and/or the editor(s) disclaim responsibility for any injury to people or property resulting from any ideas, methods, instructions or products referred to in the content.