Article

A Cyber-Physical System for Real-Time Flood Monitoring: Integration of Semantic Segmentation and Edge Computing in Taiwan


Geographic Information System Research Center, Feng Chia University, Taichung City 40724, Taiwan
*
Author to whom correspondence should be addressed.
Water 2026, 18(11), 1286; https://doi.org/10.3390/w18111286
Submission received: 21 April 2026 / Revised: 9 May 2026 / Accepted: 21 May 2026 / Published: 26 May 2026
(This article belongs to the Section Urban Water Management)

Abstract

Global climate change and extreme precipitation events increasingly challenge urban infrastructure resilience, particularly in topographically vulnerable regions like Taiwan. Traditional flood monitoring relies heavily on the manual visual interpretation of extensive surveillance networks, a process that imposes high cognitive loads and risks delayed emergency responses. This study presents a comprehensive Cyber-Physical System (CPS) architecture for an automated Water Image Monitoring Platform. Integrating approximately 10,000 cameras and multi-modal data—including precipitation records and spatial alerts—the platform leverages advanced semantic segmentation (DeepLabV3+ with Xception71) to delineate inundation boundaries. To ensure robustness under adverse conditions such as low illumination, fog, and specular glare, we implemented targeted optimizations, including HSV pre-processing, Deblur GAN architectures, and attention mechanisms. Results demonstrate a significant performance evolution, with the event recall rate rising from 88% in 2022 to 99.7% by 2025. A key driver of this success is the synergy between stationary nodes and vehicle-mounted CCTV units, which provide critical dynamic geographic coverage. Furthermore, the deployment of edge computing reduced warning latency 10 times—from 19.2 to 2 s—while virtual water level gauges maintained a mean error within ±10 cm. Despite these gains, a Human-in-the-Loop (HITL) architecture remains strategically necessary for ethical accountability and error filtering. This CPS provides a foundational model for autonomous, resilient urban disaster management.

1. Introduction

Global climate change has exacerbated the frequency and intensity of extreme weather events, posing a threat to urban and rural infrastructure resilience. Taiwan, situated in a region characterized by high typhoon activity and geological instability within the Pacific Ring of Fire, is particularly vulnerable to disasters. Intense rainfall frequently triggers landslides and debris flows in mountainous areas, while downstream plains and metropolitan regions face sudden inundation due to river overflows and urban flash floods [1,2,3,4,5]. To mitigate these risks, government agencies have deployed extensive surveillance networks across critical road segments, bridges, and high-risk streams. However, the management of these networks—often comprising thousands of cameras—remains heavily dependent on manual visual interpretation. This reliance imposes a substantial cognitive load on emergency personnel, increasing the probability of missed detections or delayed responses during critical events [6,7].
Recent progressions in Artificial Intelligence (AI) have catalyzed a shift toward automated water body recognition [8,9,10]. While existing research utilizing satellite or Unmanned Aerial Vehicle (UAV) imagery has reported recognition accuracies exceeding 95% [11,12,13], these successes are often difficult to replicate in ground-level terrestrial monitoring. Road-level inundation detections are frequently hampered by adverse weather conditions, complex backgrounds, and fluctuating lighting—such as nighttime low-visibility, strong solar reflections, or artificial glare—which significantly degrade the Mean Intersection over Union (mIoU) of deep learning models [14,15,16]. Although various studies have proposed data augmentation [17,18] and model optimizations [19] to address these issues, achieving robust performance under extreme lighting and high-noise environments remains an ongoing challenge [20,21,22].
Beyond visual recognition, contemporary disaster management necessitates the integration of heterogeneous, multi-modal data to support agile decision-making. Modern disaster response architectures have evolved toward real-time data fusion, where cross-referencing visual information with environmental sensors allows for a more efficient assessment of disaster severity, thereby reducing the operational pressure on practitioners [23,24]. Yang et al. developed an adaptive platform for New Taipei City in Taiwan, utilizing a Service-Oriented Architecture (SOA) to consolidate fragmented hydro-meteorological datasets from various government agencies. Their framework successfully incorporates Convolutional Neural Network (CNN) models for street-level flood classification and utilizes drone-based 3D mapping to support situational awareness [24]. While these advancements have demonstrably reduced operational risks, the reliance on cloud-centric processing and stationary sensing nodes can present limitations in terms of recognition latency and geographic coverage in dense urban alleys or under adverse communication conditions. To address these multidimensional challenges, this study proposes a comprehensive Cyber-Physical System (CPS) [25,26,27] architecture for an automated Water Image Monitoring Platform. This CPS-driven approach leverages real-time multi-modal data—including precipitation records and spatial alert areas—to trigger automated image recognition and water level estimation, thereby facilitating 24/7 disaster monitoring and proactive emergency warning. The features of the platform in [24] and this study are compared in Table 1.
The implementation of this platform progressed from an initial pilot of 20 high-risk nodes (Figure 1)—encompassing underpasses, intersections, and coastal drainage gates—to a regional network. Currently, approximately 10,000 cameras offer images across Taiwan on the platform, spanning coastal, urban, and mountainous terrains. Notably, six strategic locations have been equipped with the edge computing approach to support virtual water level measurements, providing low-latency response capabilities critical for immediate flood alerts. The ultimate objective of this research is to establish a resilient Internet of Things (IoT) monitoring network that serves as a foundation for a long-term transition toward a full CPS, where AI-driven insights directly inform and potentially control physical infrastructure responses.

2. Cyber-Physical System Architectures

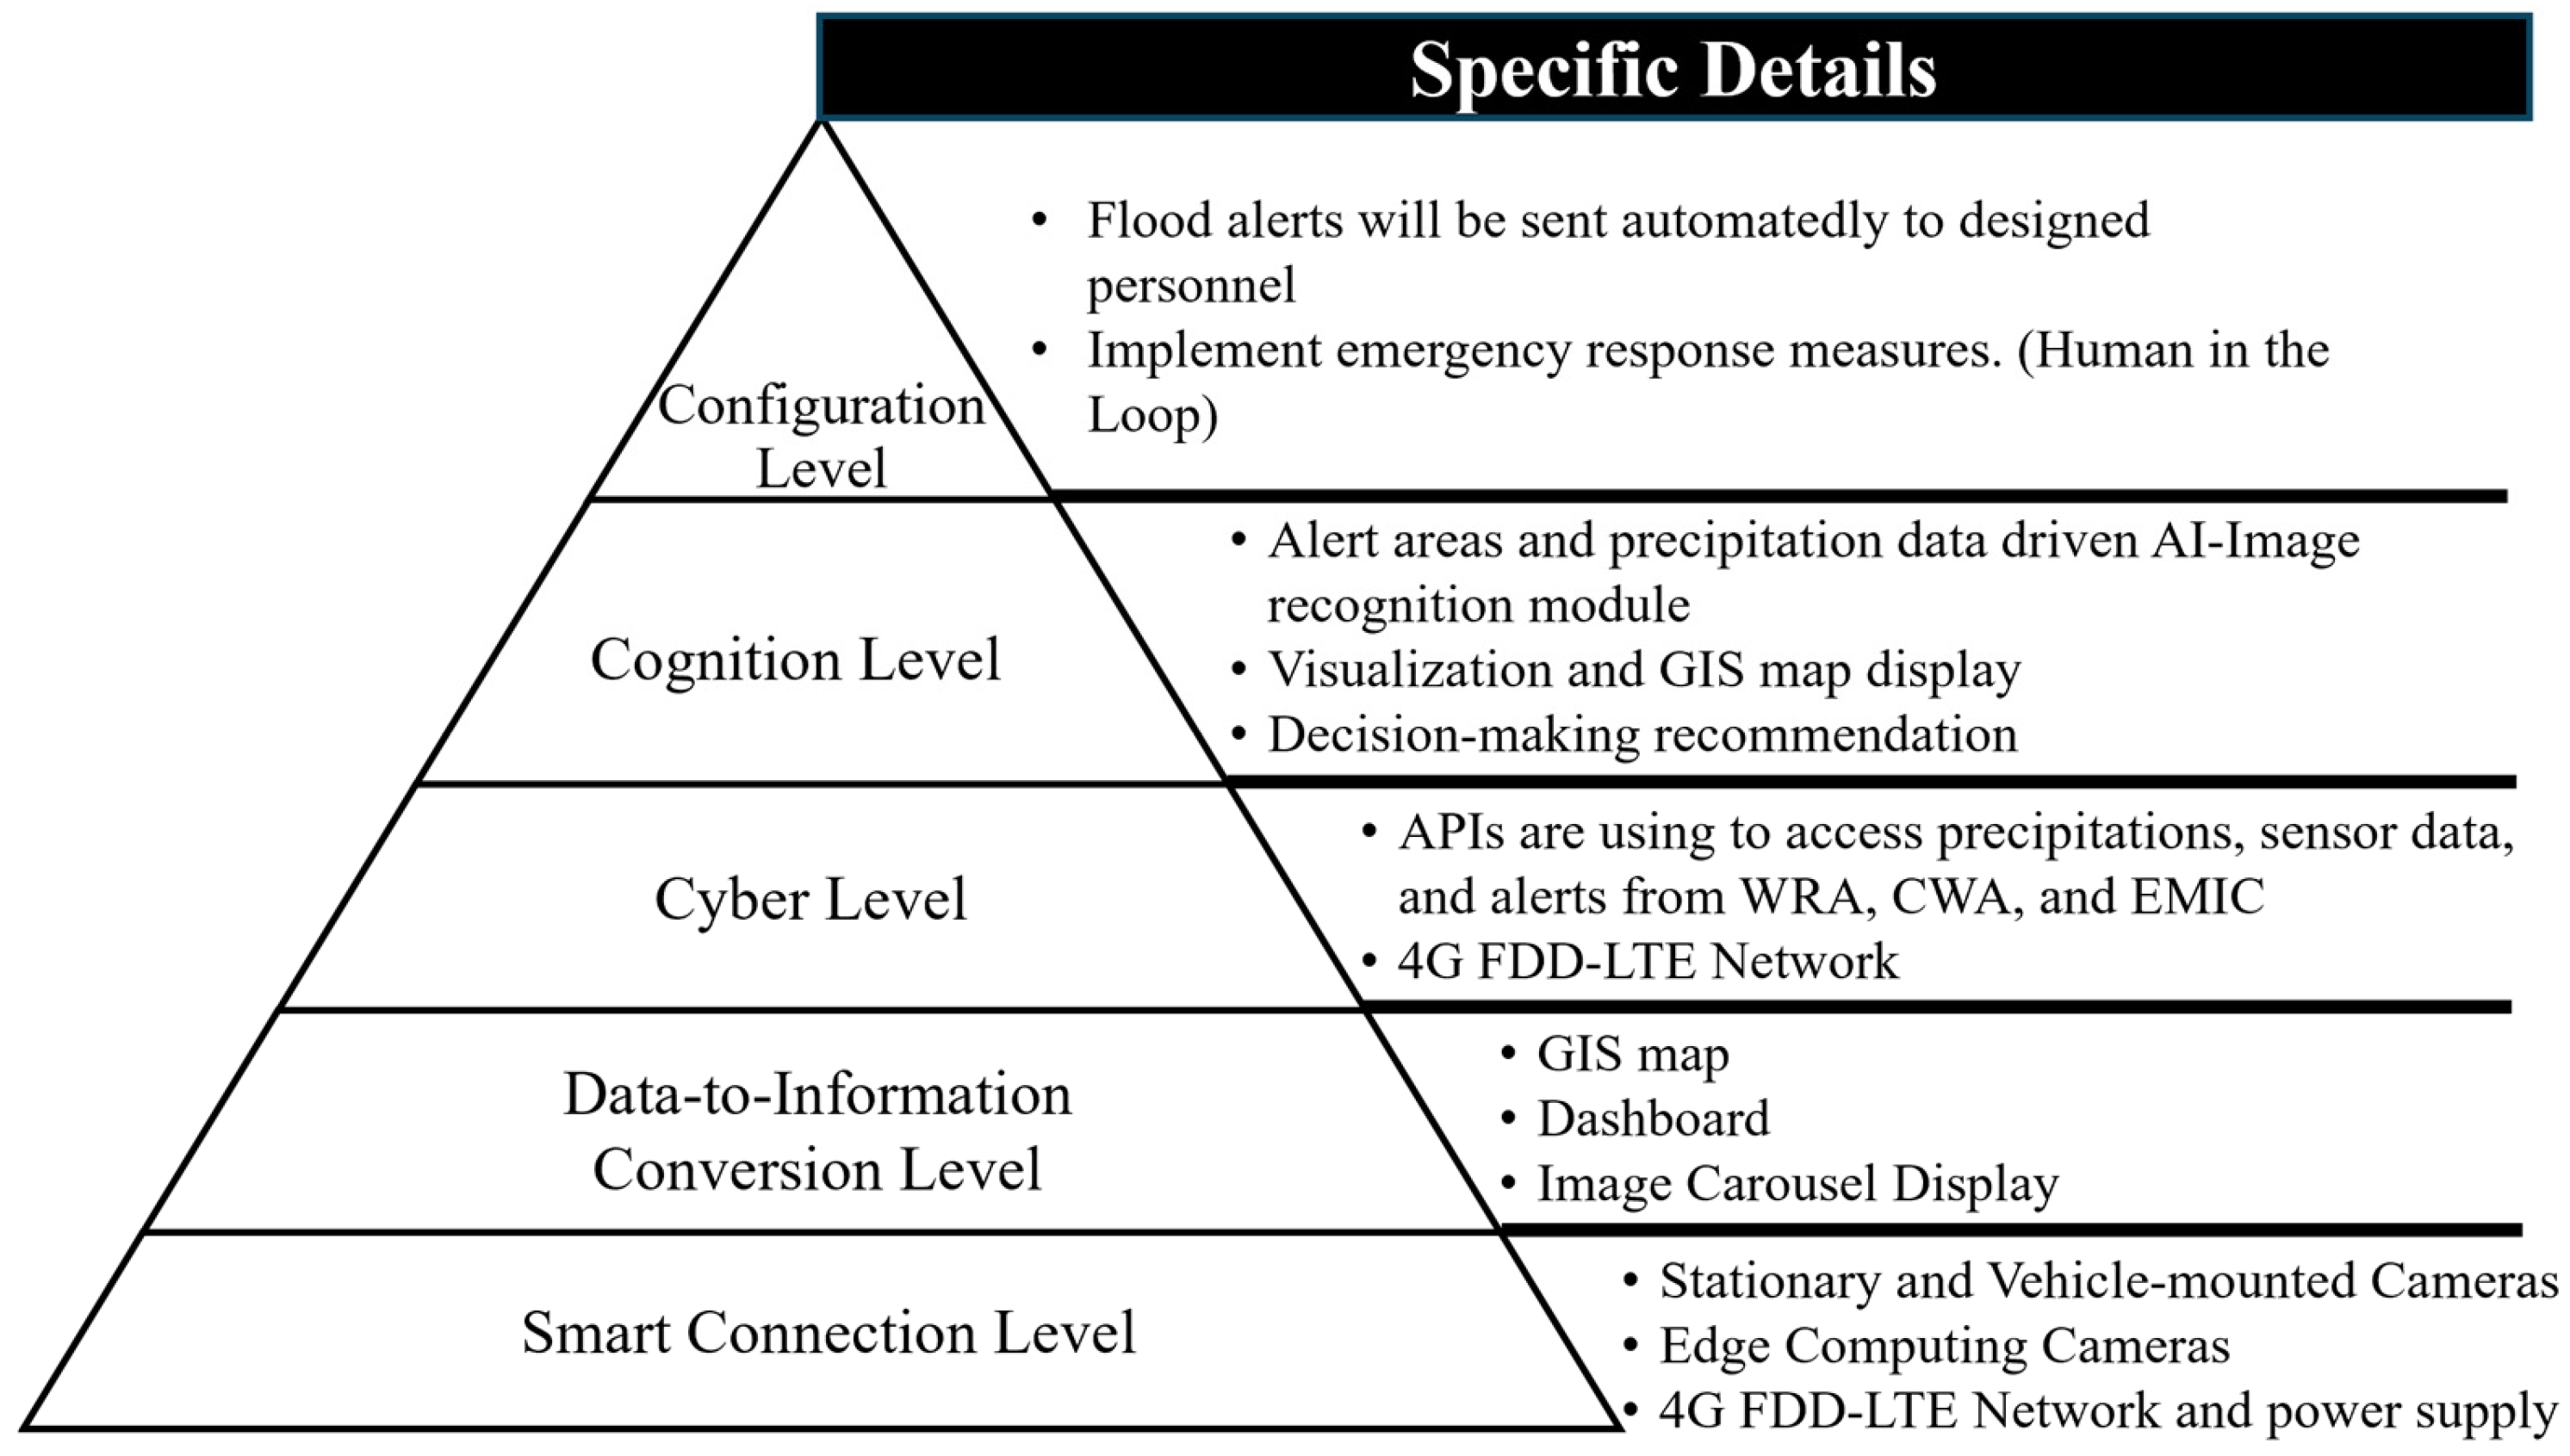
The Water Image Monitoring Platform is structured according to the five-level Cyber-Physical System (CPS) architecture [28] (Figure 2) to ensure a seamless transition from data acquisition to autonomous response.
  • Smart connection level: The Smart Connection Level establishes a robust IoT infrastructure for environmental data acquisition. The sensing network integrates over 10,000 cameras as sources of images, comprising WRA stationary units, interfaced surveillance nodes, and vehicle-mounted CCTV units. Six surveillance nodes as virtual water level gauges utilize Axis Q1805LE cameras (Axis Communications, Lund, Sweden), which feature deep-learning-optimized chipsets and localized data storage capabilities. Data transmission is primarily facilitated via the 4G FDD-LTE standard. To ensure operational resilience, WRA stations utilize a DC power supply with a DC-DC buck converter module (TaiwanIoT, Tainan, Taiwan) supported by a 14.4 V/20 A rechargeable lithium-ion battery pack consist of a Panasonic NCR18650PF battery cell (Panasonic Holdings Corporation, Osaka, Japan), which is capable of providing 30 h of continuous operation during power failures. The maximum power consumption of the edge-computing camera is approximately 25 W, while typical operational consumption is around 12 W. Compared with conventional surveillance cameras, the additional annual electricity cost is estimated to be approximately NTD 200–300 per device.
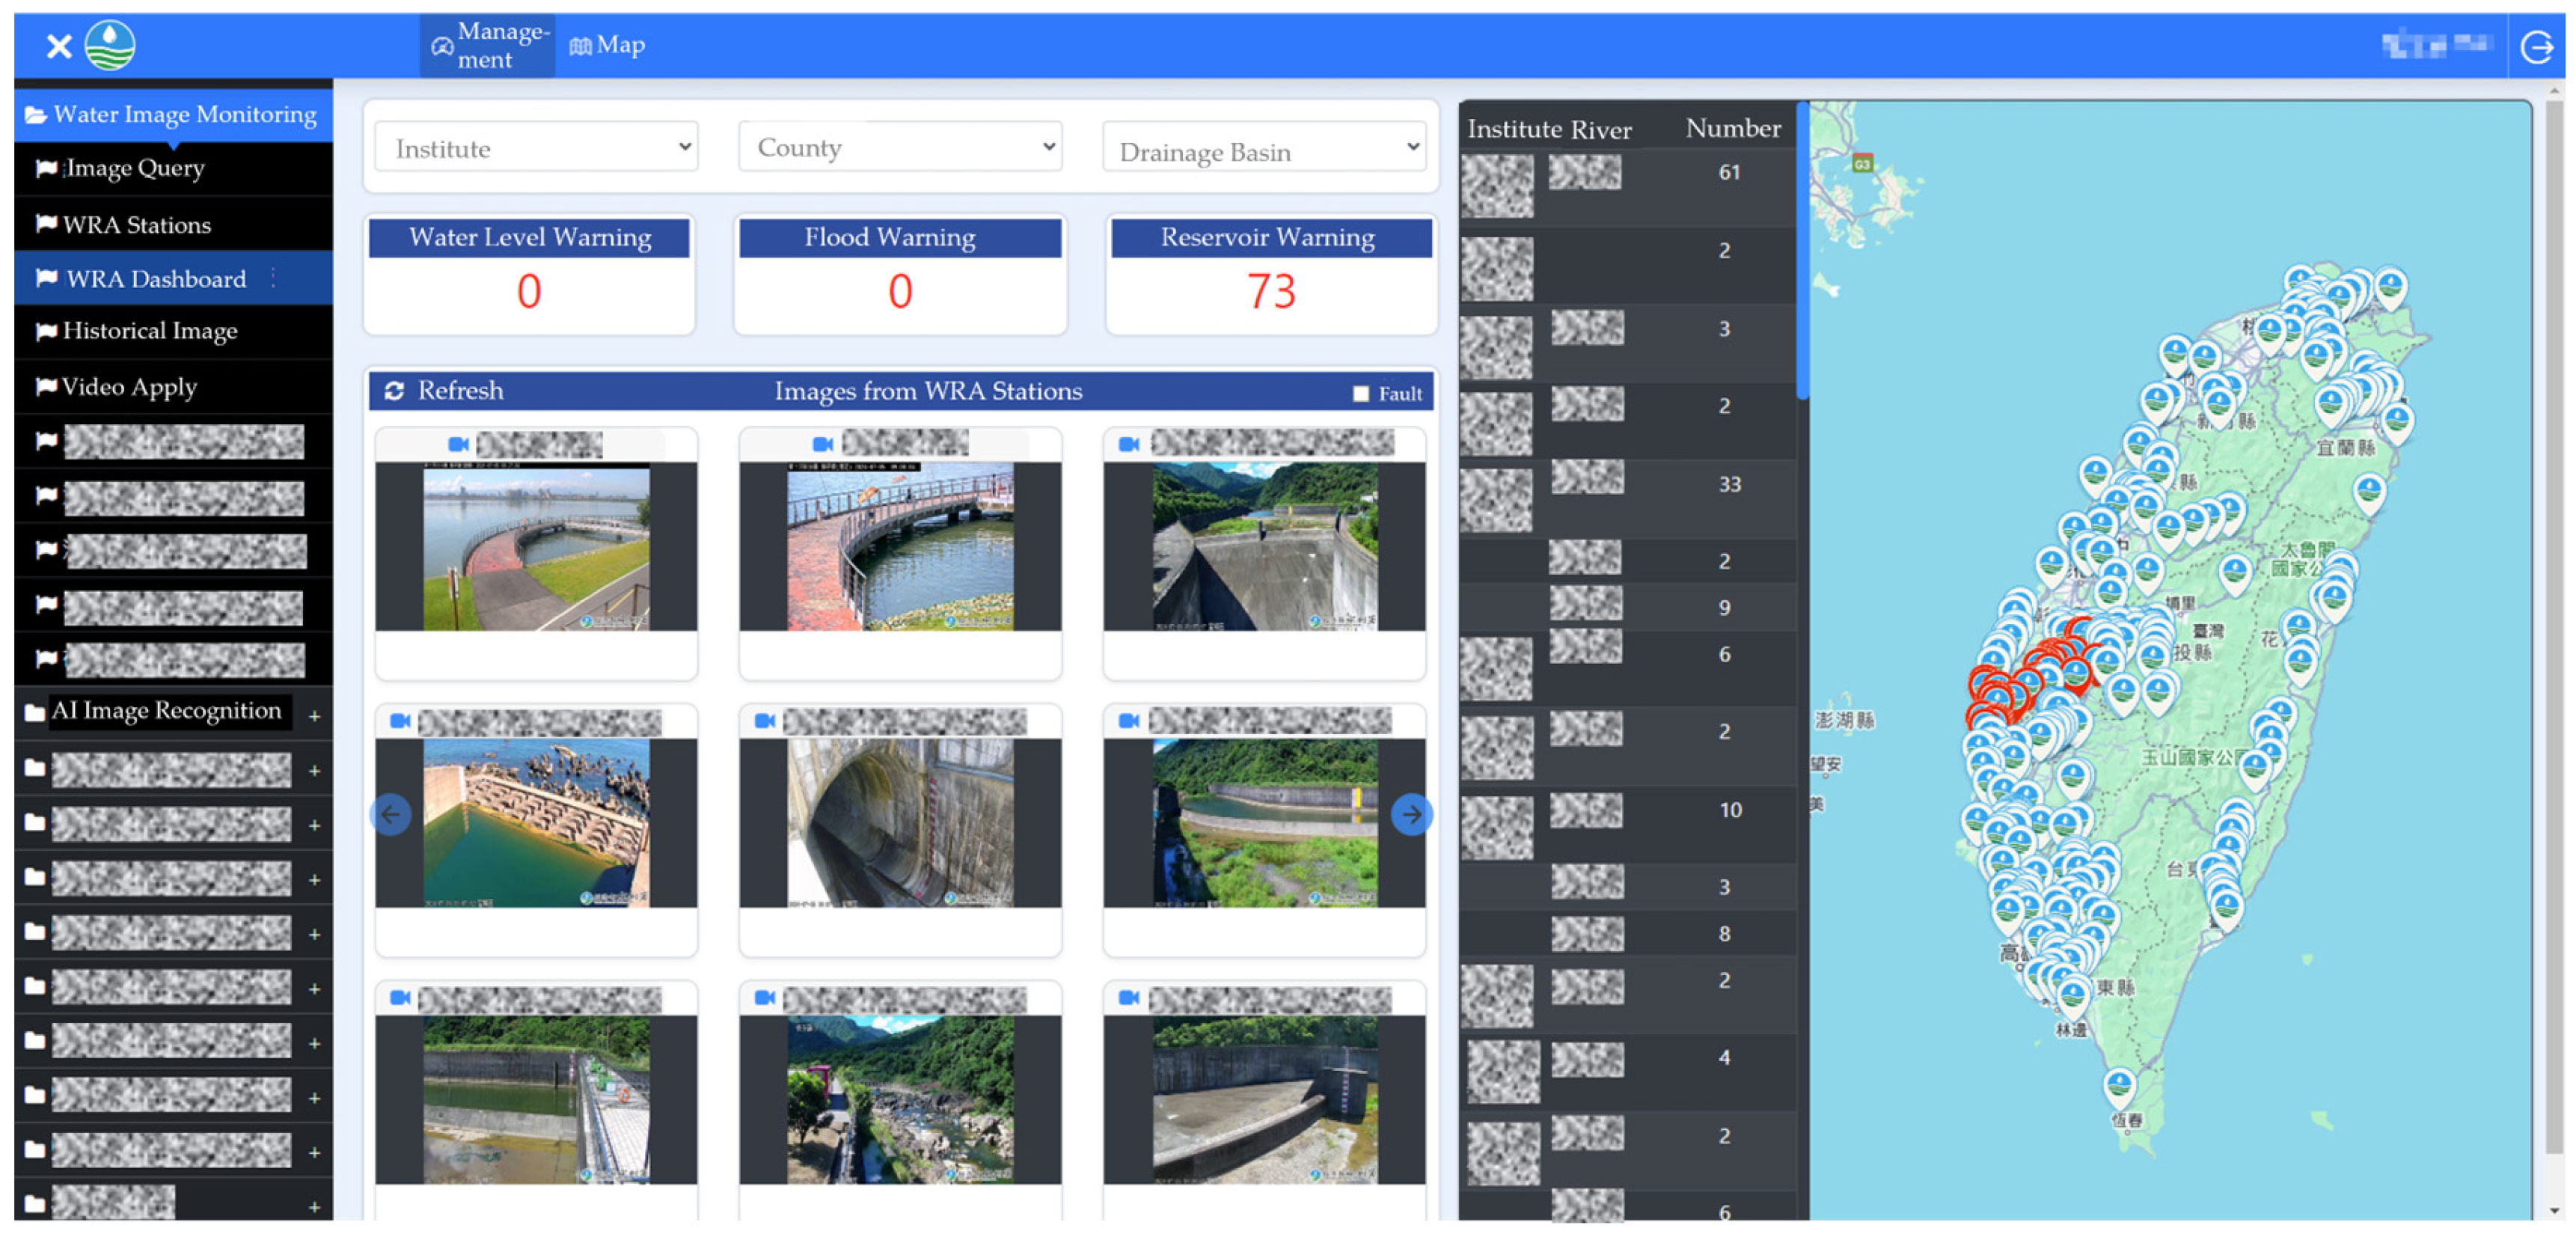
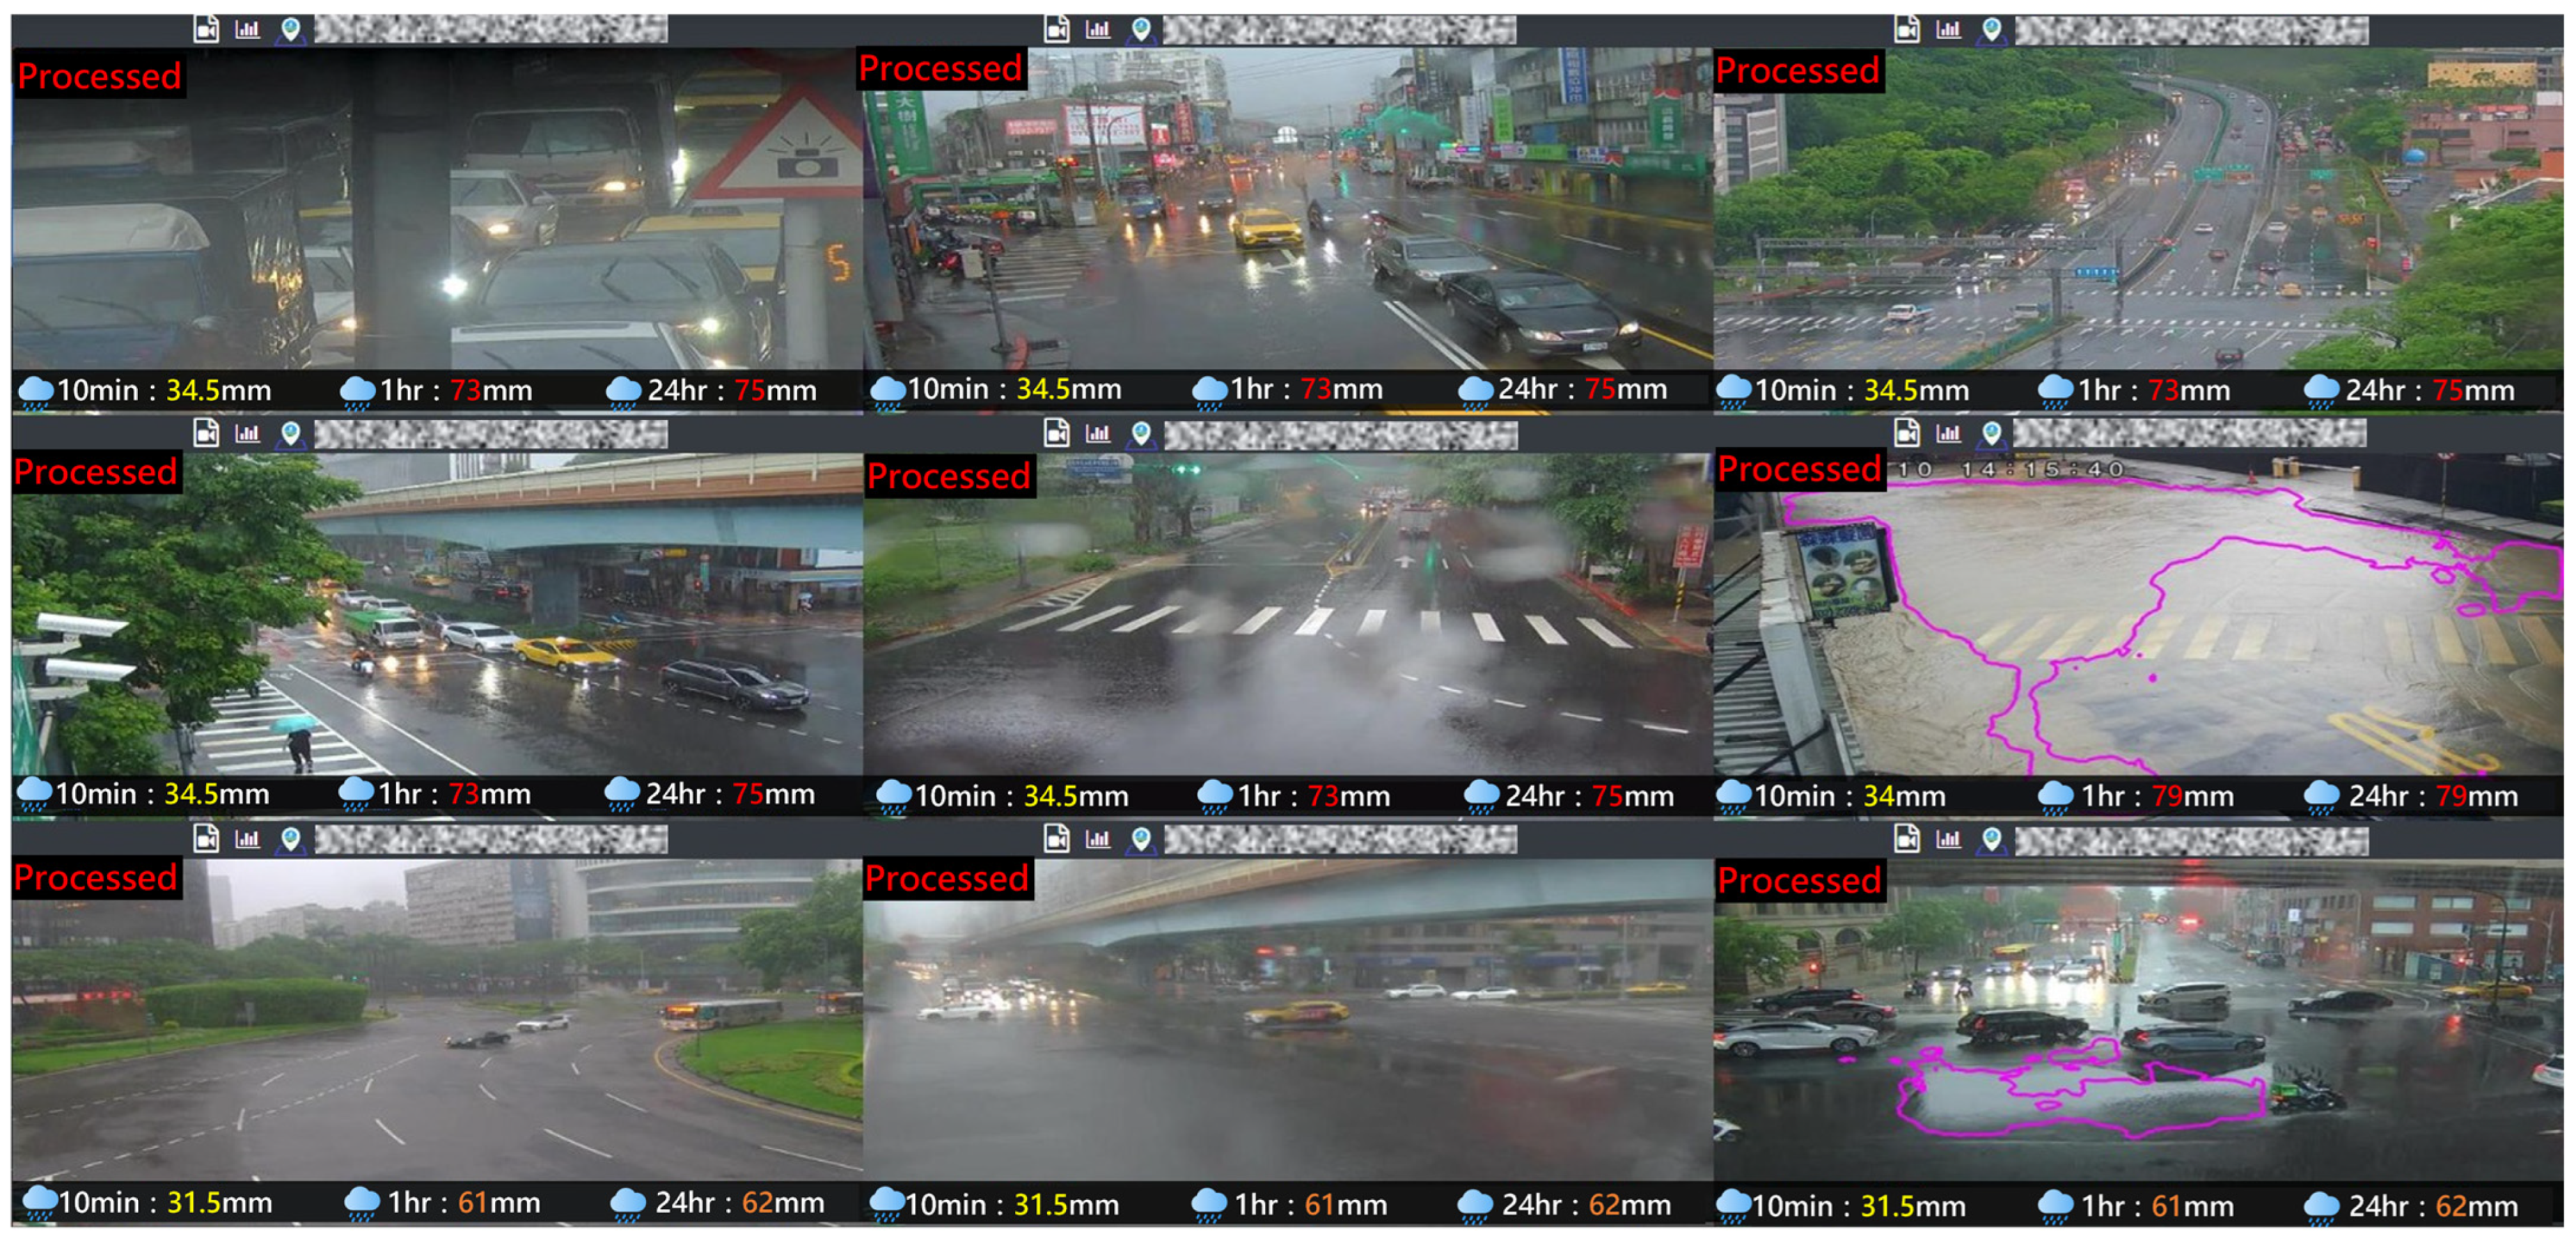
  • Data-to-Information conversion level: At this level, multi-modal data—including high-resolution imagery, geospatial coordinates, precipitation records, and flood alert areas—are ingested and stored within a centralized database. These datasets are integrated and visualized through system dashboards, GIS maps (Figure 3), and dynamic image carousel (Figure 4) interfaces to provide comprehensive situational awareness.
  • Cyber level: The Cyber Level serves as the information hub, utilizing APIs to interface with multiple real-time external intelligence sources. Key integrated data streams include precipitation data from the CWA, sensor telemetry from the EMIC, and flood alerts from the WRA. This multi-modal fusion enables the platform to achieve deep data integration and drive informed decision-making.
  • Cognition level: The Cognition Level implements AI-driven analytical modules that utilize real-time precipitation and spatial alert information to trigger the image recognition workflows. The deep learning model performs semantic segmentation to accurately delineate inundation boundaries and offer the application of virtual water level gauges. Thresholds to trigger the semantic segmentation model are defined as follows: (1) the 10-min accumulated rainfall at the rain gauge associated with a given camera reaches 10 mm, or the hourly accumulated rainfall reaches 30 mm; or (2) the camera is located in the officially announced inundation warning area by the CWA.
  • Configuration level: The Configuration Level governs the execution of response measures and alert disseminations. When the image recognition module identifies inundation events meeting specified thresholds, the platform immediately issues automated alerts via email and instant messaging (IM) to designated personnel. To ensure high reliability and ethical accountability, the platform currently operates under a Human-in-the-Loop (HITL) architecture [29,30]. Upon receiving alerts, designated personnel perform a manual verification of the AI-detected event before issuing formal public warnings and coordinating emergency response measures, such as road closures or pump deployment.

Platform Architecture and Environment

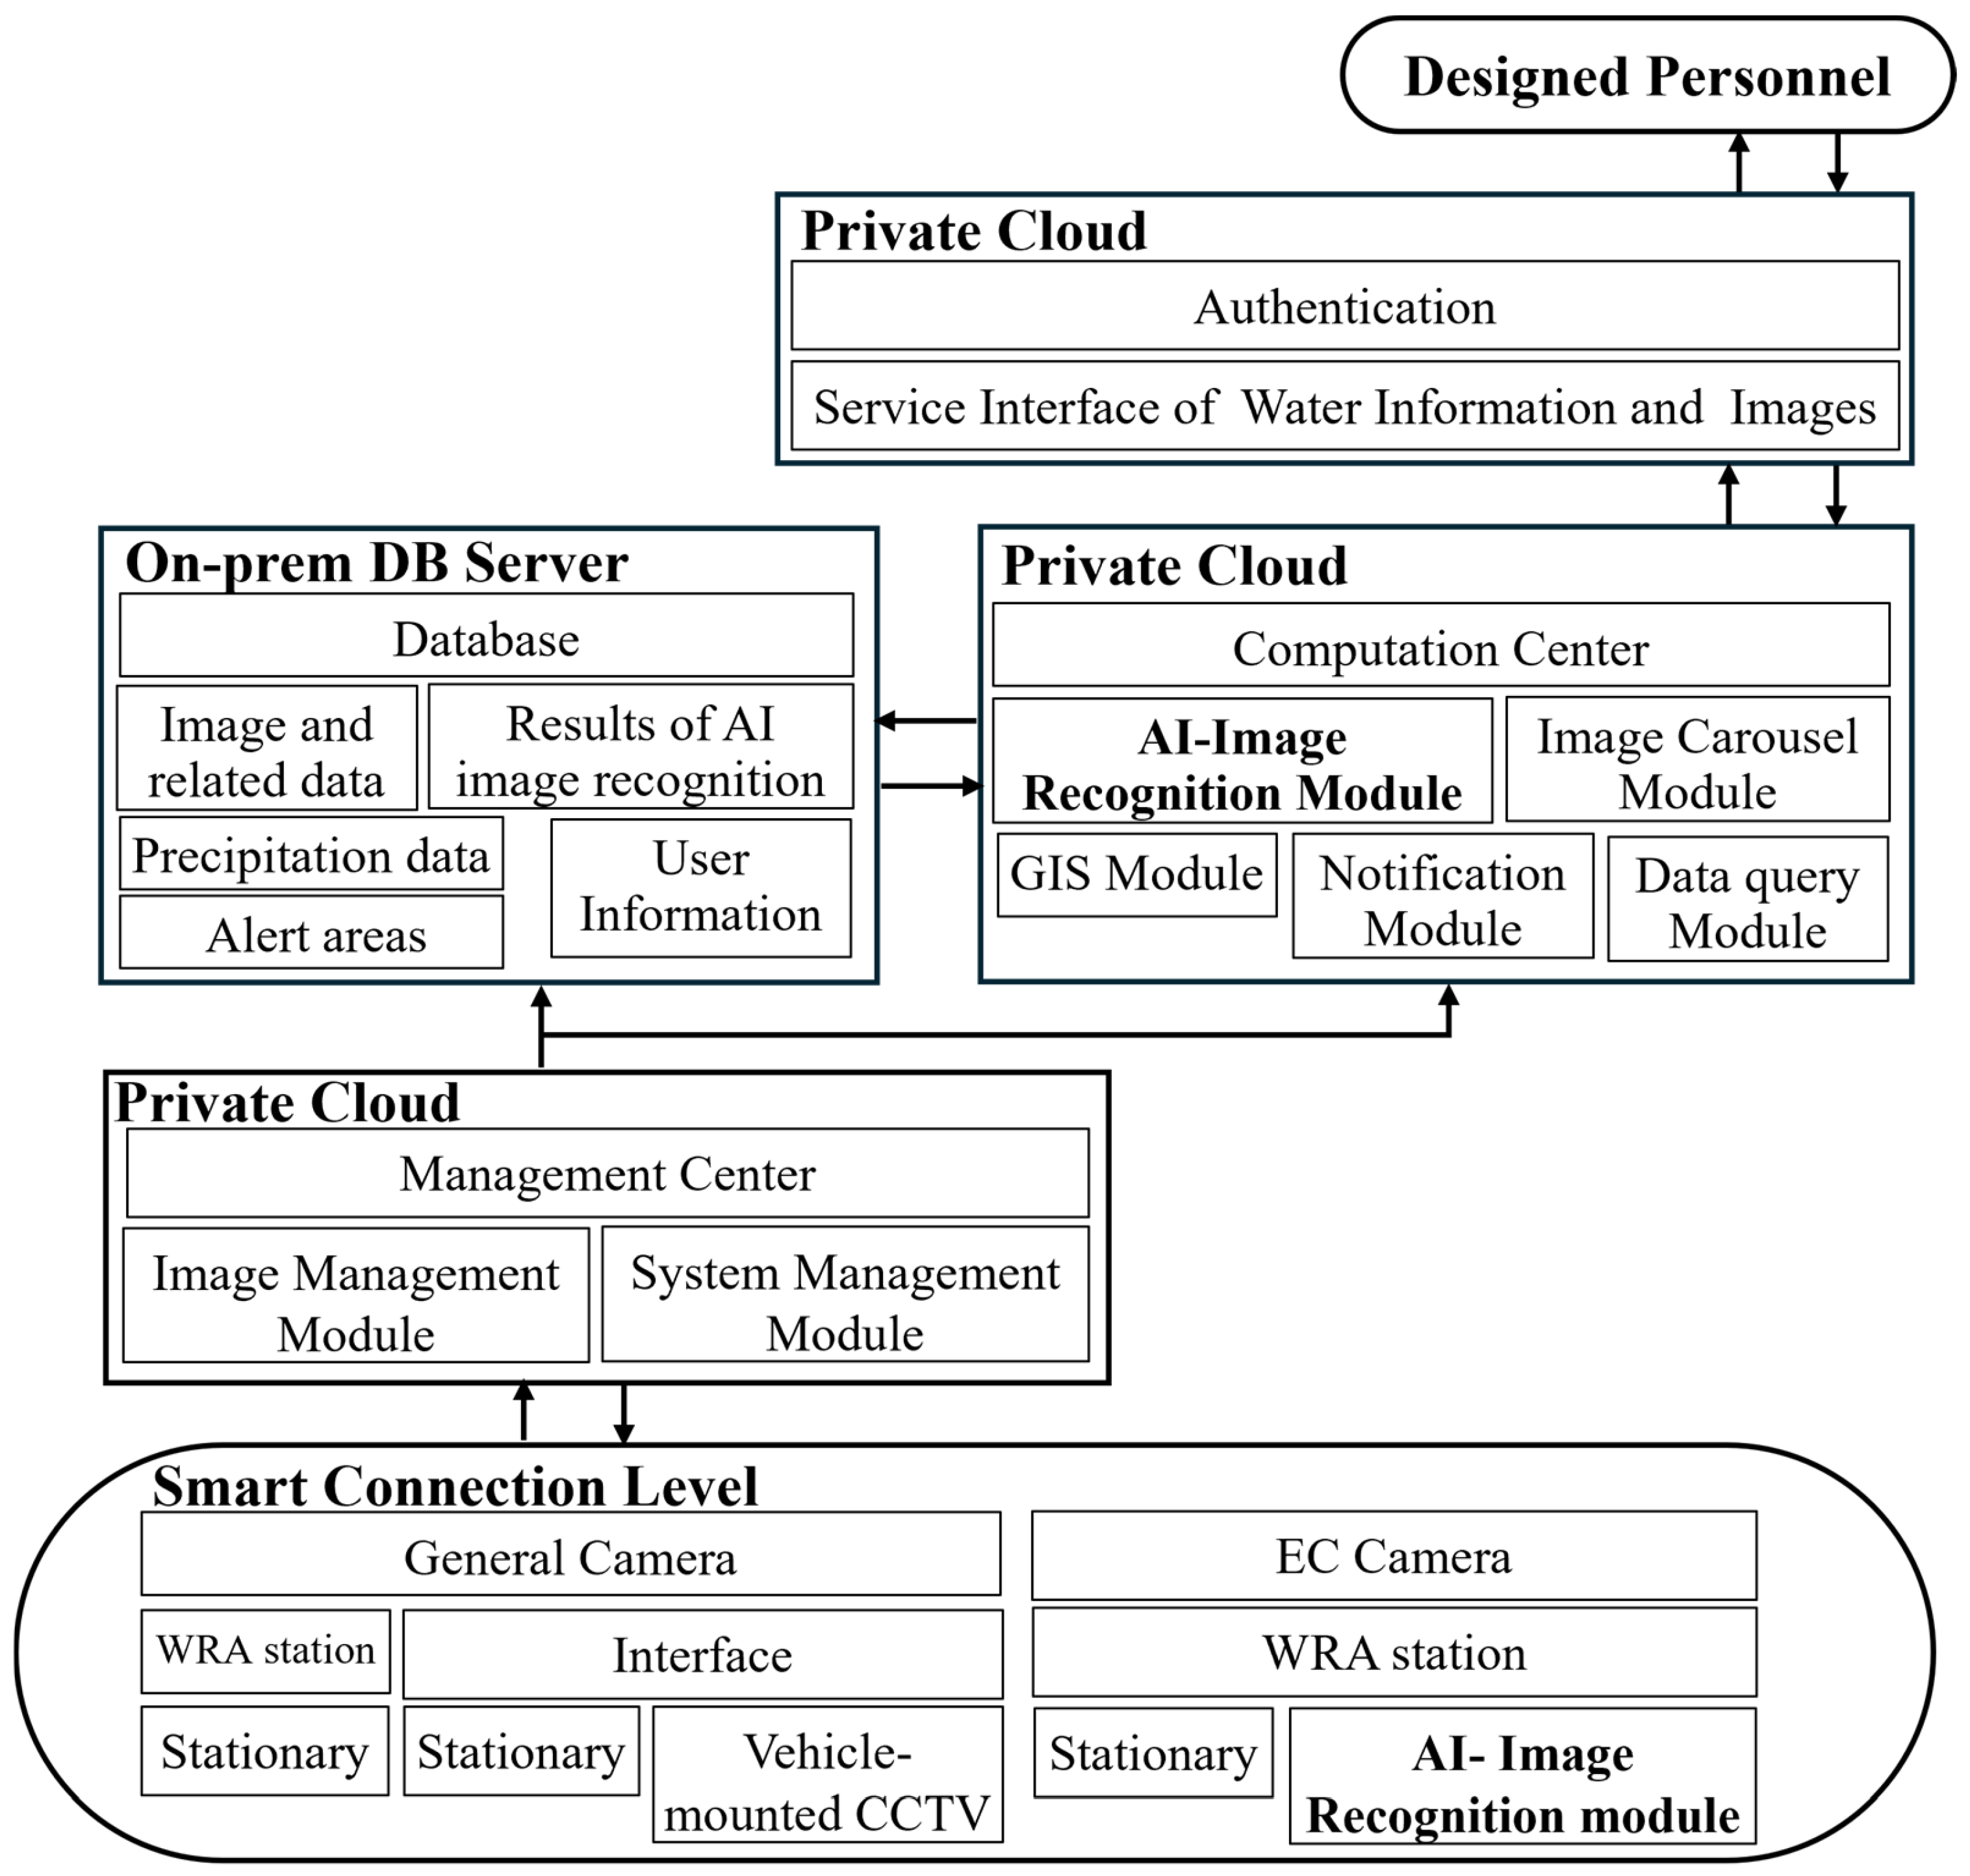
The platform architecture comprises an on-premises database, a management center hosted on a private cloud server, a computation center, and a user-facing service interface. While the on-premises database serves as the repository for all data, the majority of image recognition processing, data integration, and the visualization platform are supported by a cloud computing framework. The hardware configuration for the proposed platform consisted of two distinct environments: a development workstation and a production server. The former, used for model training and optimization, operated on Ubuntu 16.04 LTS with an NVIDIA GeForce RTX 2080 Ti GPU (NVIDIA Corp., Santa Clara, CA, USA). The latter, designated for real-time inference, utilized an NVIDIA Tesla V100 GPU (NVIDIA Corp., Santa Clara, CA, USA) within a server-class architecture to provide the necessary computational throughput for high-performance requirements.
To ensure real-time, low-latency responses and facilitate the future integration of automated control systems, six virtual water level monitoring stations employ an edge computing architecture. Within this edge-based architecture, computational resources are dedicated specifically to the virtual water level module and its AI image recognition functions. The data workflow is depicted in Figure 5.

3. Robust Image Recognition Methodology

3.1. Proprietary Dataset

In response to localized application needs in Taiwan, this study employs a proprietary dataset. Descriptions of the data acquisition, annotation, and storage strategies are provided below.
Data Acquisition and Screening: The training dataset was developed by systematically capturing imagery from the sensing layer via scheduled services and the ffmpeg utility. To ensure the inclusion of relevant hydrologic events, a spatiotemporal cross-referencing strategy was employed, aligning camera locations with precipitation records from the CWA. The resulting dataset was partitioned into diurnal (06:00–17:00) and nocturnal subsets to facilitate the training of time-specific models optimized for varying illumination.
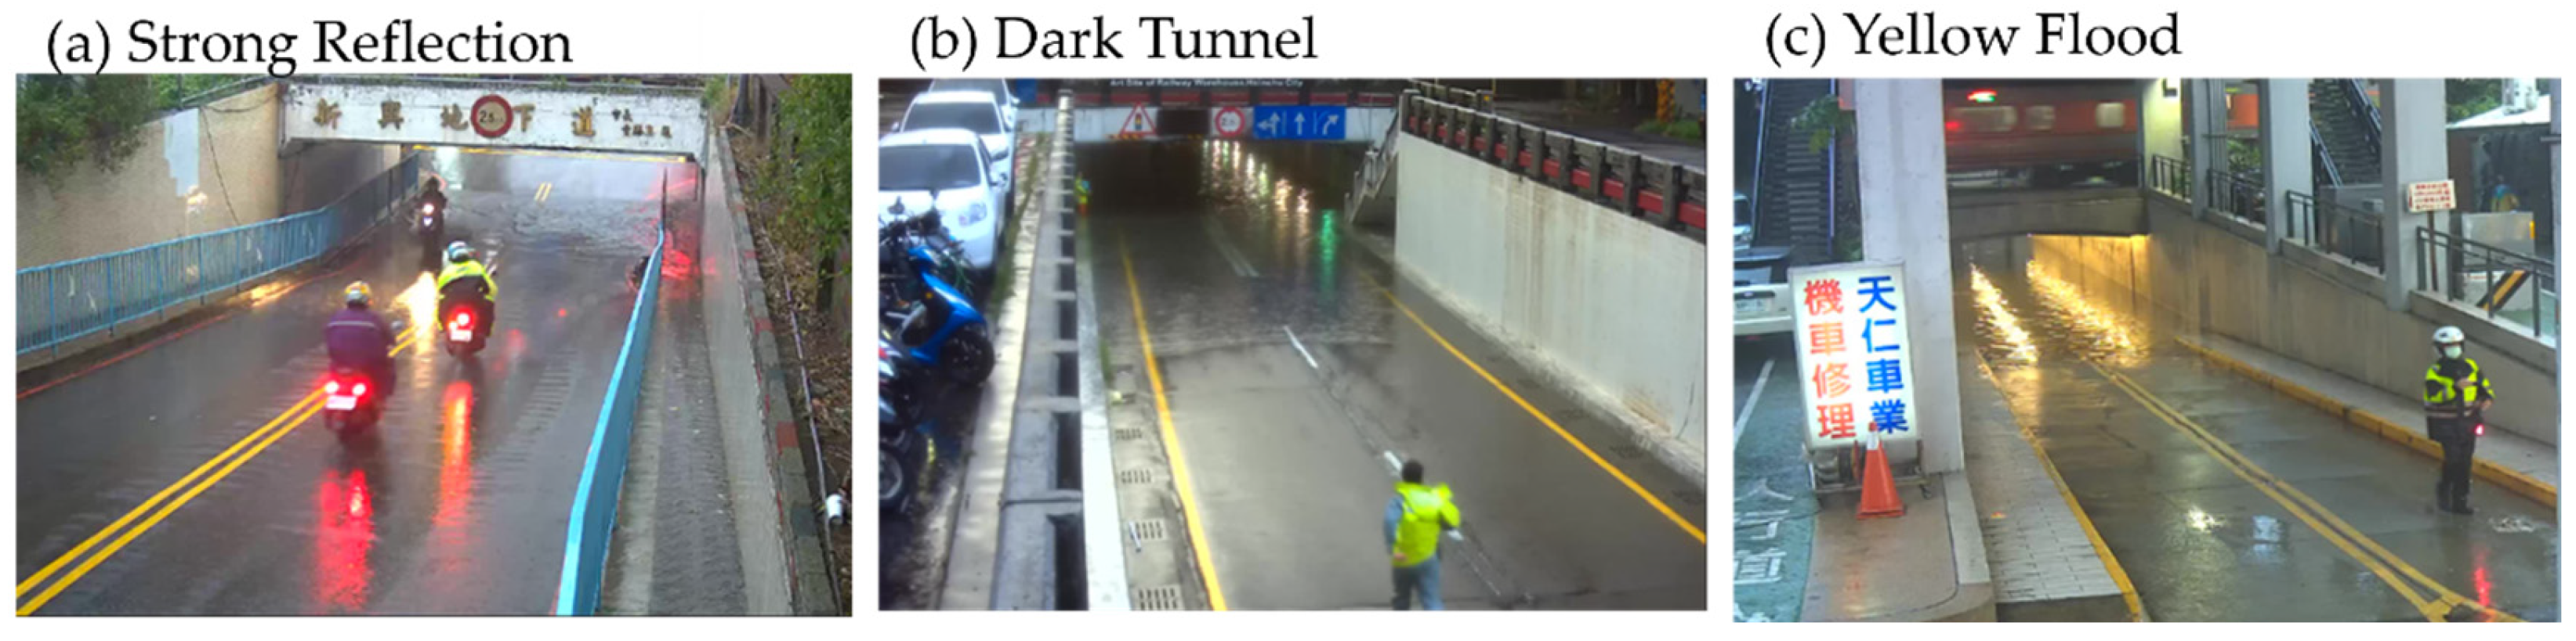
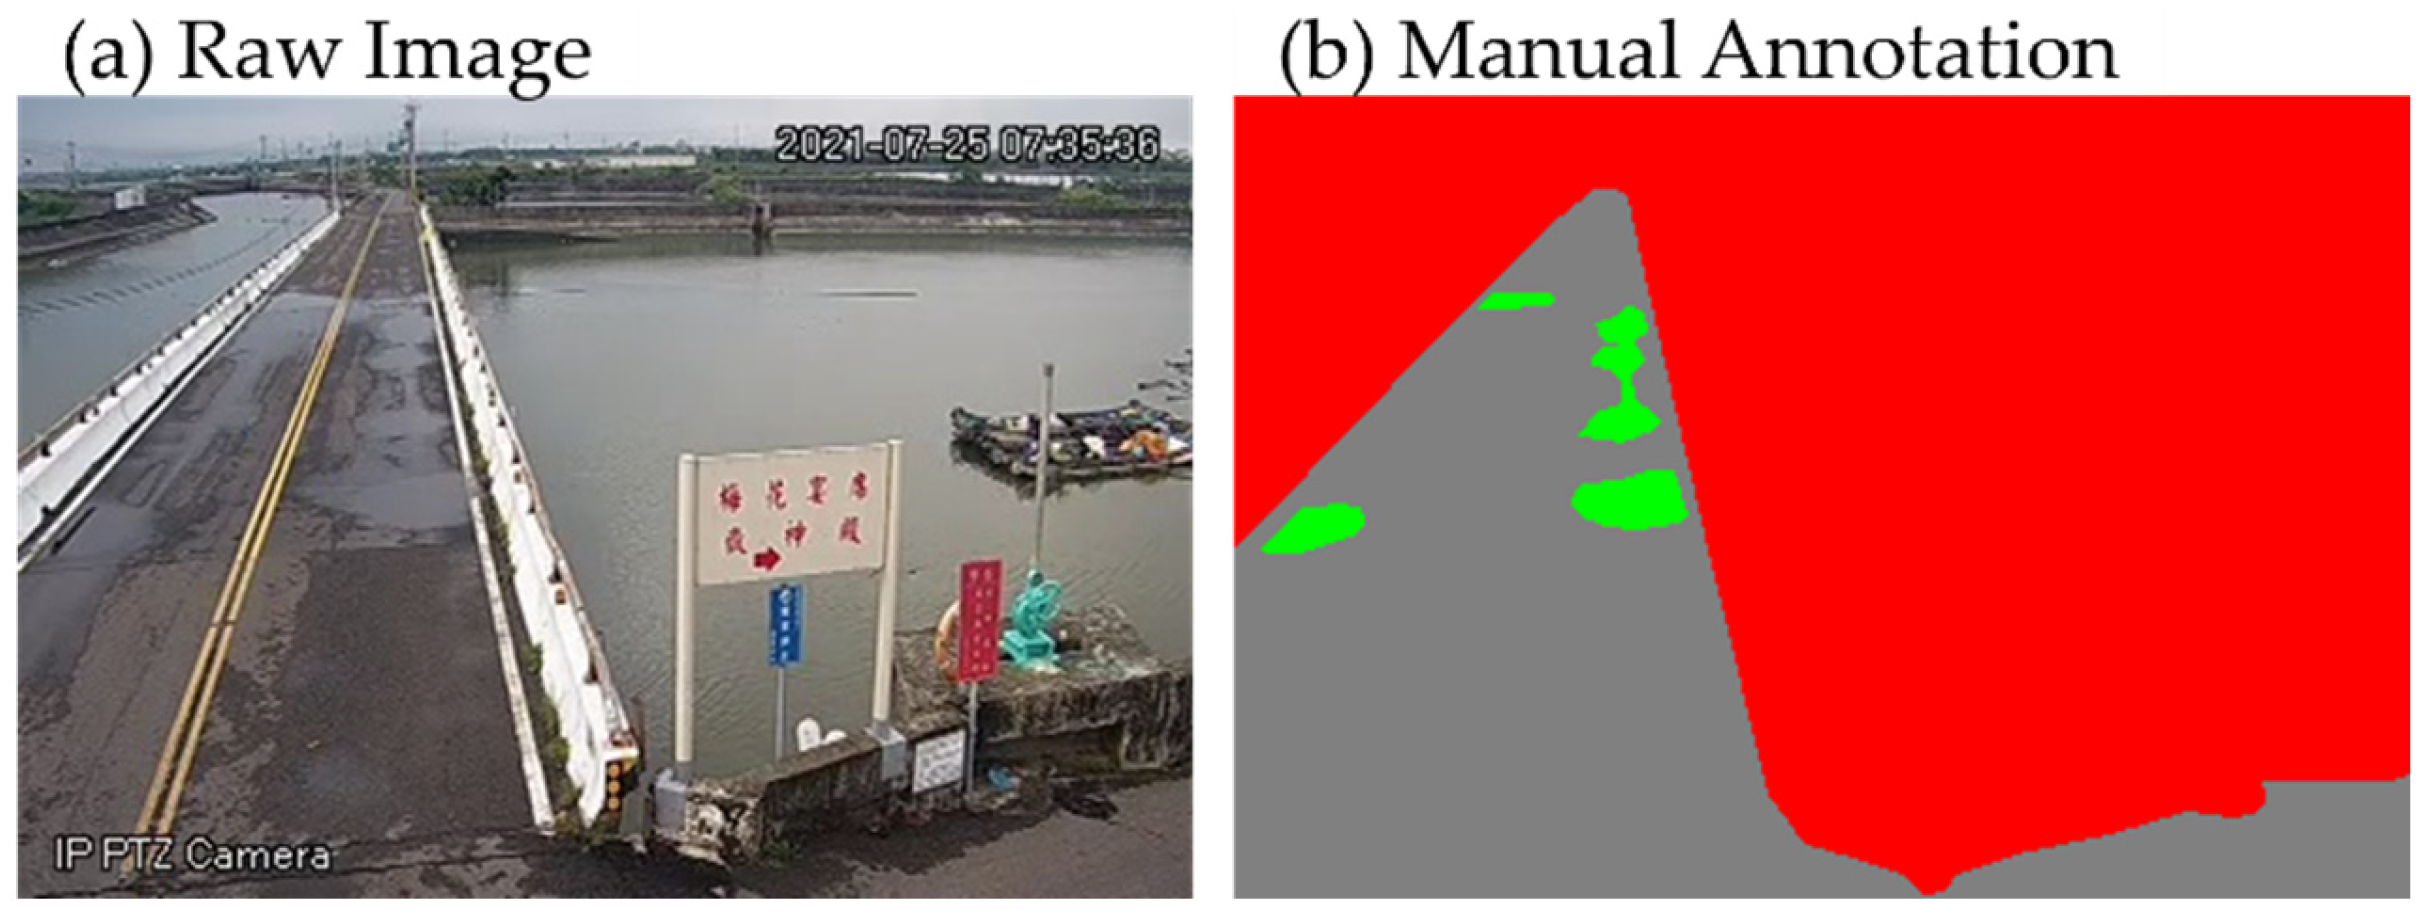
Annotation: Using ImageJ (version 1.53a or higher), approximately 6000 images were manually annotated for tri-class semantic segmentation: BACKGROUND (red), FLOOD (green), and ROAD (gray) (Figure 6). The dataset was partitioned into a 70% training and 30% testing split. To address edge cases where baseline recognition faltered—such as strong specular reflections, dark tunnels, and yellow flood (Figure 7)—a “special note” strategy was utilized. These scenarios underwent targeted data augmentation to iteratively refine model robustness as new samples were collected.
Storage and Compression Strategy: To manage the high-volume data stream, a dual-retention policy was implemented: general imagery is purged after five days, while AI-confirmed inundation events are permanently archived for disaster analysis and dataset expansion. All imagery is stored in JPG format at an 85% quality compression rate. Empirical validation confirms this compression level maintains the requisite resolution for AI recognition while achieving a 90% reduction in storage requirements compared to raw BMP formats.

3.2. Image Segmentation Architectures and Evaluations

To facilitate effective water level estimations, disaster warning, and decision support, this study requires a model capable of high-efficiency, high-precision segmentation of inundation areas while preserving intricate edge details. Within the current landscape of machine learning, object detection and semantic segmentation are primary solutions for image recognition. However, object detection frameworks—such as the widely used YOLOv9 model [13]—typically provide relatively coarse output formats and recognition precision. Furthermore, object detection relies heavily on the relative proportions of reference objects within the environment to identify targets. Given that floodwaters lack a fixed shape and are highly sensitive to environmental lighting variations, semantic segmentation provides a more suitable framework for this application.
Two state-of-the-art semantic segmentation frameworks were selected for comparative evaluation:
HRNetV2+OCR [31]: This framework is distinguished by its ability to perform high-resolution analysis and maintain fine-grained image details. It has demonstrated superior performance in large-scale urban datasets, with recent testing in drainage network environments achieving a mIoU of 95.92% [32].
DeepLabV3+ [33]: This model utilizes Atrous Spatial Pyramid Pooling (ASPP) to capture multi-scale contextual information, providing significant detail by expanding the receptive field of the convolutional kernels. DeepLabV3+ has demonstrated high mIoU scores in the PASCAL-Context urban dataset and has been successfully applied to water body identification in both satellite [34,35] and terrestrial surveillance imagery [14].
The specific architectural configurations and training parameters for all candidate models are detailed in Table 2.
The performance and segmentation efficacy of the candidate models—specifically DeepLabV3+ (configured with Xception71 backbones) and HRNetV2+OCR—are evaluated based on training loss trajectories and testing metrics, including Pixel Accuracy (PA), Mean Pixel Accuracy (MPA), and mIoU. Manually annotated datasets serve as the ground truth for these evaluations. Additionally, models are benchmarked in terms of architectural complexity and computational efficiency, specifically comparing the number of parameters and total training duration. Field validation was conducted to ensure that the proposed methodologies are strictly aligned with the practical requirements of real-world operational scenarios.

3.3. Performance Optimization Solutions

To mitigate discrepancies between model predictions and ground truth in the complex Taiwanese landscape, optimization strategies were implemented across two dimensions: image pre-processing and model enhancement. These processes were developed in Python 3.5 on an Ubuntu 16.04 environment to ensure high generalization across diverse environments.
  • Illumination and Reflection Mitigation: Environmental noise, including low ambient light, overexposure, and reflections from traffic signals or wet surfaces, significantly challenges nocturnal recognition. This was addressed via:
    HSV Pre-processing: An HSV (Hue, Saturation, Value) filter decouples color information from intensity, enhancing the model’s adaptability to non-uniform lighting. The HSV filtering algorithm for image preprocessing was developed in-house using Python 3.5 in conjunction with the OpenCV library (version 3.4.2).
    Targeted Augmentation: Problematic images underwent contrast and saturation adjustments, including horizontal flipping and color/lighting normalization, before reintegration into the training pipeline to improve illumination invariance. The data augmentation pipeline was developed in-house using Python 3.5 in conjunction with the OpenCV library (version 3.4.2).
  • Advanced Image Restoration: To resolve quality degradation caused by lens water droplets, fog, or mechanical vibrations, a Deblur GAN architecture [36] was integrated into the pre-processing workflow. This provides a robust solution for restoring clarity across various types of blur.
  • Temporal Adaptive Modeling: Given the visual contrast between day and night, independent diurnal and nocturnal models are utilized. The system executes an automated model switch at 06:00 and 17:00 to maintain optimal detection accuracy throughout the 24 h cycle.
  • Attentive Feature Recalibration: To prevent fragmented segmentation in urban environments, an attentive-recurrent network [37] was implemented. This mechanism utilizes a lightweight parallel architecture to recalibrate features, effectively prioritizing inundation (FLOOD) signals while suppressing background interference.
Following these pre-processing and optimization steps, all input imagery is standardized to a resolution of 1024 × 576 via a serial processing program to maintain high operational throughput and consistent model performance.

3.4. Application and Optimization in Virtual Water Level Gauge

Virtual Water Level Gauges (VWLGs) leverage the high-precision boundary-delineation capabilities of semantic segmentation to identify water surface edges. Currently, physical staff gauges and virtual monitoring counterparts have been established at six critical bridge locations (Figure 1) susceptible to overflow disasters, with each site equipped with a radar-based sensor or a piezoresistive level probe to facilitate robust cross-calibration.
The computational and communication workflows for these six VWLGs are implemented via an edge computing approach. The primary advantage of this approach is the significant reduction in recognition latency, ensuring near real-time response. Furthermore, the approach maintains monitoring continuity: in the event of intermittent network interruptions, especially during disaster response events, the cameras continue localized recognition and data logging, with the accumulated information automatically backfilled once connectivity is restored.

4. Results

4.1. Results of Loss Function, PA, MPA, and mIoU

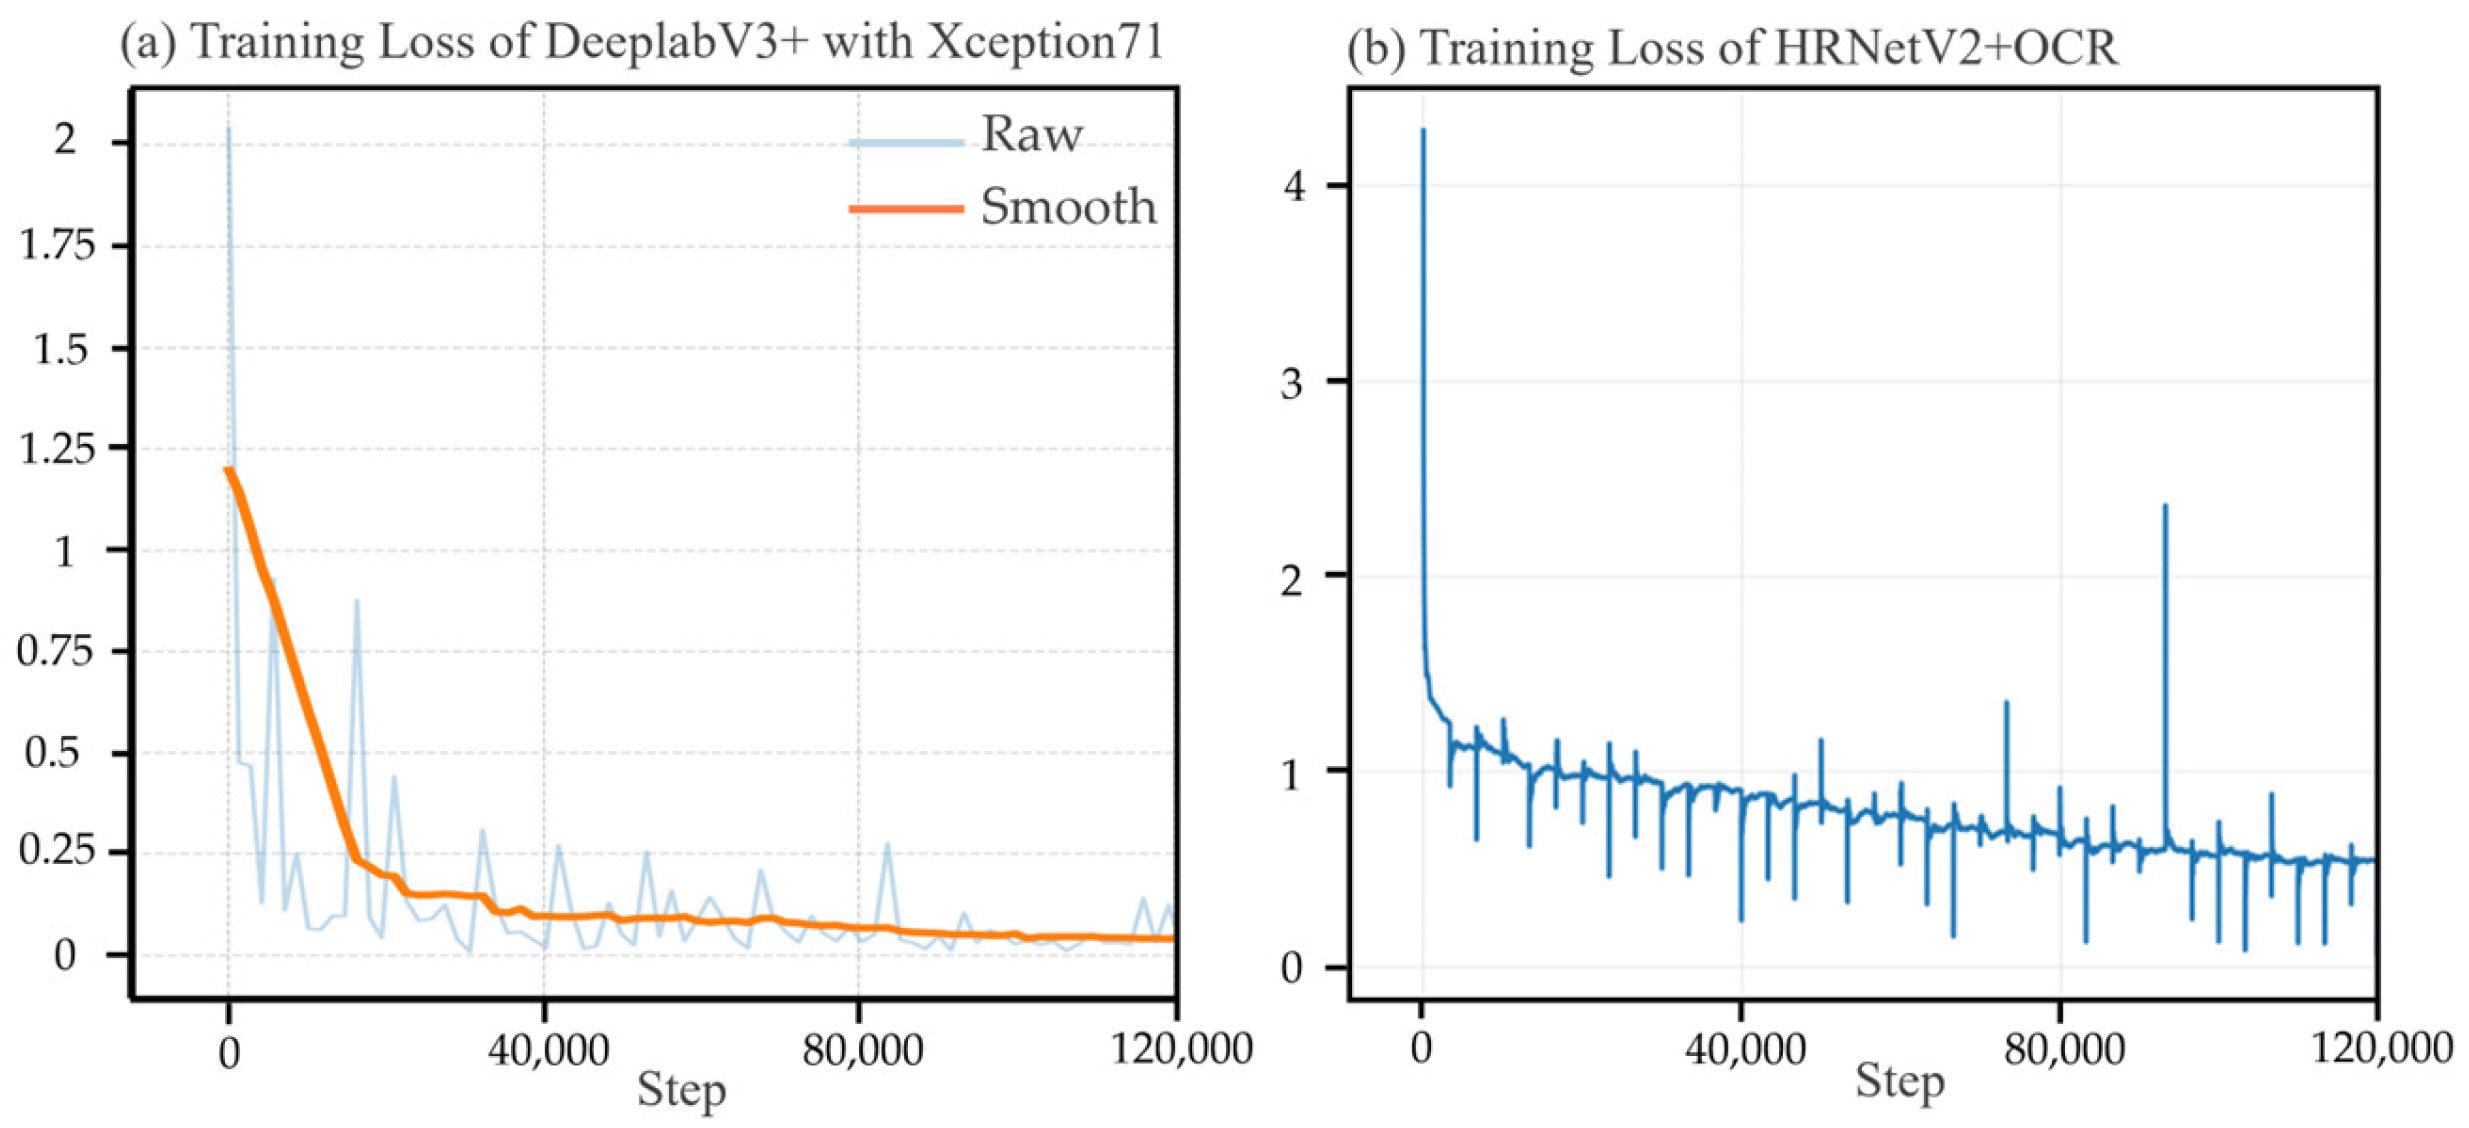
Observations of the loss function dynamics indicate that after 120,000 training steps, the DeepLabV3+ model achieved convergence with a loss value below 0.25 (Figure 8a). In contrast, the loss for the HRNetV2+OCR model remained at approximately 0.5 (Figure 8b), suggesting that the HRNetV2+OCR architecture requires more iterations to attain sufficient precision for training. Furthermore, HRNetV2+OCR required five times the computational time for training and inference compared to the DeepLabV3+ model (Table 3).
Performance benchmarking using the test dataset revealed that although DeepLabV3+ with the Xception71 backbone utilizes fewer parameters than HRNetV2+OCR (Table 3), it delivered superior recognition accuracy (Table 4). Specifically, this configuration attained higher PA, MPA, and mIoU for the FLOOD category, while also performing well in the ROAD and combined FLOOD+ROAD classes. Regarding computational efficiency, DeepLabV3+ with Xception71 demonstrated lower training and inference latencies while achieving higher scores across all evaluation metrics.
Although HRNetV2+OCR employs a higher number of parameters and is based on a superpixel-based graph representation intended for fine-grained segmentation through multiple iterations, its architecture proved less effective for the specific requirements of this study. Despite the limited number of categories, high-fidelity edge details were critical in this study; HRNetV2+OCR requires more iterations to generate these fine details within this framework. Conversely, DeepLabV3+ exhibited a faster convergence rate and superior learning efficiency on the proprietary dataset, attaining higher overall accuracy. Based on these performance indicators, DeepLabV3+ with Xception71 was selected as the optimal segmentation tool for inundation boundary capture in the automated monitoring workflow.

4.2. Effectiveness of Recognition Performance Enhancement Strategies

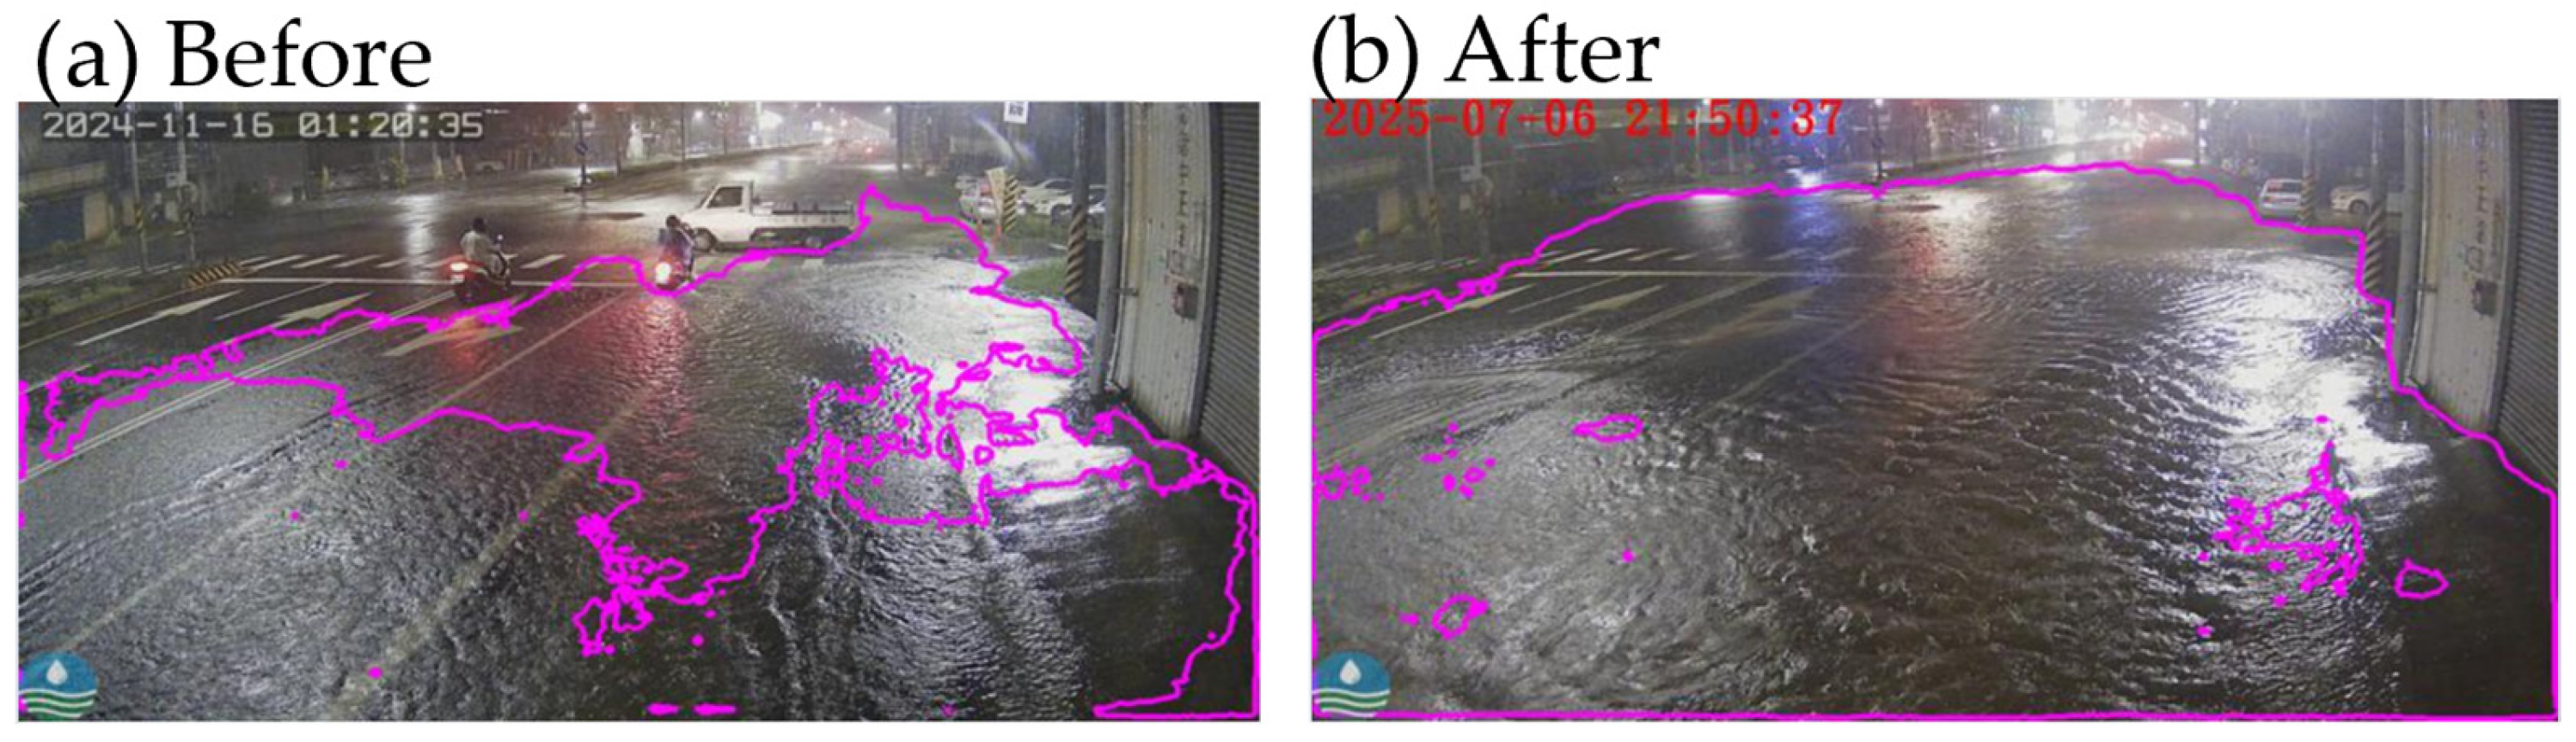
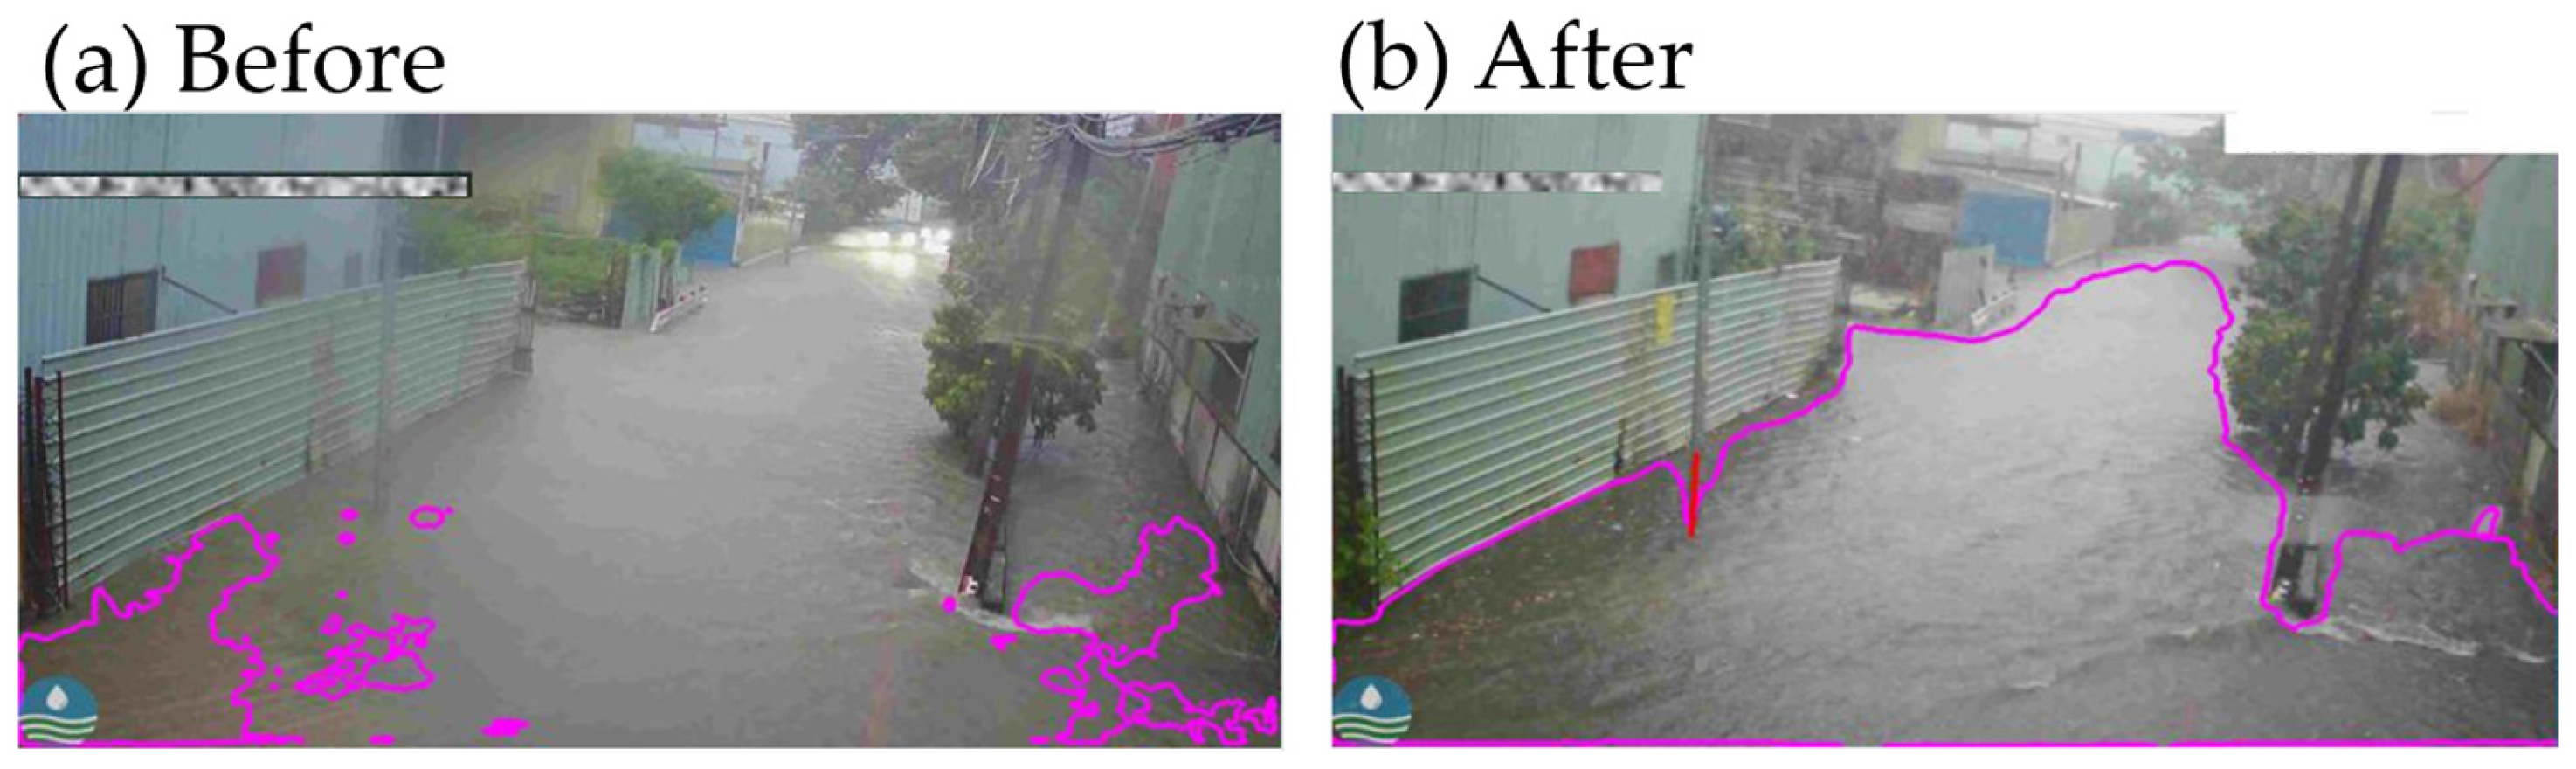
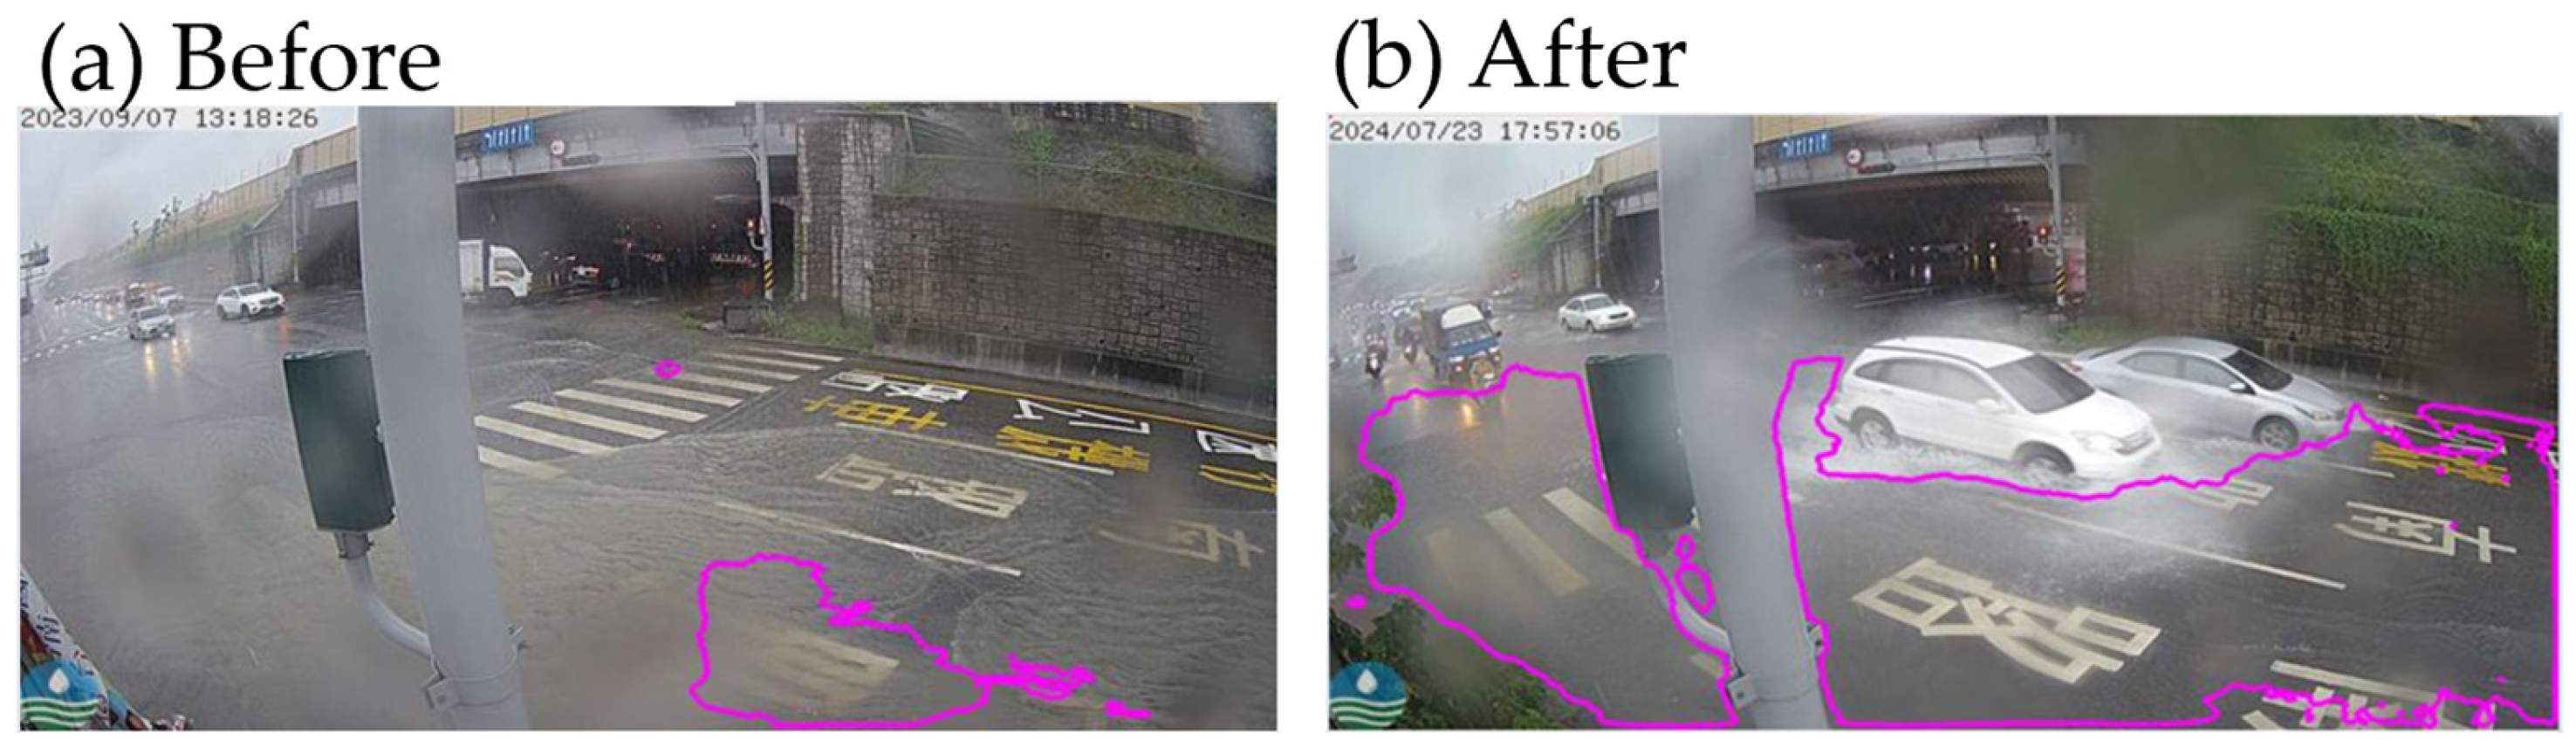
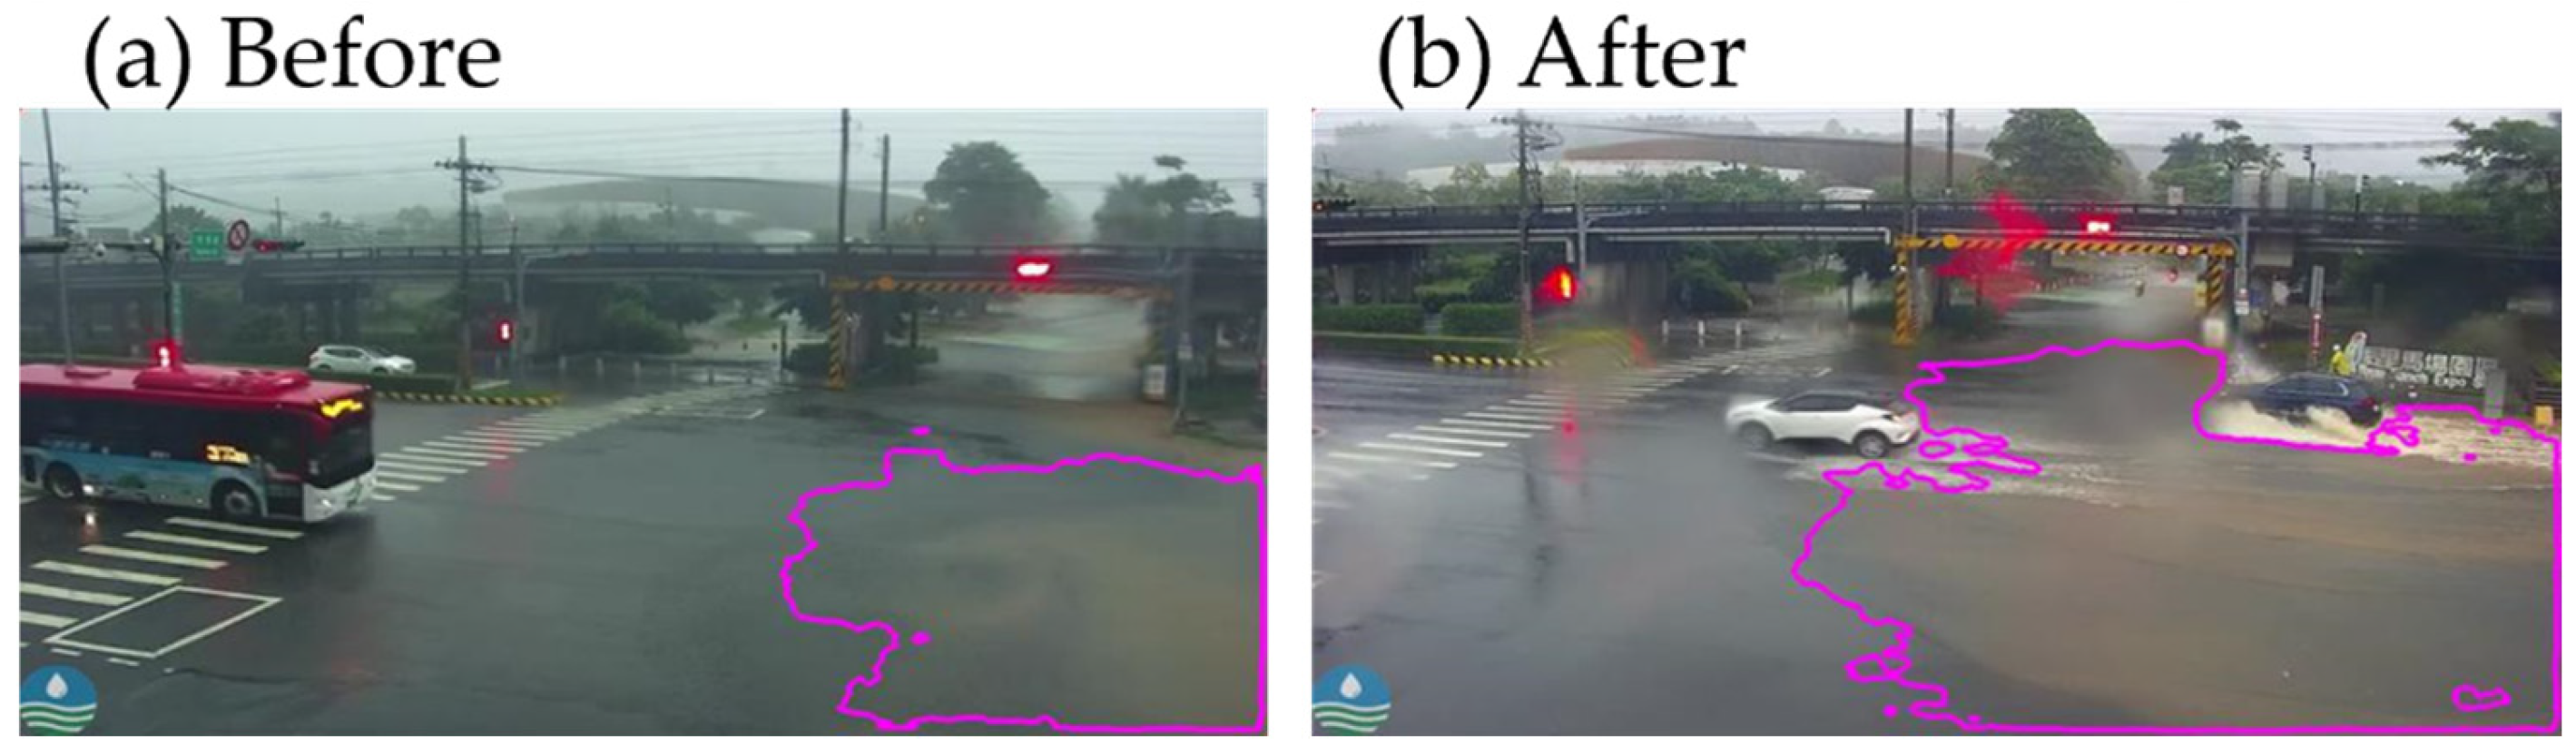
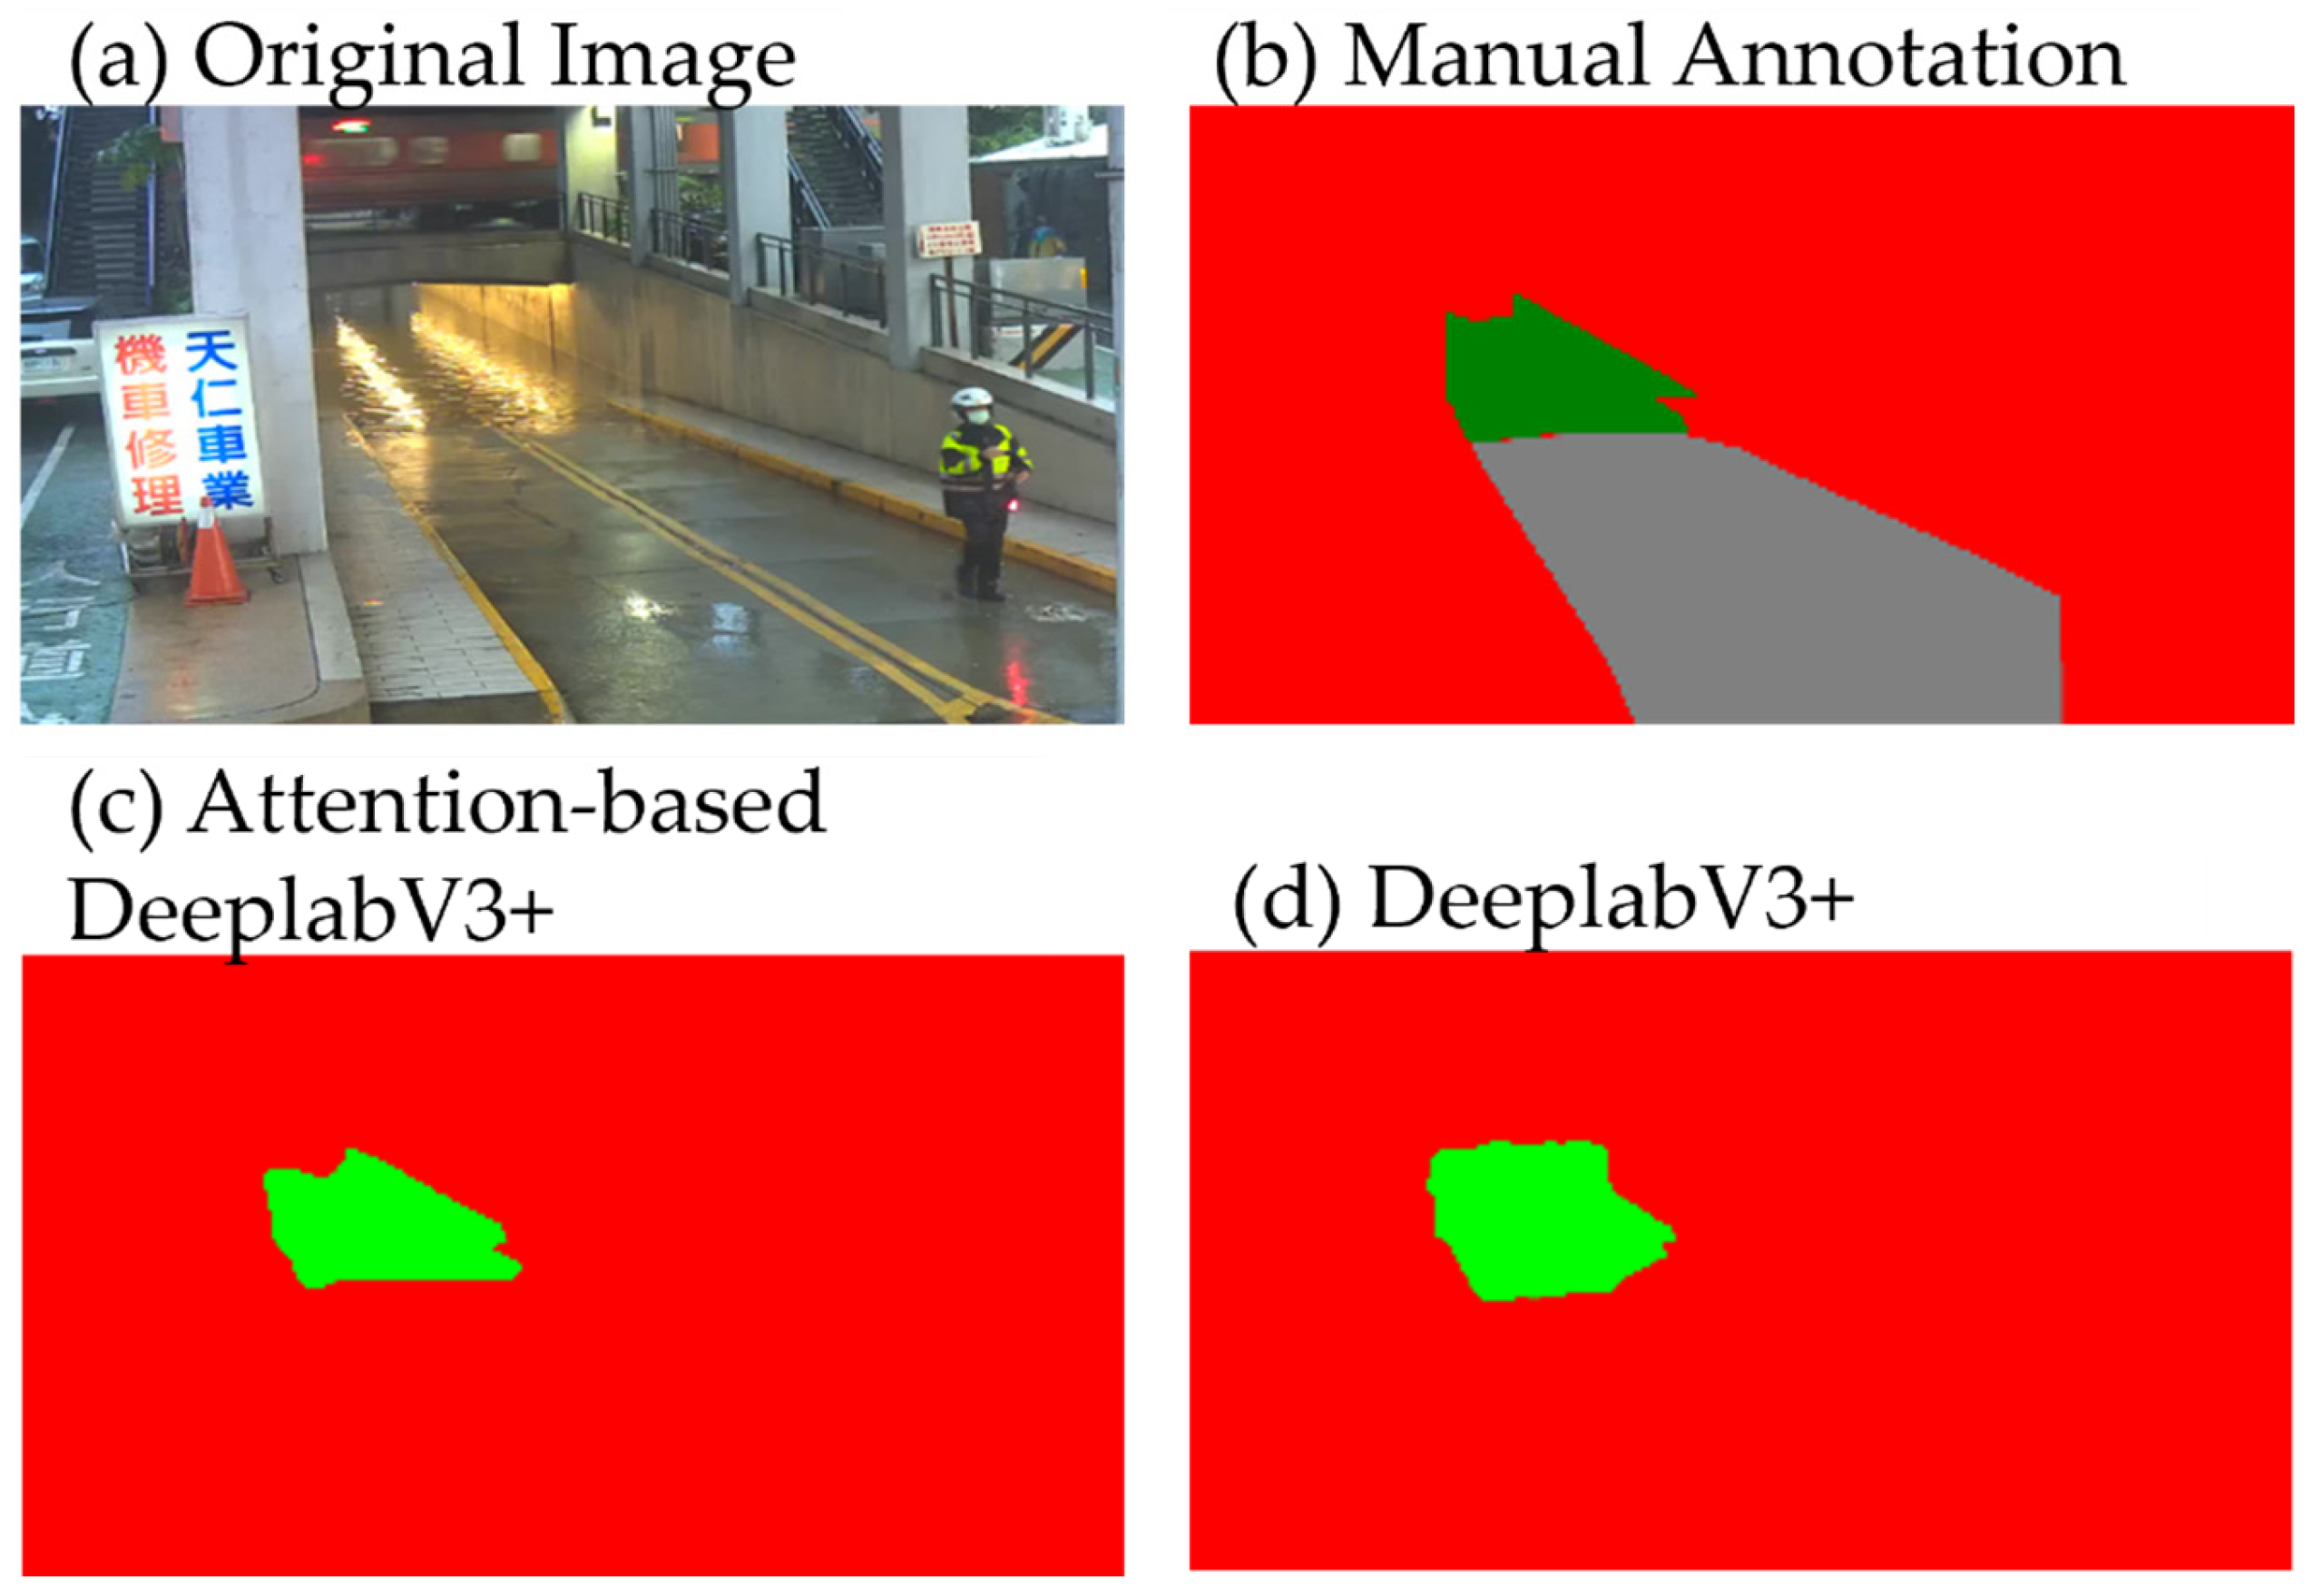
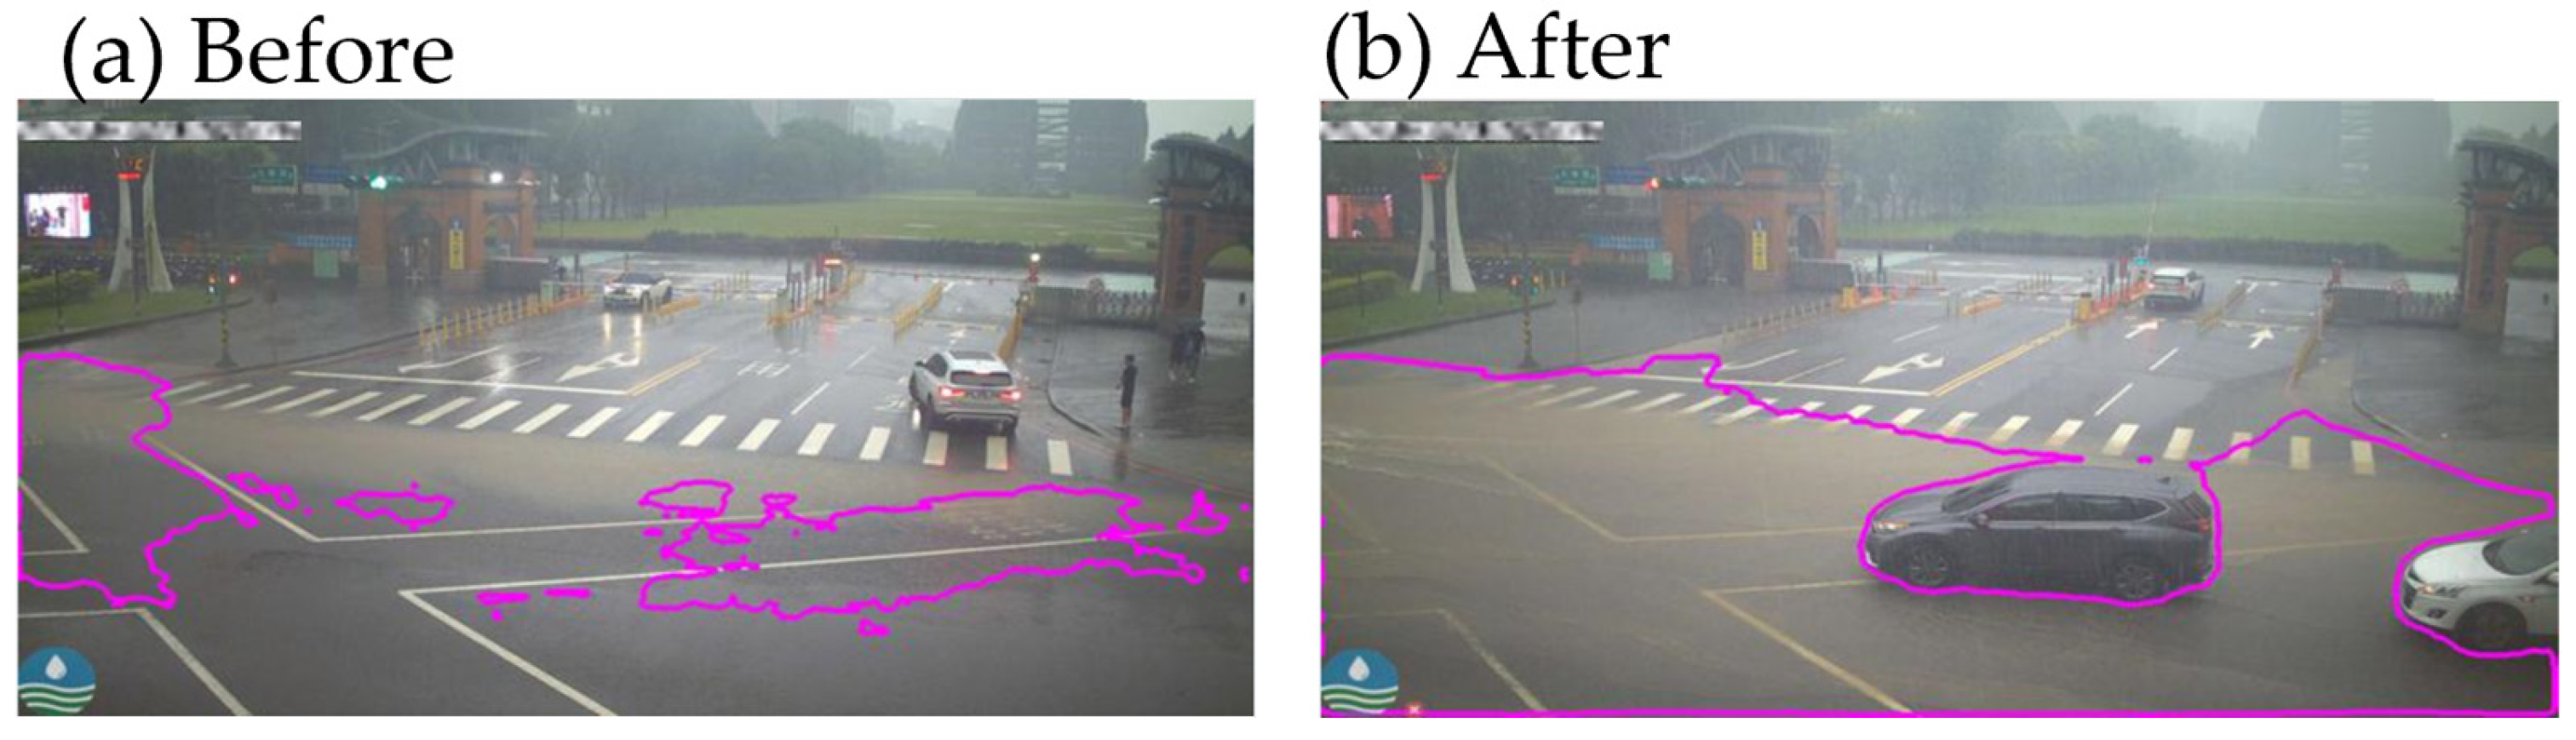
To enhance recognition performance, this study integrated several optimization strategies, including the incorporation of a Deblur GAN architecture and HSV color space filters within the image pre-processing stage, the implementation of an attention mechanism, and the inclusion of augmented problematic images into the training dataset while utilizing distinct diurnal and nocturnal models. These measures improved the module’s recognition capabilities under low-light conditions and strong reflections at night (Figure 9). For scenarios involving equipment vibration, fog (Figure 10), or image blur and light refraction caused by water droplets on the lens (Figure 11), the proposed solutions mitigated interference and enabled the segmentation of inundated areas. Furthermore, the application of HSV color space filters addressed the issue of incomplete segmentation in environments characterized by low illumination, high reflectivity, and multi-colored light sources, such as traffic signals, vehicle headlights, and neon signs (Figure 12). The integration of the attention mechanism allowed the model to delineate flood boundaries with higher precision, closely aligning with the human-annotated ground truth (Figure 13). Overall, the transition from the baseline model to the optimized workflow resulted in a substantial improvement in segmentation quality; whereas the original model often produced fragmented and incomplete results, the refined system successfully identifies the full extent of inundation even in low-visibility environments (Figure 14).

5. Validation and Discussion

5.1. Field Validation

This section presents a comparative analysis of short-duration, high-intensity rainfall events recorded at the same location in 2020 and 2025. This research assesses the efficacy of flood mitigation enhancements by integrating multi-modal data streams, including precipitation records, piezoresistive level probe measurements, and automated recognition outputs from the Water Image Monitoring Platform. By synthesizing these heterogeneous datasets, the study characterizes the spatiotemporal inundation dynamics surrounding the 2022 completion of drainage culverts and the pumping station. This longitudinal analysis highlights how these critical structural improvements facilitated a strategic transition toward a fully integrated Cyber-Physical System (CPS), enhancing both localized resilience and real-time situational awareness.
Kanding Road in Zhongli District, Taoyuan City, is a documented flood-prone area (triangle in Figure 1). This site is equipped with a surveillance camera from the Water Image Monitoring Platform, as well as the precipitation station and the piezoresistive level probe (KELLER, Series 26Y) installed by the Department of Water Resources, Taoyuan City. This longitudinal dataset provides an empirical basis for assessing the long-term impact of structural drainage improvements on localized flood resilience.
The study site is a high-density residential and commercial zone that serves as a vital transportation artery for multiple educational institutions, small-scale workshops, factories, and critical greenhouse agricultural lands. Given the demand for public commuting, industrial logistics, and agricultural transport, there is a critical need for high-fidelity situational awareness in this area. The comparative records for both sensing methodologies during this sudden, short-duration, intense rainfall event are analyzed in Figure 15 and Figure 16.
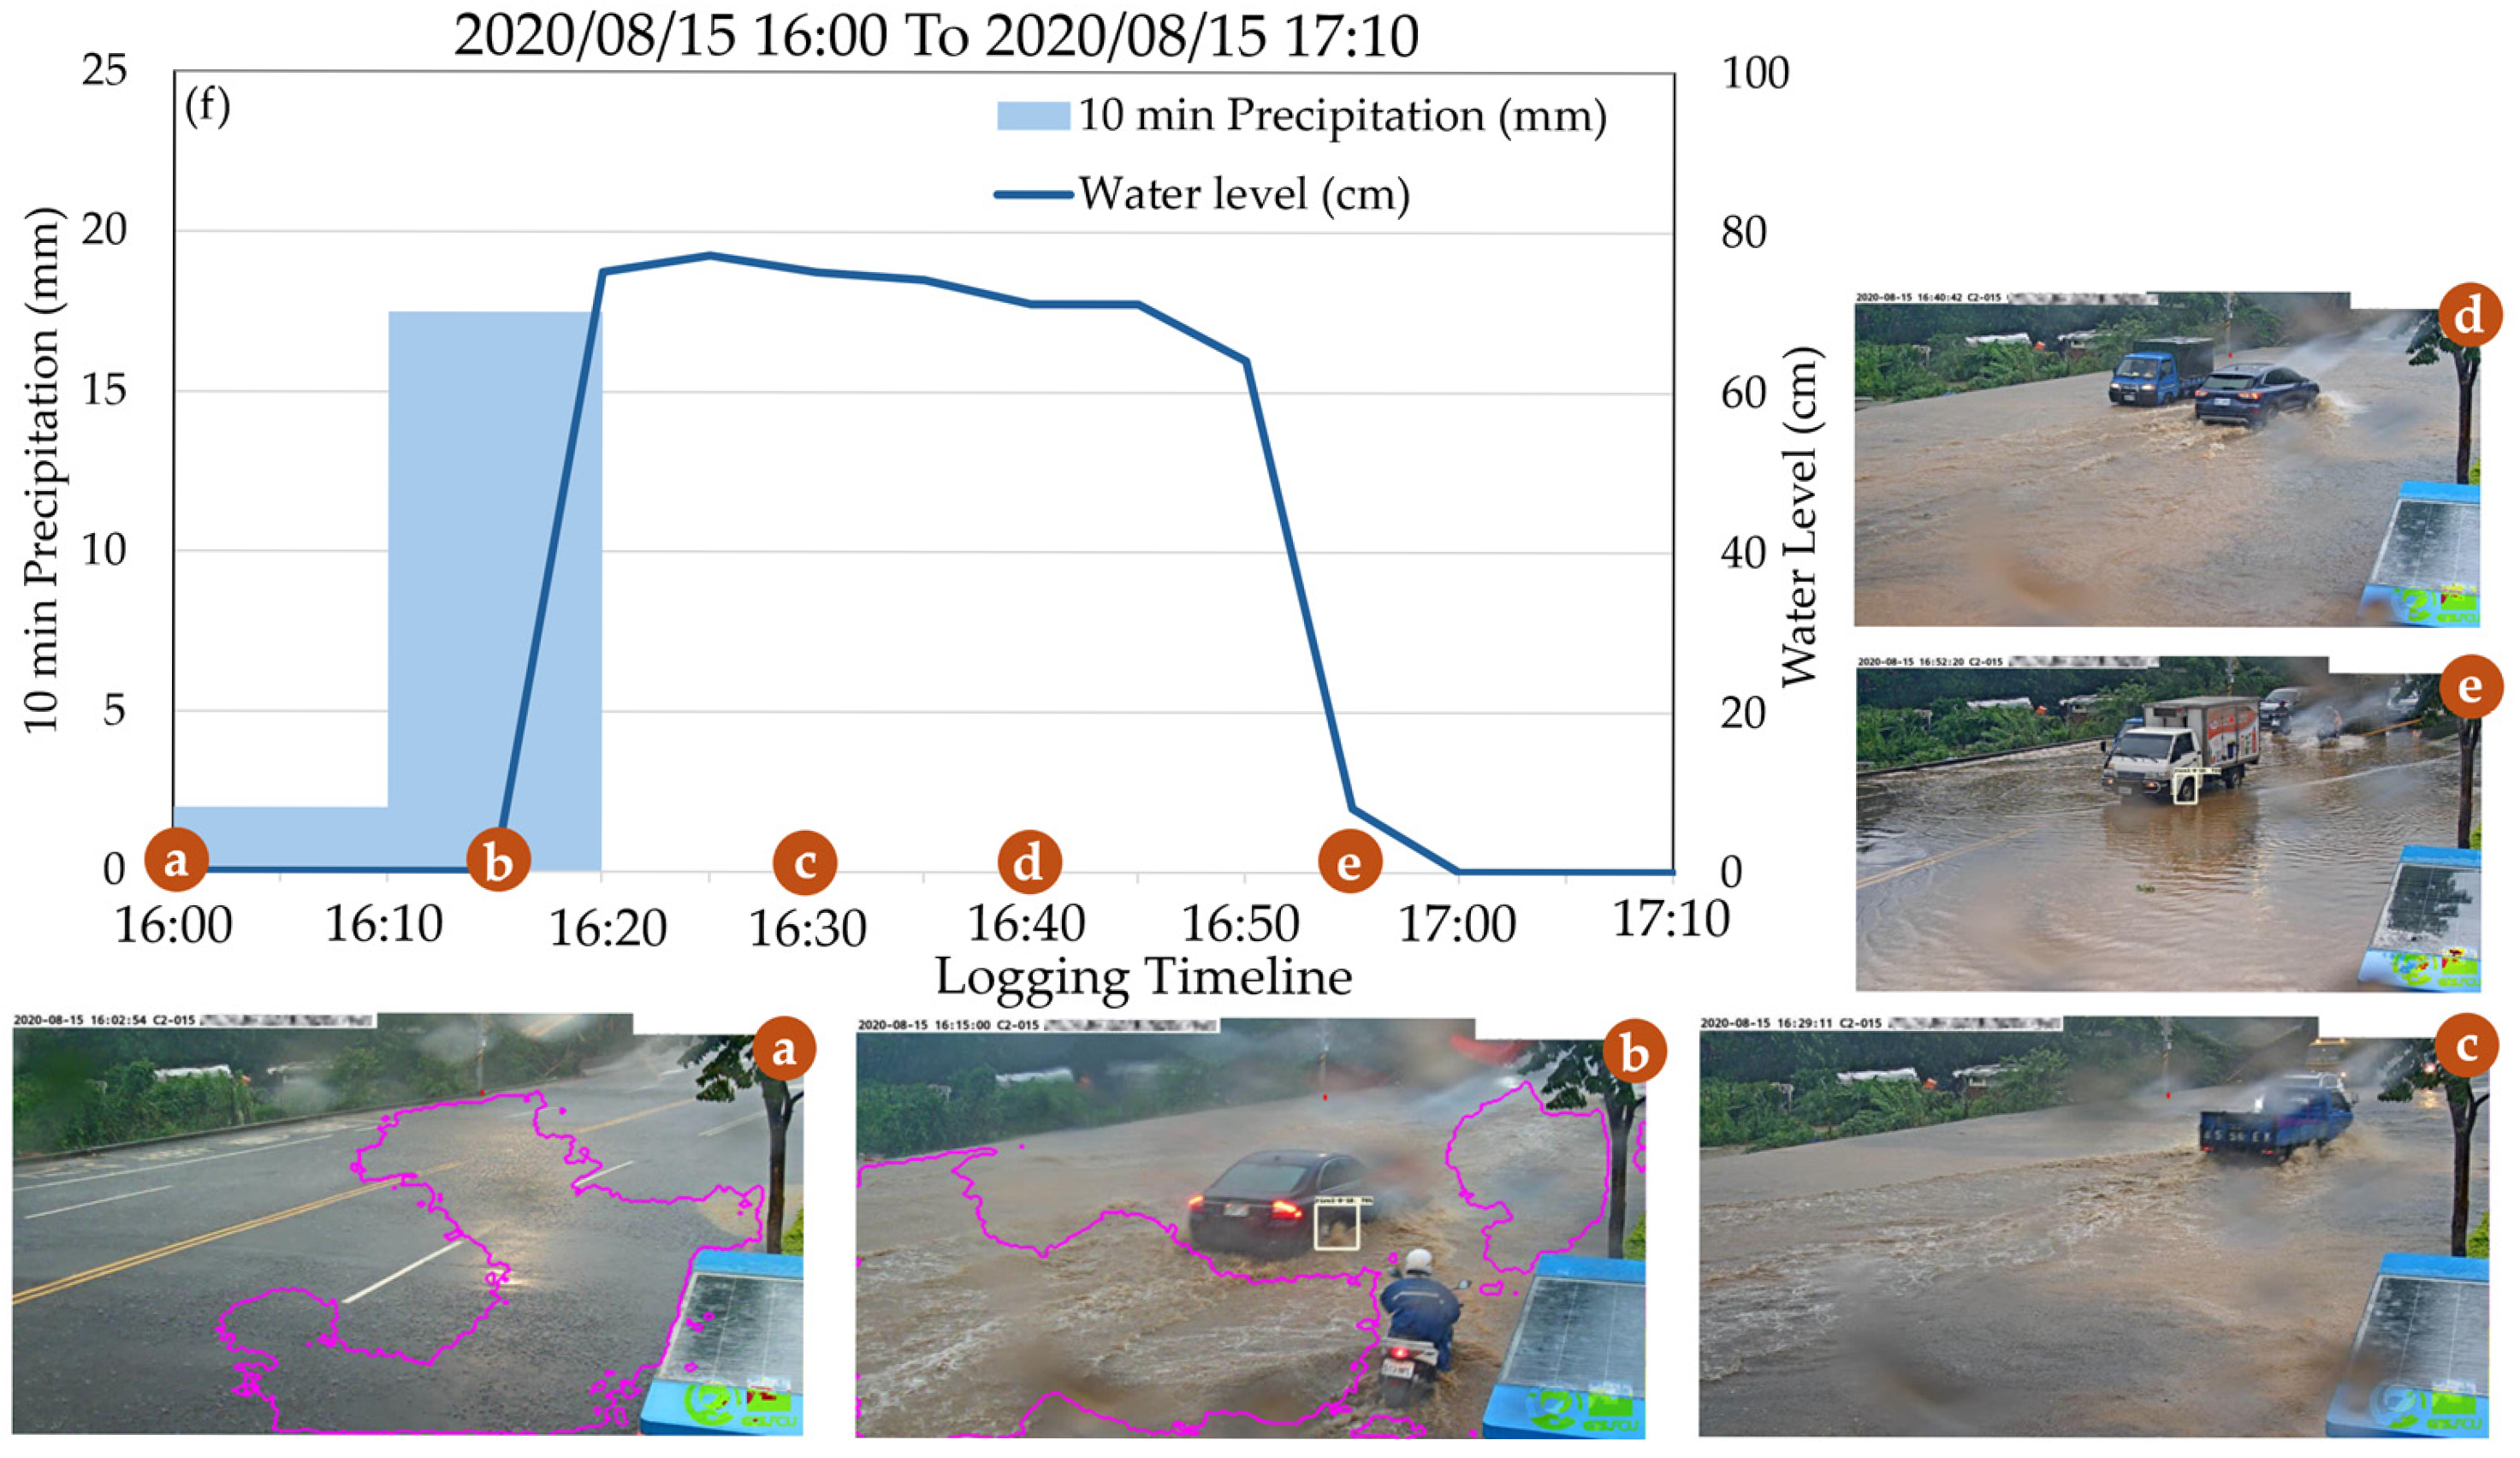
On 15 August 2020, a short-duration intense rainfall event was recorded, with the corresponding precipitation and water level data visualized in Figure 15. The piezoresistive level probe issued its initial inundation alert at 16:20, recording a water level of 75 cm. Subsequently, the sensor performed detection and reporting at five-minute intervals as the floodwaters receded, with the final alert transmitted at 16:55. Visual analysis from the 2020 event underscores the high-risk nature of even short-duration intense rainfall when monitoring or response are absent or delayed. As shown in the imagery, water levels reaching 75 cm severely obstructed mobility and elevated transit risks. Vehicles and motorcycles traversing the flooded segments generated significant splashes sufficient to submerge tires, posing immediate risks of mechanical damage and endangering pedestrian safety. Simultaneously, the Water Image Monitoring Platform successfully identified the inundation area and issued its first notification at 16:02 (Time Point a in Figure 15). Ten minutes later, at 16:12 (Time Point b in Figure 15), the platform maintained its identification of the flooded zone and continued to issue automated alerts.
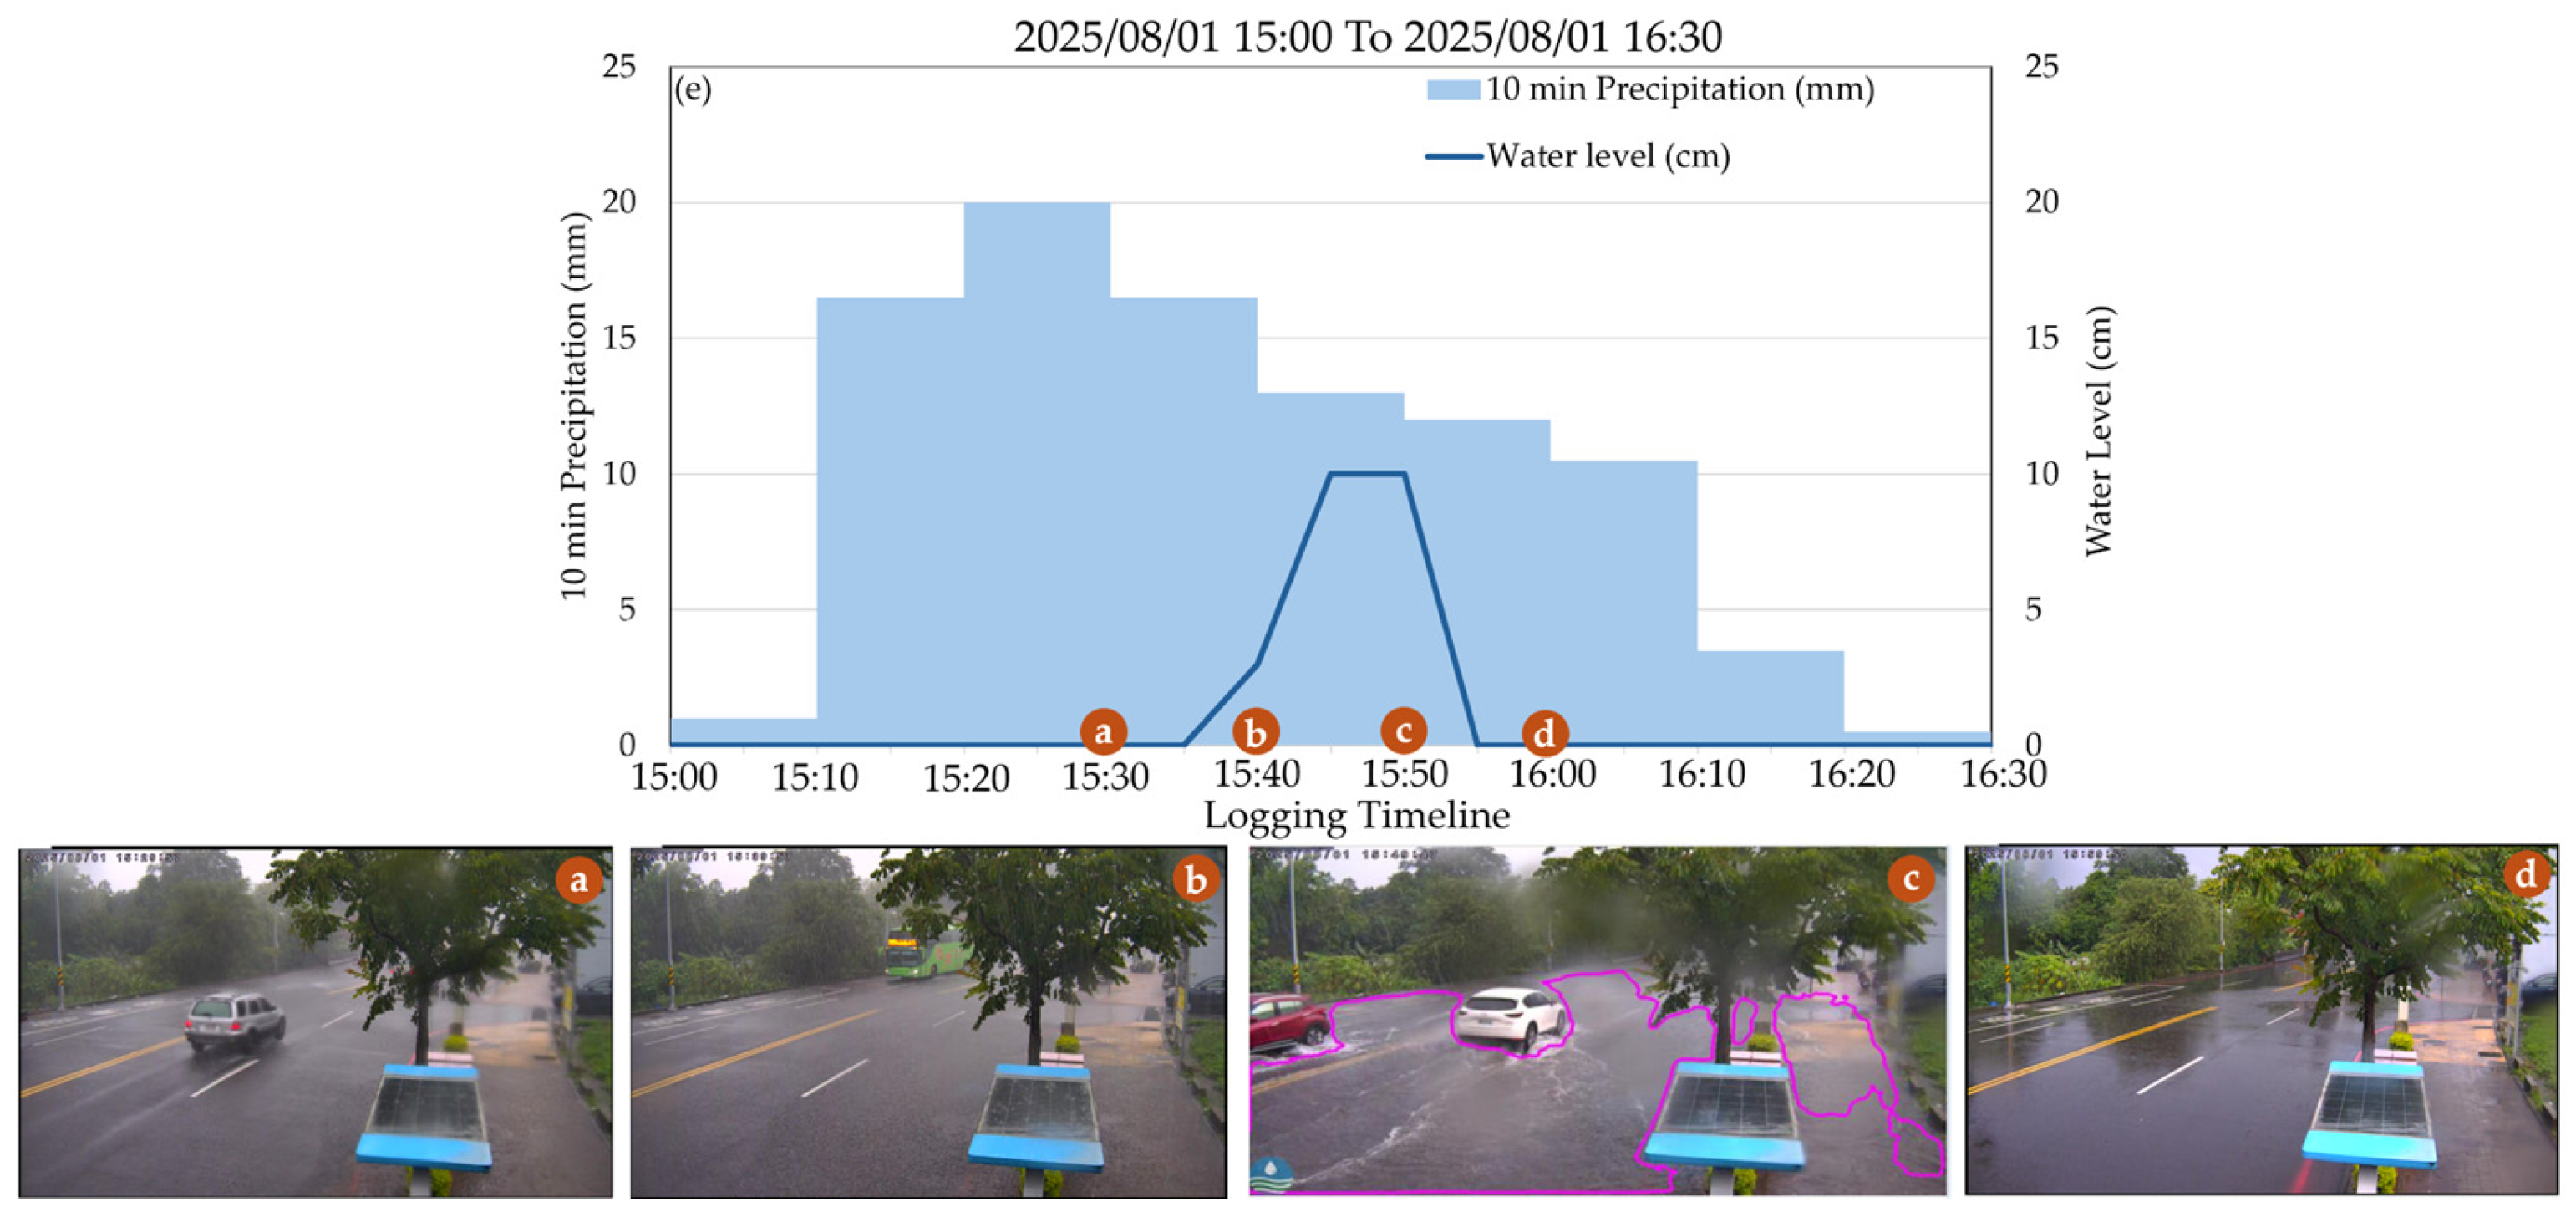
During the inundation event on 1 August 2025, the maximum flood depth was successfully constrained to only 10 cm (Figure 16). The Water Image Monitoring Platform accurately identified the emerging inundation and issued an automated alert, which enabled emergency personnel to promptly activate pumping systems. Consequently, the standing water receded within 20 min.
A comparative analysis of these two events highlights the significant advancements in localized flood resilience achieved through the CPS architecture. In the 2020 incident, although the platform provided an 18-min lead time over the piezoresistive level probe, complete recession of the floodwaters required nearly an hour. Notably, the precipitation intensity in the 2025 event exceeded that of 2020; however, the maximum inundation depth was substantially reduced to 10 cm. This improved outcome is attributed to the synergistic integration of upgraded structural drainage, enhanced personnel SOPs, and the platform’s proactive alerting capabilities.
The operational performance of the Water Image Monitoring Platform has exhibited a marked upward trend. Validated against official records from the WRA and citizen reports, the Platform’s event recall rate has increased from approximately 88% in 2022 to an exceptional 99.7% in 2025. Within the integrated monitoring architecture, the introduction of vehicle-mounted CCTV imagery has served as a critical supplementary component, accounting for approximately 3.6% of total alerts. Compared to stationary cameras, these mobile sensing units offer several strategic advantages:
  • Dynamic Geographic Coverage: Mobile units traverse various traffic routes, extending monitoring capabilities into residential zones and narrow urban alleys that often lie beyond the reach of stationary surveillance nodes.
  • Precision Spatiotemporal Tagging: Each vehicle-mounted unit is equipped with Global Positioning System (GPS) technology, ensuring that disaster imagery is precisely localized with high-accuracy spatial coordinates.
  • Data Diversity and System Resilience: The broad coverage provided by various driving routes significantly enriches the platform’s image database, enhancing the sensitivity of the AI image recognition module to sudden and localized inundation events.
This heterogeneous monitoring architecture, which synergizes stationary stations with dynamic mobile nodes, not only improves the integrity of geospatial intelligence but also serves as a primary driver for the platform’s near-perfect recall rate.

5.2. Framework of Edge Computing

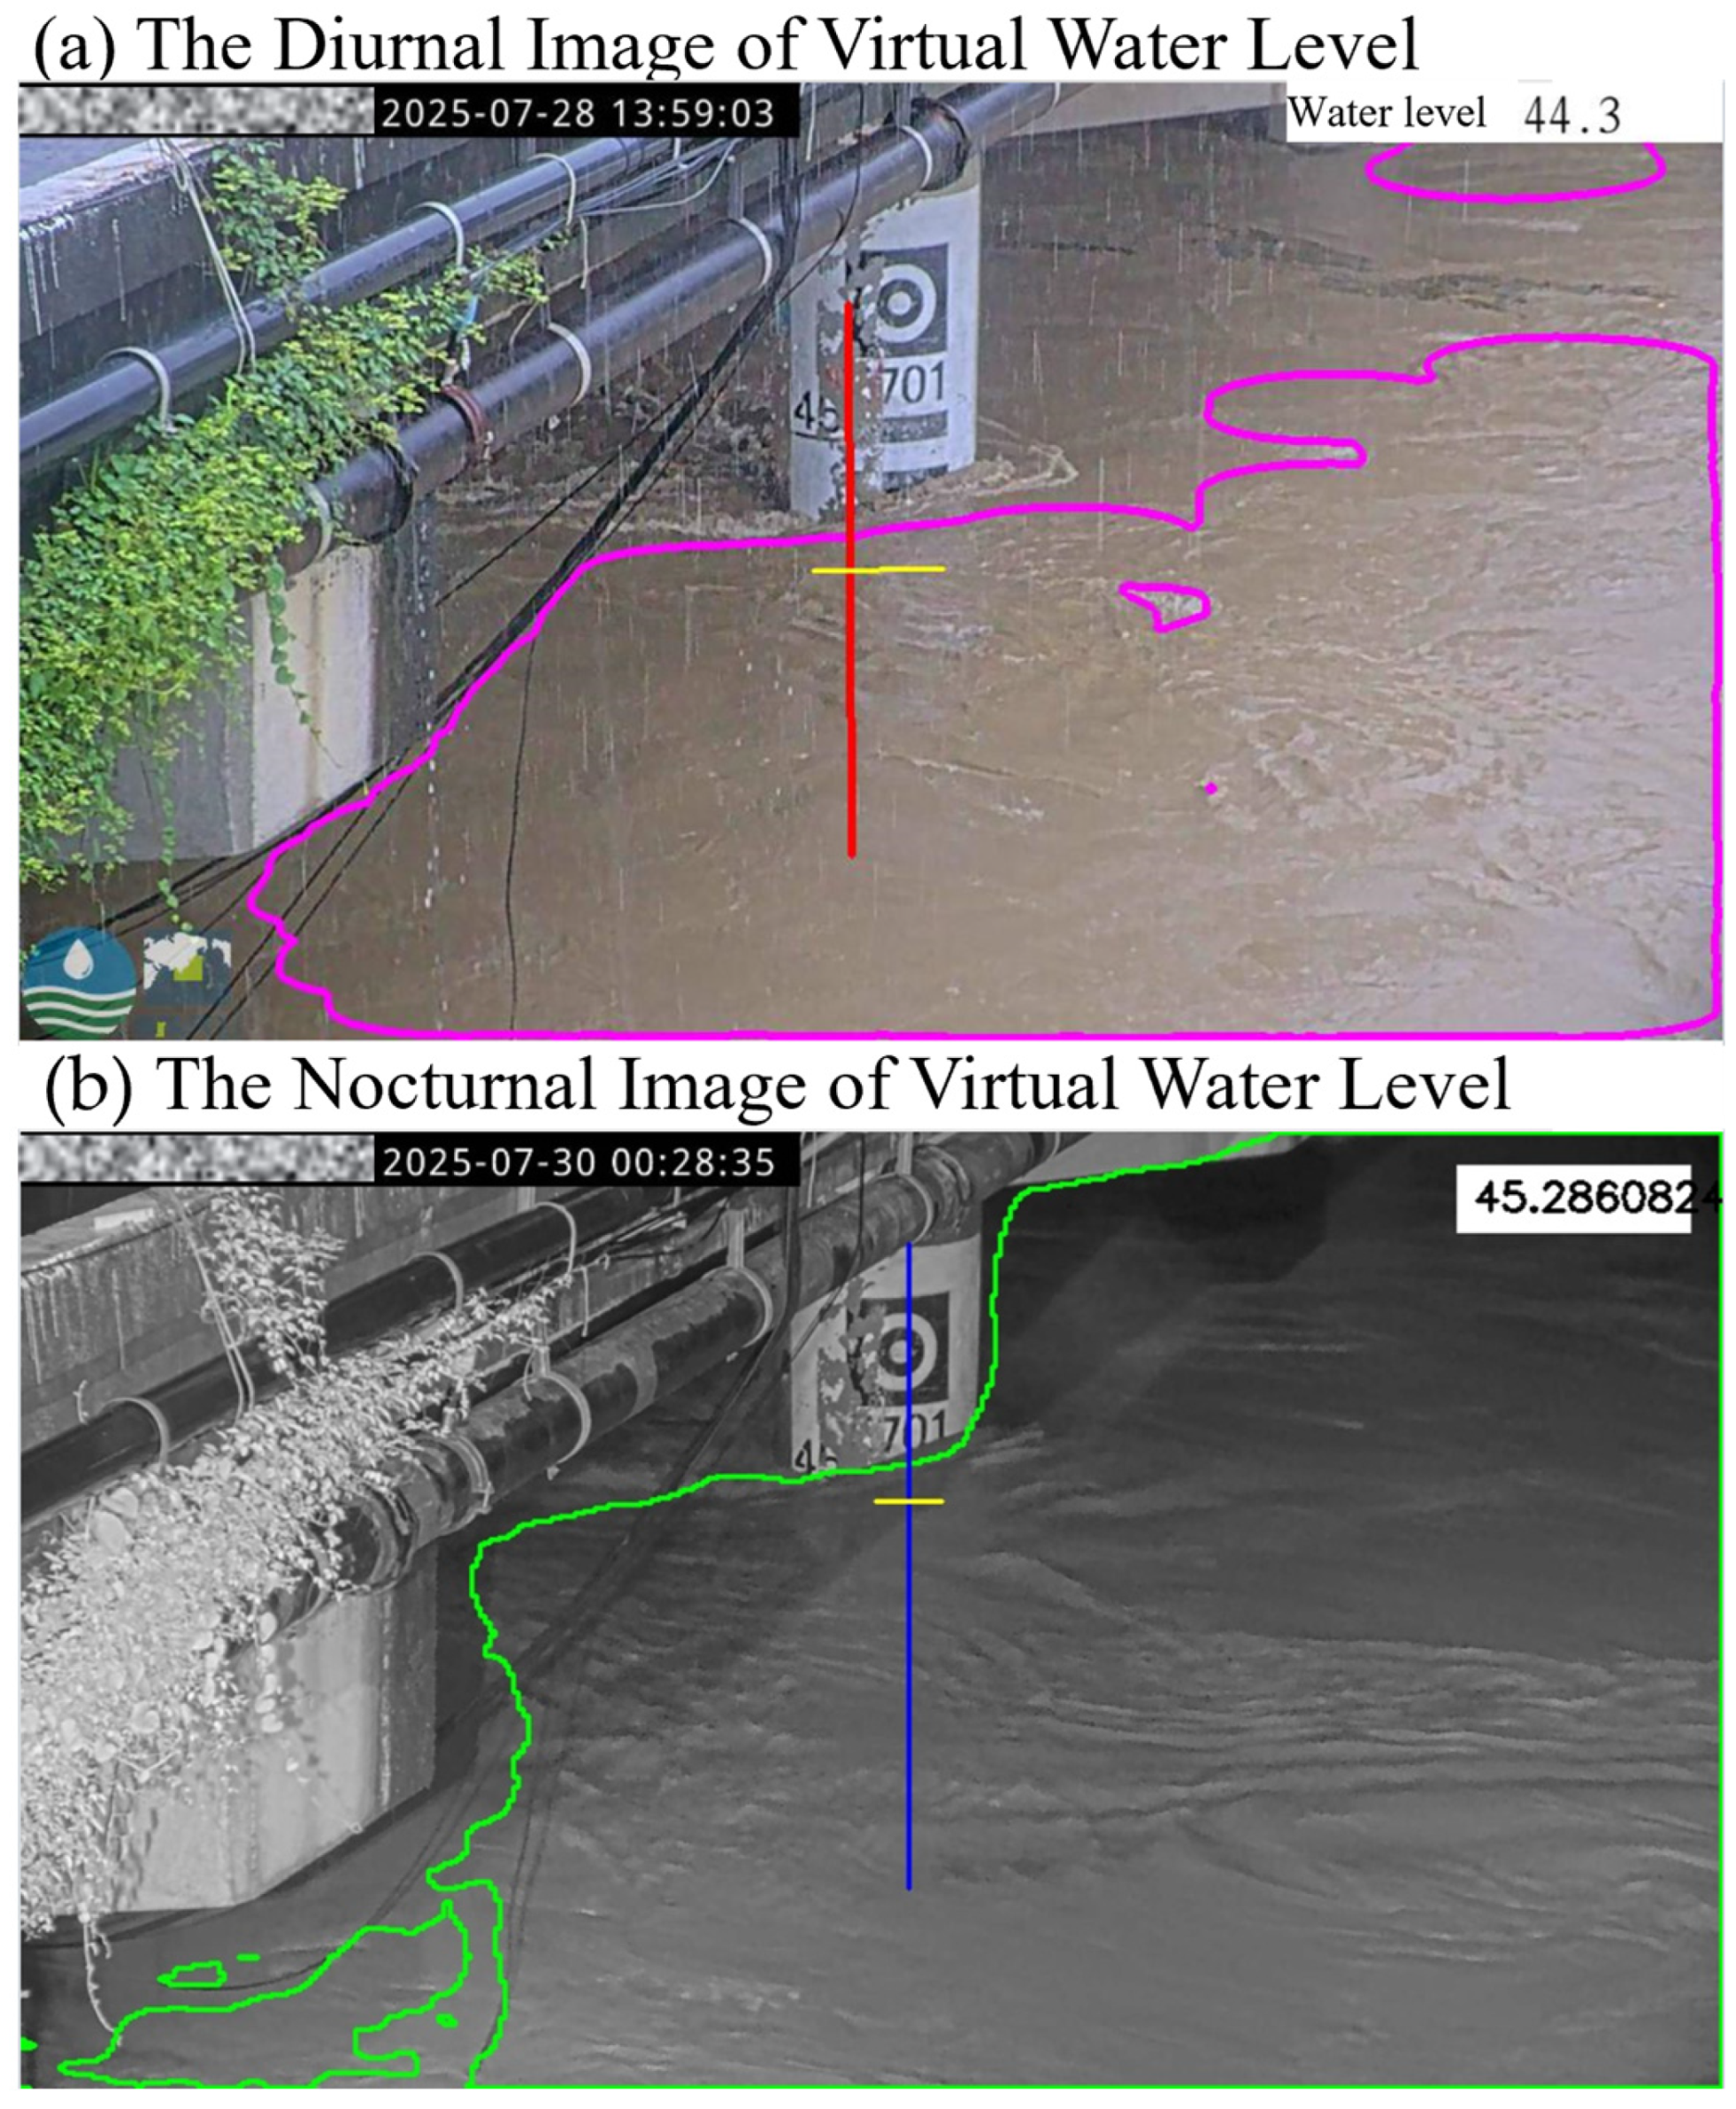
The recognition performance of the Virtual Water Level Gauges (VWLGs) is illustrated in Figure 17. The efficacy of the edge computing framework is evaluated across three primary dimensions: estimation accuracy, alert timeliness, and operational reliability.
Regarding estimation accuracy, the data derived from the VWLGs were benchmarked against measurements from radar-based water level gauges or piezoresistive level probes. Results indicate that the Mean Error (ME) of the virtual estimates remained consistently within ±10 cm. In terms of the precision, the edge-computing cameras captured 21 river-level warning events, 17 of which were manually confirmed as genuine exceedances of the warning standards, yielding a detection precision (Positive Predictive Value, PPV) of 81%.
In terms of warning timeliness, the six edge-computing nodes have detected 17 confirmed river-level warning events in 2025. The average warning latency—measured from image acquisition to the issuance of an Instant Messaging (IM) notification—was 2 s. In contrast, the platform’s standard monitoring stations averaged 19.2 s during high-intensity rainfall periods characterized by a high volume of concurrent events. This represents a 17.2 s lead-time advantage and reduces the processing time significantly. In scenarios involving rapid hydrological rises, this tens-second margin provides critical additional lead time for downstream patrols and the coordination of drainage pumps or floodgate operations.
Despite occasional network interruptions, the cameras and their battery-backed power systems sustained localized recognition and logging. Once connectivity was restored, the historical water level data were successfully backfilled, ensuring the continuity and integrity of the hydrological monitoring records.
Several critical constraints persist in the edge-computing architecture. First, computational capacity is significantly restricted compared to centralized cloud infrastructures. To maintain real-time performance, the platform utilizes lightweight, optimized models; however, achieving satisfactory recognition necessitates extensive field calibration, including the meticulous configuration of camera angles and scene composition through iterative on-site testing. Second, while edge processing mitigates bandwidth-related overhead, the system remains partially dependent on external heterogeneous data streams (e.g., precipitation records) to trigger recognition workflows. Consequently, both system activation and alert dissemination remain susceptible to network disruptions. Within the context of Taiwan, the high density of urban network infrastructure has largely neutralized these risks, with no significant connectivity-related failures observed beyond scheduled maintenance periods. Finally, model scalability and generalization are inherently limited by the constraints of lightweight architectures. Unlike full-scale cloud models, these edge-based units require prolonged site-specific calibration to ensure that the input imagery aligns precisely with the optimal operational parameters of the model.

5.3. False Analysis and System Limitations

The performance of the Water Image Monitoring Platform is evaluated through an analysis of identification errors, categorized into two kinds of false events.
The first kind of false events is primarily driven by visual interference within the monitoring environment. Currently, the platform maintains an annual false alert rate between 3% and 8% from 2022 to 2025. These misidentifications occurred in specific scenarios that share high visual similarity with actual water bodies, predominantly stemming from optical interference. Key factors include intense solar reflections on wet road surfaces, nocturnal glare from streetlights, and shadow occlusions. Although data augmentation techniques—incorporating these extreme conditions into iterative model training—have been employed to enhance the robustness of the AI image recognition module, completely eliminating sporadic false notifications caused by complex dynamic lighting remains a technical challenge.
The second kind of false events denotes instances where the system failed to trigger an alert or to capture a documented inundation event. Beyond general image quality issues such as low visibility or motion blur, three core systemic factors contribute to missed detections:
  • Spatial Resolution Constraints: When the inundated area is too far from the sensing camera, the pixel proportion of the water body becomes insufficient for effective model segmentation. This often leads to recognition failure and may cause visual misjudgment during the subsequent manual verification phase.
  • Communication Latency and Failures: Occasional anomalies in the Instant Messaging (IM) push protocols can prevent the system from delivering alerts to emergency personnel in real-time, even if the AI has successfully identified the event.
  • Data Integration Delays: Latency in the transmission of heterogeneous external data, such as precipitation records from rainfall stations, can delay the activation of the image recognition trigger mechanism, resulting in the loss of critical early-warning windows.
Within the Cyber-Physical System (CPS) architecture for flood monitoring, the Human-in-the-Loop (HITL) architecture serves as the ultimate line of defense for system reliability [38,39]. This hybrid configuration does not merely filter residual errors from the deep learning model; it plays a central role in the decision-making chain. By ensuring that emergency response resources are precisely allocated to verified disaster zones, the HITL architecture prevents decision failure and resource wastage caused by automated false warnings.
In scenarios where AI performance is traditionally weak—such as extreme reflections or low-visibility environments—integrating designed personnel as key sensing and feedback nodes enhances the decision-making resilience of the system. Furthermore, the HITL architecture provides strategic value beyond technical optimization [40,41,42]:
  • Ethical Accountability: It ensures that disaster response decisions align with social and ethical norms while clarifying legal and administrative responsibilities during complex incidents.
  • Establishment of Trust: By maintaining transparency in the execution and logic of the decision process, the HITL architecture fosters long-term user trust in automated early-warning tools.
  • Empirical Case Accumulation: The HITL architecture facilitates the collection of high-quality, contextually relevant labeled cases, which serve as a foundational dataset for constructing automated execution mechanisms, such as reinforcement learning with human feedback (RLHF) [30,43] within the CPS Configuration Level.
Currently, as physical infrastructure—such as automated floodgates and pumping stations—is still undergoing modernization and response measures remain highly dependent on human coordination. Therefore, the HITL architecture remains the most robust governance approach. As recognition precision continues to improve and hardware infrastructure, as well as workflow mechanisms, reach maturity, the platform is designed to transition incrementally from a human-centric collaboration toward an autonomous CPS flood monitoring network.

6. Conclusions

This study developed and validated a multi-layered Cyber-Physical System (CPS) designed as a real-time road flood monitoring and warning platform. By integrating the semantic segmentation model with multi-modal environmental data, the platform achieved a remarkable evolution in performance, with the event recall rate (event capture rate) rising from 88% in 2022 to 99.7% in 2025. A key driver of this success was the integration of a heterogeneous monitoring architecture; the inclusion of vehicle-mounted CCTV units (contributing 3.6% of total alerts) provided critical dynamic geographic coverage in residential areas where fixed cameras were absent.
The deployment of edge computing nodes demonstrated significant operational advantages, reducing average warning latency by 10 times—from 19.2 s in cloud-based stations to 2 s. This gain in lead time is invaluable for field personnel and gate operators during rapid-onset flooding events. Furthermore, the functionality of virtual water level gauges maintained high fidelity, with a mean error of less than ±10 cm compared to results by radar-based sensors or piezoresistive level probes.
Despite these technological gains, environmental noise such as optical interference and spatial resolution limits continues to contribute to a false alert rate of 3% to 8%. Consequently, this research underscores the strategic necessity of the Human-in-the-Loop (HITL) architecture. Beyond serving as an error-filtering mechanism, the HITL architecture ensures ethical accountability, clarifies legal responsibilities, and fosters long-term user trust in automated systems.
As physical infrastructure moves toward full automation and AI segmentation precision, as well as the workflow of HITL continues to improve, this CPS will serve as a foundational model for resilient urban disaster management. Future work will focus on refining the workflow of HITL, virtual water level gauge calibration through continuous event data collection, and exploring the integration of low-earth orbit satellite communications to ensure system resilience during catastrophic network failures.

Author Contributions

Conceptualization, Y.-M.F.; methodology, T.-S.T. and F.-J.C.; software, T.-S.T. and F.-J.C.; validation, T.-S.T. and F.-J.C.; formal analysis, T.-S.T.; investigation, T.-S.T.; resources, Y.-M.F.; data curation, T.-S.T.; writing—original draft preparation, T.-S.T.; writing—review and editing, Y.-M.F. and F.-J.C.; visualization, T.-S.T.; supervision, Y.-M.F.; project administration, Y.-M.F. and F.-J.C.; funding acquisition, Y.-M.F. All authors have read and agreed to the published version of the manuscript.

Funding

This research was supported by the National Science and Technology Council (NSTC) of Taiwan under Grant No. NSTC 113-2622-M-035-001.

Data Availability Statement

The proprietary dataset and the code are not available due to information security concerns.

Acknowledgments

The authors would like to express their sincere gratitude to the Water Resources Agency (WRA), MOEA (Ministry of Economic Affairs, R.O.C.) for providing the critical monitoring datasets and surveillance imagery utilized in this study. We gratefully acknowledge the Department of Water Resources, Taoyuan City, for providing the precipitation and water level data in Figure 15 and Figure 16.

Conflicts of Interest

The authors declare no conflicts of interest.

References

  1. Chang, K.-H.; Chiu, Y.-T.; Su, W.-R.; Yu, Y.-C.; Chang, C.-H. A Spatial–Temporal Deep Learning-Based Warning System against Flooding Hazards with an Empirical Study in Taiwan. Int. J. Disaster Risk Reduct. 2024, 102, 104263. [Google Scholar] [CrossRef]
  2. Lin, M.-Y.; Sun, M.-H.; Sun, W.-Y.; Fu, H.-S.; Chen, W.-B.; Chang, C.-H. Formulating a Warning Threshold for Coastal Compound Flooding: A Copula-Based Approach. Ecol. Indic. 2024, 162, 111994. [Google Scholar] [CrossRef]
  3. Le, T.V.; Nguyen, K.A. Landslide Responses to Typhoon Events in Taiwan During 2019 and 2023. Sustainability 2025, 17, 9673. [Google Scholar] [CrossRef]
  4. Su, Y.-F.; Lin, Y.-T.; Jang, J.-H.; Han, J.-Y. High-Resolution Flood Simulation in Urban Areas Through the Application of Remote Sensing and Crowdsourcing Technologies. Front. Earth Sci. 2022, 9, 756198. [Google Scholar] [CrossRef]
  5. Lau, Y.M.; Wang, K.L.; Wang, Y.H.; Yiu, W.H.; Ooi, G.H.; Tan, P.S.; Wu, J.; Leung, M.L.; Lui, H.L.; Chen, C.W. Monitoring of Rainfall-Induced Landslides at Songmao and Lushan, Taiwan, Using IoT and Big Data-Based Monitoring System. Landslides 2023, 20, 271–296. [Google Scholar] [CrossRef]
  6. Moy De Vitry, M.; Kramer, S.; Wegner, J.D.; Leitão, J.P. Scalable Flood Level Trend Monitoring with Surveillance Cameras Using a Deep Convolutional Neural Network. Hydrol. Earth Syst. Sci. 2019, 23, 4621–4634. [Google Scholar] [CrossRef]
  7. Tolentino, L.K.S.; Baron, R.E.; Blacer, C.A.C.; Aliswag, J.M.D.; De Guzman, D.C.E.; Fronda, J.B.A.; Valeriano, R.C.; Quijano, J.F.C.; Padilla, M.V.C.; Madrigal, G.A.M.; et al. Real Time Flood Detection, Alarm and Monitoring System Using Image Processing and Multiple Linear Regression. SSRN J. 2023, 7, 12–23. [Google Scholar] [CrossRef]
  8. Wieland, M.; Martinis, S.; Kiefl, R.; Gstaiger, V. Semantic Segmentation of Water Bodies in Very High-Resolution Satellite and Aerial Images. Remote Sens. Environ. 2023, 287, 113452. [Google Scholar] [CrossRef]
  9. Wang, Z.; Mahmoudian, N. Aerial Fluvial Image Dataset for Deep Semantic Segmentation Neural Networks and Its Benchmarks. IEEE J. Sel. Top. Appl. Earth Obs. Remote Sens. 2023, 16, 4755–4766. [Google Scholar] [CrossRef]
  10. Jonnala, N.S.; Siraaj, S.; Prastuti, Y.; Chinnababu, P.; Praveen Babu, B.; Bansal, S.; Upadhyaya, P.; Prakash, K.; Faruque, M.R.I.; Al-Mugren, K.S. AER U-Net: Attention-Enhanced Multi-Scale Residual U-Net Structure for Water Body Segmentation Using Sentinel-2 Satellite Images. Sci. Rep. 2025, 15, 16099. [Google Scholar] [CrossRef]
  11. Sun, D.; Gao, G.; Huang, L.; Liu, Y.; Liu, D. Extraction of Water Bodies from High-Resolution Remote Sensing Imagery Based on a Deep Semantic Segmentation Network. Sci. Rep. 2024, 14, 14604. [Google Scholar] [CrossRef]
  12. Attya, M.; Abo-Seida, O.M.; Abdulkader, H.M.; Mohammed, A.M. A Hybrid Deep Learning Approach for Accurate Water Body Segmentation in Satellite Imagery. Earth Sci. Inform. 2025, 18, 418. [Google Scholar] [CrossRef]
  13. Shankar, G.; Geetha, M.K.; Ezhumalai, P. Disaster Management Systems: Utilizing YOLOv9 for Precise Monitoring of River Flood Flow Levels Using Video Surveillance. SN Comput. Sci. 2025, 6, 288. [Google Scholar] [CrossRef]
  14. Zhao, J.; Wang, X.; Zhang, C.; Hu, J.; Wan, J.; Cheng, L.; Shi, S.; Zhu, X. Urban Waterlogging Monitoring and Recognition in Low-Light Scenarios Using Surveillance Videos and Deep Learning. Water 2025, 17, 707. [Google Scholar] [CrossRef]
  15. Lu, A.; Cao, R.; Wang, Y.; Hu, W.; Gao, Y.; Hu, Z.; Zang, Y. Edge Computing and Server-Based High-Precision Flood Level Classification System. Eng. Appl. Artif. Intell. 2025, 162, 112442. [Google Scholar] [CrossRef]
  16. Zhong, P.; Liu, Y.; Zheng, H.; Zhao, J. Detection of Urban Flood Inundation from Traffic Images Using Deep Learning Methods. Water Resour. Manag. 2024, 38, 287–301. [Google Scholar] [CrossRef]
  17. Zhang, D.; Tong, J. Robust Water Level Measurement Method Based on Computer Vision. J. Hydrol. 2023, 620, 129456. [Google Scholar] [CrossRef]
  18. Zeng, Y.-F.; Chang, M.-J.; Lin, G.-F. A Novel AI-Based Model for Real-Time Flooding Image Recognition Using Super-Resolution Generative Adversarial Network. J. Hydrol. 2024, 638, 131475. [Google Scholar] [CrossRef]
  19. Kerim, A.; Chamone, F.; Ramos, W.; Marcolino, L.S.; Nascimento, E.R.; Jiang, R. Semantic Segmentation under Adverse Conditions: A Weather and Nighttime-Aware Synthetic Data-Based Approach. arXiv 2022, arXiv:2210.05626. [Google Scholar]
  20. Bai, G.; Hou, J.; Zhang, Y.; Li, B.; Han, H.; Wang, T.; Hinkelmann, R.; Zhang, D.; Guo, L. An Intelligent Water Level Monitoring Method Based on SSD Algorithm. Measurement 2021, 185, 110047. [Google Scholar] [CrossRef]
  21. Wang, Y.; Shen, Y.; Salahshour, B.; Cetin, M.; Iftekharuddin, K.; Tahvildari, N.; Huang, G.; Harris, D.K.; Ampofo, K.; Goodall, J.L. Urban Flood Extent Segmentation and Evaluation from Real-World Surveillance Camera Images Using Deep Convolutional Neural Network. Environ. Model. Softw. 2024, 173, 105939. [Google Scholar] [CrossRef]
  22. Wan, J.; Wang, X.; Cheng, Y.; Zhang, C.; Xue, F.; Yang, T.; Tong, F.; Wang, Q.J. Identification of Nighttime Urban Flood Inundation Extent Using Deep Learning. Nat. Hazards Earth Syst. Sci. 2025, 25, 4361–4373. [Google Scholar] [CrossRef]
  23. Khan, S.M.; Shafi, I.; Butt, W.H.; Diez, I.d.l.T.; Flores, M.A.L.; Galán, J.C.; Ashraf, I. A Systematic Review of Disaster Management Systems: Approaches, Challenges, and Future Directions. Land 2023, 12, 1514. [Google Scholar] [CrossRef]
  24. Yang, S.-H.; Hsieh, S.-L.; Wang, X.-J.; Chang, D.-L.; Wei, S.-T.; Song, D.-R.; Pan, J.-H.; Yeh, K.-C. Adaptive Pluvial Flood Disaster Management in Taiwan: Infrastructure and IoT Technologies. Water 2025, 17, 2269. [Google Scholar] [CrossRef]
  25. Yang, T.-H.; Yang, S.-C.; Kao, H.-M.; Wu, M.-C.; Hsu, H.-M. Cyber-Physical-System-Based Smart Water System to Prevent Flood Hazards. Smart Water 2018, 3, 1. [Google Scholar] [CrossRef]
  26. Alexandra, C.; Daniell, K.A.; Guillaume, J.; Saraswat, C.; Feldman, H.R. Cyber-Physical Systems in Water Management and Governance. Curr. Opin. Environ. Sustain. 2023, 62, 101290. [Google Scholar] [CrossRef]
  27. Musa, A.A.; Hussaini, A.; Liao, W.; Liang, F.; Yu, W. Deep Neural Networks for Spatial-Temporal Cyber-Physical Systems: A Survey. Future Internet 2023, 15, 199. [Google Scholar] [CrossRef]
  28. Lee, J.; Bagheri, B.; Kao, H.-A. A Cyber-Physical Systems Architecture for Industry 4.0-Based Manufacturing Systems. Manuf. Lett. 2015, 3, 18–23. [Google Scholar] [CrossRef]
  29. Pagano, T.C.; Pappenberger, F.; Wood, A.W.; Ramos, M.; Persson, A.; Anderson, B. Automation and Human Expertise in Operational River Forecasting. WIREs Water 2016, 3, 692–705. [Google Scholar] [CrossRef]
  30. Debnath, R.; Tkachenko, N.; Bhattacharyya, M. Enabling People-Centric Climate Action Using Human-in-the-Loop Artificial Intelligence: A Review. Curr. Opin. Behav. Sci. 2025, 61, 101482. [Google Scholar] [CrossRef]
  31. Wang, J.; Sun, K.; Cheng, T.; Jiang, B.; Deng, C.; Zhao, Y.; Liu, D.; Mu, Y.; Tan, M.; Wang, X.; et al. Deep High-Resolution Representation Learning for Visual Recognition. IEEE Trans. Pattern Anal. Mach. Intell. 2021, 43, 3349–3364. [Google Scholar] [CrossRef]
  32. Gao, L.; Huang, X.; Si, W.; Yang, F.; Qiao, X.; Zhu, Y.; Fu, T.; Zhao, J. An Improved HRNetV2-Based Semantic Segmentation Algorithm for Pipe Corrosion Detection in Smart City Drainage Networks. J. Imaging 2025, 11, 325. [Google Scholar] [CrossRef]
  33. Chen, L.-C.; Zhu, Y.; Papandreou, G.; Schroff, F.; Adam, H. Encoder-Decoder with Atrous Separable Convolution for Semantic Image Segmentation. In Proceedings of the European Conference on Computer Vision (ECCV), Munich, Germany, 8–14 September 2018. [Google Scholar]
  34. Sorboni, N.G.; Wang, J.; Najafi, M.R. Urban Flood Mapping Using Sentinel-1 and RADARSAT Constellation Mission Image and Convolutional Siamese Network. In Proceedings of the AGU Fall Meeting, Chicago, IL, USA, 12–16 December 2022. [Google Scholar]
  35. Wei, D.; Chang, Y.; Kuang, H. Extraction and Spatiotemporal Analysis of Impervious Surfaces in Chongqing Based on Enhanced DeepLabv3+. Sci. Rep. 2025, 15, 9807. [Google Scholar] [CrossRef]
  36. Kupyn, O.; Martyniuk, T.; Wu, J.; Wang, Z. DeblurGAN-v2: Deblurring (Orders-of-Magnitude) Faster and Better. In Proceedings of the IEEE/CVF International Conference on Computer Vision (ICCV), Seoul, Republic of Korea, 27 October–2 November 2019. [Google Scholar]
  37. Qian, R.; Tan, R.T.; Yang, W.; Su, J.; Liu, J. Attentive Generative Adversarial Network for Raindrop Removal from a Single Image. In Proceedings of the IEEE Conference on Computer Vision and Pattern Recognition (CVPR), Honolulu, HI, USA, 21–26 July 2017. [Google Scholar]
  38. Nunes, D.; Silva, J.; Boavida, F. A Practical Introduction to Human-in-the-Loop Cyber-Physical Systems, 1st ed.; Wiley: Hoboken, NJ, USA, 2017. [Google Scholar]
  39. Domfeh, E.A.; Dancy, C.L. Human-AI Use Patterns for Decision-Making in Disaster Scenarios: A Systematic Review. In Proceedings of the 2025 IEEE International Symposium on Technology and Society (ISTAS), Santa Clara, CA, USA, 10–12 September 2025. [Google Scholar]
  40. Kuglitsch, M.; Pelivan, I.; Danakkaew, C.; Dramsch, J.; Arghandeh, R. Cultivating Trust in AI for Disaster Management. Eos 2024, 105. [Google Scholar] [CrossRef]
  41. Clemmensen, T.; Moghaddam, M.T.; Nørbjerg, J. Cyber-Physical Systems with Human-in-the-Loop: A Systematic Review of Socio-Technical Perspectives. J. Syst. Softw. 2025, 226, 112348. [Google Scholar] [CrossRef]
  42. Lazaros, K.; Vrahatis, A.G.; Kotsiantis, S. Human-in-the-Loop Artificial Intelligence: A Systematic Review of Concepts, Methods, and Applications. Entropy 2026, 28, 377. [Google Scholar] [CrossRef] [PubMed]
  43. Dai, J.; Pan, X.; Sun, R.; Ji, J.; Xu, X.; Liu, M.; Wang, Y.; Yang, Y. Safe RLHF: Safe Reinforcement Learning from Human Feedback. In Proceedings of the International Conference on Learning Representations (ICLR 2024), Vienna, Austria, 7–11 May 2024. [Google Scholar]
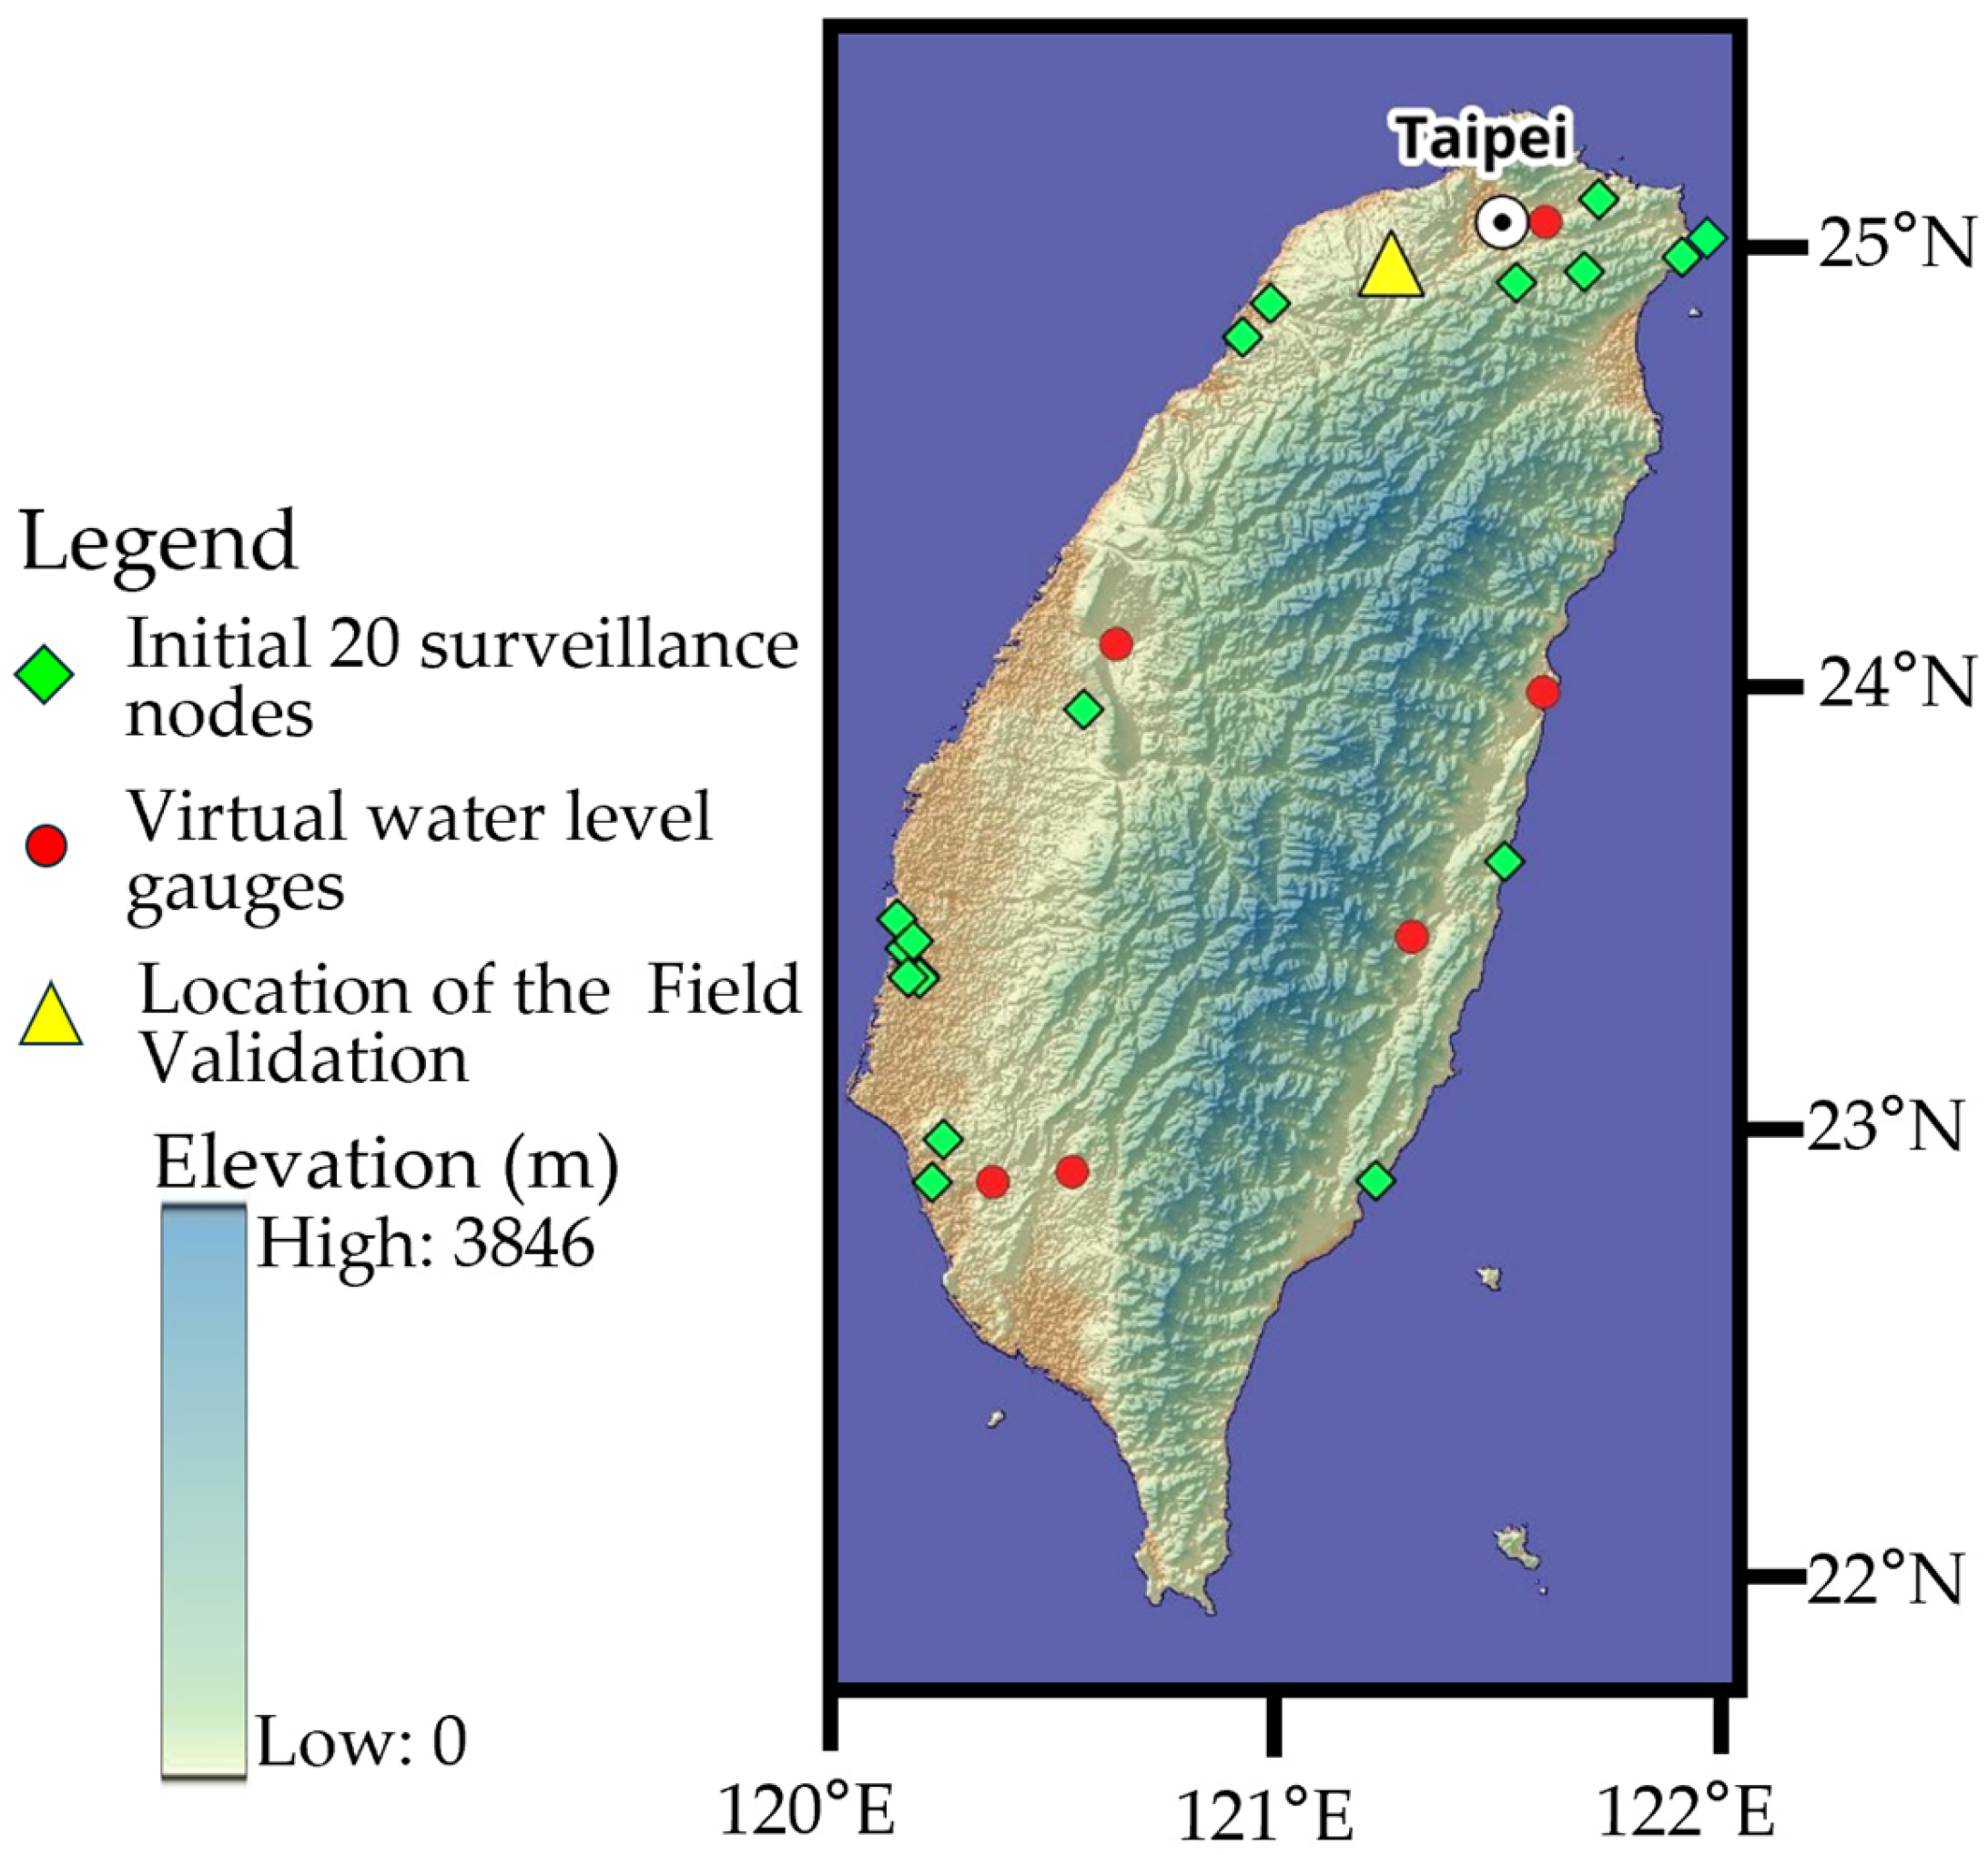
Figure 1. Geographic distribution of the initial 20 surveillance nodes (green diamonds) across Taiwan, strategically selected based on documented histories of disaster-related incidents. Red dots show locations of six surveillance nodes with virtual water level gauges. The yellow triangle shows the location of field validation in Section 5.1.
Water 18 01286 g001
Figure 2. The Cyber-Physical System architecture for the Water Image Monitoring Platform. (Abbreviations: FDD-LTE: Frequency-Division Duplexing Long Term Evolution; GIS: Geographic Information System; WRA: Water Resources Agency; CWA: Central Weather Administration; EMIC: Emergency Management Information Cloud).
Water 18 01286 g002
Figure 3. The dashboard interface of the Water Image Monitoring Platform: The markers in the map denote the deployment locations of the surveillance nodes across the network. The red markers highlight nodes positioned within active reservoir warning zones.
Water 18 01286 g003
Figure 4. Dynamic image carousel interface of the Water Image Monitoring Platform: The data panels positioned below each visual sequence display local cumulative precipitation data sourced from the CWA. To indicate varying hazard levels, the precipitation values are color-coded based on local flood warning criteria: yellow numbers denote that the Level 2 flood warning threshold has been reached; orange numbers represent precipitation levels bounded between the Level 2 and Level 1 thresholds; and red numbers signify that the Level 1 threshold has been exceeded. Additionally, the pink contours delineate the inundation area automatically extracted by the proposed model.
Water 18 01286 g004
Figure 5. Dataflow chart of the Water Image Monitoring Platform (EC Camera = Edge Computing Camera).
Water 18 01286 g005
Figure 6. (a) Raw Image, (b) Manual Annotation (The BACKGROUND was labeled in red, the FLOOD was labeled in green, and the ROAD was labeled in gray).
Water 18 01286 g006
Figure 7. Examples for Special notes: (a) Strong Reflection (The non-English texts are the name of the location: Xinxing Underground Tunnel), (b) Dark Tunnel, (c) Yellow Flood.
Water 18 01286 g007
Figure 8. Loss function graphs of (a) DeeplabV3+ with Xception71, and (b) HRNetV2+OCR.
Water 18 01286 g008
Figure 9. Improved the floodwater segmentation in highly reflective nighttime conditions. The pink contours delineate the inundation area automatically extracted by the proposed model.
Water 18 01286 g009
Figure 10. Improved accuracy in segmenting flooded areas in foggy conditions. The pink contours delineate the inundation area automatically extracted by the proposed model. The red line in (b) serves as vertical reference axis on the virtual water level gauge.
Water 18 01286 g010
Figure 11. Demonstration of flood detection resilience against lens interference: This figure illustrates the mitigated impact of water droplet adherence on the camera lens during inundation identification. The pink contours delineate the inundation areas extracted by the proposed model. The non-English pavement markings indicate the street name and denote a motorcycle restriction zone.
Water 18 01286 g011
Figure 12. The problem of inaccurate identification of flooded areas caused by colored lights was improved. The pink contours delineate the inundation areas automatically extracted by the proposed model.
Water 18 01286 g012
Figure 13. Differences between the model’s flooded area segmentation results after adding an attention mechanism and those of human annotations (For (b), the BACKGROUND was labeled in red, the FLOOD was labeled in green, and the ROAD was labeled in gray. For (c,d), FLOOD areas segmented by attention-based DeeplabV3+ (c) and DeeplabV3+ (d) models respectively were labeled in green, and others were labeled in red as BACKGROUND).
Water 18 01286 g013
Figure 14. This addresses the issue of inaccurate segmentation of flooded areas in low-visibility scenarios. The pink contours delineate the inundation areas automatically extracted by the proposed model.
Water 18 01286 g014
Figure 15. This figure presents a comparison of the event records captured on 15 August 2020, by the piezoresistive level probe and the proposed Water Image Monitoring Platform. Panels (ae) display the corresponding visual sequences captured by the proposed platform, with their respective acquisition times aligned with the timeline in (f). Panel (f) illustrates the time-series correlation between water level (right vertical axis) and precipitation (left vertical axis) recorded at the location marked by the yellow triangle in Figure 1. Notably, the pink contours in (a,b) delineate the inundation areas extracted by the proposed model.
Water 18 01286 g015
Figure 16. This figure presents a comparison of the event records captured on 1 August 2025, by the piezo-resistive level probe and the proposed Water Image Monitoring Platform. Panels (ad) display the corresponding visual sequences captured by the proposed platform, with their respective acquisition times aligned with the timeline in (e). Panel (e) illustrates the time-series correlation between water level (right vertical axis) and precipitation (left vertical axis) recorded at the location marked by the yellow triangle in Figure 1. Notably, the pink contour in (c) delineates the inundation areas extracted by the proposed model.
Water 18 01286 g016
Figure 17. The VWLG at Meinong Bridge, Meinong District, Kaohsiung City: The yellow horizontal line indicates the level 2 flood warning threshold, which was exceeded during this monitored event. Panels (a,b) display the pink and green contours that delineate the inundation areas extracted by the proposed model, respectively. The red and blue lines serve as vertical reference axes on the virtual staff gauge. The geometric intersection between these vertical references and the model-segmented water surface boundaries determines the calculated water level.
Water 18 01286 g017
Table 1. Comparison between this study and Yang et al. (2025) [24].
ItemsThis StudyYang et al., 2025 [24]
Service AreaTaiwanNew Taipei City
System architectureMulti-layer Cyber-Physical SystemService-Oriented Architecture with IoT cluster-based
AI technologySemantic Segmentation: DeepLabV3+ with Xception71CNN Classification: VGG-19, ResNet.
Image sourceStationary and Mobile CCTVsCCTVs and UAV
Heterogeneous informationRainfall, water leveling sensor, location, flood warning areaRainfall, Various-sensor information, Drainage pipe flow depth
Special applicationVirtual water level gaugesPumping machine management according to the pipe flow depth
The role of humans in the systemHuman in the LoopReduce man–machine interactions and dependence on human experience
Table 2. Architectures, backbones, and training information.
Feature Extraction ArchitectureDeepLabV3+HRNetV2+OCR
Backbone networkXception71HRNetV1-W48
Batch Size11
Learning Rate0.00010.0001
OptimizerAdamAdam
Step120,000120,000
Table 3. The parameter count, training time, and inference time of each architecture.
DeepLabV3+
(Xception71)
HRNetV2+OCR
Parameter count46.73 M72.1 M
Training time≒1 dayAt least 5 days
Inference time≒0.1 s≒0.5 s
Table 4. After training, when testing using the test dataset, PA, MPA, and mIoU of candidate architectures were evaluated.
Model and NetworkDeepLabV3+ and Xception71HRNetV2+OCR
PAMPAmIoUPAMPAmIoU
FLOOD0.8450.8420.7730.8150.8130.746
FLOOD+ROAD0.8340.8010.7310.7680.7670.693
ROAD0.8360.8280.7550.8210.8170.741
Disclaimer/Publisher’s Note: The statements, opinions and data contained in all publications are solely those of the individual author(s) and contributor(s) and not of MDPI and/or the editor(s). MDPI and/or the editor(s) disclaim responsibility for any injury to people or property resulting from any ideas, methods, instructions or products referred to in the content.