Article

Assessment of Regional-Scale Freshwater Availability Towards Sustainable Management in the Context of Climate Change


1
Department of Civil and Environmental Engineering, University of Perugia, Via G. Duranti 93, 06125 Perugia, Italy
2
National Research Council, Research Institute for Geo-Hydrological Protection, Via Madonna Alta 126, 06128 Perugia, Italy
3
Department of Civil Environmental and Mechanical Engineering, University of Trento, Via Mesiano, 77, 38123 Trento, Italy
4
Italian Institute for Environmental Protection and Research (ISPRA), Via V. Brancati 48, 00144 Roma, Italy
*
Author to whom correspondence should be addressed.
Water 2026, 18(11), 1290; https://doi.org/10.3390/w18111290
Submission received: 23 April 2026 / Revised: 18 May 2026 / Accepted: 23 May 2026 / Published: 26 May 2026

Abstract

Freshwater availability is a key indicator of climate change in areas like the Mediterranean with growing water crises. The Umbria region in central Italy, experiencing rising temperatures and declining rainfall, is a prime local case study for assessing the impact of climate change on freshwater. In this study, we exploit two well-established, spatially distributed datasets (BIGBANG v8 and ERA5-Land) to compute net freshwater (NF) available in the region as the difference between water input (precipitation) and consumption by evapotranspiration. Both datasets show a declining regional NF trend from 1951 to 2023, with −2.03 mm/year and −1.30 mm/year rates, respectively. The decline is more marked in areas with higher average NF such as mountainous areas. Despite differences in spatial resolution, spatially averaged magnitudes from the two datasets are highly correlated (r = 0.84). They both successfully capture major drought events observed in the region since the 2000s. In addition, the study compares amounts of freshwater potentially available against anthropogenic uses to develop sustainable water management policies. Information on different water uses and estimates from modelling platforms were collected in the region. This study aims to be a proof of concept for a reliable approach serving to develop policies for sustainable water use.

1. Introduction

Freshwater availability, defined as water in surface and groundwater bodies available for human use, depends on a combination of hydrological processes and climatic factors such as temperature and precipitation. These factors are strongly affected by climate change. For this reason, freshwater availability is widely considered a key indicator of global warming in several regions of the world, such as the Mediterranean basin [1], that are experiencing an increase in water crises.
Climate observations and future projections show significant changes in temperature and precipitation across Europe, with strong regional differences. Temperature increases are widespread across the continent. In contrast, precipitation is generally increasing in Northern Europe and decreasing in southern regions. These patterns are consistent with findings from the IPCC Fifth Assessment Report [2] and largely confirmed by the Sixth Assessment Report [3,4]. Studies also highlight changes in droughts and extreme events. In particular, both the duration and intensity of droughts are expected to increase in Central and Southern Europe [5,6]. Under a global warming scenario of 3 °C by 2100, and assuming no adaptation, annual drought losses in the EU+UK could be up to five times higher than current levels. The most severe impacts are expected in the Mediterranean and Atlantic regions [7]. In addition, soil moisture droughts, which strongly affect agriculture, are projected to worsen, especially in Eastern Europe and the Mediterranean area [8].
Climate change is also affecting surface water bodies in Europe. River flows are expected to decrease in Southern and Eastern Europe, while increasing in other regions. A study covering the period 1950–2013 [9] identified this clear contrast. It reported decreasing trends in the Mediterranean (about −1 × 10³ m3/km2/year) and increasing trends in Northern Europe (about +0.5 × 10³ m3/km2/year). Similar patterns are observed globally. In China, for example, the Yellow River shows a significant decline in flow, linked to reduced rainfall. In contrast, the Yangtze River shows a slight increase due to stronger monsoon rainfall [10]. Overall, decreasing river flows are observed in many low- and mid-latitude regions, and this trend may reduce water availability. In addition to the gradual decline in surface water availability observed in some parts of the world, the degrading effects caused by human activities must also be considered as a further critical factor [11].
Groundwater resources, which supply a large share of global water demand, are also affected by both human activities and climate change. Significant declines in groundwater levels have been observed in the Euro-Mediterranean region [12]. These declines indicate an imbalance between natural recharge and water extraction. Using satellite data and climate reanalysis datasets, studies have found negative trends in about 70% of the region, with an average decrease of −2.1 mm/year between 2003 and 2020 [13]. In Italy, a statistically significant decline in renewable water resources has also been reported in recent years [14,15].
In this context, freshwater availability for human uses—especially civil, agricultural, and industrial—is increasingly at risk. This is due to a growing imbalance between supply and demand. Water demand is expected to rise further in the future. Agriculture will play a crucial role, particularly irrigation, which accounts for a large share of global freshwater use [16]. Population growth, economic development, and climate change are expected to increase irrigation demand. This may also lead to greater reliance on groundwater, especially as surface water becomes more variable [17,18]. A well-known example is India, where groundwater supplies over 60% of irrigation water, leading to significant depletion [19]. Similar issues have been observed in other regions, such as the U.S. High Plains and northern China [20,21,22]. Water use for domestic purposes is also critical for sustaining urban populations and preventing water crises. A notable example is the 2018 crisis in Cape Town, South Africa, where about 4 million people faced severe water shortages due to prolonged drought. Water supply dropped to just 50 L per person per day after the depletion of the main reservoir. Similar events have occurred elsewhere, including water shortages in the Colorado River basin in the United States. Italy has also recently experienced severe drought conditions. Between 2022 and early 2023, northern and central Italy faced extreme and persistent drought, which significantly impacted agriculture and water supply systems [23,24]. Reduced precipitation led to water shortages in many local sources, affecting both civil use and irrigation. This situation required emergency measures in several regions [25,26]. Water demand from industry and energy production is also expected to grow, as it is closely linked to economic development. Hydropower production, in particular, depends directly on freshwater availability [27]. This makes the sector increasingly vulnerable to droughts, especially in regions such as the Mediterranean [4]. A recent study [28] highlighted strong regional differences in Italy. Southern regions could face hydropower reductions of up to 30% under severe climate scenarios.
Taking into account the multiple effects of climate change on water resources described above, together with the increasing water demands associated with human activities, there is a clear need to develop simple and reliable approaches capable of integrating the natural components of the hydrological balance with water uses. They should support the implementation of sustainable water management policies across different spatial scales, geographical contexts, and levels of data availability. The objective of this work is to contribute to bridging this gap, particularly proposing a methodology for estimating net freshwater availability at the regional scale. The Umbria region in central Italy is used as a case study. This region is experiencing faster-than-average temperature increases, along with decreasing rainfall and reduced runoff [20,29]. In the proposed methodology, net freshwater (NF) is estimated using two spatially distributed datasets: BIGBANG v8 and ERA5-Land. These datasets provide precipitation and evapotranspiration data at spatial resolutions of 1 km and 9 km, respectively, for the period 1951–2023, used to calculate NF and assess the presence of significant climatic trends. The study also explores how this approach can support regional decision-making. Finally, it examines the integration of water balance estimates with modelled anthropogenic water use. In principle, the proposed methodology is flexible enough to be transferred to other regional areas but also to be upscaled after use of a suitable dataset, as shown by effectively involving ERA5-Land. This work contributes to the INTERREG-Europe GOV4Water project, which focuses on smart, efficient, and adaptive water resource management.

2. Materials and Methods

2.1. Study Area: Umbria Region (Central Italy)

The study area selected for applying the proposed methodology is the Umbria region, located in central Italy. The region is shown in Figure 1, where the river network, main basin and aquifers, together with areas equipped for irrigation according to [30], are also highlighted. The Umbrian territory (8500 km2) is crossed by the River Tiber, Italy’s third-longest river with the second-largest river basin. The upper-middle Tiber river basin is characterized by a complex topography, mainly hilly/mountainous with an elevation between 50 and 2500 m a.s.l. Most of the basin’s surface area (54%) is agricultural land; the remaining portions are forested (39%) or urbanized (7%). The Umbria region has a Mediterranean climate, with an average annual precipitation of approximately 950 mm, condensed in the autumn–winter season, an average annual temperature of 13 °C and rare snowfall below 500 m above sea level.
In the last century, the Umbria region has experienced increasing air temperatures at rates higher than the planetary average, in association with decreasing yearly cumulated rainfall amounts [20] and reduced runoff volumes [29]. Specifically, across the region, the rate of decrease in annual rainfall is almost always more severe than −1 mm/year, with peaks exceeding −2 mm/year and negative trends everywhere statistically significant. All indices based on the annual averages of mean, maximum, and minimum daily temperatures show significantly increasing trends with average rates of +0.025 °C/year and peaks over 0.04 °C/year. In addition, a recent analysis performed on five pilot basins (ranging from 934 km2 to 4147 km2) located in the Umbria region has shown a decreasing trend in yearly runoff depths during the time span 1927–2020, quantified in a median loss of −1.62 mm/year.
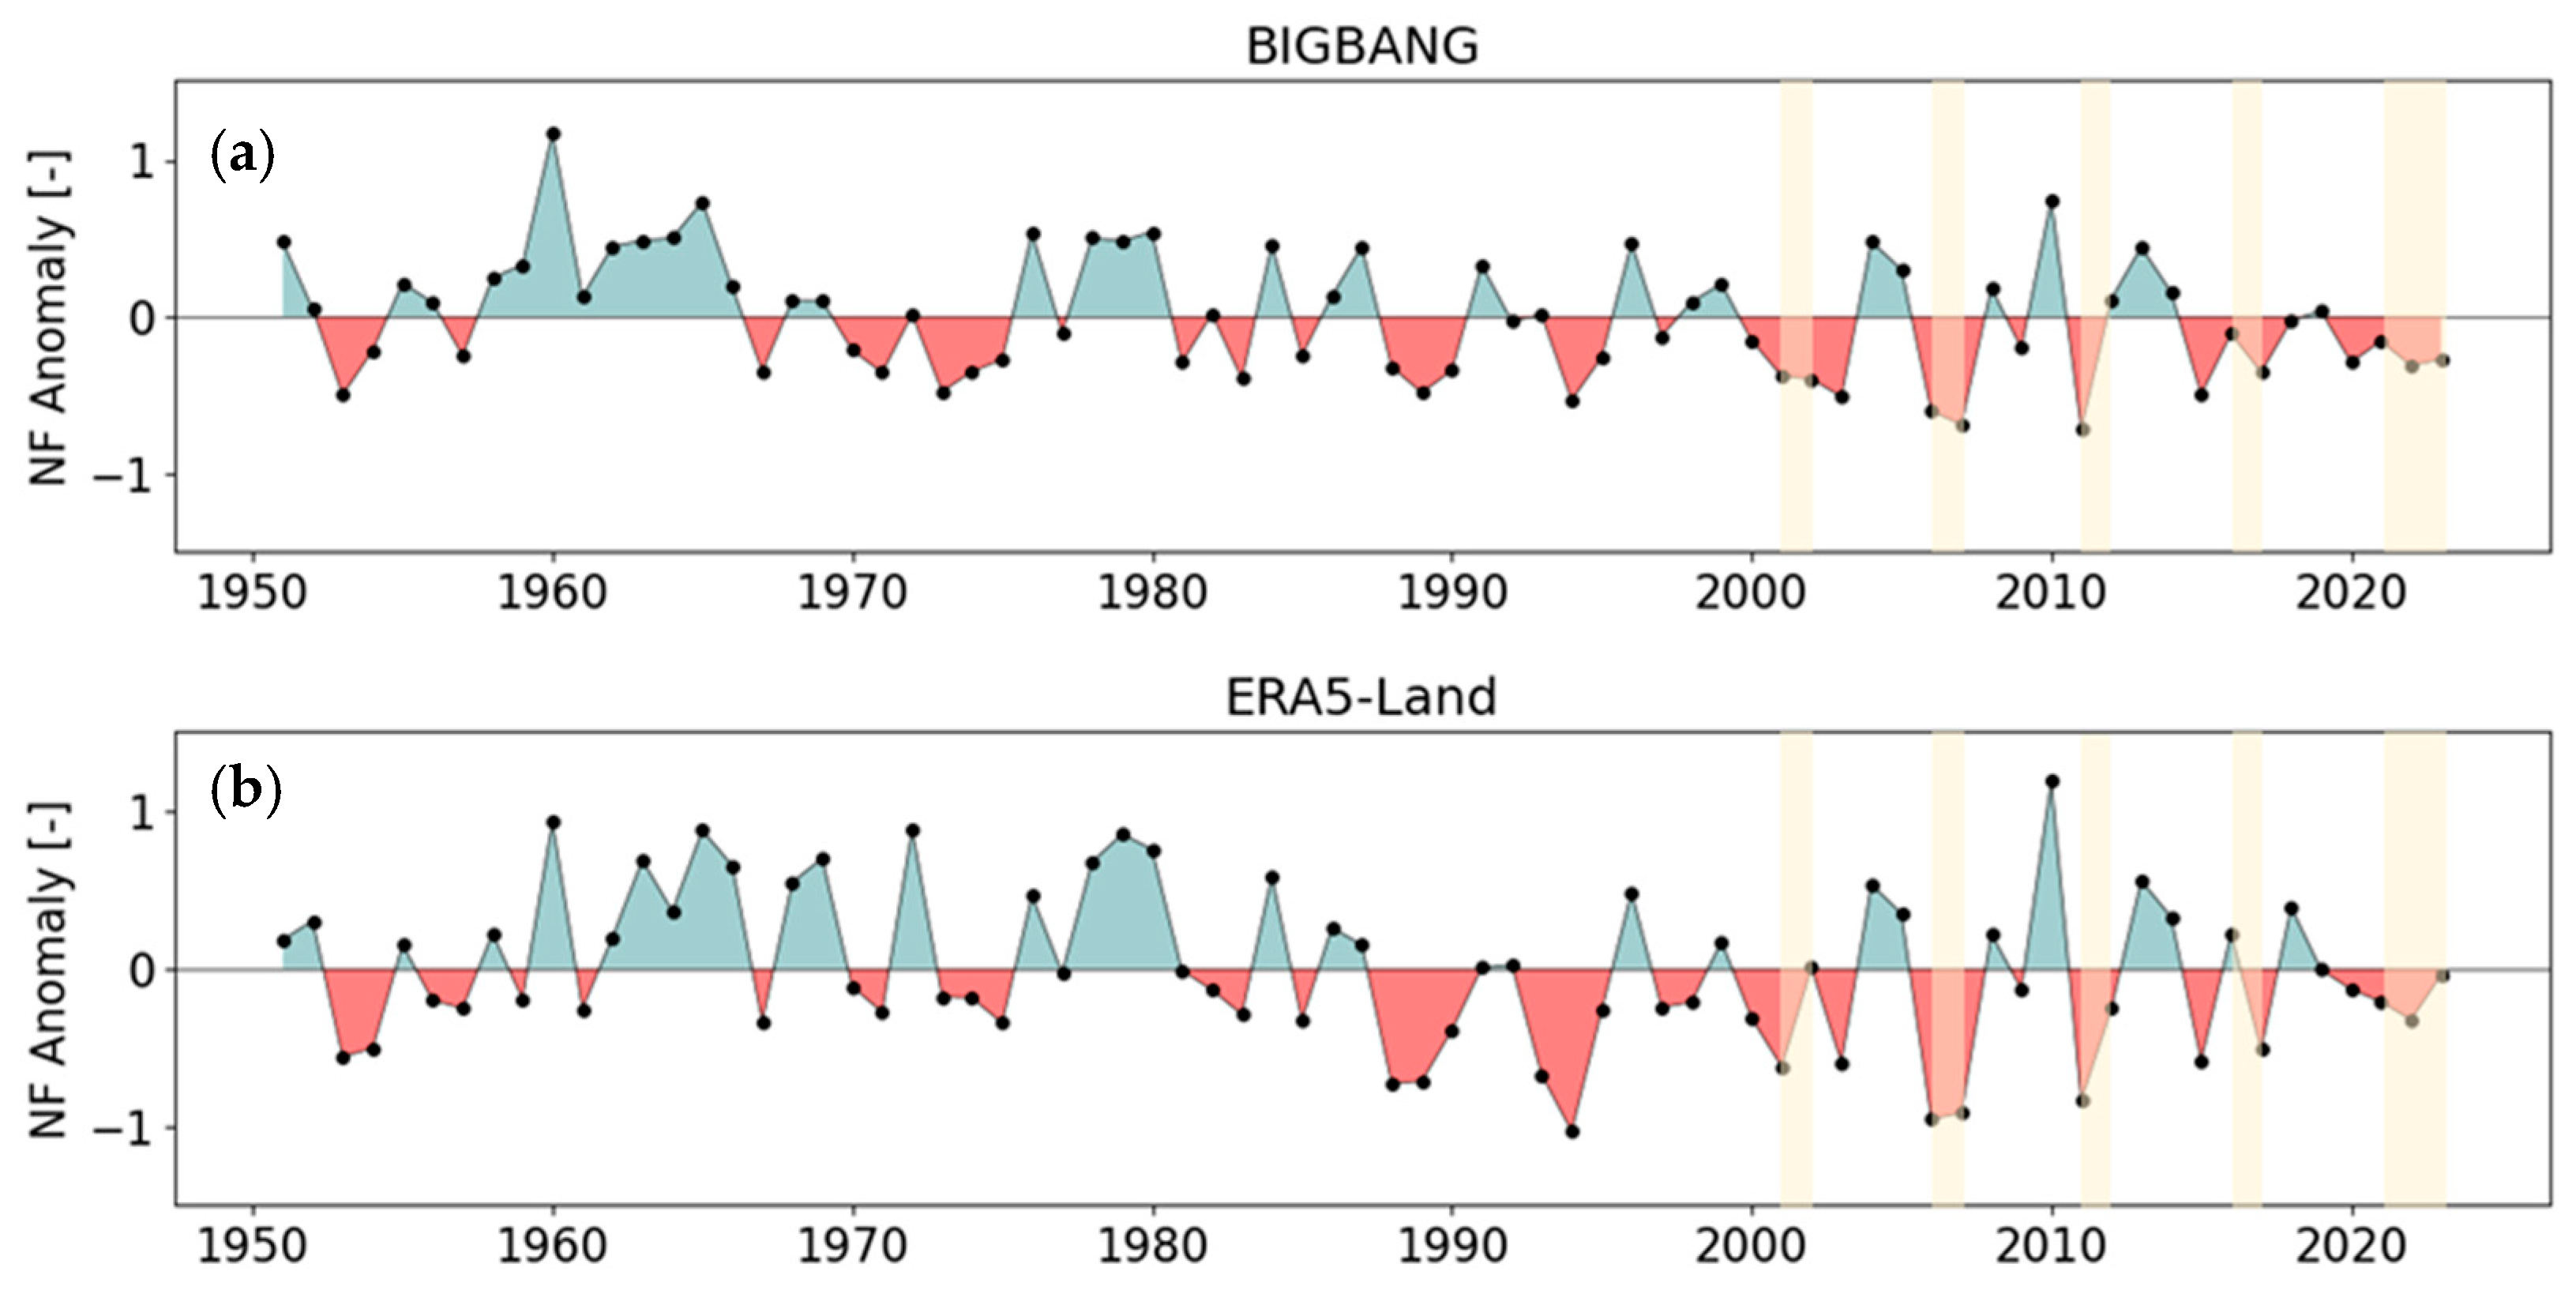
In accordance with the above scientific evidence, the Umbria region has experienced in the last 25 years recurrent and severe/extreme drought events, notably in 2001–2002, 2006–2007, 2011–2012, 2016–2017 and 2021–2023, often leading to the declaration of a state of natural disaster. These episodes caused significant reductions in freshwater availability with severe impacts on drinking water supply and marked declines in aquifer levels and surface water discharge. These particularly dry years are documented in regional reports and in those published by the Italian Institute for Environmental Protection and Research at the national level [31].
The aforementioned outcomes of trend analyses on multiple indices based on historical long-term time series of in situ observations and increasing drought frequency and intensity clearly show a gradual depletion of water resources in the Umbria region, reflecting the larger-scale warming trend currently impacting the Mediterranean area that is widely documented in the literature [32,33]. For this reason, the Umbria region is the ideal case study for developing a methodology for estimating freshwater availability and strategies for more sustainable water resource management.

2.2. NF Estimation Based on Two Selected Datasets

The proposed methodology is based on the part of the water balance that occurs in the soil of a portion of territory, treated as a control volume, that can be expressed by the following equation:
TPAE = R + G + ∆V
where: TP is the total precipitation occurring in the specific area over a certain time interval Δt; AE is the actual evapotranspiration, i.e., the amount of water that transitions to the vapour state from the soil through evaporation combined with the amount that vegetation draws from the soil via its root system and releases into the atmosphere via its foliage as a result of the transpiration process during the time interval Δt; R is the amount of runoff water during the time interval Δt; G is the amount of water contributing to aquifer recharge; ΔV is the change in water stored in the soil during the time interval Δt.
In the aforementioned balance equation, the actual external inflow and outflow in the area are considered negligible assuming a yearly time scale and a regional or greater spatial scale. As a result, the only source of renewable freshwater resource (the water naturally produced within the area in the time interval Δt) is exclusively precipitation that, after accounting for actual evapotranspiration, has fallen within that same area, i.e., what we defined net freshwater, NF = TP − AE. This quantity, identified as “internal flow” accordingly to [34,35], is a climatic water balance surplus that produces changes in runoff and sub-surface water resources according to Equation (1). In the context of this work, under the aforementioned assumptions, NF is considered directly related to available water for human use.
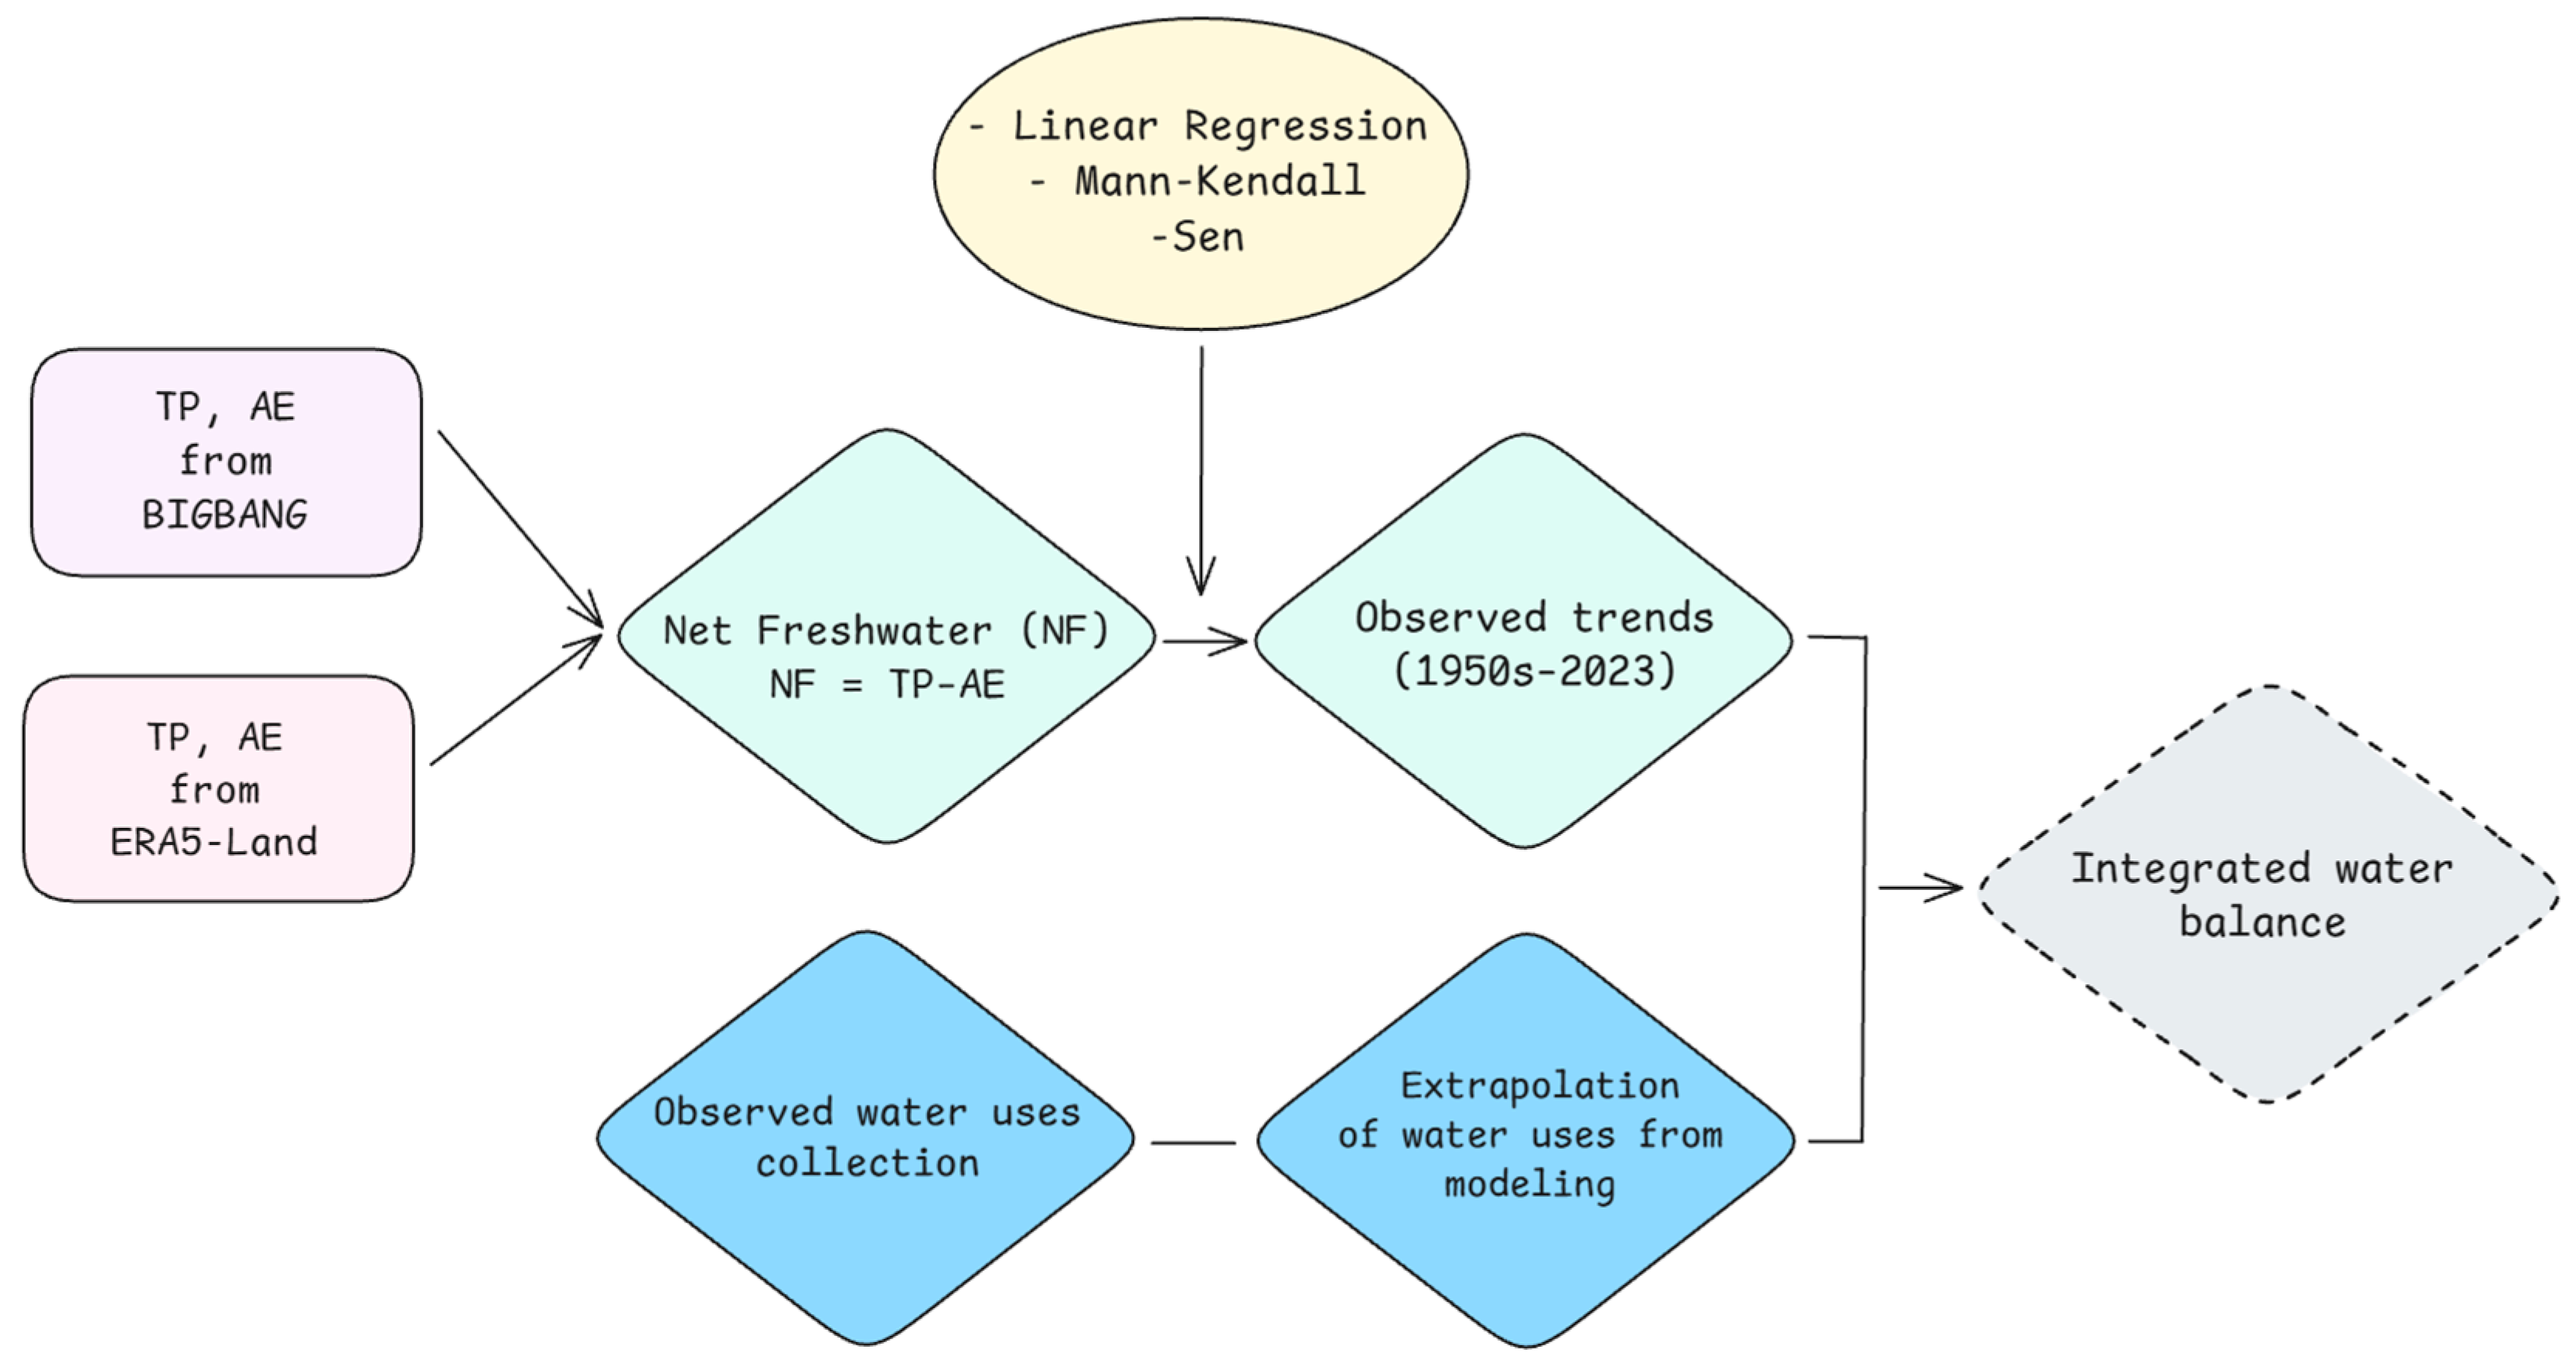
According to Figure 2, showing the rationale of the adopted methodology, to compute net freshwater (NF) at the regional scale as the difference between total precipitation and actual evapotranspiration, we derive TP and AE by two well-established, spatially distributed datasets, BIGBANG v8 [14] and ERA5-Land [13], with regard to the period from 1951 to 2023. The BIGBANG database, developed and released by the Italian Institute for Environmental Protection and Research (ISPRA), provides official components of the hydrological balance for the entire Italian territory on a monthly time scale and over a 1 × 1 km regular grid. The database exploits all the meteorological stations available across the Italian territory. Actual evapotranspiration is estimated through a simple method for assessing potential value requiring only monthly temperatures [36], combined with a soil water balance based on the scheme of [37], accounting for the actual soil water content available for evaporation and soil sealing. This information is aggregated at a 1 km scale using high-resolution data from the soil sealing layer produced by ISPRA [38], which in turn is based on the Imperviousness Layer from the Copernicus Land Monitoring Service, part of the EU Copernicus Earth Observation Programme.
ERA5-Land is one of the leading global reanalysis datasets. Produced within the Copernicus Programme and implemented by the ECMWF, ERA5-Land combines model outputs with worldwide observations to create a comprehensive and consistent global dataset. In ERA5-Land, actual evapotranspiration is computed through the H-TESSEL (Hydrology-Tiled ECMWF Scheme for Surface Exchange over Land) hydrological model [39] by solving water and energy balance equations. The database provides distributed estimates of total precipitation and actual evapotranspiration with a spatial resolution of 9 km and hourly temporal sampling on a global scale.
After assessing historical series of NF on a monthly scale from 1951 to 2023 with the spatial samplings of the two selected datasets, first, a check was performed to rule out the presence of autocorrelation in the data, and then three statistical tests, i.e., linear regression with estimation of growth/decline rate, the Mann–Kendall test [40,41] with a significance level α = 0.5 and Sen’s slope test [42], were applied to verify statistical significance of trends.
The Pearson correlation coefficient, r, and BIAS are used to compare the NF historical series from the two datasets.

2.3. Water Use Collection and Estimate

The quantification of available freshwater in the recent past and possibly for the future is nevertheless insufficient to provide the necessary information for the development of strategic water resource management policies. To this end, it is necessary to integrate the hydrological balance equation with the anthropogenic uses of water resources, which respond to various demands and significantly affect the hydrological cycle on par with natural processes. Thus, the main water demands have to be characterized, specifically civil water uses (water for domestic and potable use or equivalent), agricultural uses (mainly associated with irrigation), and industrial uses.
For this reason, a survey of the availability of data on water usage in the Umbria region was carried out to highlight critical issues and provide guidelines for the development of monitoring and information collection techniques. Specifically, considerations on a more reliable spatially distributed estimate of agricultural water use (actually consisting of irrigation water use) through satellite-derived estimates [43] have been made. However, estimates of sectoral water use coming from modelling platforms [44] have been considered as a basis for a first attempt of integrating natural water balance with human water consumption and requirements.

3. Results and Discussion

3.1. NF Estimates

Using the BIGBANG dataset, estimates of TP and AE were produced for the period 1951–2023 with monthly temporal resolution and 1 km spatial resolution in the study region. From these, spatially distributed values of NF were derived as the difference between TP and AE. The same was done starting from the ERA5-Land database but at the spatial scale of 9 km.
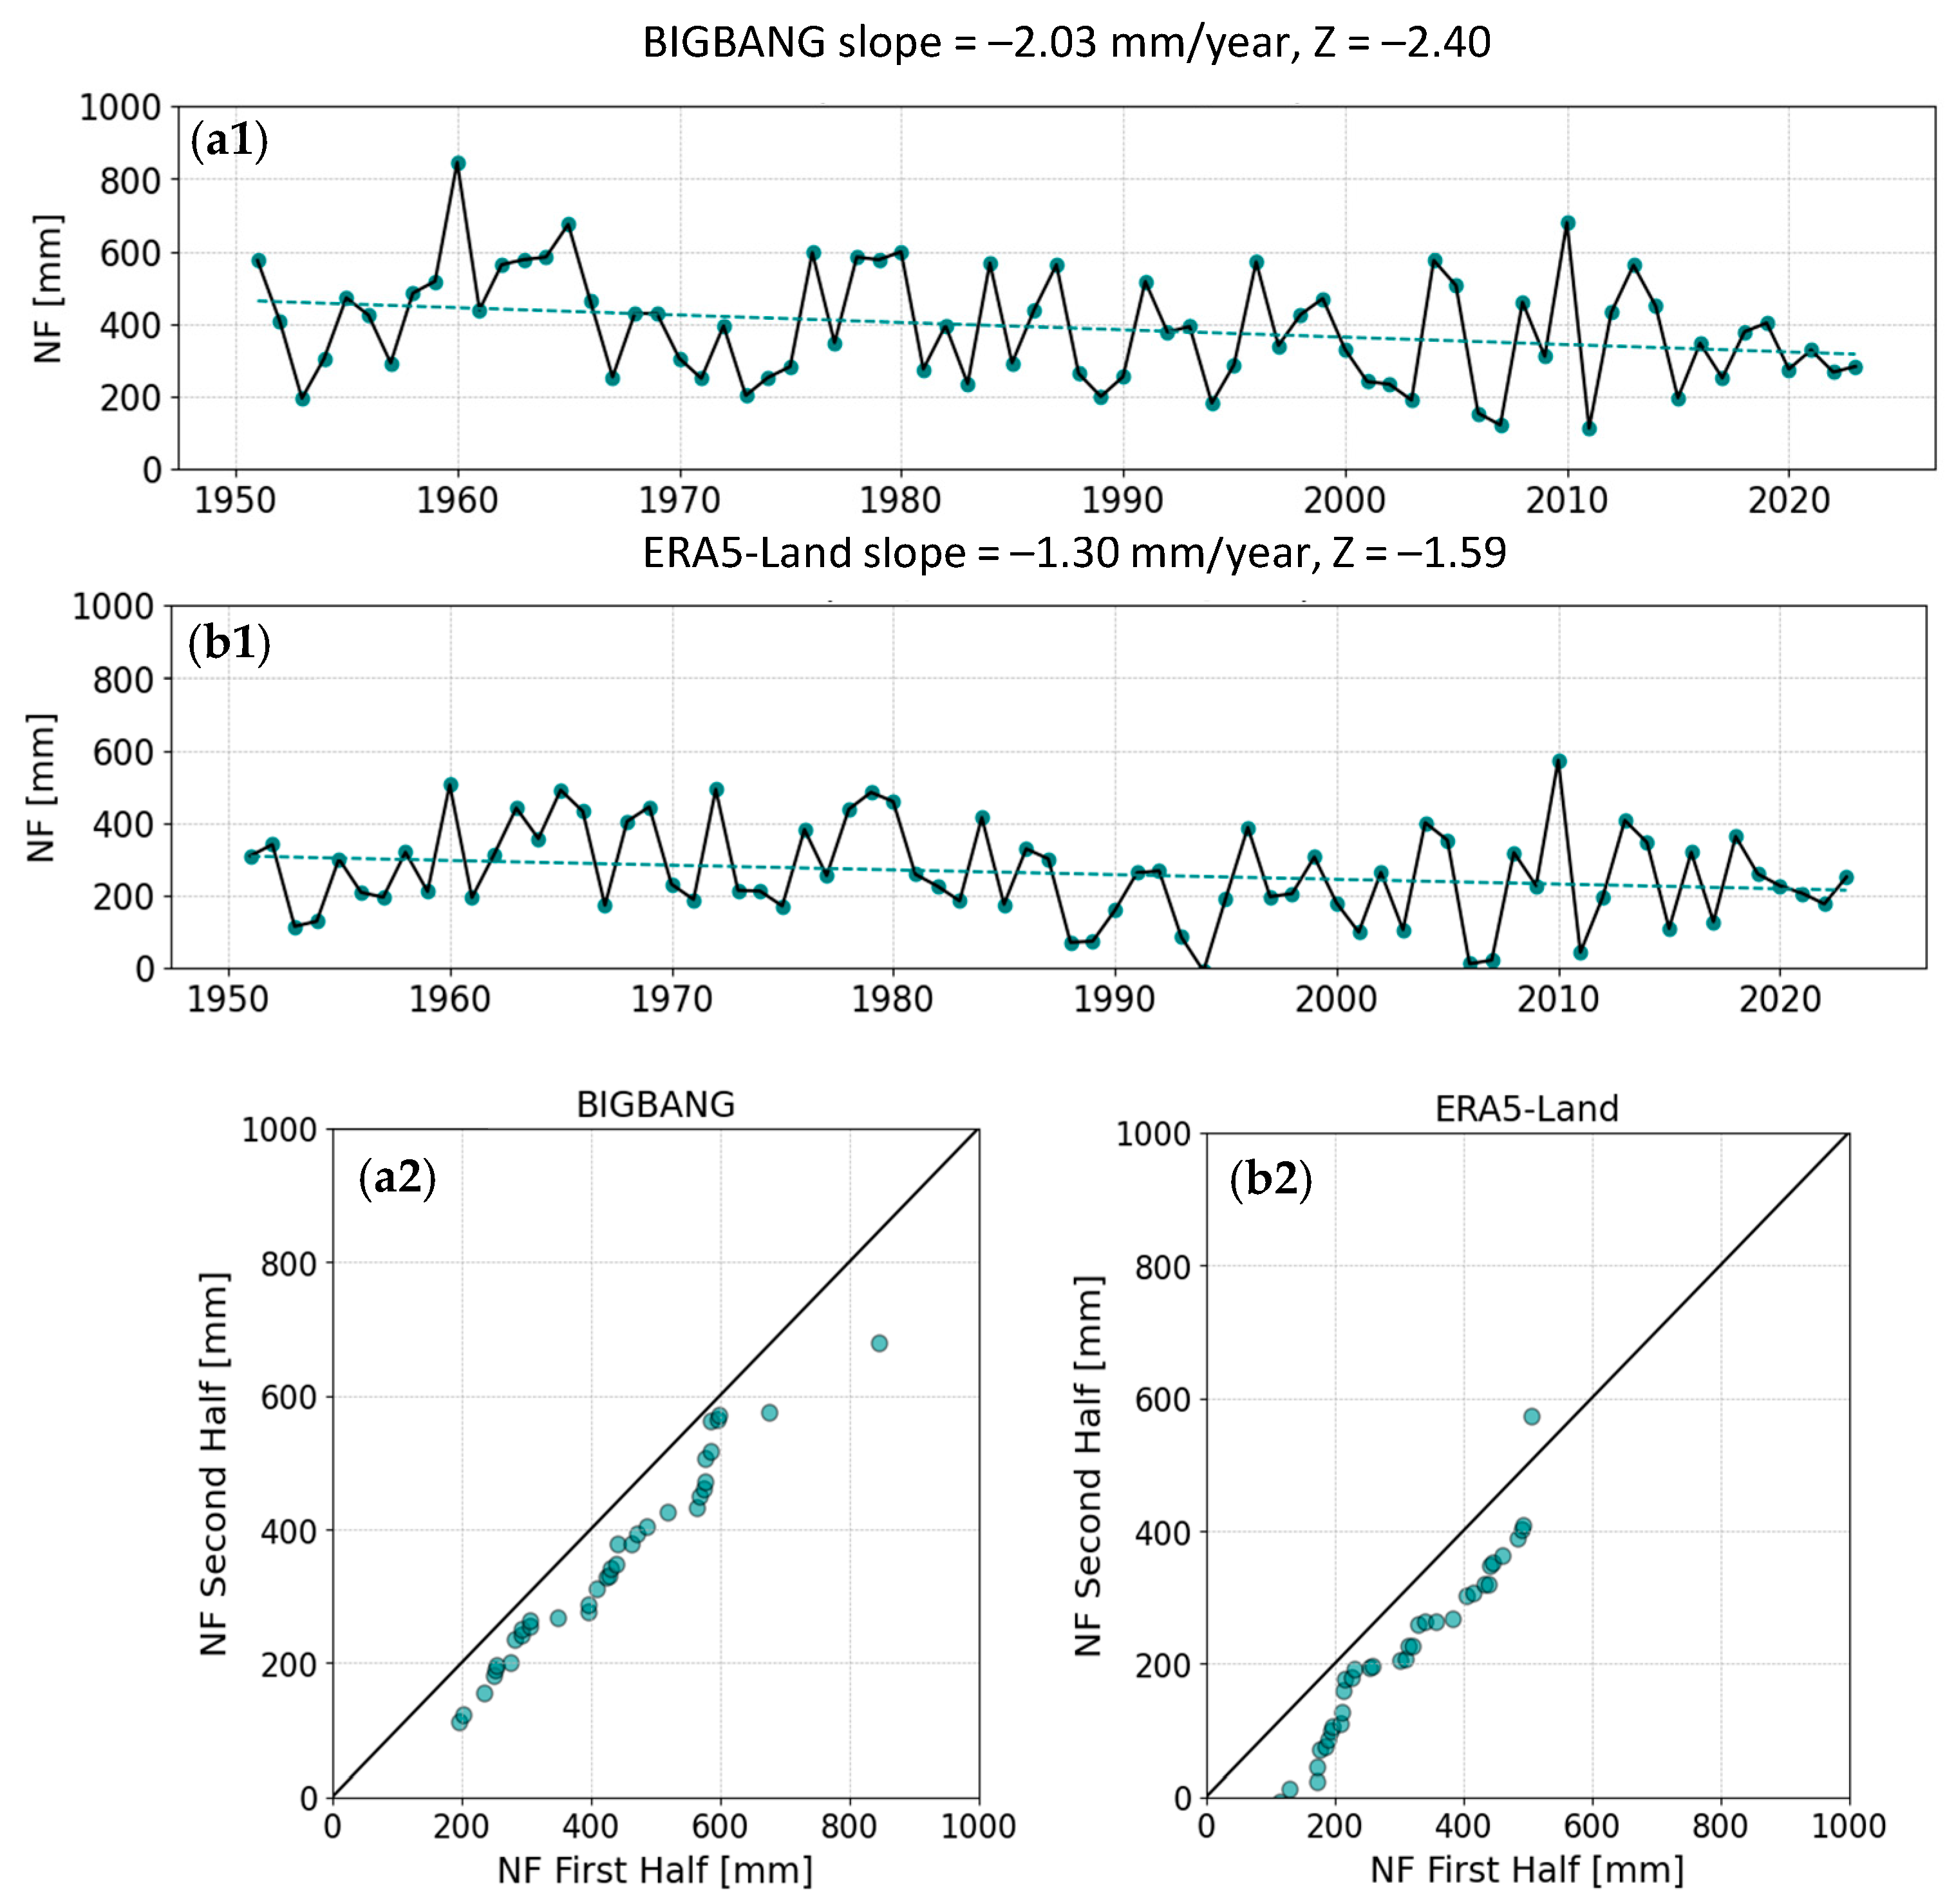
Figure 3 shows the historical time series of NF values, spatially averaged at the regional scale (Umbria region) and aggregated annually over the available period, together with the results of linear regression and Mann–Kendall and Sen tests. Panels (a1) and (a2) refer to the BIGBANG dataset, while panels (b1) and (b2) refer to ERA5-Land.
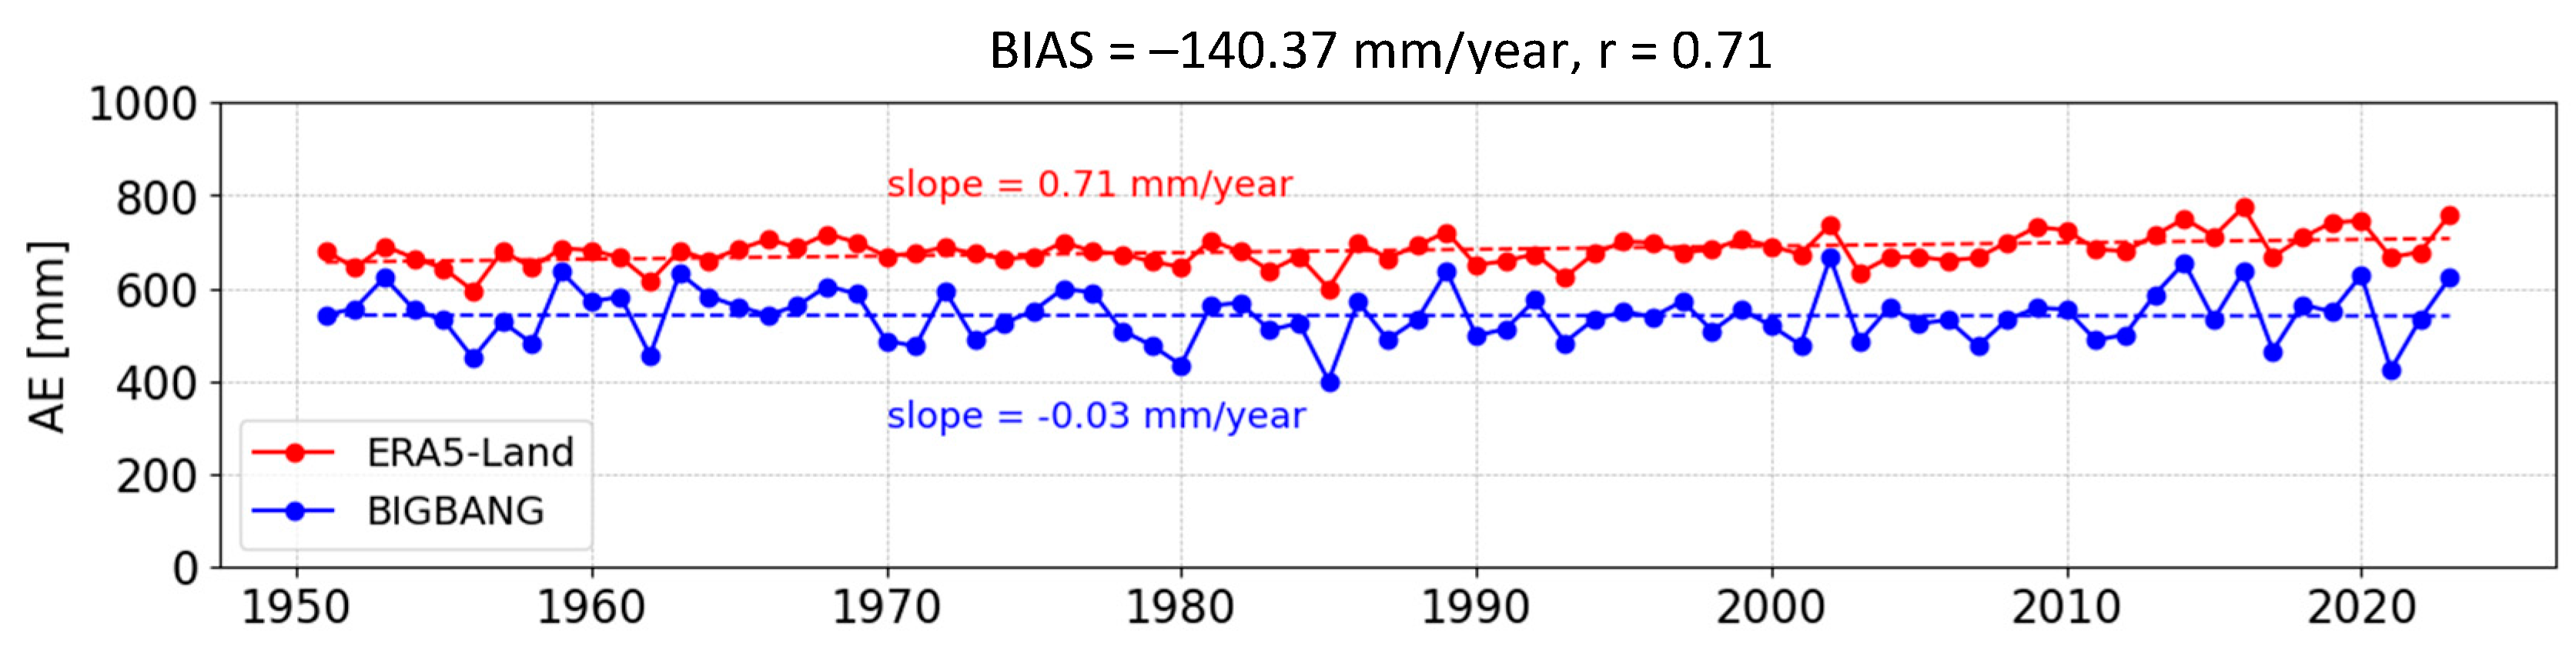
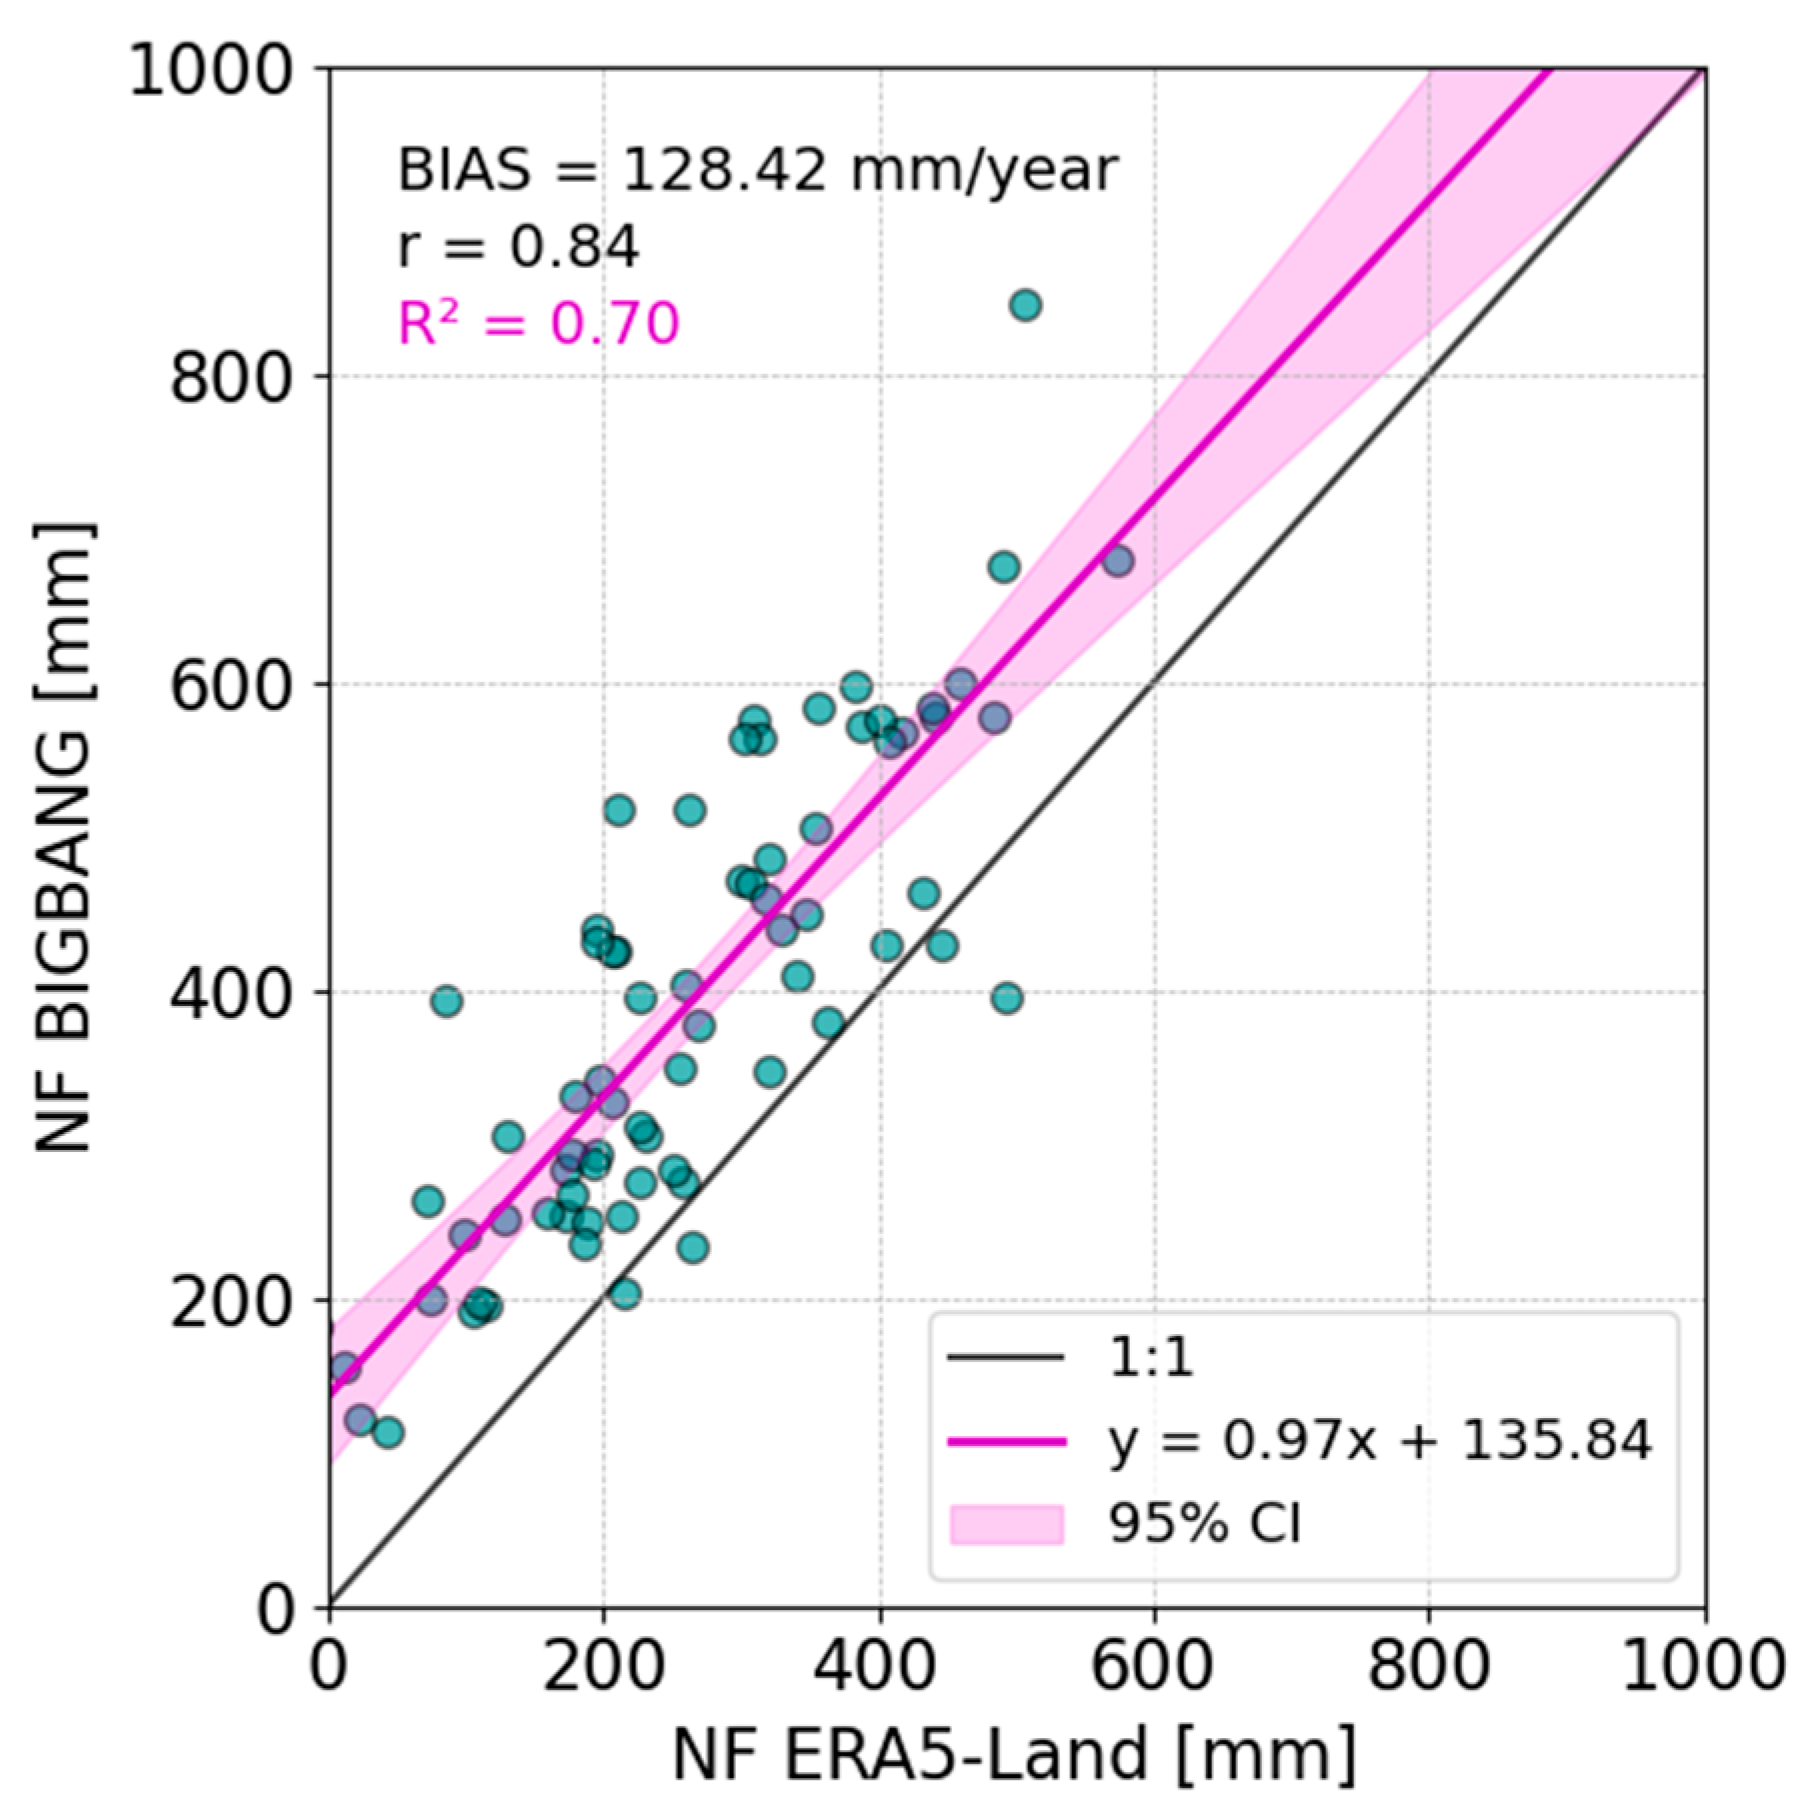
From the analysis of Figure 3(a1), a negative trend in available freshwater (expressed as water-equivalent height) is evident, with a decline rate of approximately −2.03 mm/year. This trend is statistically significant according to the Mann–Kendall test, as indicated by the Z-statistic value of Z = −2.4 (|Z| > 1.96) with additional metrics p = 0.02, 95%CI −3.67 to −0.32, and Sen’s slope −2.09 units/year, and is “monotonically decreasing” according to Sen’s test, with all plotted points falling below the 1:1 line that represents the two ordered halves of the NF series (Figure 3(a2)). By examining Figure 3(b1), a negative trend in available freshwater is confirmed, with decline rate of approximately −1.3 mm/year. This trend is not statistically significant according to the Mann–Kendall test (Z = −1.59, p = 0.11, 95%CI −2.85 to 0.27, and Sen’s slope = −1.26 units/year), but it is characterized overall as “monotonically decreasing” according to Sen’s test (Figure 3(b2)). Both datasets reveal a decreasing NF trend over the Umbria region, although with slightly different rates of decline, and seem to be highly correlated, with r equal to 0.84, as shown in the comparison between N F estimates from the two data sources provided in Figure 4. However, they show different NF magnitudes. The linear regression highlights a systematic shift between the two series, being almost parallel to the line indicating the 1:1 slope. Specifically, the BIGBANG approach yields higher absolute values of NF, with an average value of 390.3 mm/year, compared to the reanalysis, which provides an average value of 261.9 mm/year. This results in a B I A S of approximately 128.4 mm/year between the two series. Since the total precipitation is characterized by a negligible B I A S between the two approaches, the observed difference can be attributed to the different procedures for estimating actual evapotranspiration, which lead to varying results. Specifically, TP shows an average value of approximately 940 mm/year in both approaches, which is consistent with rainfall station records available at the regional scale. The decline rate is −0.6 mm/year for ERA5-Land and −2 mm/year for BIGBANG, with the latter being more aligned with estimates derived from available historical series in the Umbria region. As regards the AE estimate, Figure 5 shows that the average AE value produced by ERA5-Land over the whole period is 682 mm/year, while the corresponding value estimated using the BIGBANG dataset is lower, at 542 mm/year, resulting in a B I A S of approximately 140 mm/year. Regardless of the absolute values for the AE variable, both approaches show a substantially unchanged trend. The substantial increase in thermometric indicators observed across the region [20] would lead to a corresponding rise in potential evapotranspiration; however, the nearly invariant behaviour of actual evapotranspiration reflects more complex mechanisms including the decreasing availability of water in the soil due to progressive contraction of precipitation. The AE trends provided by the two datasets, although very different in magnitude, remain quite correlated, with r = 0.71.
In Figure 6, the NF results of the two datasets are shown in terms of normalized anomalies across the whole observation period. This figure confirms the good agreement between the two approaches since in most cases the relative lows of the trend, identifying particularly droughty years, are synchronous, but with different intensity. In addition, in both cases there is a good match of these lows with respect to documented water crises in more recent years, identified in the figure with yellow bands. This outcome can be considered a qualitative validation of the proposed approach in terms of ability to capture particularly droughty periods. This ability also allows us to extrapolate information for which there is no documentation on the occurrence of water crises. An overall analysis of Figure 6 clearly shows an increase in drought frequency and intensity over time across the region.

3.2. Insights for Strategic Water Resource Management

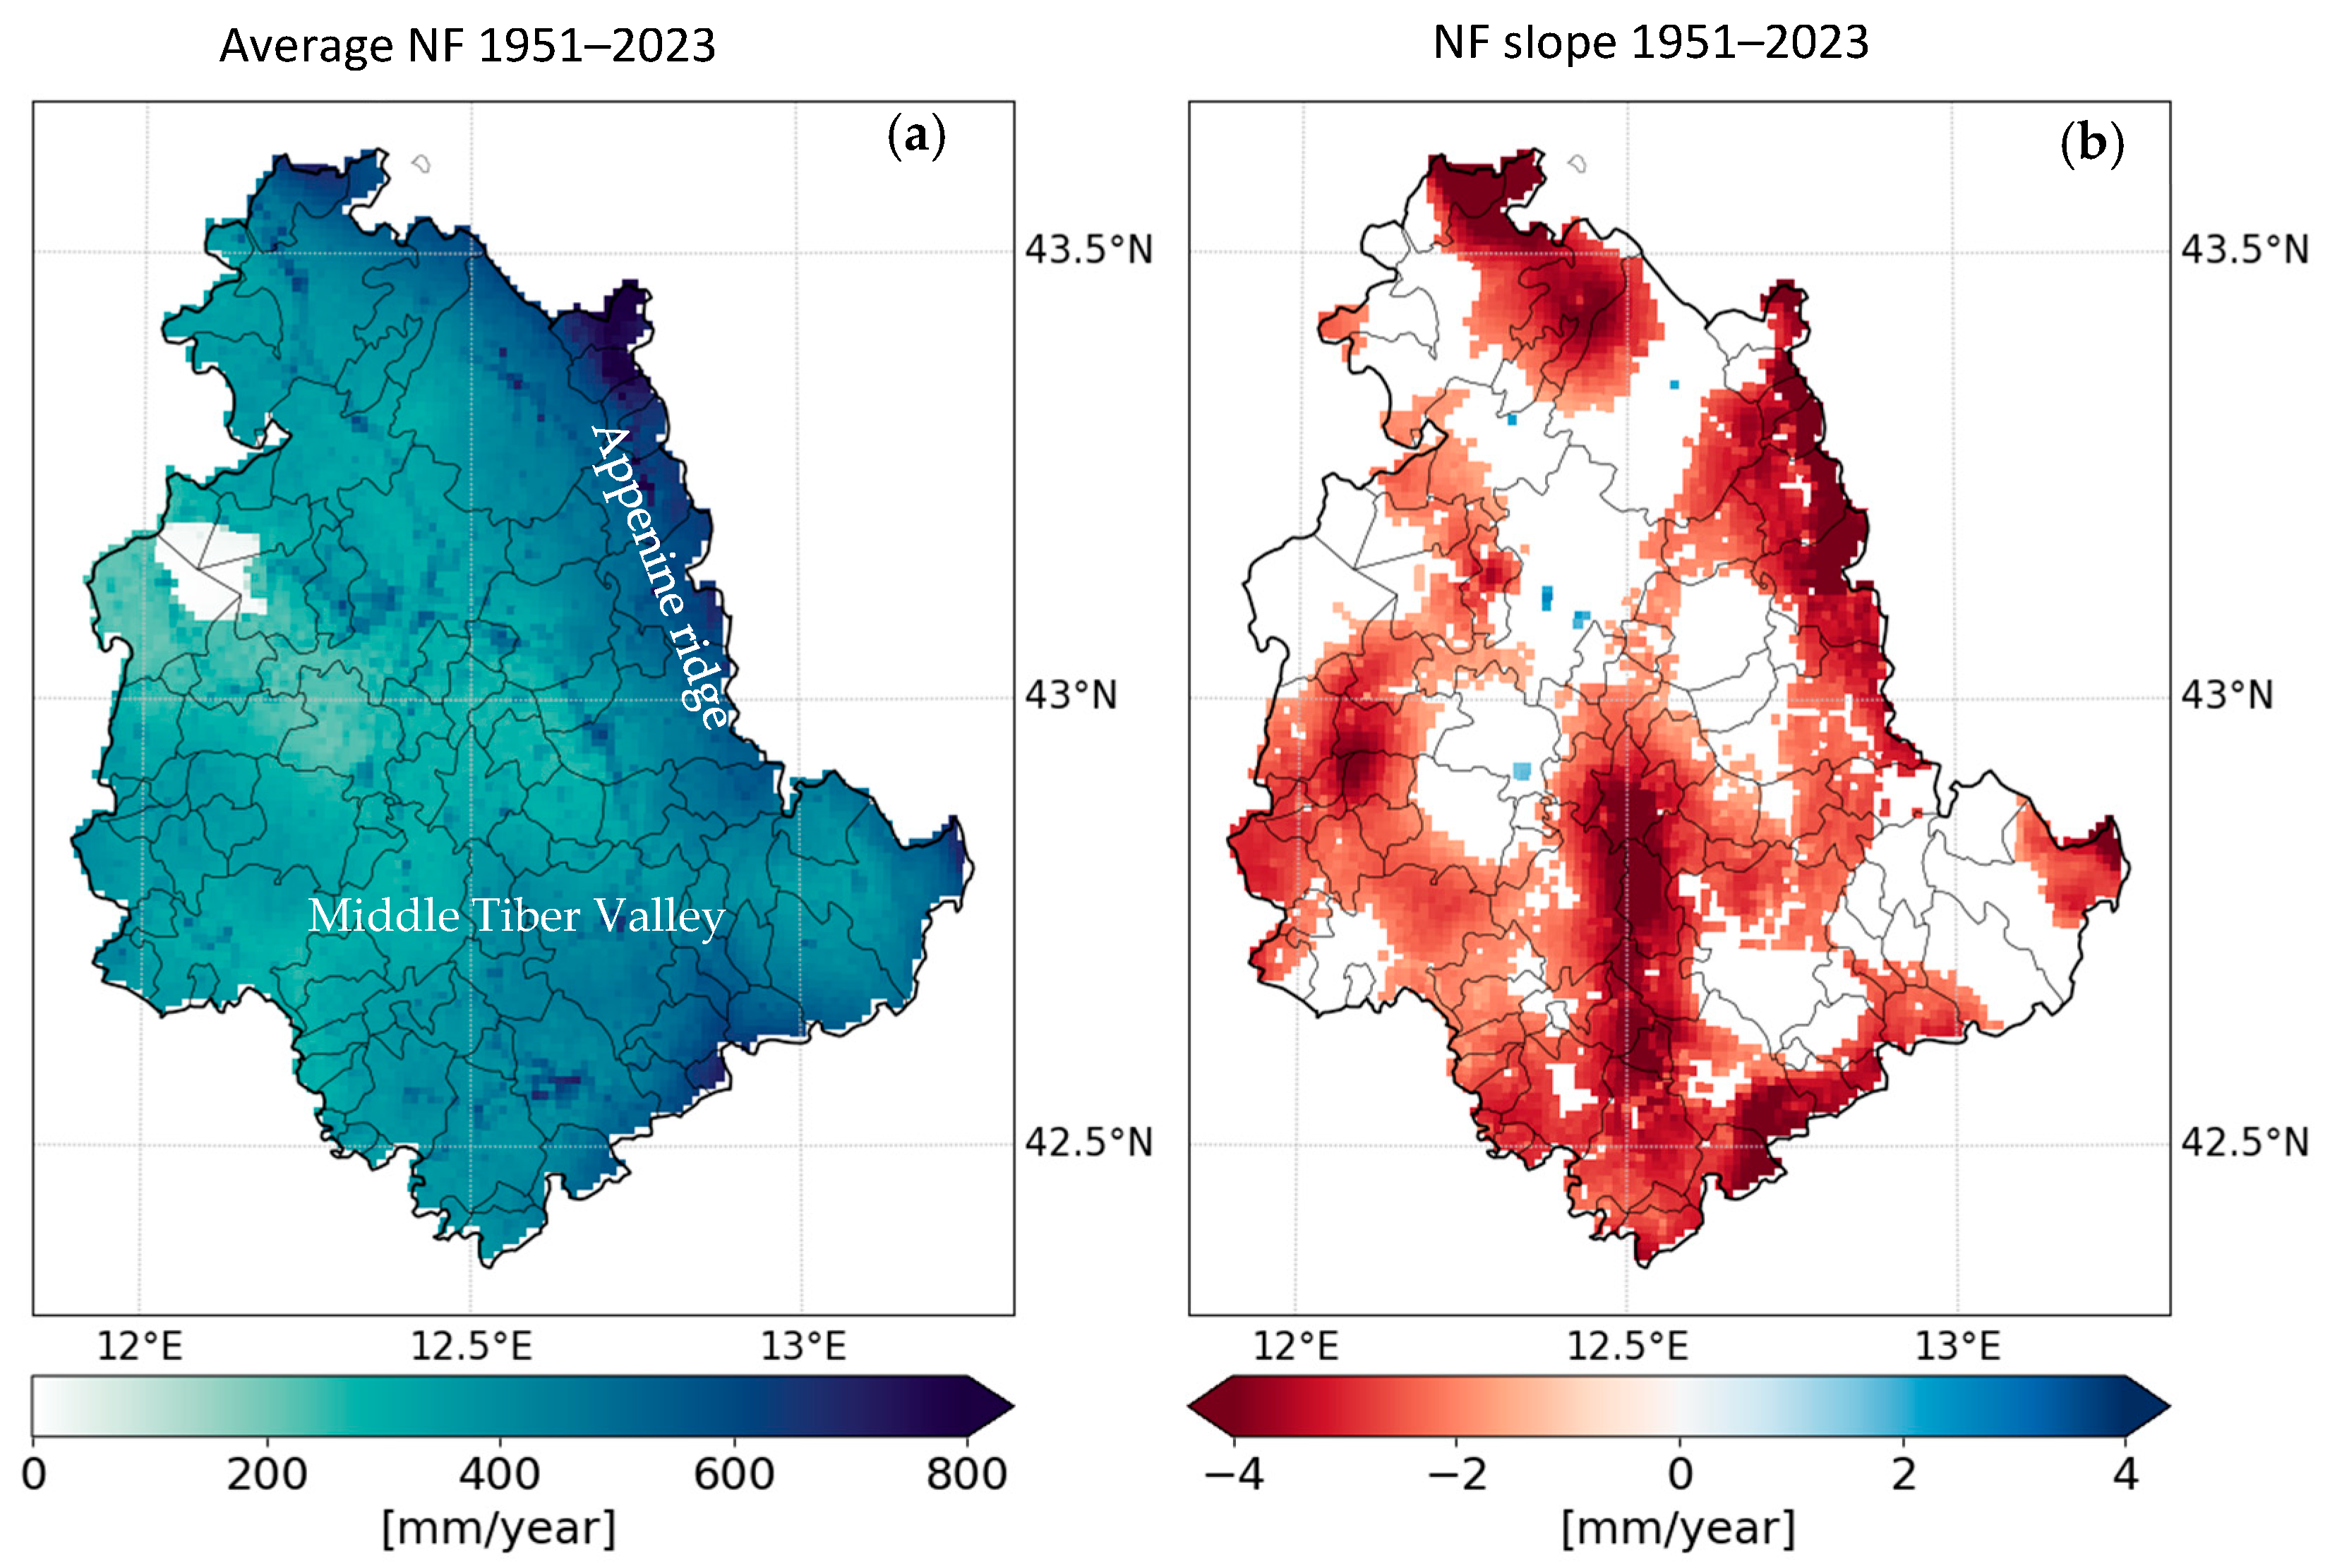
From the analysis presented above, the Umbria region is experiencing a significant reduction in available freshwater, corresponding to a water-equivalent height ranging from 96 to 148 mm over 73 years depending on the dataset used, which equates to approximately 10–16% of the average annual precipitation. To support assessments related to water resource management and regional supply sources, the results of the BIGBANG model, the only one of the two datasets with the proper spatial resolution to conduct such an investigation, were used for a distributed analysis, shown in Figure 7. Specifically, Figure 7a highlights the spatial distribution (at 1 km resolution) of the temporally averaged N F values across the entire regional territory. The figure shows a greater concentration of available freshwater along the Apennine ridge on the eastern border of the region, where the main springs are located, and lower availability in the middle Tiber Valley and the western portion of the region. Figure 7b displays the distribution of the pixel-wise slopes of NF determined by the linear regression but only plotted for the areas where a statistically significant trend is found according to the Mann–Kendall test (|Z| > 1.96). Combining the two outcomes depicted in the figures, it is possible to observe that the most water-rich areas are experiencing the greatest contraction (eastern border), together with the central–southern part of the Umbria region. The higher rates of NF decline in mountainous areas are likely the result of the combination of the observed significant rise in temperatures [20], one of the main drivers for potential evapotranspiration, and the high availability of water resources that supply the evaporative flux, leading to more limited water availability. The insights provided in Figure 7 by exploiting the dataset with higher spatial resolution can support strategic decisions for managing the various distributed water supply sources throughout the Umbria region in the near future.
An attempt was made to obtain spatially distributed NF data using the ERA5-Land dataset as well, but its coarse spatial resolution produced results that were smoothed out across the region and not very meaningful.

3.3. Guidelines for Water Balance Integration with Water Use

As the development of strategic water resource management policies requires the integration of the hydrological cycle with human water use, the first effort was directed to collect data on water withdrawals from the territory. This activity highlighted that there are still deficiencies in the monitoring and collecting regional system, which the authorities involved are working to address. As an example, representative of many regions of the Mediterranean area, the state of the art on the available data is described below. An alternative proposal for water use estimation by exploiting reconstructions of sectoral water uses from modelling [44] is then presented.

3.3.1. Data Collection in the Region

Over the Central Apennine River Basin District to which the Umbria region belongs, water is mainly used for civil purposes, followed by agricultural and industrial uses in comparable entities, according to estimates by Italian National Institute of Statistics [45]. However, there are no estimates available of the water volumes actually used in various applications based on data collected in the region to date. To fill this gap, an intensive survey on the various water uses at the regional level has been undertaken at this stage of the work, in collaboration with AURI (Umbrian Authority for Waste and Water). The goal is to characterize the framework of the hydraulic infrastructure serving the different uses in the regional territory and to highlight deficiencies in monitoring activity. The following information and critical points have been gathered.
Civil Uses
The integrated water service for civil use is entrusted to three operators under the supervision and coordination of AURI. More than 90% of the volume withdrawn for civil uses is measured [26,44]. The main water sources are wells and springs: the percentage withdrawn from well fields is 64.6%, while that from springs is 34.6%. The area richest in springs is located along the Apennine ridge at the eastern border. The only surface water source currently exploited is Montedoglio reservoir, which belongs to the neighbouring Tuscany region to the north. The regional water supply system for civil use is characterized by a high percentage of losses, approximately 42% on average, most of which are real losses due to the compromised integrity of the water distribution network elements (pipes, joints, branches, etc.) caused by ageing infrastructure, external stresses, and operational hydraulic conditions. The remaining losses are apparent, such as authorized but unmetered volumes or illegally withdrawn volumes. Consistent monitoring and collection of volumes withdrawn by the territory for civil use through various sources of supply has only started in very recent years. These data will be available in the near future for quantitative considerations.
Agricultural Uses
Agricultural water demand is mostly represented by irrigation use, since livestock-related demand is smaller. Although it accounts for the main use of freshwater resources with a share around 70% and 56% [45] of available freshwater at a global scale and in Italy, respectively, it does not appear to be the predominant water use so far in the Umbria region due to its geographical and climatic conditions. However, it is expected that the effects of climate change may alter the types of crops grown and agricultural practices in the region in the near future. In Italy, since 1998 a monitoring system for irrigation use was established, named SIGRIAN (National Information System for the Management of Water Resources in Agriculture) and managed by CREA-PB (Council for Agricultural Research and Economics—Policies and Bioeconomy Centre, formerly INEA), to which the local competent authorities, coordinated by the Regions and Public Administrations, are required to communicate irrigation withdrawal volumes at defined time intervals. Regarding self-supply withdrawals (i.e., private wells and derivations), data reporting is the direct responsibility of the regions, which should measure or estimate these volumes. Unfortunately, this system is not yet fully populated, and the available data are often represented by estimates of water demand rather than measured irrigation volumes. Therefore, the issue of monitoring volumes for irrigation use across the regional territory remains open. However, a new frontier which may contribute to solving this issue is represented by remote sensing technologies that can provide information on the extent, frequency, and quantity of irrigation, thanks to the availability of satellite products capable of delivering global estimates of soil moisture, land cover, or vegetation condition, with increasingly higher spatial and temporal resolution [46,47,48,49]. Along this line, in the near future it will be possible to exploit high-resolution satellite data (1 km) to provide irrigation estimates related to the recent past to be compared with data collected in specific irrigation districts across the region.
Industrial Uses
The industrial use of water resources refers to the volumes withdrawn by the manufacturing sector, which are estimated in Italy by Istat using a specific indicator called “water use intensity”. This indicator measures the volume of water needed to generate one unit of production value. Given the annual production figures for each manufacturing sector, it is possible to estimate the volumes withdrawn from water bodies for extractive and manufacturing activities. The most water-intensive manufacturing sectors in Italy are:
  • Coke, refined petroleum products, and chemicals (17.4%);
  • Metal products (excluding machinery) (13.6%);
  • Rubber and plastics (11.0%);
  • Textiles (8.8%).
About 10% of the national industrial water use is concentrated in the Central Apennine River Basin District, which includes the Umbria region. A separate consideration must be made for the use of water for hydropower production, which is an activity that, rather than resulting in actual consumption of water, leads to a reduction in its potential energy [26]. Hydroelectric power generation is significantly present in the region, with around 50 plants generating more than 700 MW of power. The entity responsible in Umbria for granting water use permits for industrial purposes is the regional government. At this stage, the regional authority is populating a platform with the water volumes granted to the various industrial activities present in the territory, which will be shared for quantitative analysis in the near future.

3.3.2. Water Use Estimates from Modelling

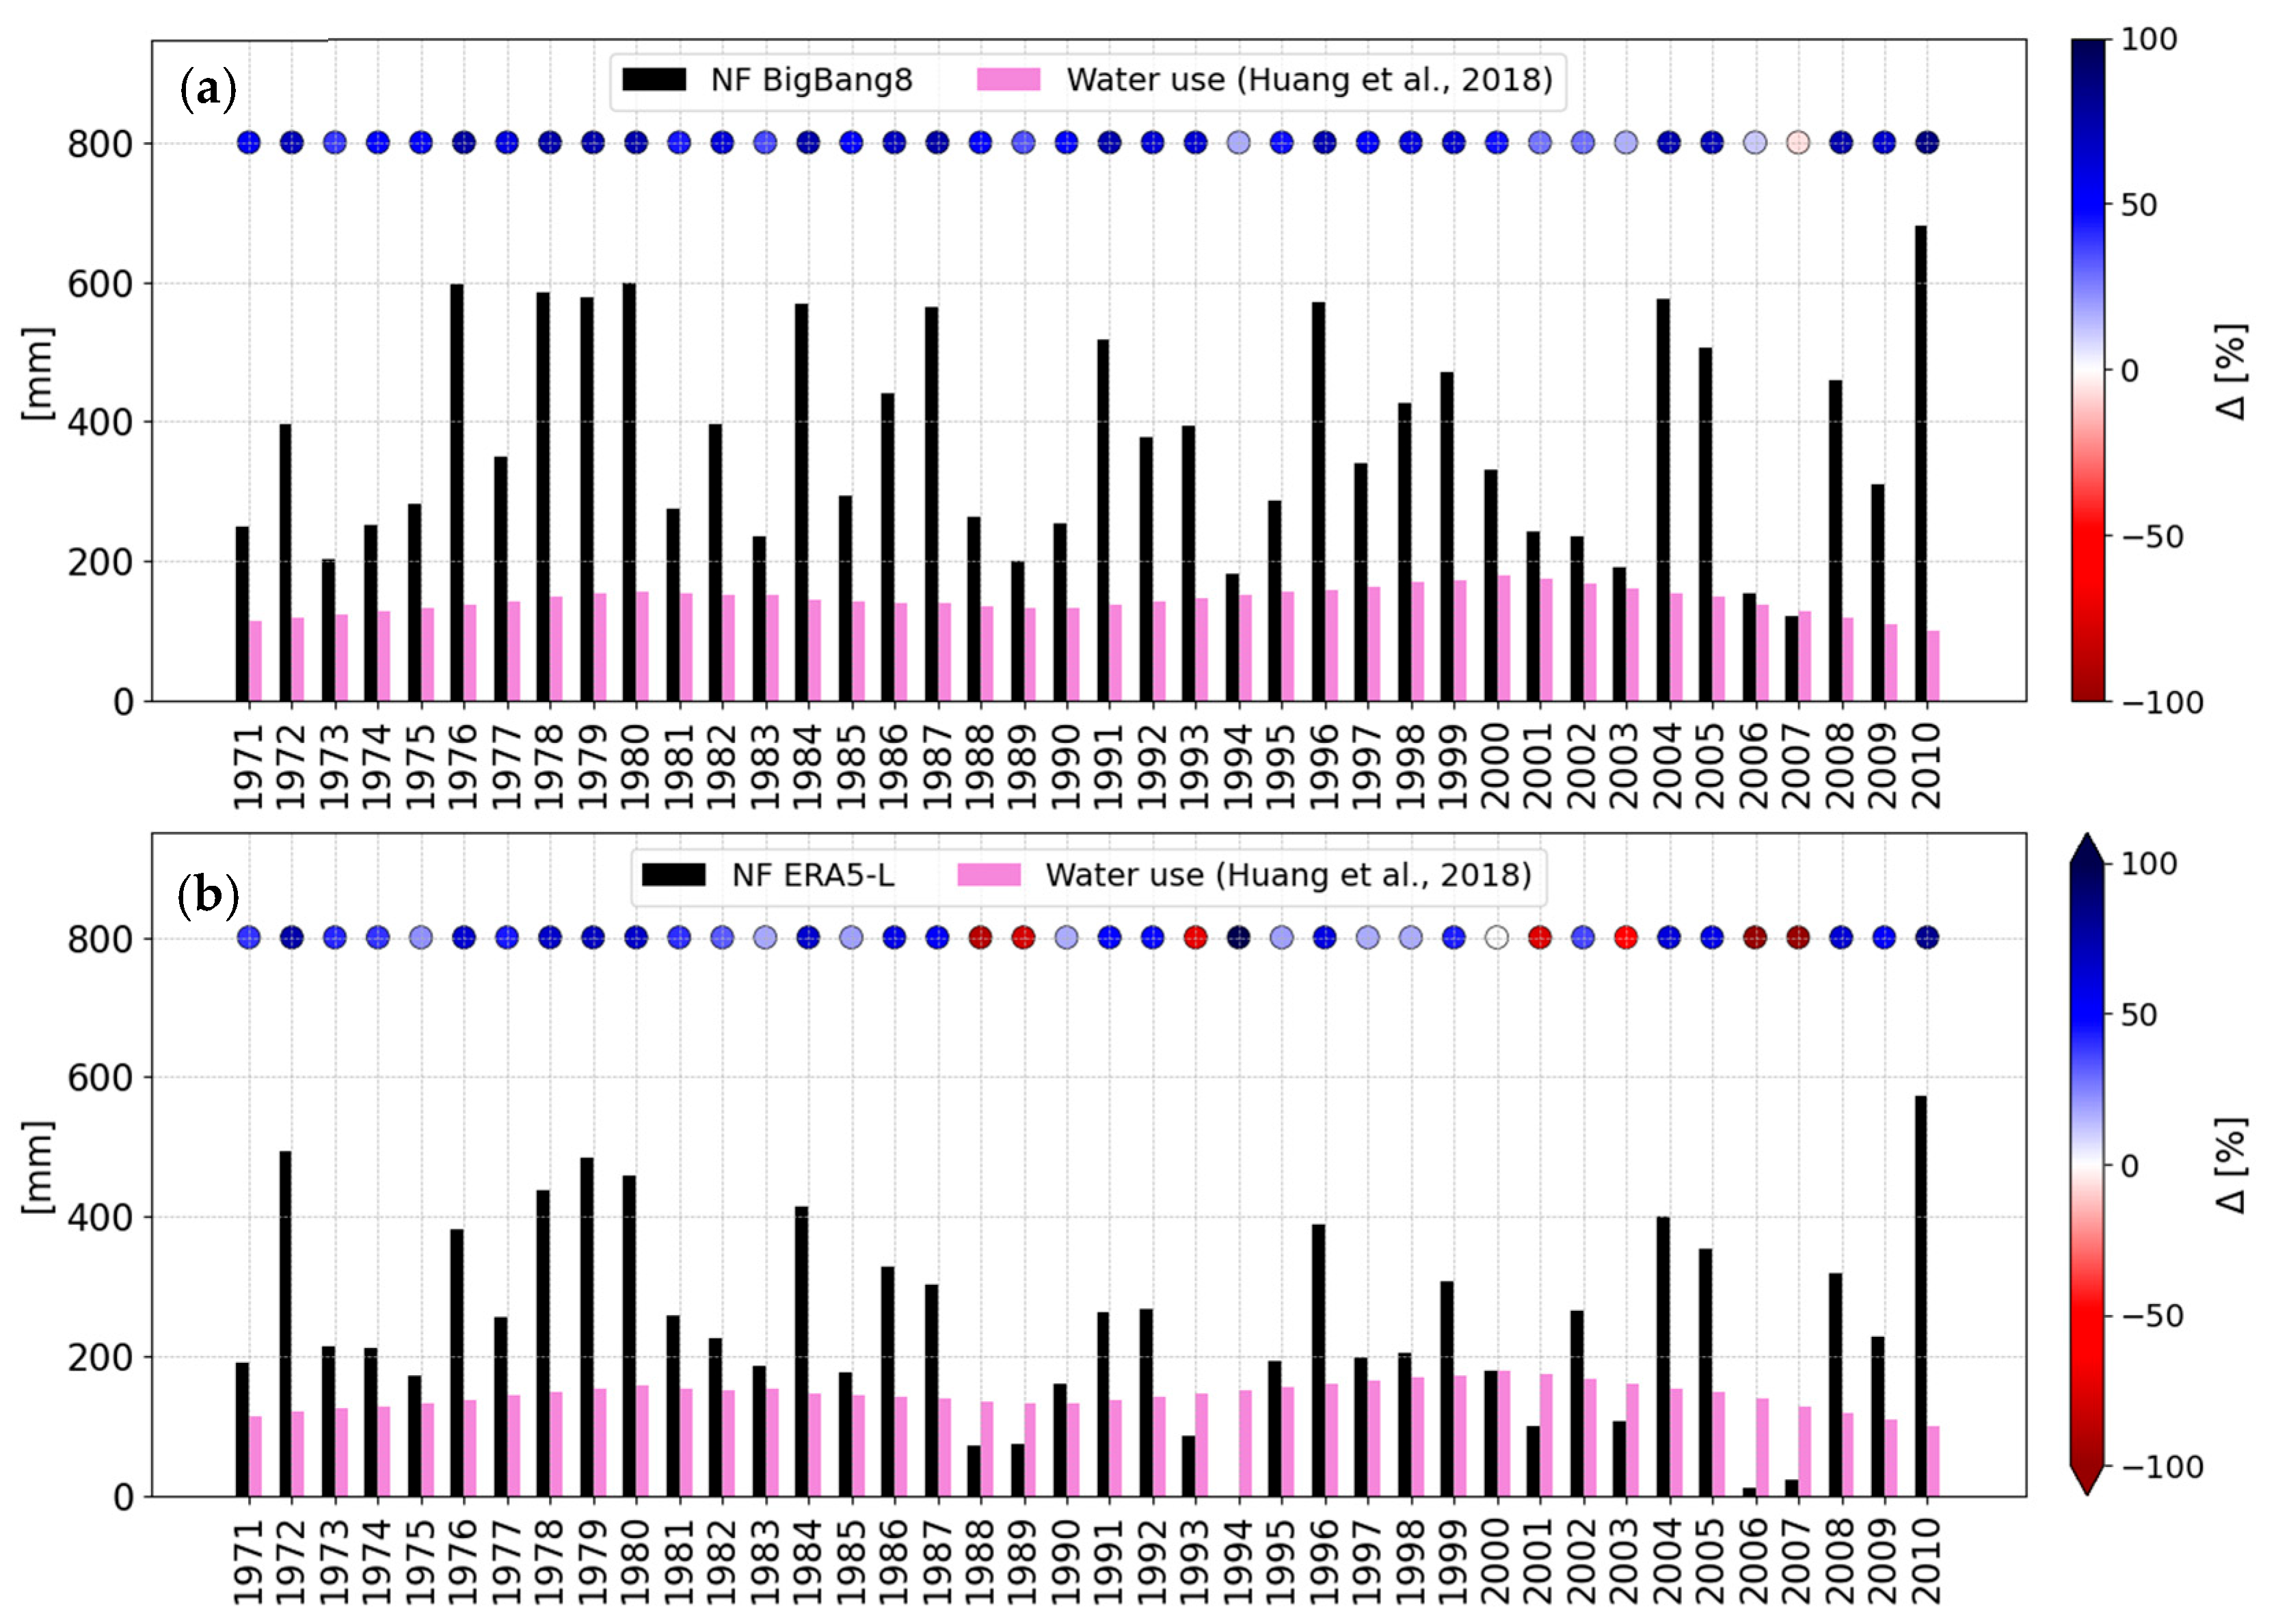
Pending the completion of quantitative assessments related to the various uses of water, global-scale reconstructions of anthropogenic water use in various sectors from [50] have been considered. The database relies on outputs of four global hydrological models and exploits ancillary information such as population distribution, national-scale industrial activity censuses, and areas equipped for irrigation. Data are provided on a 0.5° spatial resolution grid, monthly aggregated and for the period 1971–2010. Total water withdrawal including all water uses (domestic/civil, agricultural and industrial water uses) has been aggregated annually and averaged over the regional territory. This choice depends on the coarse spatial resolution of the data, making this dataset more appropriately applicable at greater spatial scales. The estimated values are shown in Figure 8, along with NF as derived from the BIGBANG and ERA5-Land datasets. According to the selected model ensemble, the water consumption for the combined civil, agricultural and industrial uses, expressed in equivalent water height, is about 144 mm/year (agricultural, industrial, and civil representing the 2.6%, 61.5%, and 35.9% of the total, respectively), with minimal fluctuations throughout the entire period. This result would buck the trend observed in many geographical areas, particularly those densely populated or with large irrigated cropland production, e.g., the United States, eastern China, India, and some parts of Europe, where total global water withdrawal has increased significantly during 1971–2010, mainly driven by the increase in irrigation water use [44]. This outcome could be justified by a limited use of water for irrigation in the region and also by the demographic crisis observed over the last 20 years, but further analyses need to be conducted based on actual water withdrawals in the Umbria region. In fact, at this stage, it is not possible to assess the reliability of the model ensemble’s estimates because data on the volumes actually withdrawn for different purposes have not been obtained yet. However, despite the current impossibility of validating the modelling approach, the latter nonetheless represents a significant advancement in knowledge. It enables estimation of the percentage difference with respect to NF, ∆, between available freshwater (NF) and the sum of estimated anthropogenic uses, TWU, according to the following equation:
∆ = (NFTWU)/NF
This quantity, synthesized by the colours of the circles in Figure 8, indicates a water deficit when negative. In certain years (1990, 1995, 2001–2003, and 2006–2007), water stress conditions occurred (i.e., the demand for water was greater than the available water), resulting in the total consumption of the available freshwater resource as calculated by BIGBANG (∆ values close to zero in Figure 8a) or even water deficits when using NF estimates derived from ERA5-Land (negative ∆ values in Figure 8b). Notably, the more recent of these critical years correspond to well-known drought years already identified in the Umbria region, confirming that the modelling approach used—though not necessarily precise in estimating water consumption—is nonetheless a valuable tool for identifying past and potentially future water deficit conditions.

4. Conclusions

In this study, we propose a methodology to estimate net freshwater (NF) available for meeting the water demand in different usage fields by exploiting temporally and spatially distributed data of precipitation and actual evapotranspiration provided by the BIGBANG and ERA5-Land datasets. The obtained results can contribute to developing policies for more sustainable water management in the context of global warming and increasing water requirements. The approach was applied at the regional scale in the Umbria region (central Italy), but it can be easily transferred to any other geographic area. The possible use of the ERA5-Land dataset providing the components of hydrological balance at the global scale also allows the upscaling of the methodology beyond the regional scale.
In addition to the estimation of NF, guidelines for properly monitoring and collecting data for performing the integration of water balance with actual water withdrawals are provided together with indications on the usage of global modelling platforms that are able to provide coarse resolution estimates of anthropogenic water consumption. The outcomes derived in the study region (Umbria) are as follows:
  • Both selected datasets show a declining NF (spatially averaged over the region) trend from 1951 to 2023, with decreasing rates of −2.03 mm/year (statistically significant) and −1.30 mm/year for BIGBANG and ERA5-Land, respectively, with a sharper decrease in areas with higher water availability where important supply sources are located; this will certainly have repercussions on the future management of water resources for civil, irrigation and industrial uses, with a probable reduction in hydroelectric production as well.
  • Despite differences in spatial resolution, the two datasets provide NF trends are highly correlated with each other (r = 0.84 considering spatially averaged magnitudes), and both successfully capture major droughts observed in the region since the 2000s. However, a significant shift was observed in N F estimates from the two datasets due to different approaches of calculating actual evapotranspiration. At this stage of the analysis, it is not yet possible to assess the accuracy of the estimates produced by the two datasets.
  • The representation of NF values and its decreasing rates provided by the BIGBANG approach, based on measured and modelled data, spatially distributed in the region and temporally averaged over the period, revealed it to be a valid tool to support water resource management and local supply sources. For this purpose, the dataset used to produce ERA5-Land does not appear sufficiently spatially distributed.
  • The combination of coarse-resolution reconstructions of water uses from modelling platforms (although not yet validated) with NF assessment provides insights in detecting water stress conditions that occurred in the past, due to the significant or even total consumption of the available freshwater resource.
  • Further effort must be made in extending and improving monitoring and collecting systems on water withdrawals, which is necessary to validate any kind of theoretical approach.
Building on the considerations above, the proposed methodology seems to be a valid tool to implement an integrated hydrological balance including natural processes affected by climate change and human activities in a specific area. It appears as the first step towards the development of a genuine coupled hydrology–water use model that can be a support for developing sustainable water management policies. Further developments will involve the full integration of the actual water uses, analyses on a seasonal scale to investigate sub-annual NF dynamics and the inclusion of projections of precipitation and temperature related to specific climatic scenarios, giving the approach the chance to be applied in forecast mode.

Author Contributions

Conceptualization, A.F. and R.M.; methodology, A.F., J.D., R.M. and C.S.; formal analysis A.F., J.D., R.M. and C.S.; investigation, R.M., A.F. and J.D.; resources, R.M., C.S. and A.F.; data curation, J.D., F.L., A.R., G.B. and S.M.; writing—original draft preparation, A.F. and J.D.; writing—review and editing, F.L., A.R., G.B., S.M., R.M. and C.S.; visualization, J.D., F.L. and A.R.; supervision, R.M. and C.S.; funding acquisition, R.M., A.F., C.S. and J.D. All authors have read and agreed to the published version of the manuscript.

Funding

This research received no external funding.

Data Availability Statement

BIGBANG v8 data can be freely downloaded at: https://groupware.sinanet.isprambiente.it/bigbang-data/library/bigbang_80 (accessed on 1 September 2025). The ERA5-Land database is accessible through the Copernicus Climate Data Store at: https://cds.climate.copernicus.eu/datasets/reanalysis-era5-land?tab=overview (accessed on 1 September 2025). Finally, reconstruction of sectoral water uses used in this study [44,50] is available at: https://zenodo.org/records/1209296 (accessed on 1 September 2025).

Acknowledgments

The authors acknowledge AURI (Autorità Umbra Rifiuti e Idrico) Umbria (https://www.auriumbria.it/) for support under the Interreg Europe Gov4Water project.

Conflicts of Interest

The authors declare no conflicts of interest.

References

  1. Giorgi, F. Climate change hot-spots. Geophys. Res. Lett. 2006, 33, L08707. [Google Scholar] [CrossRef]
  2. Kovats, R.S.; Valentini, R.; Bouwer, L.M.; Georgopoulou, E.; Jacob, D.; Martin, E.; Rounsevell, M.; Soussana, J.-F. Europe. In Climate Change 2014: Impacts, Adaptation, and Vulnerability. Part B: Regional Aspects. Contribution of Working Group II to the Fifth Assessment Report of the Intergovernmental Panel on Climate Change; Barros, V.R., Field, C.B., Dokken, D.J., Mastrandrea, M.D., Mach, K.J., Bilir, T.E., Chatterjee, M., Ebi, K.L., Estrada, Y.O., Genova, R.C., et al., Eds.; Cambridge University Press: Cambridge, UK; New York, NY, USA, 2014; pp. 1267–1326. [Google Scholar]
  3. Bednar-Friedl, B.; Biesbroek, R.; Schmidt, D.N.; Alexander, P.; Børsheim, K.Y.; Carnicer, J.; Georgopoulou, E.; Haasnoot, M.; Le Cozannet, G.; Lionello, P.; et al. Europe. In Climate Change 2022: Impacts, Adaptation and Vulnerability. Contribution of Working Group II to the Sixth Assessment Report of the Intergovernmental Panel on Climate Change; Pörtner, H.-O., Roberts, D.C., Tignor, M., Poloczanska, E.S., Mintenbeck, K., Alegría, A., Craig, M., Langsdorf, S., Löschke, S., Möller, V., et al., Eds.; Cambridge University Press: Cambridge, UK; New York, NY, USA, 2022; pp. 1817–1927. [Google Scholar] [CrossRef]
  4. Intergovernmental Panel on Climate Change—IPCC. Summary for Policymakers. In Climate Change 2023: Synthesis Report. Contribution of Working Groups I, II and III to the Sixth Assessment Report of the Intergovernmental Panel on Climate Change; Core Writing Team, Lee, H., Romero, J., Eds.; IPCC: Geneva, Switzerland, 2023; pp. 1–34. [Google Scholar] [CrossRef]
  5. Gao, X.; Giorgi, F. Increased Aridity in the Mediterranean Region under Greenhouse Gas Forcing Estimated from High Resolution Simulations with a Regional Climate Model. Glob. Planet. Change 2008, 62, 195–209. [Google Scholar] [CrossRef]
  6. Tsanis, I.K.; Koutroulis, A.G.; Daliakopoulos, I.N.; Jacob, D. Severe Climate-Induced Water Shortage and Extremes in Crete: A Letter. Clim. Change 2011, 106, 667–677. [Google Scholar] [CrossRef]
  7. Cammalleri, C.; Naumann, G.; Mentaschi, L.; Formetta, G.; Forzieri, G.; Gosling, S.; Bisselink, B.; De Roo, A.; Feyen, L. Global Warming and Drought Impacts in the EU; EUR 29956 EN; JRC118585; Publications Office of the European Union: Luxembourg, 2020. [Google Scholar] [CrossRef]
  8. Grillakis, M.G. Increase in severe and extreme soil moisture droughts for Europe under climate change. Sci. Total Environ. 2019, 660, 1245–1255. [Google Scholar] [CrossRef]
  9. Masseroni, D.; Camici, S.; Cislaghi, A.; Vacchiano, G.; Massari, C.; Brocca, L. The 63-year changes in annual streamflow volumes across Europe with a focus on the Mediterranean basin. Hydrol. Earth Syst. Sci. 2021, 25, 5589–5601. [Google Scholar] [CrossRef]
  10. Piao, S.; Ciais, P.; Huang, Y.; Shen, Z.; Peng, S.; Li, J.; Zhou, L.; Liu, H.; Ma, Y.; Ding, Y.; et al. The Impacts of Climate Change on Water Resources and Agriculture in China. Nature 2010, 467, 43–51. [Google Scholar] [CrossRef]
  11. Ji, L.; Li, Y.; Zhang, G.; Bi, Y. Anthropogenic Disturbances Have Contributed to Degradation of River Water Quality in Arid Areas. Water 2021, 13, 3305. [Google Scholar] [CrossRef]
  12. Xanke, J.; Liesch, T. Quantification and possible causes of declining groundwater resources in the Euro-Mediterranean region from 2003 to 2020. Hydrogeol. J. 2022, 30, 379–400. [Google Scholar] [CrossRef]
  13. Muñoz-Sabater, J.; Dutra, E.; Agustí-Panareda, A.; Albergel, C.; Arduini, G.; Balsamo, G.; Boussetta, S.; Choulga, M.; Harrigan, S.; Hersbach, H.; et al. ERA5-Land: A state-of-the-art global reanalysis dataset for land applications. Earth Syst. Sci. Data 2021, 13, 4349–4383. [Google Scholar] [CrossRef]
  14. Braca, G.; Mariani, S.; Lastoria, B.; Tropeano, R.; Casaioli, M.; Piva, F.; Marchetti, G.; e Bussettini, M. Bilancio Idrologico Nazionale: Stime BIGBANG e Indicatori Sulla Risorsa Idrica. Aggiornamento al 2023; Rapporti n. 401/2024; ISPRA: Rome, Italy, 2024. Available online: https://www.isprambiente.gov.it/public_files/Rapporto_BIGBANG.pdf (accessed on 1 September 2025).
  15. Mariani, S.; Braca, G.; Lastoria, B.; Tropeano, R.; Casaioli, M.; Piva, F.; Bussettini, M. Il bilancio idrologico, la disponibilità di risorsa idrica e il bilancio idrico. In Siccità, Scarsità e Crisi Idriche; Romano, E., Portoghese, I., Eds.; Cnr Edizioni: Rome, Italy, 2024; Volume 1, pp. 29–46. [Google Scholar] [CrossRef]
  16. Dari, J.; Quintana-Seguí, P.; Barella-Ortiz, A.; Rahmati, M.; Saltalippi, C.; Flammini, A.; Brocca, L. Quantifying the Hydrological Impacts of Irrigation on a Mediterranean Agricultural Context Through Explicit Satellite-Derived Irrigation Estimates. Water Resour. Res. 2024, 60, e2023WR036510. [Google Scholar] [CrossRef]
  17. Taylor, I.H.; Burke, E.; McColl, L.; Falloon, P.D.; Harris, G.R.; McNeall, D. The Impact of Climate Mitigation on Projections of Future Drought. Hydrol. Earth Syst. Sci. 2013, 17, 2339–2358. [Google Scholar] [CrossRef]
  18. Rahi, A.; Rahmati, M.; Dari, J.; Bogena, H.; Vereecken, H.; Morbidelli, R. Combining signal decomposition and deep learning model to predict noisy runoff coefficient. J. Hydrol. 2024, 641, 131815. [Google Scholar] [CrossRef]
  19. Bhattarai, N.; Pollack, A.; Lobell, D.B.; Fishman, R.; Singh, B.; Dar, A.; Jain, M. The impact of groundwater depletion on agricultural production in India. Environ. Res. Lett. 2021, 16, 085003. [Google Scholar] [CrossRef]
  20. Dari, J.; Flammini, A.; Morbidelli, R.; Rahi, A.; Saltalippi, C. Evolution of freshwater availability in a climate-changing Mediterranean context: The case of Umbria region, central Italy. Hydrol. Proc. 2023, 37, e15050. [Google Scholar] [CrossRef]
  21. Feng, W.; Zhong, M.; Lemoine, J.-M.; Biancale, R.; Hsu, H.-T.; Xia, J. Evaluation of groundwater depletion in North China using the Gravity Recovery and Climate Experiment (GRACE) data and ground-based measurements. Water Resour. Res. 2013, 49, 2110–2118. [Google Scholar] [CrossRef]
  22. Famiglietti, J.S. The global groundwater crisis. Nat. Clim. Change 2014, 4, 945–948. [Google Scholar] [CrossRef]
  23. Xue, C.; Ghirardelli, A.; Chen, J.; Tarolli, P. Investigating agricultural drought in Northern Italy through explainable Machine Learning: Insights from the 2022 drought. Comput. Electron. Agric. 2022, 227, 109572. [Google Scholar] [CrossRef]
  24. Biella, R.; Shyrokaya, A.; Ionita, M.; Vignola, R.; Sutanto, S.; Todorovic, A.; Teutschbein, C.; Cid, D.; Llasat, M.C.; Alencar, P.; et al. The 2022 Drought Needs to be a Turning Point for European Drought Risk Management. EGUsphere 2024. [Google Scholar] [CrossRef]
  25. Sistema Nazionale per la Protezione dell’Ambiente—SNPA. Il Clima in Italia Nel 2022. Report SNPA n. 36/2023. 2023. Available online: https://www.snpambiente.it/notizie/temi/meteo/il-clima-in-italia-nel-2022/ (accessed on 1 September 2025).
  26. Lauteri, M.; Amadio, J.; Braca, G.; Bussettini, M.; Casaioli, M.; Chiocchini, F.; Ciampittiello, M.; Ciolfi, M.; De Girolamo, A.M.; Di Salvo, C.; et al. Gli utilizzi idrici e la gestione sostenibile delle risorse. In Siccità, Scarsità e Crisi Idriche; Romano, E., Portoghese, I., Eds.; Cnr Edizioni: Rome, Italy, 2024; Volume 1, pp. 386–473. [Google Scholar] [CrossRef]
  27. European Environment Agency—EEA. Tracking Barriers and Their Impacts on European River Ecosystems; EU Publications: Luxembourg, 2021. [Google Scholar] [CrossRef]
  28. Amaranto, A.; Mancusi, L.; Viterbo, F.; Bonanno, R.; Braca, G.; Garofalo, E. Unravelling the uncertainties in the climate-water-energy interplay: A distributed analysis of the Italian territory. Renew. Energy 2025, 246, 122857. [Google Scholar] [CrossRef]
  29. Rahi, A.; Rahmati, M.; Dari, J.; Saltalippi, C.; Brogi, C.; Morbidelli, R. Unraveling hydroclimatic forces controlling the runoff coefficient trends in central Italy’s Upper Tiber Basin. J. Hydrol Reg. Stud. 2023, 50, 101579. [Google Scholar] [CrossRef]
  30. Mehta, P.; Siebert, S.; Kummu, M.; Deng, Q.; Ali, T.; Marston, L.; Xie, W.; Davis, K. Global Area Equipped for Irrigation Dataset 1900–2015 (v2), [Data set]. Zenodo 2022. [Google Scholar] [CrossRef]
  31. ISPRA—Italian Institute for Environmental Protection and Research. Nationwide Hydrological Water Budget: Focus on Drought and Natural Availability of Renewable Water Resources. Update to 2022; ISPRA Reports 388/2023; ISPRA: Rome, Italy, 2023. [Google Scholar]
  32. Stagge, J.H.; Kingston, D.G.; Tallaksen, L.M.; Hannah, D.M. Observed drought indices show increasing divergence across Europe. Sci. Rep. 2017, 7, 14045. [Google Scholar] [CrossRef]
  33. Lionello, P.; Scarascia, L. The relation between climate change in the Mediterranean region and global warming. Reg. Environ. Change 2018, 18, 1481–1493. [Google Scholar] [CrossRef]
  34. Eurostat & OCSE. Data Collection Manual for the OECD/Eurostat Joint Questionnaire on Inland Waters and Eurostat Regional Water Questionnaire. Concepts, Definitions, Current Practices, Evaluations and Recommendations, Version 4; Eurostat: Luxembourg, 2018. [Google Scholar]
  35. European Environment Agency—EEA. Definition of WISE SoE—Water Quantity (WISE-3) Dataset Version: November 2015, 2015. Available online: https://www.eea.europa.eu/en/datahub/datahubitem-view/a4324714-784a-4763-b8b9-b8939ead87fe?activeAccordion= (accessed on 1 September 2025).
  36. Thornthwaite, C.W. An approach toward a rational classification of climate. Geogr. Rev. 1948, 38, 55–94. [Google Scholar] [CrossRef]
  37. Thornthwaite, C.W.; Mather, J.R. The Water Balance; Laboratory of Climatology: Centerton, NJ, USA, 1955. [Google Scholar]
  38. Munafò, M.; Salvati, L.; Zitti, M. Estimating Soil Sealing Rate at National Level—Italy as a Case Study. Ecol. Indic. 2013, 26, 137–140. [Google Scholar] [CrossRef]
  39. Balsamo, G.; Viterbo, P.; Beljaars, A.; van den Hurk, B.; Hirschi, M.; Betts, A.K.; Scipal, K. A revised hydrology for the ECMWF model: Verification from field site to terrestrial water storage and impact in the Integrated Forecast System. J. Hydrometeorol. 2009, 10, 623–643. [Google Scholar] [CrossRef]
  40. Mann, H.B. Nonparametric tests against trends. Econometrica 1945, 13, 46–59. [Google Scholar] [CrossRef]
  41. Kendall, M.G. Rank Correlation Methods; The Griffin Clerkenwell Road: London, UK, 1975. [Google Scholar]
  42. Şen, Z. Innovative trend analysis methodology. J. Hydrol. Eng. 2012, 17, 1042–1046. [Google Scholar] [CrossRef]
  43. Dari, J.; Filippucci, P.; Brocca, L. The development of an operational system for estimating irrigation water use reveals socio-political dynamics in Ukraine. Hydrol. Earth Syst. Sci. 2024, 28, 2651–2659. [Google Scholar] [CrossRef]
  44. Huang, Z.; Hejazi, M.; Li, X.; Tang, Q.; Leng, G.; Liu, Y.; Döll, P.; Eisner, S.; Gerten, D.; Hanasaki, N.; et al. Reconstruction of global gridded monthly sectoral water withdrawals for 1971–2010 and analysis of their spatiotemporal patterns. Hydrol. Earth Syst. Sci. 2018, 22, 2117–2133. [Google Scholar] [CrossRef]
  45. Italian National Institute of Statistics—Istat. Utilizzo e Qualità Della Risorsa Idrica in Italia; Tersigni, S., Ed.; Istat: Rome, Italy, 2019. [Google Scholar]
  46. Brocca, L.; Tarpanelli, A.; Filippucci, P.; Dorigo, W.; Zaussinger, F.; Gruber, A.; Fernández-Prieto, D. How much water is used for irrigation? A new approach exploiting coarse resolution satellite soil moisture products. Int. J. Appl. Earth Obs. Geoinf. 2018, 73, 752–766. [Google Scholar] [CrossRef]
  47. Brombacher, J.; de Oliveira Silva, I.R.; Degen, J.; Pelgrum, H. A novel evapotranspiration based irrigation quantification method using the hydrological similar pixels algorithm. Agric. Water Manag. 2022, 267, 107602. [Google Scholar] [CrossRef]
  48. Dari, J.; Brocca, L.; Modanesi, S.; Massari, C.; Tarpanelli, A.; Barbetta, S.; Quast, R.; Vreugdenhil, M.; Freeman, V.; Barella-Ortiz, A.; et al. Regional data sets of high-resolution (1 and 6 km) irrigation estimates from space. Earth Syst. Sci. Data 2023, 15, 1555–1575. [Google Scholar] [CrossRef]
  49. Dari, J.; Lo Presti, S.; Brocca, L. Irrigation monitoring from satellite at hyper-high resolution: Paving the way for remote-sensing-based agricultural water management support services. Agric. Water Manag. 2025, 317, 109627. [Google Scholar] [CrossRef]
  50. Huang, Z.; Hejazi, M.; Li, X.; Tang, Q.; Vernon, C.; Leng, G.; Liu, Y.; Döll, P.; Eisner, S.; Gerten, D.; et al. Global Gridded Monthly Sectoral Water Use Dataset for 1971–2010: V2. 2018. Available online: https://zenodo.org/records/1209296 (accessed on 1 September 2025).
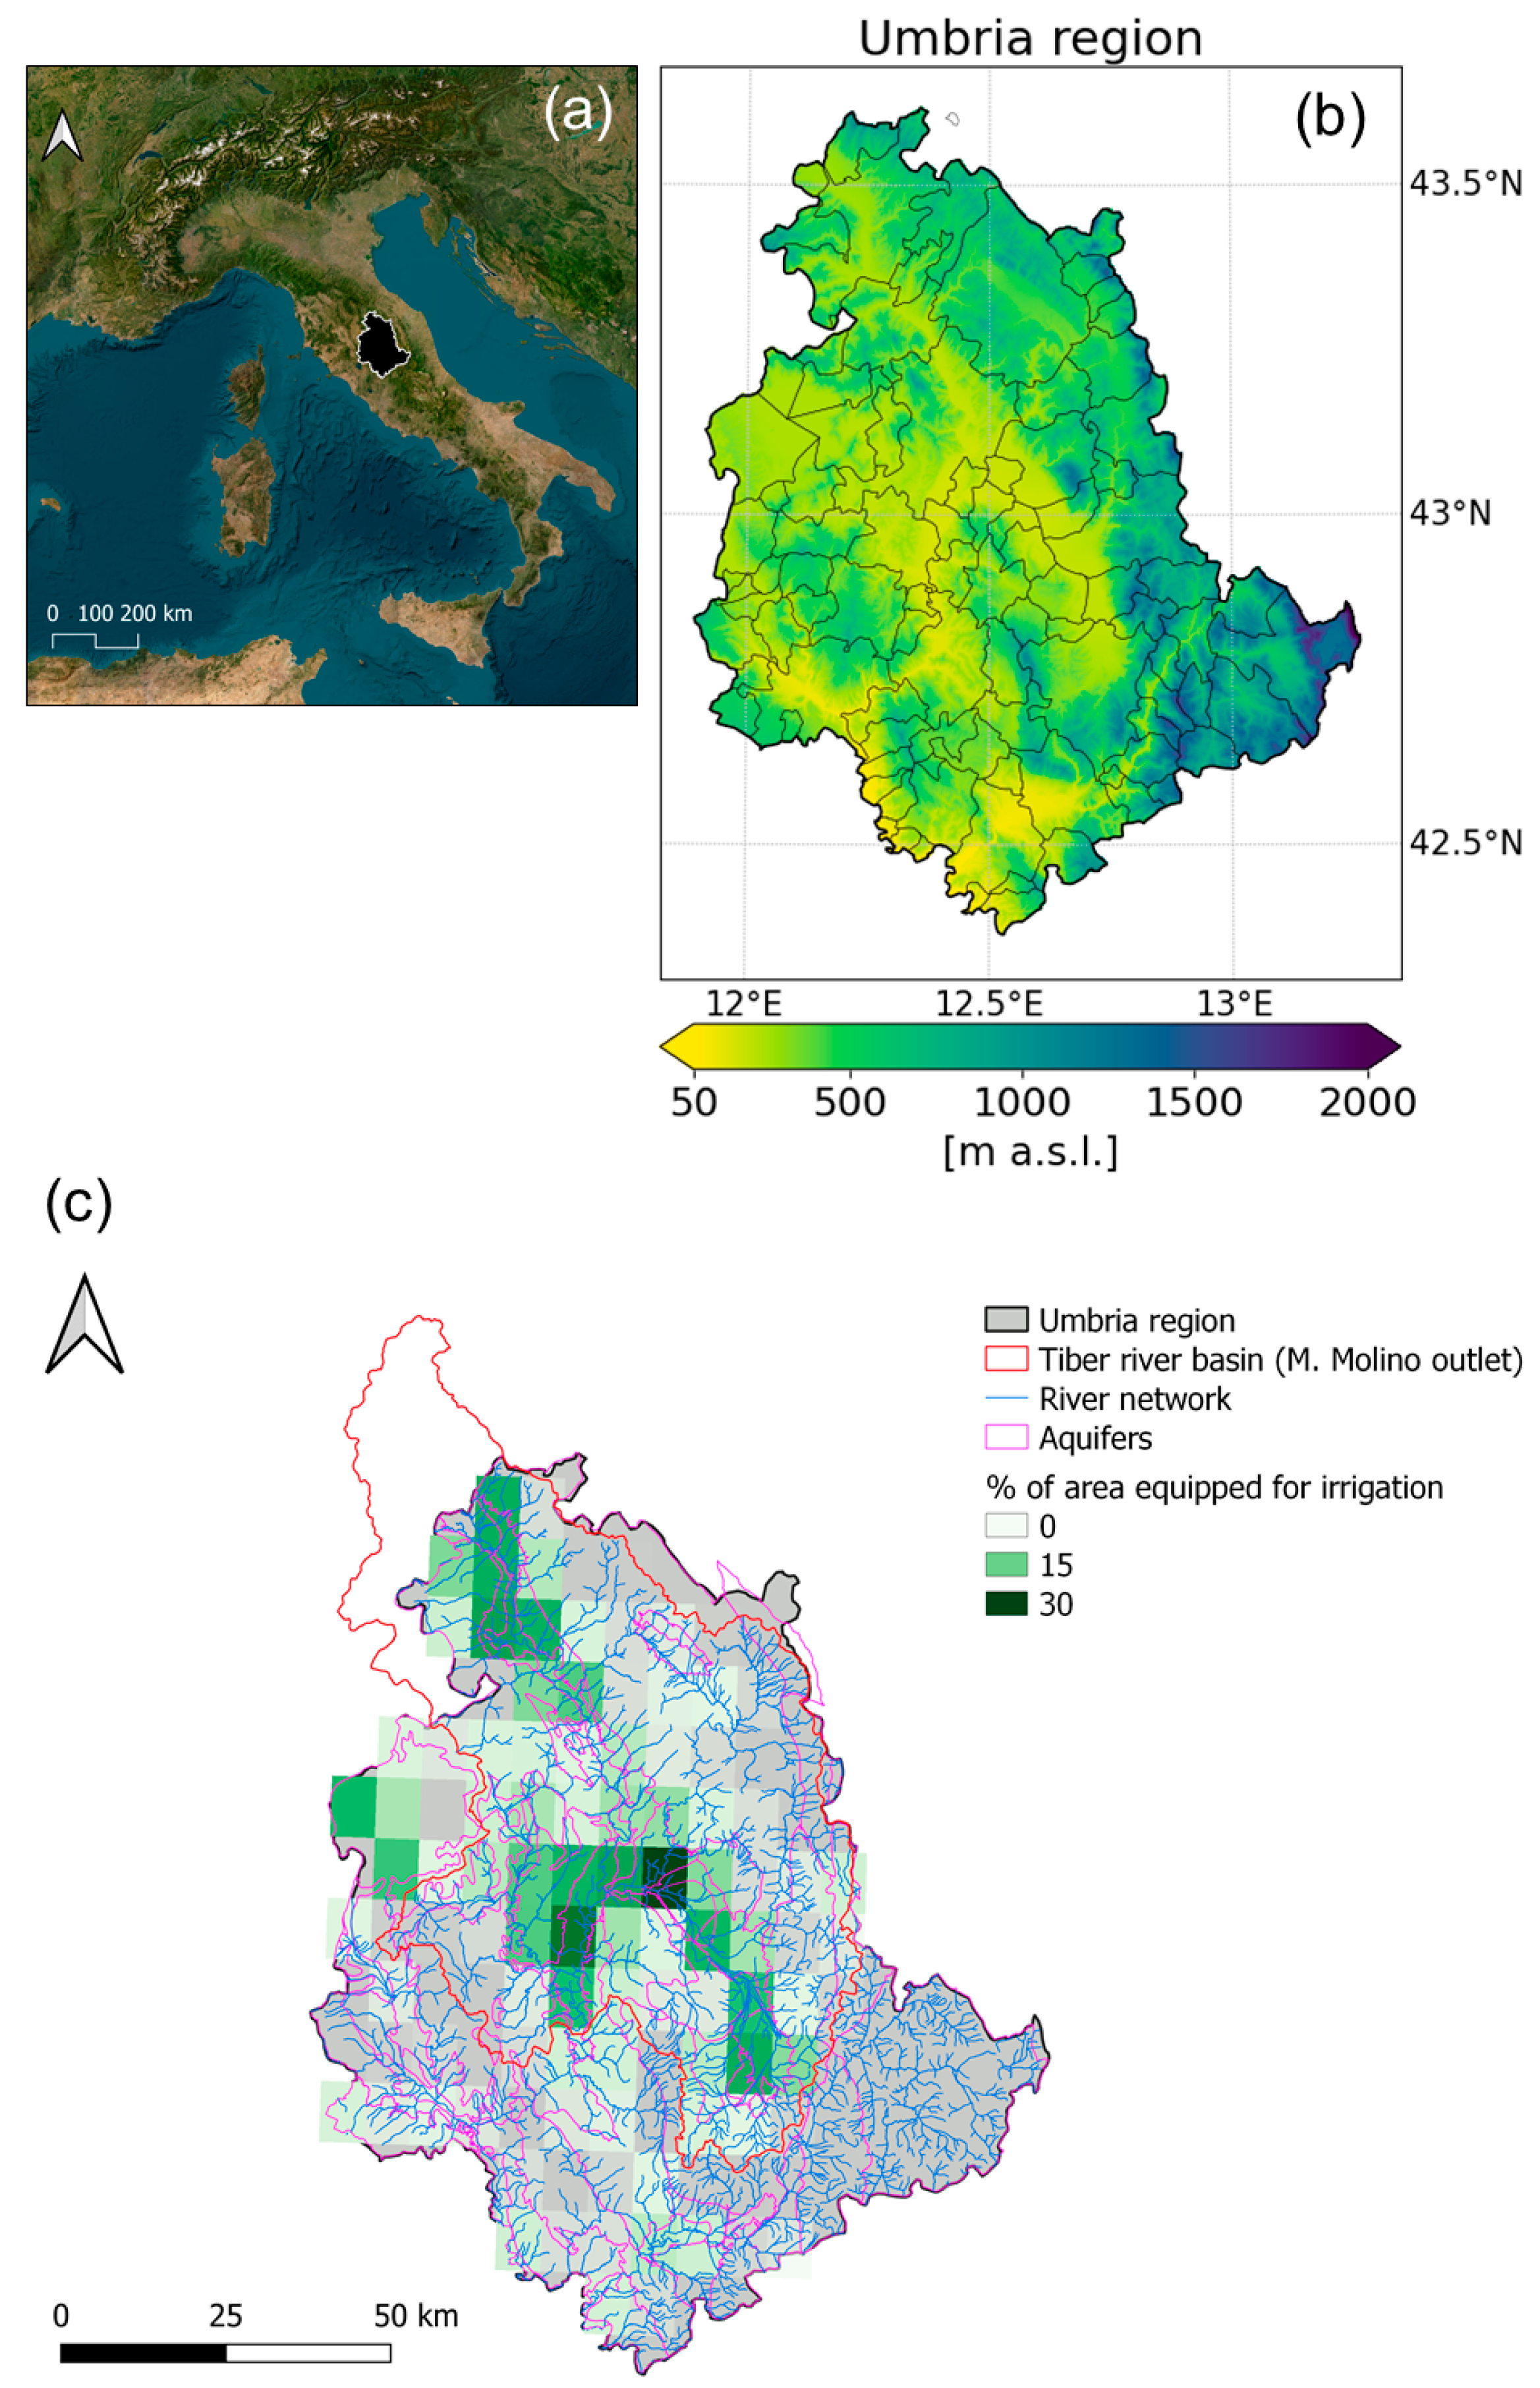
Figure 1. Location of the Umbria region (central Italy) (a); Digital Elevation Model (DEM) derived from v1.1 of Copernicus EU-DEM, available through the Copernicus Land Monitoring Service (b); relevant hydrologic information in the region (aquifers, rivers, and areas equipped for irrigation) (c).
Water 18 01290 g001
Figure 2. Overarching scheme of the applied methodology.
Water 18 01290 g002
Figure 3. Historical series of net available freshwater (NF), expressed in terms of water-equivalent height, and relative linear regression and Mann–Kendall test results, derived from the BIGBANG dataset (a1) and the ERA5-Land dataset (b1); results of Sen’s test for BIGBANG NF trend (a2) and ERA5-Land NF trend (b2).
Water 18 01290 g003
Figure 4. Scatter plot of historical series of net available freshwater (NF), expressed in terms of water-equivalent height, derived from the ERA5-Land and BIGBANG datasets; the figure also shows the linear regression together with the 95% confidence interval, CI, the B I A S between the two series, the coefficient of determination, R2, and the Pearson correlation coefficient, r.
Water 18 01290 g004
Figure 5. Comparison between historical series of actual evapotranspiration (AE), expressed in terms of water-equivalent height, derived from ERA5-Land and BIGBANG; the figure also shows the BIAS between the two series and the correlation coefficient, r.
Water 18 01290 g005
Figure 6. Historical series of available net freshwater (NF), expressed in terms of normalized anomaly, derived from BIGBANG (a) and ERA5-Land (b). Red and blue colours indicate, respectively, negative and positive anomaly compared to the historical NF mean; yellow-shaded areas indicate documented recent water crises.
Water 18 01290 g006
Figure 7. Estimated values of annual available freshwater, NF, derived using the BIGBANG dataset on a 1 km regular grid over the regional territory of Umbria: average (a) and slope of the associated linear regression (b) in areas where the Mann–Kendall test exhibits a statistically significant trend.
Water 18 01290 g007
Figure 8. Annual total water uses (encompassing domestic, agricultural and industrial uses) estimates by modelling platforms [44] compared with available freshwater ( N F ) derived using the BIGBANG (a) and ERA5-Land (b) datasets for the period 1971–2010. The colour of the circles above the bars quantifies the percentage difference between NF and water consumption (∆). All variables are expressed in terms of equivalent water height over the regional territory.
Water 18 01290 g008
Disclaimer/Publisher’s Note: The statements, opinions and data contained in all publications are solely those of the individual author(s) and contributor(s) and not of MDPI and/or the editor(s). MDPI and/or the editor(s) disclaim responsibility for any injury to people or property resulting from any ideas, methods, instructions or products referred to in the content.