Article

Evaluating Method-Dependent Estimates of Volumetric Field Capacity in the Roldanillo–Unión–Toro Irrigation District, Colombia


by
Harold Tafur-Hermann
1,
Estefania Osorio-Ocampo
1,
Andrés Fernando Echeverri-Sánchez
2,
Edwin Erazo-Mesa
2 and
Jhony Armando Benavides-Bolaños
2,*
1
Universidad Nacional de Colombia, Palmira 763533, Colombia
2
EIDENAR, Universidad del Valle, Cali 760032, Colombia
*
Author to whom correspondence should be addressed.
Water 2026, 18(10), 1195; https://doi.org/10.3390/w18101195
Submission received: 10 April 2026 / Revised: 7 May 2026 / Accepted: 12 May 2026 / Published: 14 May 2026
(This article belongs to the Special Issue Research on Soil Moisture and Irrigation, 2nd Edition)

Abstract

Reliable estimates of volumetric water content at field capacity (θFC) are important inputs for irrigation scheduling because θFC contributes to the estimation of plant-available water, depletion thresholds, and refill targets. In irrigated systems, θFC is therefore an operational decision variable rather than a fixed soil property. However, θFC varies systematically across estimation methods, introducing uncertainty into irrigation management. This study evaluated method-dependent differences in θFC for irrigated tropical soils in the Roldanillo–Unión–Toro agricultural irrigation district (Valle del Cauca, Colombia). Field capacity was estimated at 42 sampling points (0–0.10 m depth) using four methods: Mariotte bottle (MB), filter paper (FP), a pedotransfer function (PTF), and the Richards pressure plate method (RPP). The RPP method was used as an operational reference for comparative purposes, not as an absolute representation of true FC. Agreement and bias were assessed using descriptive statistics, error metrics, regression, Bland–Altman analysis, and texture-stratified comparisons. RPP θFC averaged 39.37% (range: 29.85–46.41%), whereas MB, FP, and PTF produced higher mean values of 42.66%, 44.26%, and 46.38%, respectively. Relative to RPP, mean error and root mean square error increased from MB (3.29% and 5.21%) to FP (4.89% and 8.16%) and PTF (7.01% and 10.82%). Disagreement also varied with soil texture. These results show that low-cost θFC methods are not directly interchangeable with RPP measurements in the evaluated surface layer. Because θFC is commonly used in irrigation calculations, the observed method-dependent differences may affect the estimation of depletion thresholds and refill targets if surface-layer values are extrapolated without local validation. Overall, surface-layer θFC in the Roldanillo–Unión–Toro irrigation district was strongly method-dependent, highlighting the need to account for method-related uncertainty before using alternative θFC estimates as inputs for irrigation decision support.

1. Introduction

Agriculture is the activity that consumes the largest volume of freshwater worldwide; it is required to satisfy the demand of food, fiber and energy crops worldwide [1]. This high demand makes agriculture the main pressure factor on water resources, a pressure that will intensify under climate change, which could significantly increase the areas exposed to water stress by 2050 [2,3]. Projections indicate that climate warming will increase irrigation requirements, promoting the expansion of irrigated areas and the conversion from rainfed to irrigated systems, which results in a reduction (depletion) in water availability and a loss of sustainability in aquatic ecosystems [4].
This impact will be particularly critical in tropical and subtropical regions, where the combined reduction in available water will aggravate agricultural water scarcity [5,6,7]. Likewise, the increase in temperatures and the greater variability in precipitation will intensify crops’ dependence on irrigation even in traditionally humid areas, increasing the water footprint and the vulnerability of agricultural production [8].
In Colombia, climate variability already compromises water supply for several crops, which poses risks for food security, crop production, and the fulfillment of the Sustainable Development Goals [9,10,11,12]. In the Roldanillo–Unión–Toro agricultural irrigation district (RUT), located in the flat zone of the Valle del Cauca in Colombia, water management is especially critical, since historical records show that, for several consecutive months each year, evaporation exceeds accumulated precipitation, leading to episodes of water stress in high-value crops [13,14,15].
Under these conditions, strengthening water management through precision agriculture is essential, which requires accurate estimation of soil hydraulic parameters such as volumetric water content at field capacity (θFC). The θFC is highly sensitive for calculating plant-available water (PAW) in the soil [16,17], and its determination directly conditions the net irrigation depth, application frequency, and water-use efficiency (WUE) [18,19,20]. Therefore, θFC is the starting point to anticipate scenarios and support strategic decisions in agricultural production [21,22]. However, its estimation exhibits high methodological variability, which introduces uncertainty both in simulation models and in agronomic decision-making [23,24].
Although standard methods, such as the Richards pressure plates, and modern instruments, such as HYPROP (METER Group, Pullman, WA, USA), provide high accuracy, their implementation requires specialized infrastructure, trained personnel, long equilibration times, and high costs [16,25]. These demands greatly restrict their use in resource-limited countries such as Colombia.
In response to these limitations, interest has grown in alternative methods that are faster, inexpensive, and capable of estimating θFC with acceptable accuracy. Potentially more accessible options include (a) the Mariotte bottle method (MB), which enables direct field estimates of soil water hydraulic properties on the top soil layer [26,27]; (b) a laboratory method with cylinders under drainage over filter paper (FP), which approximates θFC from the maximum capillary water content and water retention capacity (WRC) [16]; and (c) a pedotransfer function (PTF), which predicts θFC based on textural fractions and bulk density ( ρ b ) [28].
The variability in θFC estimates is associated with the inherent characteristics of each method and introduces uncertainty into the soil hydraulic inputs used for irrigation scheduling, particularly where low-cost methods are adopted without local validation. Because θFC contributes to the calculation of plant-available water, depletion thresholds, and refill targets, systematic over- or underestimation may affect irrigation calculations. However, when θFC is measured only in the surface layer, such implications should be interpreted as potential effects on decision-support inputs rather than as direct evidence of changes in whole-root-zone irrigation performance.
Specifically, four approaches—MB, FP, a PTF, and RPP—were compared across 42 sampling points spanning multiple soil texture classes. The RPP method was used as an operational reference because it provides a standardized laboratory estimate of water content at −33 kPa, but it was not interpreted as the unique or absolute definition of FC. The objectives were to: (i) quantify cross-method differences and bias in θFC estimates; (ii) assess agreement and uncertainty using error metrics, regression, and Bland–Altman analysis; and (iii) evaluate whether method performance and uncertainty vary with soil texture. It was hypothesized that alternative methods would exhibit systematic, positive bias relative to RPP-derived θFC, that the magnitude of disagreement would differ among methods, and that method-induced uncertainty would be texture-dependent. By framing surface-layer θFC as a method-dependent soil hydraulic input rather than a fixed soil constant, this study provides an evidence-based evaluation of how method choice influences θFC estimates and the uncertainty associated with their potential use in irrigation decision-support frameworks. The study does not directly evaluate full root-zone water storage or irrigation performance.

2. Methodology

2.1. Study Area Description

The study was conducted in the RUT agricultural irrigation district, which covers the municipalities of Roldanillo, La Unión, and Toro, in the northern part of the Valle del Cauca, Colombia (Figure 1). This agricultural irrigation district covers approximately 10,200 ha and benefits approximately 1900 farmers, who face the ongoing challenge of efficient water-resource management [7,11,13,29].
Soils in the RUT are mostly deep, with fine to moderately fine textures, well drained, highly fertile, and with neutral to moderately alkaline reaction [30,31]. Locally, there are areas with reduced crop root effective depth, limited by proximity to the water table and poor drainage, which conditions irrigation practices. These characteristics correspond to the most widespread soil mapping units (SMU) in the RUT District, including VWTP-C (Mollisol), VWAD-M (Vertisol), VWTP-G (Mollisol), PWASP-AL (Mollisol), VWAC-T (Inceptisol), VWAN-A (Vertisol), and VWTP-D (Vertisol), all delineated in the soil survey carried out by the Instituto Geográfico Agustín Codazzi (Agustín Codazzi Geographical Institute-IGAC) and the Corporación Autónoma Regional del Valle del Cauca (Valle del Cauca’s Environmental Authority-CVC) [32] (Figure 1c).
The climate is tropical, with an average annual temperature of 24 °C, a bimodal rainfall regime (1100 mm year−1), a yearly relative humidity of 79.9%, sunshine of 1936 h year−1, and annual evaporation close to 1800 mm [7,13].

2.2. Selection of Soil Sampling Size

Site selection was based on the SMU reported by [32]. Seven SMUs with areas greater than 200 ha and high agricultural aptitude were prioritized. These units are associated with crops of regional importance such as maize, guava, grapevine, passion fruit, and papaya.
Sampling was designed as stratified random, considering the heterogeneity among SMU and the internal homogeneity of each stratum [33]. Sample allocation was carried out according to the relative weight of each SMU, ensuring proportionality in the distribution of sampling points.
Sample size was determined with the stratified sampling procedure proposed by [34], which uses within-stratum variance as a measure of dispersion and considers the desired precision, confidence level, and finite population correction. To this end, Equations (1)–(3) were applied:
n 0 = W H S H 2 V
V = γ Y t 2
n = n 0 1 + n 0 N
where n 0 is the initial sample size before accounting for the population size, W H is the relative weight of stratum H, S H 2 is the variance of the target variable (soil moisture at FC) within stratum H, V is the variance of the population mean, γ is the allowable relative error, Y is the expected population mean, t is Student’s t value for a 95% confidence level, and n is the final sample size, that is, the actual number of samples.
Although seven SMUs were prioritized for this study, the sample size calculation (Equation (1)) was developed using historical soil property data available from previous characterization studies [30].

2.3. Soil Sampling for θFC Estimation

At the 42 selected points, an initial morphological description was conducted using an auger down to 1 m depth, which allowed verification and refinement of the information from the [32] soil survey and improved understanding of water–soil interactions within each SMU.
Field sampling included disturbed and undisturbed samples. Disturbed samples were used to determine properties such as texture and particle density, while undisturbed samples, extracted in metal cylinders, preserved soil structure for ρ b estimation and construction of soil water retention curves.
Each θFC estimation method was applied once at each sampling point. Therefore, the study design prioritized spatial coverage across the main SMUs of the RUT district rather than analytical replication within individual points. This design allowed paired method comparisons across 42 locations, but it did not allow separation of analytical repeatability from spatial heterogeneity. Consequently, the results should be interpreted as method-to-method differences observed across the sampled landscape, not as estimates of within-method laboratory precision. This limitation was considered when interpreting RMSE, MAE, ME, and PBIAS, which were used as descriptive indicators of paired disagreement relative to RPP rather than as formal estimates of measurement error.

2.4. Methods for θFC Estimation

The θFC values were estimated using four complementary methods to evaluate their consistency and applicability under local conditions. This comparison is essential because θFC is a critical input for irrigation scheduling: different estimation methods can produce substantially different values, which has direct consequences for irrigation design and WUE at both field and district scales [35,36].
To focus the comparison on θFC estimation differences, the volumetric water content at permanent wilting point (θPWP) was standardized across all methods using the RPP value at −1500 kPa. This methodological decision reduced one source of variation and allowed method differences in θFC estimates to be assessed more directly. However, this choice also means that possible method-dependent differences in θPWP were not evaluated. Therefore, the present comparison addresses method effects on θFC only, not the full uncertainty associated with both upper and lower soil–water limits used to calculate plant-available water.

2.4.1. Richards Plate Method (RPP)

Undisturbed samples collected in cylinders 2.5 cm high and 5 cm in diameter were subjected to different matric potentials in Richards plates, constructing water retention curves at four tensions: saturation, and −33, −500, and −1500 kPa. Water content at −33 kPa was considered FC, and that at −1500 kPa was taken as PWP. This method was adopted as the reference for comparative analyses.

2.4.2. Filter Paper Method (FP)

The θFC values were estimated indirectly in undisturbed soil cores (5 cm diameter × 5 cm height) using the filter paper draining method adapted from Almaz et al. [16]. This procedure differs from the in-contact filter paper technique used to estimate soil suction. In the drainage method, the soil water content of the core sample is determined after controlled drainage over dry filter paper for fixed time intervals. After capillary saturation, the saturated cores were placed on dry filter paper under laboratory conditions. The first drainage stage corresponded to 2 h of total drainage and was used to determine maximum capillary water capacity (MCWC). The filter paper was then replaced, and the samples were allowed to drain for an additional 22 h, reaching 24 h of total drainage. The 24 h value was used to determine retention water capacity (RWC), which Almaz et al. [16] found to be the best predictor of field capacity determined as water content at −33 kPa.
RWC was calculated as volumetric water content after 24 h of drainage using Equation (4):
R W C = M 24 M d M d × ρ b ρ w
where M 24 is the moist mass of the soil core after 24 h of drainage, M d is the oven-dry soil mass, ρ b is soil bulk density, and ρ w is water density. The FP estimate of θFC at −33 kPa was then obtained using the empirical relationship proposed by Almaz et al. [16] using Equation (5):
θ F C , F P = 1.0802 R W C 0.0688
where both θ F C , F P and RWC are expressed in c m 3 c m 3 . The resulting values were multiplied by 100 to express θFC as % v/v. This relationship was selected because Almaz et al. [16] reported strong agreement between RWC and FC determined at −33 kPa, with RMSE = 0.045 cm3 cm−3 and R = 0.953.

2.4.3. Pedotransfer Function (PTF)

Textural fractions (sand, silt, and clay) were determined using the Bouyoucos method, and ρ b was determined using the cylinder method. Using these predictors, the PTF developed by [28] was applied. This function estimates θFC at −33 kPa from calculated porosity and nonlinear relationships with sand and clay contents. In this study, the PTF was used as an external published model and was not locally calibrated or independently validated for RUT soils before application. Therefore, its results should be interpreted as an evaluation of how this published PTF behaved under local soil conditions, not as a locally optimized prediction model.

2.4.4. Mariotte Bottle Method (MB)

The MB method based on the Mariotte bottle principle ensured a constant water supply at a fixed flow rate. A calibrated plastic bottle was used to maintain a constant flow of 2 L h−1, which allowed monitoring the advance of the soil wetting front until equilibrium was reached. Once the surface area of the wet bulb was stabilized, subsamples from the soil surface in the wet bulb limit were collected from the 0–0.10 m layer to determine gravimetric water content at FC, which was then converted to θFC using ρ b .

2.5. Statistical Analysis

2.5.1. Descriptive Statistics

For each θFC estimation method descriptive statistics—including mean, standard deviation (SD), minimum, maximum, and coefficient of variation (CV)—were calculated across the 42 samples. The same set of statistics was computed within each soil texture class to provide a texture-stratified characterization of method behavior across contrasting soil physical conditions.
Because each sampling point was measured once per method, observed variability represents the combined effect of spatial heterogeneity among sampling locations, method-specific procedures, and possible measurement error. The design does not permit independent estimation of analytical repeatability or laboratory precision for each method. Accordingly, descriptive statistics and error metrics were interpreted as indicators of method-specific behavior across the sampled landscape, not as estimates of within-method measurement uncertainty.

2.5.2. Method Agreement and Bias Analysis

The RPP method was designated as the operational reference for all pairwise comparisons because it provides a standardized laboratory determination of volumetric water content at a prescribed matric potential and is widely used in soil water retention studies [37,38]. However, RPP was not treated as an absolute or error-free measure of true field capacity. Therefore, the agreement metrics reported in this study quantify the deviation of each alternative method from the RPP operational reference, not absolute accuracy relative to an unknown true FC value. Agreement between each alternative method (MB, FP, and PTF) and RPP was quantified using complementary error-based metrics computed on paired observations at each sampling point.
Mean error (ME) was calculated as the average difference between alternative method estimates and Richards values, providing a measure of systematic bias (positive values indicate overestimation; negative values indicate underestimation). Root mean square error (RMSE) was used to characterize overall disagreement magnitude, integrating both bias and dispersion. Mean absolute error (MAE) was additionally computed to quantify the average absolute deviation magnitude. To facilitate relative interpretation across methods, percent bias (PBIAS) was calculated as (ME/mean Richards value) × 100.
Because each sampling point was measured once per method, observed variability represents the combined effect of spatial heterogeneity among sampling locations, method-specific procedures, and possible measurement error. The design does not permit independent estimation of analytical repeatability or laboratory precision for each method. Accordingly, descriptive statistics and error metrics were interpreted as indicators of method-specific behavior and paired disagreement across the sampled landscape, not as estimates of within-method measurement uncertainty. For this reason, RMSE, MAE, ME, and PBIAS were not interpreted as separating true methodological bias from analytical error; they were used to summarize the magnitude and direction of differences relative to the RPP operational reference.

2.5.3. Correlation and Agreement Assessment

Correlation and regression analyses were used exclusively to assess association and linearity and were not interpreted as evidence of agreement. Method agreement was primarily evaluated using Bland–Altman analysis and error-based metrics [39]. Bland–Altman analysis was used to evaluate agreement between alternative θFC estimation methods and the RPP reference because the objective was to assess method interchangeability rather than association. Unlike correlation or regression, which quantify co-variation, Bland–Altman plots were constructed for each alternative method relative to RPP, displaying the difference between methods as a function of their mean, thereby allowing visual and quantitative assessment of systematic bias, dispersion, and limits of agreement across the observed range of θFC values.
Pairwise Pearson correlation coefficients were computed among all four methods to characterize the strength of linear association between θFC estimates. Ordinary least squares (OLS) regression models were also fitted between each alternative method and the RPP reference to summarize linear association and visualize departures from the 1:1 line. However, OLS results were not used to establish method interchangeability or to derive calibration equations. This is because OLS assumes that the independent variable is measured without error, an assumption that is not fully satisfied in method-comparison studies where both the reference and alternative methods contain measurement uncertainty. Therefore, OLS was interpreted descriptively only. If the objective were formal method conversion or calibration, error-in-variables approaches such as Deming regression or non-parametric alternatives such as Passing–Bablok regression would be more appropriate.

2.5.4. Texture-Dependent Performance Evaluation

To investigate whether method performance varied with soil physical characteristics, agreement metrics (ME, RMSE, MAE, and PBIAS) were computed separately for each soil texture class represented in the dataset. This texture-stratified analysis enabled the identification of systematic shifts in method behavior under contrasting textural conditions.
Because the number of sampling points per texture class was uneven and, in some cases, very limited, texture-specific metrics were interpreted descriptively rather than inferentially. The texture-stratified interpretation focused primarily on clay (n = 26) and clay loam (n = 9), which together represented 35 of the 42 samples. Texture classes represented by one or two samples were retained for transparency and completeness, but they were not used to support general conclusions about texture-dependent method performance. Method ranking by RMSE within texture classes was therefore restricted to the dominant texture groups.
The statistical analysis was designed as a paired method-agreement assessment rather than a formal hypothesis-testing experiment. Because each method was applied once per sampling point and several texture classes had very small sample sizes, formal inferential comparisons among methods were not used as the primary basis for interpretation. Instead, conclusions were based on paired error metrics, Bland–Altman agreement patterns, descriptive distributions, and consistency of method behavior across the sampled points. This approach avoids overstating statistical certainty where analytical replication and balanced texture-specific sample sizes were not available. All statistical analyses and figure generation were performed in Python version 3.12 within the Google Colab environment. The workflow used pandas for data handling, NumPy for numerical calculations, statsmodels for ordinary least squares regression, and Matplotlib for figure generation. The scripts calculated descriptive statistics, paired error metrics, Bland–Altman statistics, Pearson correlations, OLS relationships, and texture-stratified summaries.

3. Results

This section emphasizes descriptive and agreement-based evidence. Because the study design did not include analytical replication within sampling points, and because some texture classes had very small sample sizes, the results are interpreted as paired method-comparison patterns rather than inferential tests of method superiority.

3.1. Main Descriptors of SMUs

Field sampling and characterization of the 42 soil profiles distributed across seven representative SMUs in the RUT District identified distinct physical, hydrological, and taxonomic characteristics among units (Table 1). The SMUs exhibited varying dominant textures, ranging from loam to clay loam, with effective depths between 50 and 100 cm. Hydrologic regimes were classified as either Ustic or Udic, while representative soil taxonomies included Typic Haplustolls, Chromic Endoaquerts, Fluventic Haplustolls, Vertic Endoaquepts, Typic Haplustert, and Typic Haplusterts. Soil limitations varied among SMUs, including imperfect drainage and high subsurface cohesion, shrink-swell properties, and risks of surface sealing and localized waterlogging. VWTP-C was the most extensively represented unit (16 profiles), followed by VWAD-M (11 profiles), VWTP-G (10 profiles), while PWASP-AL, VWAC-T, VWAN-A, and VWTP-D were represented by 2, 1, 1, and 1 profiles, respectively (Table 1).

3.2. Raw θFC Values

The raw θFC data were compiled for 42 sampling points, each characterized by particle-size fractions (sand, silt, clay), USDA textural class, and θFC estimated using four methods (MB, FP, PTF, and RPP) (Supplementary Table S1).

3.3. Overall Method-to-Method Differences in θFC

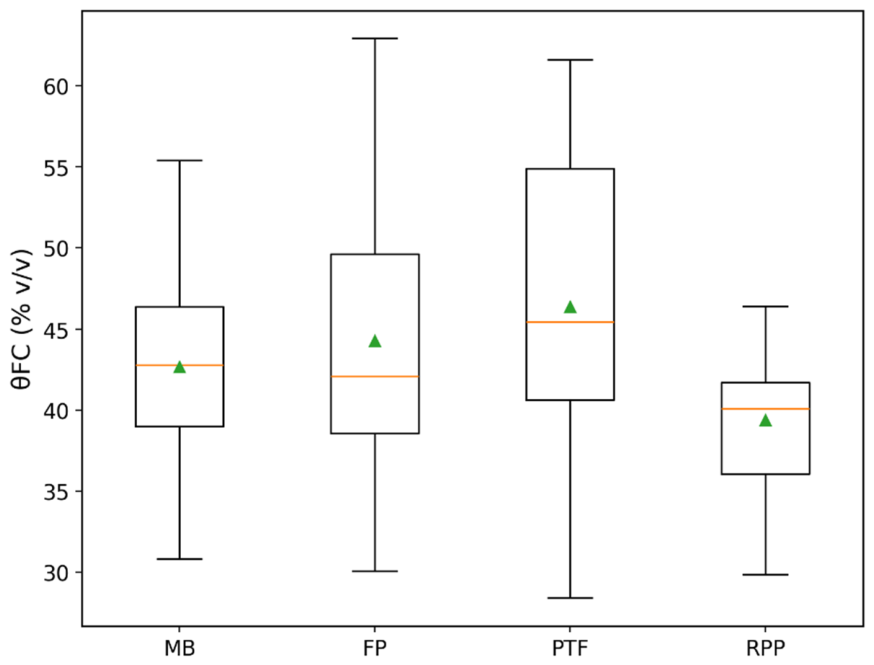
Across the 42 sampling points, the distribution of θFC differed clearly among methods, not only in mean level but also in spread (Figure 2). The RPP consistently produced the lowest central tendency, whereas PTF produced the highest values and the broadest distribution, indicating both upward displacement and greater heterogeneity across samples. MB remained closer to RPP than the other alternative methods and showed a narrower distribution than FP and PTF. These patterns indicate that the observed differences are not limited to isolated cases but reflect a systematic shift in the location and dispersion of θFC estimates among methods.
In terms of dispersion, the RPP showed the lowest variability, with a SD of 4.09 and a CV of 10.39%, indicating the most consistent θFC estimates among the four methods. MB also showed relatively low variability, with an SD of 5.30 and a CV of 12.42%. In contrast, the FP and PTF methods exhibited greater dispersion, with SD values of 7.92 and 8.89 and CV values of 17.90% and 19.16%, respectively, indicating less stable estimates and greater relative variability across samples.

3.4. Agreement and Bias Relative to Richards Pressure Plate Operational Reference

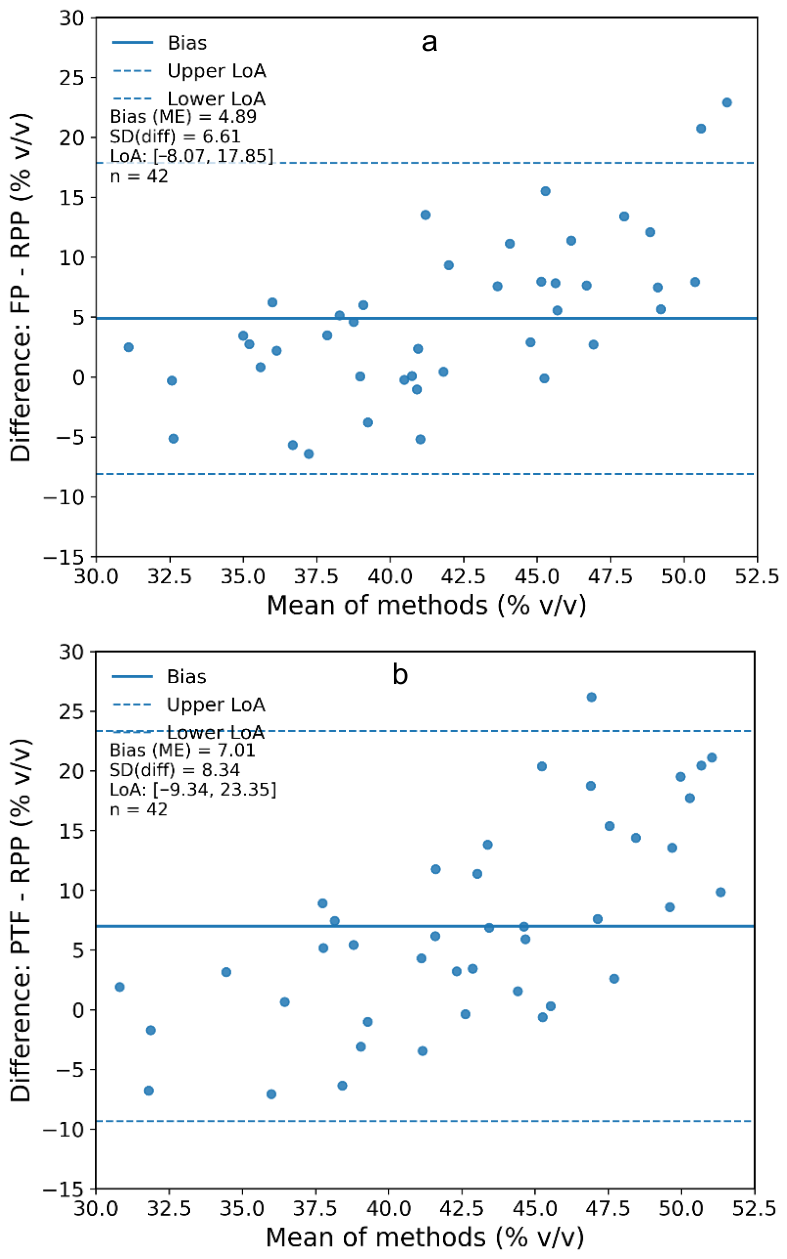
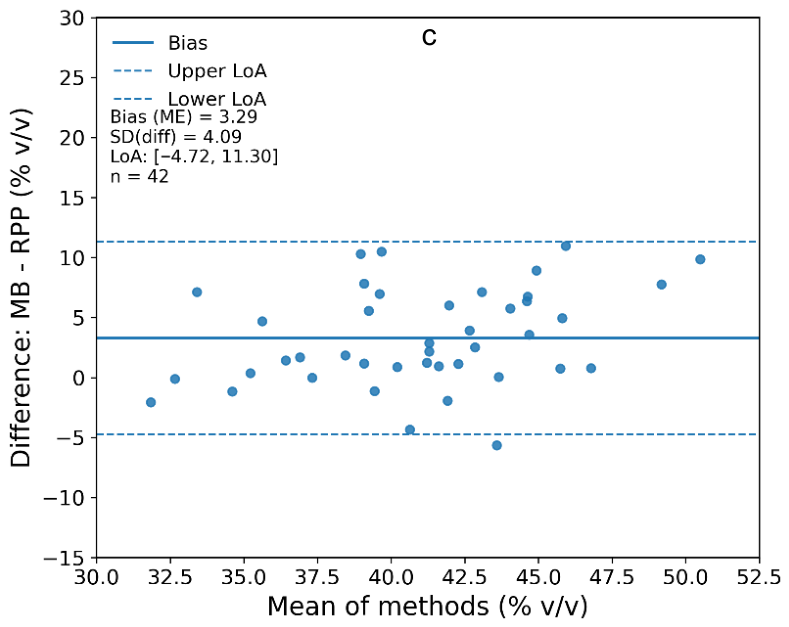
Bland–Altman analysis showed that disagreement relative to the RPP operational reference was directional rather than random (Figure 3a–c). All three alternative methods tended to overestimate θFC, but the magnitude and spread of this overestimation differed among methods. MB showed the smallest mean offset and comparatively narrower limits of agreement, whereas FP and especially PTF exhibited larger positive bias and wider dispersion. The plots also suggest that disagreement tended to increase at higher average θFC values, indicating that method substitution becomes more problematic in the wetter or higher-storage portion of the dataset.

3.5. Association with Richards: Regression and Correlation Summaries

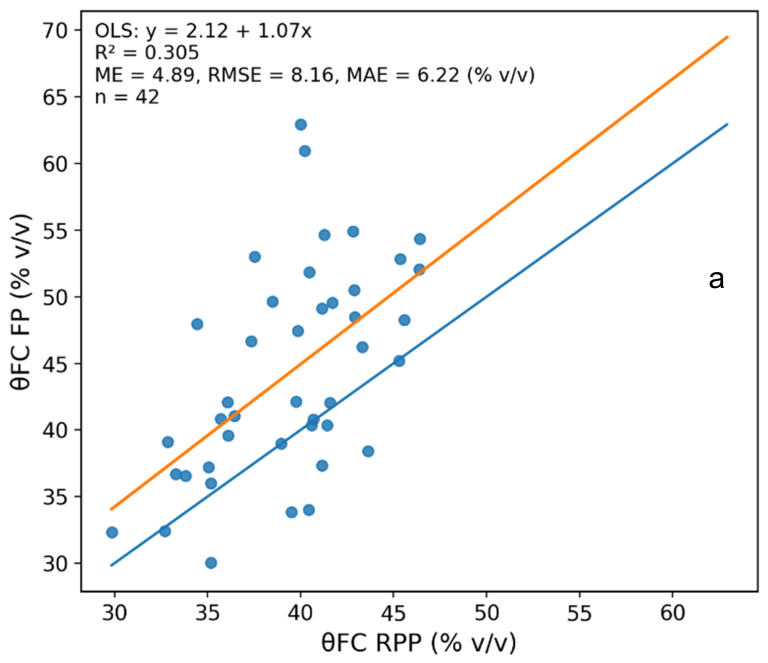
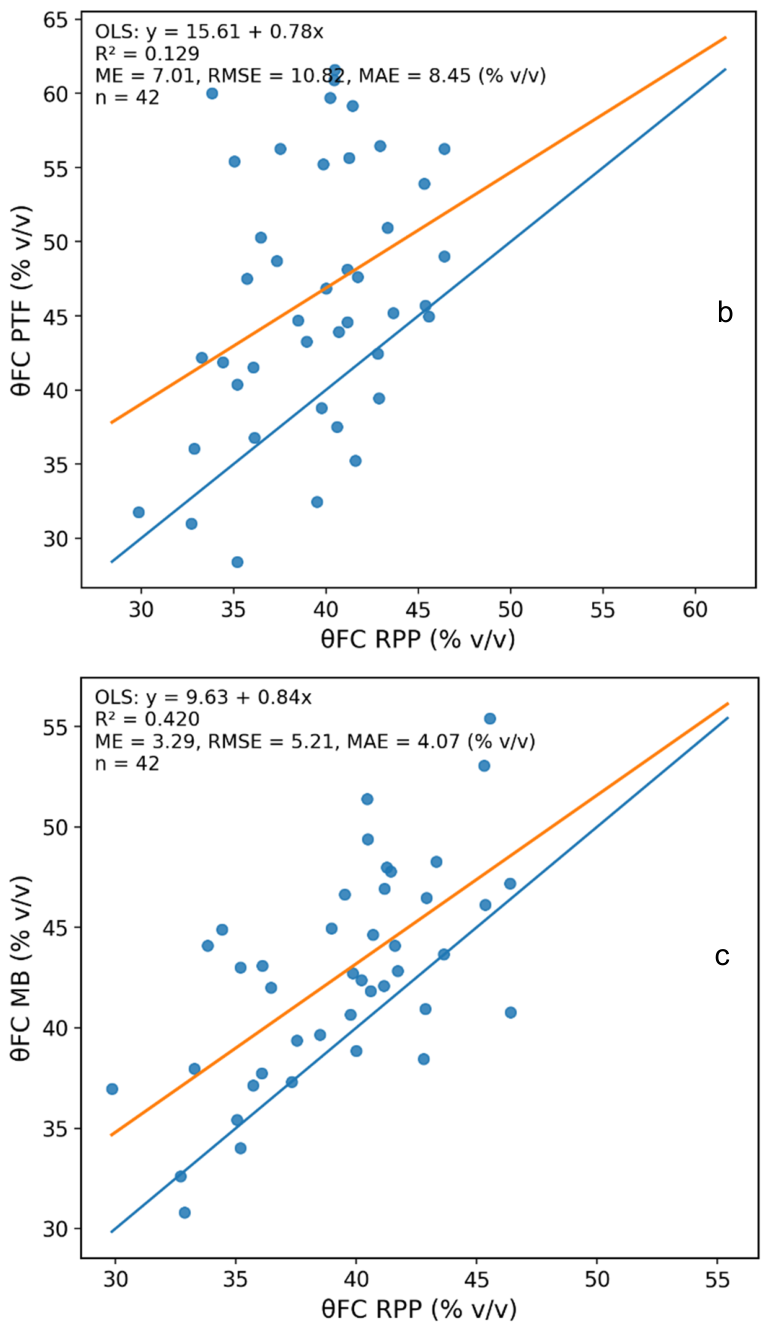
The regression plots show positive linear association between the three alternative methods and RPP, but these OLS relationships were interpreted only descriptively and were not used as calibration equations or evidence of interchangeability (Figure 4). MB showed the closest linear relationship with the reference and the smallest overall deviation from the 1:1 line, indicating the most consistent tracking of RPP across the observed range. FP showed an intermediate pattern, with moderate scatter and a tendency toward overestimation. In contrast, PTF displayed the weakest fit and the largest departures from the 1:1 line, indicating that its higher θFC estimates were accompanied by weaker point-by-point agreement with RPP. These results reinforce that association alone does not imply equivalence among methods.
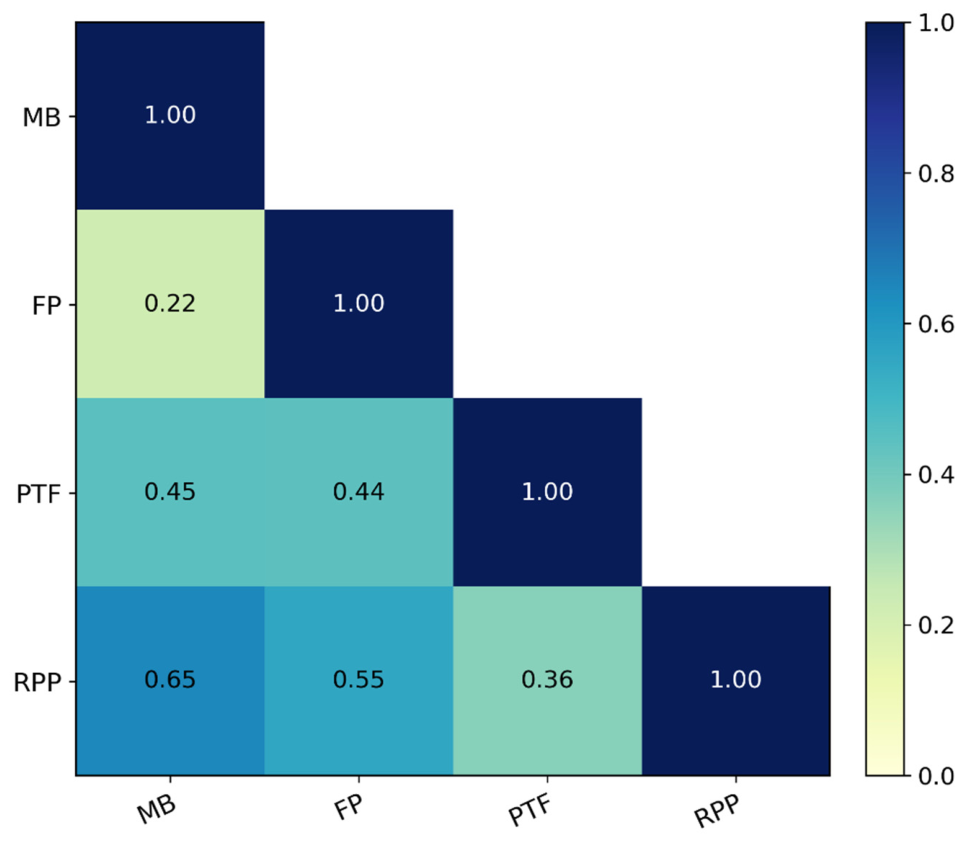
The correlation heat map summarizes the overall structure of association among methods and shows that the closest relationship with RPP was obtained for MB, followed by filter paper and then PTF (Figure 5). It also shows that the three alternative methods are positively related to each other, but not to the same degree, which reflects shared sensitivity to some soil properties combined with method-specific behavior. This pattern is consistent with the previous agreement and regression results: methods that appear broadly associated can still differ substantially in bias and dispersion relative to the reference (Figure 5).

3.6. Texture Composition and Texture-Dependent Patterns

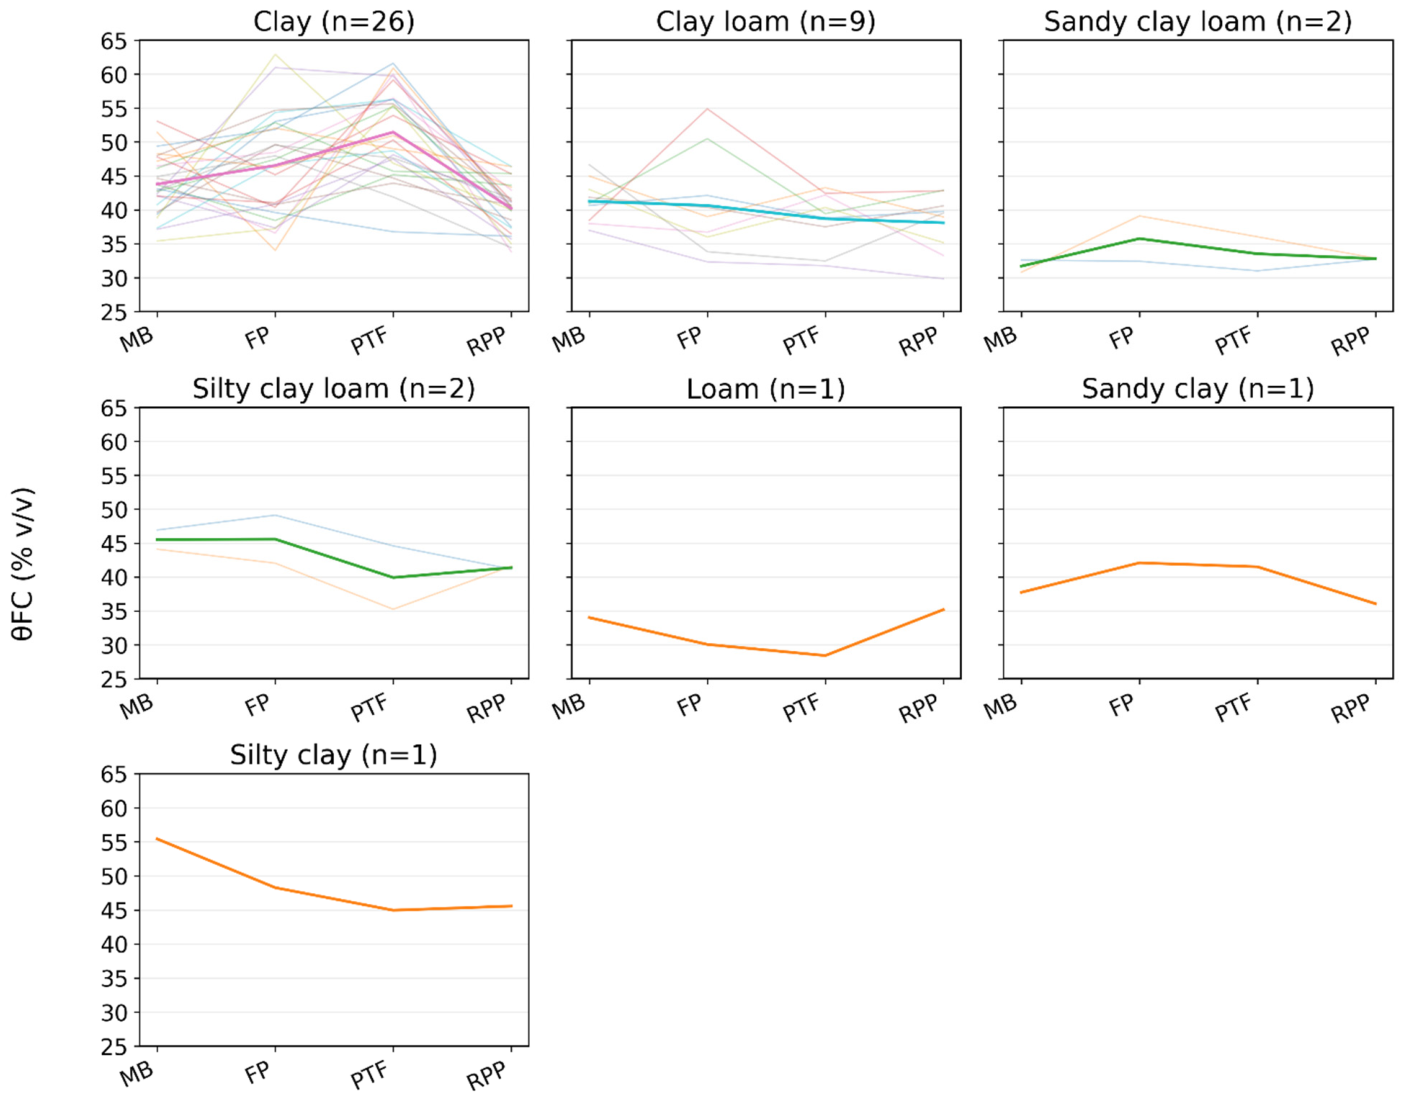
The texture-stratified profiles suggest that method-dependent differences were not uniform across the dataset, but this interpretation is mainly supported by the two dominant texture classes: clay (n = 26) and clay loam (n = 9) (Figure 6). In clay, most individual profiles showed the same ordered pattern, with RPP tending to produce the lowest θFC values and PTF frequently the highest, while MB and FP occupied intermediate positions. In clay loam, by contrast, the four methods were generally closer together and the separation among them was smaller, especially for PTF relative to RPP. The remaining texture classes showed variable behavior, but their very small sample sizes prevent robust texture-specific interpretation. Therefore, the texture-dependent conclusions of this study should be understood as mainly reflecting the dominant clay and clay loam soils.
Because clay and clay loam accounted for 35 of the 42 samples, the clearest texture-dependent patterns were observed in these two classes. In clay soils, all alternative methods yielded higher mean θFC values than RPP, with a progressive increase from MB (43.80% v/v) to FP (46.54% v/v) and especially the PTF (51.45% v/v), compared with 40.21% v/v for RPP. This indicates that the largest upward departures from the reference occurred in the most represented fine-textured soils. In contrast, differences among methods were much smaller in clay loam, where mean θFC values ranged from 38.09% v/v for RPP to 41.27% v/v for MB, and the PTF (38.69% v/v) was much closer to the reference than in clay. A second relevant pattern was the change in dispersion: RPP consistently showed the lowest variability in both dominant textures (CV = 9.65% in clay and 8.53% in clay loam), whereas FP and PTF generally showed broader spread, especially in clay. The remaining texture classes are included for completeness, but their very small sample sizes limit interpretation of their descriptive statistics (Table 2).
Texture-stratified agreement metrics confirmed that method performance relative to RPP was strongly texture-dependent. In clay soils, all three alternative methods showed positive bias, but the magnitude of disagreement increased markedly from MB (ME = 3.59% v/v; RMSE = 5.37% v/v) to FP (ME = 6.33% v/v; RMSE = 9.53% v/v) and PTF (ME = 11.24% v/v; RMSE = 13.26% v/v), indicating that the PTF performed poorest in the texture class that dominated the dataset. In clay loam, by contrast, the three methods were more comparable, and the PTF showed the smallest mean error and RMSE (0.60% v/v and 4.72% v/v), suggesting that its performance improved substantially outside the clay domain. These results suggest that method disagreement was not uniform across the sampled soils, especially when comparing the dominant clay and clay loam groups. However, because several texture classes were represented by only one or two samples, broader texture-dependent conclusions should be treated as descriptive and exploratory. Agreement metrics for the remaining texture classes are reported to document the full dataset, but they should be interpreted cautiously because those classes were represented by only one or two samples (Table 3).
Some negative ME values were observed in the less represented texture classes (Table 3). For example, MB showed negative ME in sandy clay loam and loam, while PTF showed negative ME in silty clay loam, loam, and silty clay. These values indicate that the alternative methods did not overestimate RPP in every individual texture class. However, these negative biases occurred only in classes represented by one or two samples, so they should not be interpreted as robust evidence of systematic underestimation. Instead, they show local variability in method behavior and reinforce the need for larger texture-specific sample sizes before drawing general conclusions for these minor texture groups.
To express these method differences in irrigation-relevant units, mean θFC bias was converted to an equivalent water depth for the sampled 0–0.10 m layer. In this layer, 1 percentage point of volumetric water content corresponds to approximately 1 mm of water storage. Therefore, the global mean errors relative to RPP corresponded to equivalent surface-layer water-depth differences of approximately 3.29 mm for MB, 4.89 mm for FP, and 7.01 mm for PTF. In the dominant clay texture class, the equivalent differences were larger, reaching approximately 3.59 mm for MB, 6.33 mm for FP, and 11.24 mm for PTF. These values should not be interpreted as full root-zone irrigation depths, but they indicate the magnitude of method-dependent differences in the sampled surface layer.

4. Discussion

4.1. Field Capacity as a Method-Dependent Soil Water State in the RUT District

The results show that θFC was not constant across methods, even though all four approaches were intended to represent the same post-drainage soil water condition. Across the 42 sampling points, the mean θFC differed by 7.01 percentage points (v/v) between RPP (39.37% v/v) and the PTF (46.38% v/v). This difference is not trivial when compared with the variability of the RPP measurements themselves (SD = 4.09; CV = 10.39%). In practical terms, the method used to estimate θFC changed the resulting value enough to affect its interpretation for irrigation purposes.
This result is consistent with previous studies showing that FC is not a single fixed hydraulic condition but depends on how it is defined and measured. Different approaches approximate different hydraulic conditions, for example a fixed matric potential, a drainage endpoint, or an inferred value from predictors such as texture and ρ b [17,35,36,40,41]. These differences become more relevant in soils where redistribution is strongly influenced by structure, layering, and drainage behavior.
That context fits the RUT dataset. Most samples were clay or clay loam, and several dominant soil mapping units include drainage limitations or vertic behavior. Under these conditions, a difference of a few volumetric percentage points in surface-layer θFC may become relevant if such values are used as inputs for irrigation calculations or extrapolated to represent deeper soil layers. However, because this study evaluated only the 0–0.10 m layer, the observed spread should be interpreted as method-dependent uncertainty in surface θFC estimates, not as a direct quantification of whole-root-zone water storage.

4.2. Agreement Relative to RPP

All three alternative methods showed positive bias relative to RPP. The ordering was consistent across the global metrics: MB had the lowest mean error and RMSE, followed by FP, whereas the PTF showed the largest disagreement. This same gradient appeared in the overall distributions, where the PTF produced both higher θFC values and greater dispersion. These results indicate that the alternative methods were not directly interchangeable with the RPP reference in this dataset.
An important point is that correlation did not resolve this issue. Regression and correlation showed that the methods were associated, but association alone does not indicate agreement. Bland–Altman analysis was useful here because it showed both the direction of bias and how disagreement changed across the range of values [39,42]. In this study, the mean differences were positive for all three alternative methods, and the spread of disagreement tended to increase at higher average θFC values. This pattern matters because the larger θFC values were mostly associated with the fine-textured soils that dominated the dataset.
Among the alternative methods, MB remained the closest to RPP overall. It had the smallest bias, the lowest RMSE, and the strongest association with the reference. This does not mean that MB reproduced RPP exactly, but it suggests that, in this study, the field drainage-based procedure tracked the reference more consistently than FP or the PTF.

4.3. Why Methods Diverged?

The texture-stratified analysis showed that disagreement was not uniform across soils. In clay, all alternative methods overestimated θFC relative to RPP, and the PTF showed the largest departure by far. In clay loam, in contrast, the differences were smaller, and the PTF was much closer to RPP. This shift indicates that method performance depends strongly on soil texture.
For the PTF, the most likely explanation is domain mismatch. The function uses texture and ρ b as predictors, but it was not calibrated or validated specifically for the RUT district before application. These predictors may not capture structural features that strongly influence water retention in fine-textured, shrink-swell, or poorly drained soils. In clay soils from the RUT district, especially those influenced by vertic behavior, this limitation may explain why the PTF produced larger positive bias and higher RMSE. Therefore, the PTF results should not be interpreted as evidence that the model is generally unsuitable, but as evidence that external PTFs require local validation before being used for irrigation-related soil hydraulic estimates. Similar limitations have been reported in other studies of structured and swelling soils, where particle-size data alone could not fully explain retention behavior [28,43,44,45,46].
The FP results were also plausible from a methodological standpoint. This method depends on calibration relationships and on adequate equilibration and contact between soil and paper. In fine-textured soils, small differences in suction can correspond to noticeable changes in volumetric water content, which may contribute to larger variability and bias [47,48]. In this dataset, filter paper generally overestimated θFC and was less stable than MB. The few negative biases observed in Table 3 occurred only in texture groups with very small sample sizes. Therefore, they should be interpreted as local deviations rather than evidence of a consistent underestimation pattern. They also suggest that method behavior may change outside the dominant clay and clay loam groups, but the present dataset is not sufficient to characterize those minor texture classes.
Our results suggest that the four methods did not capture exactly the same hydraulic state. RPP imposed a standardized equilibrium at a prescribed matric potential. FP estimated suction indirectly. The PTF predicted θFC from covariates. MB approximated a field drainage endpoint in the upper soil layer. The observed differences are therefore understandable from a physical and methodological standpoint, especially in structurally complex tropical soils.

4.4. Implications for Irrigation Scheduling

The practical importance of these differences is that θFC is used to derive several irrigation scheduling variables, including total available water, depletion thresholds, and refill targets. However, the present study evaluated θFC only in the 0–0.10 m layer and did not measure full root-zone water storage, crop response, or applied irrigation depths. Therefore, the observed differences should be interpreted as potential sources of uncertainty in irrigation decision-support inputs, not as direct evidence of changes in irrigation timing, drainage, leaching, or crop water stress. Previous studies have shown that uncertainty in soil hydraulic parameters can affect simulated drainage, stress frequency, and irrigation performance, especially when combined with weather variability and management assumptions [41,49,50,51].
The texture effect is relevant, but it should be interpreted mainly for the dominant clay and clay loam groups. In clay loam, the PTF was closer to RPP than in clay, suggesting that a method that appears acceptable in one textural domain may perform less well in another. However, because several texture classes had very small sample sizes, the present results should not be read as a complete evaluation of all USDA texture classes in the district. The main supported conclusion is that local texture and soil condition influenced the magnitude of disagreement within the dominant fine-textured soils sampled in this study.
The conversion of θFC bias into equivalent water depth helps place the method differences in practical terms, while keeping the interpretation within the sampled depth. For the 0–0.10 m layer, the global mean errors represented approximately 3.29 to 7.01 mm of water, and the PTF bias in clay soils represented approximately 11.24 mm. These values are not root-zone irrigation depths, but they show that method choice can produce measurable differences even in a shallow surface layer. If similar biases were used without local validation in irrigation calculations or in the parameterization of deeper soil layers, estimates of available water and refill targets could differ from those obtained using the RPP operational reference. Therefore, the water-depth conversion supports the need for local checking of θFC methods, especially in clayey soils, rather than providing direct evidence of irrigation losses or crop water stress.
The results also help clarify what kind of use may be reasonable for each method. If the objective is relative comparison or mapping, a method with moderate association may still be useful. However, if the method is used directly to define irrigation thresholds, then bias and agreement become more important than correlation alone. In the RUT dataset, the wider disagreement at higher θFC values suggests that substitution among methods is least defensible precisely in the soils where storage estimates matter most for irrigation depth and drainage risk.
For the RUT district, these findings have practical relevance but should be interpreted cautiously. The district serves about 1900 farmers across approximately 10,200 ha, and θFC is one of the soil hydraulic inputs that can inform irrigation planning. However, because this study was limited to surface samples, the results do not quantify district-scale irrigation demand or root-zone storage. They indicate that local checking of method bias is necessary before surface-layer θFC values from low-cost methods are used in broader irrigation decision-support frameworks. In that sense, even a limited local reference dataset would improve the interpretation of alternative methods. This agrees with recent work emphasizing local validation and uncertainty characterization rather than assuming universal parameter transferability [16,22,25].

4.5. Limitations and Future Directions

Two limitations should be considered. First, θFC was evaluated only for the 0–0.10 m layer. This depth is relevant for surface redistribution, seedling establishment, and the upper part of the cultivated soil profile, but it does not represent the full effective root zone used in irrigation scheduling. Therefore, the results should not be interpreted as direct estimates of root-zone plant-available water, seasonal irrigation demand, or district-scale water requirements. Because disagreement among methods was texture- and structure-dependent, comparisons at deeper horizons could yield smaller or larger differences, especially in soils with layering, drainage constraints, or vertic properties. This is also the main operational limitation of the MB method, since in its standard form it is restricted to the superficial 0–0.10 m layer. Deeper evaluation would require terraces or stepped excavations, which reduces its practicality for routine use. Second, the comparison was based on the full operational implementation of each method, and the methods differed not only in theoretical principle but also in sample geometry, sampling condition, and equilibration pathway. RPP used undisturbed cores of 2.5 cm height and 5 cm diameter under imposed matric potentials, FP used undisturbed cores of 5 cm height and 5 cm diameter under drainage over filter paper, and MB was based on field wetting-front sampling from the 0–0.10 m layer. The absence of analytical replication is another important limitation. Because each method was applied once per sampling point, the study cannot partition the observed disagreement into analytical repeatability, laboratory error, field sampling variability, and true method-related differences. Therefore, the error metrics should be interpreted as descriptive paired-deviation metrics rather than as complete uncertainty estimates. Future studies should include repeated measurements within each method and sampling point to quantify repeatability and to separate analytical uncertainty from spatial variability. Therefore, the observed differences cannot be attributed exclusively to a single methodological principle. They reflect the combined effect of each method as it would be applied in practice, including sample size, soil disturbance context, drainage pathway, and equilibrium definition. This does not invalidate the comparison, but it limits the extent to which the source of disagreement can be isolated mechanistically.
The FP method also depends on an empirical relationship originally developed by Almaz et al. [16] between RWC after 24 h of filter-paper drainage and FC measured at −33 kPa. Although this relationship showed strong performance in the source study, it was developed using soils from a different geographic and pedological context. Therefore, in the present study, the FP method should be interpreted as an indirect estimate of θFC based on a published empirical relationship, not as a direct pressure-equilibrium measurement. This is especially relevant for clayey and structurally complex soils, where drainage behavior and pore connectivity may differ from the calibration dataset.
The PTF results also need to be interpreted in light of model transferability. The PTF was applied as a published external equation and was not recalibrated using a local training dataset from the RUT district. Therefore, its larger disagreement in clay soils may reflect limited applicability of the original calibration domain to local fine-textured and structurally complex soils. Future work should evaluate locally calibrated PTFs and compare them with external models using independent validation datasets.
RPP was treated as an operational reference, not as an absolute truth. In this study, RPP represented a standardized laboratory definition of θFC at −33 kPa, which allowed paired comparison among methods. However, FC can also be defined using drainage rate, flux-based criteria, profile redistribution, or alternative matric potentials depending on soil texture and hydraulic context. Therefore, the observed disagreement should be interpreted as disagreement relative to the RPP operational definition, not as absolute error relative to a unique true FC. This distinction is important because part of the disagreement may reflect differences in the hydraulic state represented by each method, rather than only poor method performance. The RPP water retention characterization was based on four points: saturation, −33, −500, and −1500 kPa. This design was sufficient for identifying the selected operational θFC and θPWP values used in the comparison, but it does not provide a high-resolution soil water retention curve. As a result, this study did not evaluate the full shape of the retention curve, air-entry behavior, or detailed pore-size distribution. Future work should include additional matric potential points or continuous retention measurements to better characterize the hydraulic behavior of these soils.
Future work should therefore compare alternative reference criteria, including suction-based and flux-based definitions, and examine which one best predicts irrigation outcomes under representative RUT conditions [27,36,40,41]. A useful next step would also be to propagate the observed method differences into irrigation experiments under field conditions, so that the effect of alternative θFC estimates on timing, applied water, and drainage can be quantified more directly. That would move the discussion from method comparison to management consequences under local conditions.

5. Conclusions

This study shows that surface-layer θFC is not an interchangeable soil constant but a method-dependent operational estimate whose numerical value depends on the definition and measurement pathway used to represent post-drainage equilibrium. Across predominantly fine-textured soils of the RUT district, alternative estimation methods converged conceptually on the same soil hydraulic variable but diverged systematically in magnitude. These differences were structured, directional, and texture-dependent rather than random, indicating that method-related uncertainty should be considered before surface-layer θFC estimates are used as inputs in irrigation decision-support frameworks.
Second, when evaluated against the RPP reference, all lower-cost methods examined exhibited positive bias, with increasing disagreement from MB to FP to PTF. Because θFC is commonly used to estimate plant-available water, depletion thresholds, and refill targets, such bias may propagate into irrigation calculations if method-specific differences are ignored. However, this study did not include irrigation experiments, crop response measurements, or water-balance simulations. Therefore, the observed biases should be interpreted as potential sources of uncertainty in irrigation decision-support inputs, particularly in clay and clay loam soils, rather than as direct evidence of delayed irrigation, increased refill volumes, crop water stress, or deep percolation losses.
Finally, the main contribution of this work is not simply a ranking of θFC estimation methods by accuracy, but an evaluation of volumetric field capacity as a decision-sensitive variable whose uncertainty has direct implications for irrigation management. For resource-limited irrigation districts such as the RUT, the results show that low-cost methods should not be treated as directly interchangeable with RPP-based estimates without prior local evaluation of their bias, agreement, and texture-dependent behavior. By shifting the focus from method comparison alone to the uncertainty associated with method-dependent θFC estimates, this study provides a more cautious basis for using low-cost θFC methods in irrigation decision-support frameworks. Direct evaluation of irrigation scheduling outcomes would require root-zone measurements, crop response data, or water-balance simulations.

Supplementary Materials

The following supporting information can be downloaded at https://www.mdpi.com/article/10.3390/w18101195/s1, Table S1: Point-level soil texture and θFC estimates. Summary of sand, silt, and clay (%), USDA texture class, and θFC (% v/v) obtained by MB, FP, PTF, and RPP methods for the 42 sampling points.

Author Contributions

H.T.-H.: Methodology and validation. E.O.-O.: Methodology, investigation, writing—original draft. J.A.B.-B.: Methodology, data curation, visualization, formal analysis, writing—original draft, writing—review and editing. A.F.E.-S.: Methodology, funding acquisition, validation, writing—original draft. E.E.-M.: Conceptualization, funding acquisition, investigation, project administration, supervision, writing—review and editing. All authors have read and agreed to the published version of the manuscript.

Funding

This work was funded by the Colombian Ministry of Science, Technology and Innovation (Ministerio de Ciencia, Tecnología e Innovación, MinCiencias) under Research Project BPIN 2024000100016, entitled “Fortalecimiento de los pequeños productores para gestión de la cantidad y calidad del agua en la producción de alimentos en el Distrito de Adecuación de Tierras de los municipios Roldanillo, La Unión y Toro (RUT) del Valle del Cauca.” The funding agency had no role in the design of the study; in the collection, analysis, or interpretation of data; in the writing of the manuscript; or in the decision to publish the results.

Data Availability Statement

The original contributions presented in this study are included in the article/Supplementary Materials. Further inquiries can be directed to the corresponding author.

Acknowledgments

The authors gratefully acknowledge the investigators of the REGAR Research Group (Universidad del Valle, College of Engineering, EIDENAR, Category A, Ministerio de Ciencia, Tecnología e Innovación, MinCiencias—Colombian Ministry of Science, Technology and Innovation) for their valuable comments, constructive suggestions, and continued encouragement throughout this study. Their input substantially strengthened the clarity and scientific rigor of the manuscript. The authors also thank Luis Fernando Ruíz and Rodrigo Jiménez for their assistance with fieldwork activities, and Oscar Eduardo Trujillo for coordinating the fieldwork.

Conflicts of Interest

The authors declare no conflicts of interest.

References

  1. Naziq, M.S.; Sathyamoorthy, N.K.; Ga, D.; Pazhanivelan, S.; Vadivel, N. Coupled Weather and Crop Simulation Modeling for Smart Irrigation Planning: A Review. Water Supply 2024, 24, 2844–2865. [Google Scholar] [CrossRef]
  2. Aslam, M.F.; Masia, S.; Spano, D.; Mereu, V.; Debolini, M.; Snyder, R.L.; Borgo, A.; Trabucco, A. Modelling Crop Water Demand under Climate Change: The Case of Sardinia Region. Irrig. Sci. 2025, 43, 1681–1698. [Google Scholar] [CrossRef]
  3. Baggio, G.; Qadir, M.; Smakhtin, V. Freshwater Availability Status across Countries for Human and Ecosystem Needs. Sci. Total Environ. 2021, 792, 148230. [Google Scholar] [CrossRef]
  4. Rosa, L.; Chiarelli, D.D.; Sangiorgio, M.; Beltran-Peña, A.A.; Rulli, M.C.; D’Odorico, P.; Fung, I. Potential for Sustainable Irrigation Expansion in a 3 °C Climate. Proc. Natl. Acad. Sci. USA 2020, 117, 29526–29534. [Google Scholar] [CrossRef]
  5. Ahmad, U.; Sohel, F. Evaluating Decision Support Systems for Precision Irrigation and Water Use Efficiency. Digit. Eng. 2025, 4, 100038. [Google Scholar] [CrossRef]
  6. El Chami, D.; Knox, J.W.; Daccache, A.; Weatherhead, E.K. Assessing the Financial and Environmental Impacts of Precision Irrigation in a Humid Climate. Hortic. Sci. 2019, 46, 43–52. [Google Scholar] [CrossRef]
  7. Benavides-Bolaños, J.A.; Echeverri-Sánchez, A.F.; Reyes-Trujillo, A.; del Mar Carreño-Sánchez, M.; Jaramillo-Llorente, M.F.; Rivera-Caicedo, J.P. In Situ Hyperspectral Reflectance Sensing for Mixed Water Quality Monitoring: Insights from the RUT Agricultural Irrigation District. Water 2025, 17, 1353. [Google Scholar] [CrossRef]
  8. Mbewu, A.D.; Elephant, D.E.; Motsi, H.; Nyambo, P. Climate Change Effects on Water Footprint of Crop Production: A Meta-Analysis. Environ. Chall. 2024, 17, 101033. [Google Scholar] [CrossRef]
  9. Martínez-Vega, R.R.; Ouazaa, S.; De Swaef, T.; Chaali, N.; Garré, S.; Jaramillo-Barrios, C.I.; Moreno Fonseca, L.P. Exploring Non-Conventional Irrigation Methods and Drone-Based Monitoring to Enhance Water Use Efficiency: A Case of Rice Cultivation in Colombia. Irrig. Sci. 2025, 43, 1615–1633. [Google Scholar] [CrossRef]
  10. Erazo-Mesa, E.; Echeverri-Sánchez, A.; Ramírez-Gil, J.G. Advances in Hass Avocado Irrigation Scheduling under Digital Agriculture Approach. Rev. Colomb. Cienc. Hortic. 2022, 16, 13456. [Google Scholar] [CrossRef]
  11. Castillo-Sánchez, L.; Echeverri Sánchez, A.F.; Carreño Sánchez, M.d.M.; Barona Ramirez, S.M.; Jaramillo, M.F. Assessment of the Hazards Associated with Water Quality for Irrigation in the Environmental Interceptor Canal of the RUT District, Colombia. Rev. Fac. Nac. Agron. Medellin 2026, 79, 1. [Google Scholar] [CrossRef]
  12. Lal, R. Managing Soils of Colombia and South America for Addressing Global Issues and Advancing Sustainable Developing Goals. Suelos Ecuat. 2016, 46, 81–88. [Google Scholar]
  13. Castillo-Sánchez, L.; Echeverri-Sánchez, A.F.; Sánchez Torres, L.D.; Quiroga-Rubiano, E.L.; Benavides-Bolaños, J.A. A Review of Riverbank Filtration with a Focus on Tropical Agriculture for Irrigation Water Supply. Water 2025, 17, 3169. [Google Scholar] [CrossRef]
  14. Obando, Ó.E.T.; Escobar, J.A.D.; Torres, E.A. Socio-Economic Aspects Associated with Water Management in Cocoa Cultivation in Valle Del Cauca, Colombia. Acta Agron. 2023, 72, 368–376. [Google Scholar] [CrossRef]
  15. Echeverri-Sánchez, A. Methodological Proposal to Assess the Vulnerability of Soils to Salinization in Flat Area Irrigation Districts. Rev. Ing. Univ. Medellín 2022, 21, 28–43. [Google Scholar] [CrossRef]
  16. Almaz, C.; Miháliková, M.; Báťková, K.; Vopravil, J.; Matula, S.; Khel, T.; Kara, R.S. Simple and Cost-Effective Method for Reliable Indirect Determination of Field Capacity. Hydrology 2023, 10, 202. [Google Scholar] [CrossRef]
  17. Chen, S.; Wang, C.; Shang, S.; Mao, X.; Zhao, J. Dynamic and Empirical Methods for Field Capacity Estimation in Fine Textured Soils with a Coarse Interlayer. Geoderma 2024, 449, 117000. [Google Scholar] [CrossRef]
  18. Foster, T.; Brozović, N.; Butler, A.P.; Neale, C.M.U.; Raes, D.; Steduto, P.; Fereres, E.; Hsiao, T.C. AquaCrop-OS: An Open Source Version of FAO’s Crop Water Productivity Model. Agric. Water Manag. 2017, 181, 18–22. [Google Scholar] [CrossRef]
  19. Mortel, G.M.M.; Madramootoo, C.A. Improving Water Use Efficiency of Surface Irrigated Sugarcane. Front. Water 2023, 5, 1278306. [Google Scholar] [CrossRef]
  20. Ali, A.; Hussain, T.; Zahid, A. Smart Irrigation Technologies and Prospects for Enhancing Water Use Efficiency for Sustainable Agriculture. AgriEngineering 2025, 7, 106. [Google Scholar] [CrossRef]
  21. Nagahage, E.A.A.D.; Nagahage, I.S.P.; Fujino, T. Calibration and Validation of a Low-Cost Capacitive Moisture Sensor to Integrate the Automated Soil Moisture Monitoring System. Agriculture 2019, 9, 141. [Google Scholar] [CrossRef]
  22. Reynolds, W.D. An Analytic Description of Field Capacity and Its Application in Crop Production. Geoderma 2018, 326, 56–67. [Google Scholar] [CrossRef]
  23. Dong, Y.; Tucker, S.; Singh, G.; Ali, N.; Yazdanpanah, N.; Weide, J.V.; Sears, M. Optimizing Soil Moisture Sensor Placement through Spatial Variability Analysis in Orchards. Smart Agric. Technol. 2025, 12, 101273. [Google Scholar] [CrossRef]
  24. Shao, W.; Li, M.; Wu, Y.; Ma, X.; Song, Q.; Zhang, Y.; Su, Y.; Ni, J.; Dong, J. Identification of Varied Soil Hydraulic Properties in a Seasonal Tropical Rainforest. Catena 2022, 212, 106104. [Google Scholar] [CrossRef]
  25. Singh, A.; Verdi, A. Estimating the Soil Water Retention Curve by the HYPROP-WP4C System, HYPROP-Based PCNN-PTF and Inverse Modeling Using HYDRUS-1D. J. Hydrol. 2024, 639, 131657. [Google Scholar] [CrossRef]
  26. Angelaki, A.; Bota, V.; Chalkidis, I. Estimation of Hydraulic Parameters from the Soil Water Characteristic Curve. Sustainability 2023, 15, 6714. [Google Scholar] [CrossRef]
  27. Argote-Sanchez, C.L.; Lozano-Santa, J.M.; Reyes-Trujillo, A. Determination of the Water Regulation Capacity of a Typic Hapludands by Means of Humidity Retention Curves and the Modeling of Its Hydrophysical Properties. Ing. Compet. 2019, 21, 103–116. [Google Scholar] [CrossRef]
  28. Pollaco, J.A. A Generally Applicable Pedotransfer Function That Estimates Field Capacity and Permanent Wilting Point from Soil Texture and Bulk Density. Can. J. Soil Sci. 2008, 88, 761–774. [Google Scholar] [CrossRef]
  29. ASORUT. Asociación de Usuarios Del Distrito de Adecuación de Tierras de Los Municipios de Roldanillo, La Unión, Toro. Available online: https://asorut.com/ (accessed on 1 March 2026).
  30. Castillo-Sánchez, L. Zonificación Del Comportamiento Espacial de Las Propiedades Hidrodinámicas Del Suelo En El Distrito de Riego RUT. Master’s Thesis, Universidad Nacional de Colombia (Palmira), Palmira, Colombia, 2016. [Google Scholar]
  31. Castillo-Sánchez, L. Evaluación de Los Peligros Asociados a La Calidad Del Agua Del Canal Interceptor Uasda En Riego En El Distrito RUT. Master’s Thesis, Universidad del Valle, Cali, Colombia, 2024. [Google Scholar]
  32. CVC. IGAC Levantamiento Semidetallado de Suelos Del Departamento Del Valle Del Cauca Escala 1:25.000; CVC: Cali, Colombia, 2023. [Google Scholar]
  33. Anderson, D.; Sweeney, D.; Williams, T. Estadística Para Administración y Economía, 10th ed.; Cengage Learning: Mexico City, Mexico, 2008. [Google Scholar]
  34. Di, W.; Qingbo, Z.; Zhongxin, C.; Jia, L. Optimal Design of Spatial Sampling Schemes for Winter Wheat Sown Area Estimation. In Proceedings of the First International Conference on Agro- Geoinformatics (Agro-Geoinformatics); IEEE: Shanghai, China, 2012. [Google Scholar]
  35. Twarakavi, N.K.C.; Sakai, M.; Šimůnek, J. An Objective Analysis of the Dynamic Nature of Field Capacity. Water Resour. Res. 2009, 45, W10410. [Google Scholar] [CrossRef]
  36. Andabili, S.J.; Rasoulzadeh, A.; Moghadam, J.R.; Pollacco, J.A.P.; Fernández-Gálvez, J. Improved Understanding of Soil Water Content at Field Capacity and Estimates from Pedotransfer Functions. Irrig. Drain. 2025, 74, 516–528. [Google Scholar] [CrossRef]
  37. Hidalgo-Campos, C.; Camacho-Umaña, M. Potencial Hídrico y Contenido de Agua En El Suelo: Métodos de Análisis Disponibles y Sus Implicaciones En El Manejo de Los Recursos Suelo y Agua. Agron. Costarric. 2024, 48, 169–200. [Google Scholar] [CrossRef]
  38. Cresswell, H.P.; Green, T.W.; McKenzie, N.J. The Adequacy of Pressure Plate Apparatus for Determining Soil Water Retention. Soil Sci. Soc. Am. J. 2008, 72, 41–49. [Google Scholar] [CrossRef]
  39. Bland, M.; Altman, D. Statistical Methods for Assessing Agreement between Two Methods of Clinical Measurement. Int. J. Nurs. Stud. 2010, 47, 931–936. [Google Scholar] [CrossRef]
  40. Assouline, S.; Or, D. The Concept of Field Capacity Revisited: Defining Intrinsic Static and Dynamic Criteria for Soil Internal Drainage Dynamics. Water Resour. Res. 2014, 50, 4787–4802. [Google Scholar] [CrossRef]
  41. Nasta, P.; Franz, T.E.; Gibson, J.P.; Romano, N. Revisiting the Definition of Field Capacity as a Functional Parameter in a Layered Agronomic Soil Profile beneath Irrigated Maize. Agric. Water Manag. 2023, 284, 108368. [Google Scholar] [CrossRef]
  42. Giavarina, D. Understanding Bland Altman Analysis. Biochem. Med. 2015, 25, 141–151. [Google Scholar] [CrossRef]
  43. Kishné, A.S.; Morgan, C.L.S.; Ge, Y.; Miller, W.L. Antecedent Soil Moisture Affecting Surface Cracking of a Vertisol in Field Conditions. Geoderma 2010, 157, 109–117. [Google Scholar] [CrossRef]
  44. Dinka, T.M.; Morgan, C.L.S.; McInnes, K.J.; Kishné, A.S.; Daren Harmel, R. Shrink-Swell Behavior of Soil across a Vertisol Catena. J. Hydrol. 2013, 476, 352–359. [Google Scholar] [CrossRef]
  45. Román Dobarco, M.; Cousin, I.; Le Bas, C.; Martin, M.P. Pedotransfer Functions for Predicting Available Water Capacity in French Soils, Their Applicability Domain and Associated Uncertainty. Geoderma 2019, 336, 81–95. [Google Scholar] [CrossRef]
  46. Paschalis, A.; Bonetti, S.; Guo, Y.; Fatichi, S. On the Uncertainty Induced by Pedotransfer Functions in Terrestrial Biosphere Modeling. Water Resour. Res. 2022, 58, e2021WR031871. [Google Scholar] [CrossRef]
  47. Almeida, E.L.D.; Teixeira, A.D.S.; Silva Filho, F.C.D.; Assis Júnior, R.N.D.; Leão, R.A.D.O. Método Do Papel-Filtro Para Obter a Curva de Retenção de Água No Solo. Rev. Bras. Cienc. Solo 2015, 39, 1344–1352. [Google Scholar] [CrossRef]
  48. Nelson, J.T.; Adjuik, T.A.; Moore, E.B.; VanLoocke, A.D.; Ramirez Reyes, A.; McDaniel, M.D. A Simple, Affordable, Do-It-Yourself Method for Measuring Soil Maximum Water Holding Capacity. Commun. Soil Sci. Plant Anal. 2024, 55, 1190–1204. [Google Scholar] [CrossRef]
  49. Feki, M.; Ravazzani, G.; Ceppi, A.; Mancini, M. Influence of Soil Hydraulic Variability on Soil Moisture Simulations and Irrigation Scheduling in a Maize Field. Agric. Water Manag. 2018, 202, 183–194. [Google Scholar] [CrossRef]
  50. Kelly, T.D.; Foster, T.; Schultz, D.M.; Mieno, T. The Effect of Soil-Moisture Uncertainty on Irrigation Water Use and Farm Profits. Adv. Water Resour. 2021, 154, 103982. [Google Scholar] [CrossRef]
  51. Lena, B.P.; Bondesan, L.; Pinheiro, E.A.R.; Ortiz, B.V.; Morata, G.T.; Kumar, H. Determination of Irrigation Scheduling Thresholds Based on HYDRUS-1D Simulations of Field Capacity for Multilayered Agronomic Soils in Alabama, USA. Agric. Water Manag. 2022, 259, 107234. [Google Scholar] [CrossRef]
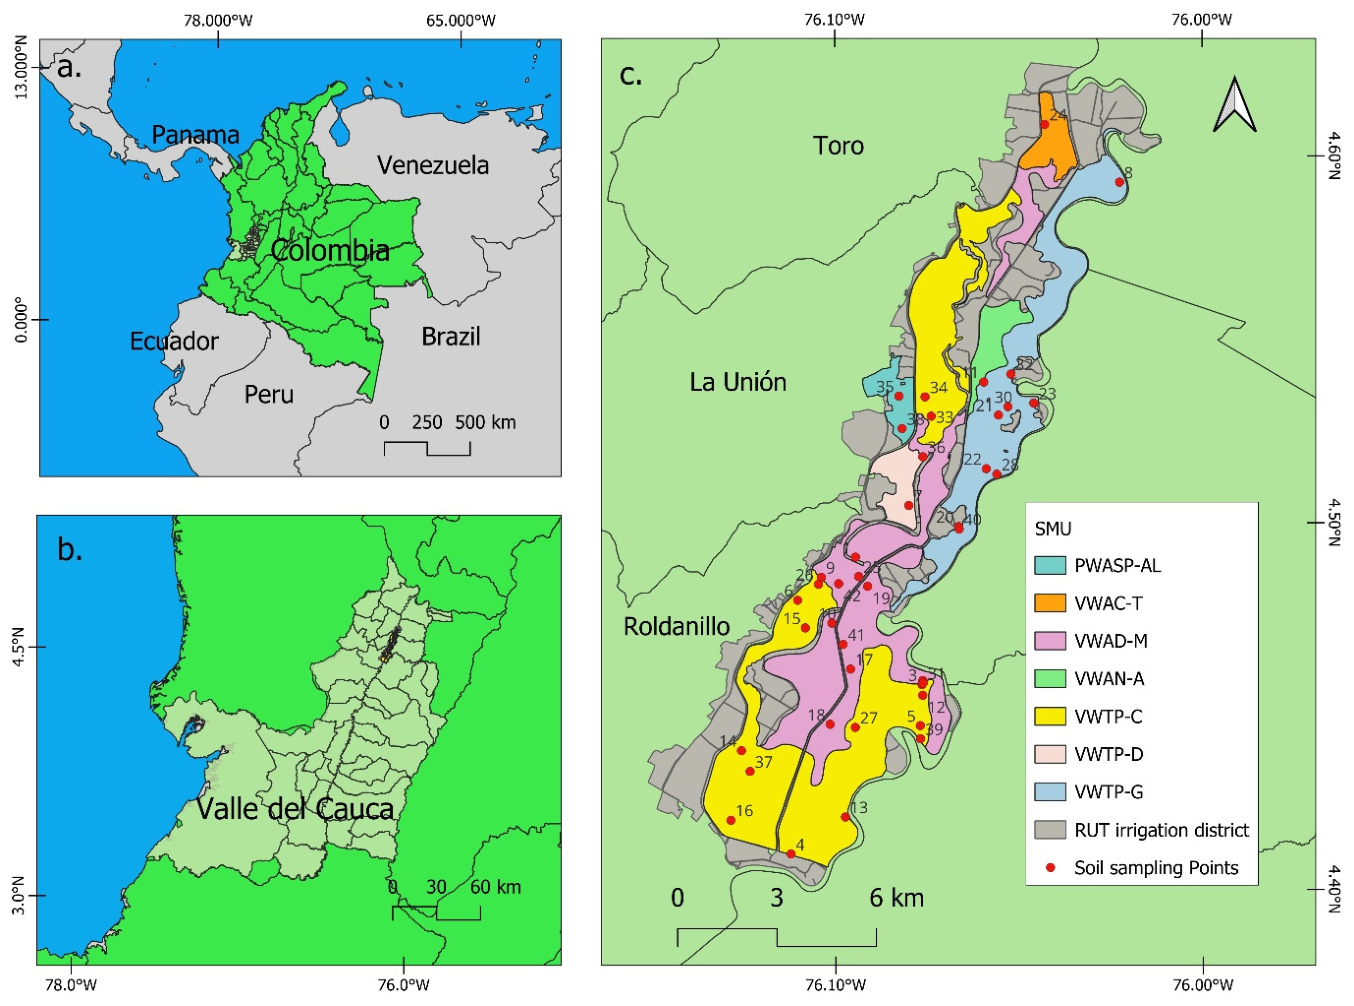
Figure 1. Geographic location of the study area: (a) Colombia in the Americas; (b) Valle del Cauca in Colombia; (c) RUT District with sampling point distribution and SMUs.
Water 18 01195 g001
Figure 2. Distribution of θFC by estimation method. Boxplots of θFC (% v/v) across the 42 sampling points for MB, FP, PTF, and RPP methods; triangles denote method means. Orange line inside the box represents the median.
Water 18 01195 g002
Figure 3. Bland–Altman agreement plots relative to RPP. Difference (alternative–RPP) versus mean of paired methods for (a) FP, (b) PTF, and (c) MB. Solid line indicates mean difference (bias); dashed lines indicate 95% limits of agreement.
Water 18 01195 g003aWater 18 01195 g003b
Figure 4. Scatterplots and Ordinary Least Squares (OLS) relationships relative to RPP. Paired θFC (% v/v) comparisons against RPP for (a) FP, (b) PTF, and (c) MB, showing the 1:1 line (blue line) and fitted OLS regression equation and tendency line (orange) with reported R2 and error metrics.
Water 18 01195 g004aWater 18 01195 g004b
Figure 5. Pearson correlation heat map among θFC estimation methods (n = 42). Pairwise Pearson correlation coefficients computed across all sampling points for MB, FP, PTF, and RPP θFC (% v/v).
Water 18 01195 g005
Figure 6. Paired θFC profiles across methods, stratified by soil texture. Connected-line plots showing θFC (% v/v) across the four methods for individual sampling points within each USDA texture class; panel titles report texture class and sample size (n).
Water 18 01195 g006
Table 1. Physical, hydrological, and taxonomic descriptors of the 42 soil profiles by SMUs in the RUT.
SMUsProfilesDominant TextureEffective Depth (cm)Hydric RegimeRepresentative TaxonomyLimitations
VWTP-C16Loam to clay loam100Ustic/UdicTypic HaplustollsNo major limitations
VWAD-M11Clay loam to clay50–80UdicChromic EndoaquertsImperfect drainage; plasticity
VWTP-G10Clay loam100UdicTypic HaplustollsHigh subsurface cohesion
PWASP-AL2Silt loam80UsticFluventic HaplustollsRocky material or lithologic fragments
VWAC-T1Clay loam60–80UdicVertic EndoaqueptsMottling and a massive clay horizon
VWAN-A1Clay loam50–80UsticTypic HaplustertShrink–swell; possible surface sealing; risk of localized waterlogging
VWTP-D1Clay loam100UsticTypic HaplustertsShrink–swell; possible surface sealing; risk of localized waterlogging
Table 2. Texture-stratified descriptive statistics of θFC by method. Mean, SD, min, max, and CV (%) for θFC (% v/v) reported separately within each USDA texture class; n denotes the number of sampling points within each texture.
Texture ClassnMethodMean (% v/v)SDMinMaxCV (%)
Clay26MB43.804.7937.0255.4210.93
FP46.547.7934.0662.9216.75
PTF51.458.3837.3661.6016.29
RPP40.213.8834.7646.419.65
Clay loam9MB41.273.6437.0847.868.82
FP40.644.4733.8549.1811.00
PTF38.695.9231.9250.1715.31
RPP38.093.2534.0143.628.53
Sandy clay loam2MB31.450.6231.0131.891.97
FP35.611.8234.3236.905.11
PTF33.401.6132.2634.544.83
RPP32.890.7332.3733.412.22
Silty clay loam2MB45.461.0244.7446.182.25
FP45.454.9541.9548.9510.88
PTF40.054.3136.9943.1110.76
RPP41.180.1241.1041.260.29
Loam1MB34.0034.0034.00
FP30.0030.0030.00
PTF28.5028.5028.50
RPP35.0035.0035.00
Sandy clay1MB38.0038.0038.00
FP42.0042.0042.00
PTF41.5041.5041.50
RPP36.0036.0036.00
Silty clay1MB55.2055.2055.20
FP48.3048.3048.30
PTF45.0045.0045.00
RPP45.5045.5045.50
Table 3. Texture-stratified agreement metrics relative to RPP pressure plate. RMSE, MAE, and PBIAS for each alternative method versus RPP, computed separately by texture class; n-texture indicates the number of sampling points per texture.
Texture Classn-TextureMethod vs. RPPME (% v/v)RMSE (% v/v)MAE (% v/v)PBIAS (%)
Clay26MB3.595.374.388.92
FP6.339.537.2615.75
PTF11.2413.2611.2427.96
Clay loam9MB3.185.224.218.35
FP2.555.384.696.70
PTF0.604.723.771.58
Sandy clay loam2MB−1.441.621.44−4.38
FP2.723.082.728.27
PTF0.510.580.511.55
Silty clay loam2MB4.284.414.2810.40
FP4.276.174.2710.37
PTF−1.134.324.06−2.75
Loam1MB−1.001.001.00−2.86
FP−5.005.005.00−14.29
PTF−6.506.506.50−18.57
Sandy clay1MB2.002.002.005.56
FP6.006.006.0016.67
PTF5.505.505.5015.28
Silty clay1MB9.709.709.7021.32
FP2.802.802.806.15
PTF−0.500.500.50−1.10
Disclaimer/Publisher’s Note: The statements, opinions and data contained in all publications are solely those of the individual author(s) and contributor(s) and not of MDPI and/or the editor(s). MDPI and/or the editor(s) disclaim responsibility for any injury to people or property resulting from any ideas, methods, instructions or products referred to in the content.