Abstract
Triclosan (TCS) is extensively detected in wastewater and waste-activated sludge (WAS). The occurrence and fate of TCS in anaerobic digestion have been well revealed, but the change in TCS during WAS pretreatment needs to be clarified. Thermal hydrolysis pretreatment has been proven to be efficient for both WAS hydrolysis and TCS removal, with a removal efficiency of 54.0% and a retention time of 90 min at 170 °C. Alkaline pretreatment remarkably changed the TCS distribution between the sludge and liquid, and the solid–liquid distribution coefficient decreased by three orders of magnitude as the pH increased to 13. Neither alkaline pretreatment nor thermal–alkaline pretreatment resulted in the obvious removal of TCS. UP demonstrated limited efficiency in the hydrolysis of WAS, as well as the migration and removal of TCS. Thus, this study demonstrated that pretreatment methods and operational parameters significantly influence the migration and removal of TCS. It also provides a valuable reference for future studies on the migration and degradation behavior of TCS during anaerobic digestion and lays a foundation for the development of WAS treatment engineering capable of efficiently removing TCS.
1. Introduction
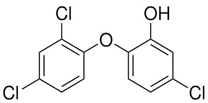
Triclosan (5-Chloro-2-(2,4-dichlorophenoxy) phenol, TCS) is a broad-spectrum chlorinated antimicrobial that is used globally as an additive in soap, liquid soap, shampoo, shower gel, etc. [1,2]. Thousands of products were reported to employ TCS as antimicrobial in the early 2010s. However, TCS is environmentally persistent and is assumed to be a source of toxins and carcinogens, including dioxins, chloroform, and chlorinated anilines, and it is also considered an incentive to antibiotic resistance genes [3,4]. Given the environmental and health risks of TCS, the U.S. Food and Drug Administration banned nineteen antimicrobial ingredients (including TCS) in over-the-counter consumer antiseptic wash products in September 2016. More than 200 scientists and medical professionals documented a consensus in 2017 and recommended avoiding the unnecessary use of TCS and labeling all products containing TCS [5]. Although the potential risks of TCS have attracted public attention, the extensive application of TCS has not been reported in many countries in recent years, and frequent and relatively high concentrations of TCS have been detected in waters/wastewaters in Asia [6,7], Europe [8], and America [9]. TCS was substantially removed from wastewater by means of biological wastewater treatment; however, owing to its hydrophobic characteristics, approximately 30–70% of the removed TCS accumulated in solid-phase sludge [10]. Without sufficient treatment and disposal processes for TCS-containing waste-activated sludge (WAS), environmental risks will be passed on to water and soil.
Anaerobic digestion is a feasible and promising method for the treatment of WAS because of its cost-effectiveness, net energy profit, and wide applicability in industry [11]. Hydrolysis is considered to be the rate-limiting step in anaerobic digestion. To overcome this barrier, various pretreatment methods, including mechanical pretreatment (ultrasonic, microwave, and high-pressure homogenization), thermal hydrolysis, and chemical pretreatment (acidic and alkali) have been developed to improve the hydrolysis effect of WAS [12]. Previous studies have investigated the fate of TCS in anaerobic digestion, and most have reported that TCS is bundled by sludge particles and cannot be completely eliminated [13,14]. It could be deduced that the dissolved TCS could be readily degraded compared to adsorption in the sludge. To the best of our knowledge, few studies to date have focused on the fate of TCS in the WAS pretreatment process, but there are no in-depth evaluations of TCS migration between the solid and liquid phases [4]. A comprehensive investigation of the migration and degradation behavior of TCS during the pretreatment of WAS will provide a foundation for the targeted development of enhanced TCS removal technologies.
In this study, four typical methods, namely ultrasonic pretreatment (UP), alkaline pretreatment (AP), thermal–alkaline pretreatment (TAP), and thermal hydrolysis pretreatment (THP), were employed to pretreat WAS. The performance of organic matter released after various pretreatment methods was also investigated. The migration and removal of TCS using different pretreatment methods were explored, and the alternation of the solid–liquid distribution coefficient was appraised. In addition, the effect of pretreatment methods on the fate of TCS is also discussed.
2. Materials and Methods
2.1. Source of Waste-Activated Sludge (WAS)
Waste-activated sludge (WAS) used in this study was sampled from a thickening tank at a local wastewater treatment plant in Wuxi, China, which operates on an anaerobic-anoxic-aerobic process. The collected WAS was stored at 4 °C until use. The characteristics of raw WAS are summarized in Table 1.

Table 1.
The characteristics of the raw waste-activated sludge (WAS) used in this study.
2.2. Chemicals
TCS with a purity of 97% was procured from Shanghai Aladdin Bio-Chem Technology Co., Ltd., China. The structural characteristics and key physicochemical properties of TCS are shown in Table 2. High-performance liquid chromatography (HPLC)-grade methanol and acetonitrile, used as extraction solvents and mobile phases, were obtained from Merck and Sigma-Aldrich (Steinheim, Germany), respectively. All the other chemicals utilized were of analytical grade.
Table 2.
The structure and physicochemical properties of target triclosan.
2.3. Experimental Design
Four typical WAS pretreatment methods, namely UP, AP, TAP, and THP, were conducted in this study. A WAS with total suspended solids (TSS) of approximately 40 g/L was used in the experiment. Assuming that the TSS concentration in the raw WAS was insufficient, as shown in Table 1, part of the raw WAS was centrifuged at 8000 rpm for 10 min (R134 a, Eppendorf, Hamburg, Germany) to obtain precipitates for TSS maintenance. UP was conducted using an ultrasonic instrument (KQ-500E, Kunshan Ultrasonic Instrument Co., Ltd., Suzhou, China), which provided a power of 500 W and an ultrasonic frequency of 40 kHz, with ultrasonic times of 30, 60, 90, and 120 min. The pH of AP was adjusted using 6 mol/L sodium hydroxide solution to 9, 10, 11, 12 and 13, respectively, and maintained for 30 min. To further evaluate the influence of temperature on AP, TAP was carried out at 40, 60, and 80 °C, with the pH adjusted to 12. The design temperature was determined using a thermostatic heater (DF-101F, Qiuzuo Scientific Instrument Co., Ltd., Shanghai, China). Both AP and TAP were operated using an electric mixer (OS20-S, DLAB Scientific Co., Ltd., Beijing, China) to obtain a homogeneous mixture. THP was manipulated with a stirring autoclave (FYXD1, Tongchan high-pressure reactors manufacture Co., Ltd., Dalian, China) with treatment times of 30, 60, and 90 min. The temperature was set to 170 °C, which was reported to be suitable for WAS hydrolysis [15]. WAS (500 mL) spiked with TCS (20 mg/L, calculated according to the slurry volume) was used for each condition, and all experiments were conducted in triplicate.
2.4. Analytical and Calculation Methods
WAS samples were syringe-extracted and centrifuged at 8000 rpm for 10 min (R134 a, Eppendorf, Hamburg, Germany) to separate the supernatant and sediment. The supernatant was pretreated by filtering with 0.45 μm filters (Jinteng Experiment Equipment Co., Ltd., Tianjin, China) and used to determine the soluble indexes. Chemical oxygen demand (COD), total suspended solids, and volatile suspended solids were analyzed according to standard methods [16]. Proteins were quantified using a bicinchoninic acid Protein Assay Kit (P0010, Beyotime Biotechnology, Shanghai, China). The total sugar concentration was measured using the phenol-sulfuric acid method [17]. The pH was determined using a pH meter (FE28, Mettler Toledo, Shanghai, China). TCS in the solid and liquid samples was extracted before determination, and the procedure is detailed as follows.
Extraction from the solid phase: After centrifugation, the solids were transferred to a freeze-dryer (FreeZone 2.5, Labconco, KS, USA) until the mass stabilized. Analytes (approximately 0.5 g) were extracted with 30 mL of a 50:50 methanol: acetone (v:v) solution by sonication for 30 min. The extracts were filtered using 0.2 μm filters (Jinteng Experiment Equipment Co., Ltd., Tianjin, China), collected in a glass Petri dish, and then evaporated to dryness in a special fume hood. It was reconstituted using 5 mL acetonitrile and finally 1~1.5 mL filtered liquid sample was stored in a vial for analysis. The concentrations provided here were based on dry weight (DW).
Extraction from the liquid phase: Approximately 40 mL of the supernatant was extracted using isometric ethyl acetate, and the organic phase was separated using a separating funnel. The organic phase was evaporated to dryness in a special fume hood and reconstituted using acetonitrile (2 mL). The samples were then filtered and stored in vials for analysis. The concentrations provided here were calculated according to the volume of solution used for extraction.
The TCS concentration was quantified using an HPLC system (Dionex UltiMate 3000, Thermo Scientific, Waltham, MA, USA) equipped with a diode array detector (at a wavelength of 199 nm, Thermo Scientific, Waltham, MA, USA) and a C18 column (5 μm, 4.6 mm × 150 mm, InertSustain, Shimadzu, Kyoto, Japan). The mobile phase consisted of 75% acetonitrile and 25% deionized water at a flow rate of 1 mL/min. The injection volume of the sample was 10 μL and the column temperature was set to 30 °C. All measurements were conducted in triplicate. Data were processed using Microsoft Office Excel (Redmond, WA, USA) and OriginPro2020b (Northampton, MA, USA). Analysis of variance was used to evaluate the significance level of p < 0.05 and p < 0.01.
3. Results
3.1. Hydrolysis of Waste-Activated Sludge with Various Pretreatment Conditions
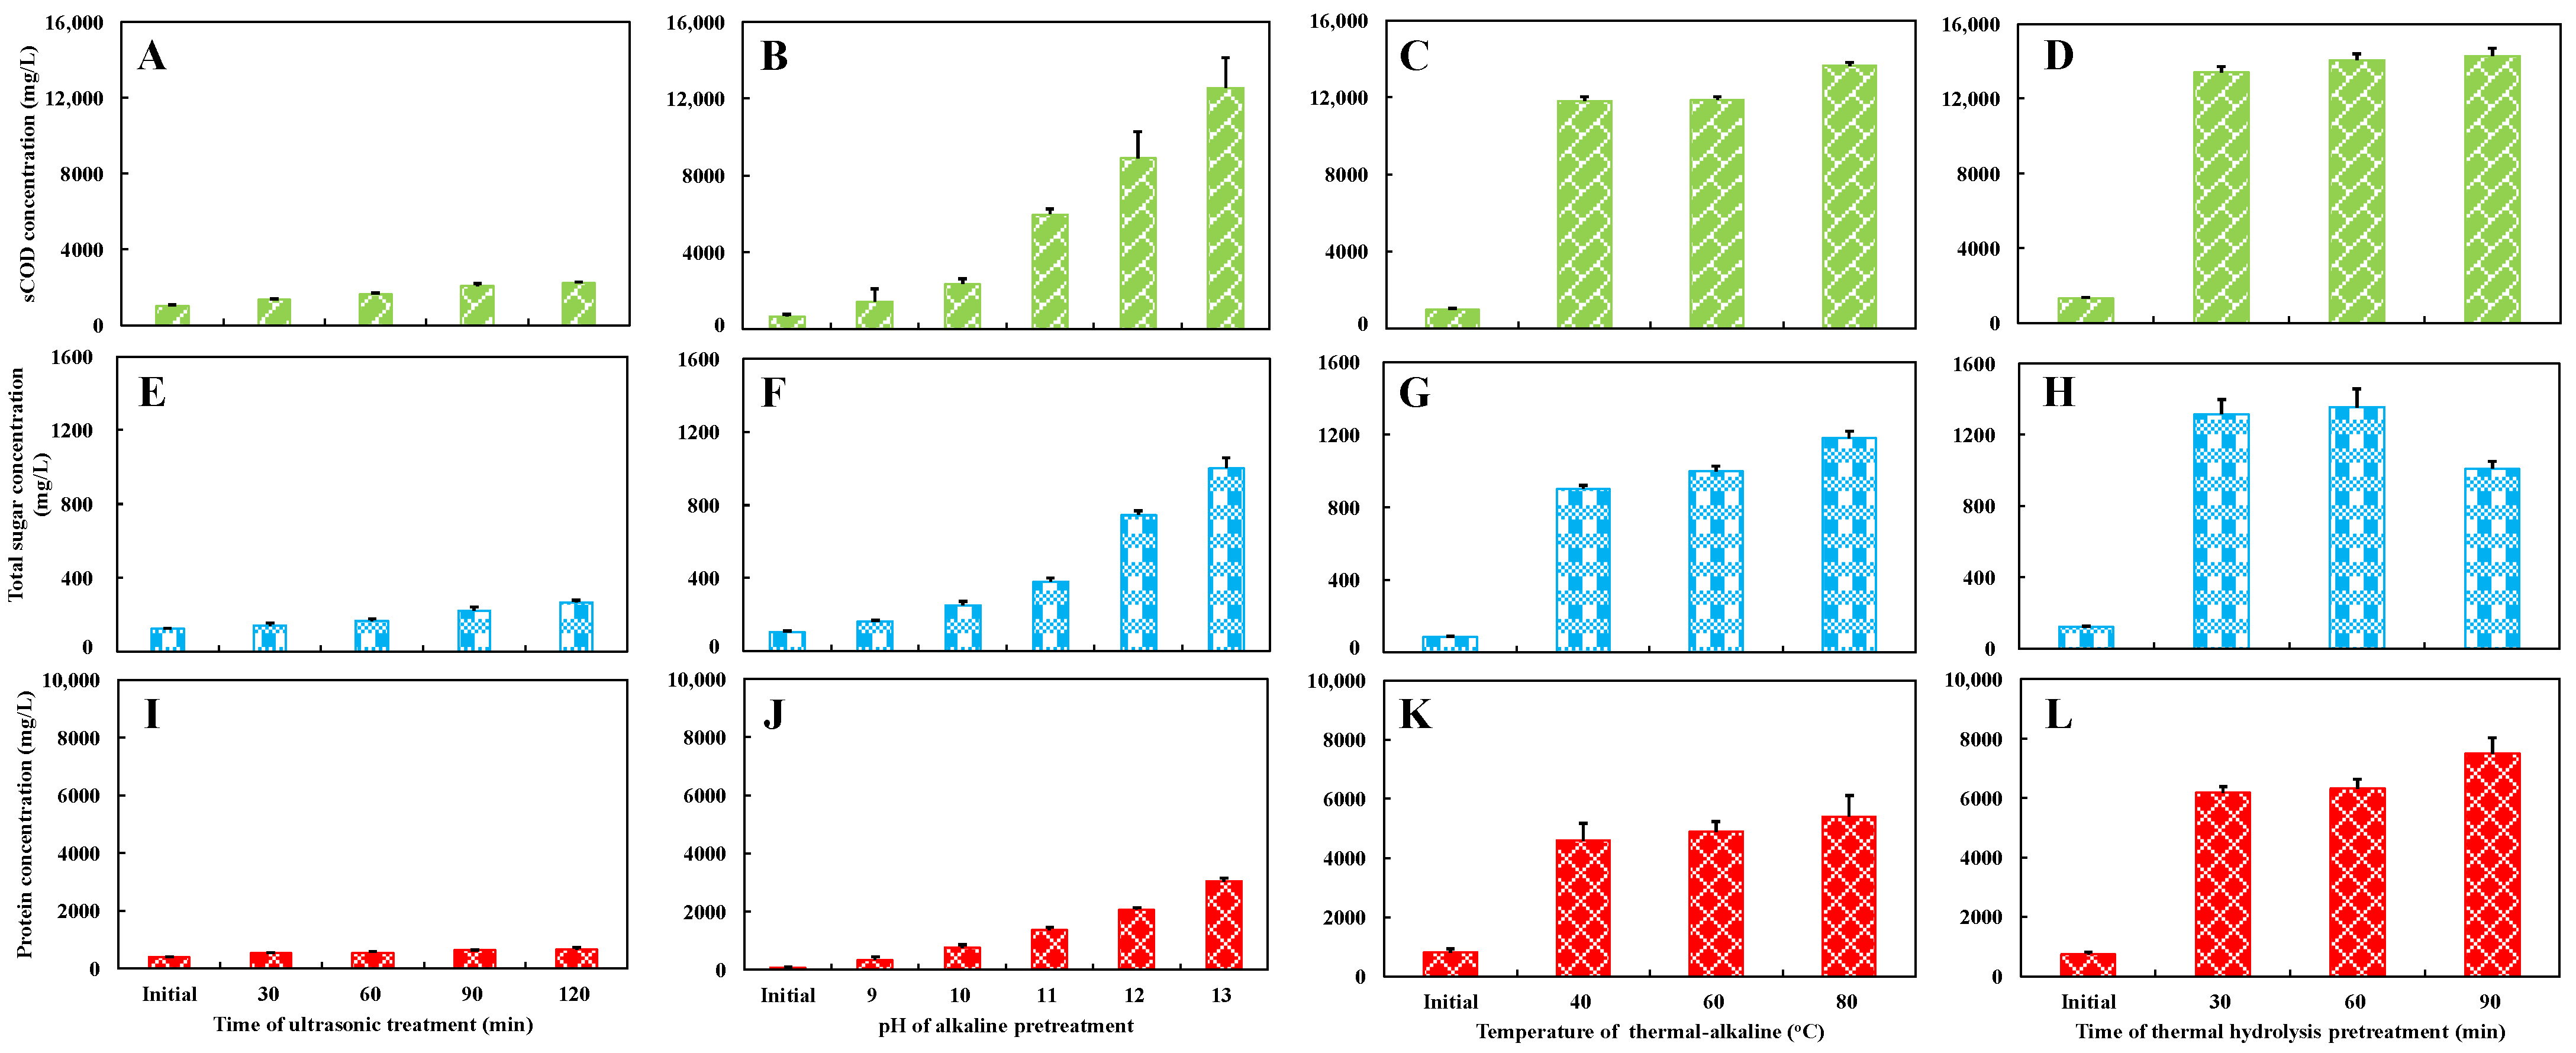
The effects of four pretreatment methods under varying conditions on the hydrolysis of WAS are depicted in Figure 1. UP showed weak facilitation of WAS hydrolysis, and the highest sCOD was recorded as 2217 ± 69 mg/L at 120 min. Very similar trends were observed in the changes in total sugar and soluble protein concentrations, which only increased by 115% and 64%, respectively, compared to the initial WAS. The hydrolysis performance of AP increased with pH appraisal. The maximum sCOD, total sugar, and soluble concentrations were 12,544 ± 1577, 1002 ± 55 and 3048 ± 109 mg/L, respectively, at a pH of 13. With the assistance of heating below the boiling point, TAP demonstrated a slight improvement in hydrolysis compared with AP alone. Increasing the temperature from 40 to 80 °C did not significantly affect hydrolysis (p > 0.05). THP revealed the optimum performance for organic matter release. The concentration of sCOD reached 13,400 ± 333 mg/L after 30 min of treatment which was about 10 folds to that in the initial WAS (p < 0.01). There was no significant increase in sCOD with prolonged treatment time (p > 0.05). An unwanted decrease in the total sugar concentration was observed after 120 min of treatment. This seems to be associated with the Maillard reaction, in which carbohydrates are converted into polymerides and then reduced for the detection of total sugar in the liquid [18,19].
Figure 1.
Effect of hydrolysis (soluble chemical oxygen demand (sCOD), total sugar, and protein concentrations) of ultrasonic pretreatment (A,E,I), alkaline pretreatment (B,F,J), thermal–alkaline pretreatment (C,G,K), and thermal hydrolysis pretreatment (D,H,L) on waste-activated sludge.
3.2. Distribution and Removal of Triclosan Under Various Pretreatment Conditions
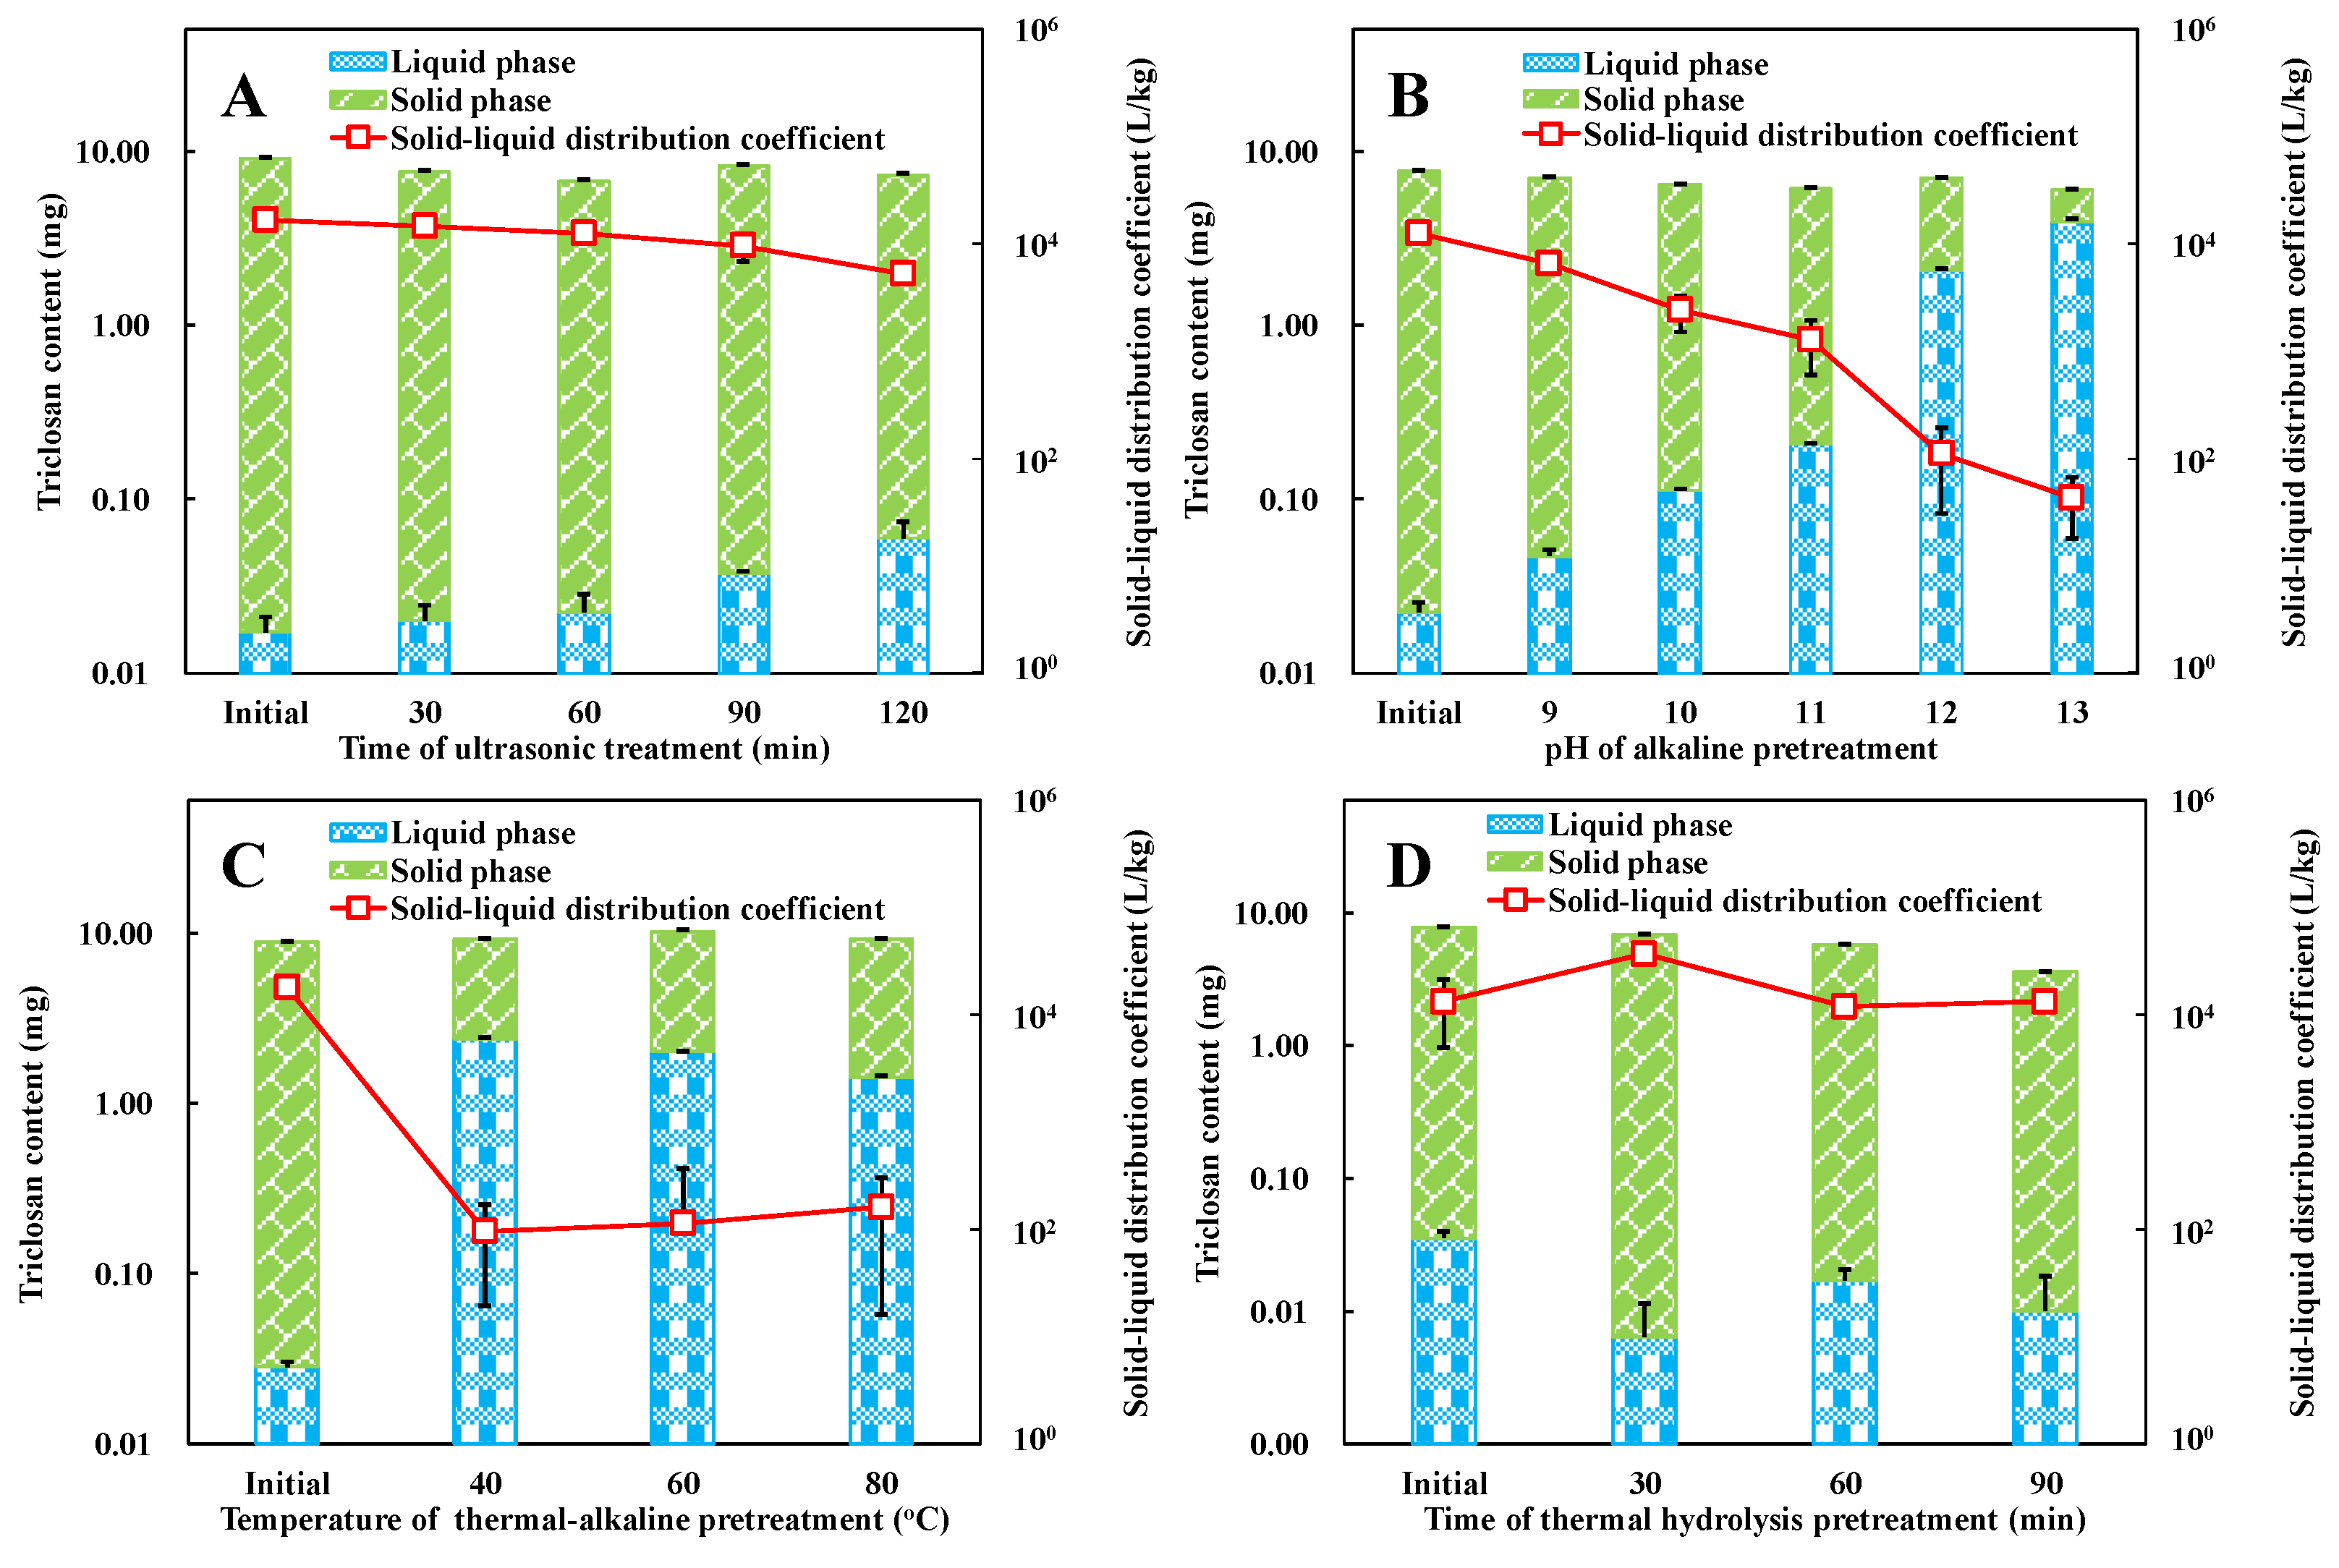
The solid–liquid distribution coefficients were in the range of 12,708 ± 261 to 17,971 ± 1697 L/kg under all the initial WAS conditions, as displayed in Figure 2. An overwhelming majority of TCS was present in the solid phase. UP slightly promoted the dissolution of TCS from the solid to the liquid phase and resulted in a solid–liquid distribution coefficient reduction to 5259 ± 401 L/kg after 120 min of treatment (p < 0.01). The solid–liquid distribution coefficient significantly decreased in AP with increasing pH (p < 0.05), and the amount of TCS in the liquid phase increased by one order of magnitude at pH 10 and two at pH 12. The amount of dissolved TCS was higher than that in the solid phase at pH 13 and under a solid–liquid distribution coefficient of 43 ± 5 L/kg. At an augmentation of the temperature from 40 to 80 °C, the solid–liquid distribution coefficients were stable at 95 ± 76 L/kg to 161 ± 145 L/kg. In contrast to the previously mentioned three pretreatment methods, THP exhibited significant removal effects (p < 0.05) of TCS of 12.8%, 26.1%, and 54.0%, respectively, under treatment time limits of 30, 60, and 90 min. Specifically, the TCS amount in the liquid phase was retained steady in a low range of 0.006 ± 0.005 to 0.017 ± 0.004 mg, while that in the solid phase was significantly decreased to 3.57 ± 0.05 mg (p < 0.05). Interestingly, the dissolved TCS was readily degraded compared with that absorbed into the solid phase.
Figure 2.
The effect of ultrasonic pretreatment (A), alkaline pretreatment (B), thermal–alkaline pretreatment (C), and thermal hydrolysis pretreatment (D) on the concentration and solid–liquid distribution coefficient of TCS.
4. Discussion
Pretreatment is an indispensable step for accelerating hydrolysis and further enhancing anaerobic digestion and other biological resource recovery processes [20]. The solubilization of organic matter is strongly dependent on hydrolysis strength. As illustrated in Figure 1, the most effective pretreatment method was THP, which demonstrated a sufficient hydrolysis effect after 30 min of treatment, and no significant enhancement was noticed with time increases to 60 and 90 min. A previous study reported that the reaction time had a low incidence of THP [21]. The TAP could achieve similar performance to THP, but it required strong alkaline solutions with a pH of 13 and heating up to 80 °C. Based on the results of existing practical projects and literature reports, THP has been extensively applied in the pretreatment of WAS before anaerobic digestion in China, notably in processes such as Cambi [21]. Despite the high energy consumption associated with high-temperature operations, THP offered a significant advantage in hydrolyzing WAS, which substantially enhanced subsequent methane production. Furthermore, the optimized heat exchange process can efficiently harness the residual heat from the THP treatment to preheat the incoming materials, thereby achieving lower overall energy consumption for THP. Although the TAP process could achieve a hydrolysis effect comparable to that of THP, its industrial application is less favorable because of the extensive use of chemical reagents and prolonged operation time. Relatively mild pretreatment conditions, such as UP and AP, were inadequate for the hydrolysis of WAS. Sufficient hydrolysis can release cellular content by cell wall rupture, macromolecule degradation, and conversion of insoluble organic matter to soluble contents. For instance, the extracellular polymeric substances are a complex mixture of biopolymers comprising polysaccharides, proteins, nucleic acids, uronic acids, humic substances, and lipids, amongst others [22]. It was comprehended that the extent of hydrolysis of four pretreatment methods was THP > TAP > AP > UP, by employing the increment of soluble organic matter as the index for evaluation of the effects of hydrolysis.
The various pretreatment methods exhibited quite different effects on the TCS migration and removal in this study as portrayed in Figure 2. Significant removal of TCS was only observed in THP, and it was strongly dependent on the treatment time. The suitable operating time parameter was reported as 30–60 min considering the hydrolysis effect of WAS [22]; however, it was obviously not qualified for TCS degradation. The removal efficiency of TCS was significantly improved by extending the retention time to 90 min (p < 0.01). TCS is considered a stable substance compared to the WAS cellular structures, yet it can be decomposed under high-temperature and high-pressure conditions. The distribution of TCS between the solid and liquid phases strongly depended on the solution pH, which could be attributed to the dissociation equilibrium between the molecular form of TCS and anionic TCS (TCS-) [23]. The increased anionic TCS proportion stimulated TCS migration from the solid to the liquid phase, which led to a significantly decreased trend of the solid–liquid distribution coefficient (p < 0.05) with progressively elevated pH, as shown in Figure 2. In addition to the changes in the form of TCS molecules caused by pH variations, which altered the distribution between the solid and liquid phases, fluctuations in the concentrations of organic substances such as proteins, polysaccharides, volatile fatty acids, and inorganic substances such as ammonium also influenced the interphase distribution of TCS. The primary mechanism involves the formation of electrostatic interactions, hydrophobic effects, hydrogen bonding, and other synergistic mechanisms with TCS molecules through their unique structures, thereby modifying the solid–liquid distribution coefficient of TCS. The alkaline condition was insignificant for removal effects on TCS, even with the assistance of a low strength of heat (TAP). UP demonstrated the lowest pretreatment strength among the four methods and exhibited negligible influence on both the migration and removal of TCS, as predicted.
Understanding the migration and removal performance of hydrophobic antibiotics/antibacterial agents (such as TCS) in WAS pretreatment is crucial for subsequent treatment and disposal [24]. To date, a few researchers have demonstrated the fate of antibiotics/antibacterial agents during WAS pretreatment, as tabulated in Table 3. The migration and removal performance of these hydrophobic compounds between the solid and liquid phases were strongly governed by the WAS pretreatment conditions, as well as their properties. THP presented an indiscriminate attack on organic matter, which makes its performance preferable for the hydrolysis of WAS and hydrophobic antibiotics/antibacterials. However, the optimal operating parameters of THP to hydrolyze WAS reported in the literature (~170 °C and ~30 min) are not adequate for removing these hydrophobic compounds. It might also require more detailed information from diverse THPs and data covering multiple target contaminants to establish the fundamentals of antibiotic/antibacterial degradation and migration in THPs.
Table 3.
Summary of the fate of antibiotics/antibacterial agents during the WAS pretreatments.
It is obvious that the adsorbed contaminants were impossible to degrade when they enveloped up in the solid particles. The elimination required efficient contact between the substances and the reactive interface. Therefore, more research emphasis needs to be dedicated to the migration of hydrophobic contaminants throughout WAS treatment. Migration might be affected by acidic or alkaline pretreatment because of their dissociation degree [29]. Nevertheless, more attention is required for pH adjustment processes. For instance, the pH would be attuned to an alkaline environment to accommodate the demand for struvite precipitation to recover nutrients [30], while it would potentially increase the release of TCS from the solid phase and cause potential risks.
Forthcoming research will involve the systematic evaluation of the fate of hydrophobic antibiotics/antibacterial after pretreatment, such as anaerobic digestion, biogas slurry treatment, residue disposal, etc. Efficient mathematical methods should be proposed to describe the migration processes of these substances.
5. Conclusions
In this study, we examined the distribution and removal of TCS across various WAS pretreatment methods. THP exhibited superior performance in WAS hydrolysis and TCS removal, owing to its robust hydrolysis capability. Alkaline conditions promoted TCS migration from the sludge to the liquid phase, whereas AP and TAP showed limited effectiveness in TCS removal. UP was found to be inefficient for WAS hydrolysis, TCS migration, and TCS removal. These findings underscored the critical need to focus research efforts on the transformation of emerging contaminants during WAS pretreatment and their subsequent management.
Author Contributions
Conceptualization, M.-H.C.; methodology, S.-Y.W.; investigation, S.-Y.W.; writing—original draft preparation, H.-Y.D. and M.-H.C.; writing—review and editing, T.S. and M.-H.C.; funding acquisition, M.-H.C. All authors have read and agreed to the published version of the manuscript.
Funding
This research was funded by the National Natural Science Foundation of China (No. 52370171 and 52000088).
Data Availability Statement
Data are contained within the article.
Conflicts of Interest
The authors declare no conflicts of interest.
References
- Chen, J.; Meng, X.-Z.; Bergman, A.; Halden, R.U. Nationwide reconnaissance of five parabens, triclosan, triclocarban and its transformation products in sewage sludge from China. J. Hazard. Mater. 2019, 365, 502–510. [Google Scholar] [CrossRef]
- Wang, Z.; Li, X.; Liu, H.; Zhou, T.; Li, J.; Li, Y.; Lin, C.S.K.; Wang, Q. Triclosan in sludge: Exploring its journey from the sewage treatment plants to land application and potential impacts on the environment. Crit. Rev. Environ. Sci. Technol. 2024, 54, 1–24. [Google Scholar] [CrossRef]
- Cameron, A.; Barbieri, R.; Read, R.; Church, D.; Adator, E.H.; Zaheer, R.; McAllister, T.A. Functional screening for triclosan resistance in a wastewater metagenome and isolates of Escherichia coli and Enterococcus spp. from a large Canadian healthcare region. PLoS ONE 2019, 14, e0211144. [Google Scholar] [CrossRef] [PubMed]
- Cui, M.-H.; Chen, L.; Zhang, X.-D.; Zhang, Q.; Pan, H.; Liu, L.-Y.; Liu, H.; Wang, A.-J. Recent advancements on the migration and transformation of hydrophobic pharmaceutically active compounds in anaerobic digestion process. Chem. Eng. J. 2022, 446, 136902. [Google Scholar] [CrossRef]
- Halden, R.U.; Lindeman, A.E.; Aiello, A.E.; Andrews, D.; Arnold, W.A.; Fair, P.; Fuoco, R.E.; Geer, L.A.; Johnson, P.I.; Lohmann, R. The florence statement on triclosan and triclocarban. Environ. Health Perspect. 2017, 125, 064501. [Google Scholar] [CrossRef] [PubMed]
- Lei, K.; Zhu, Y.; Chen, W.; Pan, H.Y.; Guo, B.B.; Zhang, X.; Cao, Y.X.; Sweetman, A.J.; Lin, C.Y. The occurrence of home and personal care products in the Haihe River catchment and estimation of human exposure. Sci. Total Environ. 2018, 643, 63–72. [Google Scholar] [CrossRef] [PubMed]
- Mohan, S.; Balakrishnan, P. Triclosan in Treated Wastewater from a City Wastewater Treatment Plant and its Environmental Risk Assessment. Water Air Soil. Pollut. 2019, 230, 1–13. [Google Scholar] [CrossRef]
- Lépesová, K.; Krahulcová, M.; Mackuľak, T.; Bírošová, L. Sewage sludge as a source of triclosan-resistant bacteria. Acta Chim. Slovaca 2019, 12, 34–40. [Google Scholar] [CrossRef]
- Hill, K.L.; Breton, R.L.; Manning, G.E.; Teed, R.S.; Capdevielle, M.; Slezak, B. Deriving a water quality guideline for protection of aquatic communities exposed to triclosan in the Canadian environment. Integr. Environ. Assess. Manag. 2018, 14, 437–441. [Google Scholar] [CrossRef] [PubMed]
- Cui, M.H.; Chen, L.; Zhang, Q.; Liu, L.Y.; Pan, H.; Liu, H.; Wang, A.J. Understanding the effects of sludge characteristics on the biosorption of triclosan. Sci. Total Environ. 2022, 842, 156665. [Google Scholar] [CrossRef] [PubMed]
- Sadino-Riquelme, C.; Hayes, R.E.; Jeison, D.; Donoso-Bravo, A. Computational fluid dynamic (CFD) modelling in anaerobic digestion: General application and recent advances. Crit. Rev. Environ. Sci. Technol. 2018, 48, 39–76. [Google Scholar] [CrossRef]
- Zhen, G.; Lu, X.; Kato, H.; Zhao, Y.; Li, Y.-Y. Overview of pretreatment strategies for enhancing sewage sludge disintegration and subsequent anaerobic digestion: Current advances, full-scale application and future perspectives. Renew. Sustain. Energy Rev. 2017, 69, 559–577. [Google Scholar] [CrossRef]
- Heidler, J.; Halden, R.U. Fate of organohalogens in US wastewater treatment plants and estimated chemical releases to soils nationwide from biosolids recycling. J. Environ. Monit. 2009, 11, 2207–2215. [Google Scholar] [CrossRef]
- Chen, J.L.; Ravindran, S.; Swift, S.; Singhal, N. Changes in estrogenicity and micropollutant concentrations across unit processes in a biological wastewater treatment system. Water Sci. Technol. 2018, 77, 1673–1682. [Google Scholar] [CrossRef]
- Barber, W.P.F. Thermal hydrolysis for sewage treatment: A critical review. Water Res. 2016, 104, 53–71. [Google Scholar] [CrossRef] [PubMed]
- EPA. Standard Methods for the Examination of Water and Wastewater, 4th ed.; China Environmental Science Press: Beijing, China, 2002.
- Dubois, M.; Gilles, K.A.; Hamilton, J.K.; Rebers, P.A.; Smith, F.J.A.C. Colorimetric Method for Determination of Sugars and Related Substances. Anal. Chem. 1956, 28, 350–356. [Google Scholar] [CrossRef]
- Dwyer, J.; Starrenburg, D.; Tait, S.; Barr, K.; Batstone, D.J.; Lant, P. Decreasing activated sludge thermal hydrolysis temperature reduces product colour, without decreasing degradability. Water Res. 2008, 42, 4699–4709. [Google Scholar] [CrossRef]
- Muir, D.D. The Maillard Reaction—Chemistry, Biochemistry and Implications. Int. J. Dairy. Technol. 2010, 60, 59. [Google Scholar] [CrossRef]
- Zhang, D.; Jiang, H.; Chang, J.; Sun, J.; Tu, W.; Wang, H. Effect of thermal hydrolysis pretreatment on volatile fatty acids production in sludge acidification and subsequent polyhydroxyalkanoates production. Bioresour. Technol. 2019, 279, 92–100. [Google Scholar] [CrossRef]
- Sapkaite, I.; Barrado, E.; Fdz-Polanco, F.; Perez-Elvira, S.I. Optimization of a thermal hydrolysis process for sludge pre-treatment. J. Environ. Manag. 2017, 192, 25–30. [Google Scholar] [CrossRef] [PubMed]
- Carrere, H.; Dumas, C.; Battimelli, A.; Batstone, D.J.; Delgenes, J.P.; Steyer, J.P.; Ferrer, I. Pretreatment methods to improve sludge anaerobic degradability: A review. J. Hazard. Mater. 2010, 183, 1–15. [Google Scholar] [CrossRef] [PubMed]
- Yan, Z.R.; Meng, H.S.; Yang, X.Y.; Zhu, Y.Y.; Li, X.Y.; Xu, J.; Sheng, G.P. Insights into the interactions between triclosan (TCS) and extracellular polymeric substance (EPS) of activated sludge. J. Environ. Manag. 2018, 232, 219–225. [Google Scholar] [CrossRef]
- Quan, B.; Li, X.; Zhang, H.; Zhang, C.; Ming, Y.; Huang, Y.; Xi, Y.; Weihua, X.; Yunguo, L.; Tang, Y. Technology and principle of removing triclosan from aqueous media: A review. Chem. Eng. J. 2019, 378, 122185. [Google Scholar] [CrossRef]
- Balcioglu, I.A.; Oncu, N.B.; Mercan, N. Beneficial effects of treating waste secondary sludge with thermally activated persulfate. J. Chem. Technol. Biotechnol. 2017, 92, 1192–1202. [Google Scholar] [CrossRef]
- Armstrong, D.L.; Rice, C.P.; Ramirez, M.; Torrents, A. Influence of thermal hydrolysis-anaerobic digestion treatment of wastewater solids on concentrations of triclosan, triclocarban, and their transformation products in biosolids. Chemosphere 2017, 171, 609–616. [Google Scholar] [CrossRef] [PubMed]
- Li, N.; Liu, H.; Xue, Y.; Wang, H.; Dai, X. Partition and fate analysis of fluoroquinolones in sewage sludge during anaerobic digestion with thermal hydrolysis pretreatment. Sci. Total Environ. 2017, 581–582, 715–721. [Google Scholar] [CrossRef] [PubMed]
- Zhang, X.; Li, R. Variation of antibiotics in sludge pretreatment and anaerobic digestion processes: Degradation and solid-liquid distribution. Bioresour. Technol. 2018, 255, 266–272. [Google Scholar] [CrossRef]
- Yan, Z.R.; Zhu, Y.Y.; Meng, H.S.; Wang, S.Y.; Gan, L.H.; Li, X.Y.; Xu, J.; Zhang, W. Insights into thermodynamic mechanisms driving bisphenol A (BPA) binding to extracellular polymeric substances (EPS) of activated sludge. Sci. Total Environ. 2019, 677, 502–510. [Google Scholar] [CrossRef] [PubMed]
- Zhang, L.; Liu, H.; Zheng, Z.; Ma, H.; Yang, M.; Liu, H. Continuous liquid fermentation of pretreated waste activated sludge for high rate volatile fatty acids production and online nutrients recovery. Bioresour. Technol. 2018, 249, 962–968. [Google Scholar] [CrossRef]
Disclaimer/Publisher’s Note: The statements, opinions and data contained in all publications are solely those of the individual author(s) and contributor(s) and not of MDPI and/or the editor(s). MDPI and/or the editor(s) disclaim responsibility for any injury to people or property resulting from any ideas, methods, instructions or products referred to in the content. |
© 2025 by the authors. Licensee MDPI, Basel, Switzerland. This article is an open access article distributed under the terms and conditions of the Creative Commons Attribution (CC BY) license (https://creativecommons.org/licenses/by/4.0/).