1. Introduction
In recent years, due to the dual impact of natural environmental changes and high-intensity human activities, floods have become one of the most frequent and widespread global natural disasters, posing a serious threat to people’s lives, property security, and social stability [
1,
2,
3]. According to the United Nations Office for Disaster Risk Reduction (UNISDR), floods resulted in over 2300 deaths and affected more than 95 million people globally, with economic losses estimated at over USD 40 billion in 2020 alone. Accurate and efficient flood simulation plays a vital role in flood warning, risk analysis, and reservoir regulation [
4,
5,
6,
7].
In order to further improve the accuracy of hydrological simulation, various hydrological models have been utilized for flood simulations [
8,
9,
10,
11]. The majority of widely used classical hydrological models are based on the physical concepts of hydrological phenomena and empirical formulas. The setting of parameters in these models determines their final simulation performance [
12]. A method was developed to perform event-based flood simulation on a sub-daily timescale based on SWAT2005 and simultaneously improved the UH method used in the original SWAT model [
13]. The correlated parameters were established using Pearson Correlation Analysis from the calibrated SWAT-generated parameters to enhance the accuracy of flood simulations in the Ponnaiyar River Basin [
14]. A distributed Xin’anjiang hydrological model was utilized to conduct flood simulations in Shandong, which demonstrated high accuracy [
15]. These studies mostly adopt a set of hydrological model parameters obtained through calibration using multiple historical flood events for flood simulation. However, there are differences in the parameters of the hydrological model corresponding to different types of floods. For example, in terms of confluence parameters, the larger the flood, the shorter the confluence time, with an earlier peak occurrence time and a sharper and thinner process; conversely, the longer the confluence time, the later the peak occurrence time, and the flatter the process. Therefore, a flood forecasting method that relies on only one set of parameters across an entire watershed obviously cannot meet the requirements for higher precision hydrological simulations.
Due to the high complexity and randomness of flood processes, coupled with their exhibition of certain regular characteristics, extracting effective flood characteristic parameters from historical flood databases and conducting flood classification research based on these parameters have become crucial research directions for improving the accuracy and efficiency of flood forecasting. With the rapid advancement of computing capabilities and the swift development of big data technologies, machine learning methods have effectively facilitated the efficient integration and management of massive information and multi-source data, significantly enhancing the efficiency and accuracy of flood classification [
16,
17,
18]. An iterative model based on fuzzy clustering was proposed, which combines subjective weights with objective weights using sensitivity coefficients. This resulted in the construction of a fuzzy clustering iterative model with combined weights (FCI-CW) and achieved good results in flood classification at Nanjing Station and Yichang Station [
19]. An optimization model for flood classification was established through a projection pursuit model, and solved using a shuffled frog leaping algorithm. The research results indicate that, compared to the projection pursuit model optimized by the particle swarm optimization algorithm (PSO-PPM), the projection pursuit model optimized by the shuffled frog leaping algorithm (SFL-PPM) is more effective and reasonable [
20]. A quick and flexible Gaussian Naïve Bayes (GNB) classifier was utilized to categorize eight different years as flooded or non-flooded based on predictor variables obtained via the Mutual Information (MI) technique [
21]. However, most of the aforementioned classification methods lack in-depth consideration of the characteristic factors of actual rainstorm-induced floods. They are susceptible to limitations imposed by factors such as data quality, model assumptions, and uncertainties, and are unable to accurately represent the characteristics, trends, and underlying physical mechanisms of rainstorm-induced flood events [
22]. Studies have shown that incorporating precipitation characteristics (such as precipitation intensity and duration) into the classification can better capture the relationship between precipitation and floods, improve classification accuracy, and provide a more scientific and reasonable basis for flood prediction and prevention [
23].
Despite significant advancements made in the fields of flood simulation and classification, there are still critical research gaps that urgently need to be filled. Firstly, although various hydrological models have been widely applied in flood simulation, most of these models rely on a set of hydrological model parameters calibrated through historical flood events. However, there are differences in the hydrological model parameters corresponding to different types of floods, which results in the inability of a single parameter set to meet the requirements for high-precision hydrological simulation when used for flood forecasting across the entire watershed. Secondly, despite the application of machine learning methods in flood classification, which has improved the efficiency and accuracy of classification, most classification methods lack in-depth consideration of the actual characteristics and factors of rainstorm-induced floods. They are susceptible to limitations such as data quality, model assumptions, and uncertainties, and are unable to accurately reflect the characteristics, trends, and underlying physical mechanisms of rainstorm-induced flood events.
This study aims to explore a more effective flood classification method, thereby improving the accuracy of different categories of floods based on hydrological models and reducing the errors associated with using only one set of parameters for an entire watershed. Taking Xunhe watershed in Shandong Province as the study area, the Random Forest model was employed to classify floods based on five rainfall characteristics (one-hour maximum precipitation, 3-hour maximum precipitation, total precipitation, rainfall duration, and mean rain intensity). On this basis, a Spatio-Temporal Variable Source Mixed Model was utilized to obtain parameters for various flood categories, enabling the simulation of different categories of floods.
2. Study Area and Data Processing
2.1. Study Area
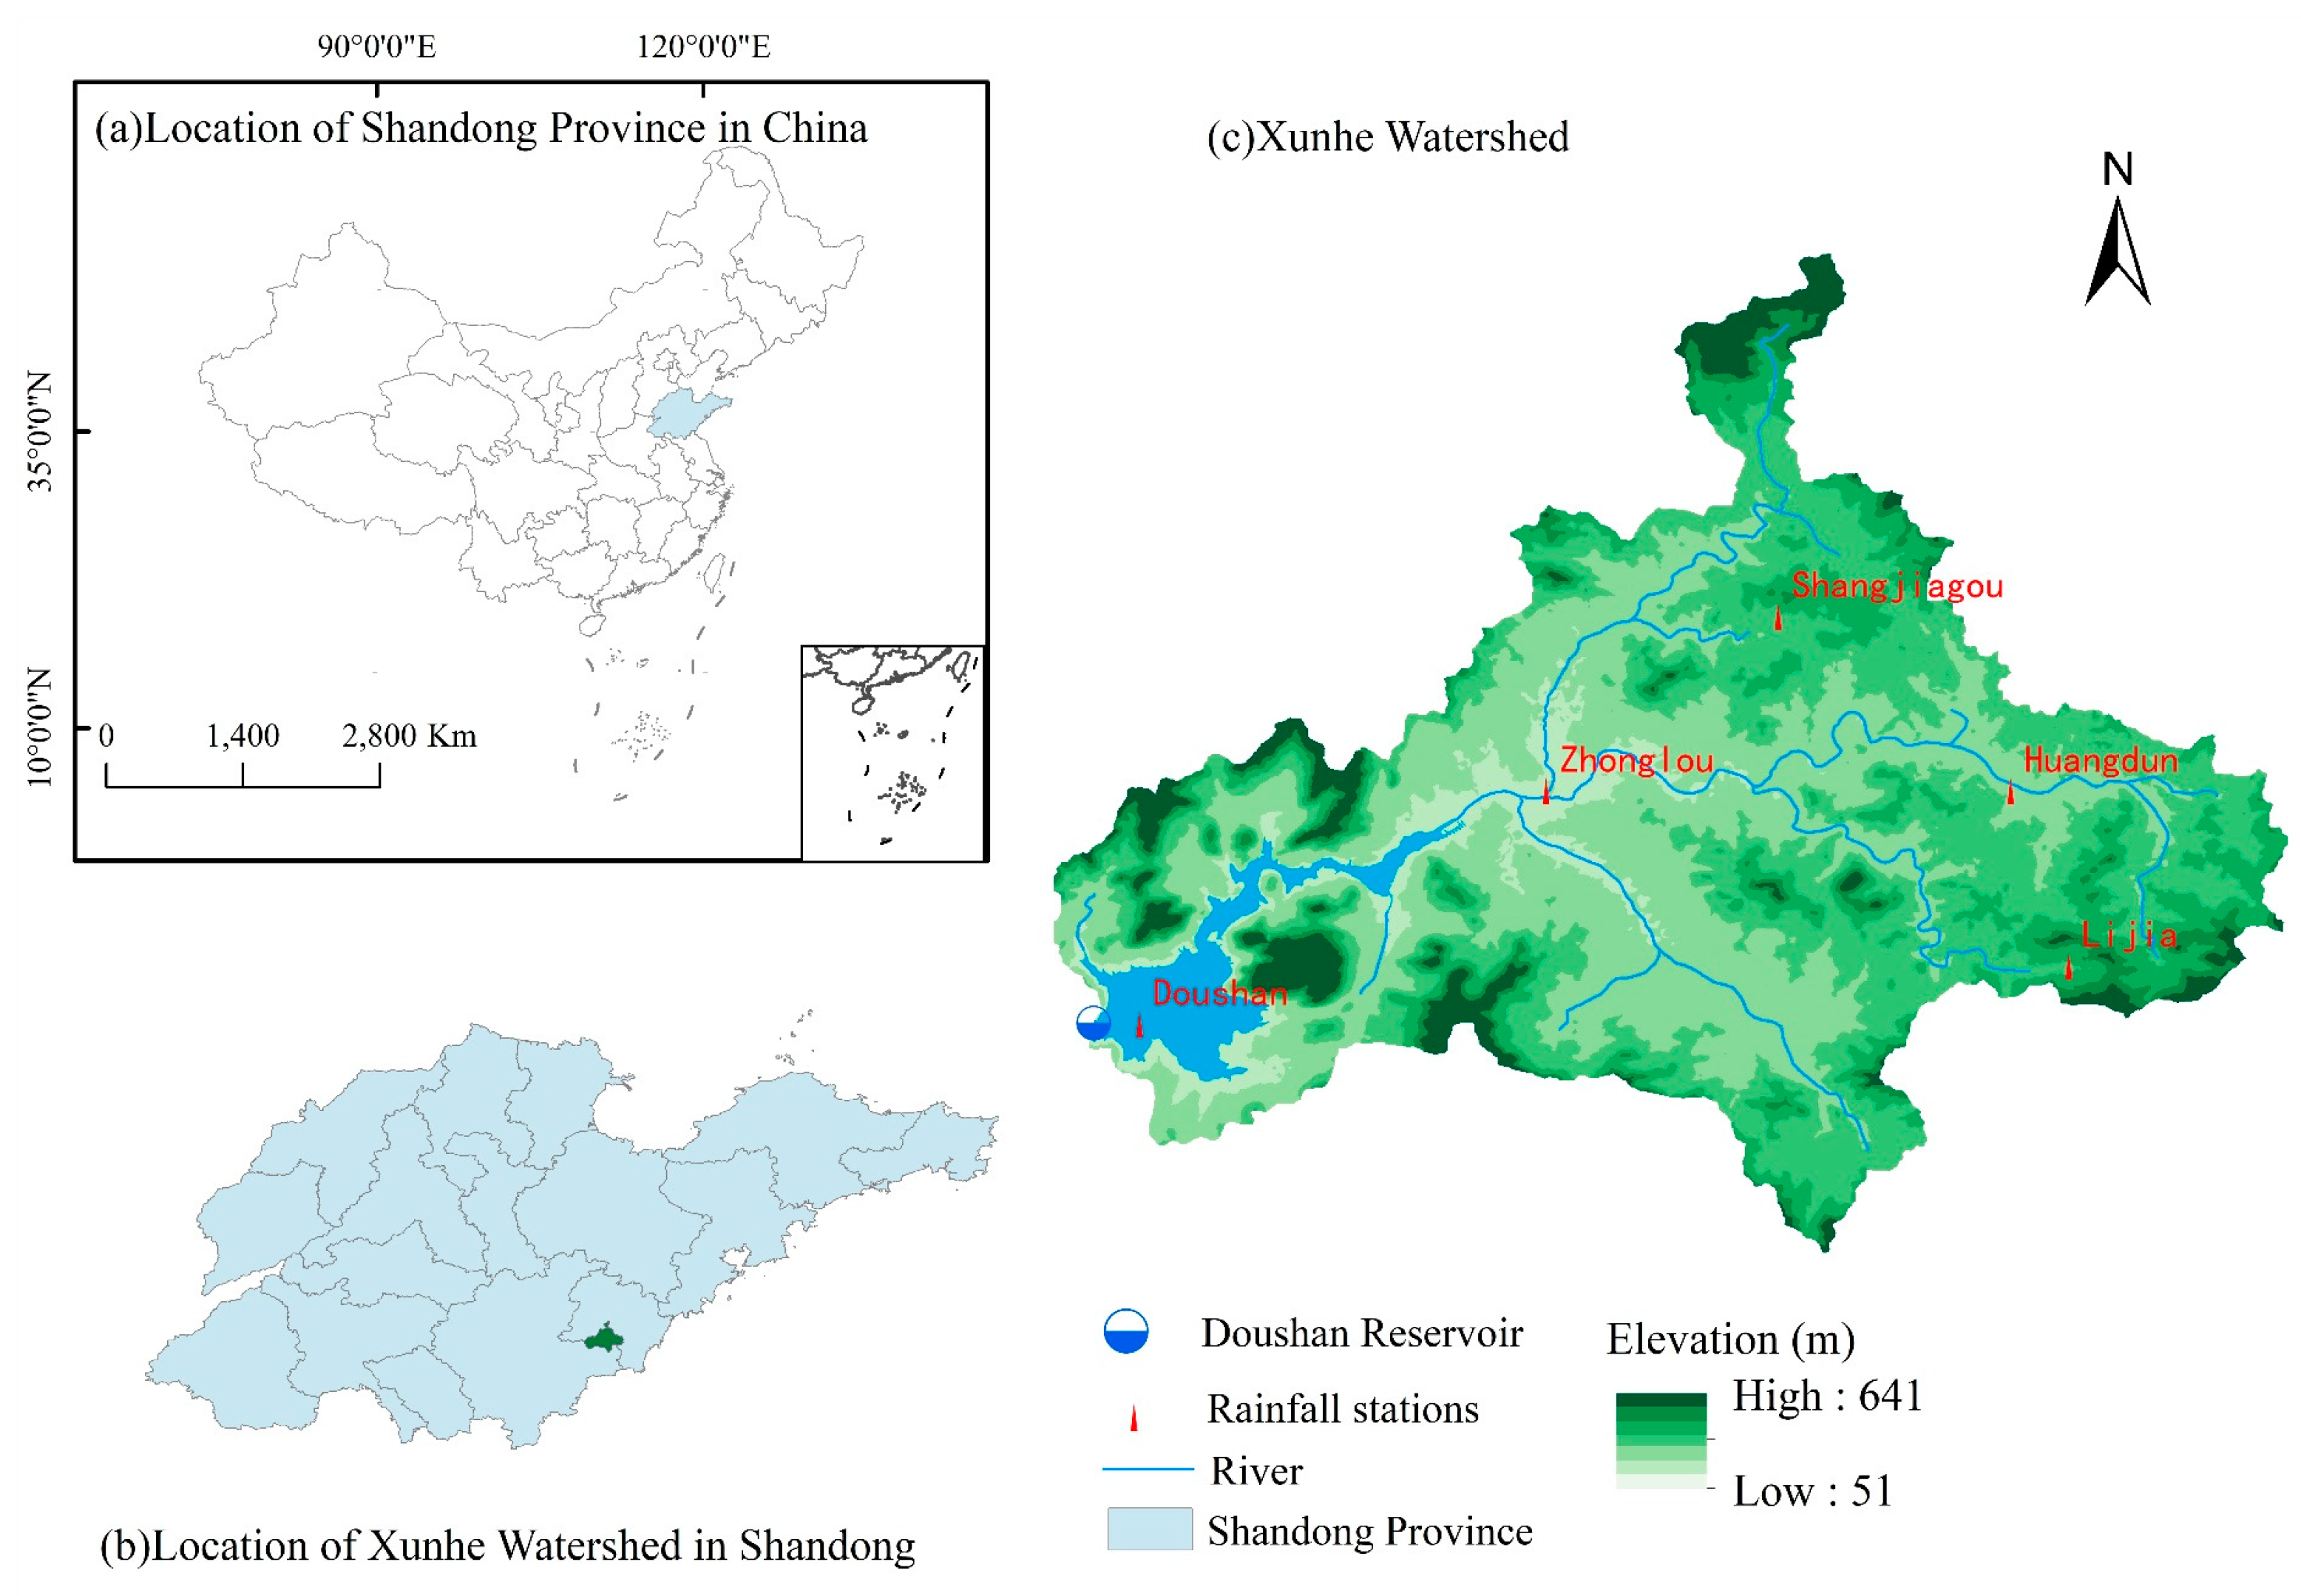
In this study, Xunhe watershed is selected as the study area (
Figure 1). It covers an area of 535.26 km
2, which is a tributary of Yishu River, Shandong, China. The watershed is located in a temperate monsoon climate zone, with an average annual rainfall of 813.3 mm. The precipitation is unevenly distributed throughout the year and exhibits significant interannual variations. The average annual precipitation during the flood season accounts for approximately 71.4% of the total annual precipitation. Historically, Xunhe watershed has been prone to frequent floods. Despite local government efforts, the watershed’s flood control standards remain low, and flood disasters occur frequently.
Doushan Reservoir serves as a representative station in Xunhe watershed. Situated at the outlet of Xunhe watershed, it possesses detailed information on precipitation, evaporation, water levels, flow velocities, and other hydrological parameters. This study primarily utilizes rainfall data from five rainfall stations and discharge data from Doushan Reservoir.
2.2. Data
The data required in this study can be divided into two parts: geographical data and hydrological data.
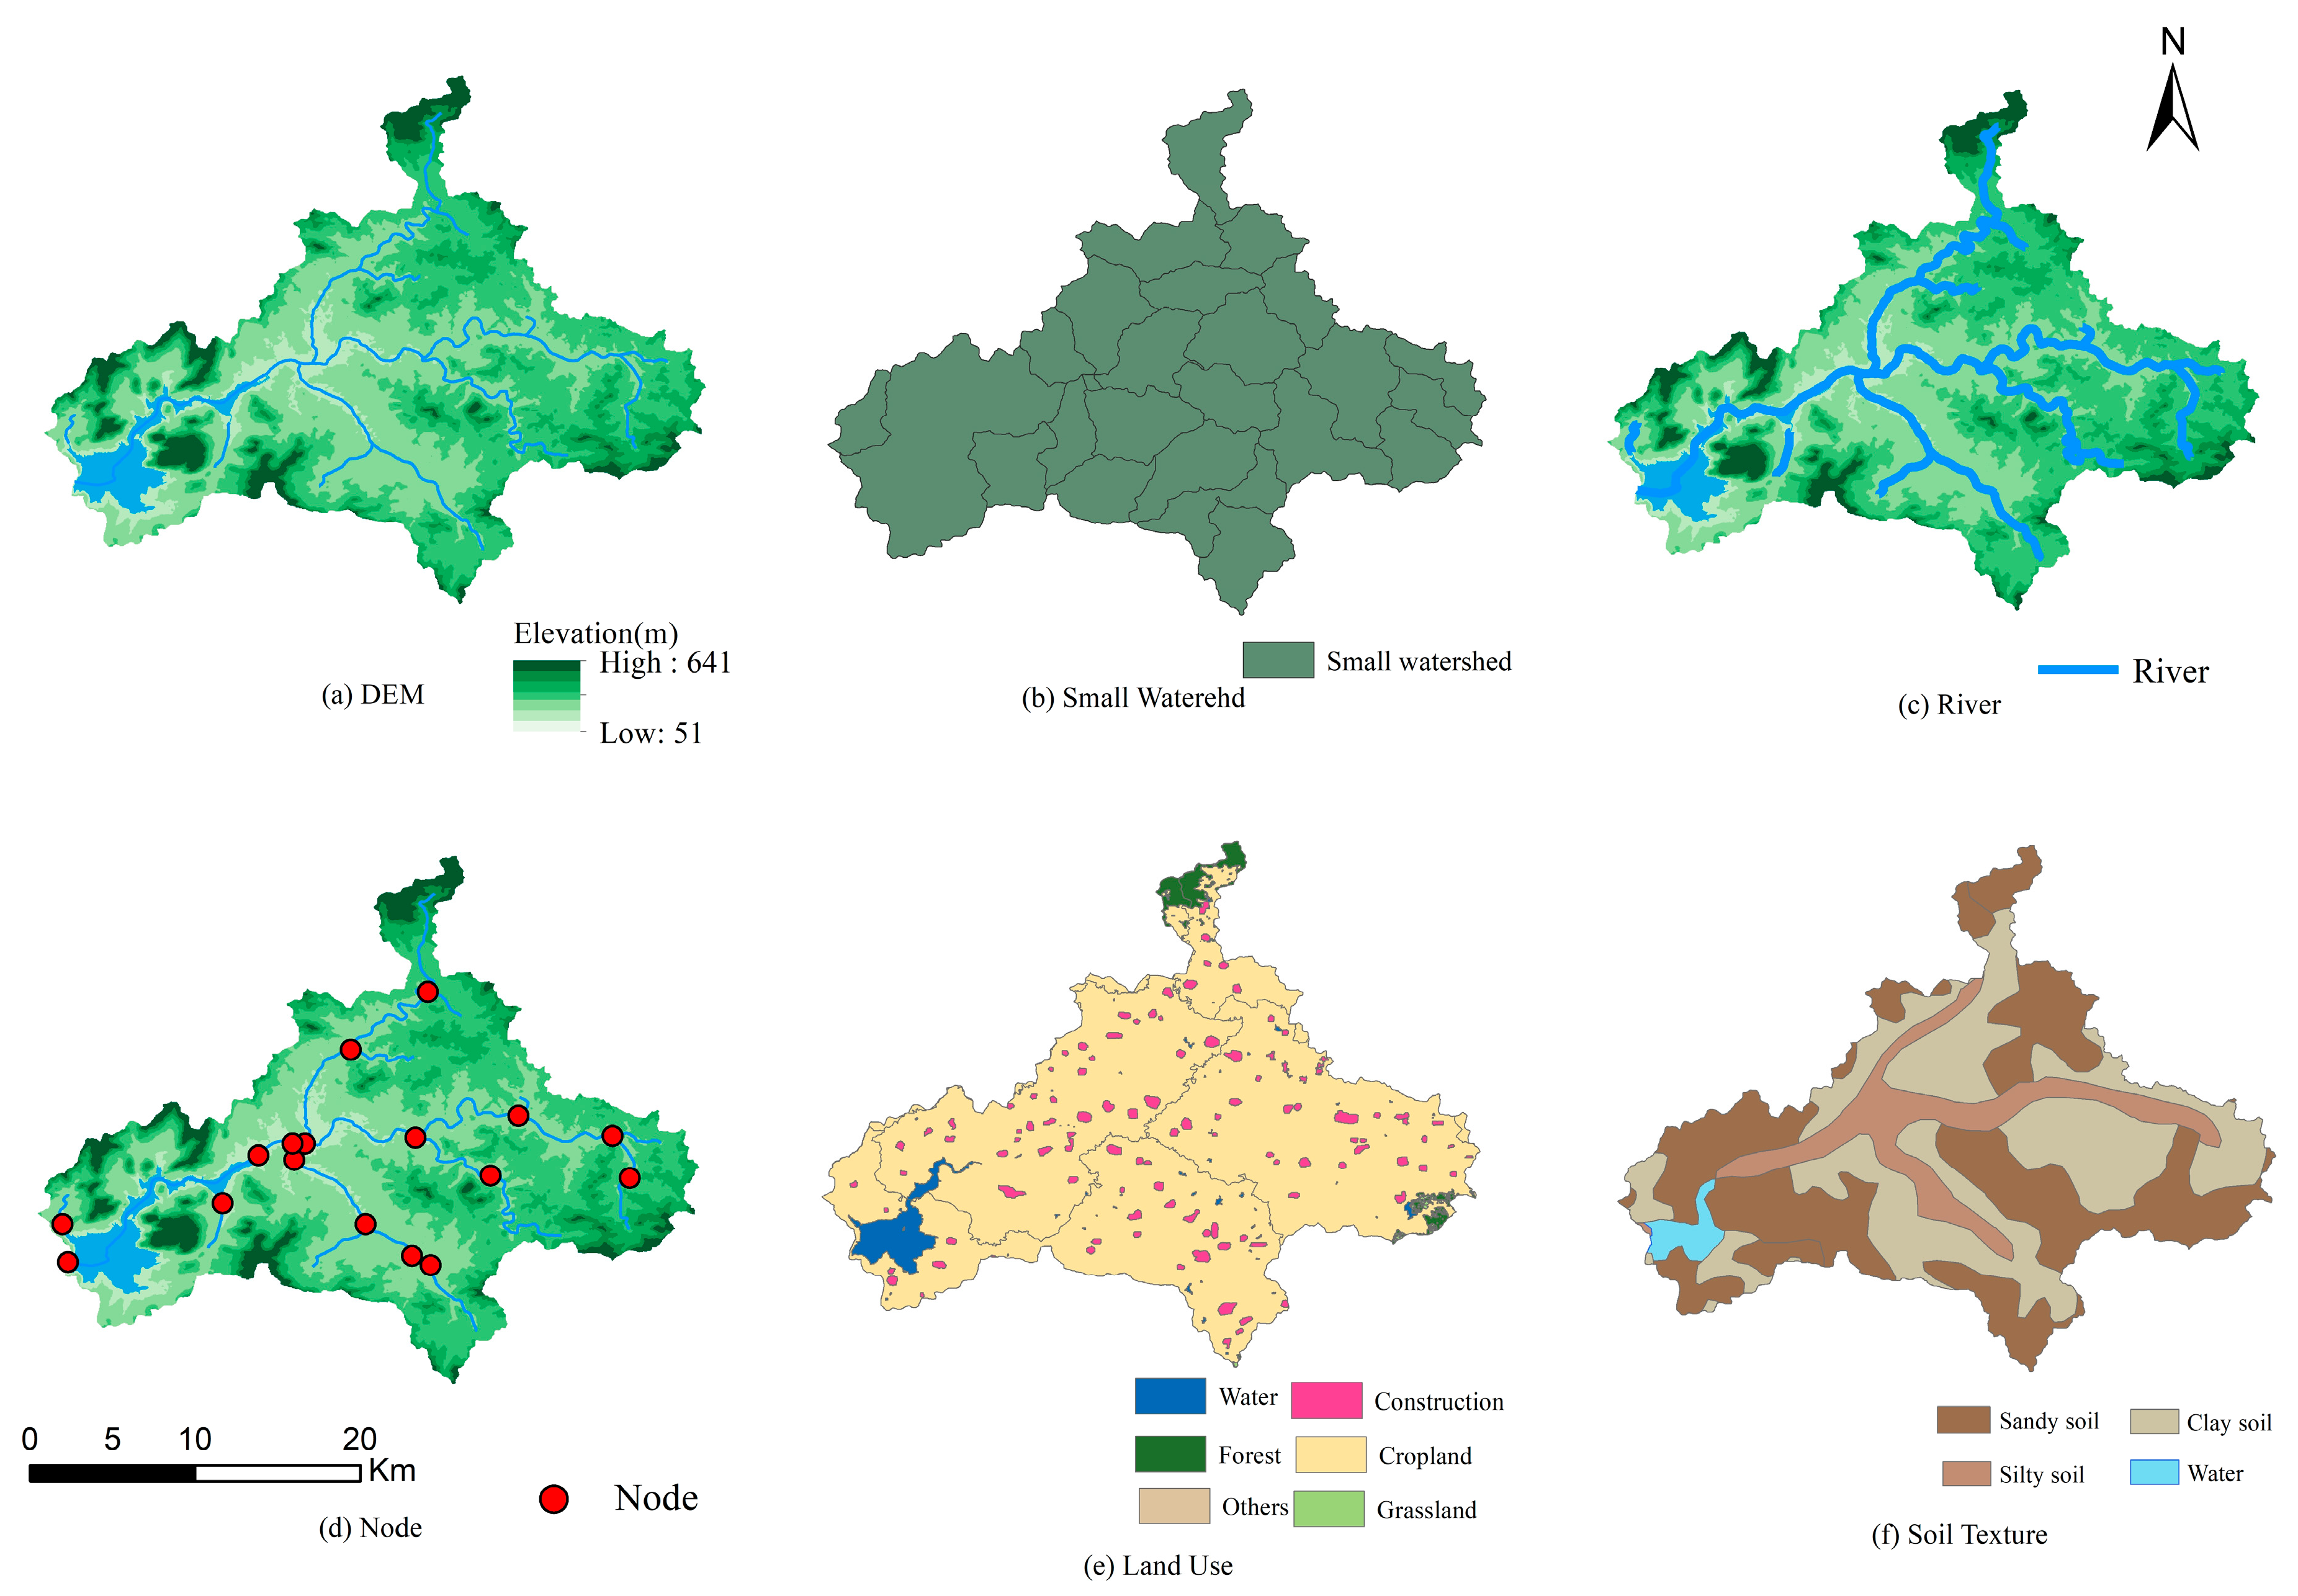
The geographical data include DEM, small watershed, river, soil texture, land use, and node. The sources and attributes of the geographical data are shown in
Table 1 and
Figure 2. These geographical data are sourced from the Database for Mountain Torrent Disaster Investigation and Assessment of China Institute of Water Resources and Hydropower Research and will be used as input for constructing the Spatio-Temporal Variable Source Mixed Model.
The main hydrological data used in this study include rainfall data from precipitation stations within the study area, as well as inflow data from Doushan Reservoir located at the outlet of the watershed (
Table 2), all of which are sourced from Annual Hydrological Report. Their specific location distribution is shown in
Figure 1. These hydrological data will serve as input for constructing the Spatio-Temporal Variable Source Mixed Model and will also be used to filter characteristic values for flood classification.
2.3. Data Processing
The precipitation and discharge data were interpolated on an hourly basis to form a time series. A total of 30 historical flood events were selected, serving as input data for parameter calibration of the Spatio-Temporal Variable Source Mixed Model.
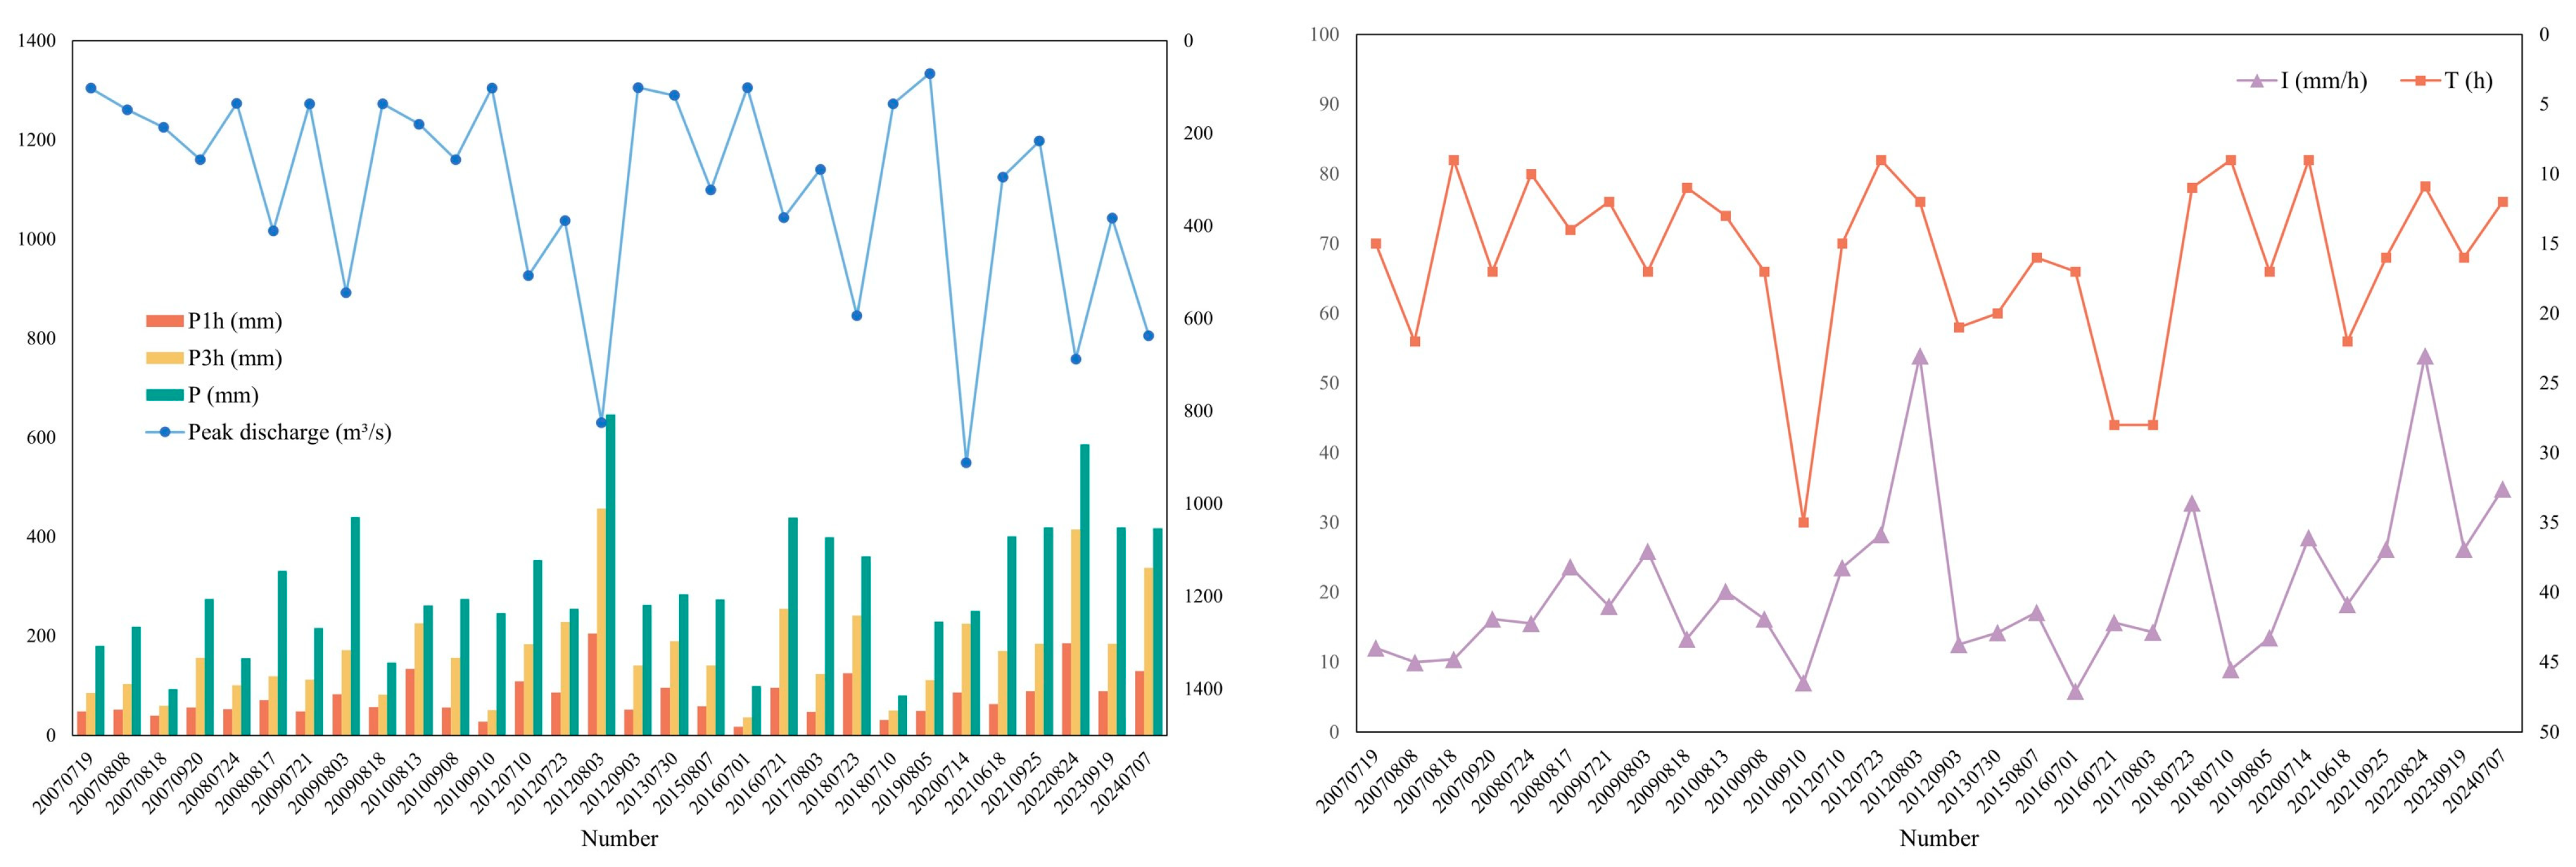
For classification, this study employs the following principles in selecting characteristic indicators for flood classification: (1) Select characteristics that have a significant impact on the flooding process. (2) The values of these factors can be easily obtained before a flood occurs, which facilitates the judgment of the category of the upcoming flood and the classification forecast. Therefore, one-hour maximum precipitation (P
1h), 3-hour maximum precipitation (P
3h), total precipitation (P), rainfall duration (T), and mean rain intensity (I) of 30 floods are statistically analyzed as characteristic indicators for flood classification based on the precipitation time series. The characteristic indicators and peak discharge of the 30 floods are shown in
Figure 3.
Separately, to construct the Random Forest flood classification model, considering that the dataset only comprises 30 historical flood events, a 5% random perturbation was applied as a data augmentation strategy, aiming to expand the effective sample size and enhance the model’s generalization capability. The final dataset contains 120 samples, with 84 samples used as the training set and 36 samples used as the validation set.
3. Methodology
3.1. Research Framework
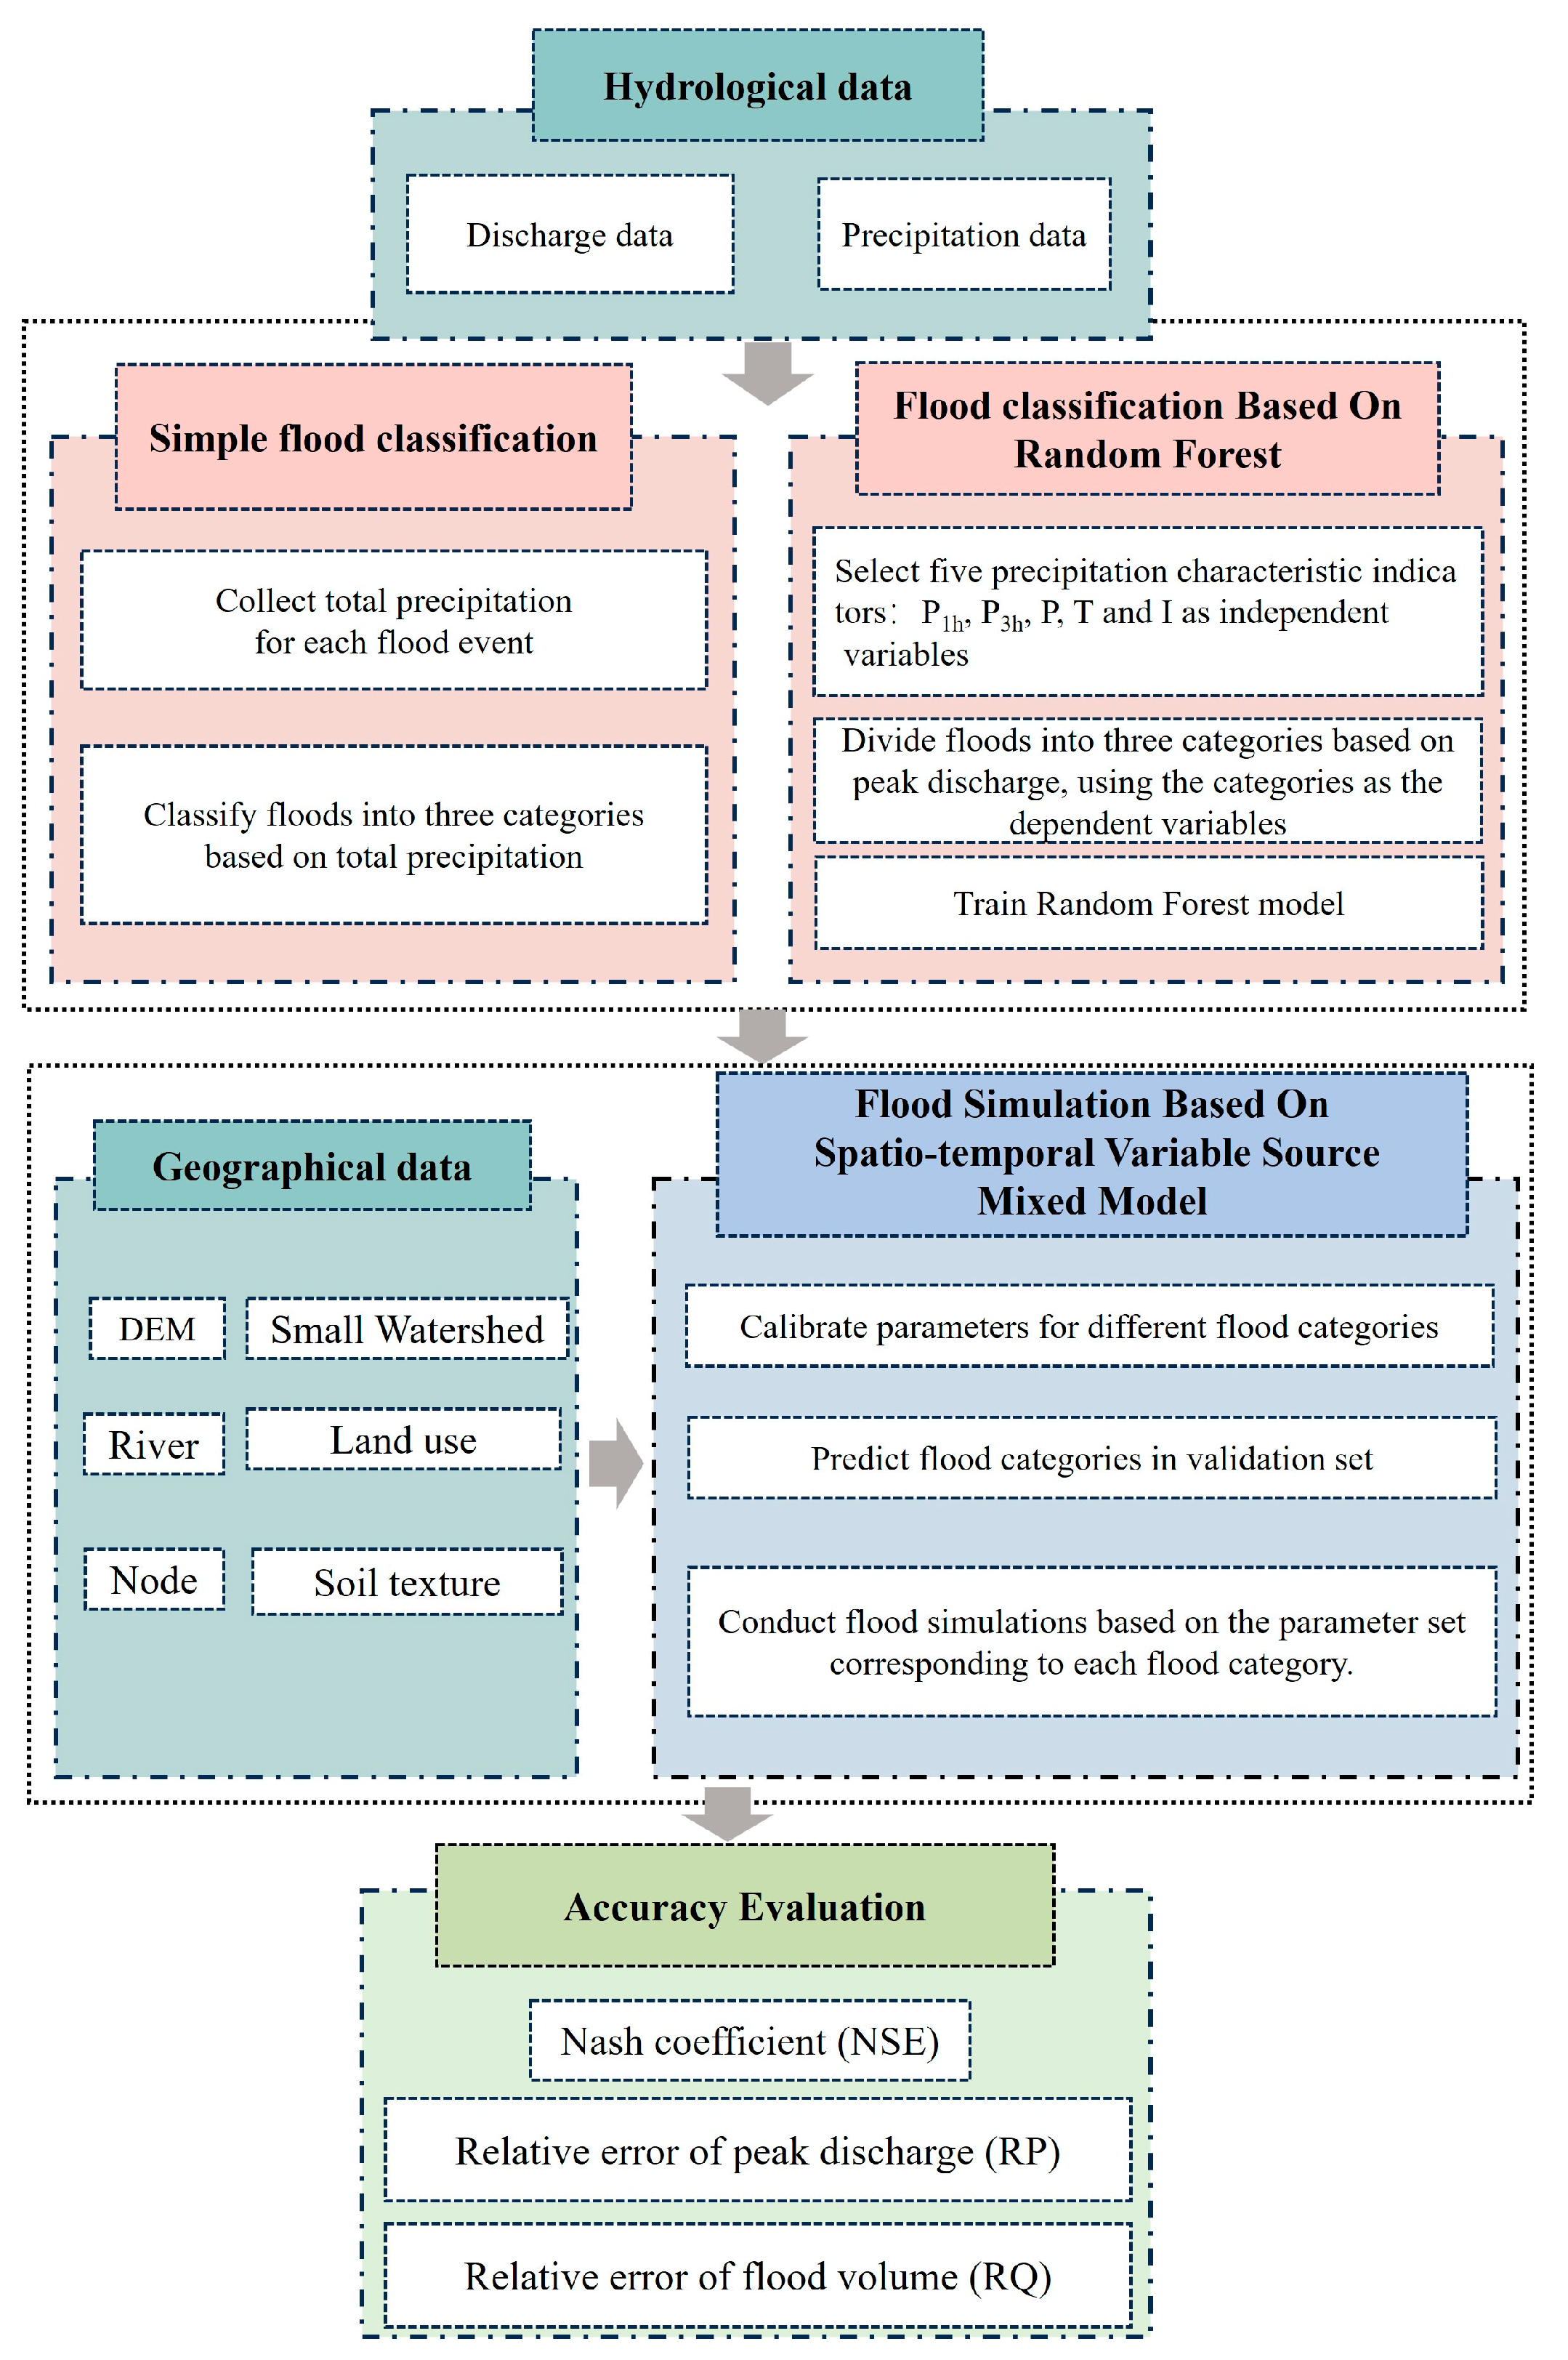
In this study, historical floods were initially classified into three categories based on peak discharge. Random Forest was employed to predict flood categories using five characteristic indicators: P
1h, P
3h, P, T, and I. This study also adopted a simpler classification method, dividing historical floods into three categories solely based on total precipitation, in order to verify whether the method proposed in this study using Random Forest to classify floods based on multiple rainfall characteristics could provide more accurate and comprehensive flood classification results, thereby enhancing the precision of flood simulation. Subsequently, parameter calibration was conducted separately for each flood category using the Spatio-Temporal Variable Source Mixed Model, yielding three sets of parameters tailored to different flood categories. Furthermore, the flood categories in the validation set were predicted, and different sets of hydrological model parameters were selected for flood simulation based on the predicted category. Finally, the accuracy of the simulation results was evaluated, and a comparison of the results of the two methods was made to ascertain whether the flood classification method based on Random Forest could be improved to enhance flood simulation accuracy. The framework is shown in
Figure 4.
3.2. Random Forest
Machine learning enables computers to automatically extract useful patterns and information by analyzing large amounts of data, thereby optimizing their decision-making processes [
24]. Through collecting and analyzing vast amounts of multi-source data such as meteorological, hydrological, and topographical information, machine learning is capable of identifying the crucial factors and patterns that lead to flooding, thereby enhancing the accuracy and reliability of flood simulation [
25,
26,
27].
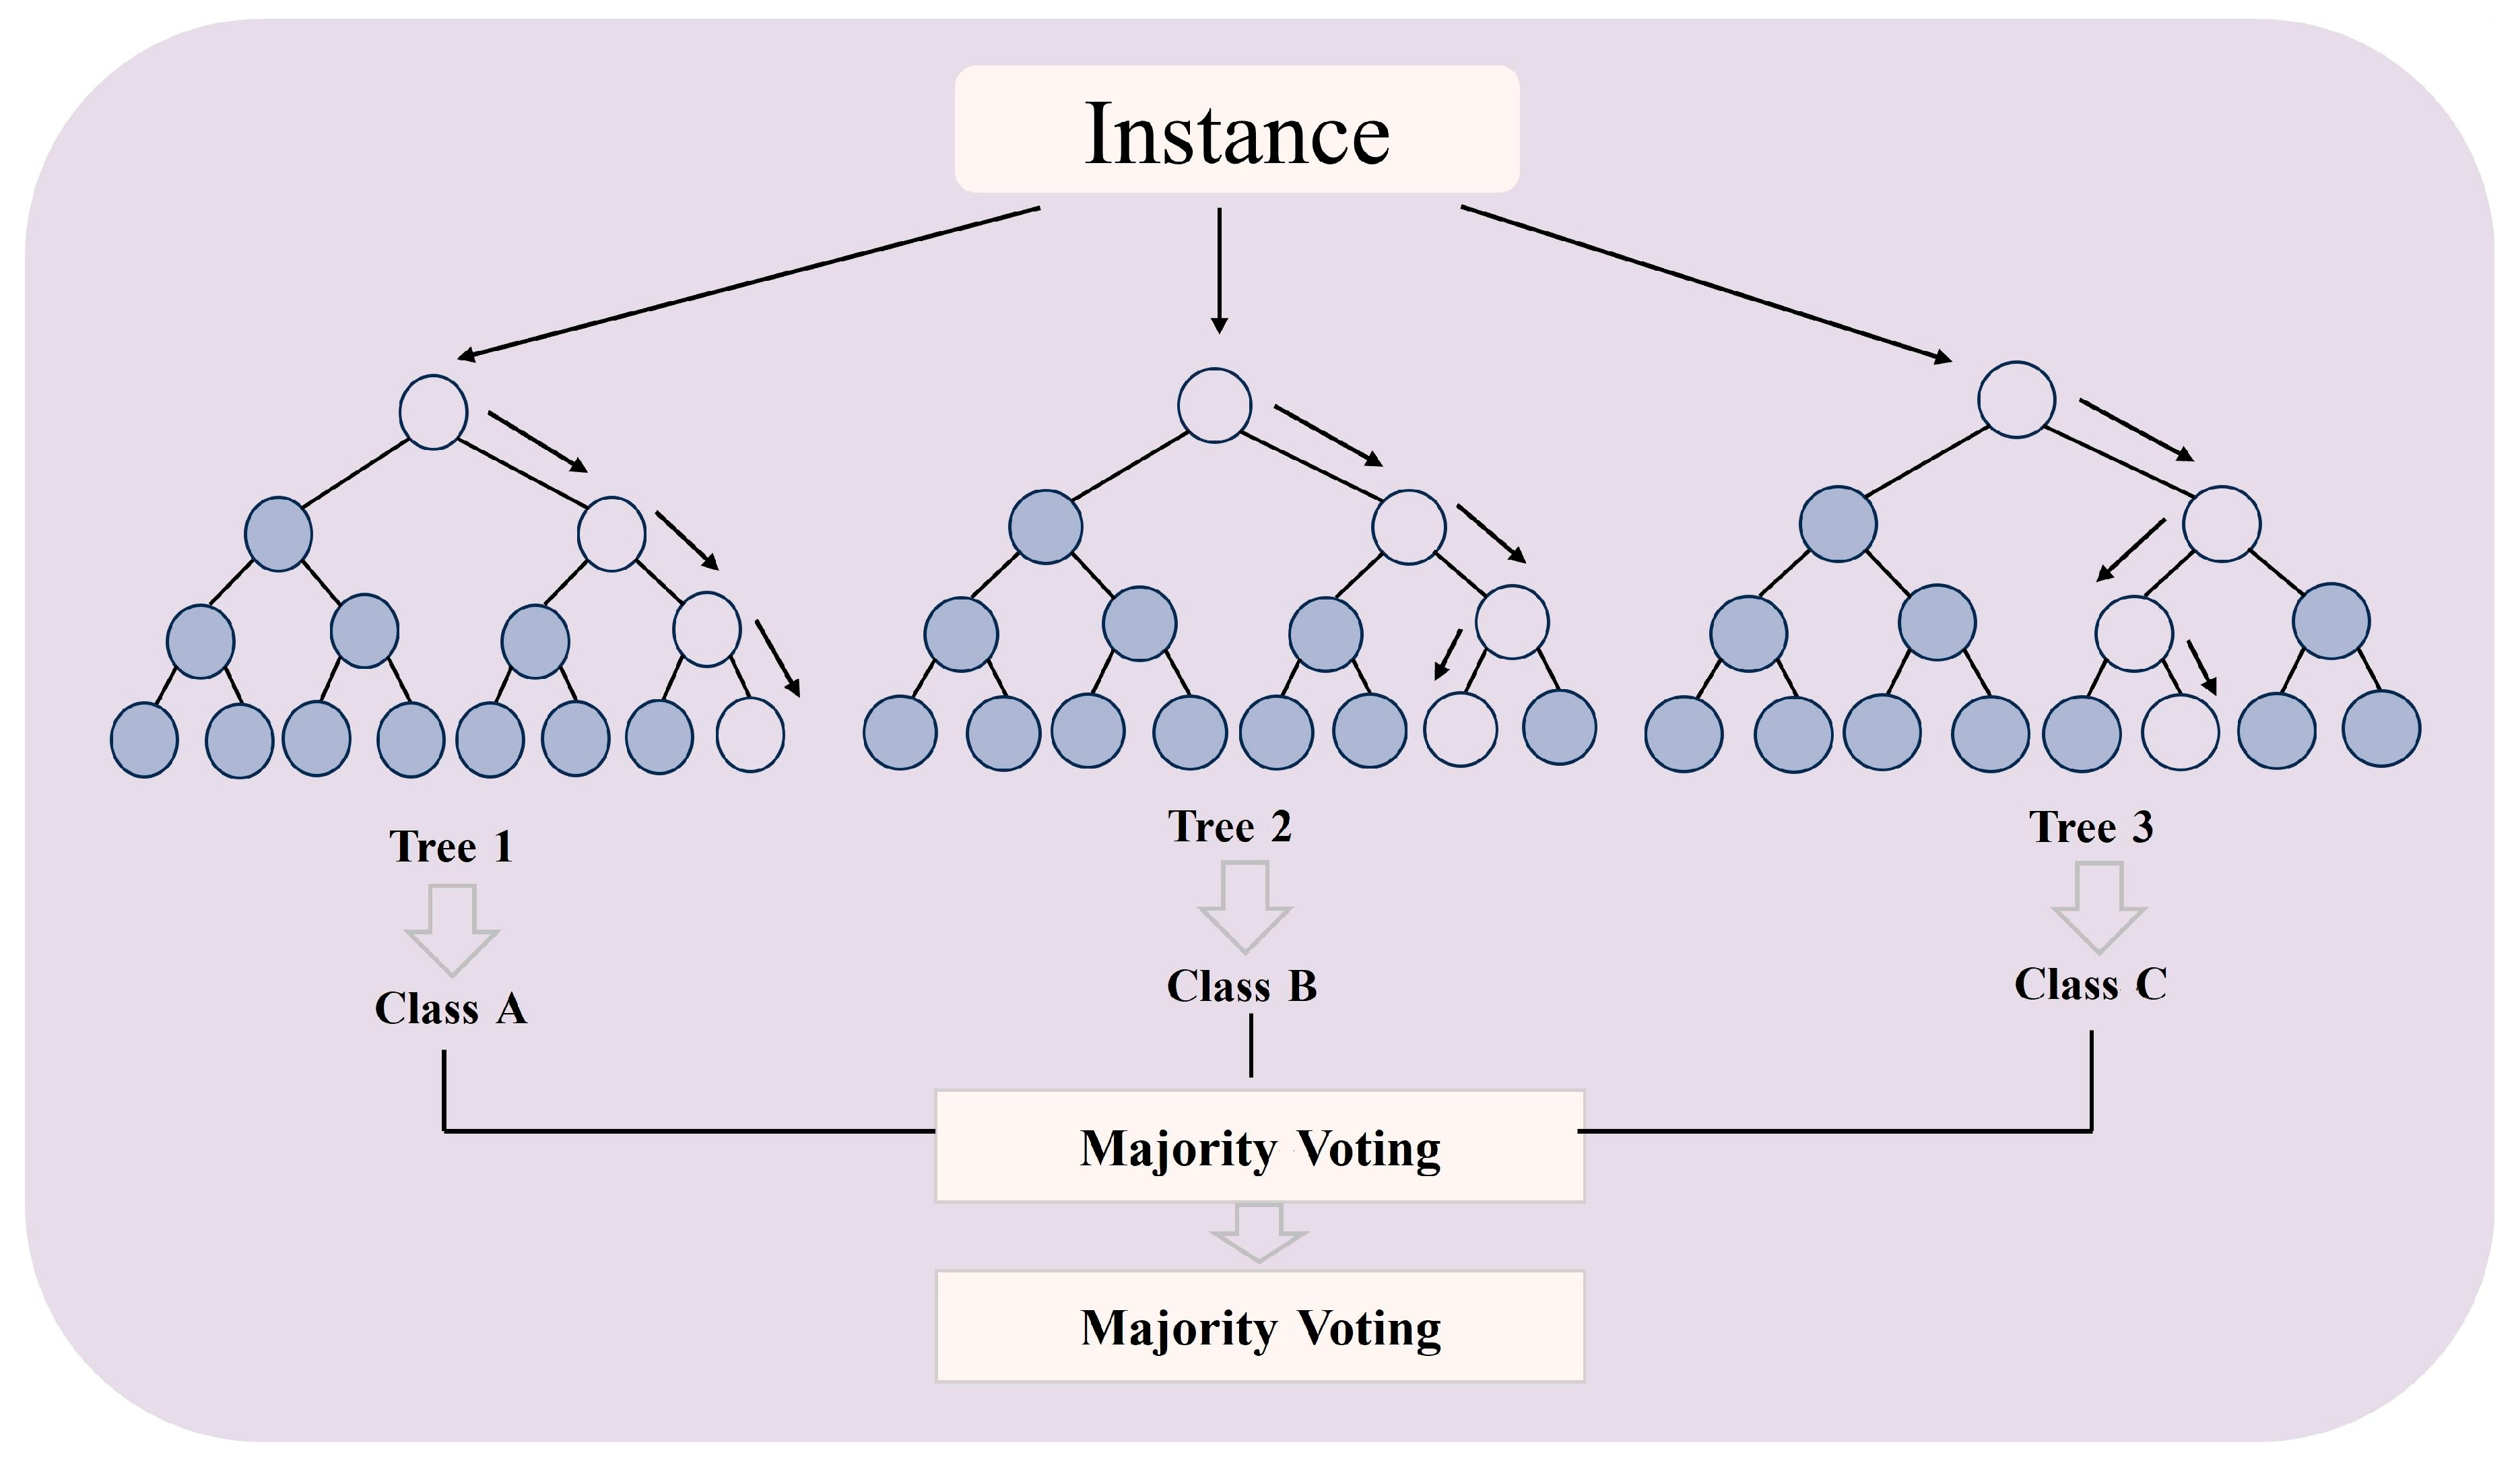
In this study, the Random Forest model (RF) is selected. The RF model, which was systematically proposed by Breiman [
28], is an ensemble learning model that constructs multiple decision trees simultaneously and aggregates their prediction outcomes to derive the final prediction result. Compared to other machine learning models, this model can reduce the potential overfitting problem of a single decision tree and effectively handle data without the need for complex dimensionality reduction, thereby preserving the integrity and richness of the data.
The final prediction result is obtained by either voting or averaging the prediction outcomes from all the decision trees. This approach aims to enhance prediction accuracy and improve the stability of the model for regression tasks. So, RF is an ensemble of decision trees that can be applied to classification and regression problems. The model is immune to overfitting, able to capture nonlinearity, and has a small number of model parameters resulting in easy implementation. The operating principle of RF is summarized in
Figure 5.
In this study, Random Forest was utilized for flood classification, where the independent variables comprise five rainfall characteristic indicators (P1h, P3h, P, T, and I), and the dependent variables are the flood categories classified based on peak discharge. During the construction of the Random Forest classification model, considering that the dataset only contains 30 historical flood events, a 5% random perturbation was applied to the independent variable as a data augmentation strategy, aiming to expand the effective sample size and enhance the model’s generalization ability. Additionally, L2 generalization was employed, with attention given to reducing the number and depth of decision trees for the purpose of simplifying the model and preventing overfitting issues. In this study, except for the number of decision trees, the depth of decision trees, and the mtry value which were manually optimized, the remaining hyperparameters adopted the default values. Among them, the number of decision trees is 24, the depth of the trees is 6, and the mtry value is 2. In addition, the software used is MATLAB R2023b.
3.3. Spatio-Temporal Variable Source Mixed Model
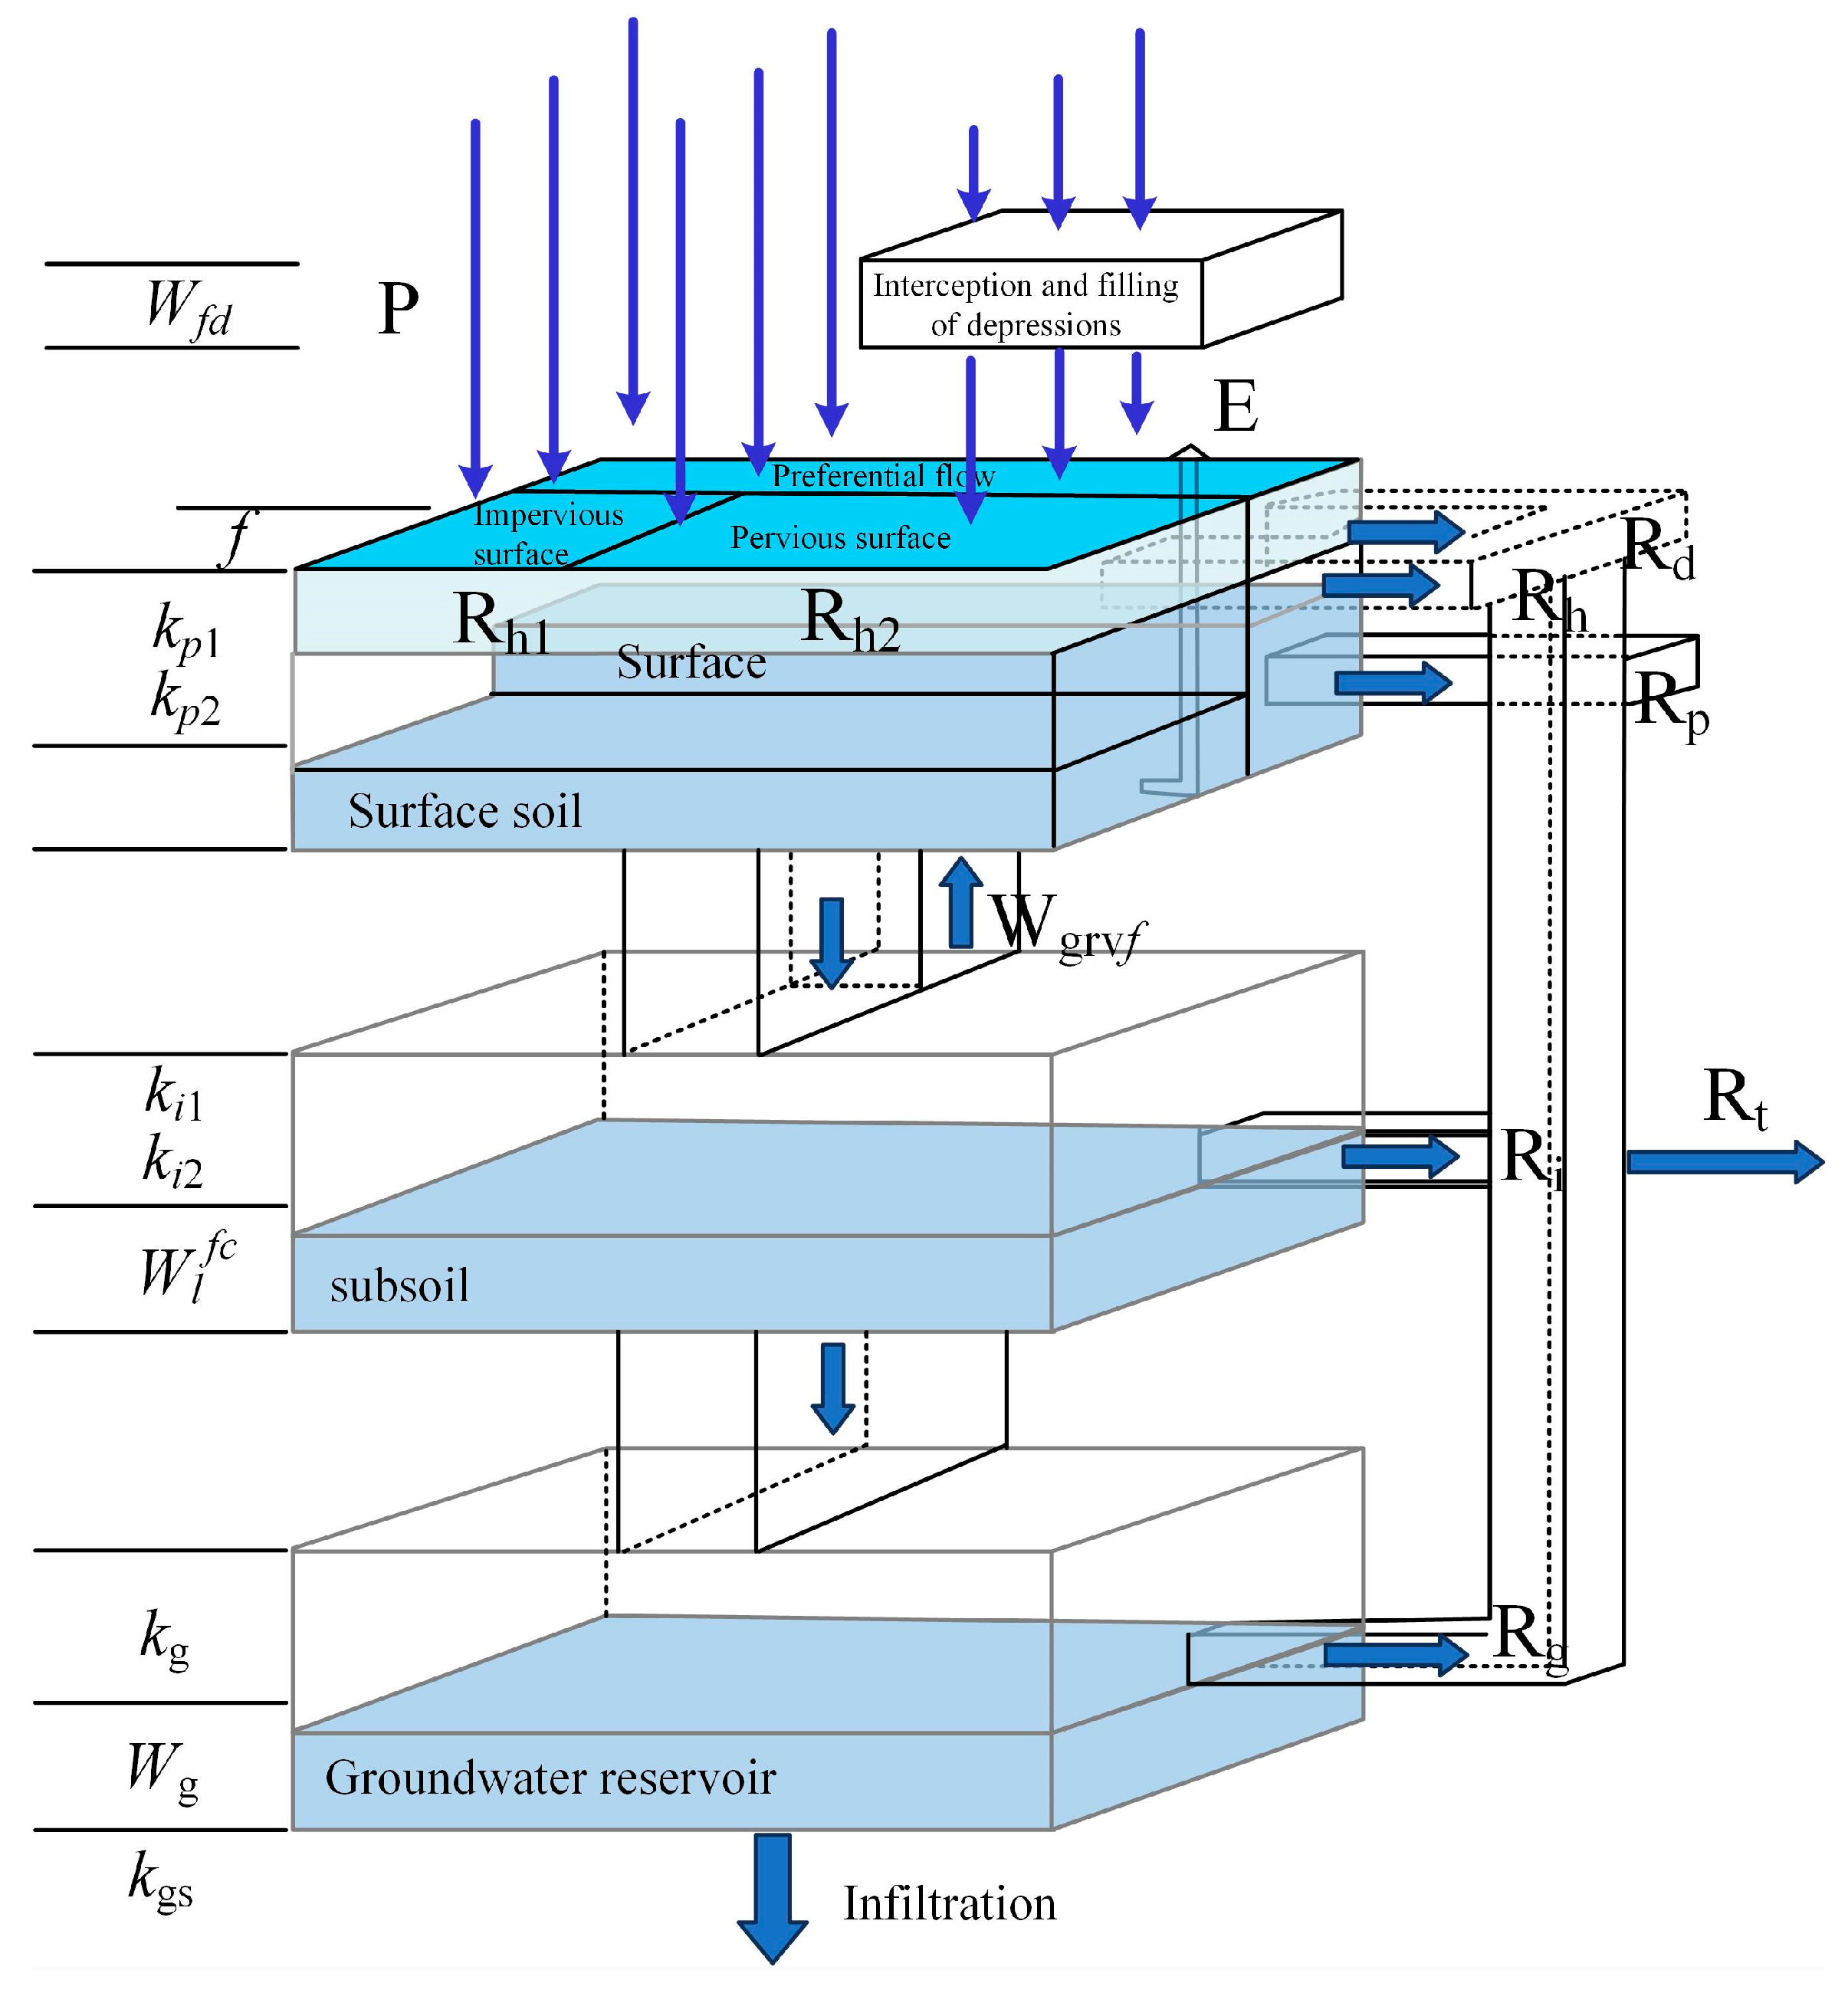
In many regions, the form of runoff includes both saturation–excess and infiltration–excess mode. For the same watershed, due to the difference in rainfall characteristics, the proportion of runoff components varies in different periods. In the same flood process, the proportion of runoff components also varies at different times. In order to better reveal the runoff generation mechanism and hydrological laws of small and medium-sized watersheds, the Spatio-Temporal Variable Source Mixed Model was proposed [
29]. The structure of the model is shown in
Figure 6.
The core ideas of the Spatio-Temporal Variable Source Mixed Model encompass two major components: spatio-temporal variable source and mixed runoff generation. The spatio-temporal variable source primarily focuses on the temporal and spatial variations of soil moisture content under the combined effects of external factors (such as rainfall infiltration and evaporation) and internal factors (like gravity and matrix suction). Through the simulation of each time period, the model is capable of capturing the subtle differences in these variations. Mixed runoff generation refers to the dynamic combination of excess/saturation runoff in both temporal and spatial dimensions, influenced by the changes in soil moisture content. By calculating the variations in water content and infiltration within each hydrological response unit at every time step, the model determines the area changes between excess runoff and saturation runoff. Additionally, the model considers the relationship between rainfall intensity and the infiltration and runoff generation capacities of different underlying surfaces, enabling the temporal and spatial transformation of excess/saturation runoff across individual geomorphic hydrological response units [
30].
- (i)
Infiltration–Excess Runoff
The infiltration–excess runoff component divides the watershed surface into impermeable and permeable areas. The net precipitation generated by rainfall through portions of the impervious area directly generates surface runoff.
where
is the net precipitation after filling,
is the proportion of the impervious area, and
is the surface runoff.
If the rainfall intensity is greater than the infiltration rate when the net rain falls on the pervious area portion, then infiltration–excess runoff occurs:
where
represents the infiltration capacity during the calculation period, and
is the infiltration–excess runoff.
The total infiltration–excess runoff is calculated as follows:
where
is the total infiltration–excess runoff.
- (ii)
Saturation–Excess Runoff
The relationship between the water content of three layers of soil and their depths is as follows:
where
is the maximum water content of upper soil,
is the maximum water content of priority flow aquifers,
is the maximum soil moisture content,
is the upper-soil field water-holding capacity,
is the field water-holding capacity of priority flow aquifers,
is the maximum soil water content,
is the initial water content of upper soil,
is the initial soil water content of priority flow aquifers,
is the initial soil moisture content,
is the percentage of the priority stream area, and
is the saturated moisture content.
After infiltration–excess runoff, the actual infiltration in the upper soil layer is calculated as follows:
Therefore, the soil water content of the preferential flow aquifer is calculated as follows:
The first full runoff that appears in the preferential flow aquifer is calculated as follows:
After the infiltration of surface water, the water content of the surface soil is calculated as follows:
The water content of the entire soil layer is calculated as follows:
The water content of the lower soil layer is calculated as follows:
The water infiltrating into the tension aquifer consists of two parts, one part is in the tension aquifer (
), and the other part infiltrates into the lower gravitational aquifer and groundwater aquifer (
).
The amount of water infiltrating from the tension aquifer into the groundwater aquifer is (
) calculated as follows:
where
represents the leakage coefficient of soil to groundwater.
The water content of the gravitational aquifer is calculated as follows:
The water volume replenishing the gravitational aquifer from the tension aquifer is calculated as follows:
The discharge flow of the gravitational aquifer is calculated as follows:
Water inflow into the gravitational aquifer is calculated as follows:
The outflow from the gravitational aquifer will flow upwards into the preferential flow aquifer. If the preferential flow aquifer is saturated, it will generate saturation–excess runoff:
At this time, the water discharge from the gravitational aquifer is calculated as follows:
The total saturation–excess runoff is calculated as follows:
3.4. Accuracy Evaluation Methods
According to the Specifications for Hydrological Information and Forecasting in China, the Nash coefficient, relative error of peak discharge, and relative error of flood volume were used to evaluate the optimal values of periodic parameters and the accuracy of the classified flood prediction.
The Nash coefficient is generally used to verify the quality of hydrological model simulation results, which represents the fitting degree between the simulated flow value and the measured flow value. The Nash coefficient can be expressed as follows:
where
is the measured value of runoff,
is the simulated value of runoff,
is the average value of the measured runoff, and
is the sequence length.
The relative error of peak discharge is expressed as follows:
where
is the measured value of runoff and
is the simulated value of runoff.
The optimal value is 0. The greater the absolute value of , the greater the simulation error of the model.
The relative error of flood volume is expressed as follows:
where
is the measured value of runoff and
is the simulated value of runoff.
4. Results
4.1. Flood Classification
In practical applications, peak discharge is the primary focus because it directly reflects the intensity and scale of floods. There are significant differences in peak discharge among floods of different magnitudes. Furthermore, according to the Specifications for Hydrological Information and Forecasting, peak discharge is also used as an important criterion for classifying flood levels. Therefore, this study classified historical floods in the study area into three categories (i, ii, and iii) based on peak discharge. The peak discharge ranges for the three flood categories (i, ii, and iii) are set as follows: greater than 400 m3/s for Category i, between 200 and 400 m3/s for Category ii, and less than 200 m3/s for Category iii. The classification criteria were established on the foundation of comprehensive analysis of historical flood data pertaining to the Xunhe watershed, coupled with practical experience gained from flood control operations in this area. The categories were used as the dependent variable for the Random Forest classification model. Five characteristic indicators (P1h, P3h, P, T, and I) were selected as independent variables to predict flood categories. In the dataset, there are 28 floods of Category i, 45 floods of Category ii, and 47 floods of Category iii.
To validate the rationality of the classification, statistical analysis of the flood characteristics of the three flood categories was also conducted. The characteristics of the different categories of floods are presented in
Table 3. It is evident from the table that there are significant differences in the five characteristic indices among the three flood categories, which to a certain extent indicates that the classification of floods based on these characteristic indicators is reasonable. Furthermore, as can be seen in
Table 3, in terms of precipitation, whether it is P
1h, P
3h, or P, there is a clear increase in precipitation as the flood category increases. It can also be inferred from the table that short-duration and intense rainfall can lead to higher peak flow discharges and consequently higher flood categories in Xunhe watershed.
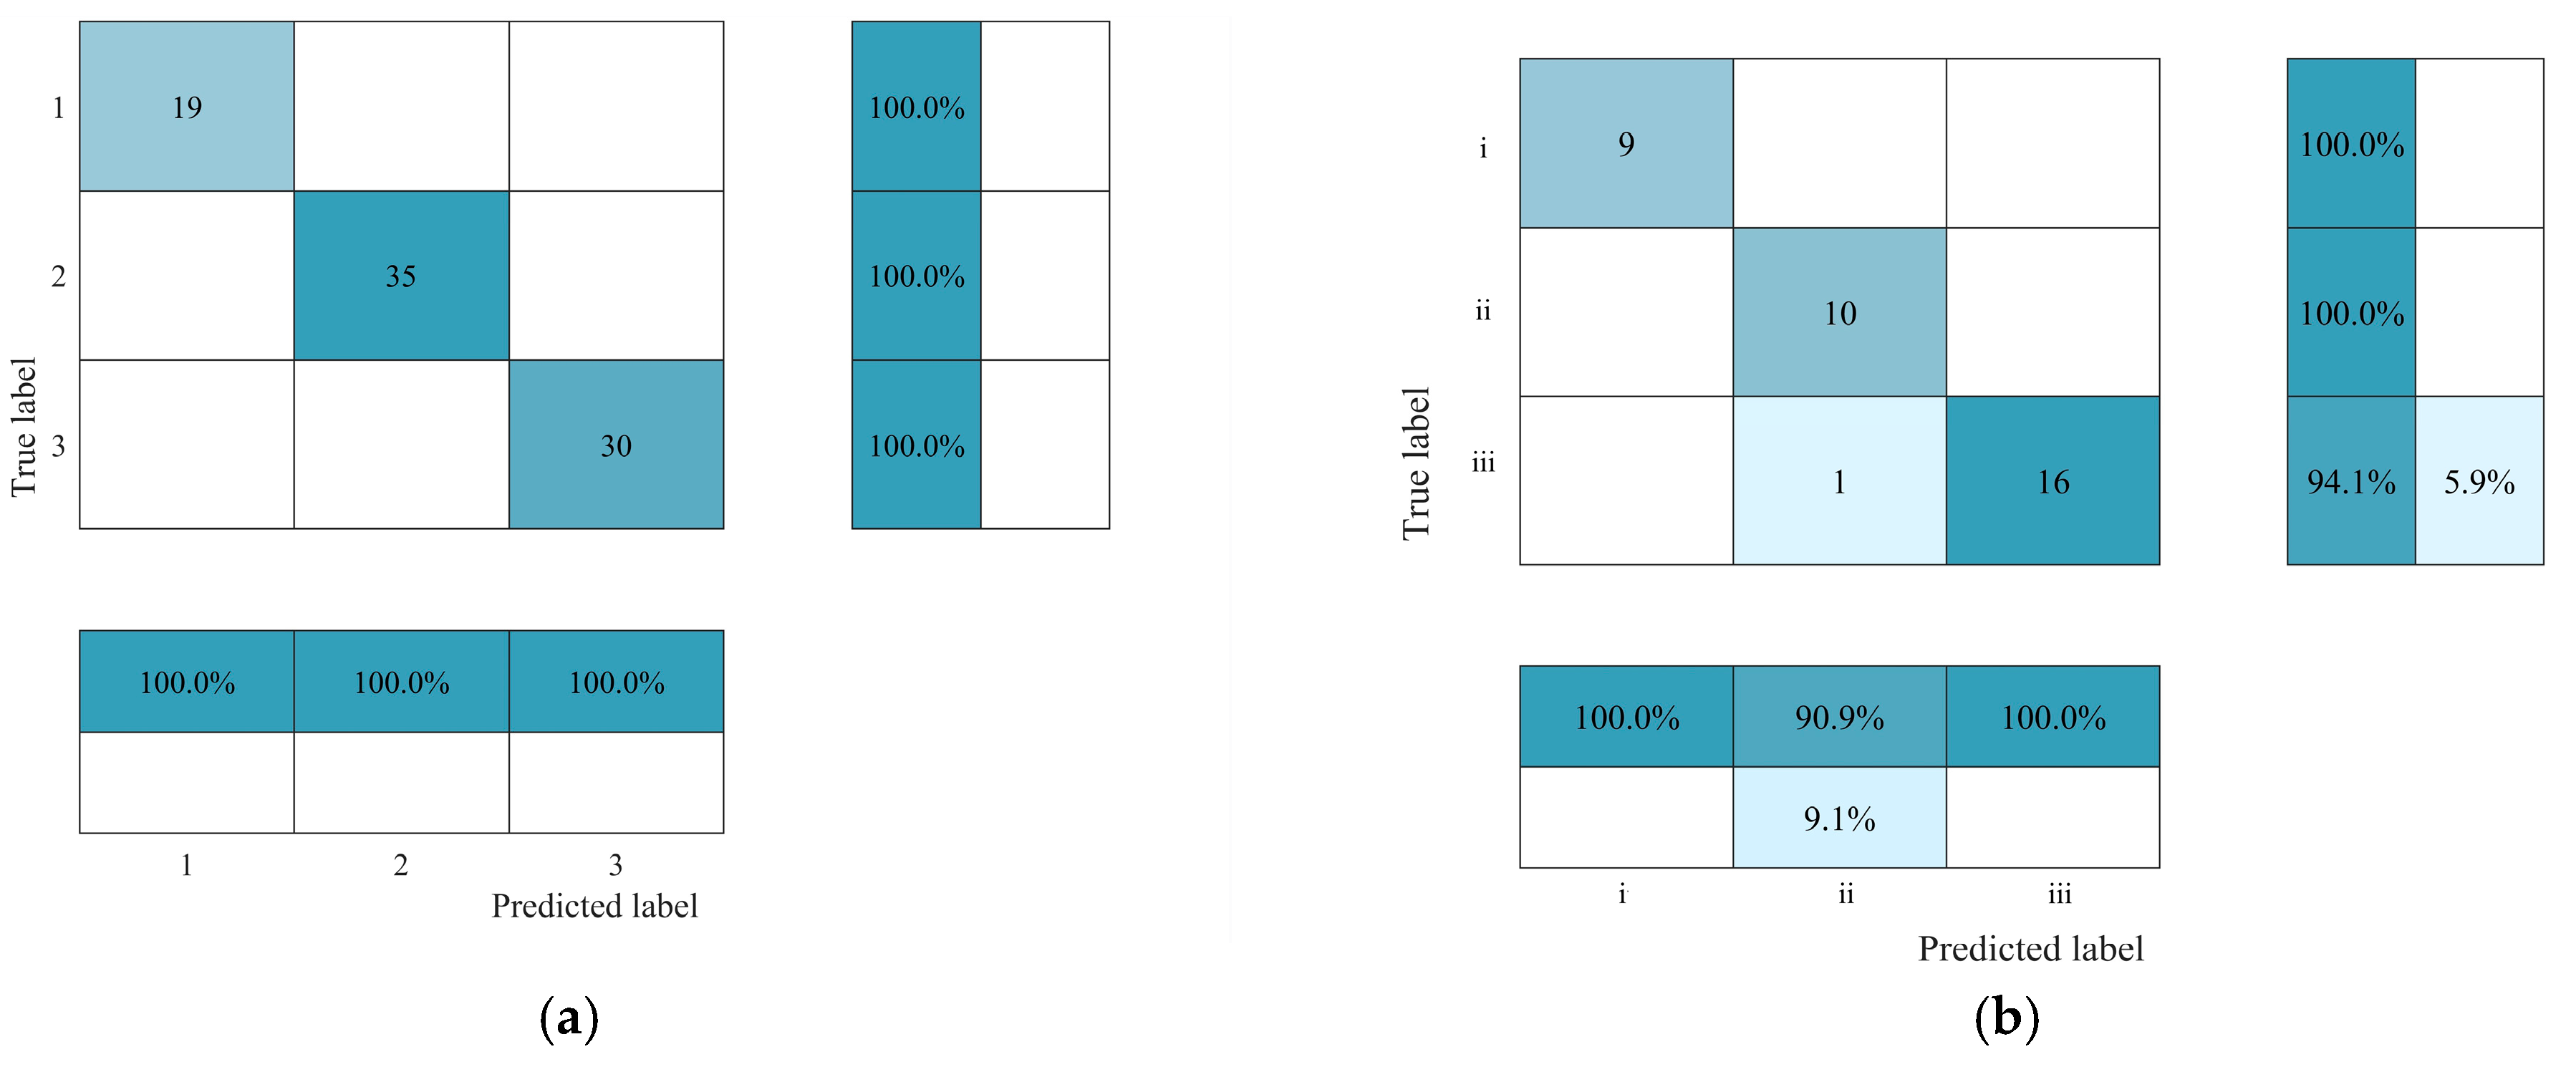
The Random Forest classification model was used to train and validate various historical flood data, with 84 samples selected as the training set and 36 samples as the validation set. An important tool for assessing model performance is the confusion matrix, which aids in understanding classification accuracy and detecting overfitting issues.
Figure 7 displays the confusion matrix for the Random Forest flood classification model, showcasing results from both the training set and the validation set.
The results indicate that the overall prediction accuracy in the training set is 100%, with all three flood categories being accurately predicted based on rainfall characteristic factors. In the test set, the overall prediction accuracy is 97.2%, where all floods in Categories i and ii are accurately predicted, while one flood in Category iii was incorrectly predicted as Category ii. Additionally, the out-of-bag error rate is 5.95%.
To further validate the effectiveness of this method, this study also adopted a flood classification method based on the total precipitation of historical flood events within the watershed and compared the performance of the two methods in a hydrological simulation. Based on the historical statistical data from the watershed management department, it was found that the average total rainfall for small floods is below 230 mm; for moderate floods, it ranges from 230 to 360 mm; and for large floods, it exceeds 360 mm. Therefore, using total precipitation as the classification criterion for potential flood magnitudes, floods are categorized into three classes. The total precipitation ranges for the three flood categories (i, ii, and iii) were set as follows: greater than 360 mm for Category i, between 230 and 360 mm for Category ii, and less than 230 mm for Category iii.
To further verify whether the flood classification methods can improve the accuracy of flood simulation, six typical flood events of varying magnitudes within the watershed were selected and classified using the two aforementioned flood classification methods for subsequent flood simulation. The flood classification results of the six floods based on the two methods are shown in
Table 4.
4.2. Flood Simulation
With the aim of further comparing the accuracy of flood simulation based on flood classification methods, the Spatio-Temporal Variable Source Mixed Model was utilized to simulate different types of floods.
Based on the two classification results, parameter calibration using the SCE-UA optimization algorithm [
31] was conducted for the three categories of floods in the calibration dataset utilizing the Spatio-Temporal Variable Source Mixed Model, which resulted in sets of model parameters suitable for different categories.
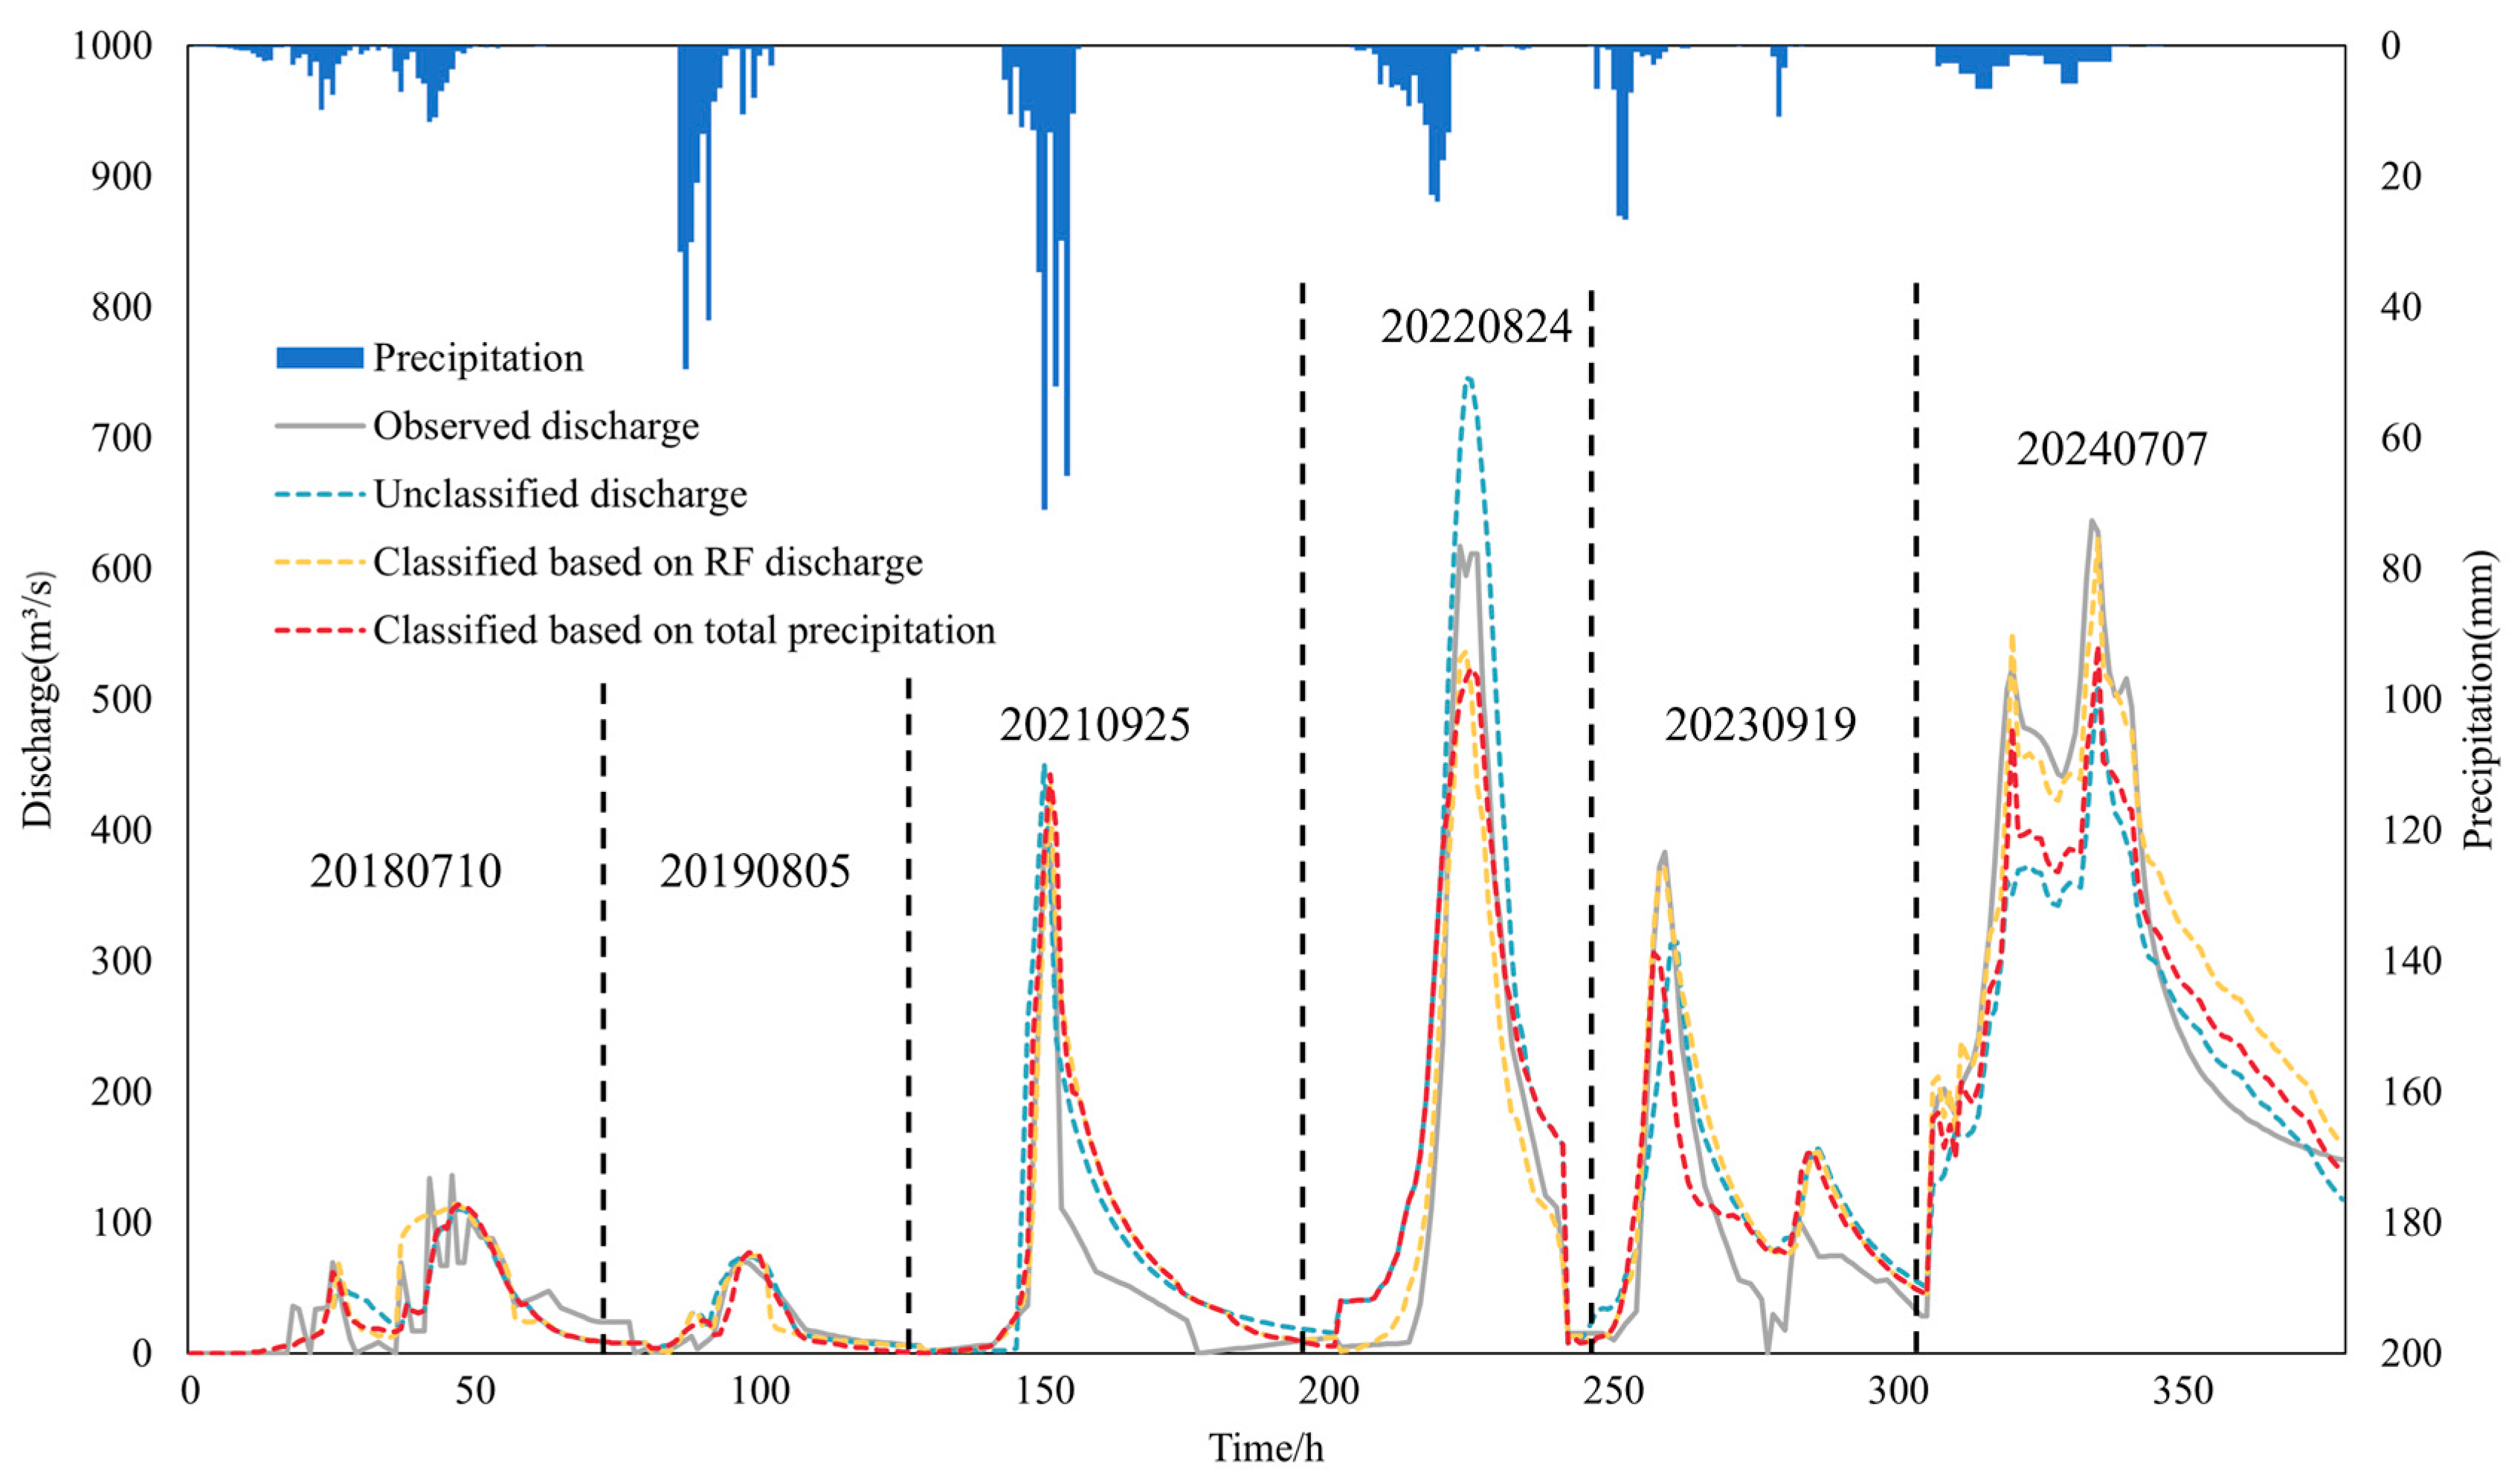
Subsequently, the Spatio-Temporal Variable Source Mixed Model was used to simulate six floods in Xunhe watershed, with a total precipitation duration of 375 h for these floods. Statistical analysis was conducted on the results after calibration. The simulation results are shown in
Figure 8. The statistical results of each evaluation indicator are shown in
Table 5.
Based on the statistical results, after utilizing the RF model to classify the flood events according to different rainfall characteristics, among the six flood events in the validation set, the peak flood errors of five events decreased by 3% to 11.24% compared to before classification, with an average reduction of 6.16%. The relative error of flood volume of five events decreased by 1.46% to 9.44% compared to before classification, with an average reduction of 7.09%. Furthermore, the NSE of five flood events improved by 0.06 to 0.14, with an average increase of 0.086. When flood classification was based solely on total precipitation, among the six flood events in the validation set, the peak flood errors of four events decreased by 2.0% to 7.56% compared to before classification, with an average reduction of 2.10%. The relative error of flood volume of five events decreased by 1.84% to 7.83% compared to before classification, with an average reduction of 3.61%. Additionally, the NSE of five flood events improved by 0.04 to 0.1, with an average increase of 0.049.
5. Discussion
To optimize the parameters of hydrological models for different types of floods and enhance the accuracy of flood simulation, this study proposes a flood classification method employing Random Forest, which is compared with a simple flood classification approach. Based on these two classification methods, multiple sets of parameters for the Spatio-Temporal Variable Source Mixed Model were established for different flood categories, thereby enabling the forecasting of six typical flood events of varying scales within the watershed.
The results indicate that the prediction of flood categories using the Random Forest classification method based on five rainfall characteristics exhibits satisfactory accuracy. In the dataset, only one flood event was misclassified as another category, resulting in an overall high precision of the prediction results. This suggests that the Random Forest method can be utilized to predict flood categories, with peak discharge serving as the primary characteristic value, based on various precipitation characteristics. Although the simulation accuracy has improved, there are still some flood events where the simulations deviate significantly from the actual observations. One potential reason for this is the complexity and variability of flood events. Even though our model has been trained and validated, it may not capture all of the nuances of individual flood events, particularly those driven by unusual or extreme weather conditions. Additionally, there may be limitations in the input data used for the simulations. For instance, inaccuracies in precipitation measurements can affect the model’s ability to accurately predict flood behavior.
Additionally, the simulation results of six typical flood events utilizing parameter sets from the Spatio-Temporal Variable Source Mixed Model tailored to different flood categories show that the accuracy of flood simulation is significantly enhanced after flood classification. Further comparing the two classification methods, the simulation effect of peak discharge and flood volume based on the RF classification method is significantly better than that of the simple classification method. As for the NSE, except for two flood events, the RF classification method still outperforms the simple classification method. This may be attributed to the fact that when utilizing the RF model for flood classification, five rainfall characteristic indicators are comprehensively considered, which aids in capturing the peak discharge under different rainfall conditions, thereby more extensively reflecting the characteristics of rainfall and their impact on flood formation, and enhancing the accuracy of classification. The RF model also minimizes the influence of human intervention and can reduce the risk of overfitting associated with individual decision trees, improving the objectivity of classification.
According to the flood control principles for Doushan Reservoir outlined in the flood prevention plan approved by the Shandong Provincial Water Resources Department, the reservoir’s flood regulation is conducted with controlled discharge based on the flood control high-water level for a 20-year return period, and the safe discharge capacity of the downstream river channel is set at 1000 m3/s, from which the flood control high-water level is deduced. When the inflow rate is less than 1000 m3/s, the outflow rate is equal to the inflow rate. However, when the water level exceeds the flood control high-water level for a 20-year return period, controlled discharge ceases, and all spillway gates will open freely for unrestricted discharge to ensure the safety of the dam. Therefore, when making subsequent predictions for downstream stations, it is necessary to take into account the actual flood season conditions and incorporate the dispatch model. By strengthening the calculation and monitoring the outflow rate from Doushan Reservoir, we can use this outflow rate as critical input data for downstream models to more accurately simulate and predict changes in downstream water levels.
This study further validates the previous argument that conducting flood classification simulations can enhance the accuracy of flood simulations. Furthermore, this study emphasizes the pivotal role of rainfall characteristics in flood classification, serving as a complement to previous research. By conducting in-depth analyses of the impact of rainfall intensity, duration, and other features on flood characteristics, a more scientific and rational framework for flood classification has been established. This approach effectively mitigates numerous challenges encountered when relying on black-box models for classification, such as data quality issues, limitations in model assumptions, and the interference of uncertainty factors. It enables us to more accurately extract flood features with classificatory significance from complex and diverse historical flood data, providing a more solid data foundation for flood simulation. Moreover, based on flood classification, more appropriate hydrological model parameters that align with the characteristics of different flood types can be obtained. This reduces the errors associated with using a single set of parameters for an entire watershed and enhances the accuracy of flood simulation. In practical applications, the forecasted rainfall characteristics should be scrutinized, and the methodology introduced in this study may be employed to anticipate flood categories. Alongside these anticipations, suitable sets of hydrological model parameters can be identified for flood forecasting purposes. Subsequently, informed flood control strategies can be devised based on the forecasting outcomes.
Therefore, by initially classifying floods based on the Random Forest method and subsequently applying different sets of hydrological model parameters for flood simulation according to the classified flood categories, the accuracy and efficiency of flood simulation can be effectively improved. This method can be further applied in actual flood forecasting and warning systems, allowing for the implementation of different flood control plans tailored to different flood categories.
6. Conclusions
To enhance the simulation accuracy for different types of floods, this study takes Xunhe watershed as the study area and proposes a flood classification method based on Random Forest that predicts flood categories using rainfall characteristics. On this basis, the parameters of the Spatio-Temporal Variable Source Mixed Model tailored to different flood categories were utilized for forecasting typical flood events. The results indicate that the classification method can effectively utilize multiple rainfall characteristics for predicting flood categories. Furthermore, the accuracy of flood simulations is significantly improved based on this classification.
Admittedly, this study also has certain limitations. For instance, during the flood classification process, peak discharge is not only related to precipitation but also to factors such as the pre-event soil moisture content of the watershed. These factors were not taken into consideration in this study. Furthermore, due to limitations in data acquisition and processing, the sample size of this study is relatively limited, which may have affected the universality of the results. Additionally, since the data used in this study are all sourced from the Annual Hydrological Report, there may be measurement errors as well as errors arising from data interpolation. These uncertainties may affect the accuracy of the input data, leading to deviations in the classification and simulation results. Moreover, the actual situation involved human interventions such as reservoir regulation, which also had a certain impact on the runoff process in this study.
In upcoming endeavors, the research will be further advanced by delving deeper into flood classification methods and seeking out more effective characteristic factors and classification algorithms. Concurrently, the scope of this study will be broadened and the sample size will be expanded, thereby bolstering the reliability and applicability of the findings.


