Abstract
An accurate understanding of the spatiotemporal variations in wetland ecosystem health is beneficial for guiding sustainable management and achieving sustainable development goals. To overcome the limitations single indicator approaches, this study proposed a multi-dimensional evaluation system based on four aspects of wetland ecosystems: pattern, quality, service, and threats. Furthermore, based on the wetland distribution dataset and MODIS products, we constructed a comprehensive wetland ecosystem health index (WEHI) from 11 indicators and applied it to assess the variations in wetland ecosystem health in the western Songnen Plain from 2000 to 2020, suggesting wetland responses to climate change and human activities. Results revealed that wetland ecosystem health was affected by variability in both hydrothermal conditions and human threats. Across the region, wetlands were primarily classified as “fair” level (0.25 ≤ WEHI < 0.50) with 63% by area, while the “good” level (0.50 ≤ WEHI < 0.75) accounted for 37%. Although the WEHI increased from 0.44 in 2000 to 0.47 in 2020, the overall health status of wetlands still requires targeted improvements. This gradual recovery was largely attributed to a combination of reduced threats, warming temperatures, and increasing precipitation. Protected areas with larger WEHI played a critical role in maintaining ecosystem health. The evaluation system developed in this study offers a reference for the wetland health assessment at a broader scale. The findings in this study are expected to inform more effective management and conservation strategies of wetlands.
1. Introduction
Wetlands are vital components of the terrestrial ecosystem, and their sustainable management and conservation are indispensable in maintaining global ecosystem sustainability and achieving the United Nations Sustainable Development Goals (SDGs) [1]. Wetland ecosystems deliver a variety of ecosystem services and are closely linked to human well-being. However, their sensitivity also makes them highly vulnerable to disturbances from both climate change and human activities [2,3]. Consequently, wetland loss and degradation have triggered a series of environmental issues, such as more frequent floods and droughts, biodiversity loss, and increased carbon emissions [4]. As complex and sensitive ecosystems, healthy wetlands not only provide robust ecosystem services but also demonstrate a strong capacity for self-maintenance, preserving their structural integrity and functional quality. Assessments based on single or limited dimensional variables fall short of capturing the complex dynamics of ecosystem health and hinder effective conservation and sustainable utilization. Therefore, establishing a scientific and comprehensive evaluation system for wetland ecosystem health is a scientific foundation for formulating rational wetland protection strategies and informing management decisions.
Against the backdrop of climate change combined with human disturbances, wetland ecosystem health has become a key research focus worldwide [5,6,7]. Assessment approaches generally fall into two categories: the indicator species method and the indicator system method. The former infers wetland ecosystem functionality or health status from the presence and condition of specific biotic indicators, such as using waterbird species and populations to assess the health of coastal wetlands in South Florida [8,9], or using aquatic invertebrates to evaluate the wetland restoration effectiveness in Northeastern China [10]. While insightful for specific aspects, this method offers a limited perspective on overall ecosystem health [11]. In contrast, the indicator system method provides a more holistic view by integrating multiple indicators. The most widely applied framework is the Pressure-State-Response (PSR) model developed by the Organization for Economic Co-operation and Development (OECD), which structures indicators around three dimensions—pressure, state, and response [12,13,14]. Commonly used indicators span chemical, biological, and physical attributes (e.g., water quality, sediment chemical composition, species composition and diversity, ecosystem biomass, and stressors) and may include socioeconomic indicators (e.g., fishery investment returns, population density, and gross domestic product) [15,16,17]. Although valuable, many applications of this method rely on field collected data, which often constrain evaluations to specific watershed or landscape scales, limiting the ability to characterize broad-scale spatiotemporal variations in wetland ecosystem health.
With the continuous development of geospatial information technologies, remote sensing has offered a powerful solution to these scaling issues in ecosystem health assessment [18,19]. Through spectral information and other characteristics, remote sensing imagery can effectively characterize surface features across spatial and temporal scales, providing a unique vantage point to visualize the spatial heterogeneity, and maintain historical traceability. This has led to its widespread application in wetland ecosystem health evaluation. For example, the land cover dataset, the normalized difference vegetation index (NDVI), and the vegetation net primary productivity (NPP) have been leveraged for this purpose in diverse regions like China’s Liaohe River Delta [20], the Yangtze River Basin [21], and the Hongze Lake [22]. However, previous remote sensing-based analyses were deficient since relying on a single or a few indicators may fail to capture the multidimensional variations in ecosystem health—pattern, quality, function, and threats. For instance, constrained by spatial resolution or the inherent limitation of spectral indices, single indicator at the pixel scale may be insensitive to subtle changes. While some studies, such as one employing 11 indicators across China [5], have incorporated structural, functional, and resilience ecosystem metrics. The omission of human threat indicators can lead to assessment with high uncertainty. Similarly, common frameworks like the PSR model may not sufficiently integrate indicators of ecosystem quality, potentially overlooking fine-grained heterogeneity of wetland ecosystem health [12]. Therefore, a comprehensive assessment framework driven by a multidimensional indicator system is still required for wetland ecosystems.
Located in the eastern farming-pastoral ecotone of Northern China, the western Songnen Plain represents a typical ecologically fragile area that has experienced significant degradation [23]. As one of China’s major inland wetland concentration zones, it serves as a crucial component of the East Asian–Australasian Flyway, playing a vital role in biodiversity conservation, soil and water retention, and ecosystem sustainability maintenance [24]. However, the combined pressures of a warming–drying climate and intensive agricultural/pastoral activities have placed these wetland ecosystems under considerable threats [24]. Previous research concerning wetland ecosystems in this region primarily focused on monitoring landscape patterns, retrieving vegetation-related ecological parameters, and assessing habitat suitability using remote sensing, leaving a gap in comprehensive ecosystem health evaluations. Conducting an ecosystem health assessment of wetlands in the western Songnen Plain thus holds scientific significance and practical value for strengthening wetland ecosystem conservation and management, as well as optimizing regional ecosystem functions and services.
Based on these backgrounds, our study aims to develop a multidimensional indicator system and a comprehensive Wetland Ecosystem Health Index (WEHI) to assess the wetlands in the western Songnen Plain. Specifically, we seek to quantify the spatiotemporal variations in wetland ecosystem health from 2000 to 2020 and assess the effectiveness of protected areas in maintaining or enhancing ecosystem health. The findings are expected to improve local conservation management and optimize ecosystem services. Moreover, the proposed framework is designed to be transferable, offering a reference for assessing wetland ecosystems in other regions.
2. Materials and Methods
2.1. Study Area
The western Songnen Plain (44°00′–48°35′ N, 121°36′–126°36′ E) is located in the heart of Northeast China (Figure 1), with a total area of 101,000 km2. The region occupies a transitional zone between China’s humid monsoon region and the inland arid area, experiencing a semi-arid to semi-humid continental climate. The average annual temperature ranges from 4 to 6 °C, and the average annual precipitation varies between 350 and 650 mm. The western Songnen Plain is a major hub for inland wetlands in China, hosting three internationally important wetlands (Ramsar sites)—Zhalong, Momoge, and Xianghai—along with over ten national and provincial-level nature reserves, such as Chagan Lake and Dabusu. These wetlands are vital for regional ecological security and provide critical habitats for waterfowl along the East Asian–Australasian Migratory Flyway [23]. However, ongoing socioeconomic development and intensifying climate change threaten these wetlands, underscoring the urgent need for robust conservation strategies. Ecosystem health assessment of these wetlands holds significant practical importance for sustainable ecosystem management and the optimization of conservation measures.
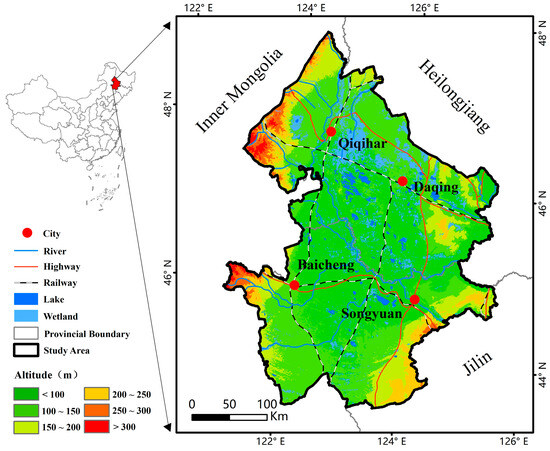
Figure 1.
Geographic location and elevation of the study area.
2.2. Remote Sensing Data
2.2.1. Wetland Distribution Dataset
The wetland distribution dataset in 2000, 2010, and 2020 used in this study was obtained from the study of Mao et al. [25], which generated a national product of China’s wetland distribution (China Wetlands). This product was developed through an integrated approach combining object-oriented and hierarchical decision tree classification methods (HOHC), based on the Landsat series remote sensing images with a spatial resolution of 30 m. The HOHC resulted in good classification accuracy by leveraging the strengths of object-oriented image analysis in characterizing wetland features and the capacity of decision tree classification in separating different wetland categories. Furthermore, this study conducted a field plot survey in the western Songnen Plain in mid-July 2022 to validate the dataset’s applicability to our specific study area. The field investigation recorded wetland types and corresponding GPS information with a precision of 2 m within the study area. A total of 609 wetland field points were collected to verify the wetland distribution dataset, confirming the dataset’s high accuracy (93.2%) for the western Songnen Plain.
2.2.2. MODIS Products
The MODIS series data from NASA with a spatial resolution of 500 m for the years 2000, 2010, and 2020 used in this study—Normalized Difference Vegetation Index (NDVI), Normalized Difference Water Index (NDWI), Net Primary Productivity (NPP), and Leaf Area Index (LAI)—were sourced from the official website of the National Aeronautics and Space Administration (NASA) and processed via the Google Earth Engine (GEE) cloud platform. NDVI (MOD13A1 product) could reflect vegetation characteristics (Equation (1)). NDWI, derived from the green and near-infrared bands (Equation (2), reflects the characteristics of water bodies very well. LAI (MOD15A2H product) is commonly used to characterize vegetation growth conditions and is defined as the green leaf area per unit of ground area [26]. NPP (MOD17A3 product) represents vegetation productivity and is estimated using the BIOME-BGC model [27]. NDVI, NDWI, and LAI were aggregated to annual maps using the maximum value method from monthly or 8-day data. Yearly NPP was processed using the accumulation method from monthly data.
2.2.3. Other Data
The population density data and gross domestic product (GDP) data in 2000, 2010, and 2020 were obtained from the Resource and Environment Science and Data Center (https://www.resdc.cn). The population density data reflects the spatial distribution of human pressures, while GDP serves as a key indicator for socioeconomic development, regional planning, and resource–environmental protection. Both datasets have a spatial resolution of 1 km.
To ensure data consistency in the study, all datasets downloaded from GEE were resampled to a uniform resolution of 1 km using the nearest neighbor method in ArcGIS 10.6 software.
2.3. Assessment Method
2.3.1. Selection of Assessment Indictors
Ecosystems are complex, with multifactor interactions and mechanisms between pressure and response that are challenging to capture accurately. While the PSR framework incorporates multidimensional indicators, especially the ecosystem pattern and services for assessing ecosystem health, most studies relied on ecosystem service value, which lacked spatial details. To address this, this study established a comprehensive yet straightforward framework tailored to the western Songnen Plain wetlands, drawing upon worldwide wetland ecosystem health assessment methodologies. Building on the PSR model, our framework integrated four key aspects easily characterized by remote sensing and geographical data: ecosystem pattern, quality, service, and threat.
Through a careful examination of indicator’s scientific significance and data availability, while giving full consideration to the primary services of western Songnen Plain wetlands, we selected representative indicators for wetland ecosystem health assessment (Table 1).

Table 1.
The indicator weight for evaluating wetland ecosystem health.
The Landscape Fragmentation Index (LFI), defined as the number of landscape patches per unit area, was used in this study to characterize the spatial heterogeneity of wetland ecosystem patterns. This study used LAI, Fractional Vegetation Cover (FVC), and NPP as proxies for wetland ecosystem quality since existing studies have demonstrated their significance. Biodiversity support is a critical service in the western Songnen Plain. Accordingly, the Habitat Suitability Index (HSI), calculated following Tian et al. [24], was our primary indicator for evaluating ecosystem services. Moreover, NDVI, which correlates to carbon sequestration and climate regulation service, and NDWI, which relates to hydrological and humidity regulation service, were also included in the service aspects. Ecosystem threats can generally be categorized into environmental and anthropogenic pressures. For environmental threat factors, this study selected temperature and precipitation. For anthropogenic stress factors, population density and GDP were chosen as key indicators.
In the analysis of integrating multidimensional wetland ecosystem health indicators, variations in units, magnitudes, and dimensions across indicators may lead to analytical and evaluation challenges. To address this issue, all indicators were transformed into dimensionless data after being normalized into a 0–1 scale using the range method (each value divided by the maximum value for that corresponding indicator).
2.3.2. Weight Calculation of Assessment Indicators
This study employed the Analytic Hierarchy Process (AHP) to assign weights to indicators for wetland ecosystem health assessment in the western Songnen Plain. AHP is a robust technique for deriving ratio scales from paired comparisons. AHP output is a set of rankings to support decisions regarding a large number of alternatives based on several decision factors per alternative. The advantages of AHP consist of its capability to organically combine qualitative and quantitative factors in decision-making processes, thoroughly analyze the intrinsic relationships and involved factors of problems, feature a straightforward methodology that facilitates user calculations, and demonstrate good reliability and practicality with minimal errors [24]. The AHP method has been widely applied in wetland ecological health assessments. After constructing a hierarchical structure and performing a sensitivity analysis, final weights for each indicator were assigned as Table 1.
2.3.3. Grading Ecosystem Health of Wetlands
The evaluation indicators were standardized and aggregated with respective weights to obtain the WEHI for the western Songnen Plain. Since the WEHI alone cannot directly reflect the health status of wetlands, a corresponding classification scheme was established based on comprehensive evaluation results to qualitatively describe wetland ecological health conditions, thereby facilitating understanding of wetland ecosystem health levels and changing trends. This study referenced evaluation standards proposed by various scholars for different types of wetland ecosystems [14,28] and incorporated local conditions of the western Songnen Plain wetlands. Ultimately, to interpret the spatial and temporal changes in wetland ecosystem health, the continuous WEHI values in the western Songnen Plain were classified into four grades using equal intervals for each time point: excellent health status (1–0.75), good health status (0.75–0.50), fair health status (0.50–0.25), and poor health status (0.25–0). Details are shown in Table 2.

Table 2.
Classification criteria for ecosystem health assessment of wetlands.
3. Results
3.1. Ecological Variations in Wetlands from 2000 to 2020
Spatial analysis revealed a generally fragmented distribution of wetlands across the western Songnen Plain, except for the designated protected areas (Figure 2). Extensive distribution of lakes and rivers provided critical hydrological conditions for the wetlands. However, climate change and human activities contributed to increased wetland fragmentation between 2000 and 2010, indicated by the decline in mean LFI (0.1). This trend, however, appeared to stabilize between 2010 and 2020, with LFI showing little change. Overall, the change in LFI exhibited notable spatial heterogeneity (Figure 2).
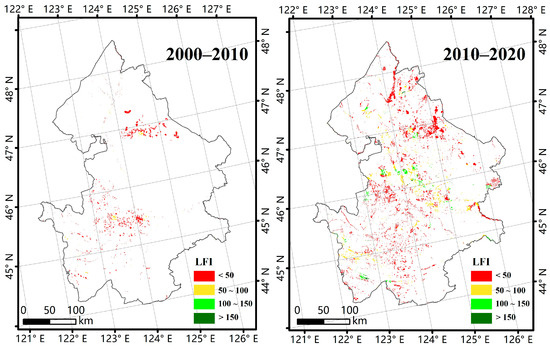
Figure 2.
Changes in landscape fragmentation index (LFI) over the western Songnen Plain from 2000 to 2020.
The ecological parameters of wetlands in the western Songnen Plain showed evident spatiotemporal dynamics from 2000 to 2020 (Figure 3). The highest values for these parameters were consistently observed within the Zhalong Ramsar site. Regionally, wetlands experienced a notable ecological improvement over the two decades, with increased mean values of LAI and FVC. The mean LAI increased from 1.91 in 2000 to 2.92 in 2010, and further to 3.85 in 2020. Similarly, FVC rose from 0.69 in 2000 to 0.74 in 2010, and further to 0.80 in 2020. In contrast to the consistent upward trends in FVC and LAI, NPP decreased notably in the former decade but recovered clearly in the latter decade (Figure 3).
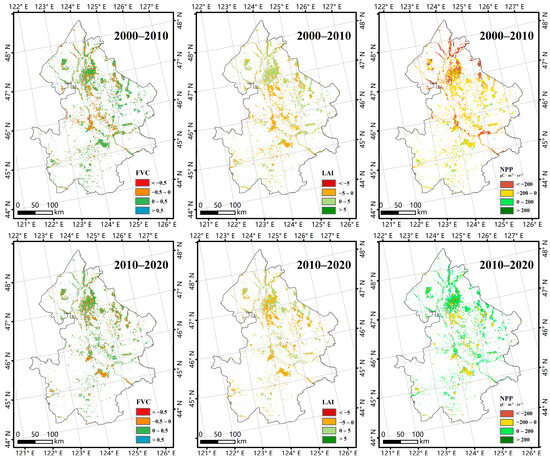
Figure 3.
Spatial patterns of changes in wetland leaf area index (LAI), vegetation coverage (FVC), and net primary productivity (NPP) over the western Songnen Plain between 2000 and 2010 and 2010–2020.
The HSI, which reflects the habitat quality, demonstrated a spatial pattern of improvement in the southern and northern parts against the degradation in the central part during the observed decades (Figure 4). Overall, the wetland habitat quality in the study area remained at a moderate level, with regional mean HSI values between 50 and 60. Driven by the broader ecological improvement of wetlands, the mean HSI values increased from 54.10 in 2000 to 55.00 in 2010, and further to 56.37 in 2020. A notable local exception was Chagan Lake, where HSI trends shifted from improvement in the first decade to degradation in the second.
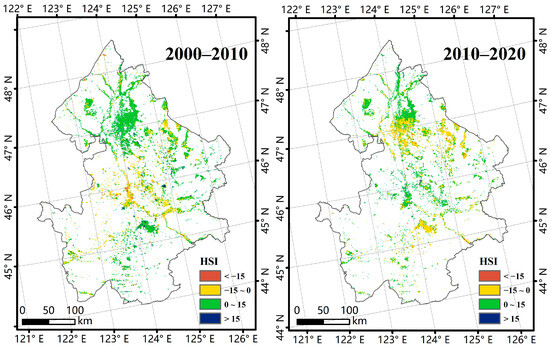
Figure 4.
Spatial pattern of the changes in Habitat Suitability Index (HSI) over the western Songnen Plain from 2000 to 2020.
NDVI and NDWI effectively capture the vegetation vigor and hydrological conditions, respectively (Figure 5). By 2020, wetlands in western Songnen Plain had relatively high NDVI values (mean: 0.76) and medium values of NDWI (mean: 0.27). During the two decades, both NDVI and NDWI of wetlands showed remarkable increases, by 21% (0.13) and 17% (0.04), respectively. Interestingly, improved hydrological conditions may weaken the spectral signals of wetland vegetation, leading to divergent trends between the two indicators in specific locations and periods (Figure 5).
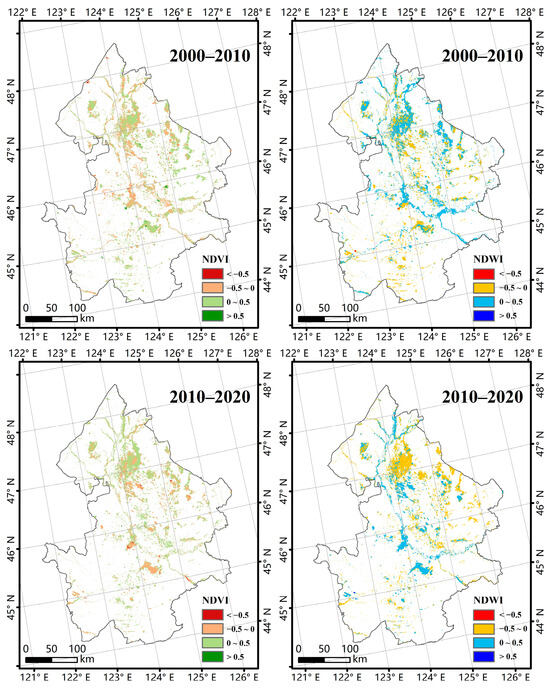
Figure 5.
Variations in NDVI and NDWI changes in western Songnen Plain from 2000 to 2010 and from 2010 to 2020.
The study area exhibited characteristic patterns of hydrothermal conditions, with a pronounced latitudinal temperature gradient and an east–west precipitation disparity (Figure 6). Despite being located in a generally semi-arid zone, a trend of warming and wetting was observed overall between 2000 and 2020, with an increase in annual mean temperature by 33% (1.06 °C) and an increase in annual precipitation by 85% (300 mm). However, this climatic trend was not uniform across decades; for example, the temperature declined in the first decade before increasing in the second (Figure 5). More wetting areas were observed for the study area during the two decades.
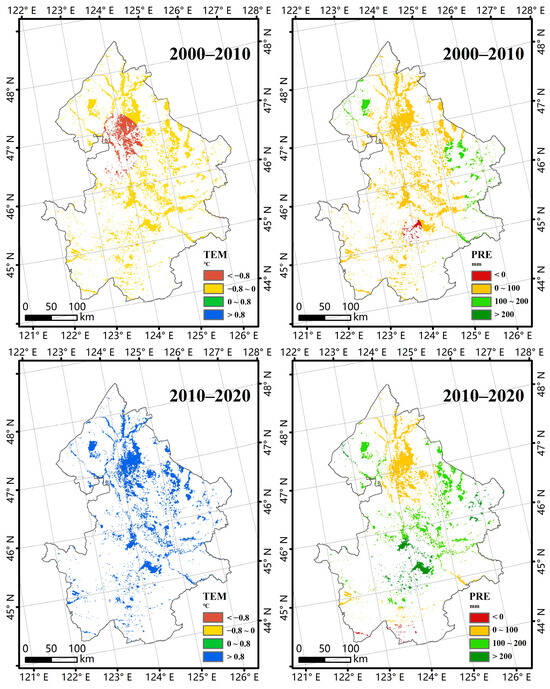
Figure 6.
Spatiotemporal changes in temperature (TEM) and precipitation (PRE) over the western Songnen Plain from 2000 to 2010 and from 2010 to 2020.
Although the western Songnen Plain has been an important agricultural area, overall population density and GDP were relatively low. The cities or towns, which were mainly distributed in the north, correlated with spatial clusters of high values of POP and GDP (Figure 7). From 2000 to 2020, the POP saw limited growth, while GDP increased substantially by 62%. However, the population experienced a decline from 2010 to 2020 across the study area, while GDP in the southern areas had declined in the same decade.
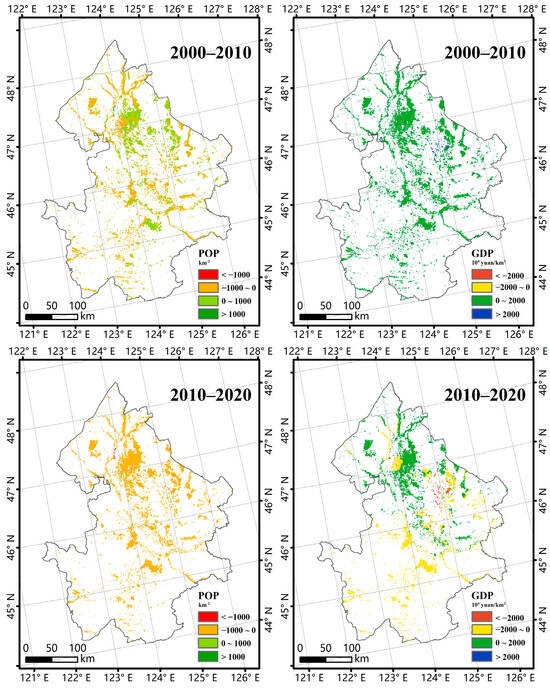
Figure 7.
Spatial patterns of population density (POP) and gross domestic product (GDP) changes over the western Songnen Plain from 2000 to 2020.
3.2. Spatiotemporal Changes in Wetland Ecosystem Health
The comprehensive evaluation of the wetland ecosystem for the study area yielded a mean WEHI of 0.47 in 2020, indicating a “fair” ecosystem health status, with considerable spatial variation (Figure 8). Specifically, areas classified as “excellent” were scarce (less than 1% of the total wetland area) and sporadically distributed in the central part of the study area in 2020. Wetlands in “good” health covered 37% of the total wetland area, primarily concentrated in the northern and central parts. Areas with a “fair” level of ecosystem health were dominant, making up 63% of total wetlands, with higher concentrations in the northeast and south. Areas in “poor” health were negligible (less than 1%), scattered in the south and northeast. In summary, the overall ecosystem health status of wetlands in the Songnen Plain was relatively low, showing initial signs of degradation.
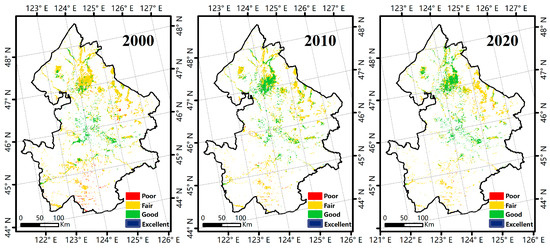
Figure 8.
Spatial variations in wetland ecosystem health over the western Songnen Plain during the period of 2000–2020.
From 2000 to 2020, a trend of gradual improvement in wetland ecosystem health was observed (Figure 8), with the WEHI increasing from 0.44 to 0.47, remaining in the “fair” level. In 2000, areas with a “poor” health status were widely scattered, primarily concentrated in the southern and northeastern parts. By 2020, the extent of “poor” health areas had decreased markedly, from 356.20 km2 to 67.61 km2 (an 81% reduction). Areas with a “fair” ecosystem health status also declined by 31% over the study period. In contrast, areas with “good” health exhibited a steady increase, expanding by 50% over the two decades. Areas classified with an “excellent” health level also saw an increase (from 0 to 2.02 km2). These trends collectively indicated an overall improvement in wetland ecosystem health. However, despite this improvement, the areas in “excellent” health remained minimal compared to the total wetland area, highlighting the need for continued conservation efforts.
3.3. Variations in Wetland Ecosystem Health Among the Ramsar Sites
Overall, the ecosystem health status of Momoge and Zhalong Ramsar sites was slightly better than that of Xianghai, with WEHI scores ranging between 0.50 and 0.75, corresponding to a “good” level (Figure 9). These wetlands exhibited complete ecosystem structures, strong service functions, and relatively good self-regulating capacity. Among the three Ramsar sites, neither Momoge nor Xianghai had wetlands in “poor” health. Notably, none of the three sites contained areas in “excellent” health conditions. In 2020, the mean WEHI of the Zhalong Ramsar site was 0.51, placing it in the “good” level. The health pattern of the Zhalong Ramsar site was dominated by a “good” status (68% of its area), with “fair” areas making up the remaining 32%, interspersed with the “good” areas. A small, degraded area (1.01 km2) in the eastern part had a negligible impact on the overall score. The Momoge Ramsar site recorded the highest WEHI (0.55) among the three sites, with a health pattern divided between “good” (72%) and “fair” (28%) areas, arranged in an east–west zonation. In contrast, the Xianghai Ramsar site had a lower WEHI (0.45). Its health status was predominantly “fair” (93%), with only 7% classified as “good” and concentrated in the southwestern corner of the reserve. Compared to Zhalong and Momoge, Xianghai’s severe imbalance in ecosystem health resulted in a lower overall WEHI, underscoring it as a priority for management and protection interventions.
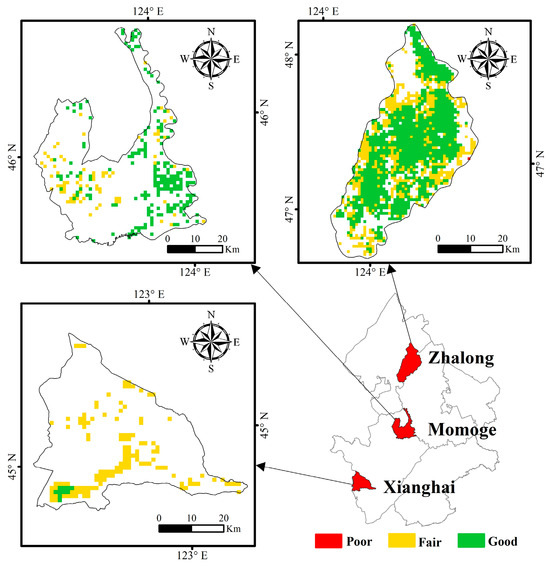
Figure 9.
Variations in wetland ecosystem health in national protected areas.
4. Discussion
Wetland ecosystem health refers to the ability of a wetland to maintain its structural integrity, ecological functions, and resilience under natural and anthropogenic pressures [29]. Therefore, previous studies have evaluated wetland ecosystem health by several indicators such as species richness, NPP, and habitat suitability. While assessments based on a single indicator—whether structural, functional, or even threats-related—often fail to recognize the complexity of ecosystem dynamics and their underlying mechanisms [30]. In this study, the ecosystem health of wetlands was assessed at a scale of 1 km, a scale determined by data availability—particularly for threat and service indicators—and the functional relevance of typical wetland patch sizes. While practical, this resolution may introduce some uncertainties related to the mixed pixel or the omission of small wetland patches, and thus single index at this scale can be unreliable. For instance, we observed that the NPP had no significant increase, whereas NDVI and FVC showed clear upward trends from 2000 to 2020. Moreover, improved hydrological conditions, largely associated with a wetting climate and reflected in rising NDWI, can sometimes suppress the spectral signals of emergent vegetation, leading to localized decreases in NDVI (Figure 5). Additionally, increased cloud cover and precipitation may also limit the photosynthesis time, indirectly affecting vegetation growth [24,31]. Therefore, a multidimensional indicator framework was the optimal approach to evaluate the ecosystem health. This study is the first to construct a comprehensive wetland ecosystem health indicator system for the western Songnen Plain—a key wetland region in China—integrating four dimensions: ecosystem pattern, quality, service, and threats. The resulting WEHI provides a systematic analysis of wetland health status and trends. We argue that such an integrated system offers a more optimal reflection of overall ecosystem health condition. Importantly, the WEHI revealed the spatially explicit variations in ecosystem health especially in the northern part of the study area, that would not have been discernible using vegetation metrics alone.
Under the combined influence of climate change and human activities, the health status of regional wetland ecosystems exhibited significant spatiotemporal variations, primarily driven by changes in hydrothermal conditions (Figure 5), consistent with earlier studies using different indicators [31]. In contrast to earlier reports of wetland degradation in the western Songnen Plain, we identified noticeable improvements in wetland vegetation growing status—evidenced by increases in NDVI and FVC—particularly between 2010 and 2020. This improvement is likely attributable to regional warming and increased precipitation, especially within the second decade [32]. During the recent decades, the wetting and warming climate was notable in China’s arid and semi-arid areas. Moreover, the notable improvement in the HSI observed in the western Songnen Plain contrasted with the previous satellite-based studies that reported declining wetland area and habitat quality mainly caused by agricultural expansion [24]. All these discrepancies highlight the importance of a multidimensional index like the WEHI for comprehensively understanding the ecosystem responses of wetland to global change and supporting sustainable management.
Although rising POP and GDP may intensify pressures on the wetlands by tourism and development, strengthened legislation protections, and growing awareness of ecological civilization have contributed to healthier wetland ecosystems in some contexts [33]. With enhanced conservation efforts and reduced anthropogenic threats guided by national or local policies, the health of regional wetland ecosystems has markedly improved in our study area. The implementation of provincial wetland protection regulations in Heilongjiang (since 2003) and Jilin (since 2011) likely played a role in reducing anthropogenic threats. The positive effect of protection is evident in the higher wetland ecosystem health levels within the three Ramsar sites compared to the study area as a whole (Figure 8). This suggests that designated protected areas can effectively mitigate direct human impacts and facilitate ecosystem recovery. With the enhancement of national wetland protection law from 2022, the conservation of wetlands is expected to intensify, further promoting ecosystem health and biodiversity conservation.
The observed increase in WEHI over the past two decades is an encouraging sign for the western Songnen Plain. Meanwhile, a wetter climate characterized by increased precipitation was projected to continue, which is beneficial to wetland rehabilitation. However, targeted conservation and restoration efforts remain essential. Specifically, Xianghai had the lowest WEHI among the three Ramsar sites, likely due to its more arid local climate and more open reserve boundaries, which increased exposure to agricultural and grazing pressures [34]. In contrast, the ecological water compensation and vegetation restoration projects performed several times at the Zhalong and Momoge Ramsar sites may have contributed to their improved wetland ecosystem health levels [35]. Based on the spatial and temporal patterns of WEHI, we recommend prioritizing areas with lower index values, particularly in the southern and northeastern parts of the region. Specific suggestions include: (1) enhancing the management effectiveness of existing protected areas, where human disturbances persist [34]; (2) constructing ecological corridors, which are critical for landscape connectivity and biodiversity conservation; (3) promoting ecological compensation policies to facilitate wetland restoration on croplands. These measures are expected to improve overall ecosystem health of wetlands and enhance the provision of vital ecosystem services to human society.
Although the WEHI framework successfully assessed wetland spatiotemporally encompassing indicators of ecosystem pattern, quality, service, and threat, some uncertainties remain. These stem from the resampling process of multi-resolution MODIS remote sensing data and the interpolation of socio-economic datasets statistics. Moreover, the use of only three time points (2000, 2010, 2020) may overlook changes occurring at finer temporal scales, leading to inadequate assessment. Future efforts should incorporate higher resolution, more frequent, and more up-to-date data, and expand the range of indicators within each dimension—such as including additional ecosystem service types and threat sources. Moreover, alternative weighting methods could be introduced to the WEHI assessment system. Finally, causal analysis should be conducted to unravel the driving mechanisms behind climate and ecosystem health interactions and to quantitatively assess their relative contributions to health variations.
5. Conclusions
This study developed a multi-dimensional indicator system—encompassing ecosystem pattern, quality, service, and threats—to evaluate spatiotemporal changes in wetland ecosystem health across the western Songnen Plain from 2000 to 2020. The assessment revealed an improved ecosystem health status during the two observed decades with an increased WEHI from 0.44 in 2000 to 0.47 in 2020. Wetland ecosystem health levels were affected by west–east gradients in hydrothermal conditions and spatial difference in human threats. A trend toward a wetter climate, combined with reduced human threats likely due to enhanced conservation measures, contributed to this positive trajectory during 2000–2020. Protected areas, particularly the Ramsar sites, exhibited higher WEHI values compared with the backdrop, underscoring their critical role in maintaining wetland ecosystem health. Additional efforts for wetland rehabilitation are still recommended to enhance ecosystem services and support sustainable development goals.
Author Contributions
Conceptualization, L.L., X.W. and Z.W.; data curation, L.L. and X.W.; methodology, L.L. and X.W.; writing—original draft, L.L.; writing—review and editing, L.L., X.W. and Z.W. All authors have read and agreed to the published version of the manuscript.
Funding
This research was jointly funded by the National Natural Science Foundation of China (42101379) and the National Key Research and Development Program of China (2023YFF0807201).
Data Availability Statement
The original contributions presented in this study are included in the article. Further inquiries can be directed to the corresponding author.
Acknowledgments
We would like to thank the National Earth System Science Data Center of China. We are also grateful to Google for providing access to the Google Earth Engine platform, which enabled the processing of all data.
Conflicts of Interest
The authors declare no conflicts of interest.
References
- Xu, W.; Fan, X.; Ma, J.; Pimm, S.L.; Kong, L.; Zeng, Y.; Li, X.; Xiao, Y.; Zheng, H.; Liu, J.; et al. Hidden loss of wetlands in China. Curr. Biol. 2019, 29, 3065–3071. [Google Scholar] [CrossRef] [PubMed]
- Dale, P.E.R.; Connelly, R. Wetlands and human health: An overview. Wetl. Ecol. Manag. 2012, 20, 165–171. [Google Scholar] [CrossRef]
- Ramsar Convention on Wetlands (RCW). Global Wetland Outlook: State of the World’s Wetlands and Their Services to People; Ramsar Convention Secretariat: Gland, Switzerland, 2018. [Google Scholar]
- Mahdianpari, M.; Granger, J.E.; Mohammadimanesh, F.; Salehi, B.; Brisco, B.; Homayouni, S.; Gill, E.; Huberty, B.; Lang, M. Meta-analysis of wetland classification using remote sensing: A systematic review of a 40-year trend in North America. Remote Sens. 2020, 12, 1882. [Google Scholar] [CrossRef]
- Liu, W.; Guo, Z.; Jiang, B.; Lu, F.; Wang, H.; Wang, D.; Zhang, M.; Cui, L. Improving wetland ecosystem health in China. Ecol. Indic. 2020, 113, 106184. [Google Scholar] [CrossRef]
- Qin, H.; Luo, J.; Xu, Y.; Xin, Y.; Xiao, Q.; Qiu, Y.; Bai, S.; Duan, H. Estimation models for pixel-scale coverage of aquatic vegetation in lakes based on Landsat and Sentinel data. J. Remote Sens. 2025, 5, 0616. [Google Scholar] [CrossRef]
- Yadav, P.K.; Jha, P.; Joy, M.S.; Bansal, T. Ecosystem health assessment of East Kolkata Wetlands, India: Implications for environmental sustainability. J. Environ. Manag. 2024, 366, 121809. [Google Scholar] [CrossRef]
- Ogden, J.C.; Baldwin, J.D.; Bass, O.L.; Browder, J.A.; Cook, M.I.; Frederick, P.C.; Frezza, P.E.; Galvez, R.A.; Hodgson, A.B.; Meyer, K.D.; et al. Waterbirds as indicators of ecosystem health in the coastal marine habitats of Southern Florida: 1. Selection and justification for a suite of indicator species. Ecol. Indic. 2014, 44, 148–163. [Google Scholar] [CrossRef]
- Ogden, J.C.; Baldwin, J.D.; Bass, O.L.; Browder, J.A.; Cook, M.I.; Frederick, P.C.; Frezza, P.E.; Galvez, R.A.; Hodgson, A.B.; Meyer, K.D.; et al. Waterbirds as indicators of ecosystem health in the coastal marine habitats of Southern Florida: 2. Conceptual ecological models. Ecol. Indic. 2014, 44, 128–147. [Google Scholar] [CrossRef]
- Lu, K.; Wu, H.; Guan, Q.; Lu, X. Aquatic invertebrate assemblages as potential indicators of restoration conditions in wetlands of Northeastern China. Restor. Ecol. 2021, 29, e13283. [Google Scholar] [CrossRef]
- Fentaw, G.; Mezgebu, A.; Wondie, A.; Getnet, B. Ecological health assessment of Ethiopian wetlands: Review and synthesis. Environ. Sustain. Indic. 2022, 15, 100194. [Google Scholar] [CrossRef]
- Das, S.; Pradhan, B.; Shit, P.K.; Alamri, A.M. Assessment of wetland ecosystem health using the Pressure-State-Response (PSR) model: A case study of Mursidabad district of West Bengal (India). Sustainability 2020, 12, 5932. [Google Scholar] [CrossRef]
- Ekumah, B.; Armah, F.A.; Afrifa, E.K.A.; Aheto, D.W.; Odoi, J.O.; Afitiri, A. Geospatial assessment of ecosystem health of coastal urban wetlands in Ghana. Ocean Coast. Manag. 2020, 193, 105226. [Google Scholar] [CrossRef]
- Sun, T.; Lin, W.; Chen, G.; Guo, P.; Zeng, Y. Wetland ecosystem health assessment through integrating remote sensing and inventory data with an assessment model for the Hangzhou Bay, China. Sci. Total Environ. 2016, 566–567, 627–640. [Google Scholar] [CrossRef]
- Agboola, J.; Ndimele, P.E.; Odunuga, S.; Akanni, A.; Kosemani, B.; Ahove, M.A. Ecological health status of the Lagos wetland ecosystems: Implications for coastal risk reduction. Estuar. Coast. Shelf Sci. 2016, 183, 73–81. [Google Scholar] [CrossRef]
- Rawat, M.; Pandey, A.; Gupta, P.K.; Yadav, B.; Patel, J.G. A novel framework for wetland health assessment using hydro-ecological indicators and landscape metrics. Model. Earth Syst. Environ. 2025, 11, 167. [Google Scholar] [CrossRef]
- Sun, R.; Yao, P.; Wang, W.; Yue, B.; Liu, G. Assessment of wetland ecosystem health in the Yangtze and Amazon River Basins. ISPRS Int. J. Geo-inf. 2017, 6, 81. [Google Scholar] [CrossRef]
- Li, Z.; Xu, D.; Guo, X. Remote sensing of ecosystem health: Opportunities, challenges, and future perspectives. Sensors 2014, 14, 21117–21139. [Google Scholar] [CrossRef]
- Steinbach, S.; Hentschel, E.; Hentze, K.; Rienow, A.; Umulisa, V.; Zwart, S.J.; Nelson, A. Automatization and evaluation of a remote sensing-based indicator for wetland health assessment in East Africa on national and local scales. Ecol. Inform. 2023, 75, 102032. [Google Scholar] [CrossRef]
- Song, Z.; Sun, Y.; Chen, P.; Jia, M. Assessing the Ecosystem Health of Coastal Wetland Vegetation (Suaeda salsa) Using the pressure state response model, a case of the Liao River Estuary in China. Int. J. Environ. Res. Public Health 2022, 19, 546. [Google Scholar] [CrossRef]
- Liu, Y.; Yang, P.; Zhang, S.; Wang, W. Dynamic identification and health assessment of wetlands in the middle reaches of the Yangtze River basin under changing environment. J. Clean. Prod. 2022, 345, 131105. [Google Scholar] [CrossRef]
- Wu, C.; Chen, W. Indicator system construction and health assessment of wetland ecosystem—Taking Hongze Lake Wetland, China as an example. Ecol. Indic. 2020, 112, 106164. [Google Scholar] [CrossRef]
- Luo, L.; Mao, D.; Wang, Z.; Du, B.; Yan, H.; Zhang, B. Remote sensing and GIS support to identify potential areas for wetland restoration from cropland: A case study in the west Songnen Plain, Northeast China. Sustainability 2018, 10, 2375. [Google Scholar] [CrossRef]
- Tian, Y.; Wang, Z.; Mao, D.; Li, L.; Liu, M.; Jia, M.; Man, W.; Lu, C. Remote observation in habitat suitability changes for waterbirds in the west Songnen Plain, China. Sustainability 2019, 11, 1552. [Google Scholar] [CrossRef]
- Mao, D.; Wang, M.; Wang, Y.; Jiang, M.; Yuan, W.; Luo, L.; Feng, K.; Wang, D.; Xiang, H.; Ren, Y.; et al. The trajectory of wetland change in China between 1980 and 2020: Hidden losses and restoration effects. Sci. Bull. 2025, 70, 587–596. [Google Scholar] [CrossRef]
- Hill, M.J.; Senarath, U.; Lee, A.; Zeppel, M.; Nightingale, J.M.; Williams, R.J.; McVicar, T.R. Assessment of the MODIS LAI product for Australian ecosystems. Remote Sens. Environ. 2006, 101, 495–518. [Google Scholar] [CrossRef]
- Zhao, M.S.; Running, S.W. Drought-induced reduction in global terrestrial net primary production from 2000 through 2009. Science 2020, 329, 940–943. [Google Scholar] [CrossRef]
- Nijiati, N.; Rusuli, Y.; Maimaitiaili, K.; Kuluwan, Y. Spatiotemporal variations and driving forces analysis of ecosystem health in the Bosten Lake wetland in China. Land Degrad. Dev. 2025, 36, 5035–5053. [Google Scholar] [CrossRef]
- Yang, R.; Chen, Y.; Qiu, Y.; Lu, K.; Wang, X.; Sun, G.; Liang, Q.; Song, H.; Liu, S. Assessing the Landscape Ecological Health (LEH) of Wetlands: Research Content and Evaluation Methods (2000–2022). Water 2023, 15, 2410. [Google Scholar] [CrossRef]
- Zhou, Y.; Dou, Y.; Yu, X.; Zhang, L.; Huang, C.; Wang, Y.; Li, X.; Li, H.; Jia, Y.; Bakker, M.; et al. Examining health of wetlands with multiple ecosystem services as targets in China’s coastal region. Chin. Geogr. Sci. 2020, 30, 600–613. [Google Scholar] [CrossRef]
- Wang, Y.; Shen, X.; Tong, S.; Zhang, M.; Jiang, M.; Lu, X. Aboveground biomass of wetland vegetation under climate change in the western Songnen Plain. Front. Plant Sci. 2022, 13, 941689. [Google Scholar] [CrossRef]
- Ren, Y.; Mao, D.; Li, X.; Wang, Z.; Xi, Y.; Feng, K. Aboveground biomass of marshes in Northeast China: Spatial pattern and annual changes responding to climate change. Front. Ecol. Evol. 2022, 10, 1043811. [Google Scholar] [CrossRef]
- Du, W.; Tong, S.; Zhang, M.; Xin, Y.; Zhang, D.; Xing, X.; An, Y.; Cui, G.; Liu, G. Revealing the spatiotemporal dynamics and nonlinear interaction-driven mechanisms of wetland ecosystem health in Northeast China using interpretable machine learning. Ecol. Indic. 2025, 178, 113878. [Google Scholar] [CrossRef]
- Mao, D.; Wang, Z.; Wang, Y.; Choi, C.Y.; Jia, M.; Jackson, M.V.; Fuller, R.A. Remote observations in China’s Ramsar sites: Wetland dynamics, anthropogenic threats, and implications for sustainable development goals. J. Remote Sens. 2021, 2021, 9849343. [Google Scholar] [CrossRef]
- Xiang, H.; Wang, Z.; Mao, D.; Zhang, J.; Xi, Y.; Du, B.; Zhang, B. What did China’s national wetland conservation program achieve? Observations of changes in land cover and ecosystem services in the Sanjiang Plain. J. Environ. Manag. 2020, 267, 110623. [Google Scholar] [CrossRef]
Disclaimer/Publisher’s Note: The statements, opinions and data contained in all publications are solely those of the individual author(s) and contributor(s) and not of MDPI and/or the editor(s). MDPI and/or the editor(s) disclaim responsibility for any injury to people or property resulting from any ideas, methods, instructions or products referred to in the content. |
© 2025 by the authors. Licensee MDPI, Basel, Switzerland. This article is an open access article distributed under the terms and conditions of the Creative Commons Attribution (CC BY) license (https://creativecommons.org/licenses/by/4.0/).