Article

Runoff Estimation in the Upper Yangtze River Basin Based on CMIP6 and WRF-Hydro Model

1
College of Information Science and Engineering, Wuchang Shouyi University, Wuhan 430064, China
2
National Engineering Research Center of Geographic Information System, China University of Geosciences, Wuhan 430074, China
*
Author to whom correspondence should be addressed.
Water 2025, 17(21), 3104; https://doi.org/10.3390/w17213104
Submission received: 29 September 2025 / Revised: 22 October 2025 / Accepted: 28 October 2025 / Published: 30 October 2025
(This article belongs to the Section Water and Climate Change)

Abstract

The impact of climate change on watershed hydrological processes has become increasingly significant, with the frequent occurrence of extreme flood events posing a severe challenge to the water resource security of the upper Yangtze River and the Three Gorges Reservoir. To enhance the understanding of runoff evolution under future climate scenarios, this study focuses on the upper Yangtze River Basin, integrating CMIP6 climate model data with the WRF-Hydro model to systematically assess the effects of climate change on runoff projections. Firstly, using CMFD data as a benchmark, the systematic biases in CMIP6 simulation results were evaluated and corrected. Precipitation and temperature data accuracy were improved through Local Intensity Correction (LOCI) and Daily Bias Correction (DBC). Secondly, a large-scale WRF-Hydro model suitable for the upper Yangtze River was developed and calibrated. Finally, based on the corrected CMIP6 data, the climate and runoff changes under the SSP2-4.5 and SSP5-8.5 scenarios for the period 2021–2050 were projected. The results show that: (1) the corrected CMIP6 data significantly improved issues of overestimated precipitation and underestimated temperature, providing a more realistic reflection of regional climate characteristics; (2) the sub-basin calibration strategy outperformed the overall calibration strategy at key control sites, with high runoff simulation accuracy during the validation period; (3) future temperatures exhibit a continuous rising trend, while precipitation changes are not significant—however, the magnitude and uncertainty of extreme events increase—and (4) under the SSP5-8.5 scenario, the inflow to the Three Gorges Reservoir during the wet season significantly increases, raising flood risk. The findings provide a scientific basis for understanding the hydrological response mechanisms in the upper Yangtze River Basin under climate change and offer decision-making support for flood control scheduling and water resource management at the Three Gorges Reservoir.

1. Introduction

The impact of global climate change on the hydrological cycle has become a central issue in the field of water resources research. According to the Intergovernmental Panel on Climate Change (IPCC) report, human activities, primarily greenhouse gas emissions, have caused the global average temperature to rise by approximately 1 °C, with a potential to exceed the critical threshold of 1.5 °C by the mid-21st century [1,2]. Climate warming significantly affects the stability of the hydrological cycle by altering atmospheric circulation, precipitation patterns, and evaporation processes [3,4]. The upper Yangtze River Basin, as a key water and energy strategic reserve area in China, plays a crucial role in the water security of the entire river basin. Affected by both climate change and human activities, the region’s precipitation and runoff patterns have undergone significant changes, leading to increased water resource imbalances and higher risks of flooding and droughts. This has made watershed water resource management more complex and challenging [5].
As an essential water and energy strategic reserve area in China, the runoff processes of the upper Yangtze River Basin are directly related to flood control and water resource allocation in the middle and lower reaches of the Yangtze River [6,7]. In recent years, influenced by global climate change, human activities, and hydraulic engineering regulation, both precipitation and runoff trends in this region have experienced notable changes [8,9]. Climate warming has intensified evaporation, exacerbating the spatial and temporal imbalances of regional water resources, with some areas facing severe water shortages during dry periods. Meanwhile, during the wet season, the flood peak effect has increased the risk of flooding in the middle and lower reaches. The Three Gorges Reservoir has alleviated some of the flood risks, but the uncertainty of extreme events in the future imposes higher demands on reservoir scheduling and watershed water resource management. Exploring the future trends in watershed climate and runoff under different scenarios is of great significance for water resource management, disaster prevention, and socio-economic sustainable development in the Yangtze River Basin.
In the study of climate change impacts on hydrological processes, the coupling of climate models and hydrological models has become a key approach. In recent years, CMIP6, as the latest generation of climate model ensembles, has significantly improved the resolution and physical process simulation compared to previous models [10,11,12]. It also incorporates emission and socio-economic pathways (Shared Socioeconomic Pathways, SSPs) to enhance the applicability of prediction results. Due to biases in global climate models at the regional scale, their simulation results must undergo downscaling and bias correction before being applied to watershed hydrological studies. Currently, downscaling methods are mainly divided into dynamic downscaling and statistical downscaling, with bias correction being a key step in statistical downscaling [13,14]. Local Intensity Scaling (LOCI) is only applicable to precipitation [15], while Daily Bias Correction (DBC) can correct both precipitation and temperature [16]. However, existing studies using LOCI and DBC for correcting precipitation often fail to fully consider the systematic biases in observational benchmark data during processing. At the same time, WRF-Hydro, an emerging atmospheric–hydrological coupling model, is capable of simulating precipitation–runoff response processes at a higher spatial resolution [17,18,19]. It has shown good performance in hydrological simulations for small and medium-sized basins, but its application in large-scale, complex watersheds (such as the upper Yangtze River) remains relatively underdeveloped, particularly in terms of parameter calibration and extreme flood event simulations [20,21,22].
With the intensification of climate change, estimating the future changes in inflow to the Three Gorges Reservoir under different climate scenarios is of significant importance for water resource management and disaster prevention. This study focuses on the Yangtze River Basin and conducts downscaling bias correction research based on CMIP6 and CMFD data. A bias correction scheme based on rainfall threshold adjustment for CMIP6 data is proposed. The WRF-Hydro model suitable for this basin is developed, and the corrected CMIP6 data is used to drive the WRF-Hydro model. Finally, the study projects runoff changes under the SSP2-4.5 and SSP5-8.5 scenarios for the period 2021–2050, with a focus on analyzing the impact of climate change on the inflow to the Three Gorges Reservoir and flood risks.

2. Materials and Methods

2.1. Study Area Overview

The Upper Yangtze River Basin is located at the eastern edge of the Tibetan Plateau, covering an area of approximately 1 million square kilometers, which accounts for more than 55% of the total area of the Yangtze River Basin (Figure 1). As a major water supply region for the Three Gorges Reservoir and an important water conservation area in the Yangtze River Basin, it directly impacts the flood control, power generation, and navigation safety of the reservoir.
The terrain and geomorphology of the basin are complex, presenting a typical landscape pattern from the Tibetan Plateau to the Hengduan Mountains and the Sichuan Basin. The western plateau area generally has an elevation exceeding 5000 m, serving as a key water source conservation area. The central mountain region is characterized by high mountains and deep valleys, with fragmented terrain. The eastern hilly area is relatively flat. The climate in the basin is complex and diverse, mainly influenced by monsoon climate and topographic effects. There are significant spatial differences in precipitation in the Upper Yangtze River Basin, with the eastern and central parts of the basin having high average annual precipitation, generally above 1000 mm, and the western part having lower average annual precipitation, less than 500 mm, and the distribution of time showing obvious seasonal characteristics, with summer precipitation accounting for a larger portion of the annual precipitation. Temperature decreases significantly with elevation, forming a climate spectrum ranging from subtropical to alpine cold zones. The basin is primarily replenished by precipitation, with some areas influenced by glacial meltwater. The uneven distribution of runoff throughout the year, coupled with the significant annual sediment transport, poses challenges to the operation and management of the Three Gorges Reservoir. In recent years, under the influence of climate change, new trends in hydrological characteristics have emerged in the basin, such as an increased frequency of extreme hydrological events and changes in runoff spatiotemporal distribution patterns. These changes directly affect the water supply security of the Three Gorges Reservoir.

2.2. Data Sources

Meteorological observation data come from the daily climate dataset published by the National Meteorological Science Data Center of China (https://data.cma.cn (accessed on 20 March 2025)). This dataset covers daily temperature and precipitation data from 824 meteorological stations. This study selects 284 valid meteorological stations with complete temperature and precipitation observation records between 1981 and 2010. The temperature data are daily average temperatures, while the precipitation data are the cumulative precipitation from 20:00 to 20:00 the following day, with special values representing trace precipitation excluded.
The China Meteorological Forcing Dataset (CMFD) is sourced from the “National Qinghai–Tibet Plateau Scientific Data Center” (http://data.tpdc.ac.cn (accessed on 25 March 2025)). This dataset integrates multi-source data, including Princeton, GLDAS, TRMM, and China’s routine observation data, and provides a good representation of regional climate characteristics [23]. This study uses a dataset with a temporal resolution of 1 day and applies bilinear interpolation to downscale it to a 0.25° resolution.
This study selects CMIP6 historical scenario data (1981–2010) and two future scenarios, SSP2-4.5 and SSP5-8.5 (2021–2050), to conduct climate change and hydrological simulations for the upper Yangtze River Basin (https://esgf-node.llnl.gov/projects/cmip6 (accessed on 27 March 2025)). Historical scenario data are primarily used to establish a bias correction method suitable for the basin, while the two future climate scenarios represent moderate and high emission pathways. WRF-Hydro requires eight key meteorological variables as input: near-surface specific humidity (huss), precipitation rate (pr), surface pressure (ps), downward longwave radiation (rlds), downward shortwave radiation (rsds), near-surface air temperature (tas), U-component wind (uas), and V-component wind (vas). Among these 34 models, only five (AWI-ESM-1-RecoM, GFDL-ESM4, MPI-ESM1-2-HR, MPI-ESM1-2-LR, and MRI-ESM2-0) provide all required variables for both scenarios. As MPI-ESM1-2-HR and MPI-ESM1-2-LR are developed by the Max Planck Institute for Meteorology, with the former being a higher-resolution version capable of more accurately simulating regional climate, considering model diversity and spatial resolution, we ultimately selected four models (AWI-ESM-1-RecoM, GFDL-ESM4, MPI-ESM1-2-HR, and MRI-ESM2-0) for this study. Their outputs cover eight meteorological variables required by the WRF-Hydro model and are uniformly interpolated to 0.25°.
Hydrological observation data come from the Yangtze River Basin Hydrological Annual Report and the daily discharge data provided by the “River and Water Information Report” website. Six representative control stations were selected: Pingshan Station on the Jinsha River, Gaochang Station on the Minjiang River, Beibei Station on the Jialing River, Wulong Station on the Wujiang River, and Cuntan and Yichang stations on the main stream. These stations are located in important river sections within the basin, with long-term and stable hydrological observation data, effectively reflecting the hydrological characteristics of their respective sub-basins and are representative of the basin. The hydrological data from Pingshan, Gaochang, Beibei, Wulong, and Yichang stations in 1982 were used for WRF-Hydro model parameter calibration, and daily discharge data from Cuntan Station from 2009 to 2018 were used for parameter validation.

2.3. Methodology

This study employs a methodology comprising two core components: bias correction of CMIP6 climate data and the construction and calibration of the WRF-Hydro model [23,24]. First, precipitation and temperature outputs from four CMIP6 models were evaluated against CMFD data, revealing systematic biases. To address this, precipitation data were corrected using the LOCI and DBC methods, while temperature data were calibrated with the DBC method, ensuring high-quality meteorological driving data for hydrological simulation [25,26,27]. Second, the calibrated data were used to build the WRF-Hydro v5.2 model. A two-stage strategy was employed to select and calibrate seven key hydrological parameters: first, independent calibration of tributary basins, followed by calibration of the main stem. Through a stepwise manual calibration approach, the representativeness and accuracy of runoff simulations were significantly enhanced. Overall, this integrated approach provides reliable bias-corrected climate data and optimized hydrological model parameters for runoff simulation in the upper Yangtze River basin.

2.3.1. CMIP6 Data Bias Evaluation and Correction

This study selects the ensemble mean results of four CMIP6 climate models: AWI-ESM-1-RecoM, GFDL-ESM4, MPI-ESM1-2-HR, and MRI-ESM2-0. Precipitation and temperature are evaluated in both temporal and spatial dimensions, and the results are compared with the CMFD to identify their systematic bias characteristics. Significant biases are found in the CMIP6 climate model data for the upper Yangtze River Basin, with precipitation simulations generally overestimated and temperature simulations consistently underestimated. Therefore, to ensure that CMIP6 data more accurately reflect the actual precipitation conditions, this study corrects the model’s simulation results to reduce the discrepancy between simulated precipitation and the CMFD observational values.
Traditional correction methods struggle to address both the intensity and frequency biases of precipitation simultaneously. Therefore, this study proposes a staged correction strategy: firstly, the precipitation frequency of CMFD data is adjusted by modifying the rain-day threshold to match the observed data from meteorological stations; then, the LOCI and DBC methods are applied to correct the CMIP6 precipitation data, and the optimal method is selected. The DBC method is used for correcting temperature data. By integrating data quality control with multi-method correction, high-precision precipitation and temperature data are obtained after bias correction, which are then used to drive the hydrological model.
LOCI is a method specifically designed for correcting precipitation frequency and intensity. This method first adjusts the monthly precipitation frequency of the climate model to match the observed monthly frequency by using observed monthly precipitation frequency data. The model’s rain-day threshold for each grid is determined, and precipitation values below this threshold are set to zero. Then, an adjustment factor s is calculated at the monthly scale to make the observed monthly mean equal to the climate model’s simulated precipitation mean for the reference period. Finally, the future precipitation data are systematically adjusted using the rain-day threshold and adjustment factor determined from the reference period. The adjustment factor s and the future precipitation correction formula are given by Equations (1) and (2), respectively:
s = (⟨Pobs,d: Pobs,d >= Pobs,T⟩ − Pobs,T)/(⟨Pref,d: Pref,d >= Pref,T⟩ − Pref,T)
Padj,d = max(Pobs,T + s (Pfut,dPref,T), 0)
Pobs,d and Pref,d are the observed and climate model daily precipitation values in the reference period, Pobs,T and Pref,T are the observed and climate model rain-day thresholds in the reference period, and ⟨⋅⟩ represents the monthly mean. Pfut,d and Padj,d are the corrected and uncorrected daily precipitation values, respectively.
DBC is a hybrid correction method that combines the Daily Translation (DT) method and LOCI. First, the LOCI method is used to correct precipitation occurrence frequency to ensure that the corrected data matches the observed precipitation frequency at the monthly scale for the reference period. Then, the DT method is applied to correct the frequency distributions of precipitation and temperature. DT is a bias correction method based on distribution mapping, which adjusts the climate series for future scenarios by using the differences (for temperature) or ratios (for precipitation) between the observational data and the simulated data across percentiles in the reference period. Specifically, the corrected temperature (Tadj,d) and precipitation (Padj,d) for the future period are calculated as Equations (3) and (4):
Tadj,d = Tfut,d + (Tobs,QTref,Q)
Padj,d = Pfut,d × (Pobs,Q/Pref,Q)
Q represents the specific percentiles for each month. To improve accuracy, DT uses 100 integral percentiles to perform the calculation for each month to ensure a more accurate representation of the non-linear characteristics of the climate series.
Since the LOCI method is specifically designed for correcting precipitation, only the DBC method is applied to correct temperature data. For precipitation data, both LOCI and DBC methods are compared and analyzed. Based on the CMFD observational data, the precipitation and temperature data from the four CMIP6 models are bias-corrected. The Mean Absolute Error (MAE), Root Mean Squared Error (RMSE), Bias, and Pearson Correlation Coefficient (R) for the corrected and uncorrected models are computed to select the optimal method, using the CMFD data from the validation period as the reference.

2.3.2. WRF-Hydro Model Construction and Calibration

WRF-Hydro, developed by the National Center for Atmospheric Research (NCAR), is an atmospheric–hydrological coupling modeling system capable of simulating runoff processes at fine spatial resolutions. In this study, WRF-Hydro v5.2 is employed, which includes functional modules for surface runoff, groundwater runoff, river network flow routing, and base flow. The data required for running the WRF-Hydro model include meteorological driving data, static geographical data, and Digital Elevation Model (DEM) data.
The meteorological driving data used in this study are sourced from CMFD reanalysis data and include key variables such as temperature, pressure, specific humidity, wind speed, shortwave radiation, longwave radiation, and precipitation rate. In this study, the main hydrological modules include surface runoff, saturated subsurface flow, channel routing, and baseflow. The NoahMP land surface model is used (10 km resolution, 2 m soil column with four layers: 10, 30, 60, 100 cm). Surface runoff is simulated using the D8 maximum slope method, channel routing with a grid-based diffusion wave model, and subsurface/baseflow with an exponential bucket model. The static geographical data are extracted and interpolated using the geogrid program from the WRF Preprocessing System (WPS) based on the default global static geographical database. These data include important geographical information such as elevation, land use, vegetation type, soil type, initial soil state, and vegetation cover. The digital elevation data are derived from the HydroSHEDS dataset, which is optimized for hydrological analysis and accurately reflects surface drainage characteristics.
WRF-Hydro, being a distributed atmospheric–hydrological coupled model, includes many complex parameters, and due to its long runtime, it is difficult to calibrate all parameters. To improve runoff simulation efficiency, this study selects seven key parameters, identified as significantly affecting the runoff process, for calibration based on a study by Huang et al. [28] conducted in the Yangtze River Basin. These seven key parameters are: infiltration coefficient (REFKDT), deep effective runoff coefficient (SLOPE), pore size distribution index (BEXP), saturated soil moisture content (SMCMAX), soil saturated hydraulic conductivity (DKSAT), surface roughness (OVROUGHRTFAC), and Manning’s roughness coefficient (MannN).
To address the issue that traditional basin-wide calibration methods fail to accurately reflect sub-basin heterogeneity, this study proposes a two-stage calibration method. First, the hydrological characteristics of each sub-basin are considered, and independent calibration is performed for each sub-basin. Then, based on the sub-basin calibration results, the main stream basin is calibrated. Compared to the traditional basin-wide calibration approach, the advantage of this method is that it significantly improves parameter representativeness and simulation accuracy by finely characterizing the heterogeneity of sub-basins.
Before calibrating the parameters, the period from 1979 to 1981 is treated as a “warm-up” period to obtain more reasonable initial conditions. To improve calibration efficiency, the WRF-Hydro offline model is used to simulate the runoff process from June to October 1982. The simulated flow is compared with observed flow to identify the parameter set that best fits the actual runoff process.
To save computation time while ensuring simulation accuracy, a manual stepwise approach is used to calibrate the model parameters. The basic steps of the stepwise approach are as follows: first, the calibration order of each parameter is determined, and initial values, calibration ranges, and step sizes are set for each parameter. Then, based on the first parameter’s calibration range and step size, runoff simulations are performed for different parameter values, and the corresponding evaluation metrics are calculated. Other parameters are kept at their initial values, and the parameter value that optimizes the evaluation metric is selected. Subsequently, the second parameter is calibrated, ensuring that the first parameter uses the previously calibrated value, while other parameters remain unchanged. Finally, an iterative process is conducted, updating the results with each iteration, using the previous iteration’s results as the initial values for the next, until the results of consecutive iterations converge, thus determining the optimal parameter values.

3. Results

3.1. CMIP6 Simulation Data Bias Evaluation and Correction Results

3.1.1. CMIP6 Simulation Data Bias Evaluation

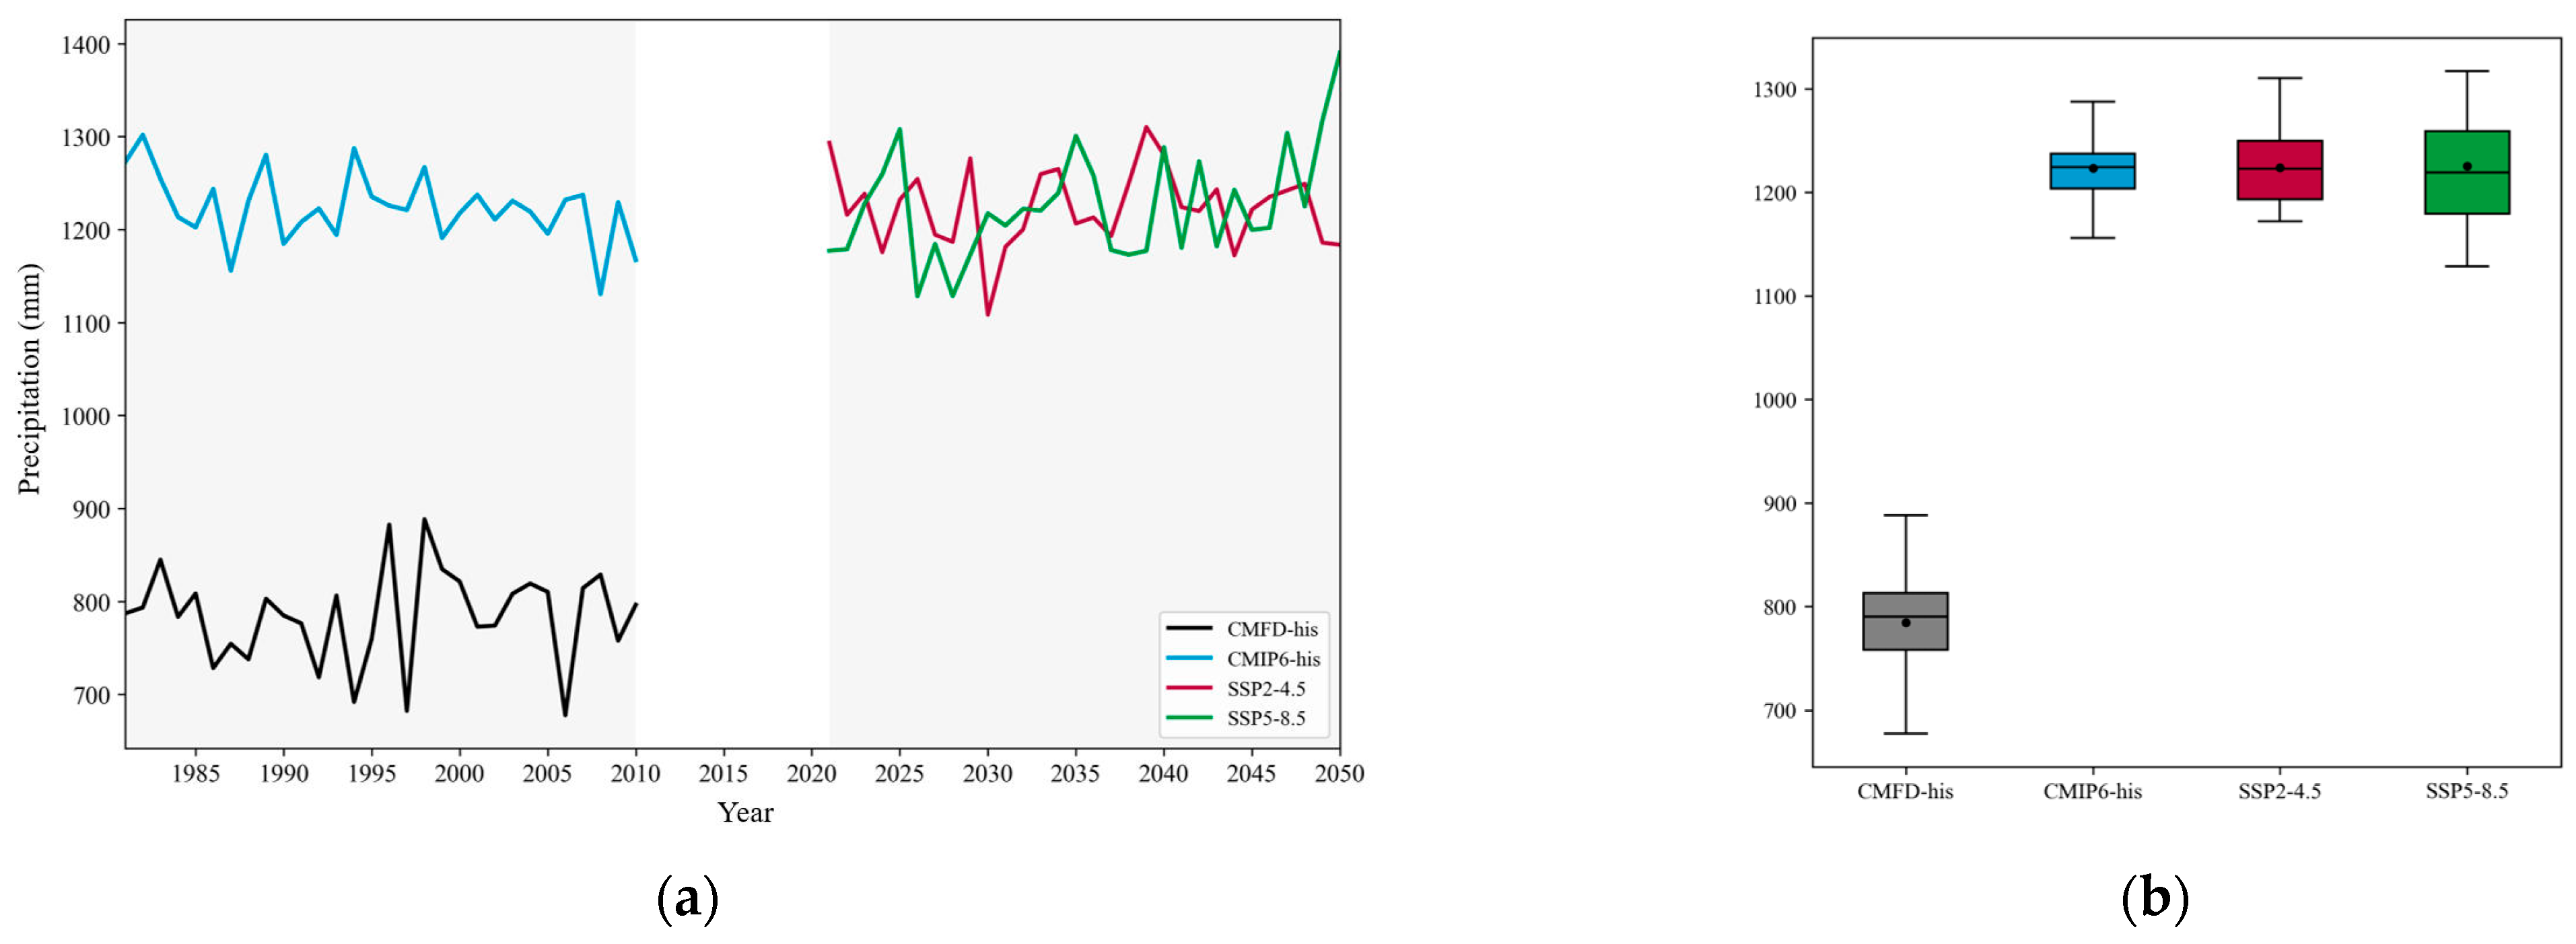
This study evaluates the suitability of CMIP6 model data for the Upper Yangtze River Basin in terms of precipitation and temperature, identifying biases between the simulated data and observational data. The results provide a scientific basis for subsequent bias correction and future scenario analysis. It can be observed that, compared to the historical baseline, there is no significant trend in precipitation under the different future climate scenarios, with the multi-year average precipitation maintaining around 1200 mm, similar to the baseline period (Figure 2). The precipitation in the SSP5-8.5 scenario shows greater variation than in the SSP2-4.5 scenario. The CMFD historical baseline precipitation ranges between 700 and 900 mm. In comparison, the ensemble mean of the models shows annual precipitation in the range of 1100 to 1400 mm, significantly higher than the CMFD observational values.
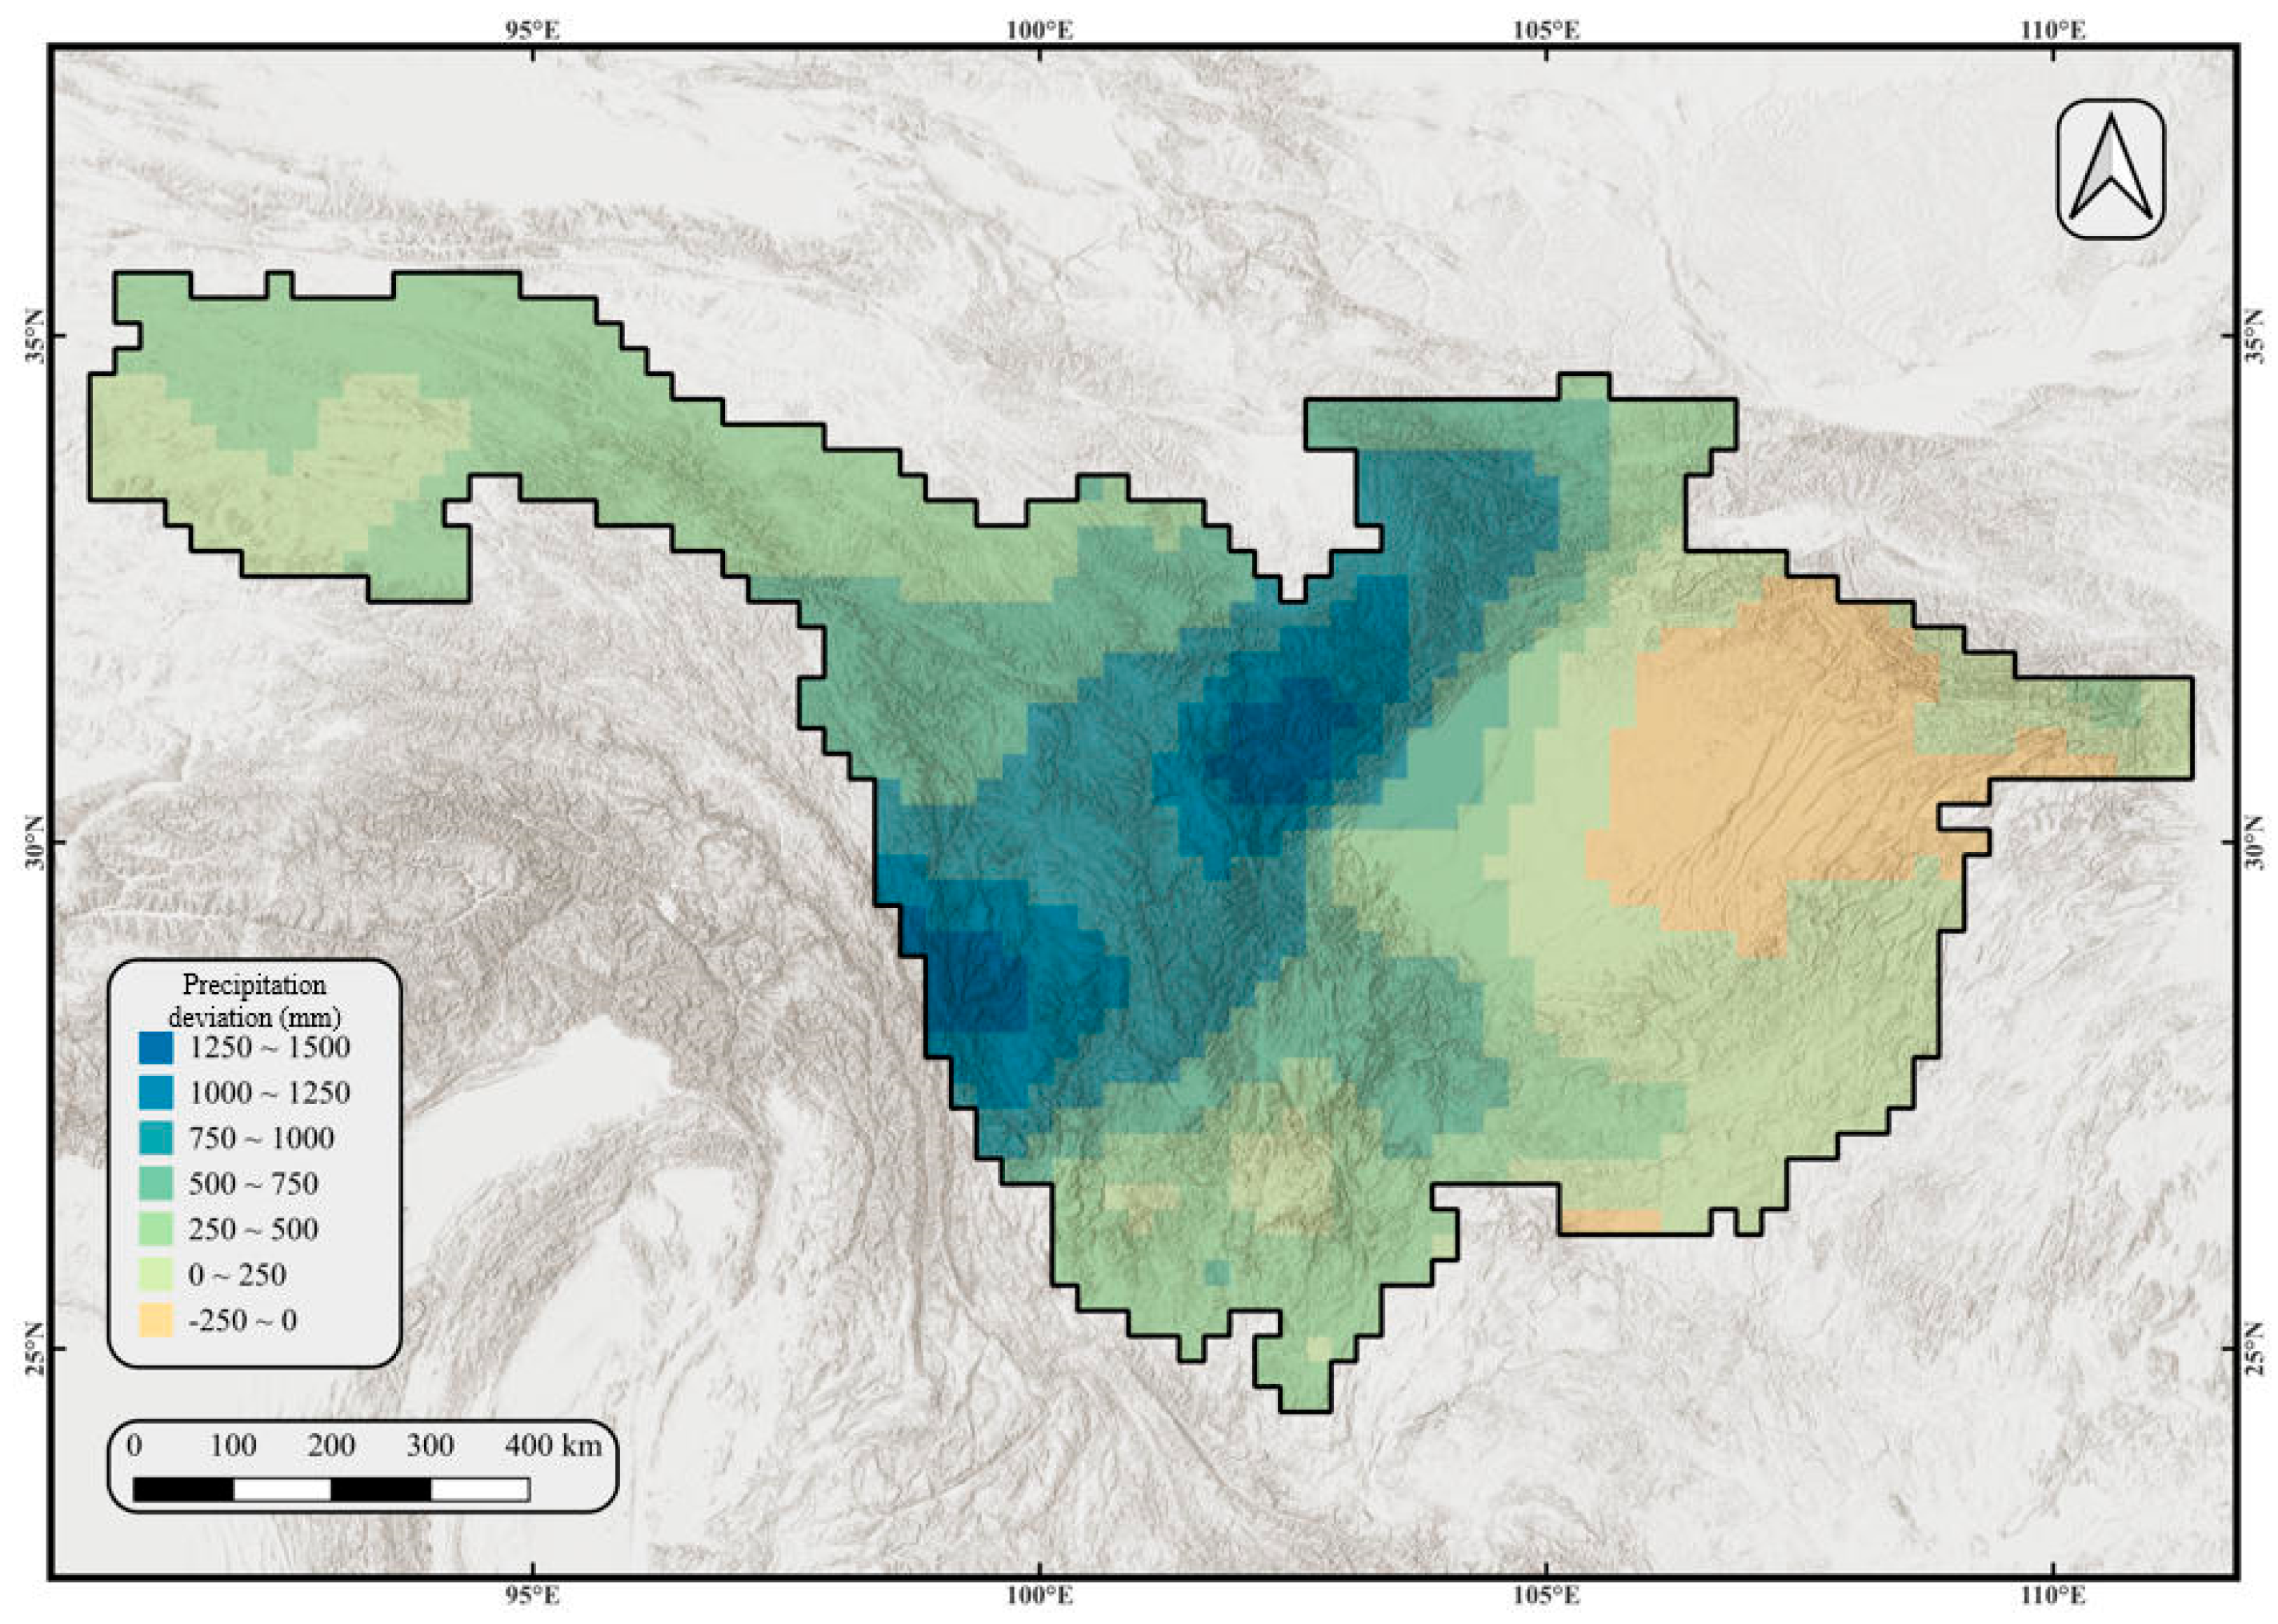
Figure 3 presents the spatial distribution of the multi-model ensemble mean simulated precipitation. A significant regional difference is observed: in the eastern Sichuan Basin and the southeastern boundary of the basin, the multi-model ensemble mean precipitation is 0 to 250 mm lower than the CMFD observations. However, in most other regions of the basin, the multi-model ensemble mean precipitation exceeds the CMFD observed values, particularly in the complex topography of the Hengduan Mountains and the transition zone between the Sichuan Basin and the Western Sichuan Plateau, where precipitation biases exceed 1000 mm.
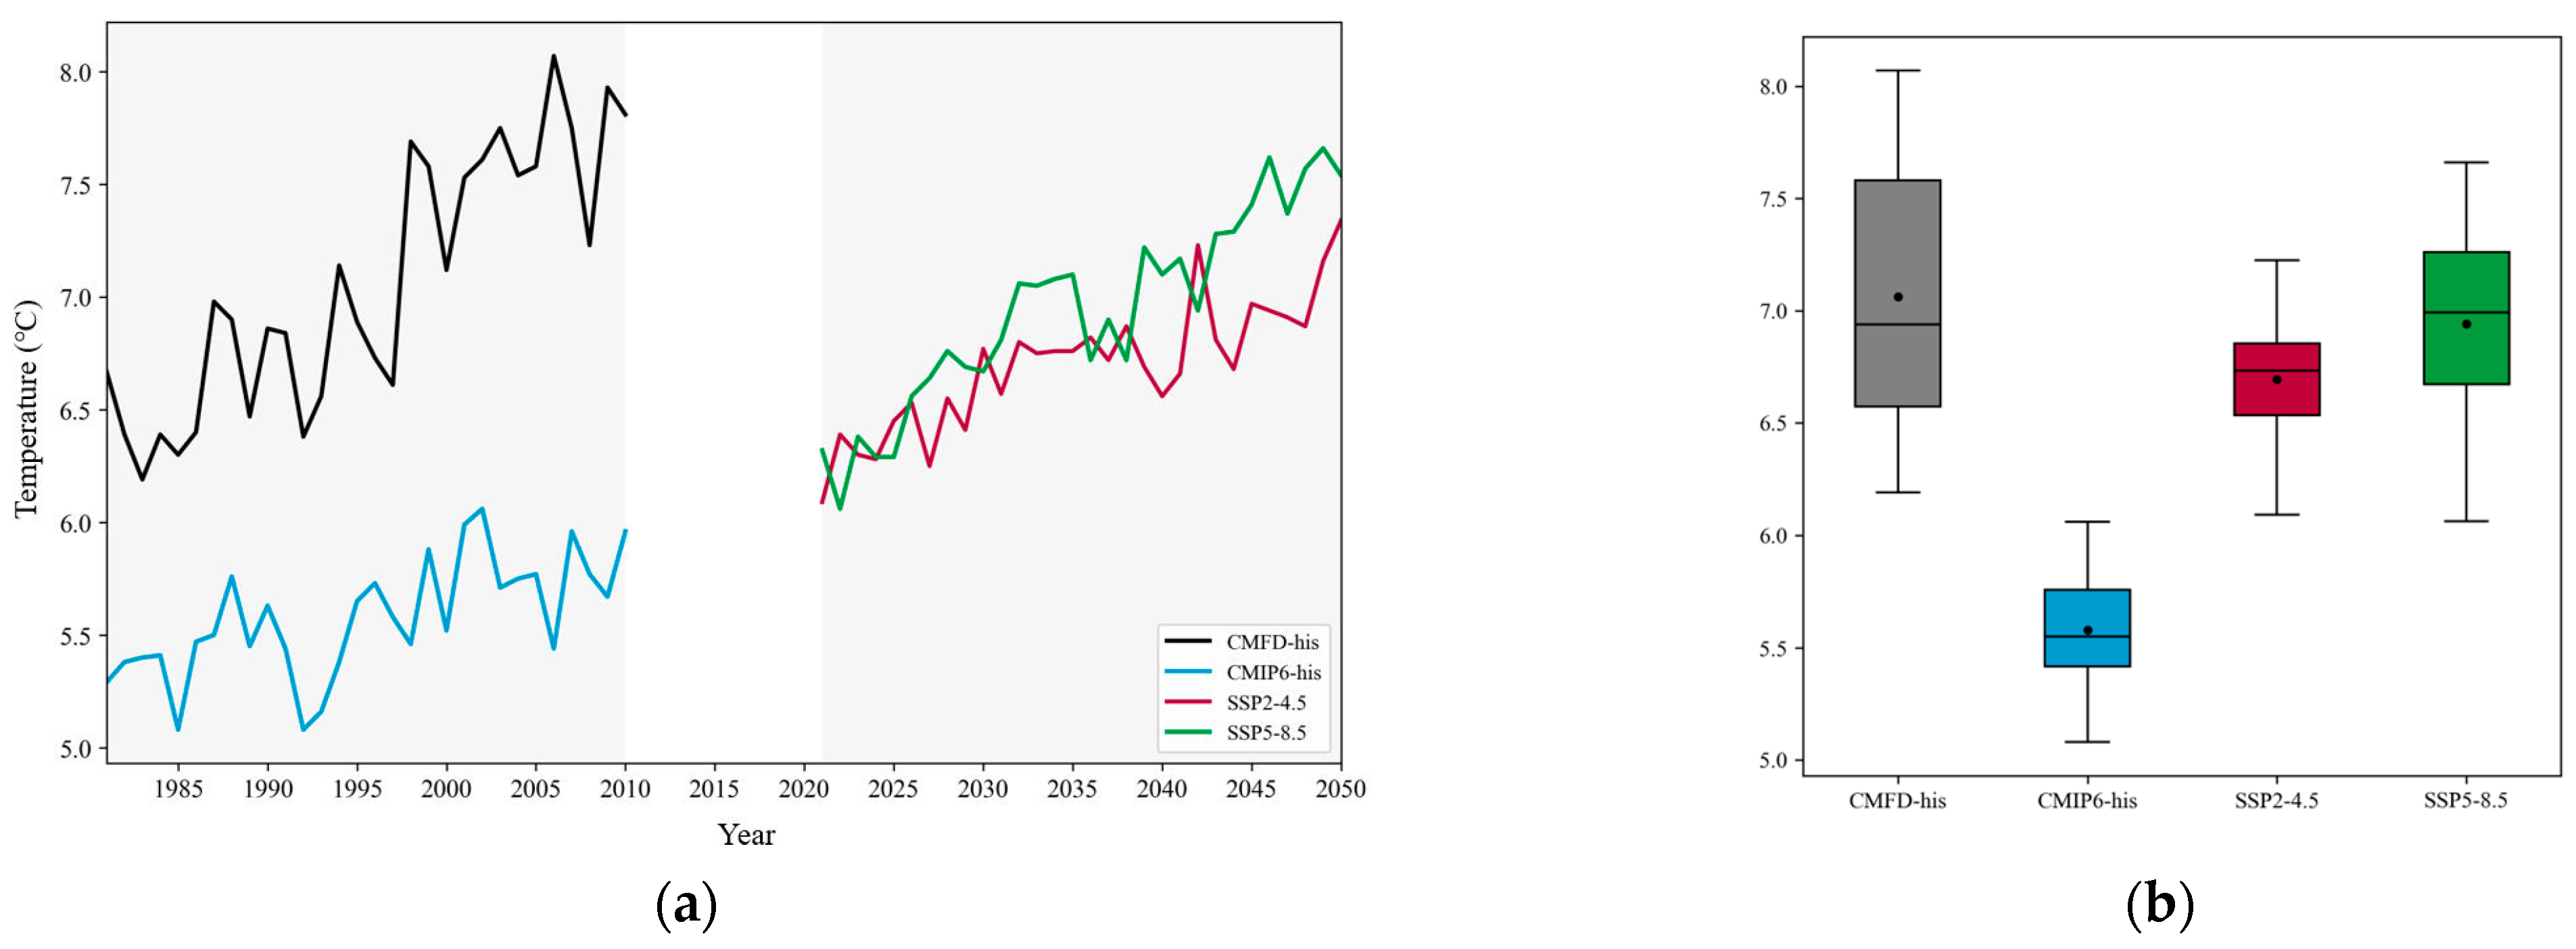
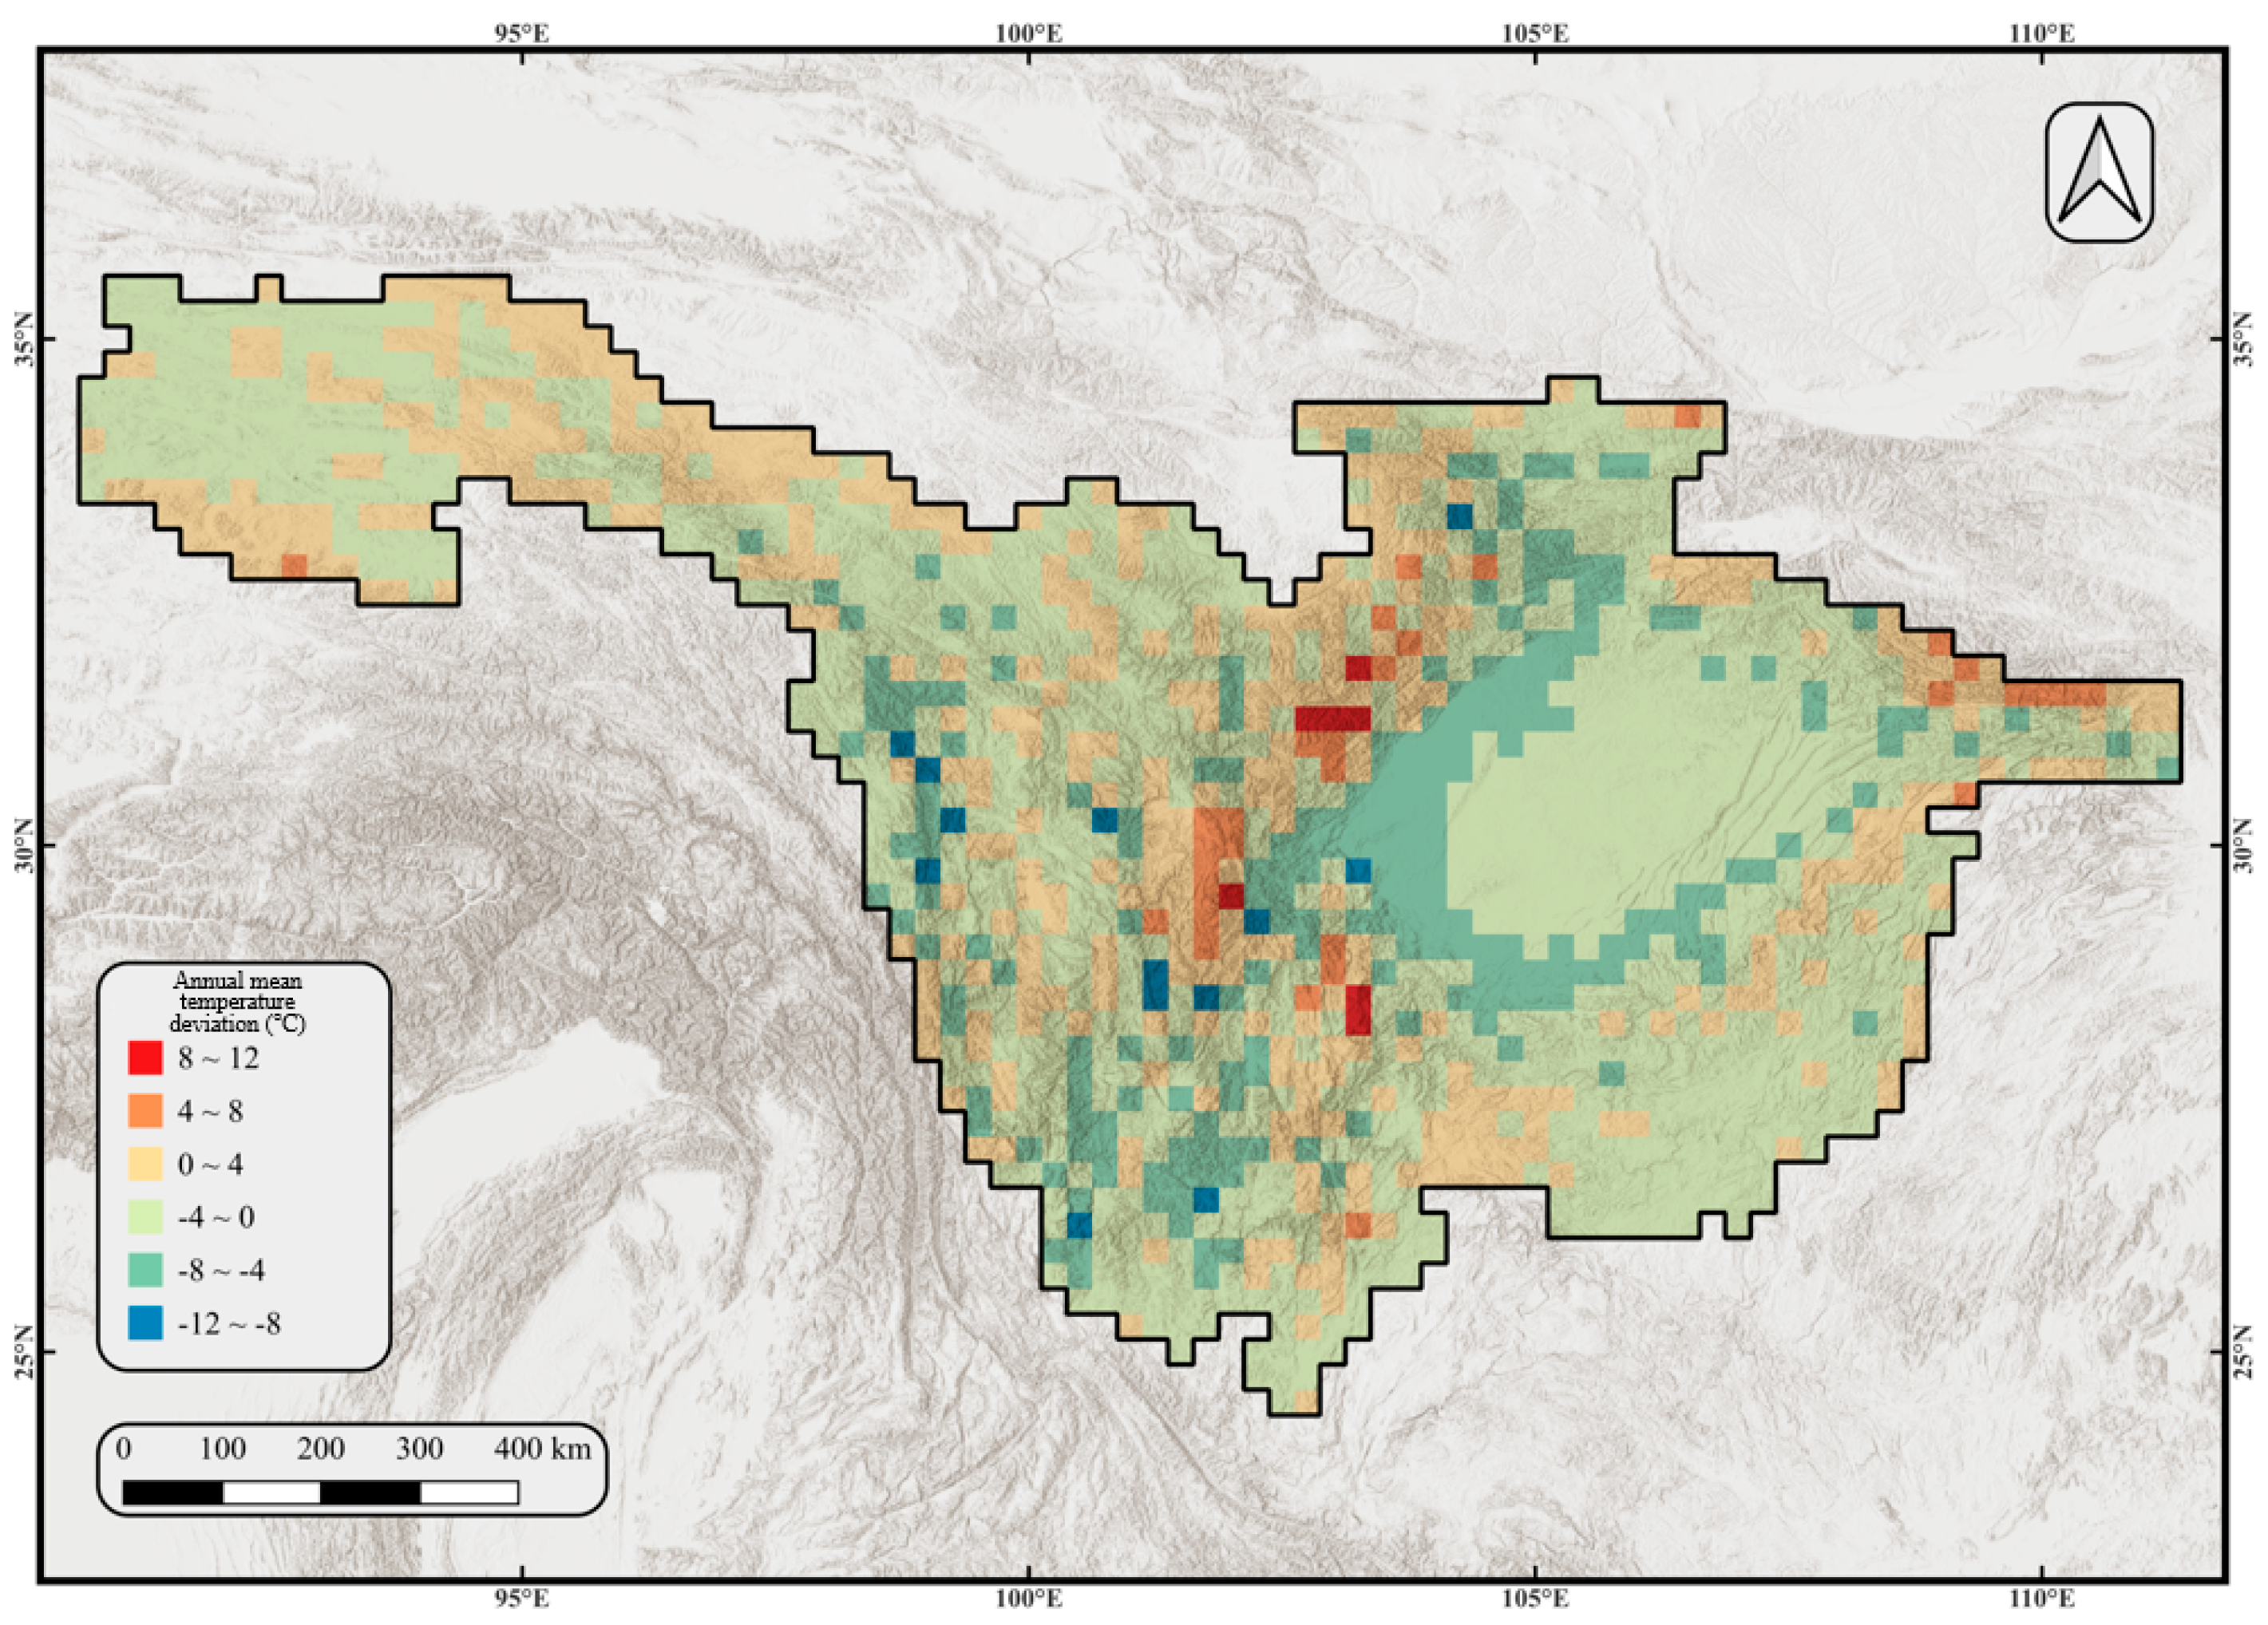
Figure 4 shows that, compared to the historical baseline, the interannual variation in temperature under different future climate scenarios presents a significant increasing trend. In the SSP2-4.5 scenario, the multi-year average temperature rises by 1.12 °C; in the SSP5-8.5 scenario, the increase is 1.36 °C, with the SSP5-8.5 scenario exhibiting a larger warming magnitude, consistent with the scenario settings. For the historical baseline, the CMFD annual mean temperature is 7.1 °C, while the CMIP6 ensemble mean has a historical annual mean temperature of only 5.5 °C, significantly lower than the CMFD observed values. Figure 5 shows that the multi-model ensemble simulated temperatures are lower than the CMFD observed values in most areas of the basin, especially in the western and southern Sichuan Basin and the mountainous gorges traversed by rivers, where the temperature bias is most prominent, reaching 4–8 °C. In contrast, areas where the temperature exceeds CMFD observations are sporadically distributed in some mountainous regions, without clear spatial regularity (Figure 6).
To improve the temperature simulation accuracy of the CMIP6 models and reduce the bias with CMFD observations, temperature data correction is needed. By applying an appropriate correction method, the accuracy of simulated temperatures can be effectively enhanced, significantly improving the model’s performance in temperature simulation.

3.1.2. CMFD Data Suitability Evaluation

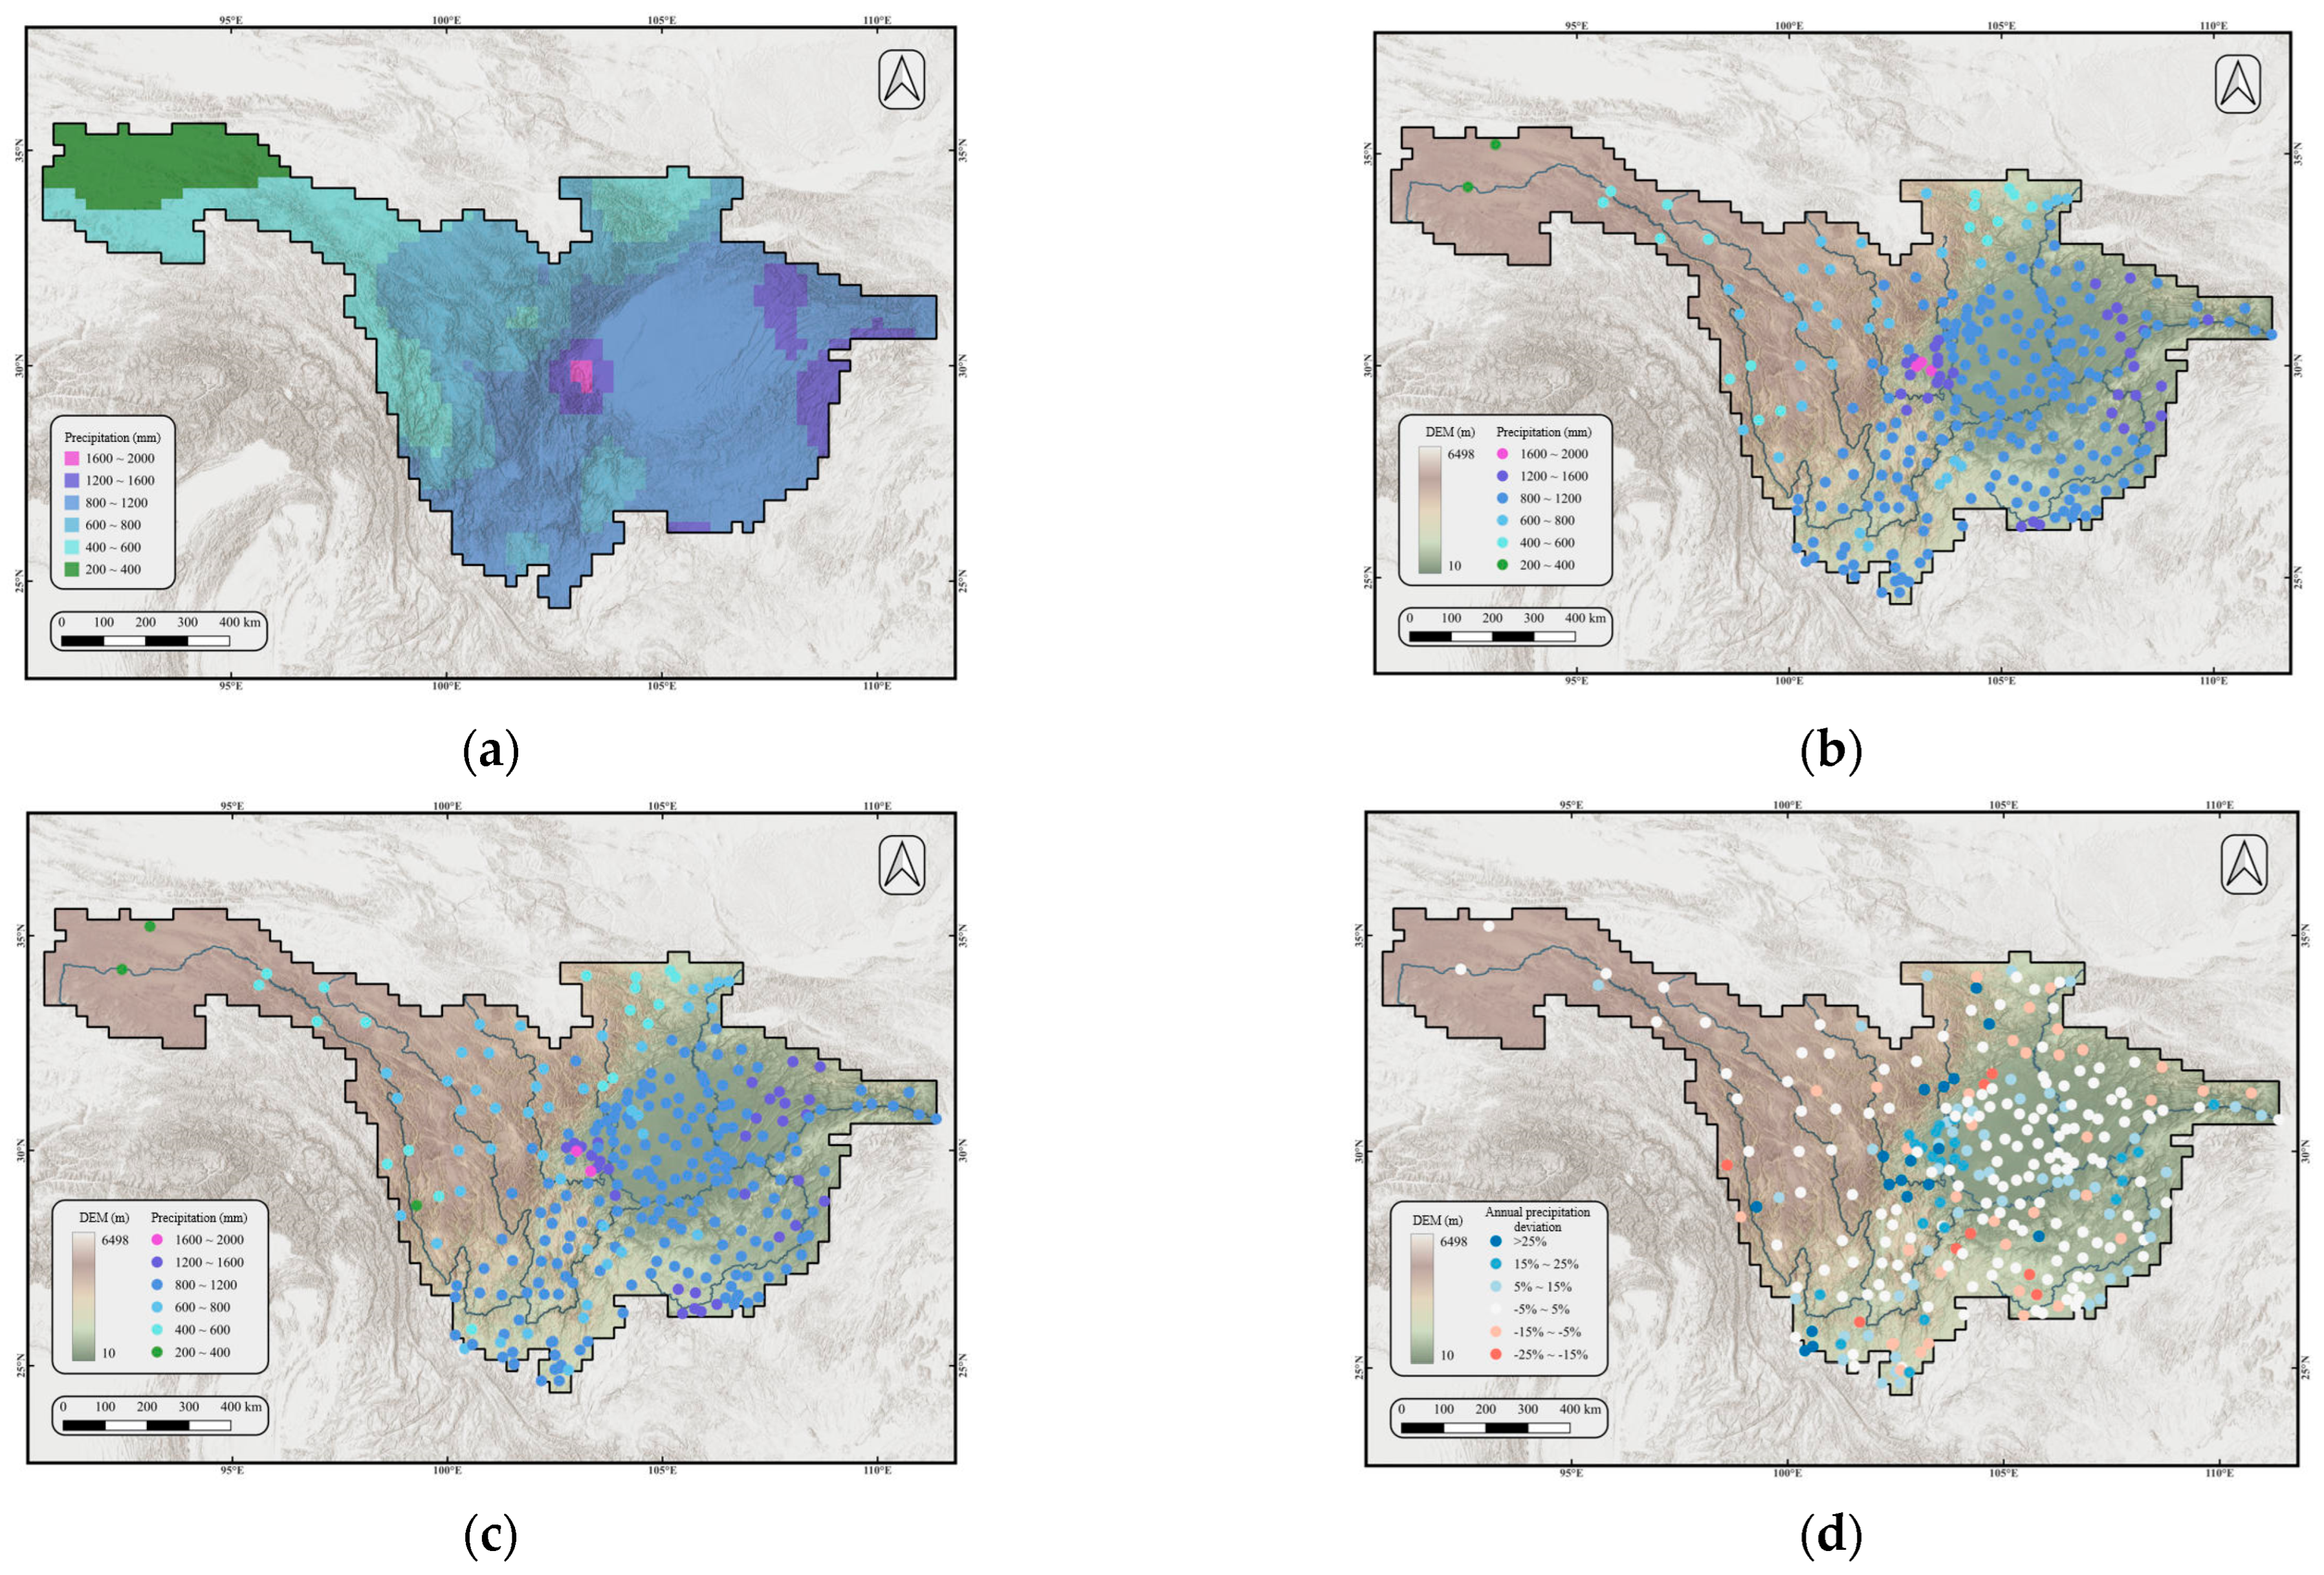
To ensure the feasibility of using CMFD data as observational data for bias correction, this study compares CMFD data with meteorological station observations in terms of precipitation, precipitation frequency, and temperature. The interannual bias, seasonal bias, and spatial distribution characteristics of the data are analyzed. The minimum annual precipitation value is 198 mm, and the maximum is 1748 mm (Figure 6). In terms of spatial distribution, the Qinghai–Tibet Plateau, which is located at the headwaters of the Upper Yangtze River Basin, has the lowest annual precipitation, while the Sichuan Basin and the transition zone between the Western Sichuan Plateau and the Sichuan Basin receive significantly higher precipitation than other areas. Among the station sites, 53.5% have errors within ±5% between the CMFD data and observed data, 15.4% of sites have CMFD values lower than observed values, and 31.3% have CMFD values higher than observed values. Notably, about 6% of the sites have CMFD values that exceed the observed values by 25%, primarily in the transition zones between the basin and plateau, as well as at the basin boundary. These regions have significant topographical variation, which contributes to a larger spatial discrepancy in precipitation.
From the seasonal perspective, summer, being the season with the most precipitation in the Upper Yangtze River Basin, shows that 54.9% of the stations have errors within ±5% between the two datasets, and 75.7% of stations have errors within ±10%, performing better than other seasons (Figure 7). In contrast, winter, the season with the least precipitation, shows significantly larger positive and negative biases due to the low baseline of precipitation. CMFD data correctly reflects the long-term average annual precipitation and seasonal precipitation characteristics of the Upper Yangtze River Basin but tends to overestimate precipitation compared to meteorological station observations.
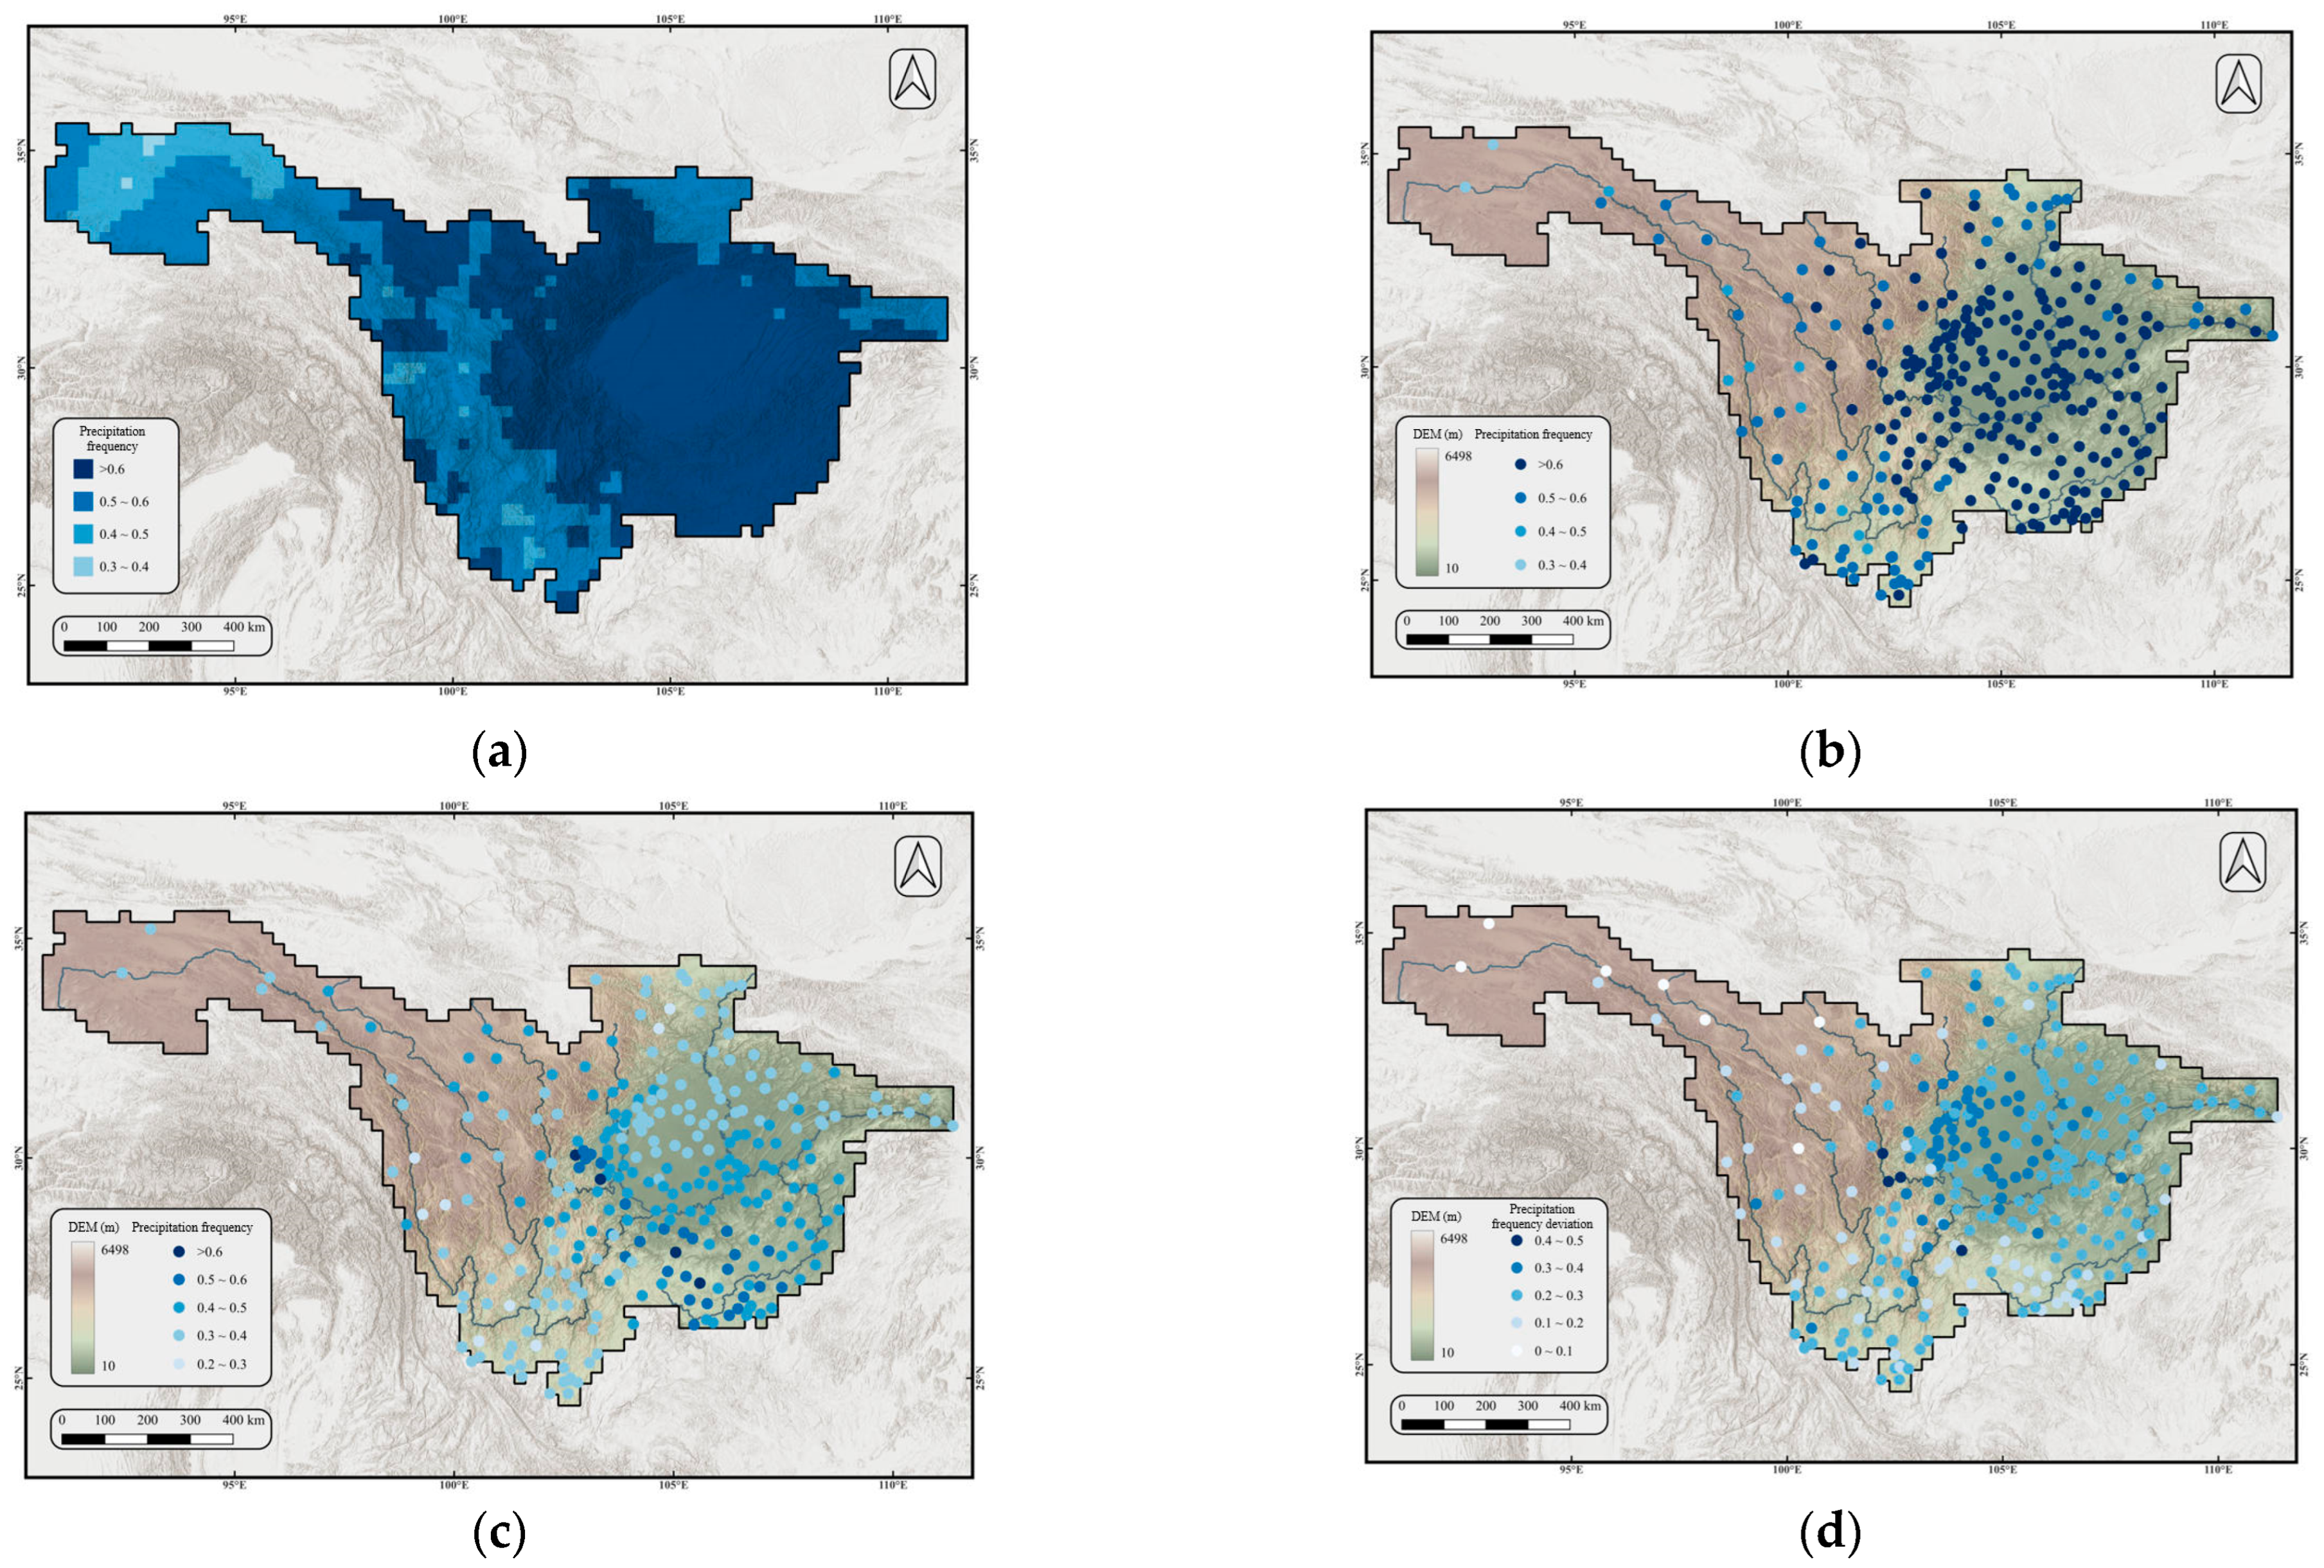
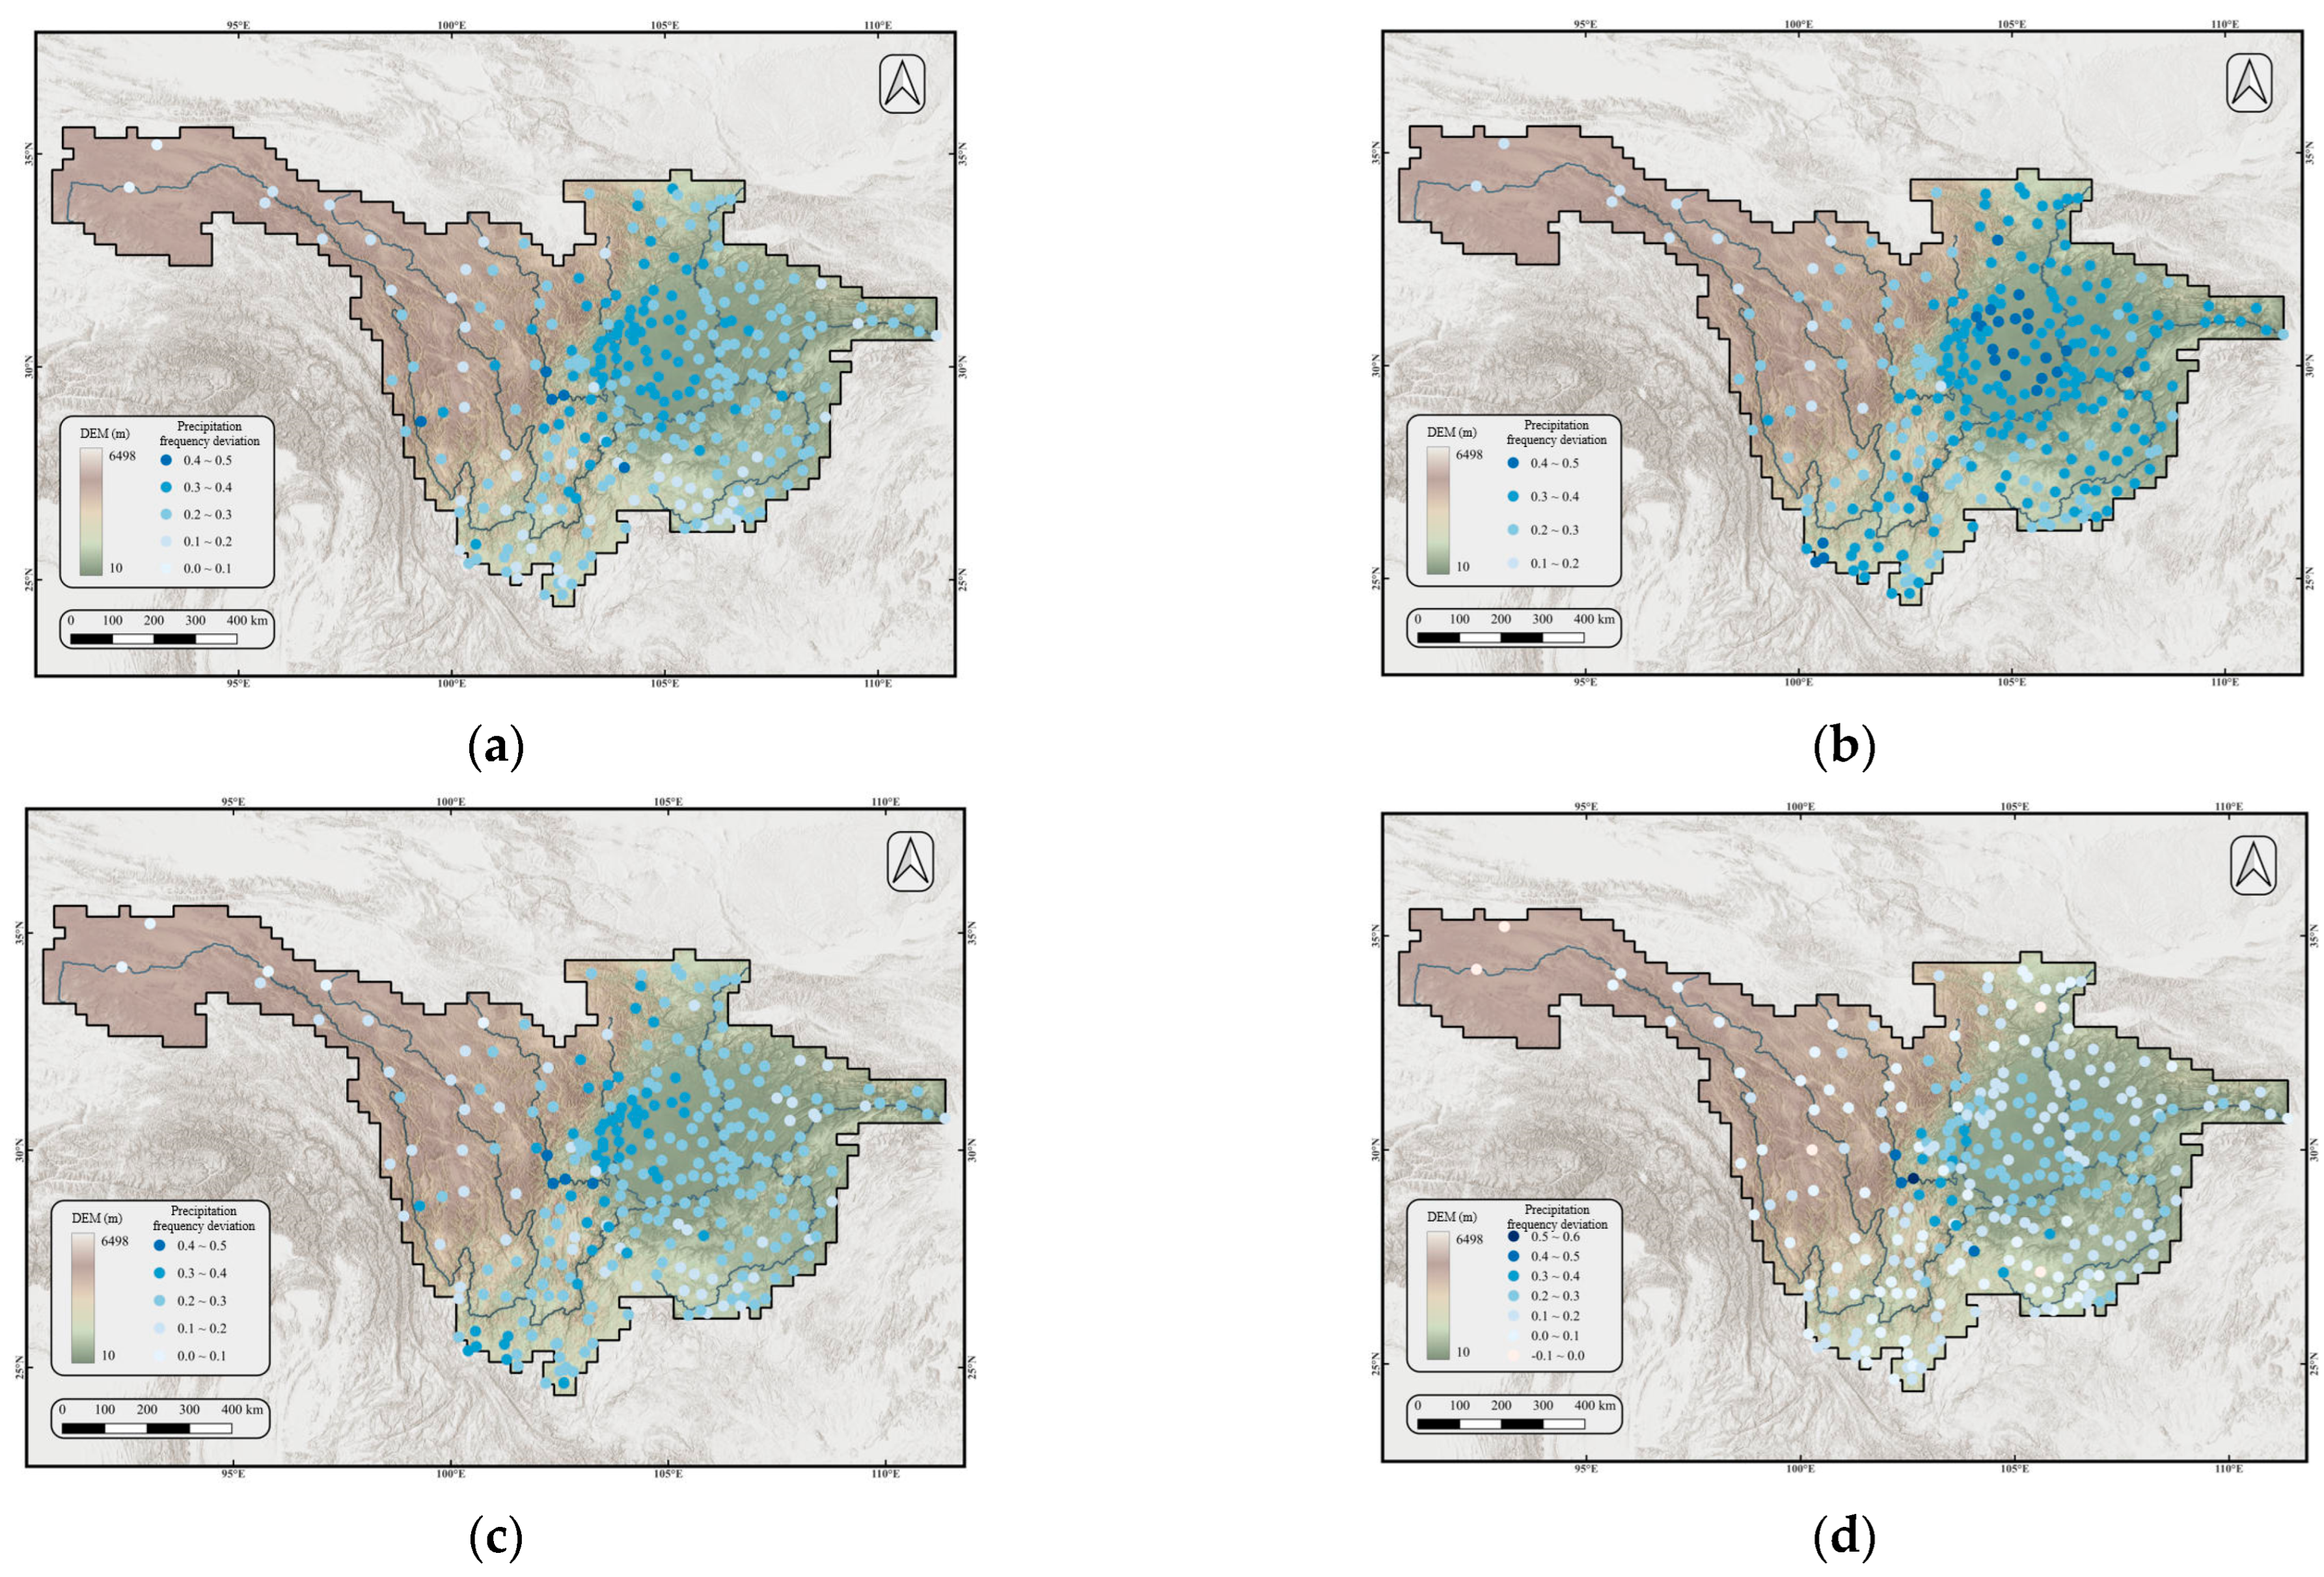
In terms of precipitation frequency, a rain day is defined as a day with daily precipitation ≥ 0.1 mm. From 1981 to 2010, the average precipitation frequency of CMFD data in the Upper Yangtze River Basin was 0.62, with a maximum value of 0.85, and 96% of the sites exceeded 0.5, while only 10.6% of the meteorological stations observed values exceeding 0.5 (Figure 8). The CMFD data significantly overestimate the precipitation frequency compared to actual observations, with ten sites exhibiting biases exceeding 100%, i.e., CMFD precipitation frequency is twice that of the observed frequency. For example, in Ya’an, known as the “rain city,” the observed multi-year average precipitation frequency is 0.57, while the CMFD precipitation frequency is 0.78, clearly indicating that the CMFD data greatly overestimates precipitation frequency. On the seasonal scale, the western and central parts of the Sichuan Basin show a significant positive bias in frequency deviation, especially in the summer, with a deviation exceeding 0.4, while winter shows the smallest bias in precipitation frequency, and spring and autumn exhibit higher deviations in the transition zones between the basin and plateau (Figure 9).
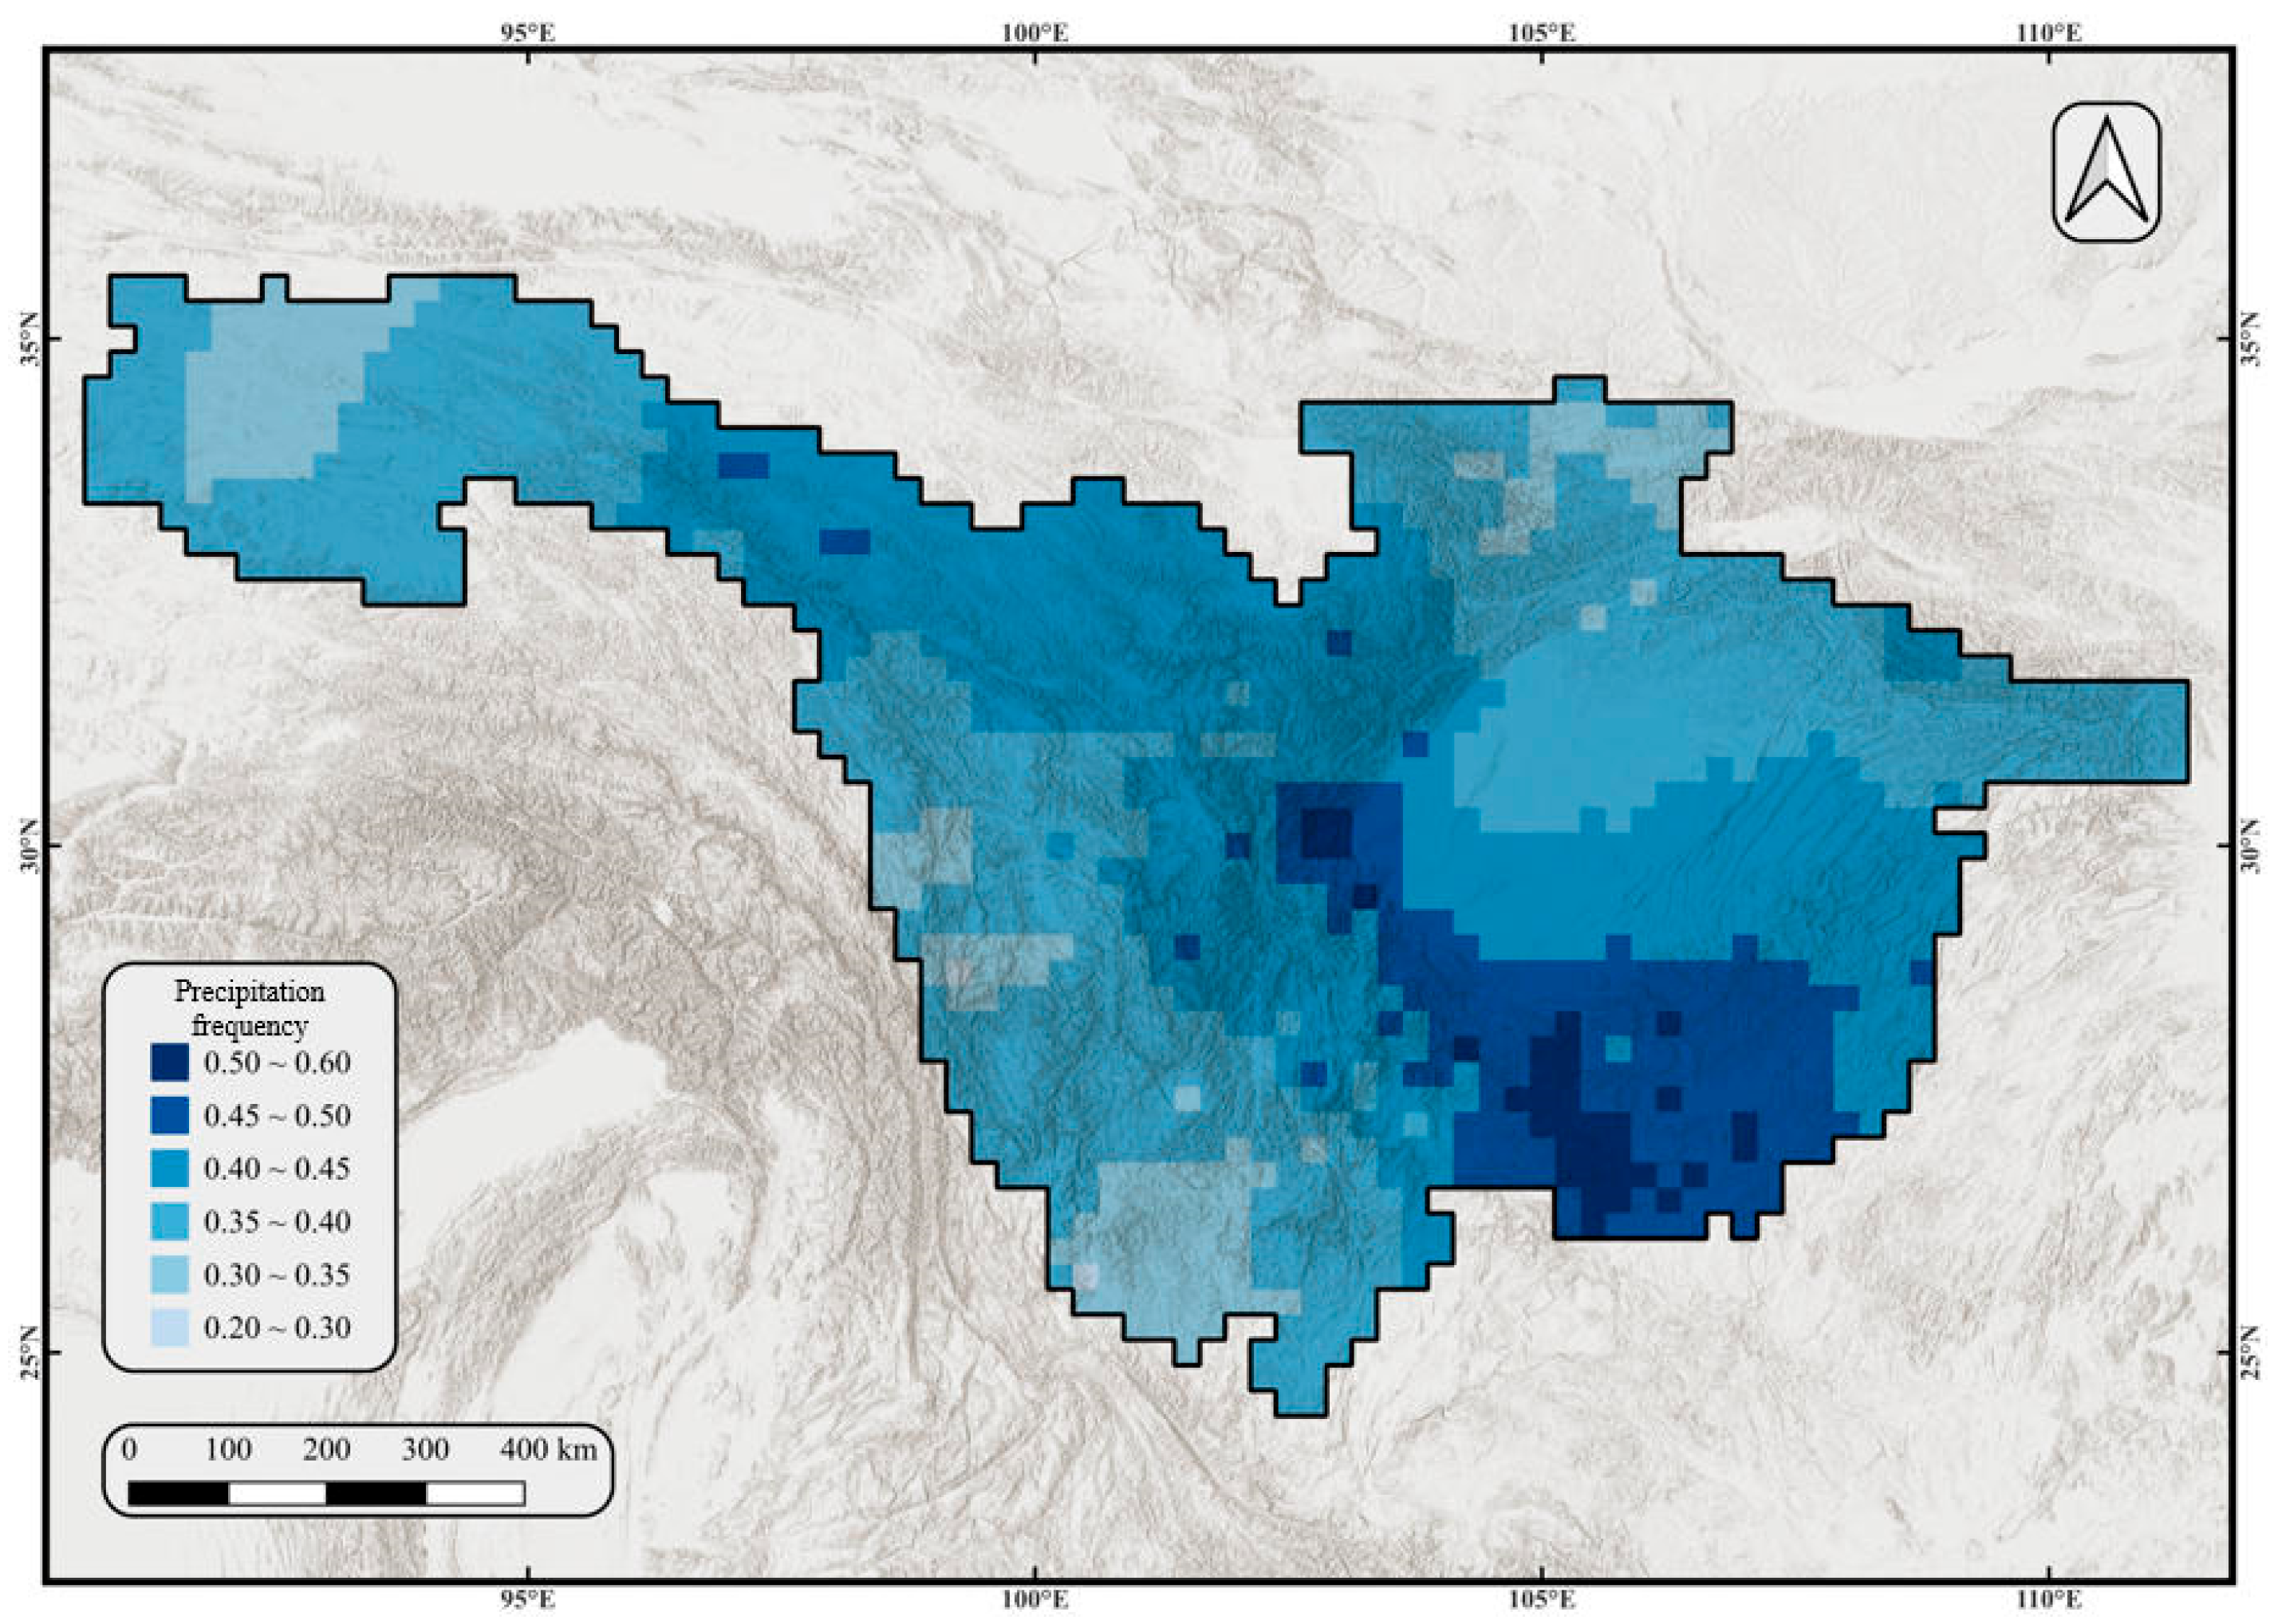
To adjust the CMFD precipitation frequency, the monthly average precipitation frequency for each station was calculated, and the monthly average precipitation frequency for the entire Upper Yangtze River Basin was interpolated. CMFD data were adjusted so that the monthly average precipitation frequency matched the observed frequency. This method allows for the determination of the rain-day threshold for each grid, with values below this threshold set to zero. This adjustment improves the frequency issue caused by using a uniform 0.1 mm threshold across the entire basin, which had resulted in an overestimation of precipitation frequency (Figure 10). After frequency adjustment, the multi-year annual average precipitation of CMFD data for the entire Upper Yangtze River Basin decreased from 826 mm to 784.9 mm, a reduction of 5%, effectively mitigating the overestimation of precipitation.
Based on the evaluation of CMFD data in terms of precipitation and precipitation frequency for the Upper Yangtze River Basin, it is found that CMFD can generally reflect the precipitation characteristics of the basin, both annually and seasonally. However, the precipitation is slightly overestimated compared to meteorological station observations, and the precipitation frequency from 1981 to 2010 is significantly higher than actual observations, with overestimations at both the annual and seasonal scales. After correcting the precipitation frequency, the multi-year average annual precipitation for the entire upper basin decreased by 5%, effectively improving the overestimation of precipitation, and the precipitation characteristics became more consistent with the observed data. CMFD data now meet the requirements for observational data in bias correction and provide more reliable data support for subsequent research.
The annual mean temperature in the region shows a significant correlation with elevation (Figure 11). In the lower elevation Sichuan Basin, the annual mean temperature generally remains between 16 and 20 °C, while the temperature in higher elevation areas is mostly below 4 °C. CMFD data match the observed data well in the Sichuan Basin and low-latitude areas: 50.4% of the sites show differences within ±1 °C, and 66.9% show differences within ±2 °C. In these regions, CMFD data accurately reflect the actual temperature distribution. However, in mountainous and high-altitude areas, the CMFD temperatures are generally lower than those observed at meteorological stations. This difference arises from the fact that CMFD data represent larger regional averages, whereas meteorological stations are typically located in mountain valleys or populated areas, where the temperature is relatively higher due to topographical sheltering and human activities.
From a seasonal perspective, the differences between CMFD data and station observations of mean temperature across the four seasons are generally consistent with the annual mean temperature differences (Figure 12). The CMFD temperature data show high consistency with actual observations in the Sichuan Basin and low-latitude areas, with accuracy sufficient to meet research needs. Although deviations exist in high-altitude regions, these primarily arise from the characteristics of spatial resolution and do not affect their applicability in large-scale studies. Given that CMFD data have undergone systematic quality control, their reliability and consistency have been repeatedly validated. For most climate analysis purposes, the current accuracy is adequate; additional processing may introduce uncertainty without substantially improving results. Therefore, considering the high consistency in major regions, large-scale applicability, and assured data quality, the CMFD temperature dataset is deemed suitable for this study without further adjustment.

3.1.3. Bias Correction Results of CMIP6 Data

The historical baseline period (1981–2010) was divided into a reference period (1981–1995) and a validation period (1996–2010). Using CMFD observations, bias correction was applied to precipitation and temperature data from four CMIP6 models. The CMFD during the validation period served as the observational reference to calculate RMSE, MAE, Bias, and R for each model and the multi-model ensemble mean before and after correction. Spatial comparisons of biases in precipitation and temperature between corrected and uncorrected data against observations were performed to evaluate correction effectiveness.
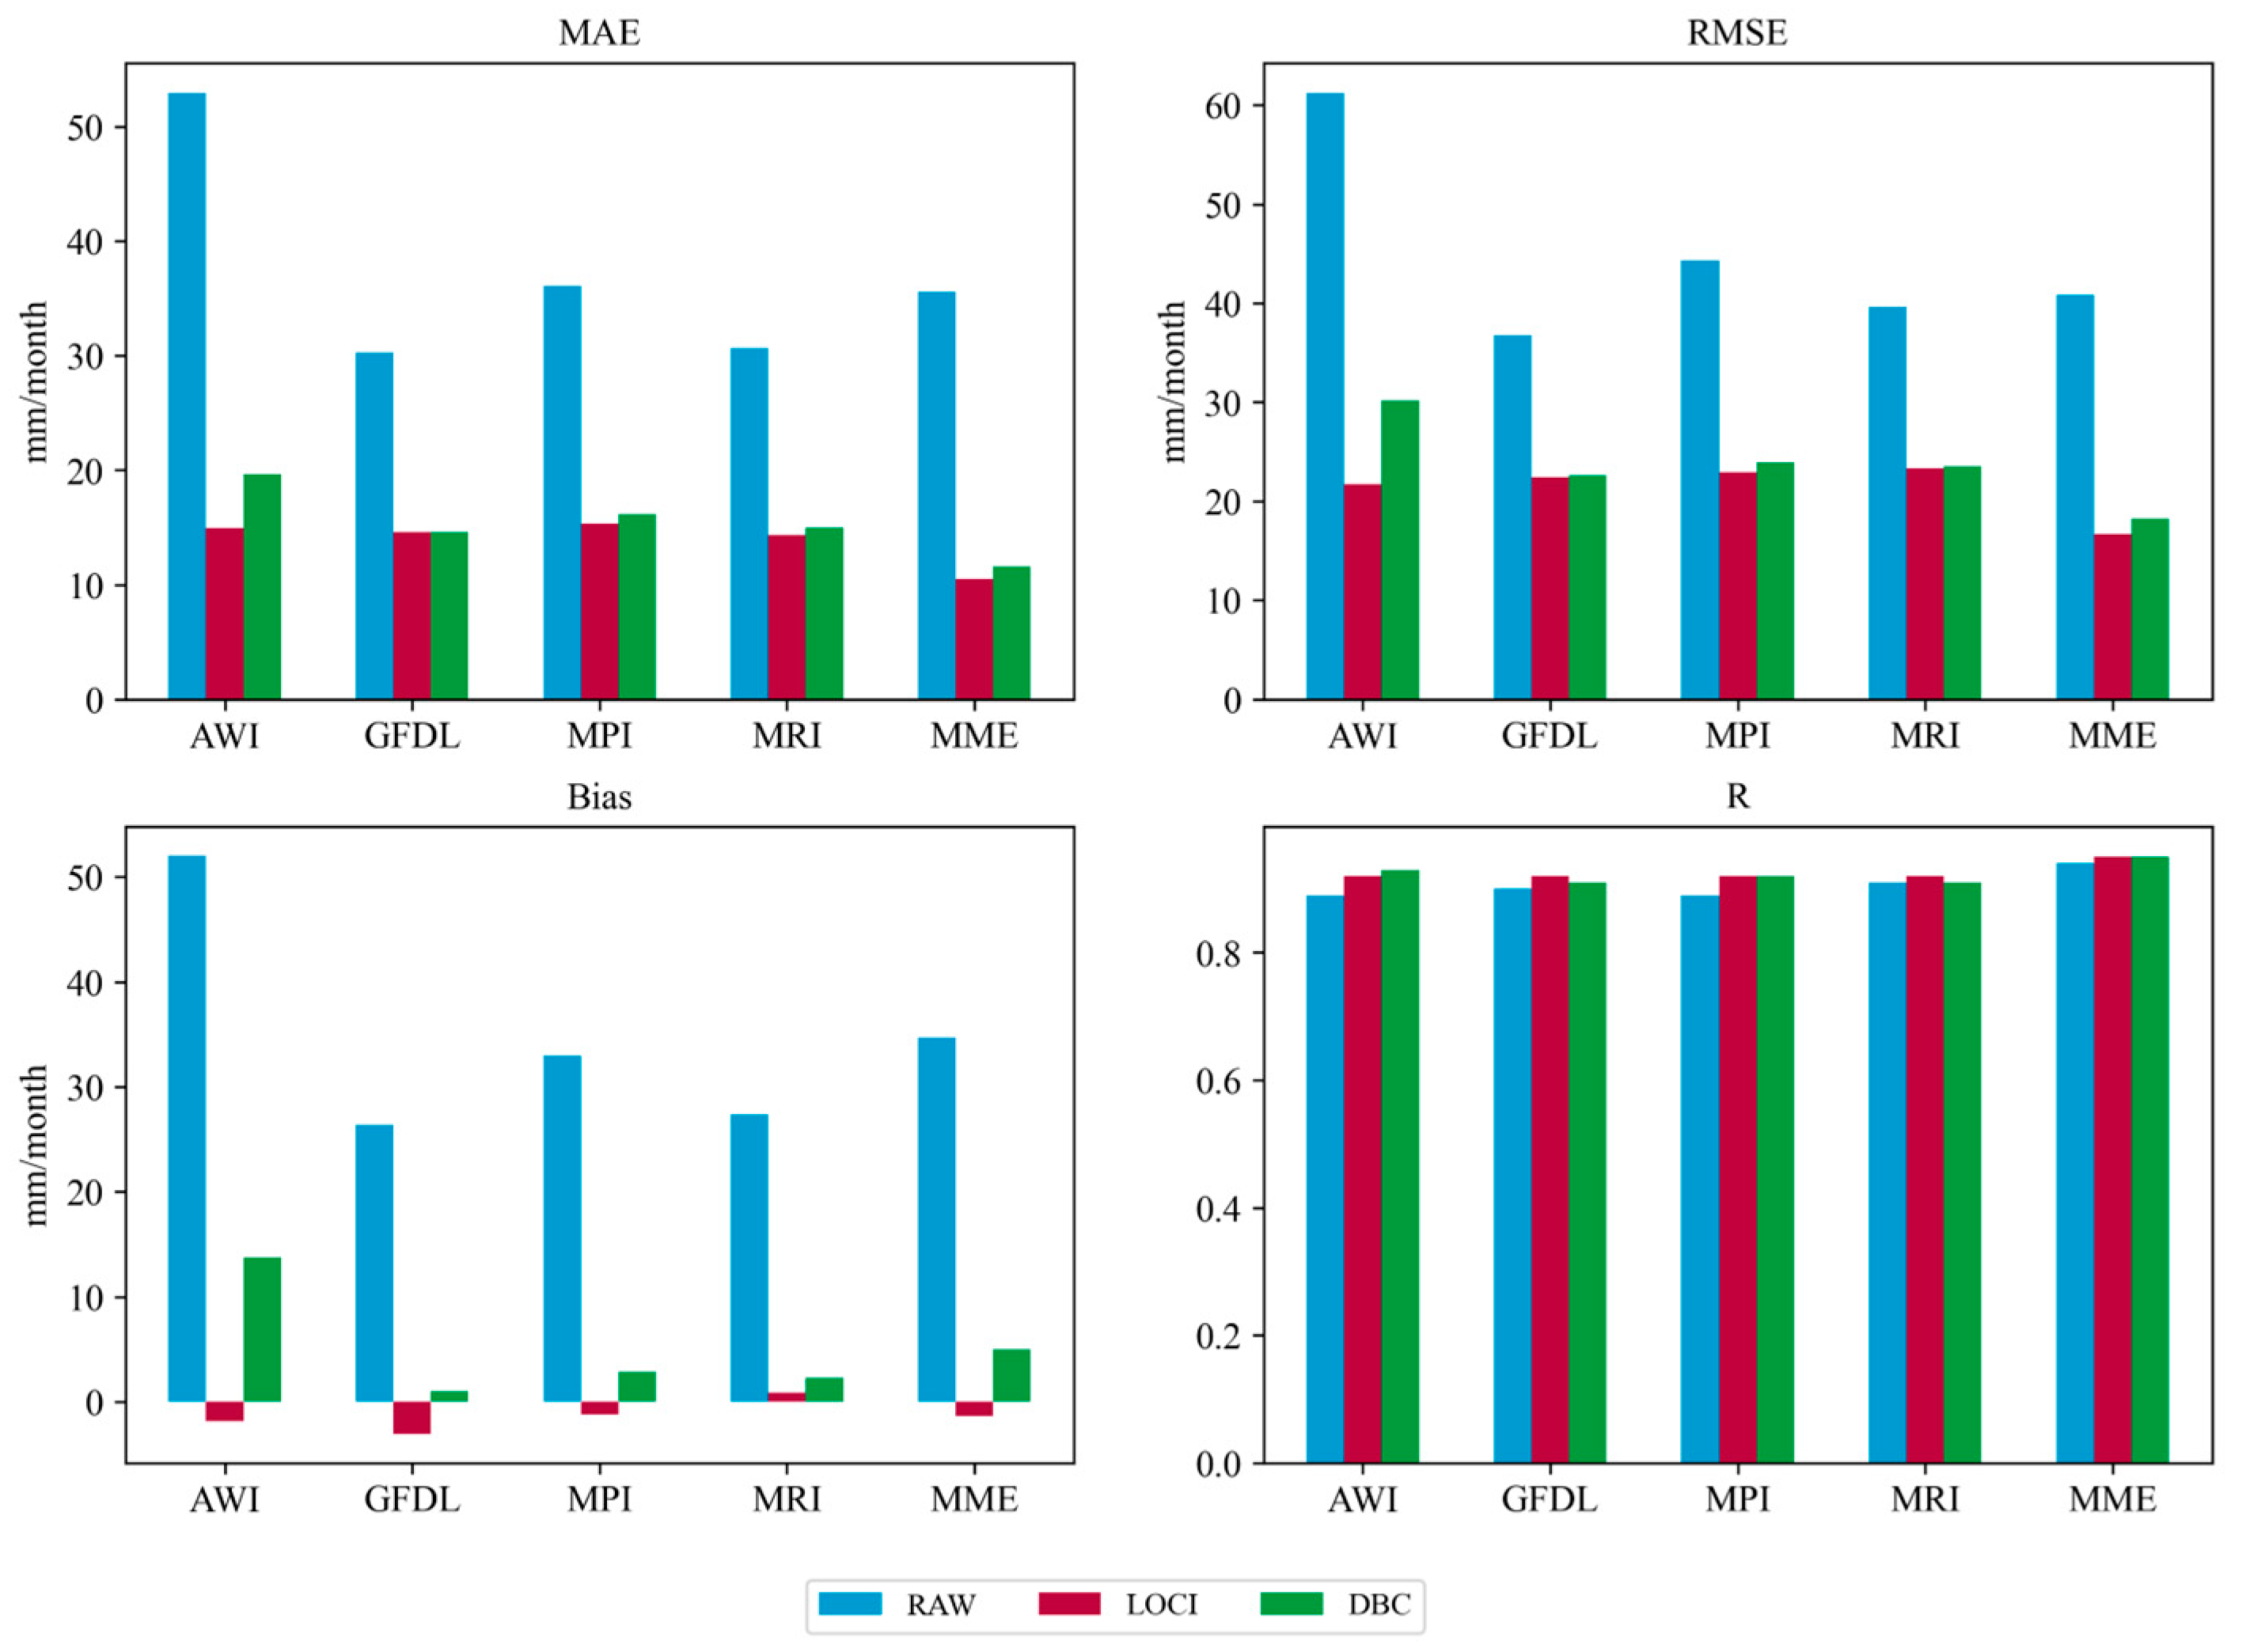
Figure 13 presents the differences in precipitation between the ensemble mean and observations during 1996–2010 before and after bias correction. The results indicate that, in most parts of the upper Yangtze River Basin, precipitation simulations were significantly overestimated prior to correction. In the complex terrain of the Hengduan Mountains, the precipitation bias exceeded 1000 mm, while in the eastern Sichuan Basin, precipitation was underestimated by approximately 0–250 mm. Figure 14 shows evaluation metrics of the precipitation bias correction, where RAW denotes the uncorrected ensemble mean. Bar chart evaluations reveal that, before correction, the ensemble mean had an MAE and Bias of about 35 mm and an RMSE of around 40 mm.
After applying bias correction, the performance of CMIP6 precipitation simulations improved substantially. Using LOCI and DBC methods, the differences between the ensemble mean and observations were significantly reduced. In most regions, the differences were within ±100 mm, while in a few areas, deviations remained but were limited to −300 to 400 mm. Post-correction, the MAE decreased to around 10 mm, and the RMSE dropped to approximately 17 mm, indicating a marked reduction in errors. Before correction, the GFDL-ESM4 model exhibited the best precipitation simulation among the five models; however, after correction, the ensemble mean demonstrated superior performance in precipitation simulations.
Comparative evaluation of the two correction methods shows that the LOCI method yielded slightly lower values for MAE, RMSE, and Bias compared to the DBC method. Spatially, although LOCI produced somewhat larger biases than DBC in the southeastern basin, its performance was more favorable in the Sichuan Basin and the transitional zone toward the western plateau, where precipitation is higher. Overall, LOCI is more suitable for precipitation bias correction in the upper Yangtze River Basin.
Figure 15 illustrates the differences in temperature between the ensemble mean and observations during 1996–2010 before and after bias correction. The results clearly indicate that, across most of the upper Yangtze River Basin, simulated temperatures were markedly underestimated prior to correction. This underestimation was particularly pronounced in the western and southern Sichuan Basin, reaching approximately 4–8 °C. Figure 16 shows the evaluation metrics of the temperature bias correction, where RAW denotes the uncorrected ensemble mean. The bar chart indicates that, before correction, the ensemble mean had an MAE and Bias of around 1.6 °C and an RMSE of about 2.0 °C. These differences likely result from a combination of model-related and observational uncertainties. The coarse spatial resolution and simplified parameterization schemes of CMIP6 GCMs limit their ability to represent complex topography and convective precipitation processes in the upper Yangtze River Basin. In addition, CMFD reanalysis data are derived from interpolated ground observations and may underestimate localized extreme precipitation in mountainous regions. Therefore, the discrepancies observed between the model and CMFD data reflect both simulation biases and observational limitations.
After correction, the performance of CMIP6 models in simulating temperature improved significantly (Figure 17). Using the DBC method, the differences between the ensemble mean and observations were substantially reduced: the MAE decreased to approximately 0.8 °C, the RMSE dropped to about 1.0 °C, and the Bias narrowed to −0.4 °C. In most areas, differences were within ±0.5 °C; in a few regions, deviations remained but were limited to −2 to 1 °C. Before correction, the MPI-ESM1-2-HR model provided the best temperature simulations; however, after correction, the ensemble mean achieved the most accurate results. Thus, the DBC method effectively corrected temperature biases in CMIP6 data for the upper Yangtze River Basin.

3.2. Calibration and Validation Results of the WRF-Hydro Model

This study employed the Noah-MP land surface parameterization scheme (horizontal resolution of 10 km) nested with a high-resolution hydrological module (500 m). Meteorological forcing was provided by CMFD reanalysis data. Considering the sensitivity of model parameters, seven key parameters with significant influence on the runoff process—REFKDT, SLOPE, BEXP, SACMAX, DKSAT, OVROUGHRTFAC, and MannN—were selected for calibration. The basin-wide calibration was conducted first, and the optimal values of each parameter are presented in Table 1.
Independent sub-basin calibration was then performed through parallel runoff simulations of four sub-basins. Five representative hydrological stations—Pingshan, Gaochang, Beibei, Wulong, and Yichang—were selected for evaluation. The Nash–Sutcliffe efficiency (NSE), the ratio of the root mean square error to the standard deviation of observations (RSR), and percent bias (PBIAS) were used as performance indicators to assess the accuracy of runoff simulations and determine the optimal parameter values. Since the mainstem of the upper Yangtze River integrates the runoff from the four sub-basins, accurate evaluation of parameter impacts on mainstem runoff requires stable inflows from the sub-basins. Therefore, the optimal parameter values were first determined for each sub-basin independently, and then the mainstem was calibrated. Each sub-basin employed its own set of parameters, thereby avoiding the loss of accuracy that may occur when applying a uniform parameter set across the entire basin. The settings used in sub-basin calibration were consistent with those used in basin-wide calibration.
After calibrating the seven parameters, the WRF-Hydro model for the upper Yangtze River Basin achieved an optimal NSE of 0.85, an optimal RSR of 0.39, and a PBIAS of approximately 0 (Table 2). Compared with basin-wide calibration, the independent sub-basin calibration improved the final NSE by 0.13 and reduced the RSR by 0.14 (Table 3). This indicates a significant improvement in streamflow simulation accuracy, suggesting that independent sub-basin calibration is superior to basin-wide calibration in the upper Yangtze River Basin. The independent calibration of sub-basins allowed key parameters such as infiltration factor, soil hydraulic conductivity, and surface roughness to be optimized according to local conditions, improving the model’s representation of both high-flow and low-flow regimes. This spatially adaptive parameterization effectively reduced systematic errors and enhanced the model’s ability to reproduce basin-wide hydrological processes.
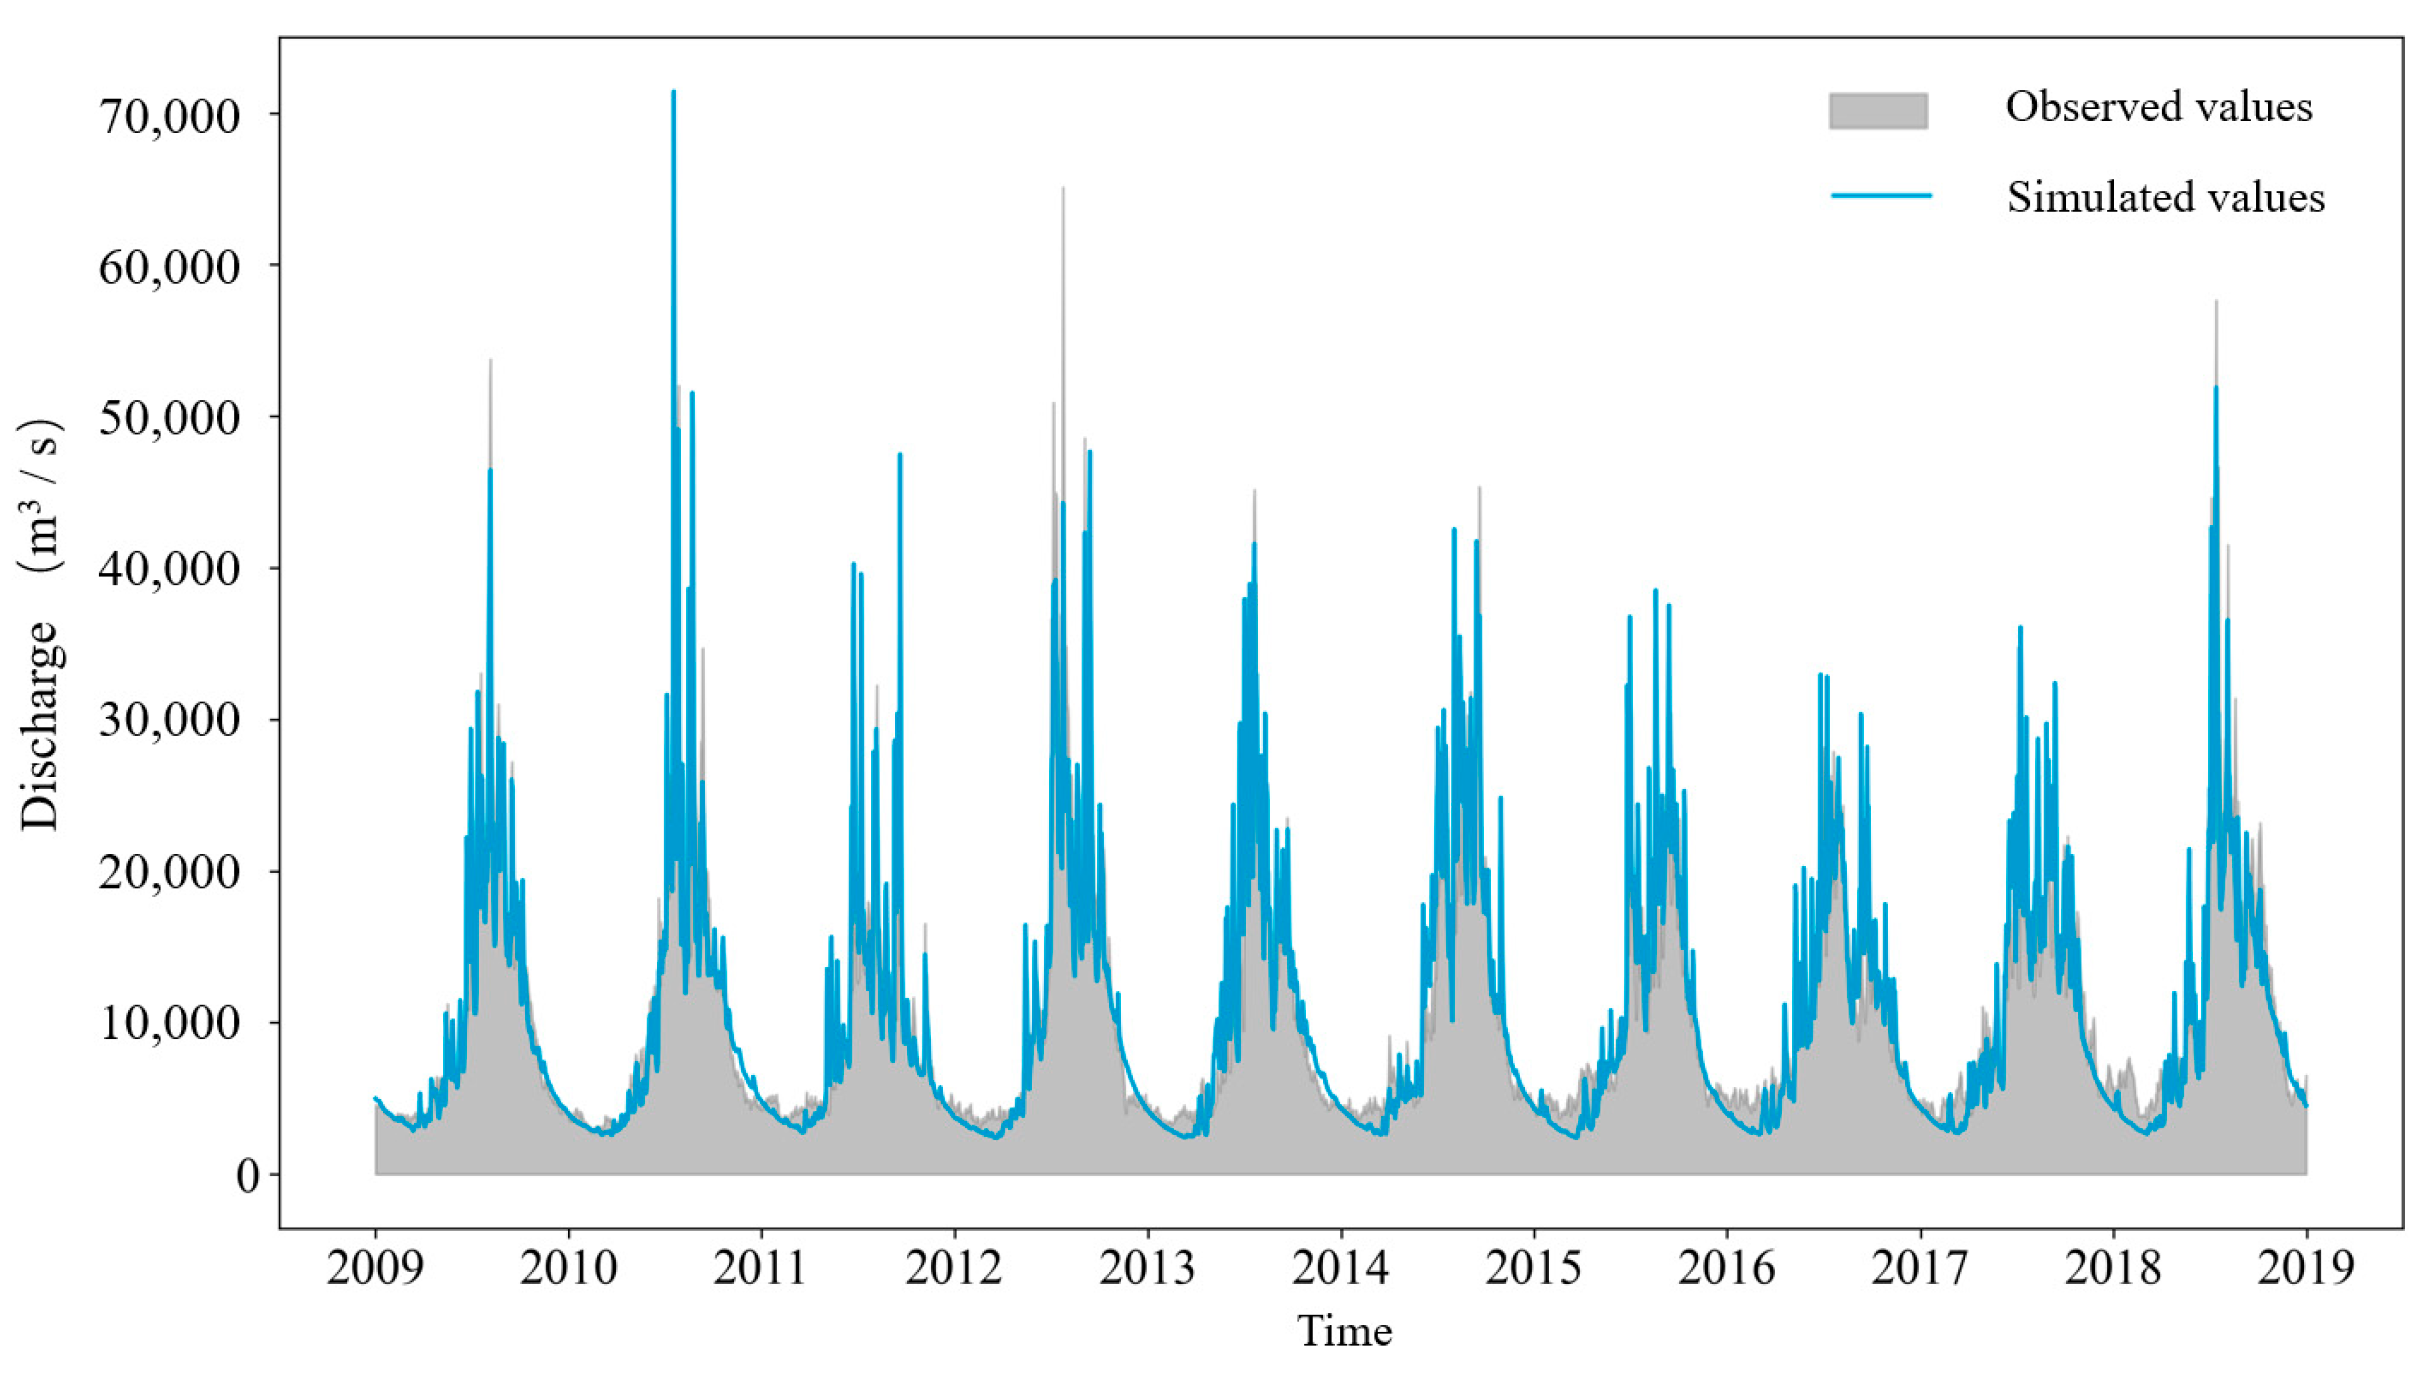
Based on the calibrated parameters, the WRF-Hydro model was validated over the period 2009–2018. Analysis of daily streamflow hydrographs demonstrated good agreement between simulated and observed flows, with the model successfully capturing both peak and low flow characteristics (Figure 17). During the validation period (2009–2018), model performance metrics showed that the NSE of daily streamflow simulations ranged from 0.65 to 0.92, with a multi-year mean of 0.82. For 5-day mean streamflow, NSE ranged from 0.75 to 0.94, with a mean of 0.86; for monthly mean streamflow, NSE ranged from 0.83 to 0.97, with a mean of 0.91 (Table 4). The model successfully reproduced streamflow processes at key hydrological control stations, such as Cuntan Station. These results demonstrate that, following the calibration of seven key parameters, the WRF-Hydro model performs robustly in the upper Yangtze River Basin, and the calibrated model can be directly applied in subsequent hydrological simulations.

3.3. Future Climate Change and Runoff Projections in the Upper Yangtze River Basin

Based on bias-corrected CMIP6 multi-model ensemble (MME) data and the calibrated WRF-Hydro model, this study evaluates the characteristics of climate and runoff changes in the Upper Yangtze River Basin under the SSP2-4.5 and SSP5-8.5 scenarios for the period 2021–2050. By analyzing the contributions of different sub-basins to inflows into the Three Gorges Reservoir and their spatiotemporal variability, this research provides scientific support for adaptive reservoir regulation under future climate conditions.

3.3.1. Climate Variables Analysis

To assess the impact of future climate change on the upper Yangtze River Basin, precipitation and temperature features under SSP2-4.5 and SSP5-8.5 were compared between the historical baseline period (1981–2010) and the future period (2021–2050). The results include interannual variability, seasonal variations, and spatial distribution characteristics.
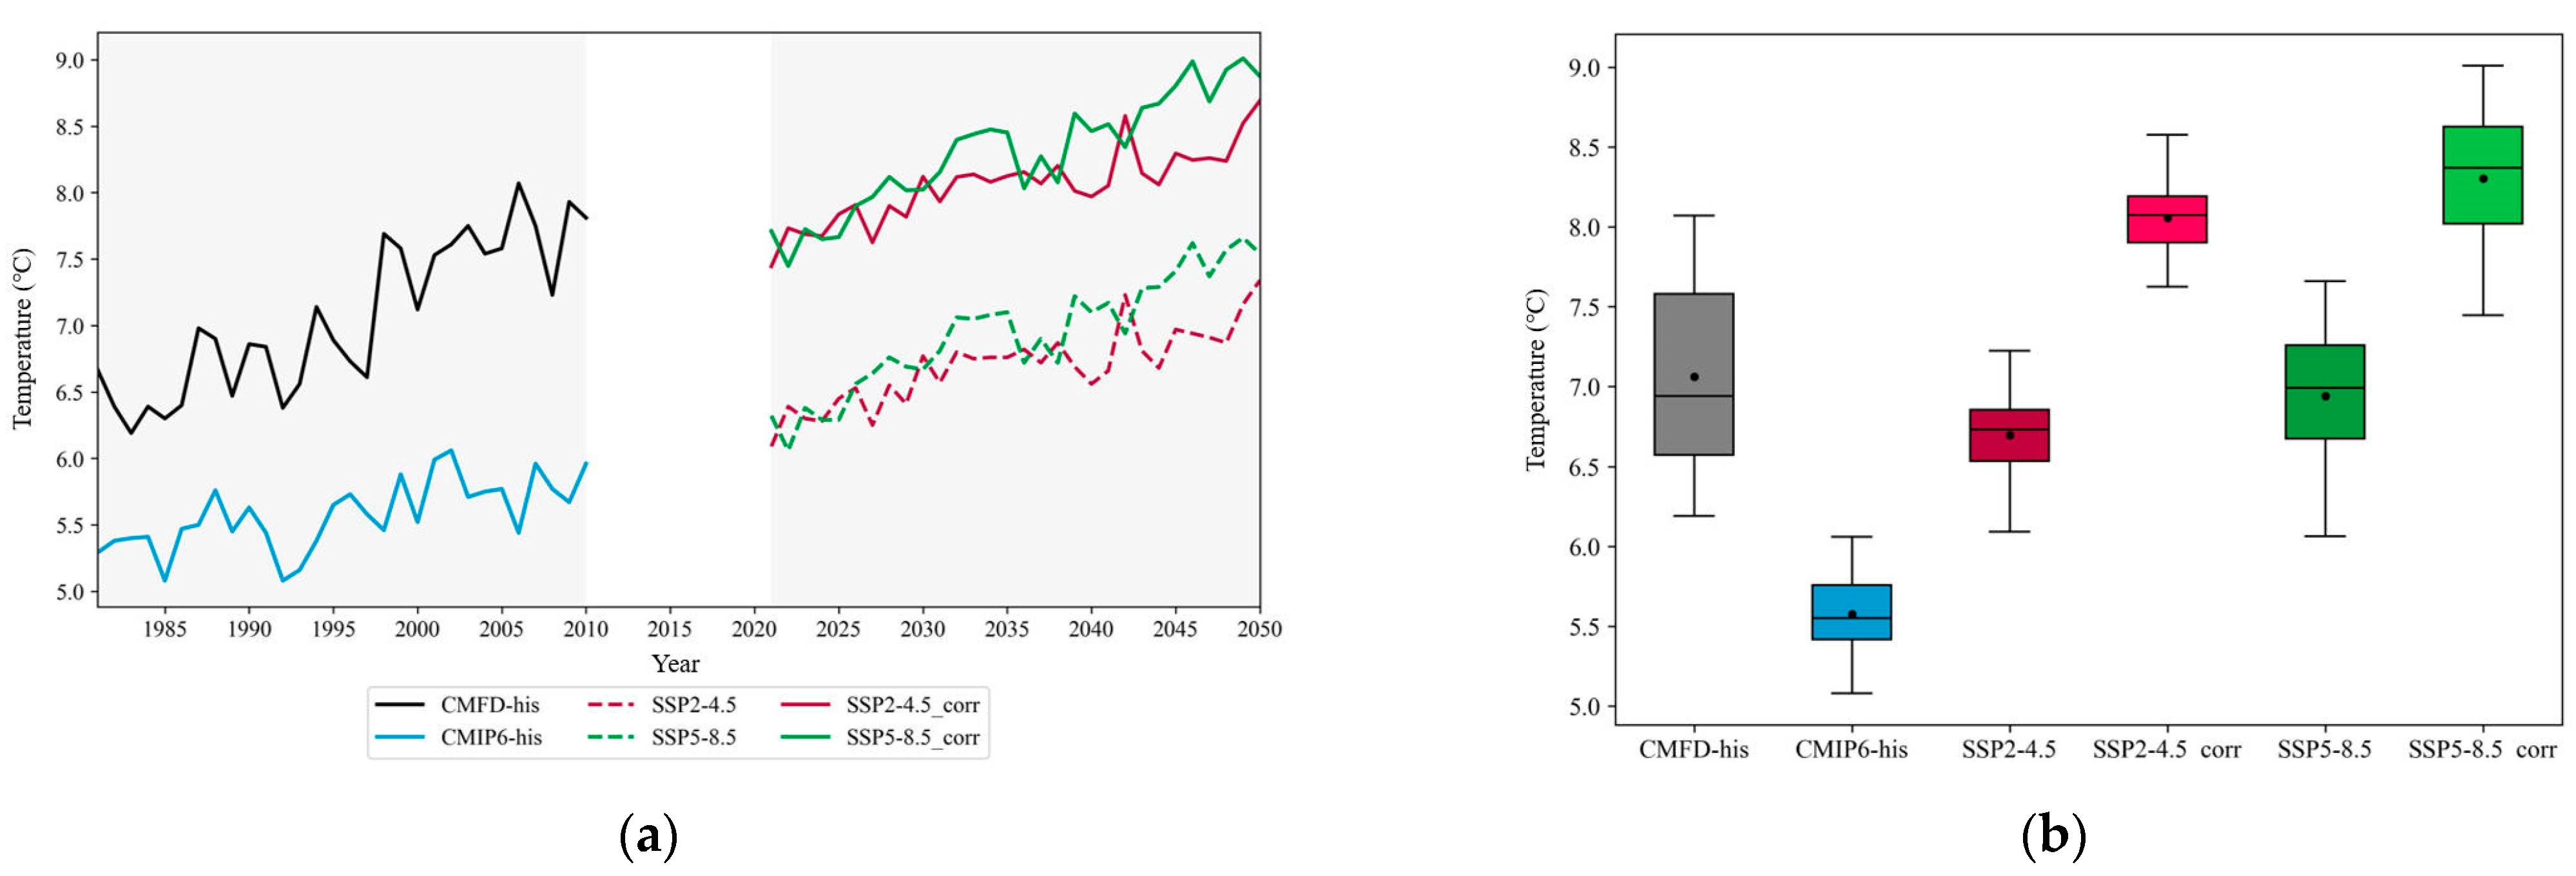
After bias correction, annual precipitation is projected to increase relative to the historical period: under SSP2-4.5, the annual mean precipitation reaches 827.3 mm, representing a 5.4% increase, while under SSP5-8.5 it reaches 832.5 mm, a 6.1% increase (Figure 18). Although the differences between the two scenarios are minor, the high-emission scenario shows a slightly larger increase. For temperature, the corrected SSP2-4.5 projections yield a mean temperature of 8.1 °C, about +1.0 °C above the historical baseline, while SSP5-8.5 reaches 8.3 °C, corresponding to an increase of +1.2 °C, indicating a stronger warming under higher emission levels (Figure 19).
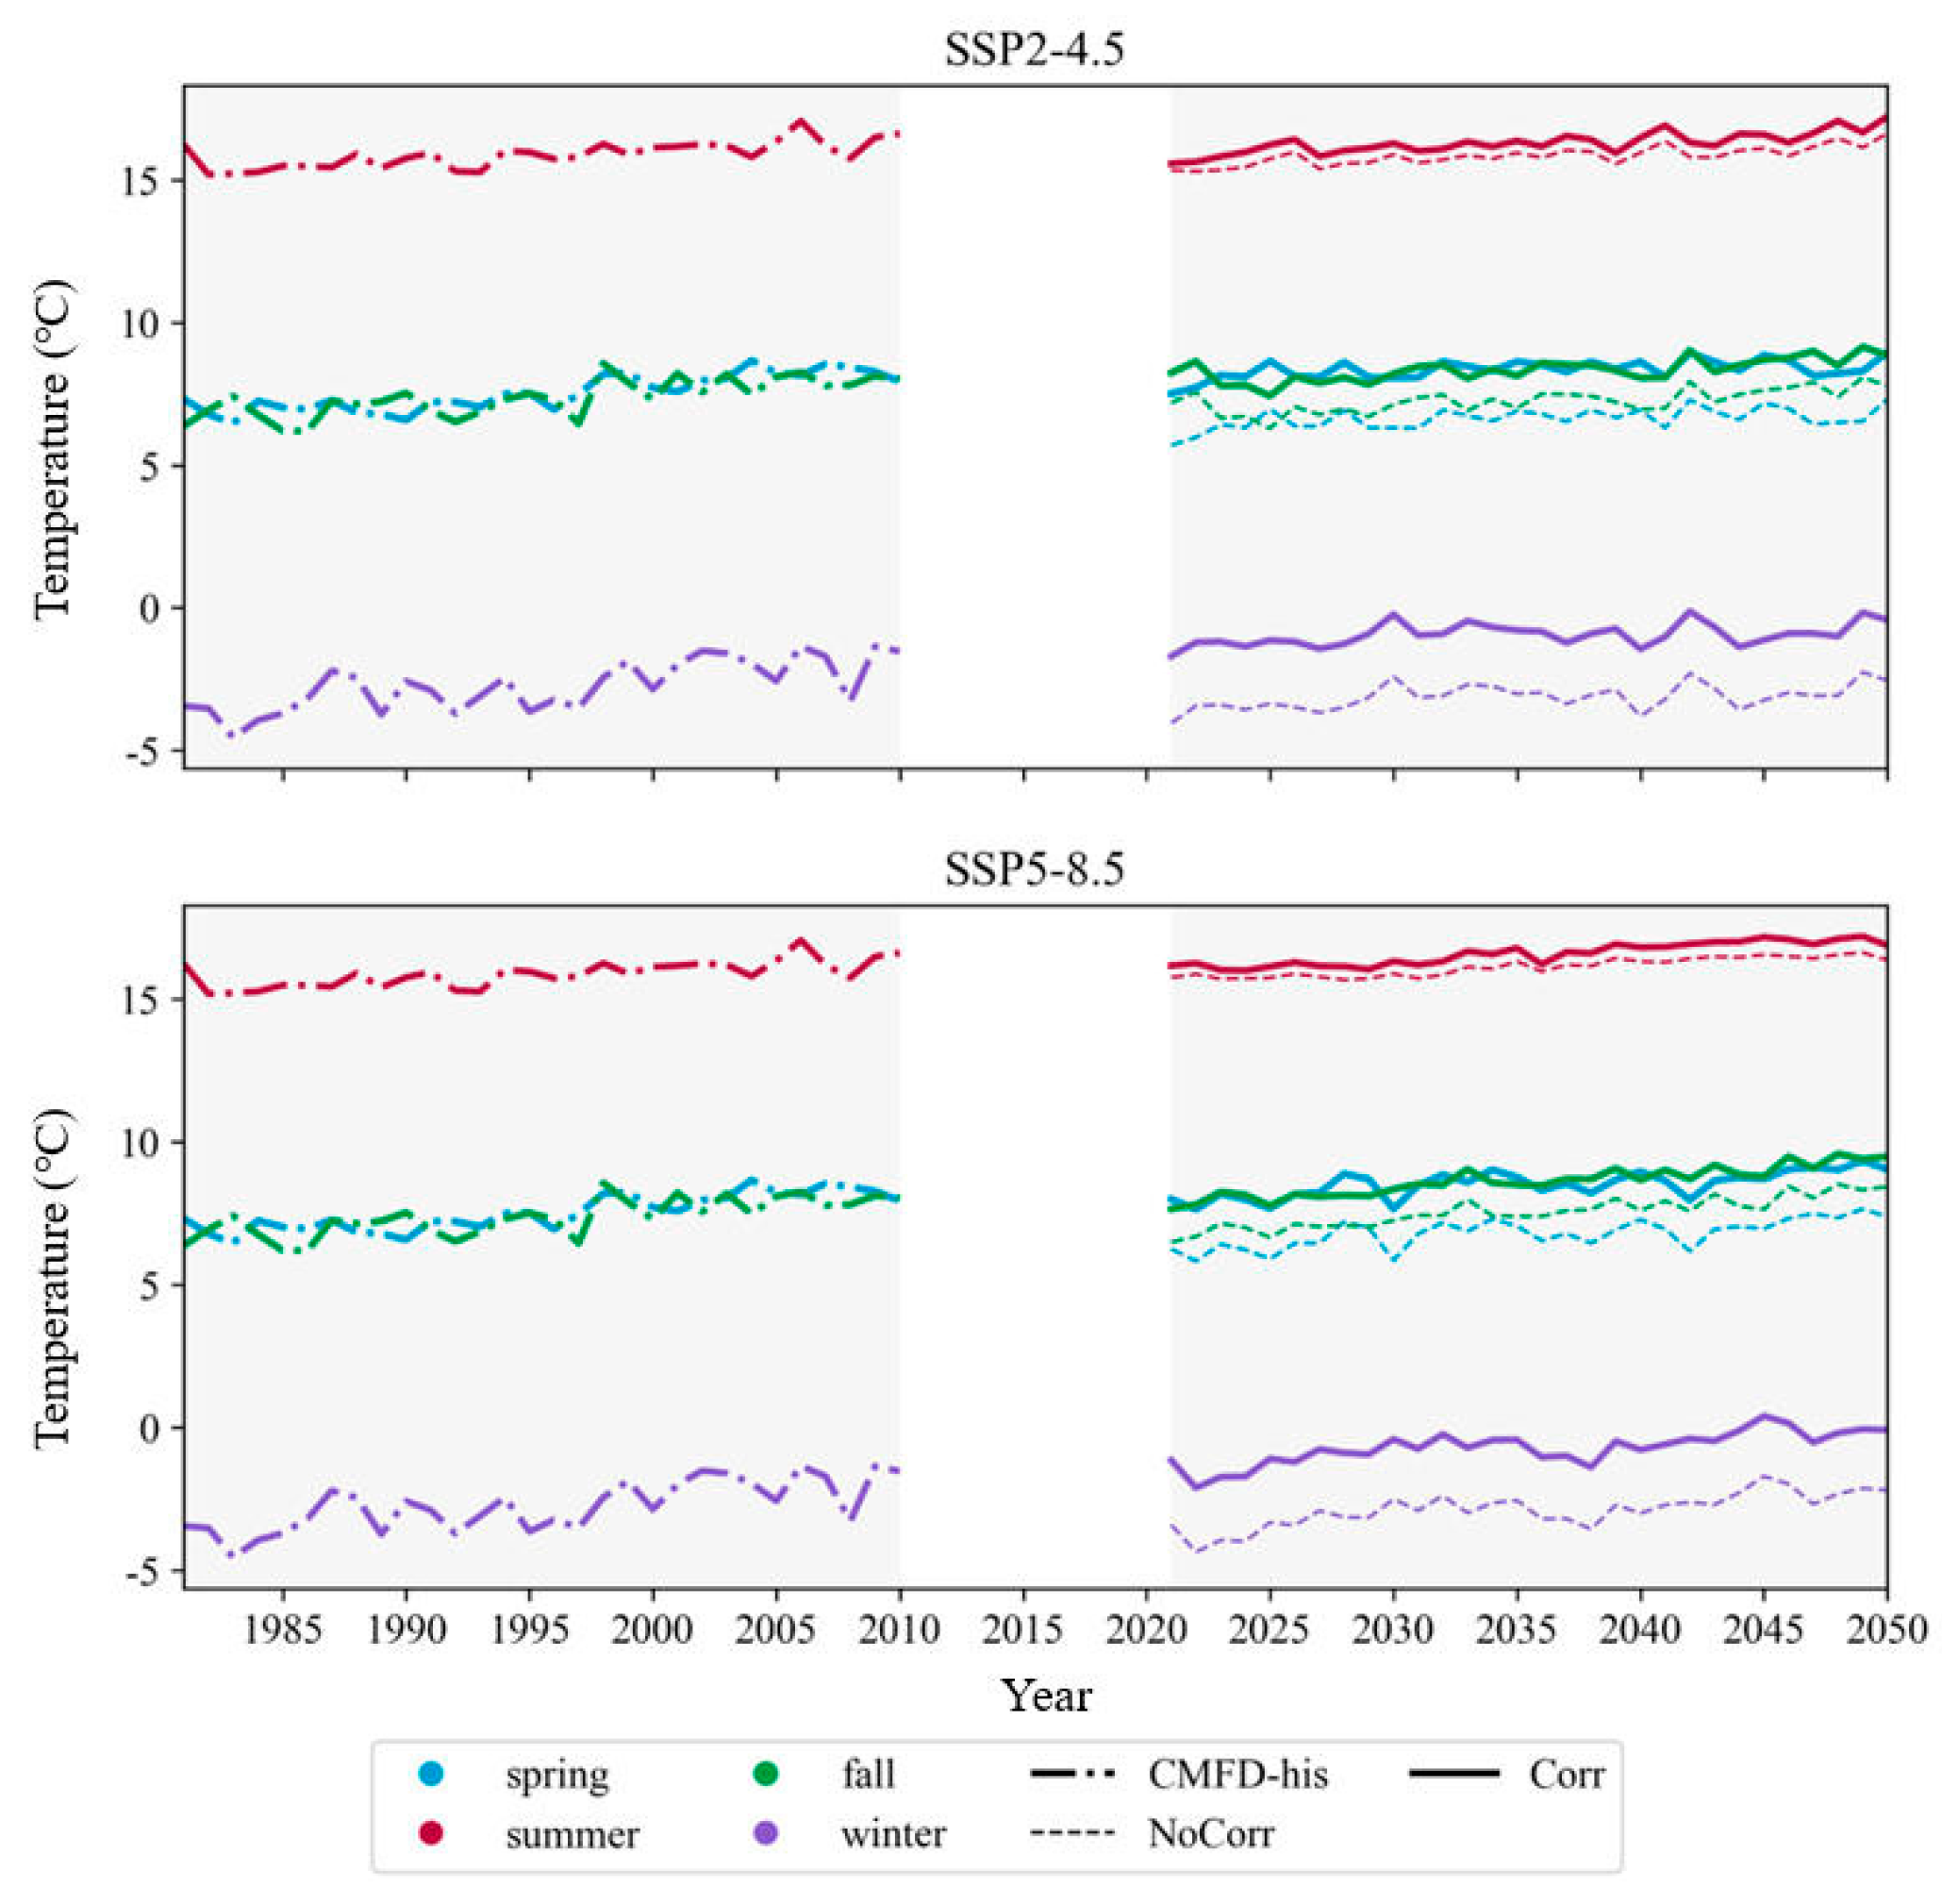
Future precipitation exhibits substantial seasonal redistribution. Spring precipitation shows the most pronounced decrease (approximately −150 mm), followed by summer (−110 mm) and autumn (−70 mm), while winter declines by about −65 mm (Figure 20). Compared with the historical baseline, SSP5-8.5 generally projects higher seasonal precipitation than SSP2-4.5, with particularly pronounced increases in autumn. Temperature changes reveal that winter warming is most significant (+1.8–2.0 °C), while spring and autumn warming range from +0.8–1.3 °C, and summer warming is weakest (+0.4–0.7 °C) (Figure 21). Overall, winter warming dominates, whereas summer changes remain relatively modest.
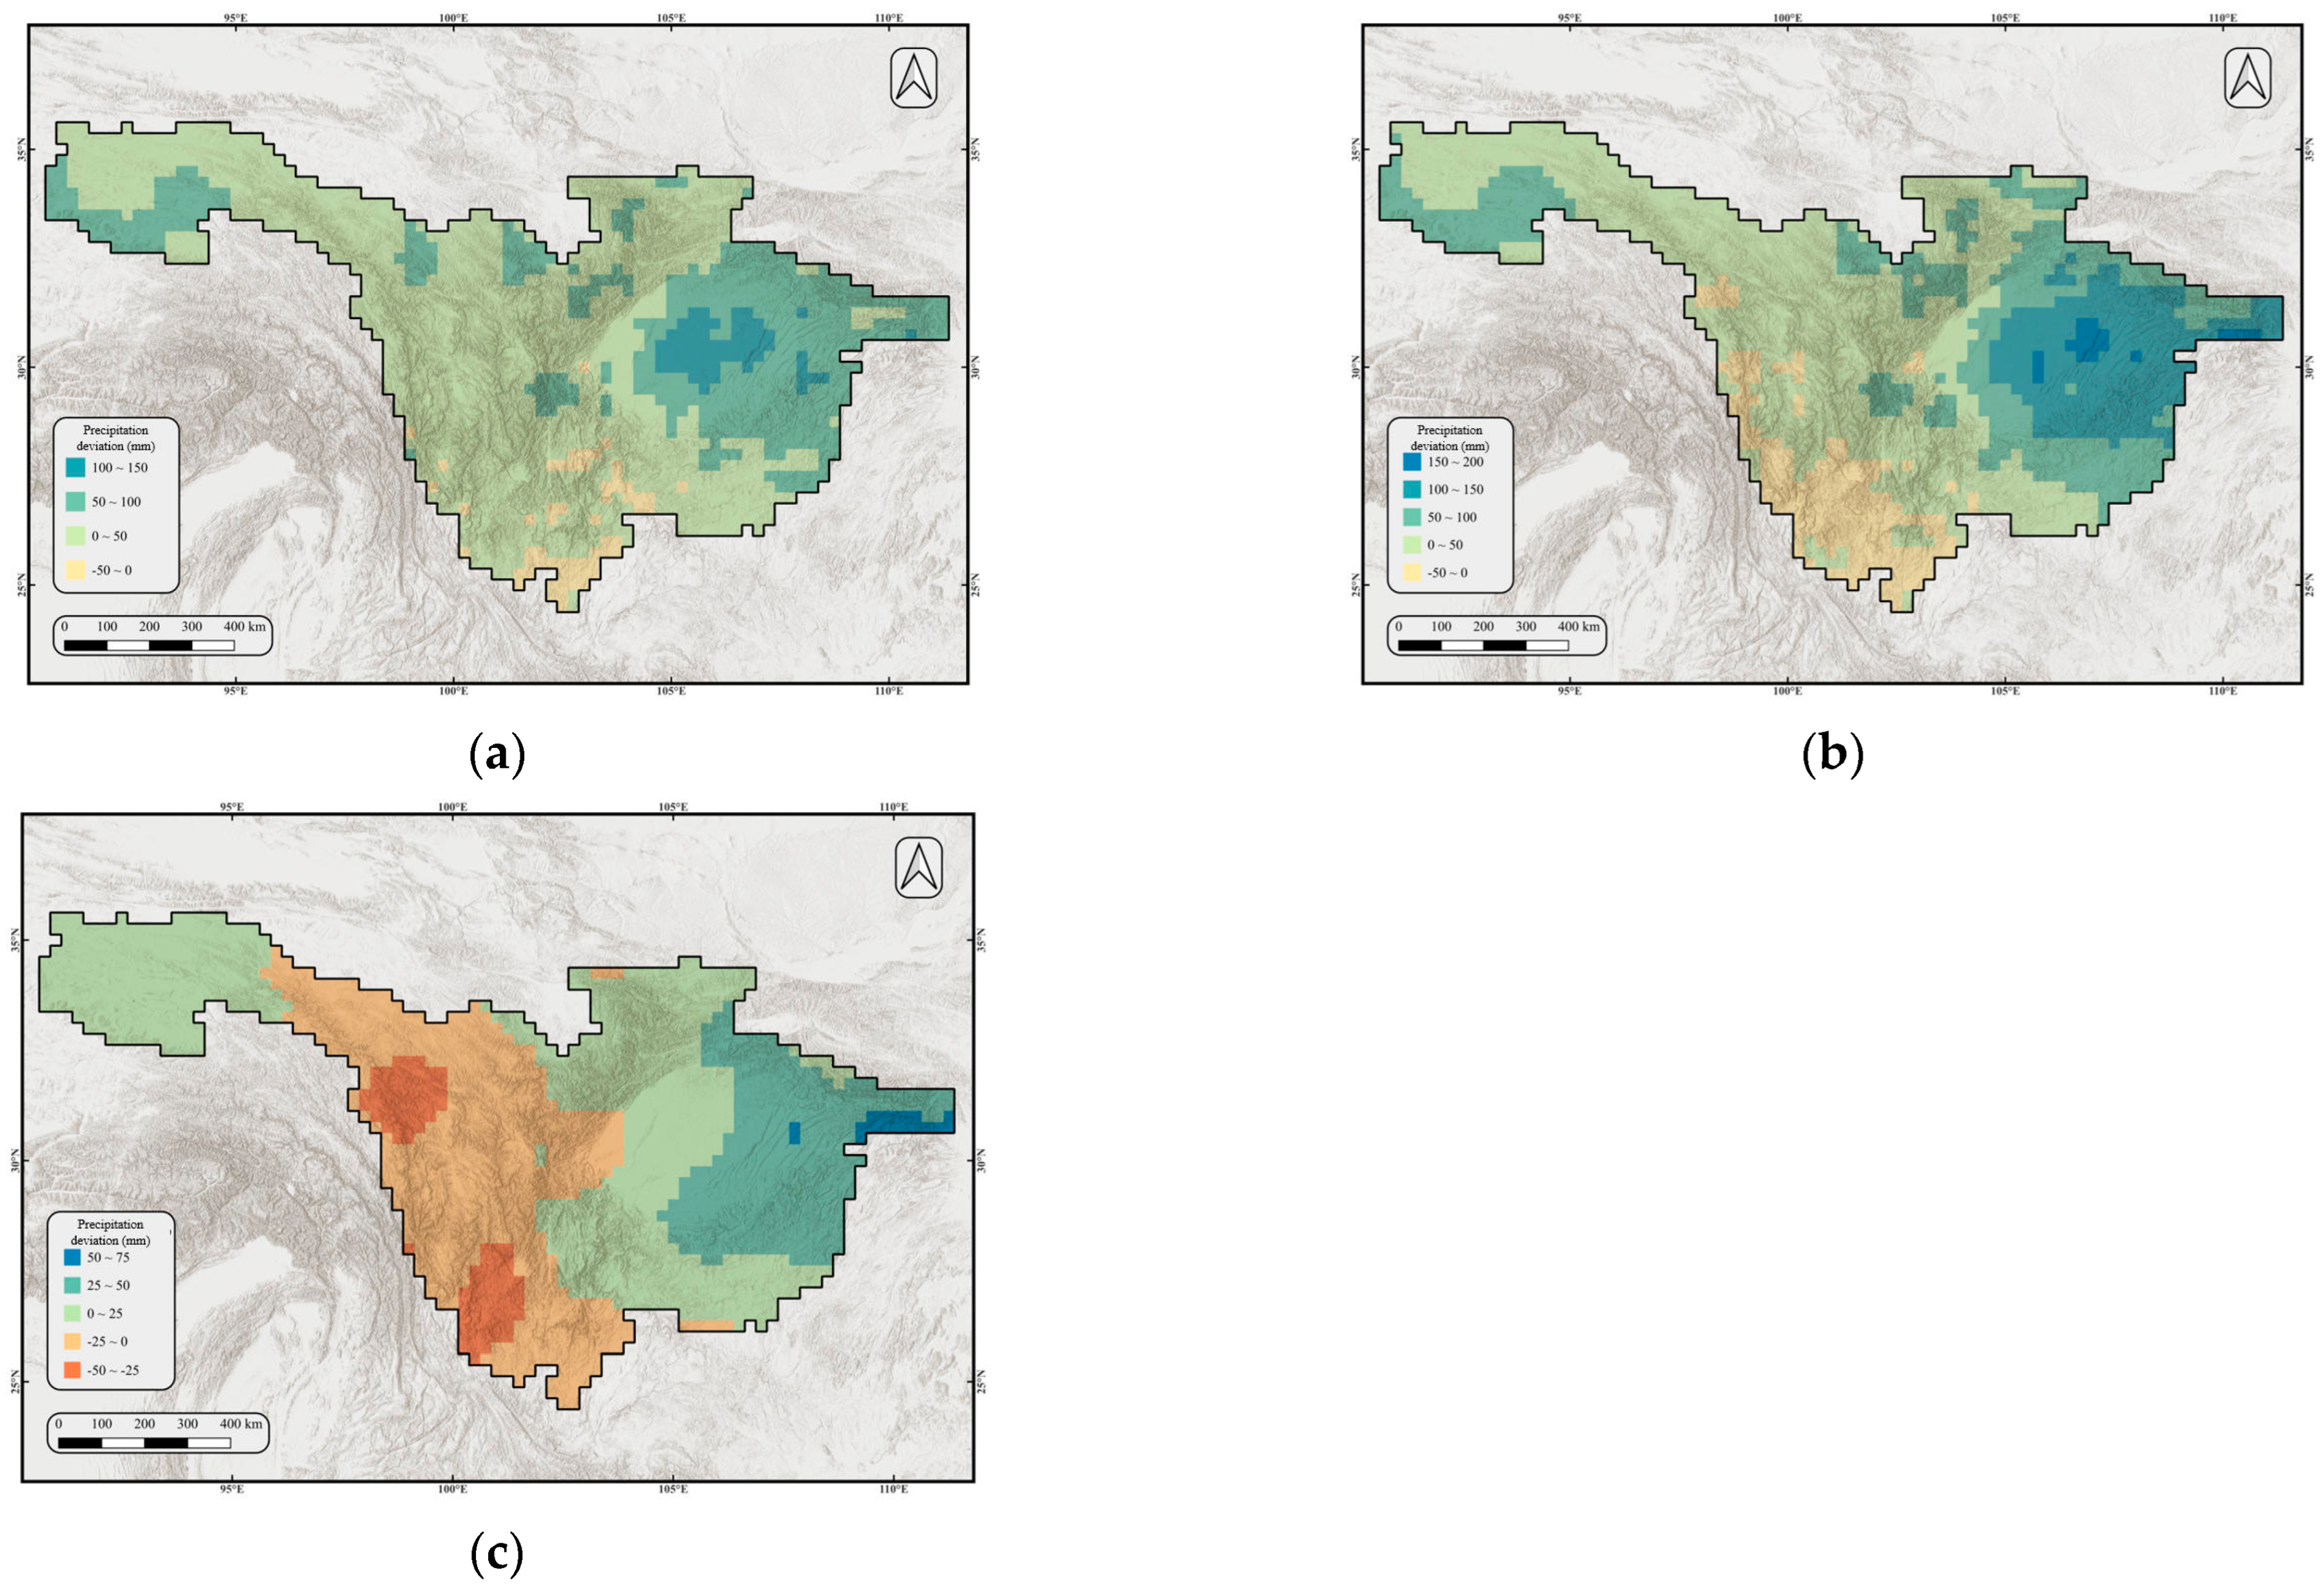
Spatially, under SSP2-4.5, most regions experience increased precipitation (0–150 mm), with the Sichuan Basin showing the strongest increase (100–150 mm). Under SSP5-8.5, precipitation generally increases across the basin, except for slight reductions (<50 mm) over parts of the Yunnan–Guizhou Plateau. In contrast, eastern regions experience increases of up to 200 mm (Figure 22). Comparisons between scenarios reveal that SSP5-8.5 produces larger precipitation increases in the eastern basin, while the Jinsha River Basin shows modest decreases.
For temperature, SSP2-4.5 projects overall warming of +0.9–1.3 °C, with the strongest warming over the Jinsha River Basin (Figure 23). Under SSP5-8.5, warming intensifies further (+1.0–1.6 °C), with the Sichuan Basin experiencing +1.5–1.6 °C, while southern parts of the Yunnan–Guizhou Plateau exhibit the weakest warming. Comparisons between the two scenarios suggest that the high-emission pathway leads to substantially stronger warming in the Sichuan Basin and adjacent regions (+0.35–0.40 °C increase relative to SSP2-4.5).
In summary, under both emission scenarios, the Upper Yangtze River Basin is projected to experience significant warming and modest precipitation increases, accompanied by notable seasonal redistribution. Winter warming is most pronounced, while extreme precipitation risks are concentrated in the eastern basin and Sichuan Basin, with important implications for runoff dynamics and flood risk.

3.3.2. Runoff Projection Analysis

Using bias-corrected CMIP6 climate data under the SSP2-4.5 and SSP5-8.5 scenarios, the calibrated WRF-Hydro model was driven to simulate runoff in the upper Yangtze River Basin for the period 2021–2050. The inflow to the Three Gorges Reservoir was selected as the outlet indicator of basin runoff. The results cover three aspects: annual mean discharge, seasonal mean discharge, and extreme flood events.
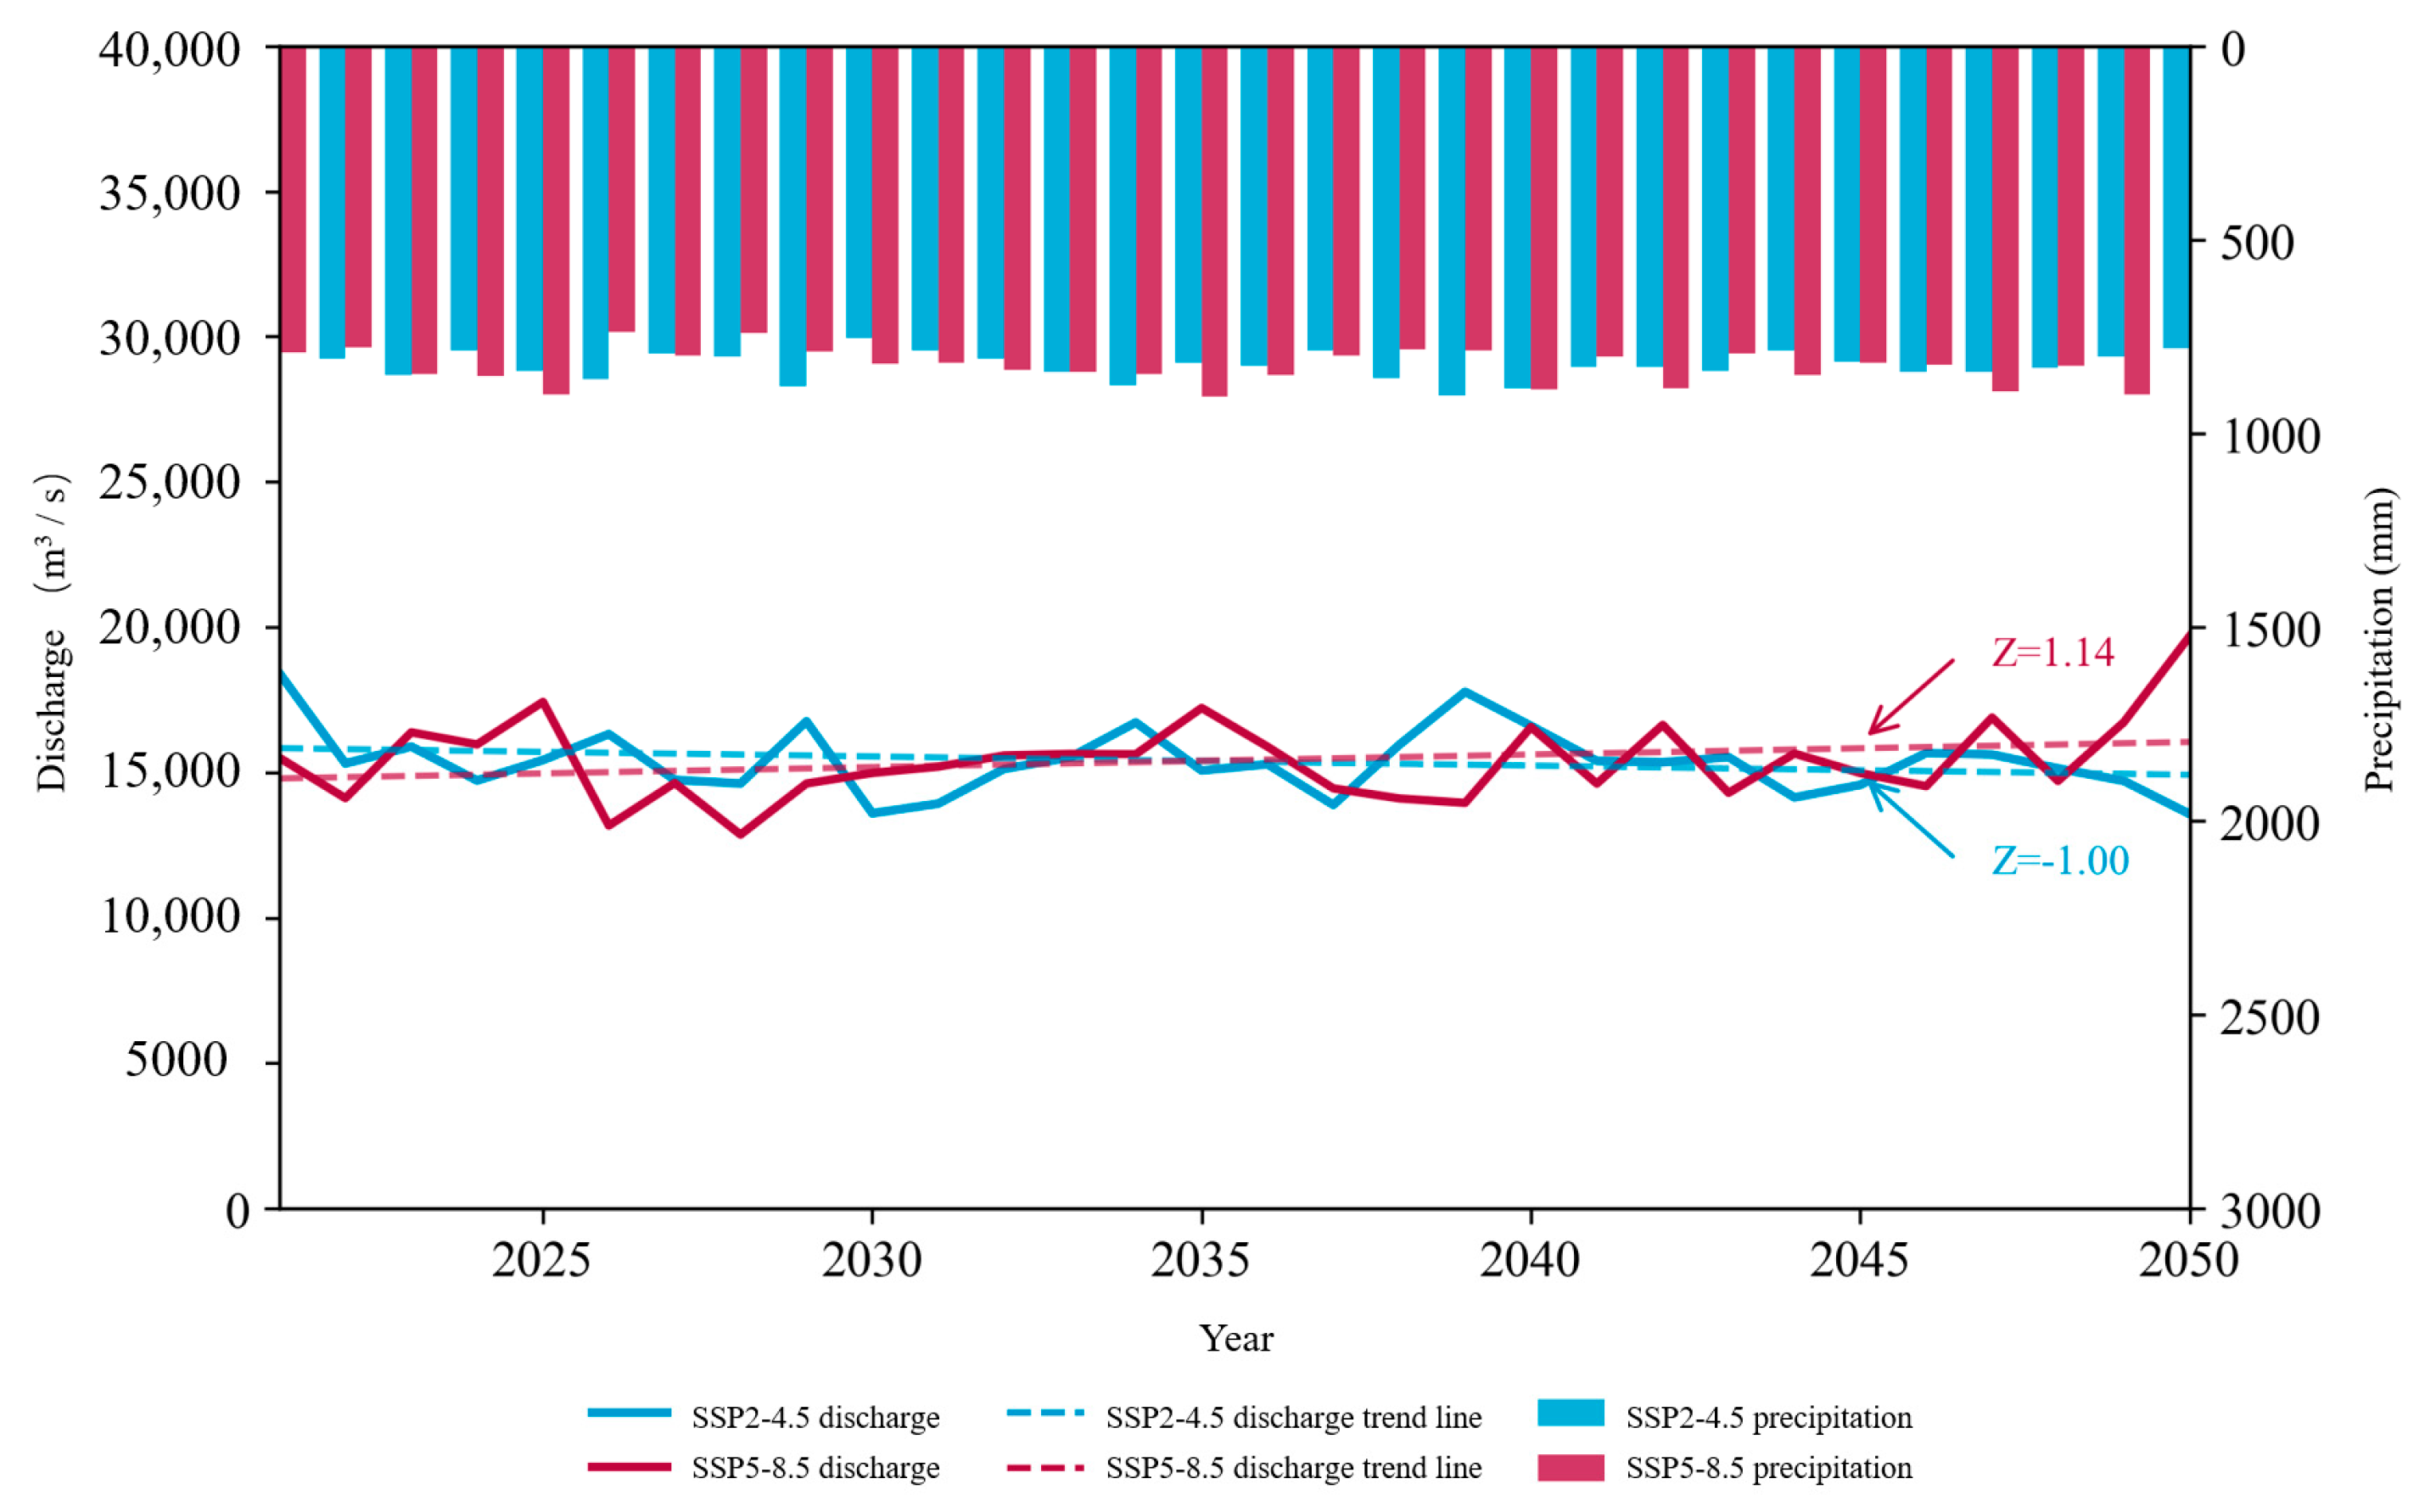
Under the SSP2-4.5 scenario, the projected multi-year mean discharge is 15,373 m3/s, with the maximum annual mean discharge occurring in 2021 and the minimum in 2050 (Figure 24). Under the SSP5-8.5 scenario, the multi-year mean discharge increases slightly to 15,416 m3/s, with the maximum value in 2050 and the minimum in 2028. In both scenarios, the temporal variations in annual mean discharge are highly consistent with precipitation trends. Mann–Kendall trend analysis of the annual discharge series shows that the standardized normal statistic (Z) is −1.00 under SSP2-4.5 and 1.14 under SSP5-8.5, indicating that no statistically significant trend in annual discharge is detected at the 95% confidence level (critical values: Z = ±1.96). At the sub-basin scale, the multi-year mean discharge of the Jinsha River Basin is projected to decrease from 5370 m3/s (SSP2-4.5) to 5205 m3/s (SSP5-8.5), a reduction of 3.1%. This suggests that intensified warming may lead to declining flows in the Jinsha River Basin. In contrast, the Min–Tuo River Basin exhibits negligible differences between scenarios, reflecting a relatively weak and delayed response to climate change. The Jialing River and Wujiang River Basins show slightly higher multi-year mean discharge under SSP5-8.5 compared with SSP2-4.5.
Marked seasonal differences are projected under different climate scenarios. In the Jinsha River Basin, the flood-season (April–October) mean discharge under SSP5-8.5 decreases by 294 m3/s (−4.2%) compared with SSP2-4.5, while non-flood-season (November–March) changes remain small. In the Jialing and Wujiang River Basins, both flood-season and non-flood-season discharges show slight increases under SSP5-8.5. At the basin-wide scale, flood-season discharge remains nearly unchanged (−33 m3/s), whereas non-flood-season discharge increases by 152 m3/s (+2.0%) (Table 5). The contribution analysis of inflows to the Three Gorges Reservoir shows that the Jinsha River contributes about 40% in the non-flood season but decreases to 30–40% during the flood season. The Jialing River contributes ~15% in the non-flood season and increases to 20% in the flood season, while the Min–Tuo and Wujiang Rivers maintain contributions of around 10% (Figure 25). Notably, the contribution rates of the Jinsha and Jialing Rivers display a significant inverse relationship during the flood season, reflecting inter-basin compensatory effects. These spatial and temporal redistributions of flow may have direct implications for reservoir regulation and regional water allocation. Decreased flood-season flow in the Jinsha River could mitigate sediment input to the Three Gorges Reservoir but may also weaken its replenishment capacity during dry spells. Conversely, increased contributions from the Jialing River may intensify short-term flood peaks, imposing additional stress on downstream flood-control operations.
The frequency of flood events with inflows exceeding 50,000 m3/s into the Three Gorges Reservoir differs substantially between scenarios. Under SSP2-4.5, only two flood events (total of 4 days) are projected in the next 30 years, while under SSP5-8.5 the frequency increases dramatically to 25 days, including 17 days in 2050 alone. Case studies of typical events reveal that under SSP2-4.5, some flood events are jointly influenced by the Jinsha, Min–Tuo, and Jialing Rivers. However, under SSP5-8.5, most flood events are dominated by runoff from the Jialing River, with the Beibei station contributing 60–99% to the Three Gorges inflow during flood peaks. The runoff processes in the Jialing River Basin exhibit strong synchronization with the Three Gorges inflow, with flood peaks occurring 1–2 days earlier, highlighting its dominant role in future extreme flood generation. These results suggest that under intensified warming, the spatial pattern of flood risk in the upper Yangtze River Basin will shift toward the Jialing River region. This change underscores the necessity for adaptive water management strategies, including early warning systems and inter-basin coordination, to mitigate future hydrological extremes.
In summary, the projected impacts of climate change on runoff in the upper Yangtze River Basin are characterized by relatively stable annual mean discharge but pronounced seasonal redistribution and substantially heightened extreme flood risks. Specifically, the Jinsha River Basin may experience reduced flood-season flows under warming scenarios, while the Jialing River Basin is projected to play an increasingly critical role in flood formation, underscoring the need for flood control operations to prioritize extreme event responses in this region. These findings highlight the need for integrated water resources management and flood control planning under future climate scenarios.

4. Discussion

This study has achieved notable progress in understanding the hydrological responses of the upper Yangtze River Basin; however, limitations remain due to constraints in data, models, and research scope, leaving several aspects open for further exploration and improvement.
From the perspective of data and models, although multiple methods were employed to enhance the applicability of CMIP6 climate data and the WRF-Hydro model, uncertainties are still inherent in both climate projections and hydrological simulations. Systematic biases in CMIP6 models, together with structural uncertainties in WRF-Hydro, may significantly affect the reliability of future projections. Moreover, constrained by computational resources and the study’s focus on relative changes under different scenarios, this work did not include more extensive uncertainty quantification experiments. Future studies should prioritize reducing these uncertainties through multi-model intercomparisons and high-resolution downscaling, as well as incorporating additional sources of observational data to improve downscaling and bias-correction methods. Advances in parameterization schemes for hydrological models, along with the quantification of confidence intervals under different SSP scenarios, will be essential for systematic uncertainty assessments. With the continued accumulation of climate and hydrological datasets, building more complex and refined coupled modeling systems will be a promising direction for achieving more accurate representations of basin-scale hydrological processes.
Recent studies in other major Chinese river basins also support the hydrological implications of intensified climate variability identified in this study. For instance, Zhang et al. [29] analyzed future meteorological droughts in the Yellow River Basin using bias-corrected CMIP6 GCMs under SSP126, SSP245, and SSP585 scenarios and found that, despite an overall increase in precipitation through 2100, drought frequency and duration will intensify, especially across the Loess Plateau. This result indicates that climate change may amplify both wet and dry extremes across China’s major basins. Similarly, hydrological modeling efforts in the Mekong River Basin [6] and upper Yangtze Basin, including our study, show an increasing tendency toward compound flood risks under high-emission scenarios. Together, these findings highlight that future climate impacts on East and Southeast Asian basins are likely to be characterized by intensified hydrological extremes, emphasizing the need for improved bias correction and uncertainty quantification in regional climate–hydrology coupling frameworks.
Regarding research content, this study mainly investigated hydrological responses under the SSP2-4.5 and SSP5-8.5 scenarios. Future work could expand the scope to include other Representative Concentration Pathways (RCPs) and Shared Socioeconomic Pathways (SSPs), thereby providing a more comprehensive assessment of basin-scale responses under diverse climate change trajectories. The projected runoff variations in the upper Yangtze River Basin are primarily driven by changes in precipitation and temperature under different climate scenarios. Precipitation acts as the dominant factor influencing the magnitude of runoff, as basin-wide increases in rainfall directly enhance surface and subsurface flow generation. In contrast, temperature rise mainly affects runoff indirectly by modifying evapotranspiration and accelerating snowmelt in high-altitude regions such as the upper Jinsha River Basin. Although this study did not quantitatively separate their relative contributions, the qualitative results suggest that precipitation variability exerts a stronger control on future flow changes, while temperature serves as an important secondary regulator. Furthermore, the upper Yangtze River Basin is characterized by numerous cascade hydropower projects. In this study, runoff projections primarily focused on natural hydrological responses driven by climate change, simulated under the default WRF-Hydro configuration, which assumes a naturalized, disturbance-free runoff regime. This approach was adopted because the current modeling framework has not yet incorporated reservoir operation modules, while the complex regulation rules of cascade hydropower projects require detailed water-use data that are difficult to obtain due to limited spatiotemporal resolution and commercial confidentiality. In addition, the compound impacts of human activities and climate change involve non-linear interactions across multiple scales, which exceed the scope of this study centered on climate forcing. Future research should explore these interactions more explicitly, assessing their implications for regional water resources, ecosystems, and socio-economic systems, thereby supporting the formulation of more targeted adaptation strategies.
In terms of application, the water resources management strategies proposed in this study require further testing and optimization in practice. Strengthened collaboration with relevant agencies is recommended to establish long-term monitoring and evaluation mechanisms, enabling iterative refinement of strategies based on real-world outcomes. This will enhance their effectiveness in flood control and sustainable water resource utilization. Moreover, the methods and findings of this study could be extended to other comparable basins, providing valuable references for addressing climate change impacts at the global scale.

5. Conclusions

As a key hydropower base and water conservation area in China, the upper Yangtze River Basin is highly sensitive to climate change due to its complex topography and climatic conditions. However, the basin is currently confronted with critical scientific challenges, including significant biases in climate model data, insufficient hydrological simulation accuracy, and an incomplete understanding of the mechanisms driving extreme hydrological events under climate change. To address these issues, this study focused on bias correction of CMIP6 climate model outputs, parameter optimization of the WRF-Hydro hydrological model, and the assessment of future climate and runoff characteristics in the upper Yangtze River Basin. By conducting systematic bias evaluation and correction of CMIP6 data, constructing and calibrating a WRF-Hydro modeling system suitable for the basin, and analyzing future climate–runoff responses, this research provides valuable insights for water resource management, flood control, and decision-making in the region. The main conclusions are as follows:
(1)
Bias correction of CMIP6 climate data: Using CMFD reanalysis data as a reference, the historical performance (1981–2010) of multi-model ensemble simulations from four CMIP6 models was evaluated. Results revealed pronounced systematic biases in the raw data: precipitation was generally overestimated, particularly over the Hengduan Mountains, while temperature was underestimated, with deviations of 4–8 °C in the western and southern Sichuan Basin. Evaluation of CMFD data showed that while long-term precipitation patterns were generally well represented, the overall magnitude was overestimated, and precipitation frequency was significantly higher than observed. This was corrected by adjusting the rainfall threshold to align with station observations. For temperature, CMFD showed strong consistency with observations in the Sichuan Basin and low-latitude regions. In the bias correction stage, the frequency-adjusted CMFD was used as the benchmark. For precipitation, comparison between the Local Intensity Correction (LOCI) method and Daily Bias Correction (DBC) indicated that LOCI performed better overall, reducing mean absolute error from 35 mm to 10 mm and root mean square error from 40 mm to 17 mm. For temperature, the DBC method was effective, reducing mean absolute error from 1.6 °C to 0.8 °C and root mean square error from 2.0 °C to 1.0 °C. Furthermore, the corrected multi-model ensemble showed higher accuracy than individual models.
(2)
Hydrological modeling with WRF-Hydro: A WRF-Hydro-based hydrological modeling system tailored to the upper Yangtze River Basin was developed to address parameter optimization challenges in simulating complex hydrological processes. Based on parameter sensitivity analysis, seven key hydrological parameters (including REFKDT) were selected, and a two-stage calibration strategy of “independent sub-basin calibration + mainstem calibration” was adopted. First, parallel parameter optimization was conducted for the Jinsha, Min-Tuo, Jialing, and Wu Rivers, each using independent parameter sets; then, the mainstem calibration was performed using the optimized sub-basin results. This approach significantly improved simulation performance at Yichang station, increasing the NSE from 0.72 (basin-wide calibration) to 0.85 (+18%), reducing RSR from 0.53 to 0.39 (−26%), and bringing PBIAS close to zero. Validation with observed discharge (2009–2018) confirmed the robustness of the approach, with NSE reaching 0.82 for daily flows, 0.86 for 5-day averages, and 0.91 for monthly flows at Cuntan station. Compared with SWAT-based studies in similar regions, the WRF-Hydro model demonstrated superior simulation accuracy.
(3)
Future climate and runoff changes: Based on bias-corrected CMIP6 multi-model data and WRF-Hydro simulations, climate and runoff characteristics for 2021–2050 were assessed under SSP2-4.5 and SSP5-8.5 scenarios. Results indicate that annual mean precipitation will increase by 5.4% (SSP2-4.5) to 6.1% (SSP5-8.5), while temperatures will rise by 1.0 °C (SSP2-4.5) to 1.2 °C (SSP5-8.5). Seasonally, autumn precipitation will increase most significantly, while winter warming will be the most pronounced. Spatially, precipitation increases are concentrated in the Sichuan Basin and the eastern basin, while warming is strongest in the Sichuan Basin and surrounding areas. Hydrological simulations suggest no statistically significant trend in annual mean discharge under either scenario. However, the Jinsha River’s mean discharge decreases by 3.1% under SSP5-8.5 relative to SSP2-4.5, whereas the Jialing and Wu Rivers exhibit slight increases. Although SSP5-8.5 shows only a minor decrease in mean flood-season daily runoff (−33 m3/s) compared with SSP2-4.5, the frequency of extreme flood events at the Three Gorges Reservoir increases substantially, from two events under SSP2-4.5 to five events under SSP5-8.5. Contribution analysis of seven flood events shows that the Jialing River was the dominant source in six of them, with contributions ranging from 60.0% to 99.1%.
In summary, this study enhances the reliability of climate data and hydrological simulations while revealing the potential impacts of climate change on hydrological processes in the upper Yangtze River Basin. The findings provide scientific support for regional water resource management, flood risk reduction, and hydropower regulation. Comparative analysis with studies from neighboring regions further supports the robustness of our findings. For example, in the Mekong River Basin, CMIP6-based projections indicate a significant intensification of flood dynamics and compound flooding events under future climate scenarios [30]. These results from the Mekong Basin align closely with our findings of enhanced flood-season discharge and increasing extreme flood events in the upper Yangtze River Basin, suggesting a consistent hydrological response across the Asian monsoon region driven by both intensified precipitation and compound flood processes under climate warming. Future efforts should focus on multi-scenario and multi-model ensemble approaches, systematic uncertainty quantification, and the integration of human activities into hydrological modeling frameworks to improve the applicability and decision-making value of projection results.

Author Contributions

Methodology, Z.C.; formal analysis, P.W. and J.Z.; data curation, K.X.; writing—original draft preparation, J.Z. and K.X.; writing—review and editing, J.Z.; supervision, Z.C.; funding acquisition, P.W. All authors have read and agreed to the published version of the manuscript.

Funding

This research received no external funding.

Data Availability Statement

The meteorological observation data used in this study are available from the National Meteorological Science Data Center of China (https://data.cma.cn (accessed on 20 March 2025)). The China Meteorological Forcing Dataset (CMFD) can be accessed from the National Tibetan Plateau Data Center (http://data.tpdc.ac.cn (accessed on 25 March 2025)). The CMIP6 model data are openly available through the Earth System Grid Federation (https://esgf-node.llnl.gov/projects/cmip6/ (accessed on 27 March 2025)). The hydrological observation data are obtained from the Yangtze River Basin Hydrological Annual Report and the “River and Water Information Report” website. Restrictions apply to the availability of hydrological data, which were used under license for this study and are therefore not publicly available. Data are however available from the authors upon reasonable request.

Conflicts of Interest

The authors declare no conflicts of interest.

References

  1. Tollefson, J. IPCC says limiting global warming to 1.5 °C will require drastic action. Nature 2018, 562, 172–173. [Google Scholar] [CrossRef]
  2. Bonan, D.B.; Siler, N.; Roe, G.H.; Armour, K.C. Energetic Constraints on the Pattern of Changes to the Hydrological Cycle under Global Warming. J. Clim. 2023, 36, 3499–3522. [Google Scholar] [CrossRef]
  3. Ma, J.; Zhou, L.; Foltz, G.R.; Qu, X.; Ying, J.; Tokinaga, H.; Mechoso, C.R.; Li, J.; Gu, X. Hydrological cycle changes under global warming and their effects on multiscale climate variability. Ann. N. Y. Acad. Sci. 2020, 1472, 21–48. [Google Scholar] [CrossRef]
  4. Xie, M.; Ren, Z.; Li, Z.; Zhang, X.; Ma, X.; Li, P.; Shen, Z. Evolution of the precipitation–stream runoff relationship in different precipitation scenarios in the Yellow River Basin. Urban Clim. 2023, 51, 101609. [Google Scholar] [CrossRef]
  5. Fang, J.; Kong, F.; Fang, J.; Zhao, L. Observed changes in hydrological extremes and flood disaster in Yangtze River Basin: Spatial–temporal variability and climate change impacts. Nat. Hazards 2018, 93, 89–107. [Google Scholar] [CrossRef]
  6. Liang, H.; Zhang, D.; Wang, W.; Yu, S.; Nimai, S. Evaluating future water security in the upper Yangtze River Basin under a changing environment. Sci. Total Environ. 2023, 889, 164101. [Google Scholar] [CrossRef] [PubMed]
  7. Shankman, D.; Lai, X. Severe flood probability on the middle Changjiang (Yangtze River) after completion of the Three Gorges Dam. Front. Earth Sci. 2022, 10. [Google Scholar] [CrossRef]
  8. Yang, R.; Xing, B. Spatio-Temporal Variability in Hydroclimate over the Upper Yangtze River Basin, China. Atmosphere 2022, 13, 317. [Google Scholar] [CrossRef]
  9. Deng, M.; Li, C.; Lu, R.; Dunstone, N.J.; Bett, P.E.; Xiao, M. Profound interdecadal variability of the summer precipitation over the upper reaches of the Yangtze River Basin. Atmos. Sci. Lett. 2024, 25, e1258. [Google Scholar] [CrossRef]
  10. Di Luca, A.; Pitman, A.J.; de Elía, R. Decomposing Temperature Extremes Errors in CMIP5 and CMIP6 Models. Geophys. Res. Lett. 2020, 47, e2020GL088031. [Google Scholar] [CrossRef]
  11. Brands, S. A circulation-based performance atlas of the CMIP5 and 6 models for regional climate studies in the Northern Hemisphere mid-to-high latitudes. Geosci. Model Dev. 2022, 15, 1375–1411. [Google Scholar] [CrossRef]
  12. Semmler, T.; Danilov, S.; Gierz, P.; Goessling, H.F.; Hegewald, J.; Hinrichs, C.; Koldunov, N.; Khosravi, N.; Mu, L.; Rackow, T.; et al. Simulations for CMIP6 With the AWI Climate Model AWI-CM-1-1. J. Adv. Model. Earth Syst. 2020, 12, e2019MS002009. [Google Scholar] [CrossRef]
  13. Rastogi, D.; Kao, S.C.; Ashfaq, M. How May the Choice of Downscaling Techniques and Meteorological Reference Observations Affect Future Hydroclimate Projections? Earth’s Future 2022, 10, e2022EF002734. [Google Scholar] [CrossRef]
  14. Michalek, A.T.; Villarini, G.; Kim, T. Understanding the Impact of Precipitation Bias-Correction and Statistical Downscaling Methods on Projected Changes in Flood Extremes. Earth’s Future 2024, 12, e2023EF004179. [Google Scholar] [CrossRef]
  15. Schmidli, J.; Frei, C.; Vidale, P.L. Downscaling from GCM precipitation: A benchmark for dynamical and statistical downscaling methods. Int. J. Climatol. 2006, 26, 679–689. [Google Scholar] [CrossRef]
  16. Chen, J.; Brissette, F.P.; Chaumont, D.; Braun, M. Performance and uncertainty evaluation of empirical downscaling methods in quantifying the climate change impacts on hydrology over two North American river basins. J. Hydrol. 2013, 479, 200–214. [Google Scholar] [CrossRef]
  17. Castro, C.L.; Gupta, H.; Lahmers, T.M.; Gochis, D.J.; Yates, D.; Dugger, A.; Goodrich, D.; Hazenberg, P. Enhancing the Structure of the WRF-Hydro Hydrologic Model for Semiarid Environments. J. Hydrometeorol. 2019, 20, 691–714. [Google Scholar] [CrossRef]
  18. Sofokleous, I.; Bruggeman, A.; Camera, C.; Eliades, M. Grid-based calibration of the WRF-Hydro with Noah-MP model with improved groundwater and transpiration process equations. J. Hydrol. 2023, 617, 128991. [Google Scholar] [CrossRef]
  19. Sun, M.; Li, Z.; Yao, C.; Liu, Z.; Wang, J.; Hou, A.; Zhang, K.; Huo, W.; Liu, M. Evaluation of Flood Prediction Capability of the WRF-Hydro Model Based on Multiple Forcing Scenarios. Water 2020, 12, 874. [Google Scholar] [CrossRef]
  20. Quenum, G.M.L.D.; Arnault, J.; Klutse, N.A.B.; Zhang, Z.; Kunstmann, H.; Oguntunde, P.G. Potential of the Coupled WRF/WRF-Hydro Modeling System for Flood Forecasting in the Ouémé River (West Africa). Water 2022, 14, 1192. [Google Scholar] [CrossRef]
  21. Kim, S.; Shen, H.; Noh, S.; Seo, D.-J.; Welles, E.; Pelgrim, E.; Weerts, A.; Lyons, E.; Philips, B. High-resolution modeling and prediction of urban floods using WRF-Hydro and data assimilation. J. Hydrol. 2021, 598, 126236. [Google Scholar] [CrossRef]
  22. Silva, D.G.; Silva Junior, J.R.D.d.; Souza, F.M.d.; Ramos, D.N.d.S.; Silva, A.R.; Santos, T.S.d.; Moreira, D.M. WRF-Hydro for Streamflow Simulation in the MATOPIBA Region within the Tocantins/Araguaia River Basin—Brazil: Implications for Water Resource Management. Water 2023, 15, 3902. [Google Scholar] [CrossRef]
  23. Mascaro, G.; Hussein, A.; Dugger, A.; Gochis, D.J. Process-based calibration of WRF-Hydro in a mountainous basin in southwestern US. J. Am. Water Resour. Assoc. 2023, 59, 49–70. [Google Scholar] [CrossRef]
  24. Yu, E.T.; Liu, X.Y.; Li, J.W.; Tao, H. Calibration and Evaluation of the WRF-Hydro Model in Simulating the Streamflow over the Arid Regions of Northwest China: A Case Study in Kaidu River Basin. Sustainability 2023, 15, 6175. [Google Scholar] [CrossRef]
  25. Liu, H.; Chen, J.; Zhang, X.-C.; Xu, C.-Y.; Hui, Y. A Markov Chain-Based Bias Correction Method for Simulating the Temporal Sequence of Daily Precipitation. Atmosphere 2020, 11, 109. [Google Scholar] [CrossRef]
  26. Luo, M.; Liu, T.; Meng, F.; Duan, Y.; Frankl, A.; Bao, A.; De Maeyer, P. Comparing Bias Correction Methods Used in Downscaling Precipitation and Temperature from Regional Climate Models: A Case Study from the Kaidu River Basin in Western China. Water 2018, 10, 1046. [Google Scholar] [CrossRef]
  27. Chen, J.; Brissette, F.P.; Chaumont, D.; Braun, M. Finding appropriate bias correction methods in downscaling precipitation for hydrologic impact studies over North America. Water Resour. Res. 2013, 49, 4187–4205. [Google Scholar] [CrossRef]
  28. Huang, S.; Gan, Y.; Chen, N.; Wang, C.; Zhang, X.; Li, C.; Horton, D.E. Urbanization enhances channel and surface runoff: A quantitative analysis using both physical and empirical models over the Yangtze River basin. J. Hydrol. 2024, 635, 131194. [Google Scholar] [CrossRef]
  29. Wang, L.; Shu, Z.K.; Wang, G.Q.; Sun, Z.L.; Yan, H.F.; Bao, Z.X. Analysis of Future Meteorological Drought Changes in the Yellow River Basin under Climate Change. Water 2022, 14, 1896. [Google Scholar] [CrossRef]
  30. Try, S.; Qin, X.; Ty, S.; Oeurng, C. Future projection of compound flooding using downscaled CMIP6 GCM climate projections in the Mekong River Basin. Hydrol. Sci. J. 2025, 70, 1439–1453. [Google Scholar] [CrossRef]
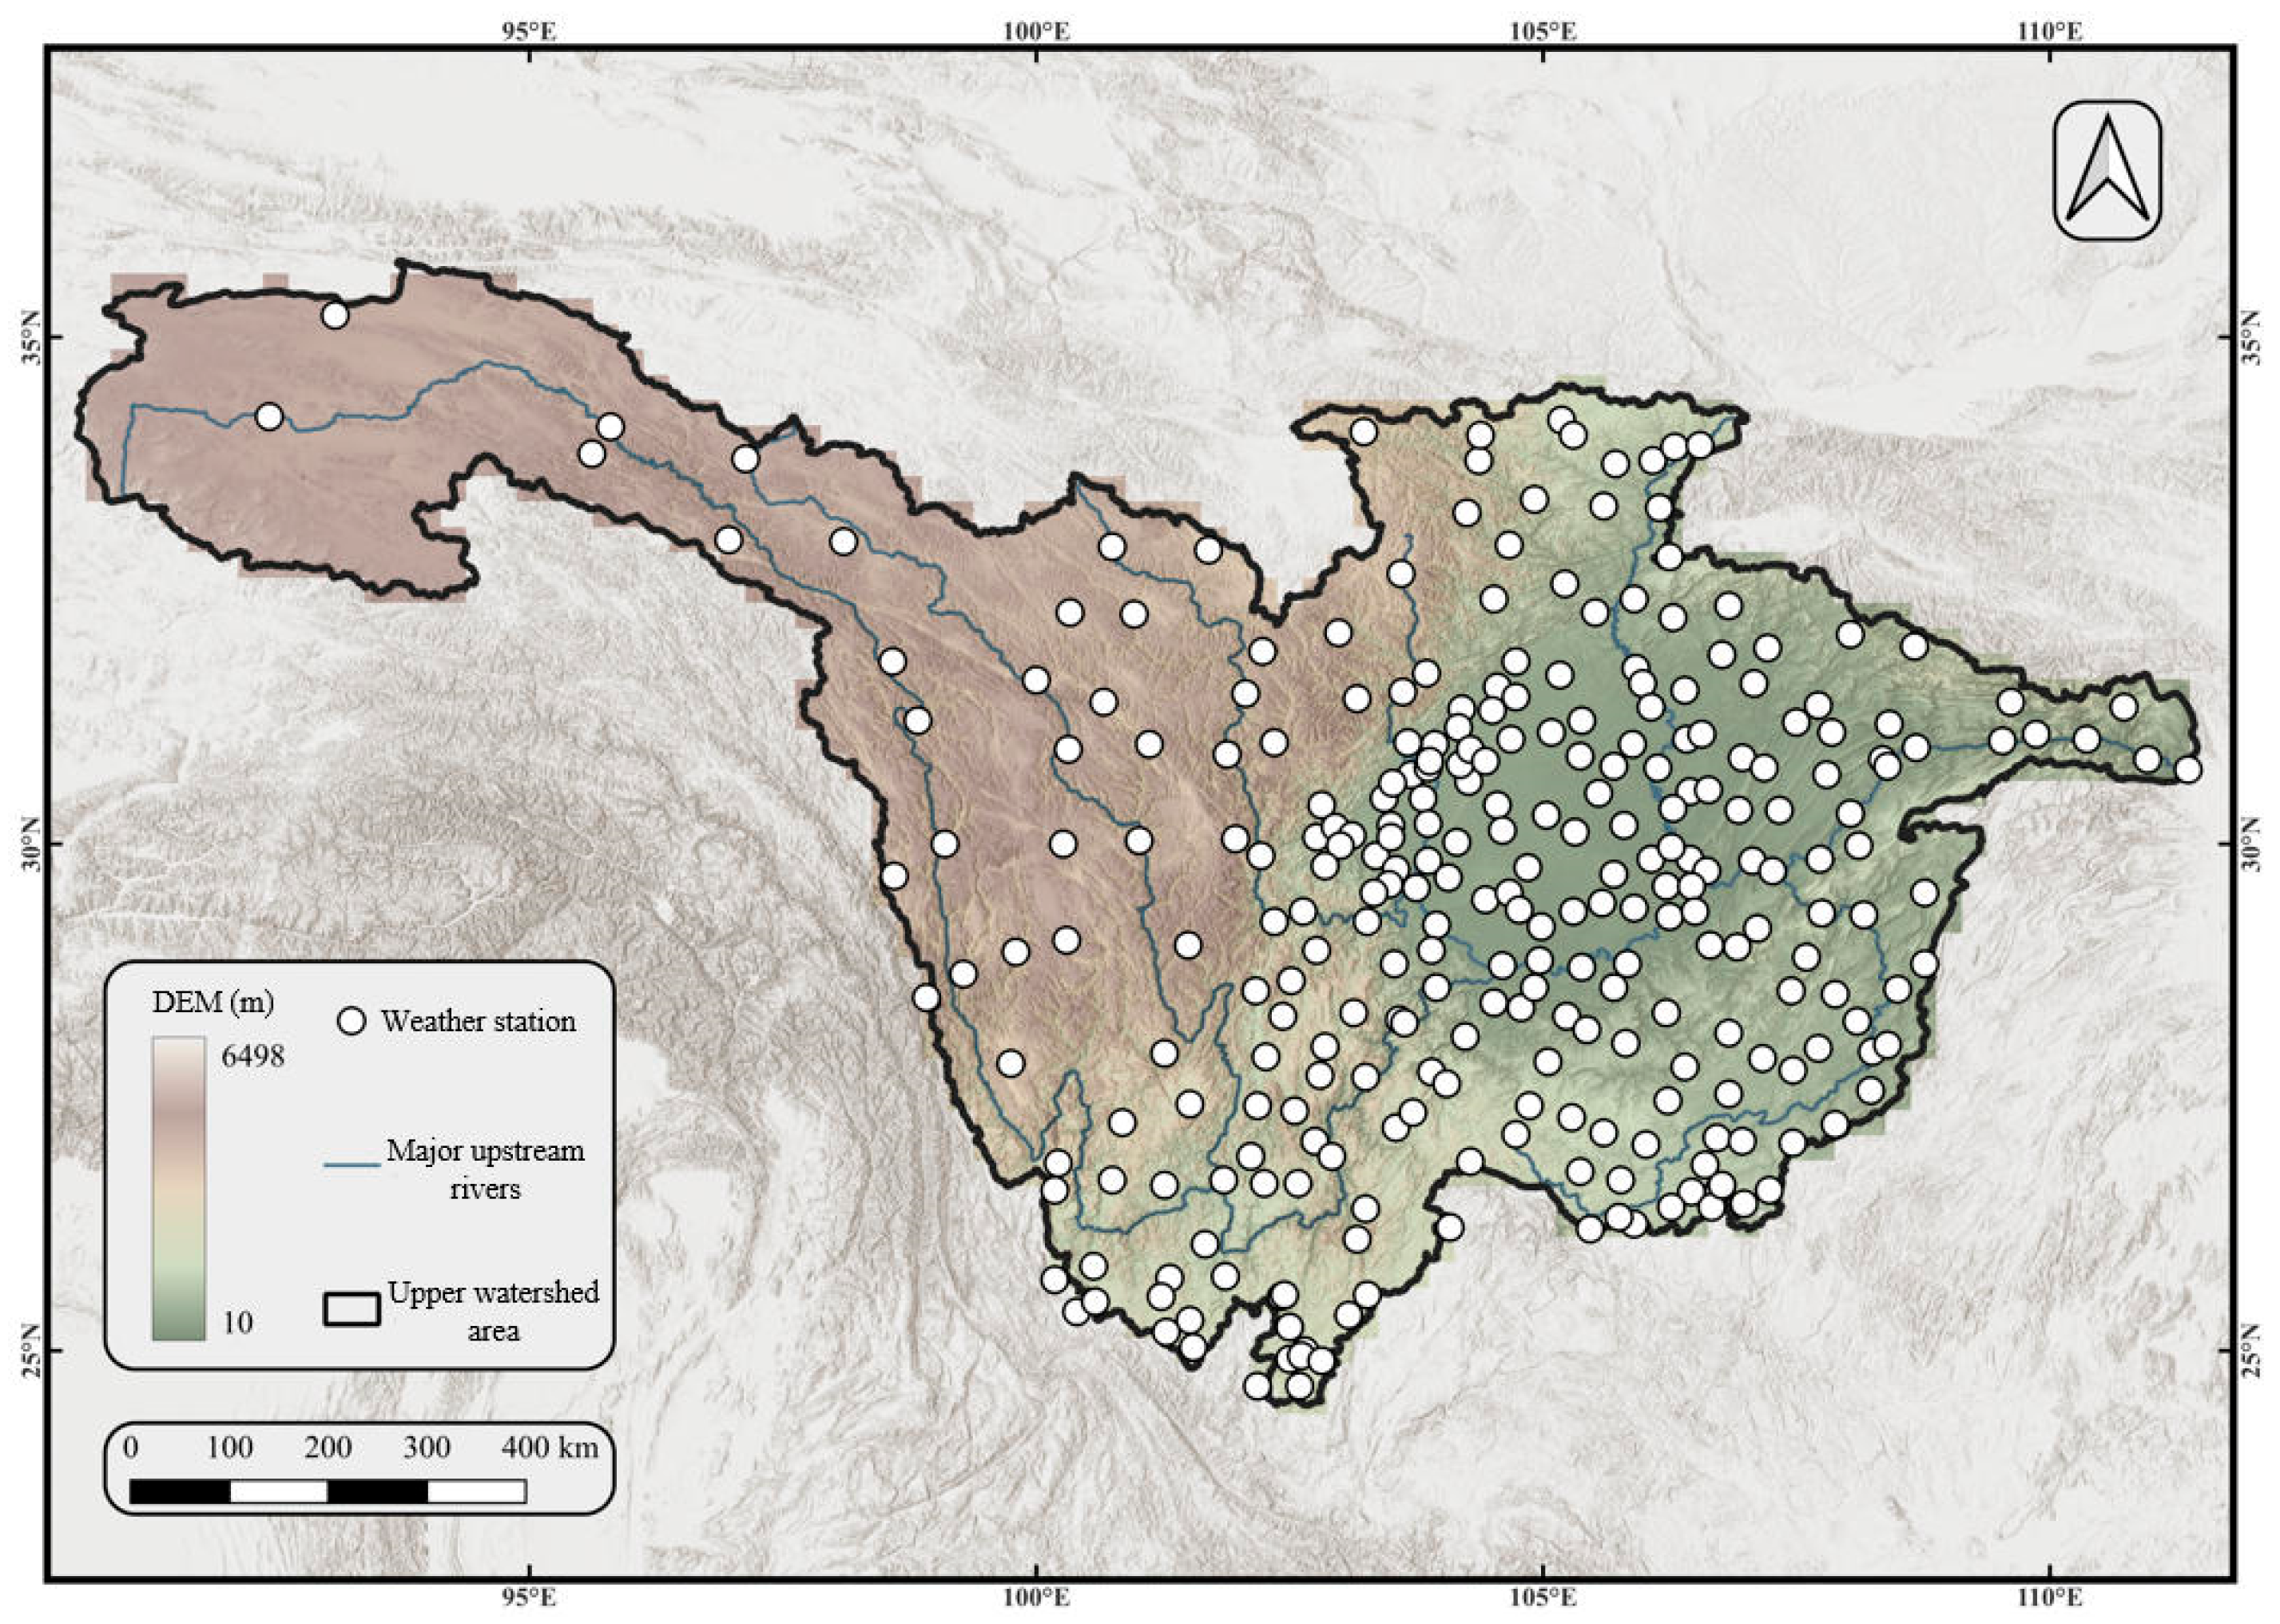
Figure 1. Location map of the upper Yangtze River Basin.
Water 17 03104 g001
Figure 2. (a) Interannual variations in precipitation under different climate scenarios during the historical baseline period (1981–2010) and the future period (2021–2050) for CMFD and CMIP6, with colored solid lines representing the multi-model ensemble mean; (b) Changes in the multi-year mean precipitation for CMFD and the multi-model ensemble mean under different climate scenarios.
Water 17 03104 g002
Figure 3. Spatial distribution of the multi-year mean precipitation bias between the multi-model ensemble mean (MME) and CMFD during the historical baseline period.
Water 17 03104 g003
Figure 4. (a) The interannual temperature variability processes under different climate scenarios for the historical baseline period (1981–2010) and future period (2021–2050) in CMFD and CMIP6. The colored solid lines represent the multi-model ensemble mean. (b) The multi-year average temperature changes in CMFD and the multi-model ensemble mean under different climate scenarios.
Water 17 03104 g004
Figure 5. Comparison of annual mean precipitation between CMFD and meteorological station observations in the upper Yangtze River Basin during 1981–2010: (a) Annual mean precipitation from CMFD data in the upper Yangtze River Basin during 1981–2010 (basin-wide perspective); (b) Annual mean precipitation from CMFD data in the upper Yangtze River Basin during 1981–2010 (station perspective, with values extracted from the gridded data in panel (a)); (c) Multi-year mean annual precipitation from meteorological station observations in the upper Yangtze River Basin during 1981–2010; (d) Bias of CMFD data relative to meteorological station observations for the multi-year mean annual precipitation.
Water 17 03104 g005
Figure 6. Spatial distribution of the annual mean temperature bias between MME and CMFD during the historical baseline period.
Water 17 03104 g006
Figure 7. Comparison of seasonal precipitation between CMFD and meteorological station observations in the upper Yangtze River Basin during 1981–2010: (a) Spring; (b) Summer; (c) Autumn; (d) Winter.
Water 17 03104 g007
Figure 8. Comparison of annual precipitation frequency between CMFD and meteorological station observations in the upper Yangtze River Basin during 1981–2010: (a) CMFD annual precipitation frequency raster map; (b) CMFD annual precipitation frequency vector map; (c) Observed annual precipitation frequency; (d) Annual precipitation deviation between CMFD and observed data.
Water 17 03104 g008
Figure 9. Comparison of seasonal precipitation frequency between CMFD and meteorological station observations in the upper Yangtze River Basin during 1981–2010: (a) Spring; (b) Summer; (c) Autumn; (d) Winter.
Water 17 03104 g009
Figure 10. Frequency-calibrated CMFD annual precipitation frequency map for the upper Yangtze River Basin during 1981–2010.
Water 17 03104 g010
Figure 11. Comparison of annual mean temperature between CMFD and meteorological station observations in the upper Yangtze River Basin during 1981–2010: (a) CMFD annual mean temperature raster map; (b) CMFD annual mean temperature vector map; (c) Observed annual mean temperature; (d) Annual mean temperature deviation between CMFD and observed data.
Water 17 03104 g011
Figure 12. Comparison of seasonal mean temperature between CMFD and meteorological station observations in the upper Yangtze River Basin during 1981–2010: (a) Spring; (b) Summer; (c) Autumn; (d) Winter.
Water 17 03104 g012
Figure 13. Differences in precipitation between multi-model ensemble means and observations before and after correction during 1996–2010: (a) before correction, (b) after LOCI, (c) after DBC.
Water 17 03104 g013
Figure 14. Precipitation bias correction evaluation indicator chart, RAW denotes pre-correction.
Water 17 03104 g014
Figure 15. Differences between multi-model ensemble means and observed temperatures before and after correction during 1996–2010: (a) pre-correction results; (b) results after DBC.
Water 17 03104 g015
Figure 16. Daily average flow simulation map for Cuntan station during 2009–2018.
Water 17 03104 g016
Figure 17. Temperature bias correction evaluation indicator chart, RAW denotes pre-correction.
Water 17 03104 g017
Figure 18. Comparison of precipitation characteristics between CMFD and CMIP6 under different climate scenarios during the historical reference period and future: (a) Interannual variation process of precipitation under different climate scenarios in the historical baseline period and future period (Including comparison of CMIP6 before and after correction); (b) Multi-year average precipitation under different climate scenarios in the historical baseline period and future period (Comparison of CMIP6 before and after correction).
Water 17 03104 g018
Figure 19. Inter-comparison of air temperature characteristics between CMFD and CMIP6 under different climate scenarios in historical baseline and future periods: (a) Interannual variation process of air temperature under different climate scenarios in historical baseline (1981–2010) and future (2021–2050) periods (Colored dashed and solid lines in the future period represent multi-model ensemble averages before and after correction, respectively); (b) Multi-year average air temperature under different climate scenarios in historical baseline (1981–2010) and future (2021–2050) periods (Comparison of multi-model ensemble averages before and after correction).
Water 17 03104 g019
Figure 20. Seasonal precipitation variation processes under different climate scenarios for CMFD and CMIP6 during the historical baseline period (1981–2010) and future period (2021–2050). The dashed line represents CMFD, while the dotted and solid lines denote the multi-model ensemble mean before and after correction, respectively.
Water 17 03104 g020
Figure 21. Seasonal temperature variation processes under different climate scenarios for CMFD and CMIP6 during the historical baseline period (1981–2010) and future period (2021–2050). The dotted line represents CMFD, while the dashed and solid lines denote the multi-model ensemble mean before and after correction, respectively.
Water 17 03104 g021
Figure 22. Spatial distribution of annual precipitation anomalies between calibrated multi-model ensemble means and observed data under different scenarios: (a) The SSP2-4.5 scenario; (b) The SSP5-8.5 scenario; (c) The difference between SSP5-8.5 and SSP2-4.5.
Water 17 03104 g022
Figure 23. Spatial distribution of annual mean temperature anomalies between calibrated multi-model ensemble averages and observed data under different scenarios: (a) The SSP2-4.5 scenario; (b) The SSP5-8.5 scenario; (c) The difference between SSP5-8.5 and SSP2-4.5.
Water 17 03104 g023
Figure 24. Future trends in annual average flow variations in the upper Yangtze River Basin.
Water 17 03104 g024
Figure 25. Contribution ratios of sub-basins in the upper Yangtze River to the inflow volume of the Three Gorges reservoir. The blue line represents the Jinsha River, the red line represents the Minhe River, the green line represents the Jialing River, the purple line represents the Wujiang River, and the yellow line represents the sum of the sub-basins: (a) SSP2-4.5 flood season; (b) SSP2-4.5 non-flood season; (c) SSP5-8.5 flood season; (d) SSP5-8.5 non-flood season.
Water 17 03104 g025aWater 17 03104 g025b
Table 1. Key parameters of the WRF-Hydro and optimal values in basin-wide calibration.
ParameterPhysical MeaningOptimal Value
REFKDTDetermines the inflow for channel routing calculations0.1
SLOPEDirectly affects subsurface runoff1.0
BEXPDescribes the soil moisture characteristic curve0.7
SMCMAXRepresents the soil water holding capacity0.7
DKSATControls the velocity of subsurface flow1.0
OVROUGHRTFACAffects the rate at which runoff converges into the river network1.0
MannNReflects the effect of channel roughness on water flow1.2
Table 2. Optimal parameter values for each watershed.
ParameterJinsha RiverMinjiang RiverJialing RiverWu RiverUpper Mainstream
REFKDT0.10.10.10.10.1
SLOPE1.01.00.10.11.0
BEXP0.80.41.91.60.4
SMCMAX1.00.80.81.00.8
DKSAT0.81.00.61.01.3
OVROUGHRTFAC0.71.00.71.01.0
MannN----1.4
Table 3. Comparison of results from two calibration methods.
ParameterNSERSRPBIAS
EntireSingleEntireSingleEntireSingle
REFKDT0.330.330.820.820.270.27
SLOPE0.600.570.630.660.140.17
BEXP0.700.770.550.48−0.010.04
SMCMAX0.700.790.550.45−0.01−0.03
DKSAT0.700.800.550.45−0.01−0.02
OVROUGHRTFAC0.700.790.550.46−0.010.00
MannN0.720.850.530.39−0.010.00
Table 4. NSE values for daily, 5-day, and monthly average flow at Cuntan station during 2009–2018.
Time2009201020112012201320142015201620172018Mean
1 d0.920.910.770.870.890.830.760.740.650.870.82
5 d0.940.930.820.890.920.880.790.810.750.890.86
1 m0.970.970.900.920.950.930.830.880.840.920.91
Table 5. Average flow conditions during flood season and non-flood season in the upper Yangtze River Basin simulated by the calibrated WRF-Hydro model driven by bias-corrected CMIP6 climate data under SSP2-4.5 and SSP5-8.5 scenarios.
BasinAverage Flow During Flood Season (m3/s)Average Flow During Non-Flood Season (m3/s)
SSP2-4.5SSP5-8.5SSP2-4.5SSP5-8.5
Jinsha River Basin6951665731313151
Minjiang River Basin27392726784799
Jialing River Basin4176426111151143
Wu River Basin24412491705719
Upper Yangtze River Basin20,82420,79176577809
Disclaimer/Publisher’s Note: The statements, opinions and data contained in all publications are solely those of the individual author(s) and contributor(s) and not of MDPI and/or the editor(s). MDPI and/or the editor(s) disclaim responsibility for any injury to people or property resulting from any ideas, methods, instructions or products referred to in the content.