Article

Impact of Extreme Droughts on the Water Balance in the Peruvian–Ecuadorian Amazon Basin (2003–2024)

by
Daniel Martínez-Castro
1,*,
Jhan-Carlo Espinoza
2,3,
Ken Takahashi
1,
Miguel Octavio Andrade
1,
Dimitris A. Herrera
4,
Abel Centella-Artola
5,
James Apaestegui
1,6,
Elisa Armijos
1,
Ricardo Gutiérrez
1,
Sly Wongchuig
7 and
Fey Yamina Silva
1
1
Instituto Geofisico del Peru, Calle Badajoz, 169 Mayorazgo IV Etapa, Ate, Lima 15012, Peru
2
Institut des Geosciences de l’Environnement, Institut de Recherche pour le Developpement, Centre Nationalde la Recherche Scientifique, Universite Grenoble Alpes, 70 Rue de La Physique, Bat. OSUG-B, Domaine Universitaire, 38400 Saint Martin d’Hères, France
3
Instituto de Investigacion Sobre la Ensenanza de las Matematicas (IREM PUCP), Pontificia Universidad Catolica del Peru, Lima 15088, Peru
4
Department of Geography & Sustainability, The University of Tennessee-Knoxville, Knoxville, TN 37996, USA
5
Instituto de Meteorologia, La Habana 10400, Cuba
6
Programa de Maestria en Recursos Hídricos, Universidad Nacional Agraria La Molina, Lima 15024, Peru
7
Laboratoire d’études en Géophysique et Océanographie Spatiales, Centre National d’Études Spatiales, Université Toulouse III-Paul Sabatier, 38058 Grenoble, France
*
Author to whom correspondence should be addressed.
Water 2025, 17(21), 3041; https://doi.org/10.3390/w17213041
Submission received: 25 June 2025 / Revised: 4 October 2025 / Accepted: 16 October 2025 / Published: 23 October 2025

Abstract

This study assesses the impact of extreme droughts on the surface and atmospheric water balance of the Peruvian Amazon basin during 2003–2024. It extends previous work by incorporating multiple datasets for precipitation (CHIRPS, MSWEP, and ERA5) and evapotranspiration (ERA5, GLDAS, Amazon-Paca, and observations from the Quistococha flux tower) and comparing three drought indices: Maximum Cumulative Water Deficit (MCWD), Standardized Precipitation Evapotranspiration Index (SPEI), and self-calibrated Palmer Drought Severity Index (scPDSI). The study focuses on the Peruvian–Ecuadorian Amazon basin, particularly on the Amazon and Madre de Dios river basins, closing at Tamshiyacu and Amaru Mayu stations, respectively. The results confirm four extreme drought years (2004–2005, 2009–2010, 2022–2023, and 2023–2024) with major precipitation deficits in dry seasons and significant reductions in runoff and total water storage anomalies (TWSAs), physically manifesting as negative surface balances indicating net terrestrial water depletion and negative atmospheric balances reflecting reduced moisture convergence, with residuals signaling hydrological uncertainties. The study highlights significant imbalances in the water cycle during droughts and underscores the need to use multiple indicators and datasets to accurately assess hydrological responses under extreme climatic conditions in the Amazon basin.

1. Introduction

The Amazon region has a decisive weight in the regulation of climate, as Amazonian forests store vast amounts of carbon in trees and soils, helping regulate the global climate by sequestering CO2 (Saatchi et al., 2011 [1]). In addition, Amazon biosphere–atmosphere interactions play a crucial role in modulating regional and global atmospheric circulation and the water cycle (Costa et al., 2021 [2]).
Surface and atmospheric water balances are foundational in shaping the climate of hydrological basins (Builes-Jaramillo and Poveda, 2018 [3]). The surface water balance is defined as the net amount of water entering and exiting the Earth’s surface. In the Amazon basin, precipitation is abundant, nourishing rivers and bodies of water that play a crucial role in maintaining wildlife and human communities. These bodies of water also regulate air humidity and are crucial for the transport of nutrients and sediments (Armijos et al., 2020 [4]; Beveridge et al., 2024 [5]).
The components of the surface water balance are precipitation (Pr), evapotranspiration (Et), and total runoff (Ro; including surface and underground runoff), which results in the storage of part of the water in the subsoil (Healy et al., 2007 [6]). Pr varies in intensity and accumulation, according to the season and location within the Amazon basin (e.g., Espinoza et al., 2009 [7]). Et signifies the combined process of evaporation from the soil surface and transpiration from plants, which pays a crucial role in maintaining atmospheric humidity and regulating the Earth’s surface temperature. In the western part of the Amazon basin, including the Peruvian–Ecuadorian sector, the relationship between Et, net solar radiation, and surface moisture is rather complex. Evapotranspiration in this region is correlated with both variables throughout the year, except during the DJF (December–January–February) season, when the correlation with the net radiation is high (Zanin et al., 2024) [8]. Conversely, Ro represents the water that flows along the surface in rivers and underground. The study of Ro at the level of regional basins in Amazonia is extremely important, as the great latitudinal extension of the Amazon basin, as well as its altitudinal gradients, induce a complex dependence on the contributions from the different regions into the basins (Espinoza et al., 2009) [9]. In addition, vegetation intercepts precipitation before it reaches the soil. This affects the amount that eventually reaches rivers and lakes, as well as how Et contributes to the water that reaches the soil surface (Kimball and Bernacchi, 2006) [10].
Atmospheric water balance involves the interaction of liquid water and water vapor in the atmosphere. The Amazon receives water vapor from the Atlantic Ocean through trade winds, forced by thermal gradients between the land and sea surfaces. This circulation causes the convergence of humidity, which ascends to the upper layers of the atmosphere through convective processes linked to atmospheric instability (Drumond et al., 2014 [11]). This process is influenced by complex interactions between large-scale atmospheric circulation and local factors. The Intertropical Convergence Zone (ITCZ) brings moisture, amplified by evapotranspiration from the dense forest, enhancing atmospheric instability. Orographic lift over the Andes contributes, while local convective processes, triggered by surface heating and forest–atmosphere interactions, produce frequent afternoon thunderstorms. (Wongchuig et al., 2023 [12]; Sierra et al., 2023 [13]). Additionally, Amazonian deforestation affects land–atmosphere moisture feedback and atmospheric stability, thus modifying precipitation patterns [14].
Severe droughts have occurred in Amazonia in the 21st century, such as in 2005, 2010, 2015–2016, and recently, in 2023–2024 (Espinoza et al., 2011 [15]; Espinoza et al., 2024 [16]; Marengo et al., 2024 [17]; Marengo and Espinoza 2016 [18]; Jimenez-Muñoz et al., 2016 [19]). These events caused major impacts on the Amazon society and ecosystem, which include the world’s largest tropical rainforest (e.g., Aragǎo et al., 2007 [20]; Malhi et al., 2009 [21]; Gatti et al., 2021 [22]). The droughts in the Amazon basin have been previously characterized based on the application of different drought indices, developing evaluations of the intensity and extension of these droughts and their impact (Aragǎo et al., 2007 [20]; Malhi et al., 2009 [21], Jiménez et al., 2019 [8,23], Doblas-Reyes et al., 2021 [24], Papastefanou, 2022 [25]; Mamani et al., 2025 [26]; Martínez-Castro et al., 2025 [27]). Considering the Maximum Cumulative Water Deficit (MCWD) as a measure of drought stress on the Amazon forest, Martínez-Castro et al., 2025 [27] identified the hydrological years of 2004–2005, 2009–2010, 2022–2023, and 2023–2024 as severe droughts, and 2006–2007 and 2015–2016 as moderate droughts.
This study has three main objectives. The first is to evaluate the components and closure of the surface and atmospheric water balances in the western Amazon Basin, using both gridded observational estimates and in situ measurements. The second is to analyze the impacts of recent extreme droughts on these balances by comparing them with climatological water budgets for the 2003–2024 period. Finally, the third is to assess uncertainties and examine the performance of different drought indices in detecting extreme events.

2. Data and Methods

2.1. Study Area

The study region encompasses the Peruvian and Ecuadorian Amazon basin, as illustrated in Figure 1, which depicts the sub-basins of the Marañón and Ucayali rivers. The Marañón river basin covers the northeastern part of the region, while the Ucayali river basin occupies most of the southeastern part, which together form the basin of the Peruvian and Ecuadorian Amazon, closing at the Tamshiyacu station (−73.160°, −4.000°) in the Loreto region (Peru), which will henceforth be referred to as the Tamshiyacu Basin. In addition, the Madre de Dios river basin was considered, located at the southeastern extreme of the Peruvian Amazon region, and closing at the Amaru Mayu station (−69.125°; −12.600°). More information about the basins can be found in the Supplementary Material (SM)).

2.2. Data Sources of Different Components of the Water Balance

We used three gridded data products for Pr and three for Et, two in situ river dis-charge records, and one flux tower record, as well as reanalyzed atmospheric circulation data.
For rainfall information, we used the second version of the Climate Hazards Group InfraRed Precipitation with Station data (CHIRPS 2.0) precipitation dataset, a satellite-based product with a 0.05° grid size (Funk et al. 2015) [28]. CHIRPS calibrates satellite-based estimates with in situ station data and can be accessed on https://data.chc.ucsb.edu/products/CHIRPS-2.0/ (accessed on 27 May 2025). In addition, we used the Multi-Source Weighted-Ensemble Precipitation (MSWEP), which is a global precipitation product with a 3 hourly 0.1° grid size merging gauge, satellite, and reanalysis data (https://www.gloh2o.org/mswep/ (accessed on 27 May 2025); Beck et al., 2019) [29]. Finally, we used monthly precipitation and evapotranspiration data from ERA5, which can be accessed at https://cds.climate.copernicus.eu/cdsapp#!/dataset/reanalysis-era5-land-monthly-means?tab=form (accessed on 27 May 2025).
For the estimation of Et, we used ERA5 Hersbash et al., 2020 [30]. The ERA5 Et data is estimated using data assimilation into a global atmospheric model coupled to the H-TESSEL land surface model (LSM; https://confluence.ecmwf.int/display/CKB/ERA5%3A+data+documentation, accessed on 27 May 2025). This dataset includes the accumulated amount of water that has evaporated from the Earth’s surface, as well as a simplified representation of vegetation transpiration in the air. The model accumulates the data for one day, after which it is adjusted to monthly values Hersbach et al., 2020 [30].
Additionally, we used monthly Et data from the Global Land Data Assimilation System (GLDAS; Rodell et al., 2004 [31]), which generates global land surface states and fluxes (e.g., soil moisture, evapotranspiration, runoff, and temperature) by combining observations with LSMs, obtained from the GLDAS NOAH Land Surface Model L4 monthly 0.25 × 0.25-degree V2.1. The authors concluded that the obtained Et maps and their statistics by country and land use were reliable, which justifies using it as an alternative data source. The data were obtained in the form of monthly files from NASA’s Earth data Search page (https://search.earthdata.nasa.gov/search/granules?p=C1342986036-GES_DISC&pg[0][v]=f&pg[0][gsk]=start_date&q=GLDAS_NOAH025_M_2.1&tl=1717633413.309!3!!, accessed on 27 May 2025) and were subsequently merged.
The dataset of de Mota-Paca et al. (2019) [32], which is the best validated for this region, was also used for part of the period, as these authors used several flow towers in Brazilian Amazon forest for validation of the dataset, which includes the period from 2003 to 2013, available at https://www.hydroshare.org/resource/24792a48a6394dcba52da62fa324ae40/ (accessed on 27 May 2025). This work used the results of six global Et products based on remote sensing techniques, which were merged to obtain a joint prediction of Et rates for the Amazon at a resolution of 250 m.
For direct comparison with experimental Et data, the dataset of observations from the Quistococha flow measurement tower was used. The Quistococha Forest Reserve (QFR) Amazonian AmeriFlux Site (AMERIFLUX code: PE-Qui) is located in the Peruvian Amazon, near Iquitos (Loreto Department), approximately at 3°47′ S and 73°19′ W. (https://ameriflux.lbl.gov/sites/siteinfo/PE-QFR) (accessed on 27 May 2025). The data available from this tower spans from 2018 to 2019, which limits its use to this period. The area is characterized by a humid tropical climate, with annual rainfall exceeding 2500 mm and average temperatures around 26 °C. The land cover is mainly mature secondary forest, with canopy heights between 15 and 30 m.
The discharge data series, from two hydrological stations in the Amazon and Madre de Dios rivers, was used as a reference to compare it with the ERA5 runoff data used for the Ro water balance. The station that aggregates the hydrological processes of the Peruvian Amazon river basin is the Tamshiyacu station, belonging to the Peruvian National Hydrometeorological service (Servicio Nacional de Hidrología y Meteorología—SENAMHI) network (code 240103; −73.160°, −4.000°), and the one closing the Madre de Dios river basin is the Amaru Mayu station, belonging to the Peruvian National Authority of water (Autoridad Nacional del Agua) network (code 30455012121; −69.125°; −12.600°).
The monthly discharge data for the Tamshiyacu station were obtained from daily measurements from 2003 to 2024. For the Amaru Mayu station, data were available only for the 2017–2024 period. After obtaining monthly discharge averages from daily values, they were transformed into runoff water layers in mm using the basin areas of 715,000 km2 for the Tamshiyacu Basin and 90,790 km2 for the Madre de Dios Basin.
For the atmospheric moisture budget, including the vertically integrated moisture flux divergence, used as convergence C, and the total column water vapor, for the tendency of precipitable water variation (PWV), the ERA5 dataset was used (https://cds.climate.copernicus.eu/datasets/reanalysis-era5-single-levels-monthly-means?tab=overview, accessed on 27 May 2025).
The land Total Water Storage (TWS) is the sum of all water contributions, including canopy water, rivers and lakes, soil moisture, and groundwater. For the calculation of terrestrial water storage anomaly (TWSA), CSR RL06 GRACE/GRACE-FO Gravity Recovery and Climate Experiment/(Gravity Recovery and Climate Experiment)-Forward mascon (mass concentration) data (Save et al., 20160) [33] were used. They were collected in two different satellite missions, GRACE (Tapley et al., 2004 [34]; Li et al., 2019 [35]) and GRACE-FO (Landerer et al., 2020 [36]), which had a discontinuity during part of the years 2017 and 2018 (https://www2.csr.utexas.edu/grace/RL06_mascons.html) (accessed on 27 May 2025) and were afterward linked in a homogeneous dataset with an intermediate gap period.
In the study period from 2003 to 2024, all the databases were available, discounting part of the years 2017 and 2018, where GRACE-GRACE-FO was not considered due to the discontinuity of these observations and some isolated months, as that database had gaps. The gaps smaller than 3 consecutive months were interpolated to obtain the monthly values, but when gaps of 3 or more consecutive months occurred, the year was dismissed.
The data processing system Climate Data Operators, version 2.5.2 (CDO), developed by the Max-Planck-Institut für Meteorologie, was used for model data processing (https://code.mpimet.mpg.de/projects/cdo, accessed on 27 May 2025).

2.3. Methodologies

2.3.1. Drought Events

In the present work we contribute to the characterization of the four extreme drought periods identified for the Peruvian Amazon region [27], including spatial precipitation distribution in the dry seasons in the extreme drought years, and the behavior of evapotranspiration and water balance for the defined study areas. Considering the regional severity of the drought and its spatial extent, estimated from averaging across six study subareas and three precipitation datasets, the hydrologic years of 2023–2024, 2022–2023, 2009–2010, and 2004–2005 were identified as extreme droughts and 2015–2016 and 2006–2007 as moderate droughts [27]. In the case of Et, an intercomparison of different data sources was included in the study.

2.3.2. Matching Coefficients

The quantitative comparison of the Et observational products and the Quistococha data was based on estimating relative bias, the Pearson correlation coefficient (r), and the Kling–Gupta modified efficiency coefficient (KGE). The mathematical expressions of the indices are in Equations (1)–(3).
Bias is a measure of the systematic difference between the values estimated by a model and the observed values. It indicates whether, on average, the model tends to overestimate or underestimate the actual data.
  B i a s = t = 1 n ( E D ) t = 1 n ( E R ) t = 1 n ( E R ) 100 %
The definition of the Pearson correlation coefficient is
                                                              r = t = 1 n ( E D i E D ¯ ) t = 1 n ( E R i E R ¯ ) t = 1 n ( E D i E D ¯ 2 ) t = 1 n ( E R i E R ¯ ) 2 100 %                    
where the subscript D refers to the model and the subscript R refers to the observations from the reference databases.
The modified Kling–Gupta efficiency (KGE) index (Kling et al., 2012) [37] is defined as
                      K G E = 1 r 1 2 + σ D μ D σ R μ R 1 2 + μ D μ R 1 2
KGE is a measure of the linear relationship between two variables. It evaluates how much one variable varies as a function of another. In this context, it indicates how well the model tracks the variation in the observed data. The KGE index integrates other statistical metrics such as bias and correlation coefficients.
The Et records were evaluated for three basins, based on the spatial mean values measured in each of them, to determine the coincidence behaviors and the datasets deviating from the generality. To analyze the mean spatial distribution of Et in the entire study area, the maps of the mean climatological distributions for the information period of each database were plotted. Both the KGE and bias were calculated for each of the basins.

2.3.3. Water Balances

The water balance equations include the surface (SB) and atmospheric balance (AB) (Zeng, 1999 [38]; Builes-Jaramillo and Poveda, 2018 [3]), expressed by the Equations (4) and (5). SB is defined as
dS/dt = Pr − Et − Ro,
where dS/dt is the variation of soil water storage anomaly in one month, or difference in the total water storage anomaly (TWSA) between two consecutive months. These fields were obtained from GRACE-GRACE-FO (ΔTWSA), (Balsamo et al., 2009) [39] while Pr, Et, and Ro are directly obtained from ERA5.
AB is defined as
d W d t = C P r + E t      
where d W d t is the precipitable water column monthly increment, or variation, which is obtained from processing the vertically integrated water vapor column obtained from ERA5. The term d W d t , which is very small compared to the other magnitudes, and the rest of the variables are directly obtained from ERA5. Here C is vertically integrated moisture flux convergence, which is obtained from the ERA5 integrated moisture flux divergence variable with changed sign.
The importance of these balances is that they describe the water cycle, both in the atmosphere and on the surface, based on the conservation of water mass. However, the measurement of its components with spatial continuity is extremely difficult, which determines the need to estimate them through satellite data and numerical models. However, this fact introduces uncertainty, and therefore, different datasets are used to try to improve its determination.
To estimate the general balance of the water system, the imbalance between the surface and water balances is calculated. This is obtained from the comparison of the vertically integrated moisture flux convergence in the atmosphere and the total runoff in the surface. A magnitude to estimate the long-term balance between the surface balance and the atmospheric balance is the imbalance (I), which can be quantified through the following expression (Marengo, 2004 [40]; Builes-Jaramillo and Poveda, 2018) [3]:
I = C R o 1

2.3.4. Drought Indices

The Amazon is home to one of the most biodiverse and extensive ecosystems on the planet. It is particularly vulnerable to droughts, which can have significant impacts on its biodiversity, hydrological cycles, and ecological functions. Various drought indices had been used to monitor and assess these events, including the MCWD (Aragao et al., 2007 [20]), the standardized precipitation–evapotranspiration index (SPEI) Vicente-Serrano et al., 2012 [41], and the self-calibrated Palmer Drought Severity Index (scPDSI; Wells et al., 2004 [42] (e.g., Aragao et al., 2007 [20]; Papastefanou et al., 2022 [25]; Paredes-Trejo et al., 2022 [43]; Martínez-Castro et al., 2025 [27]), showing that no single index is superior in all situations, and all are applied in the present work.
The MCWD is an indicator specifically designed to assess water stress in tropical ecosystems such as the Amazon. It calculates the monthly accumulated water deficit, considering the difference between Pr and Et. A high MCWD value indicates a prolonged period of water deficit, which is critical for understanding the impact of drought on Amazonian vegetation [6,10]. This index was obtained in this work by the application of a chain of CDO commands based on the algorithm explained in [27]. The SPEI is a multiscale index that assesses drought by incorporating both Pr and potential evapotranspiration, allowing for a more complete representation of the water balance. Its ability to adapt to different time scales makes it useful for analyzing short- and long-duration droughts. Studies have shown that the SPEI offers better correlations with hydrological and ecological variables during critical periods, such as summer, compared to other indices (Vicente-Serrano et al., 2012 [41]). This index was obtained in its monthly variant (known as SPEI1) using the scripts available in https://climate-indices.readthedocs.io/en/latest/ (accessed on 27 May 2025) from the page https://github.com/monocongo/climate_indices/tree/master? (accessed on 27 May 2025). The annual values were obtained by averaging the monthly values of the index. The scPDSI is an improved version of the original PDSI, designed to be more adaptable to different climatic regions. This index is based on a water balance model that considers soil water supply and demand, automatically adjusting to local conditions. A script developed by two of the authors was used to obtain the index (https://github.com/mapsm12/DroughIndexes, https://climate-indices.readthedocs.io/en/latest/ (accessed on 27 May 2025), which was originally published by Herrera and Ault (2017) [44]. Although the scPDSI has been useful in many regions, including the Amazon, it has limitations in its application in this region due to its hydrological characteristics (Jiménez-Muñoz et al. 2016 [19]; Lewis et al. 2011 [45]). Therefore, a specific intercomparison of the performance of these indices specifically for the Peruvian–Ecuadorian Amazon is necessary (Zang et al., 2020) [46]. In this study, the three indices are calculated for the period 2003–2024, where several well-documented drought periods have occurred. Their identification from the records of these indices is evaluated using a comparative approach.

3. Results

The results are structured into two main analytical components to provide a comprehensive understanding of the phenomena under study. The first component addresses the uncertainties associated with the hydroclimatic variables and the selected drought index during the periods classified as extreme droughts. This includes an evaluation of data consistency, potential biases between datasets, and the implications of these uncertainties for drought characterization. The second component examines the impacts of extreme droughts on the regional water balance. Particular attention is given to quantifying the variations in precipitation, evapotranspiration, and total water storage anomalies, as well as identifying shifts in the relative contributions of each component to the overall balance, thereby elucidating the hydrological responses to extreme drought conditions.

3.1. Precipitation

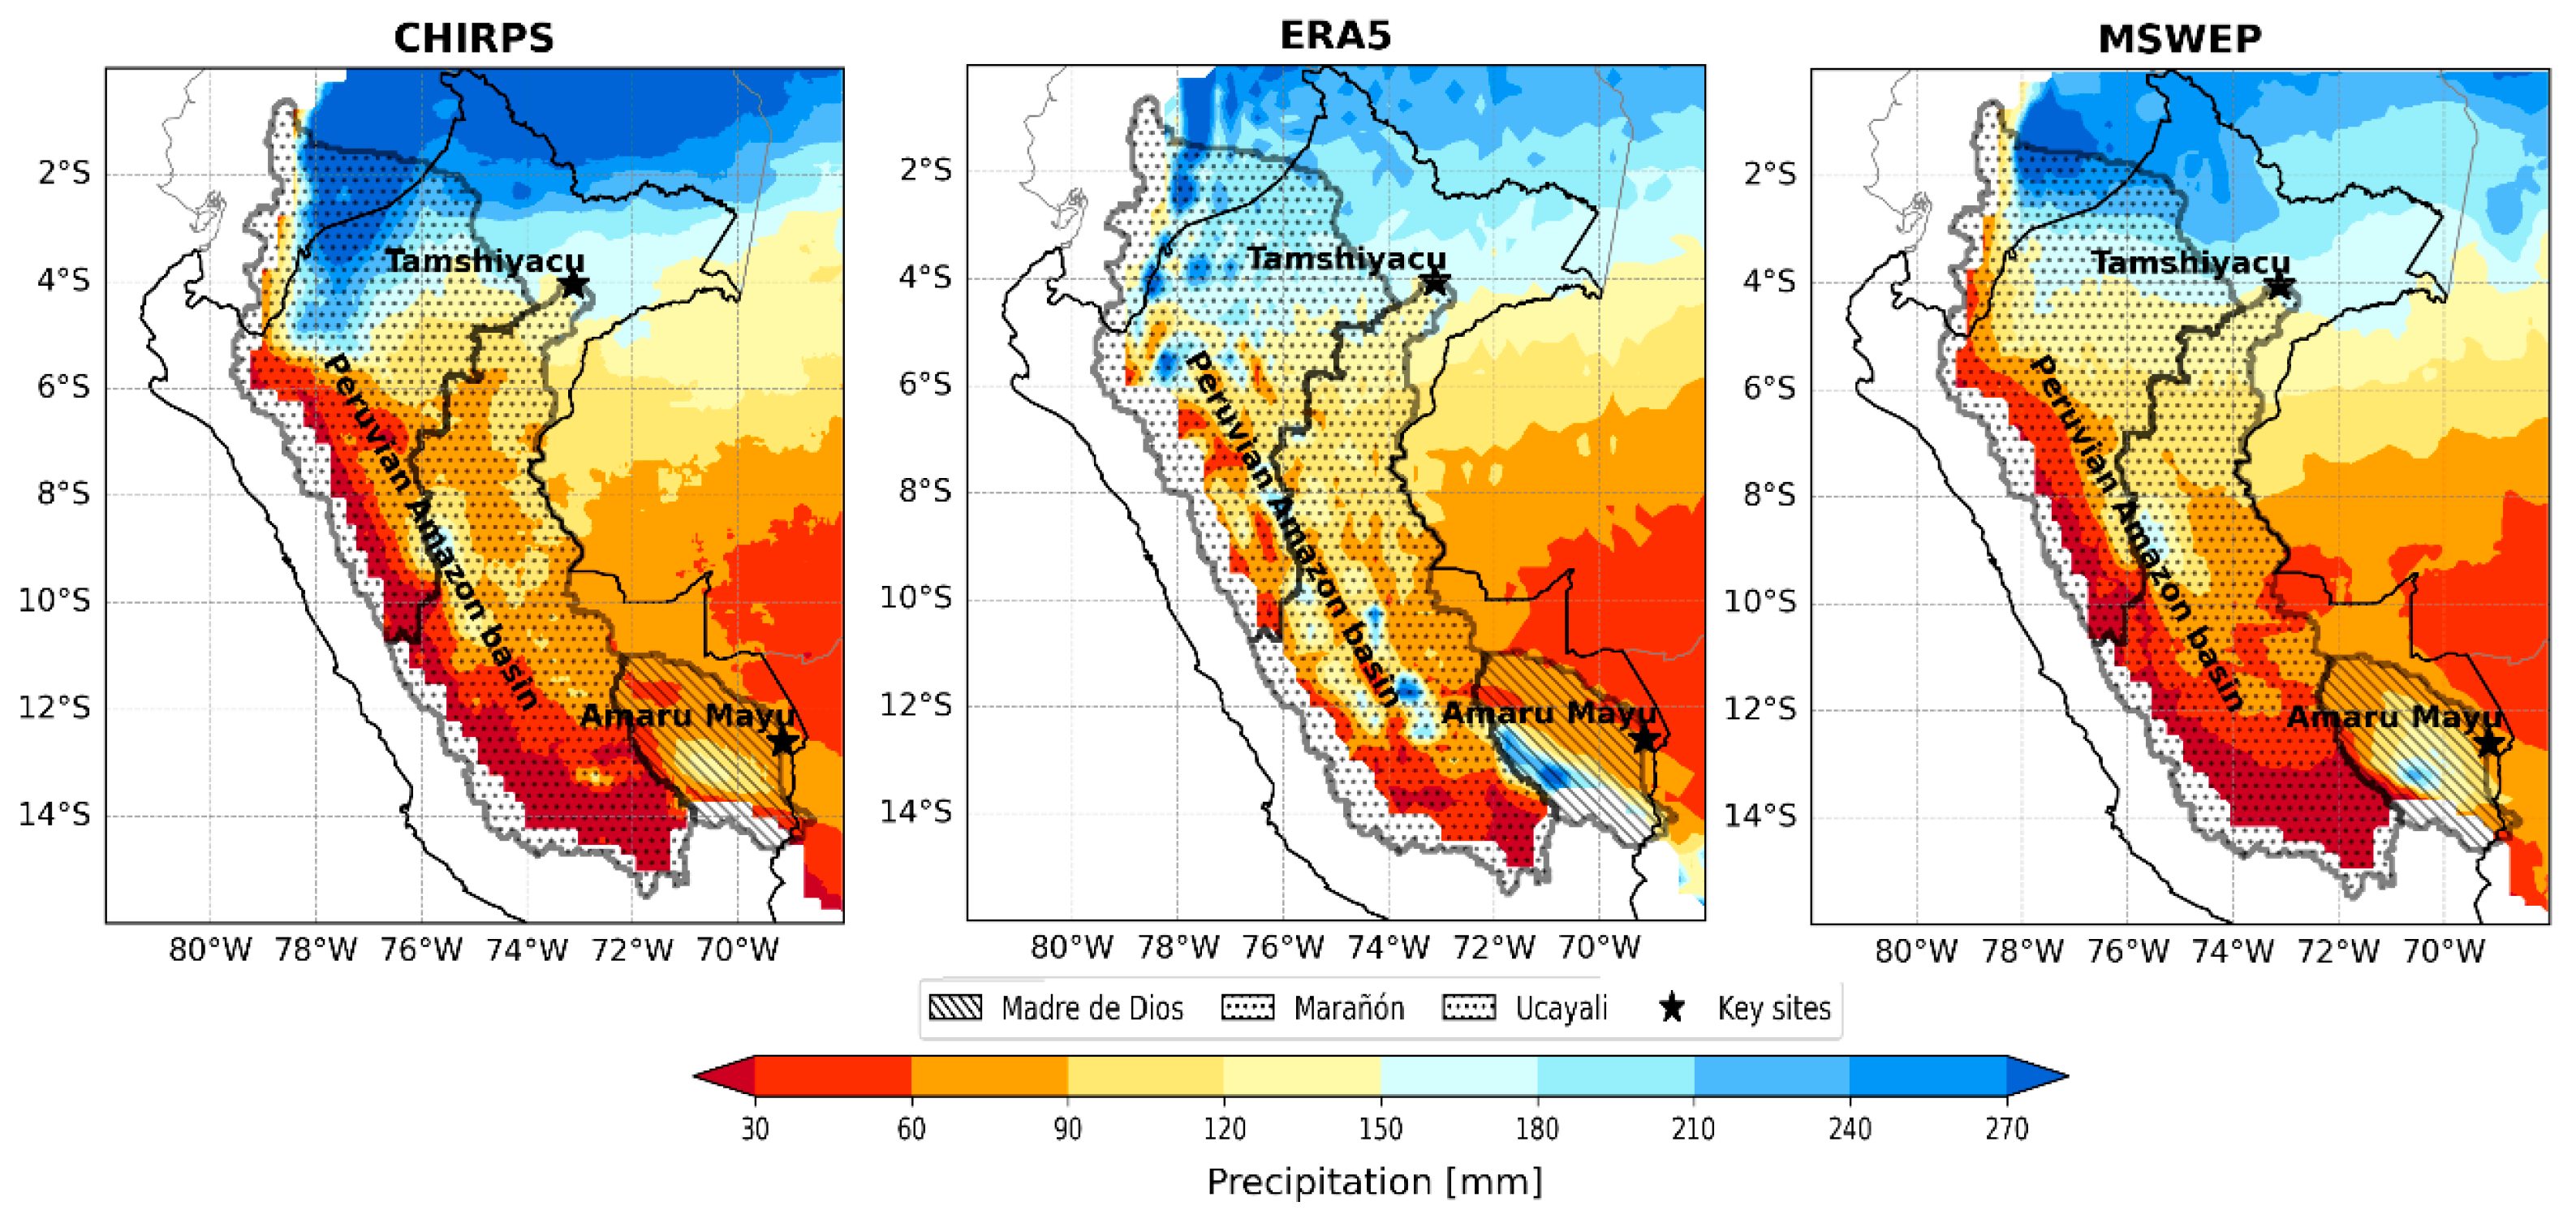
The analysis of the composition of the MCWD index allows us to conclude that in most cases, the presence of drought in a certain hydrologic year is mainly influenced by the deficit in the monthly Pr relative to monthly Et in the last four months of the hydrologic year, i.e., June, July, and August, and frequently, also in September (Figure 3 of [27]). Following this criterion, the reference climatology of the dry seasons of the 2003–2024 period, shown in Figure 2, was used to produce precipitation anomalies and relative anomalies for the dry season of the extreme drought years (Figure 3).
Following CHIRPS estimations, the 2005 drought was characterized in the dry season by very low Pr relative to the climatology all over the two basins. The contrast was less in 2010, where the rainfall deficit was also intense during the 2009–2010 austral summer characterized by a El Niño event (Espinoza et al., 2011) [15], but precipitation was also lower than the climatology. For 2023, it is evident that there is great extension of the drought-affected area with very low absolute and relative values of precipitation, reaching the northwest of the Marañón Basin, inside Peru. The year 2024 represents a more intense continuation of the drought conditions observed in 2023.
The average climatological distributions obtained from the three Pr data sources are very similar, but ERA5 seems to overestimate precipitation in topographically complex regions and, in particular, in the Andes–Amazon transition region ([27]; Hu et al., 2021 [47] and Ou et al., 2023 [48]). In general, the CHIRPS climatology is more wet in most of the area, except its northernmost region. The CHIRPS and MSWEP distributions are very similar, with the Madre de Dios Basin and the northern part of the Ucayali Basin being somewhat drier for CHIRPS.

3.2. Intercomparison of Evapotranspiration Datasets

In this section, ERA5 and GLDAS Et data are compared with the Amazon-Paca 10-year dataset, and will be verified for two years of observations using data from the Quistocoha AMERFLUX dataset.
Figure 4 shows the records of the annual arial average of Et for the Tamshiyacu and Madre de Dios Basins. In the Tamshiyacu Basin (Figure 4A), it is observed that the Amazon-Paca record is closer to the ERA5 record, but in the Madre de Dios Basin (Figure 4B), it is closer to GLDAS. In both cases, the records are relatively close to each other. To quantitatively evaluate the coincidence of the datasets, the bias, Pearson correlation coefficient, and KGE were obtained and are shown in Table 1. For both basins, the ERA5 Pearson coefficients are much better than for GLDAS, even if they are not significant at the 90% level, in part due to the limited sample of 10 years. The KGE coefficients can be considered acceptable as they are positive, but they do not reach the 0.5 threshold.
Additionally, the estimations of the ERA5 and GLDAS datasets were compared with the Et data from the Quistococha tower, since these datasets include the available observational period of 2018–2019. The observed latent heat flux data was converted to Et using the latent heat of vaporization value of 2.43 × 10⁶ J/kg corresponding to 30 °C. Figure 5A shows the series of monthly Et data from ERA5 and GLDAS and the monthly averages of observations in Quistococha. The positive bias of the two datasets with respect to the observations can be seen from the positions of the lines, and the superior performance of ERA5 in relation to GLDAS is clear as its record is always closer to the observations. Both datasets have significant Pearson correlation coefficients, with significance higher than 99.9%, but ERA5 shows a higher Pearson coefficient (Figure 5B). The KGE index is positive for both databases, which means good performance, but it is lower than 0.3 for GLDAS and close to 0.6 for ERA5, showing a relatively high KGE efficiency (Kling et al., 2012) [37]. It can be concluded that ERA5 is a suitable dataset for the estimation of evaporation, but with uncertainty, mainly at the scale of a basin, considering that the high correlations are partially related to the monthly character of the values, involving the presence of similar annual cycles for the reanalysis dataset and the observations.

3.3. Drought Indices

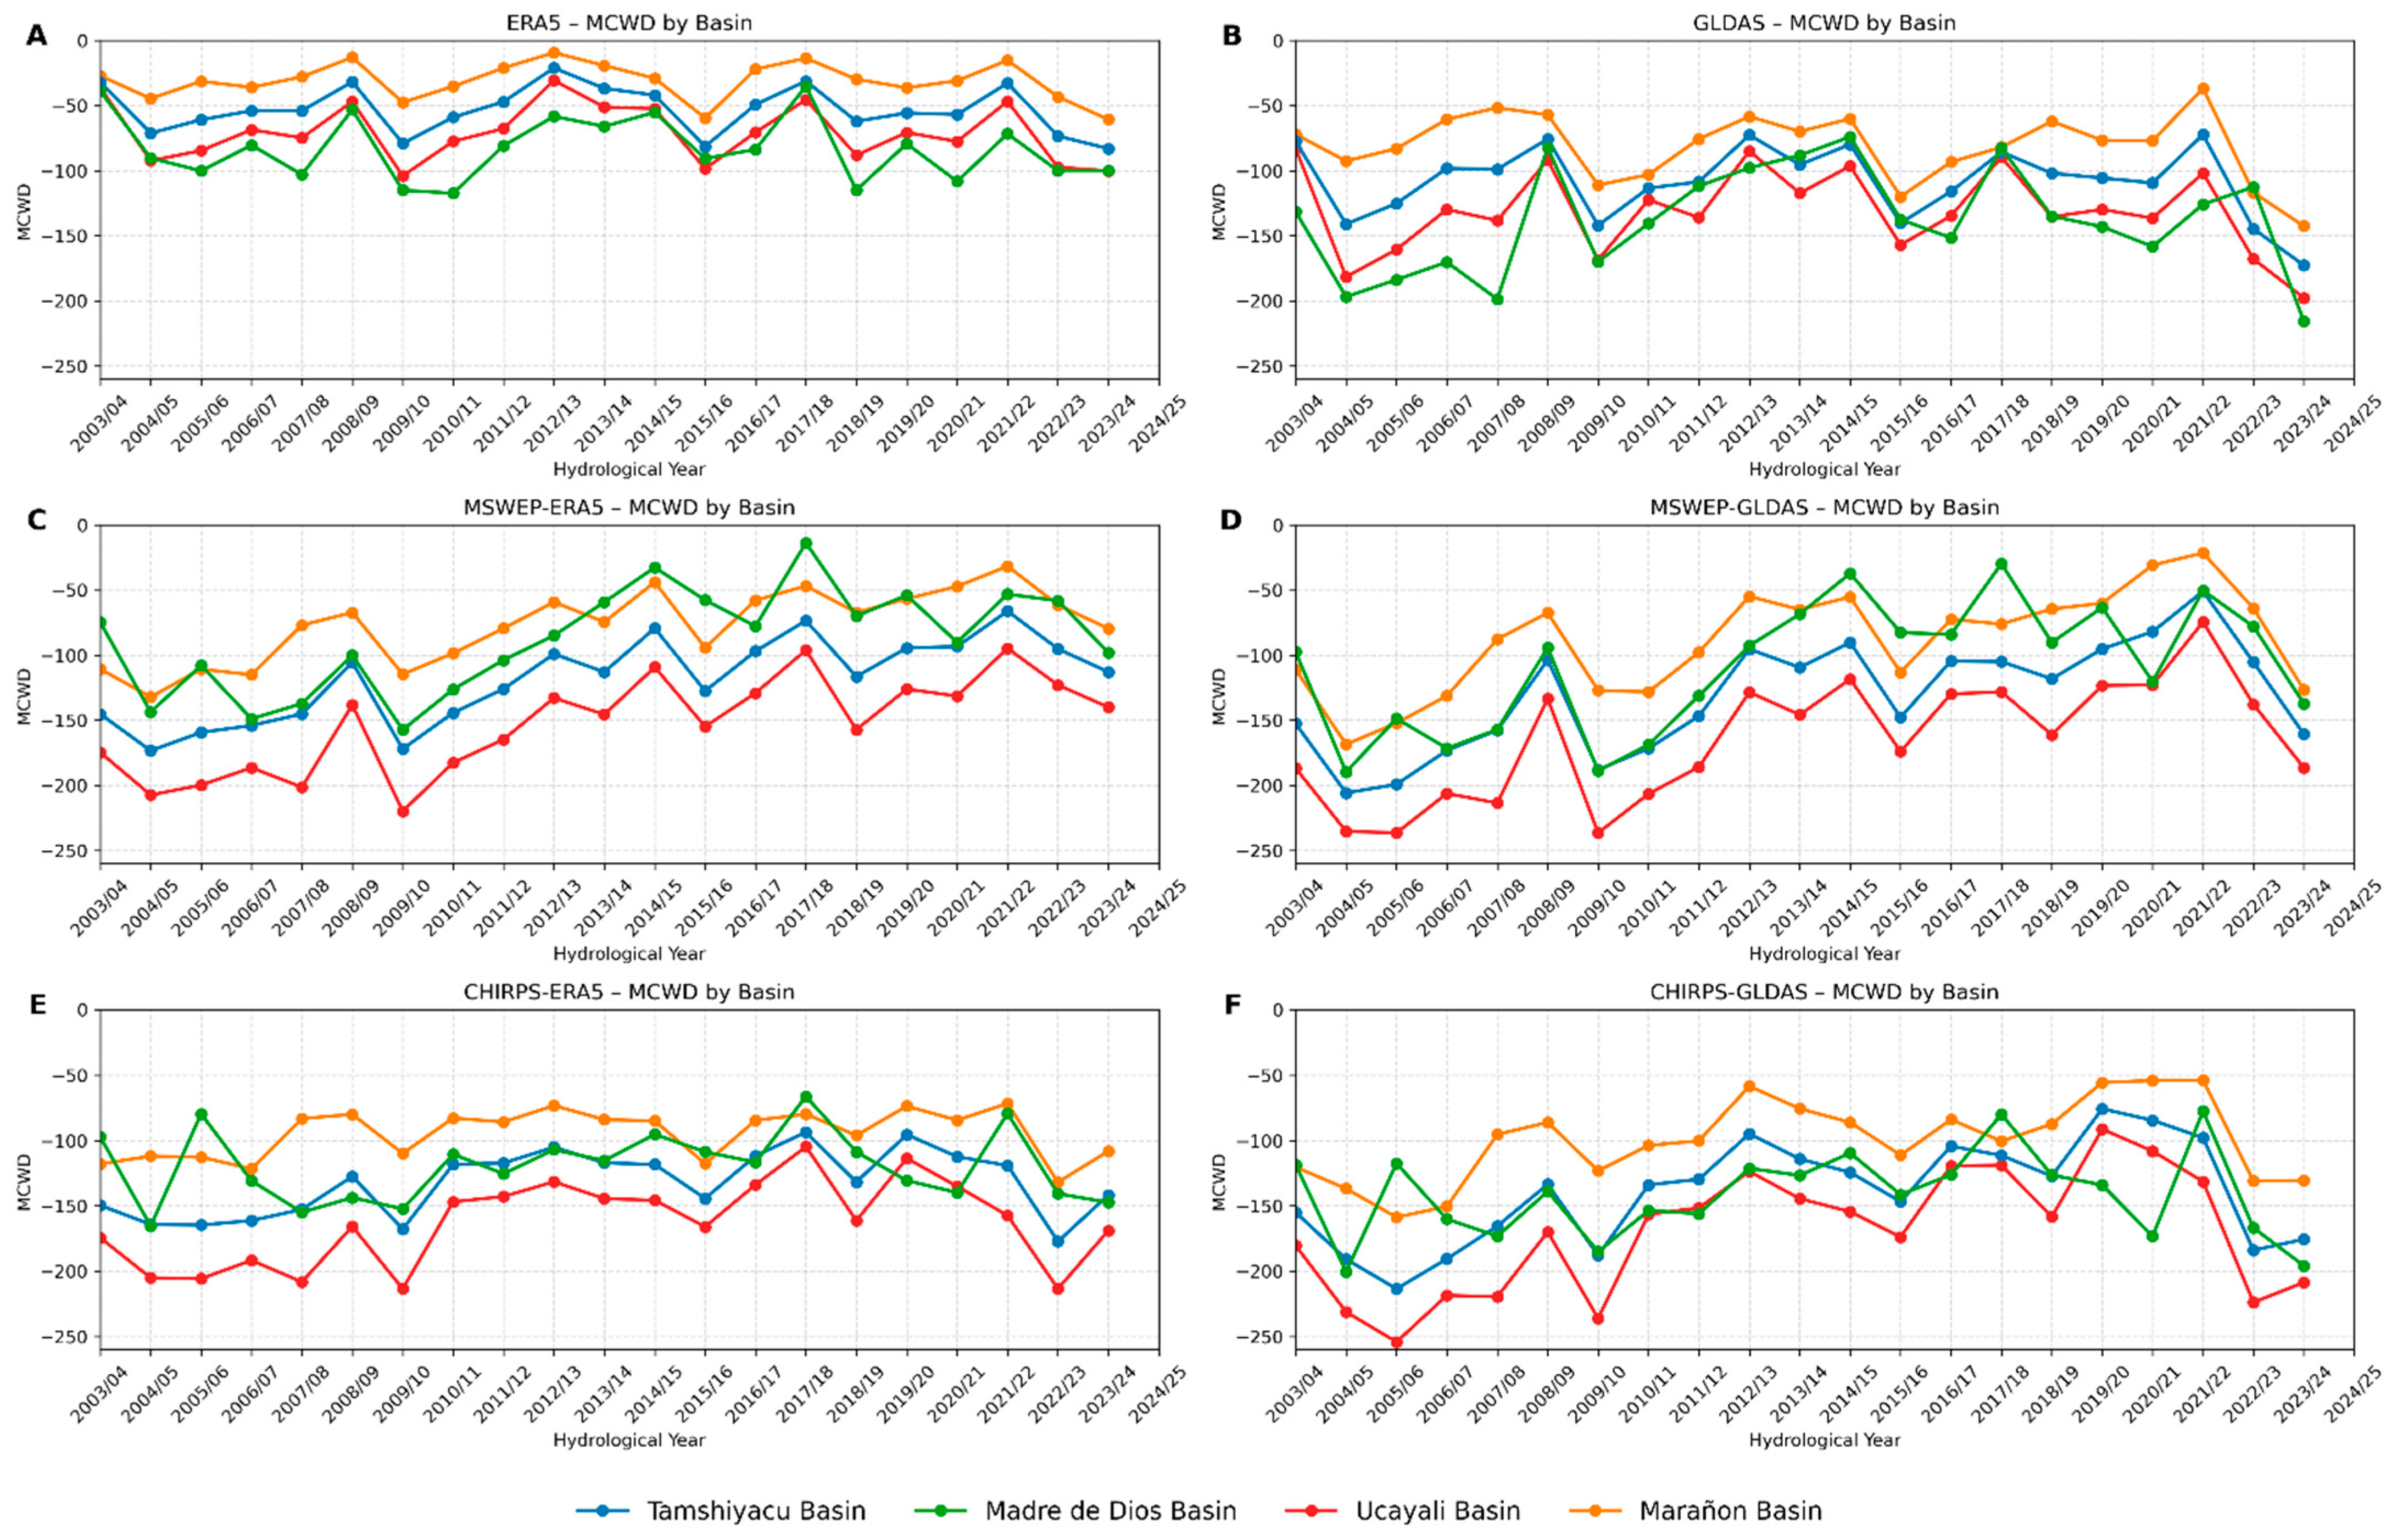
Each panel of Figure 6 displays the MCWD records for the hydrological years under study for each of the basins. The ERA5 (Figure 6A) and GLDAS (Figure 6B) records are relatively similar, with a clear minimum signal observed in the years 2004–2005 and 2009–2010, reported as Amazonian droughts (Papastefanou et al., 2022) [25], and for Peru, in [27]. Relative minima are also observed for the 2015–2016 drought in the ERA5 dataset and for the drought that lasted from 2022 to 2024, which in this case was more noticeable in GLDAS, showing an absolute minimum in 2023–2024. In some of the basins or dataset combinations, minima appear in hydrologic years that are not considered as severe or moderate droughts for all the Peruvian Amazon region, as in 2010–2011 or 2018–2019 in ERA5-Madre de Dios, or 2007–2008 in GLDAS-Madre de Dios, showing that drought conditions can be locally present in a basin, not affecting the whole western Amazon, or be detected by a certain index, but not be coincident with the others. The MSWEP records combined with ERA5 and GLDAS evapotranspiration are shown in Figure 6C,D. The minima of the first two extreme droughts of the century are clearly reproduced, but the 2015–2016 moderate drought is expressed as a secondary minimum, as are the 2022 to 2024 extreme droughts, which appear as minimal values. In the CHIRPS, combined with the ERA5 (Figure 6E) panel, the 2004–2005 minimum is well expressed in the Ucayali Basin record as the most negative value, together with the 2022–2023 hydrologic year. This is also the case for the entire Tamshiyacu Basin record. The 2004–2005 case shows a very low value too, and the 2023–2024 drought shows a moderately low value. CHIRPS-GLDAS shows clear minima for 2009–2010 and 2022–2023 and a very low value for 2023–2024 in Ucayali and the Tamshiyacu Basin, and a minimum for 2023–2024 in the Madre de Dios Basin. An absolute minimum in 2005–2006 is noticed, which had not been present with the combinations of observations with ERA5 in [27].
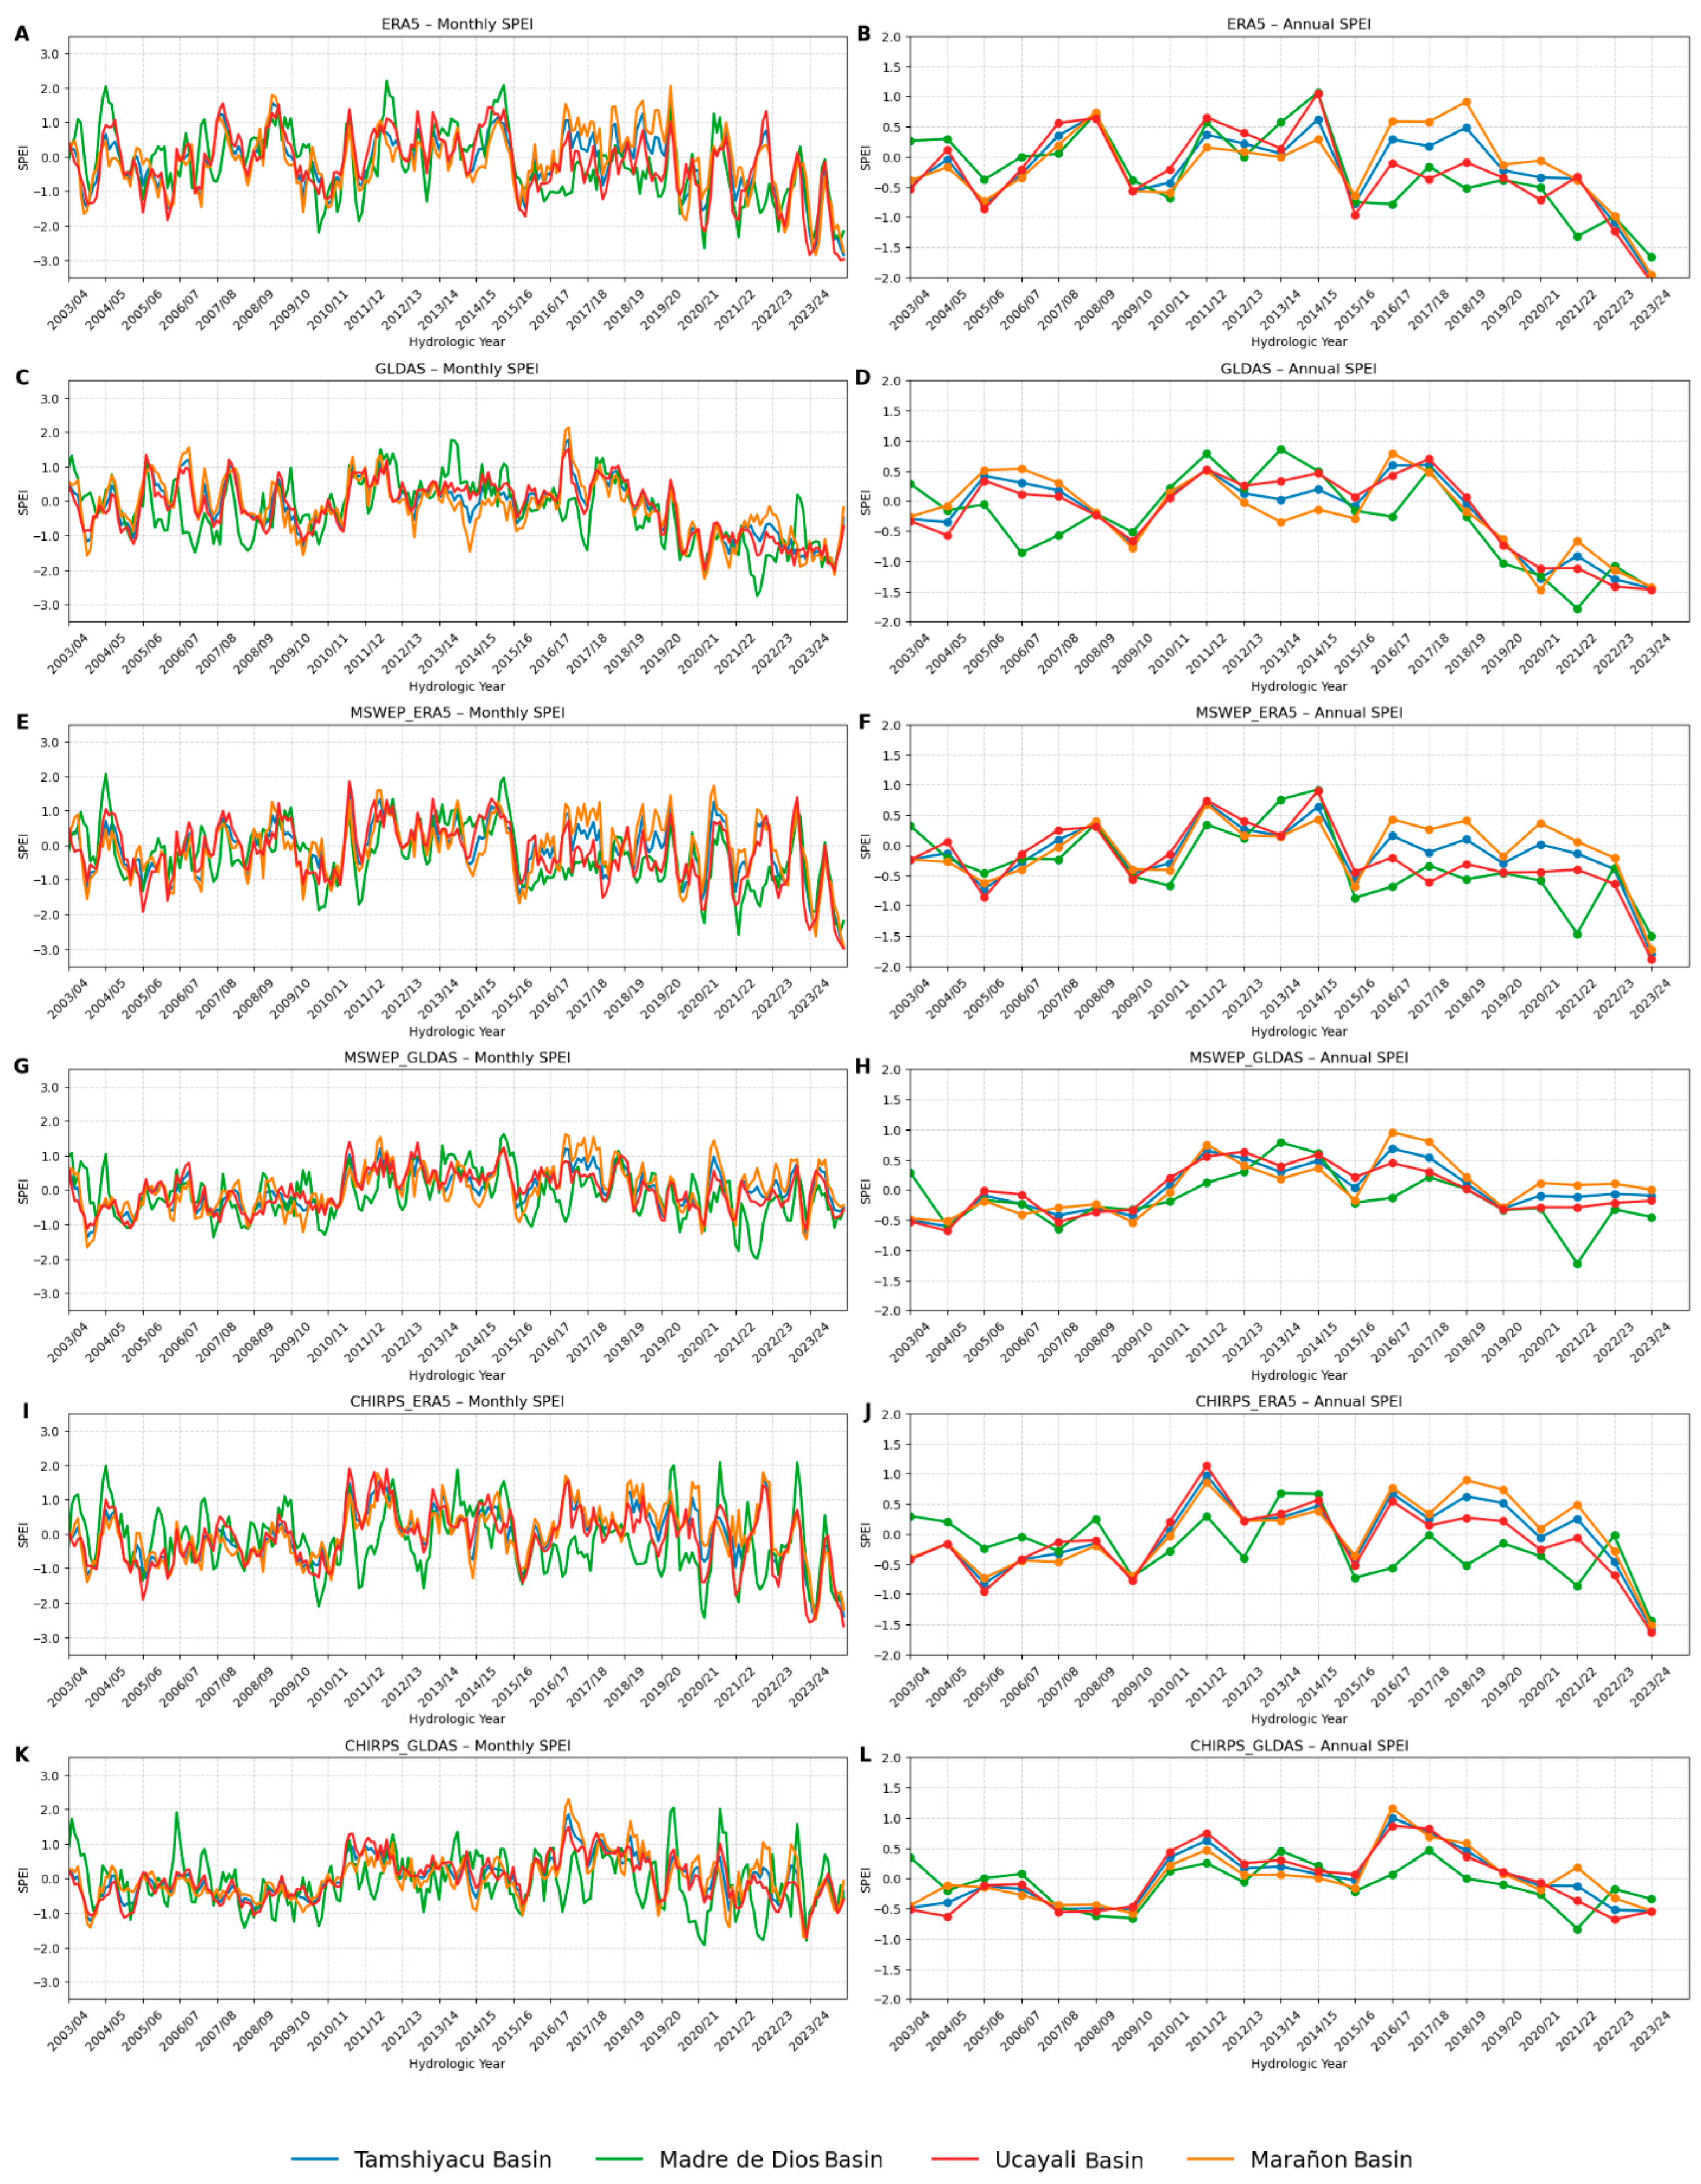
The application of the SPEI and scPDSI indices allows the evaluation of Amazonian drought conditions on a monthly time scale, and the behavior of the annual averages of these indices are subsequently estimated based on the average of the months for each hydrologic year. Figure 7 shows the monthly SPEI1 and annual averaged SPEI series according to the different data sources. Drought years are reflected in the monthly record with a minimum in the dry months, which constitute the end of the hydrological year. In the case of ERA5 (Figure 7A,B), the records correctly reflect the droughts of 2009–2010 (especially in Madre de Dios). The droughts of 2015–2016 and those from 2022 to 2024 are also reflected, while the drought of 2004–2005 is not clearly shown and appears to have occurred in the previous year. The GLDAS estimate (Figure 7C,D) is similar but shows the drought of 2005–2006 as a relative minimum, although it does not clearly reflect the drought of 2015–2016. These estimates are best appreciated in the annual records, where the extreme nature of the drought during the 2022–2024 period is clear compared to the rest of the century record. In the MSWEP-ERA5 records (Figure 7E,F), the drought periods are less differentiated, with monthly values lower than −1, particularly for Madre de Dios, where the monthly index is well under −1. SWEP-GLDAS (Figure 7G,H) shows less variability and does not produce the 2024 minimum. CHIRPS-ERA5 (Figure 7I,J) better reflects the drought periods, although the average index for 2023 is attenuated by the summer months with high indices, except for Madre de Dios, where a clear minimum is seen, while CHIRPS-GLDAS (Figure 7K,L) also lowers variability and omits the 2024 minimum. Overall, although years with extreme drought are reflected in the SPEI records, none of the estimates reach modularly high drought indices, except for 2022–2024, pointing to the need to reinterpret the thresholds for this index for the Amazon.
Figure 8 shows the monthly behavior and annual averages of the scPDSI index. The monthly index values estimated from ERA5 (Figure 8A,B) reflect the drought periods, which are seen with minima (thus, more severe droughts) at the end of the hydrological years 2004–2005, 2009–2010, 2015–2016, 2022–2023, and 2023–2024. These minima are also noticed in the annual records, except the first one, which is canceled out by the index maximum at the beginning of the corresponding hydrological year. The GLDAS records (Figure 8C,D) are similar, although they show the 2004–2005 drought for the Madre de Dios Basin much more clearly. According to MSWEP, with ERA5 (Figure 8E,F) data, the Marañón Basin was the most affected by the 2004–2005 drought. For this combination, the droughts of 2015–2016 and 2022–2024 are much less evident. When complemented with GLDAS Et data (Figure 8G,H), the drought signal improves, except for those of 2022–2024, which remain poorly reflected in the record. The CHIRPS estimates with ERA5 (Figure 8I,J) and GLDAS (Figure 8K,L) are quite similar and reflect droughts as absolute or secondary minima, showing the 2022–2024 droughts somewhat better as a relative minimum, although the absolute values of the indices remain relatively small.
The qualitative intercomparison between the MCWD, SPEI, and scPDSI indices for describing Amazonian droughts allows us to conclude that although these indices are sensitive to droughts, the MCWD is more useful for diagnosing them on an annual timescale, as it is not affected by wet season rainfall and considers the effects of drought cumulatively.
The uncertainty in the estimates for each index was investigated based on the applied data sources. For this purpose, scatter plots were drawn between pairs of data sources for each index (Figure S3), and matching coefficients were calculated, including bias, Pearson’s linear correlation coefficient, and the Kling–Gupta efficiency index. Table 2 shows the matching coefficients for these combinations of MCWD estimates. This result suggests that using observational Pr datasets for drought studies reduces uncertainty, independently of the precipitation dataset or the Et reanalysis source.
To investigate the consistency of drought conditions estimation using different drought indices, a direct comparison was made across a series of annual values of the three applied drought indices for the Tamshiyacu Basin using the combinations of CHIRPS and MSWEP Pr with ERA5 Et. To obtain comparable series, the indices were standardized using averages and standard deviations to produce non-dimensional z-scores. The MCWD shows good coincidence with the scPDSI and SPEI in Tamshiyacu for Pr from ERA5 and CHIRPS (Figure 9A,C), with a high Pearson coefficient, significant at more than 99.9% (Table 3), but in the case of MSWEP, the correlation was high only with scPSDI. On the other hand, for Madre de Dios, the correlations were non-significant at the 90% level, except for the SPEI with ERA5, and the scPDSI with MSWEP, which were just significant at the 90.0% level. These results suggest that the greater area of Tamshiyacu makes the coincidence of the MCWD with the other two indices, which can be considered to be the best, possible. The best correlation with the scPDSI with respect to the SPEI seems to indicate that deeper research is needed in the application of this index, which was used in its SPEI1 form for every month and averaged yearly.

3.4. Average Monthly Cycles and Annual Variation of Components for Water Balance

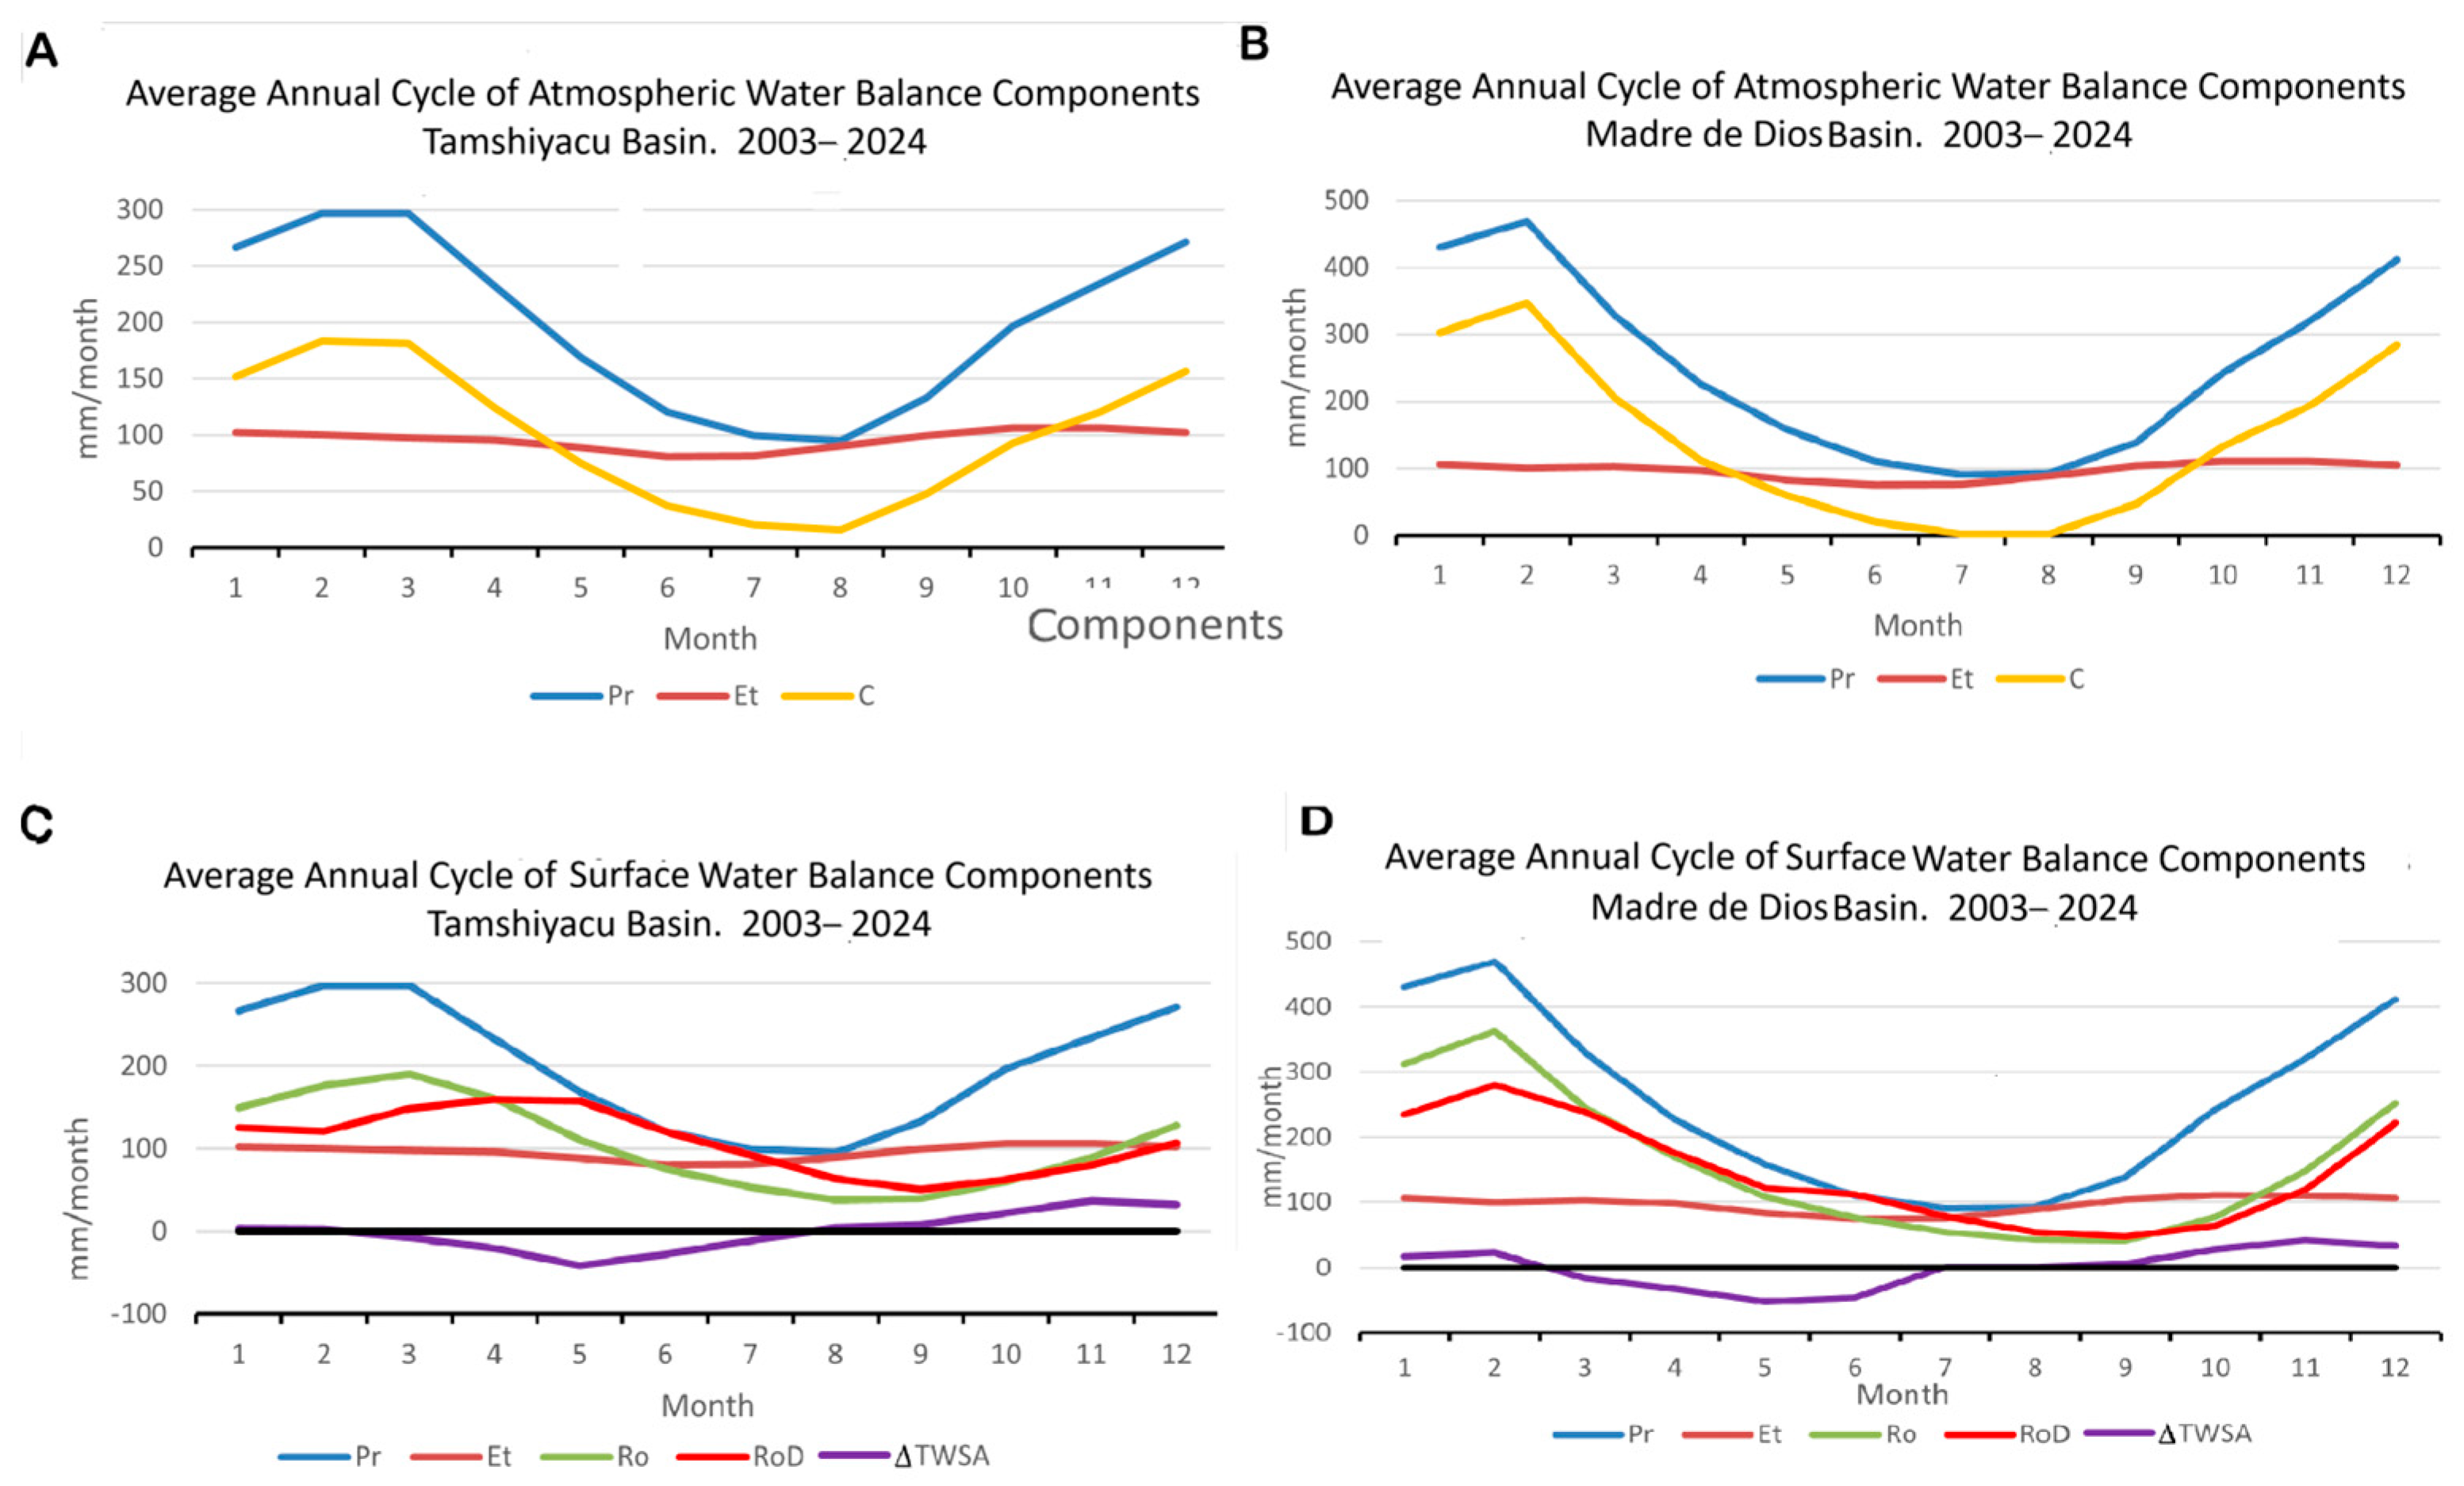
The climatological annual cycle of the components of the atmospheric and surface balances is shown in Figure 10 for the Tamshiyacu and Madre de Dios Basins. The vertically integrated water vapor variation ΔVIW is negligible compared with the other variables, as can be seen in the Supplementary Material, Table S1. Figure 10A shows the atmospheric water balance for the Tamshiyacu Basin, where lower values of Pr and C are observed in the dry season and the minimum value of C is scarcely greater than zero. This is related to the lower moisture convergence in the Amazon region during this season, inducing low Pr (Espinoza et al., 2024 [2]). The similar annual cycle for the Madre de Dios Basin (Figure 10B) reveals that in this case, the climatological value of C reaches zero in the month of August. In both cases, the average Pr and Et are equal for August, showing that there are frequent water deficits in this month in the study period. The surface water balance for the Tamshiyacu Basin is shown in Figure 10C. The average lag of ΔTWSA is clear, with minima for the other components in July–August. In this figure, besides runoff from the ERA5 estimations, the annual cycle of the runoff depth (RoD) is shown, obtained from the Amazon discharge measured at Tamshiyacu station. The difference of two months in the temporal position of the maximum runoff is apparent from the figure. It is a consequence of the time needed for the displacement of the surface and underground water to reach the river through the broad Peruvian–Ecuadorian Amazon Basin, which is not well represented by the ERA5 algorithms.
The lower excess runoff in the dry season in Madre de Dios with respect to Tamshiyacu is apparent in Figure 10D. The more marked seasonality of the Madre de Dios Basin is apparent from the wider range of the Y axis in its two water balance plots. The observational runoff depth is also shown in this figure, but the representation of this record is only 8 years (2017–2024). However, the lag of the ERA5 runoff maximum is not observed in this case because of the smaller area of this basin.
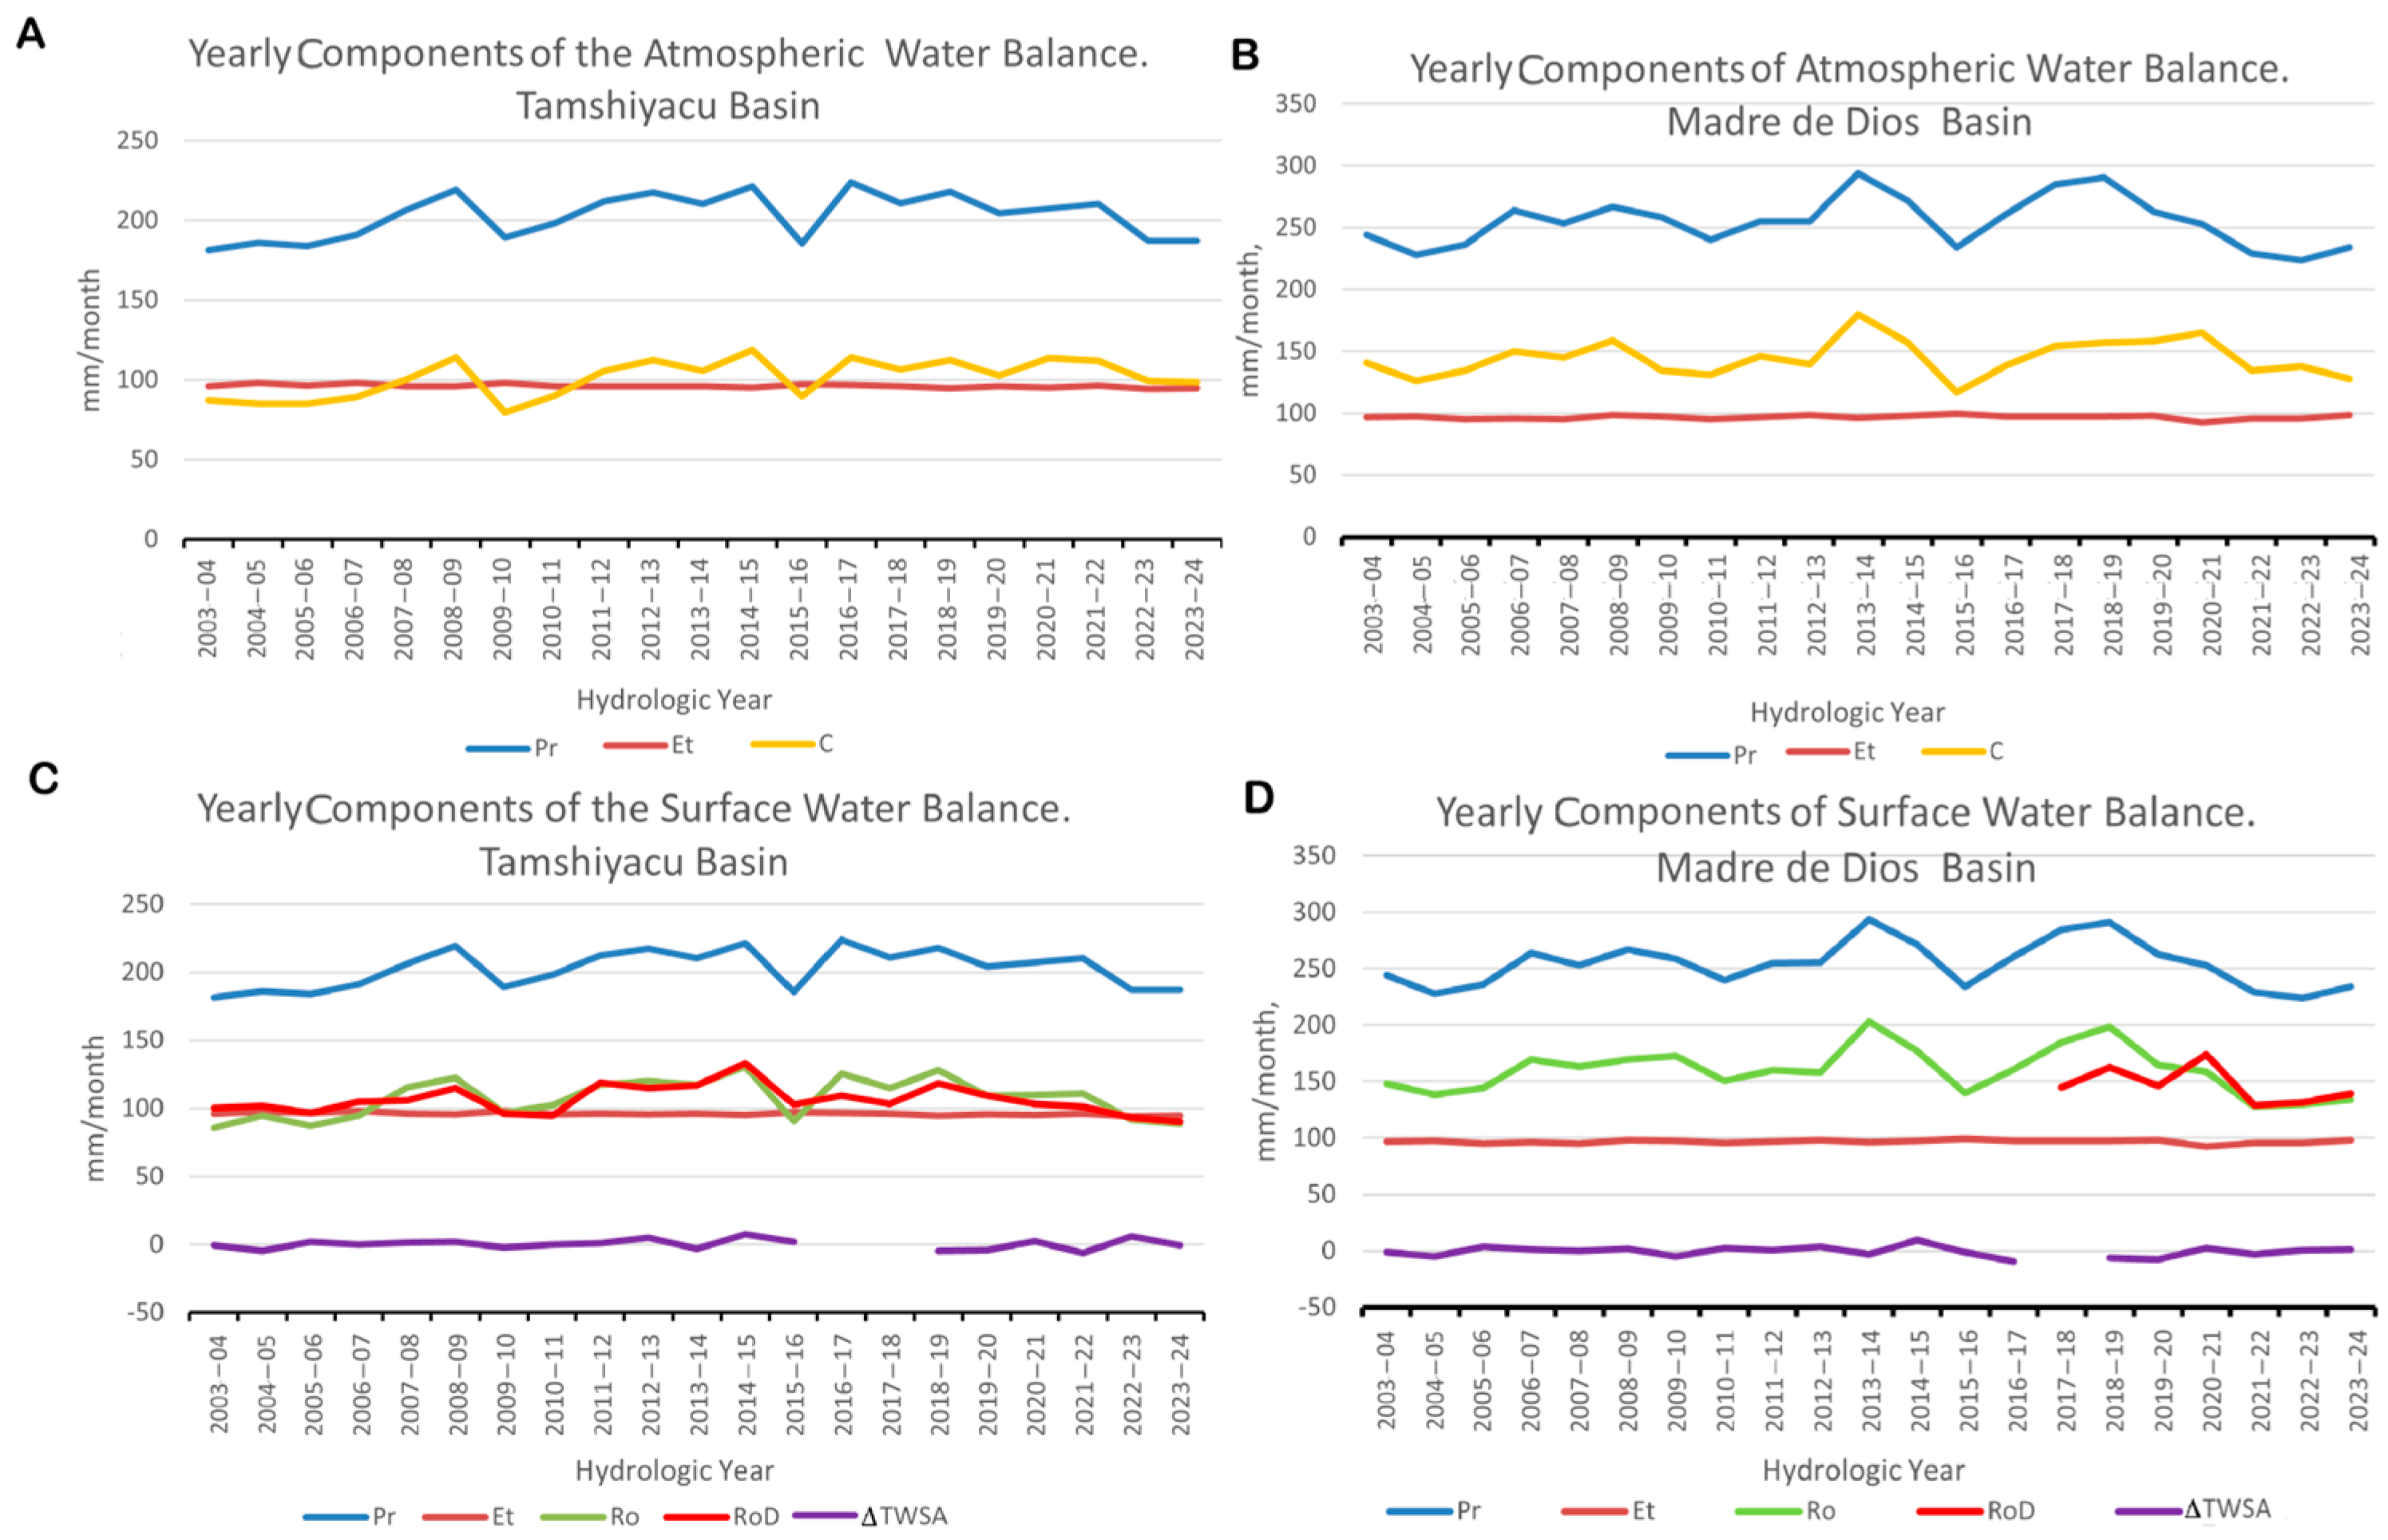
Figure 11 shows the yearly average values for the components of the atmospheric (Figure 11A,B) and surface (Figure 11C,D) water balances for each of the hydrologic years in the study period in both basins. All values are shown in Table S1 in the Supplementary Material.
When analyzing the atmospheric and surface water balance components during extreme droughts, the events of 2005 and 2010 show minimal or relatively small values for all the components, and the moderate drought of 2015–2016 shows minima in both basins (Figure 11). The observed runoff depth obtained from observed discharge RoD shows coincidence with Ro throughout the study period, showing that the ERA5 estimation is good in the long run. The runoff depth is also near to the ERA5 estimation for Madre de Dios, particularly for the last four years of the study period, but this is not conclusive due to the limitations of the observational sample for this basin. (Figure 11C,D).
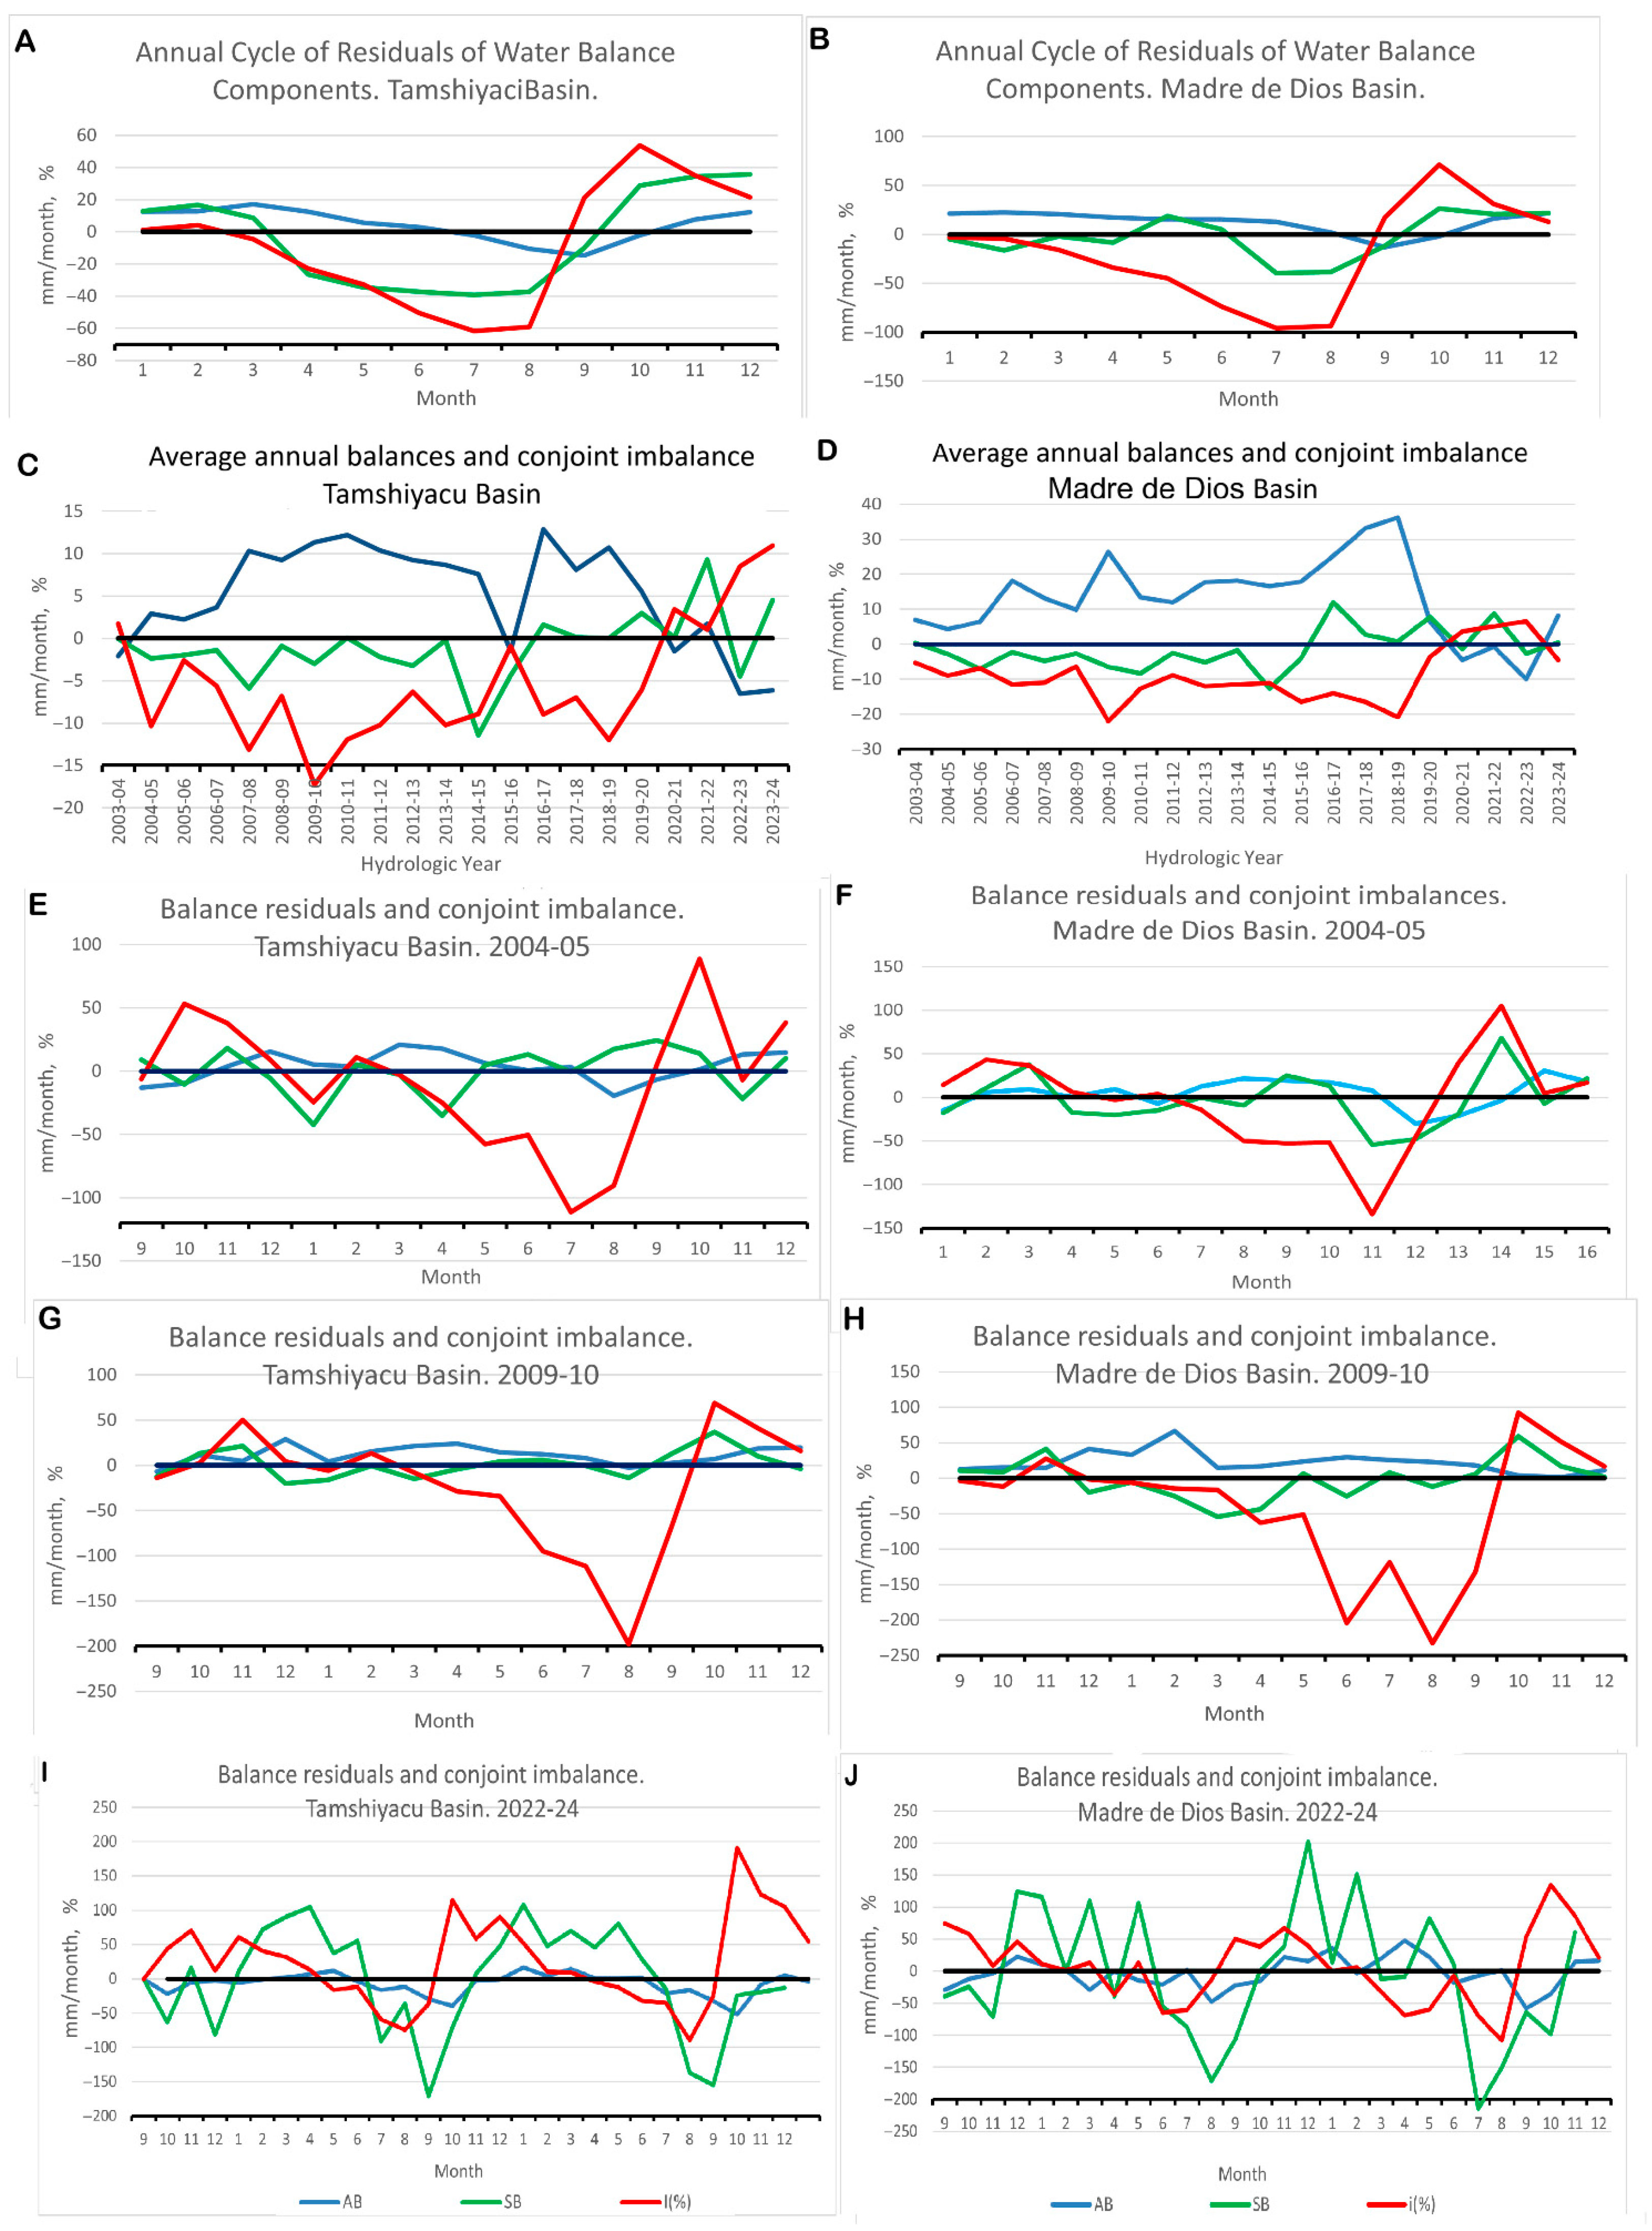
The residuals for the long-term surface and atmospheric balances for the two basins were obtained by averaging the residuals of the hydrologic years in the study period of 2003–2024, considering the derivative terms of Equations (4) and (5) as negligible, as in Marengo et al. (2004) [40] and in Builes-Jaramillo and Poveda (2018) [3]. The average residuals for each of the extreme drought years were also obtained. The residuals are summarized in Table 4, including also the average values for the components of the balances for the whole period and the extreme drought years. Very good closure was observed for the long-term atmospheric balances of 5.20 mm and 13.09 mm for the Tamshiyacu and the Madre de Dios Basins, and for the long-term surface balances of −5.36 mm and −8.98 mm (1.1 and 5,1% of average precipitation) for each basin. These low values are explainable because of the reanalysis-based character of the variables used in this work, which provides consistency. However, for individual extreme drought years, the residuals are more variable but relatively small, and almost all are less than 10% of precipitation, and are positive in the cases of 2004–2005 and 2009–2010. The atmospheric water balance residual for 2022–2024 is very close to zero, but negative, which is different from the other extreme drought years and very unusual, according to Table 1 from Bules-Jaramillo and Poveda (2018) [3]. The long-term surface balance residuals are both less than 1% of average precipitation, and the residuals for individual extreme drought years are negative and less than 10%. Some of the yearly balances for individual drought hydrologic years reach greater values, but almost all of them remain below 10% of precipitation.
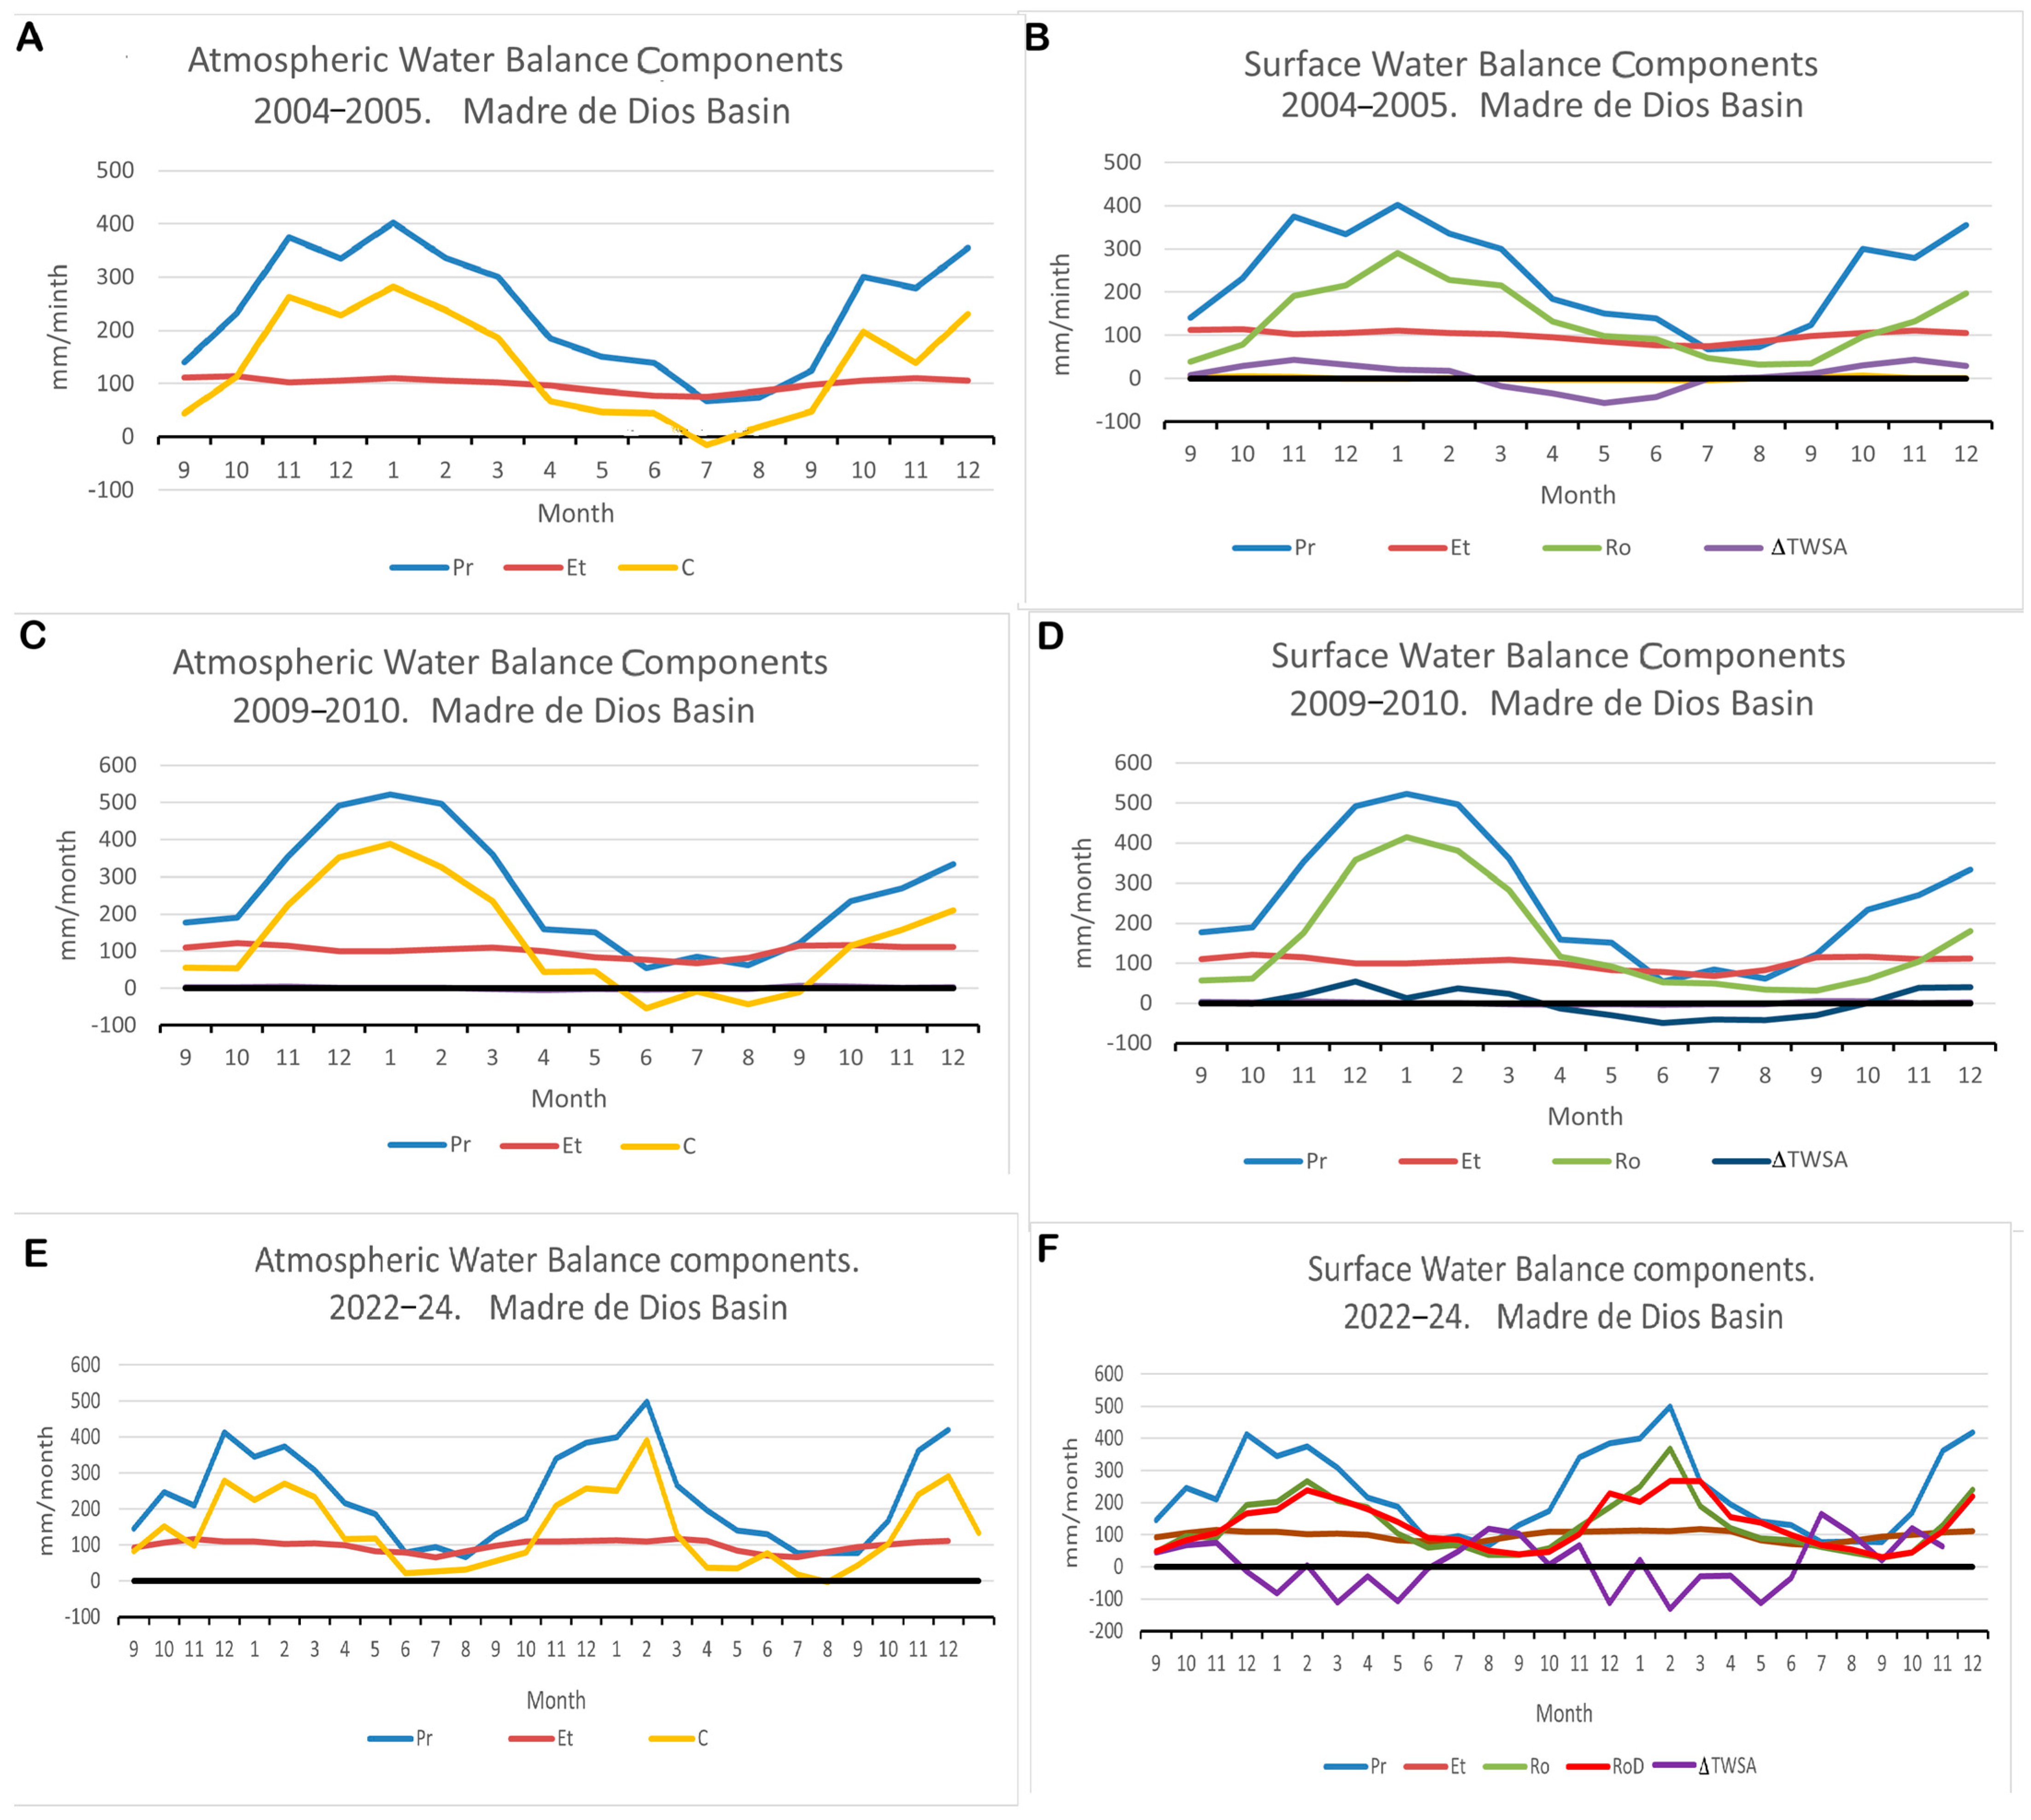
The records of the different components of the surface and atmospheric water cycles for each of the extreme drought years are shown in Figure 12 for the Tamshiyacu Basin. For every extreme drought case, the record extends for the entire hydrologic year, continuing until December of the consecutive year. Figure 12A,B show the records for 2005–2006. In the Tamshiyacu Basin, all of the components of the water balance show smaller values for the dry season, extending in this case from June to September. The observational runoff depth is also included, showing shorter time displacement than climatology (shown in Figure 11) and keeping close in value to the Ro ERA5 record. The moisture flux convergence C shows nearly zero or negative values in the dry seasons of the extreme drought years. This was noticed by Espinoza et al., 2024 [2] as one of the main causes of extreme drought conditions in 2023, when atmospheric stability prevailed over central and northern Amazonia. It can be noticed that in the extreme drought periods shown in Figure 12, not only C is very low in the dry seasons, but the difference P-C is also low, driving towards negative residuals. The seasonality of ΔTWSA is evident from the monthly values, which are positive for the rainy season, meaning a consistent monthly increase in water storage, and negative for the dry season, showing the decrease in water storage produced by dry conditions. This behavior is common for 2004–2005 and 2009–2010, but for the consecutive dry hydrologic years of 2022–2024, the opposite is observed. In this extreme drought period, the observational runoff depth record has also a small-time displacement with the precipitation and ERA5 runoff records and its value is closer to the ERA5 runoff than in the previous cases. In the Madre de Dios Basin (Figure 13), the seasonality is similar, but in 2004–2005 the ΔTWSA negative values occurred in the transition months before the dry season. However, in 2009–2010 (Figure 12C,D and Figure 13C,D), the same seasonality holds for both basins. In the case of 2022–2024, shown in Figure 12E,F and Figure 13E,F, the minima of the components occur in July–August, extending their low values after the climatological dry season, as noticed by Marengo et al., 2024 [3]. It is noticeable that, for the extreme drought years, the values for the components are generally lower than the climatology, as shown in Figure 11. It is also noticeable that for the dry season, both Pr and C are very small or negative in all cases, showing very low convergence or even divergence conditions in the dry season for the extreme drought hydrologic years. The difference P-C is also smaller in this season, producing negative residuals of the atmospheric balance. The observational runoff depth for this period was practically coincident with ERA5 runoff, except for a small displacement in the time of the 2024 maximum of the second hydrologic year of the period.
Figure 14 shows the residuals of the atmospheric water balance, surface water balance, and conjoint imbalance (I) for the Tamshiyacu (Figure 14A,C,E,G,I) and Madre de Dios (Figure 14B,D,F,H,J) Basins. The first two panels (Figure 14A,B) show the average annual cycles of the residues and the imbalance. The dry season is characterized in both basins by positive residuals and an imbalance, while a negative imbalance is a feature of the wet season in both basins. The annual variability, given by the average residuals and imbalance for each hydrologic year, shows a negative surface residual and imbalance and an apparent growing trend for most of the study period. This is clear in the Tamshiyacu Basin, turning clearly positive after 2022. (Figure 14C,D). The atmospheric balance, surface balance, and imbalance present minima for the 2005 and 2006 extreme drought years in the Tamshiyacu Basin, but they show a maximum for the 2023 and 2024 years. A clearly negative conjoint imbalance is obtained in all extreme drought years for the dry season showing minima for the Tamshiyacu Basin in August in 2005, 2023, and 2024 and in September in 2010. In the Madre de Dios Basin, the minimum conjoint imbalance occurred in July, and in the other extreme drought years they occurred from July to September.

3.5. Uncertainty Analysis

The analysis presented in this study is subject to several uncertainties inherent to the datasets and methodologies employed. Primarily, the reliance on reanalysis products such as ERA5 and GLDAS introduces potential biases, particularly in Et estimates, which exhibited positive biases when validated against limited observational data from the Quistococha flux tower (2018–2019 period only). This short validation window limits the generalizability of the findings, as longer-term observations are scarce in the Peruvian Amazon, potentially under-representing interannual variability. Additionally, precipitation datasets (CHIRPS, MSWEP, and ERA5) show discrepancies in spatial patterns, especially in topographically complex regions like the Andes–Amazon transition, where ERA5 may overestimate the wet season rainfall (Ou et al., 2023 [48]). The coincidence analysis among the different combinations of datasets used to estimate the MCWD shows that using observed Pr data combined with reanalysis Et data provides consistency, independently of the observational or reanalysis source, among the ones selected in the present paper. The GRACE/GRACE-FO data for total water storage anomalies (TWSAs) include gaps (e.g., 2017–2018), necessitating interpolation that could amplify errors in drought year assessments. Furthermore, drought indices like the MCWD, SPEI, and scPDSI are sensitive to input data choices, with correlations varying across basins (e.g., lower KGE in Marañón), highlighting the need for region-specific calibrations to account for Amazonian hydrological complexities (Papastefanou et al., 2022 [25]). These uncertainties underscore the importance of integrating more ground-based observations and ensemble approaches to enhance robustness of the findings and conclusions.

4. Discussion and Conclusions

In this work we have analyzed the impact of four major droughts on the water balance of the Peruvian–Ecuadorian Amazon basin using an array of drought metrics showing relative mutual consistency. We have also shown the climatological characteristics of surface and atmospheric water balances for the study basins of Tamshiyacu and Madre de Dios and their behavior in extreme drought conditions.
The distributions of CHIRPS precipitation anomalies in the dry season for the previously determined [27] extreme drought years corroborated this classification, showing a deficit in precipitation in each of the extreme drought hydrologic years in most of the western Amazon and in each of its main sub-basins. In the 2005 dry season, the minimum precipitation values and maximum negative anomalies were observed for the Madre de Dios and Ucayali Basins. This also holds for 2010 regarding precipitation values, but the anomalies were extended throughout all the region, with high negative values in the northeast of the Marañón Basin. In 2023 and 2024, precipitation was less than 60 mm/month for almost all the region, except for the northeastern extreme of the Marañón Basin. The spatial distribution of rainfall anomalies during extreme drought years confirms the findings from previous studies (e.g., Espinoza et al., 2011, 2024) [15,16,27].
A limitation of previous work about the diagnosis of extreme droughts in Peru [27] was the use of only one drought index. Although the MCWD is the best index to describe the relationship of Amazon droughts with forest vegetation, it is useful to investigate the consistence of the conclusions with other generally used drought indexes, such as the standardized precipitation–evaporation index SPEI and self-calibrated Palmer Drought Severity Index scPDSI, which also contain information on Et. Another limitation in [27] is the use of only one Et dataset to estimate the MCWD, even if three precipitation sources were used. To evaluate the uncertainty introduced by this limitation, the ERA5 records for the basins were compared with different Et datasets such as GLDAS and Et-Amazon-Paca and particularly with data from the Quistococha experimental flux tower. The intercomparison of these datasets shows that there is good agreement with the Amazon-Paca dataset for the Ucayali and Madre de Dios Basins, but the KGE value is not good enough for the Marañón Basin. However, the level of coincidence with the Quistococha dataset is clearly better than with GLDAS, so it can be concluded that ERA5 evaporation data can be used as a gridded evapotranspiration proxy for the Peruvian Amazon region, though this dataset must be further compared with a longer series of observations. To have a more complete assessment of the performance of reanalysis datasets in the region, more observational sites covering the Peruvian–Ecuadorian Amazon region are needed.
The evaluation of the ability of each of the indices and datasets used to identify periods of extreme drought shows that the SPEI and scPDSI indices can describe drought behavior on a monthly scale, while also showing periods of abundant rainfall. However, for drought diagnosis on an annual scale, the cumulative and selective nature of the MCWD makes it more advisable. However, the multilateral study of Amazonian drought, considering its relationship with the previous climatology, requires the use of indices such as the SPEI and scPDSI. The application of the SPEI and scPDSI to the Peruvian Amazon and Madre de Dios Basins corroborated the classification of the hydrologic years (2004–2005, 2009–2010, 2022–2023 and 2023–2024) as “extreme droughts”, which was stated before following the MSWD drought index.
The average annual values of the water balance components show relative minima for precipitation, runoff, and integrated moisture convergence in extreme drought years for the Tamshiyacu Basin (Figure 10A) and the Madre de Dios Basin.
In this work, we have explored the extreme droughts in the Amazon during the current century through the lens of several drought indexes with a rich deployment history (Aragão et al., 2007 [20]; Papastefanou et al., 2022 [25]) and conjoint surface and atmospheric water balances (Builes-Jaramillo & Poveda, 2018 [3])
The average residuals for each of the extreme drought show small closing values for the long-term atmospheric balances of 5.20 mm and 13.09 mm for the Tamshiyacu and the Madre de Dios Basins, and for the long-term surface balances of −5.36 mm and −8.98 mm for each basin. These low values are consistent with their relatively long-term nature and reanalysis origins, but for the extreme drought hydrologic years the residuals are more variable. It is remarkable that the atmospheric balance is negative, the surface balance is near to zero, and the imbalance is positive for the 2022–2024 drought in the Tamshiyacu Basin, differing with the long-term values and from the other two extreme droughts in the analyzed period. For the Madre de Dios Basin, these values are also particular, as the imbalance is negative but very small in value and the atmospheric balance is also negative.
These values seem to be related to the characteristics of this drought, discussed by [16,17], as even if moisture convergence was high, precipitation and evapotranspiration were too low, resulting in a deficit with Pr-E less than C. The delay in the onset of the wet season underlined by [17] can be confirmed from Figure 13E, where the period with a monthly water deficit in the Tamshiyacu Basin extended to September. In the case of Madre de Dios, the deficit is nearly zero in the dry season, but the wet season also started with a lag.
The interannual changes in the residuals of the surface and atmospheric water balances of ERA5 could be informative of systematic changes during droughts and long-term processes, such as changes in atmospheric circulation and deforestation (e.g., Espinoza et al., 2021 [49]; Wongchuig et al., 2022 [50]). However, these interpretations must be approached with caution, as the inherent limitations of reanalysis might make it impossible to reproduce the complexity of the processes involved. For example, the vegetation cycle in ERA5 is set to a climatological cycle of leaf area index, while dynamic processes in vegetation and associated water fluxes are not accounted for (Hersbach et al., 2020 [30]).
Linking these findings to broader climate change dynamics reveals that extreme droughts in the Peruvian Amazon are increasingly influenced by anthropogenic factors and natural variability. For instance, ENSO events, particularly El Niño phases, exacerbate drought conditions by altering moisture convergence and precipitation patterns, as evidenced in the 2015–2016 and 2023–2024 events (Jiménez et al., 2019 [23]; Espinoza et al., 2024 [16]). Deforestation further disrupts local water balances by reducing evapotranspiration and increasing runoff variability, potentially amplifying water deficits in affected basins (Wongchuig et al., 2023 [12]). These interactions contribute to a feedback loop where reduced forest cover diminishes atmospheric moisture recycling, intensifying drought severity under warming scenarios (Zanin et al., 2024 [8]). Socio-ecologically, such droughts threaten biodiversity hotspots like Manu National Park, disrupt indigenous communities’ access to water resources, and heighten risks of wildfires and carbon emissions, transforming the Amazon from a carbon sink to a source (Gatti et al., 2021 [22]; Beveridge et al., 2024 [5]). Future projections under high-emission scenarios (e.g., SSP5-8.5) suggest more frequent extreme droughts by mid-century, with potential TWSA declines of 10–20% in the region, necessitating adaptive strategies like reforestation and enhanced monitoring (Doblas-Reyes et al., 2021 [24]).
Furthermore, the results of this water balance analysis underscore the profound importance and transcendence of extreme droughts in the Peruvian–Ecuadorian Amazon basin, with far-reaching ecological, social, and economic impacts. Ecologically, the observed precipitation deficits and negative total water storage anomalies during events like 2023–2024 exacerbate forest stress, leading to increased tree mortality, biodiversity loss, and shifts in species composition, potentially tipping the Amazon toward a savanna-like state and releasing stored carbon into the atmosphere; physically, this is driven by the surface water balance (dS/dt = Pr − Et − Ro), which quantifies the rate of change in terrestrial water storage as the net result of precipitation inputs minus losses through evapotranspiration and runoff. Negative balances indicate a depletion of surface water resources, accelerating ecosystem degradation, while positive balances reflect water accumulation that supports vegetation recovery and soil moisture replenishment. These patterns are closely tied to negative surface water balances, which indicate net water loss from soils and rivers, depleting storage and impairing ecosystem resilience, while positive surface balances would signify water gains that are essential for vegetation recovery. Residuals from these balances, which are often negative during droughts (e.g., −5.36 mm long-term in Tamshiyacu), highlight uncertainties in data closure but also signal real hydrological deficits that amplify environmental degradation. Socially, these hydrological disruptions threaten water security for indigenous communities who are reliant on rivers for transportation, fishing, and agriculture, amplifying vulnerabilities to food insecurity and health risks from reduced water quality and increased wildfire smoke.
Economically, diminished runoff and evapotranspiration impair river navigation, hydroelectric power generation, and agricultural productivity, with cascading effects on regional trade and livelihoods; for instance, the 2010 drought caused estimated losses in fisheries and crop yields exceeding millions of dollars (Marengo and Espinoza 2016 [18]). This was exacerbated by negative atmospheric balances (dw/dt = C − Pr + Et) that physically represent the change in atmospheric water vapor as the balance between moisture convergence (inflow) and the net flux of precipitation minus evapotranspiration. Negative values signify atmospheric drying, reducing rainfall potential, whereas positive balances indicate moisture buildup that fosters precipitation and sustains the regional water cycle. Negative atmospheric balances reflect reduced moisture convergence and atmospheric water loss, hindering rainfall recycling, whereas positive atmospheric balances support humidity buildup critical for precipitation. Negative residuals (e.g., during 2022–2024) further underscore the imbalances that disrupt economic activities that are reliant on stable water cycles.
Transcending local scales, these impacts contribute to global climate feedback loops, highlighting the urgent need for integrated conservation policies, enhanced monitoring, interdisciplinary efforts, and international cooperation to safeguard this vital ecosystem against escalating climate pressures.

Supplementary Materials

The following supporting information can be downloaded at: https://www.mdpi.com/article/10.3390/w17213041/s1, Figure S1. Spatial distribution of precipitation (mm/month), precipitation anomalies (mm/month) and relative anomalies for the dry seasons (JJAS) of the extreme drought years 2005, 2010, 2023 and 2024, using ERA5 data. The base climatology period to obtain the anomalies is 2003–2024 (Figure 3). The first column of panels shows the maps for average precipitation in the dry seasons of the four years with extreme drought. The second column corresponds to anomalies and the third column to relative anomalies. Figure S2. Spatial distribution of precipitation (mm/month), precipitation anomalies (mm/month) and relative anomalies for the dry seasons (JJAS) of the extreme drought years 2005, 2010, 2023 and 2024, using MSWEP data. The base climatology period to obtain the anomalies is 2003–2024 (Figure 3). The first column of panels shows the maps for average precipitation in the dry seasons of the four years with extreme drought. The second column corresponds to anomalies and the third column to relative anomalies. Intercomparison of MCWD obtained from different combinations of databases. Figure S3. Scatterplots of MCWD values for the Peruvian Amazon Basin estimated from different data sources. The plotted data sources are indicated in the title of each graph. The following abbreviations are used: ERA5:ER, GLDAS:GL, CH:CHIRPS, MS:MSWEP. Table S1. Components of the atmospheric and surface water balances for the Tamshiyacu and Madre de Dios basins. A. Annual Cycles B. Yearly averages for hydrologic years. C. Monthly values for the extreme drought years.

Author Contributions

Conceptualization, D.M.-C., J.-C.E. and K.T.; Methodology, D.M.-C., J.-C.E., M.O.A., D.A.H., A.C.-A., E.A., R.G. and S.W.; Software, M.O.A.,D.A.H. and D.M.-C.; Validation, D.M.-C. and E.A. Formal analysis, D.M.-C., J.-C.E., K.T. and M.O.A.; Investigation, D.M.-C., J.-C.E., K.T., M.O.A., D.A.H., J.A. and E.A.; Data curation, D.M.-C., M.O.A., E.A. and R.G.; Writing – original draft, D.M.-C.; Writing–review & editing, D.M.-C., J.-C.E., K.T., M.O.A., D.A.H., A.C.-A., J.A., E.A., R.G., S.W. and F.Y.S.; Visualization, D.M.-C. and M.O.A.; Supervision, J.A., K.T. and F.Y.S.; Project administration, K.T. and F.Y.S.; Funding acquisition, F.Y.S. and J.A. All authors have read and agreed to the published version of the manuscript.

Funding

This research was funded by the Peruvian Program PP 068 “Reducción de vulnerabilidad y atención de emergencias por desastres”. Subprograms: 3.000737: “Estudios para la estimación del riesgo de desastres”; 5.005572: “Desarrollo de investigación aplicada para la gestión del riesgo de desastres”.

Data Availability Statement

The ERA5 data presented in this study are available on the ECMWF Copernicus website at https://cds.climate.copernicus.eu/cdsapp#!/dataset/reanalysis-era5-land-monthly-means?tab=form [30], the MSWEP website at https://www.gloh2o.org/mswep/ [29], and on the CHIRPS website https://data.chc.ucsb.edu/products/CHIRPS-2.0/. [28]. Drought indices implementation algorithms and data are available at https://github.com/mapsm12/DroughIndexes. GLDAS evapotranspiration data were taken from https://search.earthdata.nasa.gov/search/granules?p=C1342986036-GES_DISC&pg[0][v]=f&pg[0][gsk]=start_date&q=GLDAS_NOAH025_M_2.1&tl=1717633413.309!3!!. Discharge data were taken from the websites of the the Peruvian National Hydrometeorological service (Servicio Nacional de Hidrología y Meteorología–SENAMHI (https://www.senamhi.gob.pe/?p=monitoreo-informacion-diaria) and the Peruvian National Water Authority (Autoridad Nacional del Agua–ANA; https://snirh.ana.gob.pe/visorPorCuenca/?IdVar=263). Water storage data are available at the CSR RL06 mascon solutions, University of Texas CSR site (https://www2.csr.utexas.edu/grace/RL06_mascons.html) Data from the AMERIFLUX Quistococha station are available at https://ameriflux.lbl.gov/sites/siteinfo/PE-QFR. Discharge data were taken from the websites of the Peruvian National Hydrometeorological service (Servicio Nacional de Hidrología y Meteorología–SENAMHI (https://www.senamhi.gob.pe/?p=monitoreo-informacion-diaria) and the Peruvian National Water Authority (Autoridad Nacional del Agua–ANA; https://snirh.ana.gob.pe/visorPorCuenca/?IdVar=263.

Acknowledgments

This work was conducted using computational resources from Geo Cluster, provided by the Instituto Geofisico del Peru. TWSA data were obtained using GRACE-GRACE-FO data from https://www2.csr.utexas.edu/grace/RL06_mascons.html, accessed on 27 May 2025. CSR RL06 mascon solutions, University of Texas CSR. Results from [32] were used for comparison, as well as data from the AMERIFLUX Quistococha station, available at https://ameriflux.lbl.gov/sites/siteinfo/PE-QFR, accessed on 27 May 2025. Discharge data were taken from the websites of the Peruvian National Hydrometeorological service (Servicio Nacional de Hidrología y Meteorología–SENAMHI (https://www.senamhi.gob.pe/?p=monitoreo-informacion-diaria, accessed on 27 May 2025) and the Peruvian National Water Authority (Autoridad Nacional del Agua–ANA; https://snirh.ana.gob.pe/visorPorCuenca/?IdVar=263, accessed on 27 May 2025).

Conflicts of Interest

The authors declare no conflicts of interest.

References

  1. Saatchi, S.S.; Harris, N.L.; Brown, S.; Lefsky, M.; Mitchard, E.T.A.; Salas, W.; Zutta, B.R.; Buermann, S.W.; Lewis, L.; Hagen, S.; et al. Benchmark map of forest carbon stocks in tropical regions across three continents. Proc. Natl. Acad. Sci. USA 2011, 108, 9899–9904. [Google Scholar] [CrossRef] [PubMed]
  2. Costa, M.H.; Borma, L.S.; Espinoza, J.-C.; Macedo, M.; Marengo, J.A.; Marra, D.M.; Ometto, J.P.; Gatti, L.V. Chapter 5: The physical hydroclimate system of the Amazon, 2021. In Amazon Assessment Report 2021; Nobre, C., Encalada, A., Anderson, E., Roca Alcazar, F.H., Bustamante, M., Mena, C., Peña-Claros, M., Poveda, G., Rodriguez, J.P., Saleska, S., et al., Eds.; United Nations Sustainable Development Solutions Network: New York, NY, USA, 2021; Available online: https://www.theamazonwewant.org/spa-reports/ (accessed on 27 May 2025).
  3. Builes-Jaramillo, A.; Poveda, G. Conjoint analysis of surface; atmospheric water balances in the Andes-Amazon system. Water Resour. Res. 2018, 54, 3472–3489. [Google Scholar] [CrossRef]
  4. Armijos, E.; Crave, A.; Espinoza, J.-C.; Filizola, N.; Espinoza-Villar, R.; Fonseca, P. Rainfall control on Amazon sediment flux: Synthesis from 20 years of monitoring. Environ. Res. Commun. 2020, 2, 051008. [Google Scholar] [CrossRef]
  5. Beveridge, C.F.; Espinoza, J.C.; Athayde, S.; Correa, S.B.; Couto, T.B.; Heilpern, S.A.; Jenkins, C.N.; Piland, N.C.; Utsunomiya, R.; Wongchuig, S.; et al. The Andes-Amazon-Atlantic pathway: A foundational hydroclimate system for social-ecological system sustainability. Proc. Natl. Acad. Sci. USA 2024, 121, e2306229121. [Google Scholar] [CrossRef]
  6. Healy, R.W.; Winter, T.C.; LaBaugh, J.W.; Franke, O.L. Water Budgets: Foundations for Effective Water Resources; Environmental Management; U.S. Geological Survey Circular: Reston, VA, USA, 2007; p. 1308.
  7. Espinoza, J.-C.; Ronchail, J.; Guyot, J.L.; Cochonneau, G.; Naziano, F.; Lavado, W.; De Oliveira, E.; Pombosa, R.; Vauchel, P. Spatio-temporal rainfall variability in the Amazon basin countries (Brazil; Peru; Bolivia; Colombia,; Ecuador). Int. J. Climatol. 2009, 29, 1574–1594. [Google Scholar] [CrossRef]
  8. Zanin, P.R.; Pareja-Quispe, D.; Espinoza, J.-C. Evapotranspiration in the Amazon Basin; Couplings, hydrological memory; water feedback. Agric. Forest Meteorol. 2024, 352, 110040. [Google Scholar] [CrossRef]
  9. Espinoza Villar, J.-C.; Guyot, J.L.; Ronchail, J.; Cochonneau, G.; Filizola, N.; Fraizy, P.; Labat, D.; de Oliveira, E.; Ordoñez, J.J.; Vauchel, P. Contrasting regional discharge evolutions in the Amazon basin (1974–2004). J. Hydrol. 2009, 375, 297–311. [Google Scholar] [CrossRef]
  10. Kimball, B.A.; Bernacchi, C.J. Evapotranspiration, Canopy Temperature; Plant Water Relations. In Managed Ecosystems; CO2. Ecological Studies; Nösberger, J., Long, S.P., Norby, R.J., Stitt, M., Hendrey, G.R., Blum, H., Eds.; Springer: Berlin/Heidelberg, Germany, 2006; Volume 187. [Google Scholar] [CrossRef]
  11. Drumond, A.; Marengo, J.; Ambrizzi, T.; Nieto, R.; Moreira, L.; Gimeno, L. The role of the Amazon Basin moisture in the atmospheric branch of the hydrological cycle: A Lagrangian analysis. Hydrol. Earth Syst. Sci. 2014, 18, 2577–2598. [Google Scholar] [CrossRef]
  12. Wongchuig, S.; Espinoza, J.-C.; Condom, T.; Junquas, C.; Sierra, J.P.; Fita, L.; Sörensson, A.; Polcher, J. Changes in the surface; atmospheric water budget due to projected Amazon deforestation: Lessons from a fully coupled model simulation. J. Hydrol. 2023, 625, 130082. [Google Scholar] [CrossRef]
  13. Sierra, J.P.; Espinoza, J.-C.; Junquas, C.; Wongchuig, S.; Polcher, J.; Moron, V.; Fita, L.; Arias, P.A.; Schrapffer, A.; Pennell, R. Impacts of land-surface heterogeneities; Amazonian deforestation on the wet season onset in southern Amazon. Clim. Dyn. 2023, 61, 4867–4898. [Google Scholar] [CrossRef]
  14. Davidson, E.A.; de Araújo, A.C.; Artaxo, P.; Balch, J.K.; Brown, I.F.; Bustamante, M.M.C.; Coe, M.T.; DeFries, R.S.; Keller, M.; Longo, M.; et al. The Amazon basin in transition. Nature 2012, 481, 321–328. [Google Scholar] [CrossRef]
  15. Espinoza, J.-C.; Ronchail, J.; Guyot, J.L.; Junquas, C.; Vauchel, P.; Lavado, W.S.; Drapeau, G.; Pombosa, R. Climate variability; extremes drought in the upper Solimões River (Western Amazon Basin): Understanding the exceptional 2010 drought. Geophys. Res. Lett. 2011, 38, L13406. [Google Scholar] [CrossRef]
  16. Espinoza, J.-C.; Jimenez, J.C.; Marengo, J.A.; Schongart, J.; Ronchail, J.; Lavado-Casimiro, W.; Ribeiro, J.M. The new record of drought; warmth in the Amazon in 2023 related to regional; global climatic features. Sci. Rep. 2024, 14, 8107. [Google Scholar] [CrossRef]
  17. Marengo, J.; Cunha, A.; Espinoza, J.-C.; Fu, R.; Schöngart, J.; Jimenez, J.; Costa, M.; Ribeiro, J.; Wongchuig, S.; Zhao, S. The Drought of Amazonia in 2023–2024. Am. J. Clim. Change 2024, 13, 567–597. [Google Scholar] [CrossRef]
  18. Marengo, J.A.; Espinoza, J.C. Extreme Seasonal Droughts; Floods in Amazonia; Causes, Trends; Impacts. Int. J. Climatol. 2016, 36, 1033–1055. [Google Scholar] [CrossRef]
  19. Jiménez-Muñoz, J.; Mattar, C.; Barichivich, J.; Santamaría-Artigas, A.; Takahashi, K.; Malhi, Y.; Sobrino, J.A.; van der Schrier, G. Record-breaking warming; extreme drought in the Amazon rainforest during the course of El Niño 2015–2016. Sci. Rep. 2016, 6, 33130. [Google Scholar] [CrossRef]
  20. Aragão, L.E.O.C.; Malhi, Y.; Roman-Cuesta, R.M.; Saatchi, S.; Anderson, L.O.; Shimabukuro, Y.E. Spatial Patterns; fire response of recent Amazonian droughts. Geophys. Res. Lett. 2007, 34, L07701. [Google Scholar] [CrossRef]
  21. Malhi, Y.; Aragao, L.E.O.C.; Galbraith, D.; Huntingford, C.; Fisher, R.; Zelazowski, P.; Sitch, S.; McSweeney, C.; Meir, P. Exploring the likelihood; mechanism of a climate-change-induced dieback of the Amazon forest. Proc. Natl. Acad. Sci. USA 2009, 106, 20610–20615. [Google Scholar] [CrossRef] [PubMed]
  22. Gatti, L.V.; Basso, L.S.; Miller, J.B.; Gloor, M.; Gatti-Domingues, L.; Cassol, H.L.G.; Tejada, G.; Aragão, L.E.C.; Nobre, C.; Peters, W.; et al. Amazonia as a carbon source linked to deforestation; climate change. Nature 2021, 595, 388–393. [Google Scholar] [CrossRef]
  23. Jimenez, J.-C.; Marengo, J.A.; Alves, L.M.; Sulca, J.C.; Takahashi, K.; Ferrett, S.; Collins, M. The role of ENSO flavours; TNA on recent droughts over Amazon forests; the Northeast Brazil region. Int. J. Climatol. 2019, 41, 3761–3780. [Google Scholar] [CrossRef]
  24. Doblas-Reyes, F.J.; Sorensson, A.A.; Almazroui, M.; Dosio, A.; Gutowski, W.J.; Haarsma, R.; Hamdi, R.; Hewitson, B.; Kwon, W.-T.; Lamptey, B.L.; et al. Linking global to regional climate change. In Climate Change 2021: The Physical Science Basis, Contribution of Working Group I to the Sixth Assessment Report of the Intergovernmental Panel on Climate Change; Masson-Delmotte, V., Zhai, P., Pirani, A., Connors, S.L., Pean, C., Berger, S., Caud, N., Chen, Y., Goldfarb, L., Gomis, M.I., et al., Eds.; Cambridge University Press: Cambridge, UK; New York, NY, USA, 2021; pp. 1363–1512. [Google Scholar] [CrossRef]
  25. Papastefanou, P.; Zang, C.S.; Angelov, Z.; de Castro, A.A.; Jimenez, J.C.; De Rezende, L.F.C.; Ruscica, R.C.; Sakschewski, B.; Sörensson, A.A.; Thonicke, K.; et al. Recent extreme drought events in the Amazon rainforest: Assessment of different precipitation; evapotranspiration datasets; drought indicators. Biogeosciences 2022, 19, 3843–3861. [Google Scholar] [CrossRef]
  26. Mamani, L.; Andreoli, R.V.; Parente de Souza, I.; Cevalho, W.; Sales, D.; Kayano, M.T.; de Souza, R.A.F.; Molina-Carpio, J.; Ceron, W.L.; Macedo, T. Extreme droughts in the Amazon Basin during cyclic ENSO events coupled with Indian Ocean Dipole modes; Tropical North Atlantic warming. Sci. Total Environ. 2025, 963, 178536. [Google Scholar] [CrossRef]
  27. Martínez-Castro, D.; Takahashi, K.; Espinoza, J.-C.; Vichot-Llano, A.; Andrade, M.O.; Silva, F.Y. Extreme droughts in the Peruvian Amazon region (2000–2024). Water 2025, 17, 744. [Google Scholar] [CrossRef]
  28. Funk, C.; Peterson, P.; Landsfeld, M.; Pedreros, D.; Verdin, J.; Shukla, S.; Husak, G.; Rowland, J.; Harrison, L.; Hoell, A.; et al. The climate hazards infrared precipitation with stations—A new environmental record for monitoring extremes. Sci. Data 2015, 2, 1–21. [Google Scholar] [CrossRef] [PubMed]
  29. Beck, H.E.; Wood, E.F.; Pan, M.; Fisher, C.K.; Miralles, D.G.; van Dijk, A.I.J.M.; McVicar, T.R.; Adler, R.F. MSWEP V2 Global 3-Hourly 0.1° Precipitation: Methodology; Quantitative Assessment. Bull. Am. Meteor. Soc. 2019, 100, 473–500. [Google Scholar] [CrossRef]
  30. Hersbach, H.; Bell, B.; Berrisford, P.; Hirahara, S.; Horányi, A.; Muñoz-Sabater, J.; Nicolas, J.; Peubey, C.; Radu, R.; Schepers, D.; et al. The ERA5 global reanalysis. Q. J. R. Meteorol. Soc. 2020, 146, 1999–2049. [Google Scholar] [CrossRef]
  31. Rodell, M.; Houser, P.R.; Jambor, U.; Gottschalck, J.; Mitchell, K.; Meng, C.-J.; Arsenault, K.; Cosgrove, B.; Radakovich, J.; Bosilovich, M.; et al. The Global Land Data Assimilation System. Bull. Am. Meteorol. Soc. 2004, 85, 381–394. [Google Scholar] [CrossRef]
  32. da Motta Paca, V.H.; Espinoza-Dávalos, G.E.; Hessels, T.M.; Medeiros Moreira, D.; Comair, G.F.; Bastiaanssen, W.G.M. The spatial variability of actual evapotranspiration across the Amazon River Basin based on remote sensing products validated with flux towers. Ecol. Process. 2019, 8, 6. [Google Scholar] [CrossRef]
  33. Save, H.; Bettadpur, S.; Tapley, B.D. High-Resolution CSR GRACE RL05 Mascons. J. Geophys. Res. Solid Earth 2016, 121, 7547–7569. [Google Scholar] [CrossRef]
  34. Tapley, B.D.; Bettadpur, S.; Ries, J.C.; Thompson, P.F.; Watkins, M.M. GRACE Measurements of Mass Variability in the Earth System. Science 2004, 305, 503–505. [Google Scholar] [CrossRef] [PubMed]
  35. Li, B.; Rodell, M.; Kumar, S.; Beaudoing, H.; Getirana, A.; Zaitchik, B.F.; de Goncalves, L.G.; Cossetin, C.; Bhanja, S.; Mukherjee, A.; et al. Global GRACE data assimilation for groundwater; drought monitoring: Advances; challenges. Water Resour. Res. 2019, 55, 7564–7586. [Google Scholar] [CrossRef]
  36. Landerer, F.W.; Flechtner, F.M.; Save, H.; Webb, F.H.; Bandikova, T.; Bertiger, W.I.; Bettadpur, S.V.; Byun, S.H.; Dahle, C.; Dobslaw, H.; et al. Extending the global mass change data record: GRACE Follow On instrument; science data performance. Geophys. Res. Lett. 2020, 47, e2020GL088306. [Google Scholar] [CrossRef]
  37. Kling, H.; Fuchs, M.; Paulin, M. Runoff conditions in the upper Danube basin under an ensemble of climate change scenarios. J. Hydrol. 2012, 424–425, 264–277. [Google Scholar] [CrossRef]
  38. Zeng, N. Seasonal cycle; interannual variability in the Amazon hydrologic cycle. J. Geophys. Res. 1999, 104, 9097–9106. [Google Scholar] [CrossRef]
  39. Balsamo, G.; Viterbo, P.; Beljaars, A.; van den Hurk, B.; Hirschi, M.; Betts, A.K.; Scipal, K. A revised hydrology for the ECMWF model: Verification from field site to terrestrial water storage; impact in the Integrated Forecast System. J. Hydrometeorol. 2009, 10, 623–643. [Google Scholar] [CrossRef]
  40. Marengo, J.A. Characteristics; spatio-temporal variability of the Amazon River Basin Water Budget. Clim. Dyn. 2004, 24, 11–22. [Google Scholar] [CrossRef]
  41. Vicente-Serrano, S.M.; Beguería, S.; Lorenzo-Lacruz, J.; Camarero, J.J.; López-Moreno, J.I.; Azorin-Molina, C.; Revuelto, J.; Morán-Tejeda, E.; Sanchez-Lorenzo, A. Performance of Drought Indices for Ecological; Agricultural; Hydrological Applications. Earth Interact. 2012, 16, 1–27. [Google Scholar] [CrossRef]
  42. Wells, N.; Goddard, S.; Hayes, M.J. A Self-Calibrating Palmer Drought Severity Index. J. Clim. 2004, 17, 2335–2351. [Google Scholar] [CrossRef]
  43. Paredes-Trejo, F.; Barbosa, H.; Giovannettone, J.; Lakshmi Kumar, T.V.; Kumar Takur, M.; de Oliveira Buriti, C. Drought variability; land degradation in the Amazon River basin. Front. Earth Sci. Sec. Environ. Inform. Remote Sens. 2022, 10, 1344. [Google Scholar] [CrossRef]
  44. Herrera, D.A.; Ault, T. Insights from a New High-Resolution Drought Atlas for the Caribbean Spanning 1950–2016. J. Clim. 2017, 30, 7801–7825. [Google Scholar] [CrossRef]
  45. Lewis, S.L.; Brando, P.M.; Phillips, O.L.; van der Heijden, G.M.F.; Nepsta, D. The 2010 Amazon Drought. Science 2011, 331, 554. [Google Scholar] [CrossRef]
  46. Zang, C.S.; Buras, A.; Esquivel-Muelbert, A.; Jump, A.S.; Rigling, A.; Rammig, A. Standardized drought indices in ecological research: Why one size does not fit all. Glob. Change Biol. 2020, 26, 322–324. [Google Scholar] [CrossRef] [PubMed]
  47. Hu, X.; Yuan, W. Evaluation of ERA5 precipitation over the eastern periphery of the Tibetan plateau from the perspective of regional rainfall events. Int. J. Climatol. 2021, 41, 2625–2637. [Google Scholar] [CrossRef]
  48. Ou, T.; Chen, D.; Tang, J.; Lin, C.; Wang, X.; Kukulies, J.; Lai, H. Wet bias of summer precipitation in the northwestern Tibetan Plateau in ERA5 is linked to overestimated lower-level southerly wind over the plateau. Clim. Dyn. 2023, 61, 2139–2153. [Google Scholar] [CrossRef]
  49. Espinoza, J.-C.; Arias, P.A.; Moron, V.; Junquas, C.; Segura, H.; Sierra-Pérez, J.P.; Wongchuig, S.; Condom, T. Recent Changes in the Atmospheric Circulation Patterns during the Dry-to-Wet Transition Season in South Tropical South America (1979–2020): Impacts on Precipitation; Fire Season. J. Clim. 2021, 34, 9025–9042. [Google Scholar] [CrossRef]
  50. Wongchuig, S.; Espinoza, J.C.; Condom, T.; Segura, H.; Ronchail, J.; Arias, P.A.; Junquas, C.; Rabatel, A.; Lebel, T. A regional view of the linkages between hydro-climatic changes; deforestation in the Southern Amazon. Int. J. Climatol. 2022, 42, 3757–3775. [Google Scholar] [CrossRef]
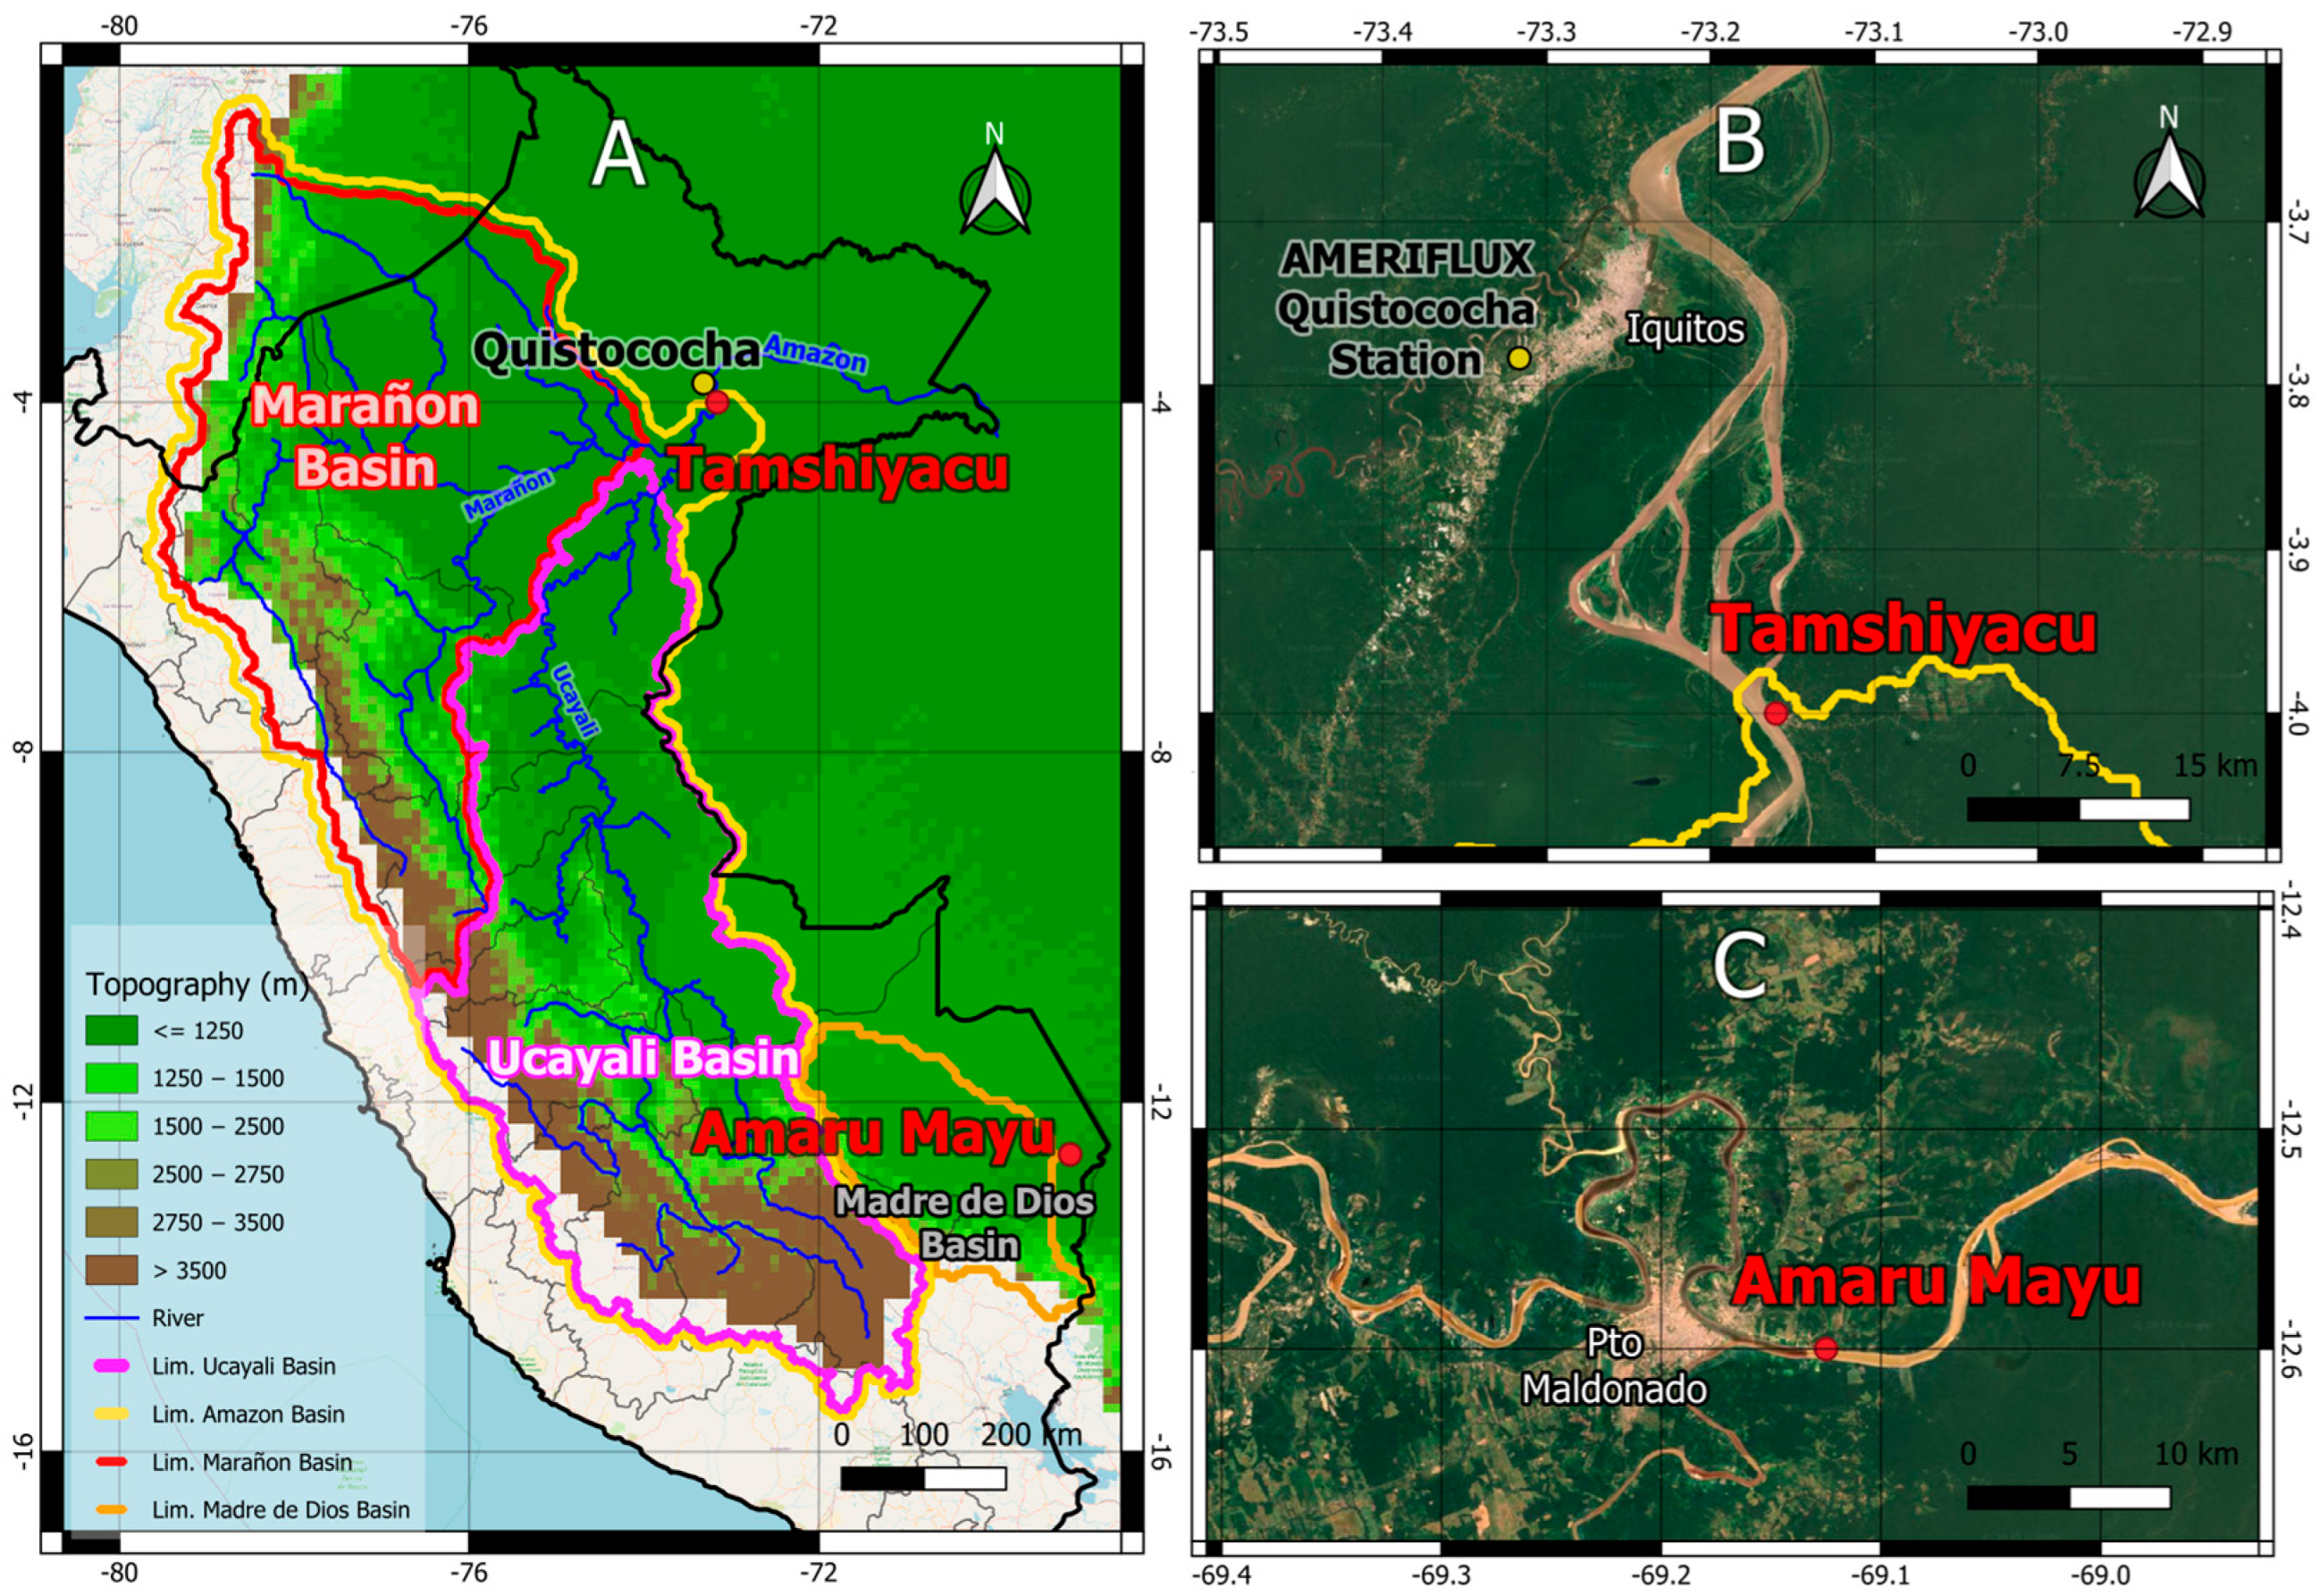
Figure 1. (A) Study area of the Tamshiyacu Basin (dotted) ending in Tamshiyacu, which contains the basins of the Marañón and Ucayali rivers, and the Madre de Dios Basin (striped), ending in the Amaru Mayu station. (B) Google Maps satellite image showing the region of the north of the Peruvian Amazon forest region where the AMERIFLUX Quistococha and SENAMHI Tamshiyacu hydrologic stations are located. (C) Google Map satellite image showing the region of the Amazon forest region where the ANA Amaru Mayu hydrologic station is located.
Water 17 03041 g001
Figure 2. Average monthly precipitation for the dry season (JJAS) of the period 2000–2024, constituting the base climatology for obtaining of the absolute and relative precipitation anomalies for the dry seasons with extreme droughts.
Water 17 03041 g002
Figure 3. Spatial distribution of precipitation, precipitation anomalies (mm/month), and relative anomalies for the dry seasons (JJAS) of the extreme drought years 2005, 2010, 2023, and 2024, using CHIRPS data. The base climatology period to obtain the anomalies is 2003–2024 (Figure 2). The first column of panels shows the maps for average precipitation in the dry seasons of the four years with extreme drought. The second column corresponds to anomalies and the third column to relative anomalies.
Water 17 03041 g003
Figure 4. Records of arial average Et from the ERA5, GLDAS, and Amazon-Paca dataset for the two studied basins, Tamshiyacu (A) and Madre de Dios (B), computed for the dry season (JJAS).
Water 17 03041 g004
Figure 5. Intercomparison of Et data estimated from ERA5 and GLDAS with observations. (A) Series of monthly evapotranspiration data (Et) obtained from the two datasets averaged within a 1-degree box centered in the Quistococha flux tower for the period 2018–2019 and corresponding Quistococha observations. (B) Matching coefficients: Bias, Pearson coefficient, and KGE index for comparison of GLDAS and ERA5 data with the Quistococha flux tower observations.
Water 17 03041 g005
Figure 6. Annual records of MCWD (mm) based on precipitation and evapotranspiration estimates from ERA5 (A) and GLDAS (B), and precipitation estimates from MSWEP, with evapotranspiration from ERA5 (C) and GLDAS (D), and from CHIRPS, with evapotranspiration from ERA5 (E) and GLDAS (F). The curves represent the different basins of the Peruvian–Ecuadorian Amazon region.
Water 17 03041 g006
Figure 7. Monthly records (left column) and annual averages (right column) of the SPEI drought index based on precipitation and evapotranspiration estimates from ERA5 (A,B) and GLDAS (C,D), precipitation estimates from MSWEP, with evapotranspiration from ERA5 (E,F) and GLDAS (G,H), and from CHIRPS, with evapotranspiration from ERA5 (I,J) and GLDAS (K,L). Amazonian drought periods commonly reported in the literature are highlighted in grey. The curves represent the different basins of the Peruvian–Ecuadorian Amazon.
Water 17 03041 g007
Figure 8. Monthly records (left column) and annual averages (right column) of the scPDSI drought index based on precipitation and evapotranspiration estimates from ERA5 (A,B) and GLDAS (C,D), precipitation estimates from MSWEP, with evapotranspiration from ERA5 (E,F) and GLDAS (G,H), and from CHIRPS, with evapotranspiration from ERA5 (I,J) and GLDAS (K,L). Amazonian drought periods commonly reported in the literature are highlighted in grey. The curves represent the different basins of the Peruvian–Ecuadorian Amazon.
Water 17 03041 g008
Figure 9. Series of annual z-scores of drought indices SPEI, scPDSI, and MCWD for the Tamshiyacu and Madre de Dios Basins using ERA5 Et data and different datasets for precipitation. (A) ERA5 Pr for Tamshiyacu. (B) ERA5 Pr for Madre de Dios. (C) CHIRPS Pr for Tamshiyacu. (D) CHIRPS Pr for Madre de Dios. (E) MSWEP Pr for Tamshiyacu. (F) MSWEP Pr for Madre de Dios.
Water 17 03041 g009
Figure 10. Annual cycle (monthly average values) of the components of the atmospheric and surface water cycles for the Tamshiyacu and the Madre de Dios Basins for the study period of 2003–2024. (A) Atmospheric Balance for Tamshiyacu. (B) Atmospheric Balance for Madre de Dios. (C) Surface Balance for Tamshiyacu. (D) Surface Balance for Madre de Dios. Pr—Precipitation. Et—Evapotranspiration. Ro—Runoff. RoD—Observed runoff depth. C—Vertically integrated moisture flux convergence. ΔTWSA—Difference of total water storage anomaly across consecutive months. The labels in the X axis represent the months. All units are mm/month. A horizontal black line has been added in panels C and D to indicate the zero level.
Water 17 03041 g010
Figure 11. Annual average values for the components of the atmospheric and surface water balances for the Tamshiyacu Basin (A,C) and the Madre de Dios Basin (B,D). 2003–2024. Pr—Precipitation. Et—Evapotranspiration. Ro—Runoff. RoD—Observed runoff depth. PWD—Precipitable water difference. C—Vertically integrated moisture flux convergence. ΔTWSA—Variation of soil water storage anomaly in one month. The labels in the X axis represent the hydrologic year. All units are in mm/month.
Water 17 03041 g011
Figure 12. Monthly values for the components of the atmospheric water balances for the extreme drought hydrologic years for the Tamshiyacu Basin. (A,B): 2004–2005; (C,D): 2009–2010; and (E,F): 2022–2024. In every case, the months of September–December in the last year of the corresponding hydrologic year have been included in the record. Pr—Precipitation. Et—Evapotranspiration. Ro—Runoff. RoD—Observed runoff depth. C—Vertically integrated moisture flux convergence. ΔTWSA—Variation of soil water storage anomaly in one month. The labels in the X axis represent the months. All units are in mm/month. A horizontal black line has been added in panels B, C, D and F to indicate the zero level.
Water 17 03041 g012
Figure 13. Monthly values for the components of the atmospheric water balances for the extreme drought hydrologic years for the Madre de Dios Basin. (A,B): 2004–2005; (C,D): 2009–2010; and (E,F): 2022–2024. In every case, the months of September–December in the last year of the corresponding hydrologic year have been included in the record. Pr—Precipitation. Et—Evapotranspiration. Ro—Runoff. RoD—Observed runoff depth. C—Vertically integrated moisture flux convergence. ΔTWSA—Variation of soil water storage anomaly in one month. The labels in the X axis represent the months. All units are in mm/month. A horizontal black line has been added in panels B, C, D and F to indicate the zero level.
Water 17 03041 g013
Figure 14. Residuals of the atmospheric and surface balances (AB and SB) for the Tamshiyacu and Madre de Dios Basins and percent conjoint imbalance (I (%)). (A,B): Annual cycles of monthly values for the residuals of the water balances. (C,D): Average annual values for the 2003–2024 period. (E,F): Monthly values for the 2004–2005 hydrologic year, including the last months of 2005. (G,H): Same for 2009–2010. (I,J): Same for 2022–2024. The labels in the X axis represent the month in panels (A,B), and (EJ) and the hydrologic year in (B,C).
Water 17 03041 g014
Table 1. Matching coefficients between the ERA5 and GLDAS Et datasets and the Amazon-Paca dataset, (2003–2013). Bias, Pearson correlation coefficient, and Kling–Gupta efficiency for the Tamshiyacu Basin and the Madre de Dios Basin.
BiasPearsonKling–Gupta
Tamshiyacu Basin
ERA5 vs. Amazon-Paca0.060.3790.376
GLDAS vs. Amazon-Paca0.150.004−0.015
Madre de Dios Basin
ERA5 vs. Amazon-Paca−0.05630.3950.392
GLDAS vs. Amazon-Paca0.0175−0.0910.392
Table 2. Matching coefficients between different combinations of datasets used to determine MCWD. The combinations are denoted as Dataset 1 and Dataset 2. Each of them is composed by the precipitation and evapotranspiration datasets used to calculate MCWD. The first double column shows the Pr and Et components of Dataset 1 for every combination and the second double column is the same for Dataset 2. The last three columns display Pearson, bias, and KGE coefficients. Pearson coefficients greater than 0.8, biases lower or equal than 0.10, and KGEs greater than 0.5 are shown in bold green.
Dataset 1Dataset 2Statoiistics metrics
PrEtPrEtPearsonBiasKGE
ERA5ERA5GLDASGLDAS0.930.510.38
MSWEPERA50.460.550.17
GLDAS0.550.60.24
CHIRPSERA50.590.6-0.09
GLDAS0.560.620.2
GLDASGLDASMSWEPERA50.410.090.4
GLDAS0.550.180.47
CHIRPSERA50.530.180.38
GLDAS0.550.230.48
MSWEPERA5CHIRPSERA50.690.110.47
GLDAS0.750.150.69
GLDASERA50.670.010.22
ERA5MSWEPGLDAS0.940.10.79
GLDASCHIRPSGLDAS0.820.060.76
CHIRPSERA5GLDAS0.920.050.65
Table 3. Pearson’s correlation coefficients for the 2003–2024 series of annual values of the standardized MCWD drought index with the standardized scPDSI and SPEI annual indices for the same period. The first column shows the Pr dataset that combines with ERA5 to obtain the indices.
Pr DatasetIndicesTamshiyacu BasinMadre de Dios Basin
Pearson Correlation CoefficientLevel of Significance
(>90%)
Pearson Correlation CoefficientLevel of Significance (>90%)
ERAMCWD-scPDSI0.5799.6%0.10Non-significant
ERAMCWD-SPEI0.6399.9%0.5090.0%
CHIRPSMCWD-scPDSI0.7399.9%0.27Non-significant
CHIRPSMCWD-SPEI0.6799.9%0.08Non-significant
MSWEPMCWD-scPDSI0.7399.9%0.3490.0%
MSWEPMCWD-SPEI0.25Non-significant0.06Non-significant
Table 4. Residuals of the atmospheric and surface balances (AB and SB, respectively) for the study period of 2003–2024 and each of the extreme drought years for the Tamshiyacu Basin and the Madre de Dios Basin and the average components for each period and basin in mm/month. Percentages are included with respect to average precipitation.
PeriodAverage Pr.
mm/mo.
Average Et.
mm/mo.
Average C
mm/mo.
Average Ro
mm/mo.
Average ΔTWSA
mm/mo
AB
Residual
mm/mo.
% of Average PrSB
Residual
mm/mo.
% of Average PrI (%)
Tamshiyacu
2003–2024202.4196.14101.1194.870.045.21.1−1.07−0.5−5.36
2004–2005185.9597.9685.0594.87−4.532.932.4−2.36−1.3−21.35
2009–2010189.1497.9879.8096.46−2.3011.353.0−3.01−1.6−35.36
2022–2024187.1794.6098.9190.172.43−6.34−0.03−0.03 0.08.83
Madre de Dios
2003–2024254.2796.76144.43146.67−0.6713.095.1−1.49−0.6−8.98
2004–2005227.8297.53125.92138.29−0.134.361.9−7.88−3.5−20.46
2009–2010258.5197.48134.62172.58−2.3026.4110.2−9.26−3.6−58.01
2022–2024229.0197.02132.99131.801.27−1.00−0.4−1.08−0.5−3.98
Disclaimer/Publisher’s Note: The statements, opinions and data contained in all publications are solely those of the individual author(s) and contributor(s) and not of MDPI and/or the editor(s). MDPI and/or the editor(s) disclaim responsibility for any injury to people or property resulting from any ideas, methods, instructions or products referred to in the content.