Abstract
This work is a logical continuation of the study of the chemical composition of the waters of the Lovozersky district (Kola Peninsula, Russia), where an indigenous population resides. The problem statement is caused by the discovery of rare and rare earth elements in drinking water and the high rate of illness among the residents of the Lovozersky district. The goal of this work is to assess the quality of natural waters in the village of Krasnoshchelye (Kola Peninsula, Russia) and compare it with the composition of other waters in the Kola Peninsula, taking into account sanitary standards (maximum permissible concentrations) and biologically significant concentrations. As a result, the chemical composition of surface and groundwater was studied, their quality was characterized, and the forms of element migration in the “solution–crystalline substance” system in water and the human body (using the stomach as an example) were examined. The results of studies of drinking water in the village of Krasnoshchelye indicate that the macro-(Ca, Mg, Na, K) and microelement (Co, Cu, Mn, Ni, V, Zn, Cr) composition has lower concentrations in terms of biological significance for the elemental balance of humans than the recommended levels for them. The exceptions are the elements U, Th, and Y, whose concentrations are several times higher than their lower limits of biologically significant concentrations. In the human body, within the “water–gastric juice” system, the forms of the migration of elements and newly formed phases depend not only on the acidity of the stomach but also on the amount of gastric juice, which are individual characteristics of a person and their age. It has been established that well water contains rare elements and up to 50 µg L−1 of rare earth elements, and changes in their migration forms can lead to accumulation in the human body and become a cause of diseases of the nervous system and other organs.
1. Introduction
Water is a major resource for the sustenance of living organisms. The chemical composition of underground and surface waters, which can serve as sources of drinking water supply, is the most important geoecological factor, as the chemical properties of water have a direct biochemical effect on the human body and its physiological functions. The problem of changing the chemical composition of freshwater and the search for methods to assess water quality remain relevant [1,2,3]. Among the methods for assessing the level of metal and metalloid contamination in water bodies, several groups can be distinguished: (1) geochemical assessment methods based on the use of the comparison of data with average values of their contents in the upper continental crust and regional background concentrations and (2) methods based on the use of standards for the content and maximum contaminant level (MCL). At the same time, for assessing water quality in Russia, the state sanitary standard (SanPiN) [4] or stricter standards for the quality of water bodies designated for fisheries are used [5]. In addition, there are recommendations from the World Health Organization that are comparable to Russian standards [6] and (3) methods related to complex pollution indices. The methods help to establish the pollution level based on the classification of a particular index [2,7]; (4) the water quality index (WQI) is one of the most used tools to describe water quality. The WQI can be effectively used for the simple interpretation of large-scale datasets to determine pollution sources. It is based on physical, chemical, and biological factors that are combined into a single value that ranges from 0 to 100. The WQI is very effective technique for determining the suitability of water, but it is limited to drinking water quality only. Moreover, the conventional indices evaluating the suitability of water do not clearly specify the status, as these indices do not aggregate all required compounds [8,9,10,11].
The idea of the outstanding Russian biochemist N.K. Koltsov about the quality of drinking water (1912) [12] was reflected in the regulatory documents of Russia in the Sanitary and Epidemiological Rules and Standards for waters bottled in containers [13]. Similar sanitary rules and regulations for bottled water appeared in the Republic of Belarus and Ukraine [14,15].
The chemical composition of underground and surface waters, sources of the drinking water supply, is the most important geoecological factor, since the chemical properties of water have a direct biochemical effect on the human body and its physiological functions. The works of V.V. Kovalsky are devoted to the justification of such optimal concentrations for various chemical elements in the geochemical environment. He laid the foundations of geochemical ecology [16]. Water can contain a very large number of elements that, at high concentrations, can have a toxic effect on the human body. It is important to know that both an excess of any element and its deficiency have biochemical significance [17]. Barvish and Schwartz [18] stated that due to the presence of microelements, drinking water can be both suitable for drinking and useful at the same time. The term “biologically significant concentration” was introduced (BSC). This is a concentration at which the intake of an element into the human body with water can affect the overall microelement balance. The lower limit of the BSC is taken to be the value at which the intake of an element into the body with drinking water is 5% of the total average intake, and the daily consumption of drinking water is taken to be equal to 2 L for an adult. This study presents a table of the average daily human consumption of elements and lower limits of the BSC [18].
A significant factor in the study of the chemical composition and assessment of the quality of drinking water is the investigation of the migratory forms of chemical elements, as different migration forms of the same element can have varying effects on the human body due to their different toxicities [3,17,19,20].
Previously, research on the influence of the chemical composition of the rocks of the Lovozero Massif on the change in the chemical composition of natural waters was carried out. These waters have originate from this massif and its immediate northern border and depending on the composition of the rocks, the catchment area, and anthropogenic influences, certain changes can occur. These objects were studied using modern precision methods of analysis (ICP-MS, etc.). Physicochemical modeling was also used, namely the software package (SP) “Selektor” (version 3.01) [21]. The results of the studies of drinking waters of the village of Lovozero have showed that these waters do not have a balanced, complete composition. This water cannot be considered physiologically complete in terms of the content of the main macro- and microelements and the amount of total mineralization, both in its original natural state and at the time of delivery to the consumer. As a result of water treatments, the chemical composition of the water changes depending on the reagents used, but this does not bring the chemical composition of the water closer to the standards for bottled water [22,23,24].
For some elements, such as Sr and Na, and anions, such as HCO3−, Cl−, SO42−, and NO3−, in full-value and bottled waters, the need to revise the MCL and the introduction of regional standards for the study area were also raised here.
The Lovozero district, where the indigenous population lives, is a risk area in terms of the cities and districts of the region. There is a significant excess of the average Russian indicators of urolithiasis, circulatory system diseases, malignant neoplasms, and gastrointestinal tract diseases (stomach ulcers, duodenal ulcers, gastritis, and duodenitis) [25,26]. Maintaining the health of the small indigenous population is a very important task. The purpose of this work is to evaluate the quality of the surface and groundwater in the village of Krasnoshchelye (Lovozero district), taking into account the MCL and lower limits of the BSC and the form of the migration of elements in the “solution–crystalline substance” system in natural waters and the human body (using the stomach as an example), and compare this with the composition of other waters in the Kola Peninsula.
2. Materials and Methods
2.1. Research Objects
The village of Krasnoshchelye is located in the Lovozero district (Kola Peninsula, Russia). It is the third largest settlement in the district, with a small population (a little over 400 people). The distance from the district center is 140 km. The village of Krasnoshchelye is located on the left bank of the Ponoy River, 157 m above sea level. The main enterprise is the agricultural reindeer herding cooperative “Olenevod”. Fishing, hunting, and picking mushrooms and berries are of great importance to the villagers. The village of Krasnoshchelye is home to the indigenous populations of the Kola North, the Izhma Komi, and the Sami. People use water from non-centralized water supply systems, i.e., wells (Figure 1).
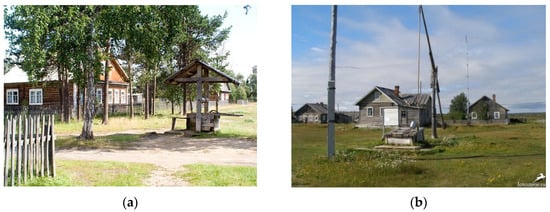
Figure 1.
The facade of wells in the village of Krasnoshchelye. (a) wells with a rotary lifting mechanism; (b) wells with lever lifting mechanism.
The objects of this study were surface water (Ponoy River and Lake Shumesozero) and underground water from wells in the village of Krasnoshchelye. The Ponoy River is the largest river on the Kola Peninsula. The river originates in the center of the Kola Peninsula, flows eastward, and flows into the White Sea. The length of the main channel is 426 km; the drop in level from the source to the mouth is 292 m. Three characteristic sections are distinguished near the Ponoy River: the upper section is a swampy plain from the upper reaches of the Ponoy River to the confluence of the Losinga River (211 km from the mouth); the middle section is the section to the confluence of the Kolmak River (211–100 km from the mouth), where the Ponoy River enters the boundaries of the crystalline plateau and gradually forms its valley; and a gorge forms in the lower section from the Kolmak to the mouth of the Ponoy River. The upper section is the longest (214 km). The source of the Ponoy River lies on the western spurs of the Upland Keivy, at an altitude of 292 m above sea level. The river bed is characterized by strong sinuosity, divided into branches and channels. The river valley is conditional, and the Ponoy River spills over the swamps during a flood. When the Sakharnaya River flows into the Ponoy River, the Ponoy River widens to 50 m. Alluvium brought from Keivy accumulates along the banks. Alluvium frames the Ponoy River with a kind of dam, on which trees grow.
When the tributaries Tichka, Kuksha, and Eljoka flow into the Ponoy River, the river reaches 100 m in width and 3 m in depth and approaches the first settlement, Krasnoshchelye (288 km from the mouth). The Shumesozero is located in the north of the village of Krasnoshchelye.
The sampling of natural waters from the Ponoy River and Shumesozero Lake, as well as from wells located on different streets of the village, was conducted in April 2024 (Figure 2, Table 1). The complete chemical composition of these waters was determined for the first time.
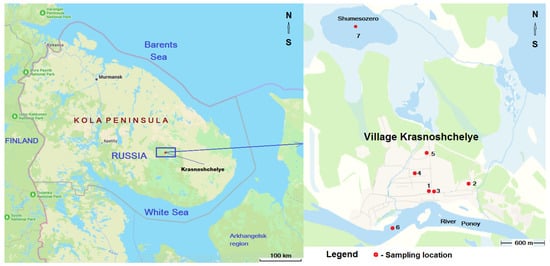
Figure 2.
Water sampling locations (highlighted in red): 1–5—wells, 6—Ponoy River, 7—Shumesozero Lake.

Table 1.
Sampling stations of surface waters and groundwater in the operation area.
2.2. Research Methods
Samples were collected in 1 L High-Density Polythene bottles previously washed with Milli-Q Element (Millipore SAS, Molsheim, France) deionized water. The preparation of bottles for samples was performed in a clean bench room. The samples were kept in a portable ice box and were delivered to the Laboratory of Chemical and Optical Methods of Analysis at the Tananaev Institute of Chemistry. The samples were stored in a chemical laboratory at temperature of 4–5 °C and were pre-filtered (filter with pore diameter of 0.45 μm) in the laboratory to carry out the analysis. In the present study, the analysis of water samples included determination of pH, Eh, alkalinity, anionic composition (Cl−, SO42−, NO3−, HCO3−, PO43−), and NH4+ using titrimetry and potentiometry methods and liquid analyzer Ekspert-001 (Econix-Expert, Moscow, Russia). The uncertainty of pH measurement was ±0.02, and for Eh it was ± 1 mV. For metallic parameters, the 50 mL samples were added by 0.1 mL to ultrapure distilled nitric acid to obtain a pH of 2–3 after acidification. Elemental analysis was performed using inductively coupled plasma mass spectrometry with an ELAN 9000 DRC-e instrument (Perkin Elmer, Waltham, MA, USA). All measurements were carried out in accordance with the state standard GOST R 56219-2014 (ISO 17294-2:2003) [27] (method quantification limit (MQL) for REE—0.1 µg/L for La-Lu and 0.2 µg/L for Yb), the official methodology CV 3.18.05-2005 [28], and the methods developed and used at the Institute of Chemistry. Multielement solutions ICP-MS-68A (Solution A and Solution B) (High-Purity Standards, Charleston, SC, USA) were used for calibration of the device. The analytical calibration curves of elements showed good linearity with R2 > 0.999 for standard addition calibration within the range of 10–200 μg L−1. Corrections for oxide and hydroxide ions were made for REEs and metals (with the help of mathematical correction, preliminary linear equations of mathematical correction were obtained). Blank contamination when determining U and Th was 0.000n and 0.001 µg/L and 0.001–0.010 for REE. In our work, the experimental assessment of MQL for REE was 0.01 µg/L, and for U and Th it was 0.1 and 0.2 ng/L, respectively. The validity and reproducibility of the analysis were controlled using standard samples, STOK-16, STOK-10 (Inorganic Ventures, Christiansburg, VA, USA), CRM-SOIL-A, and CWW-TM-A (High-Purity Standards, Charleston, SC, USA). Fluorine concentration was determined using direct potentiometry, with an ion meter I-160 MI, (ZIP, Gomel, Belarus) (performer E.A. Krasavtseva). The detection limit by the F− method was 0.02 µg/L.
2.3. Software and Thermodynamic Dataset for Modeling
Thermodynamic modeling was performed using the software package “Selektor”, version 3.01 (the patent holder is Vinogradov Institute of Geochemistry Siberian Branch of the Russian Academy of Sciences, Irkutsk, Russia). The software package implements the Gibbs energy minimization method based on the convex programming approach [29,30]. “Selektor” has built-in thermodynamic databases [31,32,33,34,35,36,37,38] and a module for building models of varying complexity. The algorithm used, based on minimizing the Gibbs potential of the system being modeled by convex programming, supports calculations of complex chemical equilibria in isobaric–isothermal, isochemical, and adiabatic conditions in multiple systems with the simultaneous presence of an aqueous electrolyte solution, gas mixture, liquid and solid hydrocarbons, and minerals in the form of solid solutions and single-component phases.
In the Selector PC, the computational core is a stable and efficient algorithm—the interior point method—and there are representative databases of thermodynamic properties of substances. The creation of new physicochemical models was automated, and a mechanism for processing and visualizing calculated data was integrated. The developed model was used to study many natural and man-made objects and was investigated in a state of uncertainty. The influence of errors in the chemical composition of the system, related to the accuracy (uncertainty) of analytical data, on the quantitative and qualitative characteristics of solutions and the minerals precipitating from them was evaluated.
To solve the problem, a physicochemical model of the interaction “water–rock” was developed. It was adapted to the conditions of the Kola Peninsula and helped to evaluate the environmental situation if there was a natural or anthropogenic influence in it. The physicochemical model includes 47 independent components (Al, B, Br, Ar, He, Ne, C, Ca, Cl, F, Fe, K, Mg, Mn, N, Na, P, S, Si, Sr, Cu, Zn, Ni, Pb, V, Ba, U, Ag, Au, Co, Cr, Hg, As, Cd, Mo, Se, La, Ce, Zr, H, O, ē), where ē is an electron, and 1174 dependent components—546 of them are in aqueous solution, 76 are in the gas phase, 111 are in liquid hydrocarbons, and 440 are in solid phases, organic, and mineral substances. The set of solid phases of the multisystem was formed taking into account the mineral composition of the rocks of the Baltic Shield [23,24]. In this work, the SP was used for modeling in the systems “water–atmosphere”, “water–rock–atmosphere”, and “solution–crystalline substance”, where the solution was a mixture of drinking water and gastric juice.
The boundary conditions of the model are the amount of water (1000 kg), 1 kg of atmosphere, and temperatures of 20 °C (temperature when performing chemical analyses) and 38 °C (average temperature of the organ, the stomach). The number of moles involved in the interaction, or the degree of interaction (ξ), simulates the rate of chemical processes.
3. Results and Discussion
The analysis for the chemical composition of the well water regarding macrocomponents (groundwater) shows concentrations (Figure 3) of mgL−1: Ca (4.1–15.0), Mg (0.94–2.5), Na (3.4–7.6), K (0.89–9.7), NO3− (11.3–31.8), and Cl− (3.3–10.2). For some microcomponents the following concentrations were found: μgL−1: Se (0.01–2.7), U (0.01–0.08), Th (0.01–0.12), Li (0.23–1.2), Fe (29.9–263), Cu (0.20–1.5), Ni (0.28–1.8), and Y (0.32–16.0). The pH values in wells range from 5.38 to 6.89 (the permissible range is 6.5–8.5 [10]), and in surface waters it is 6.38–6.45. The concentration of nitrates in the Ponoy River is 0.35 mgL−1.
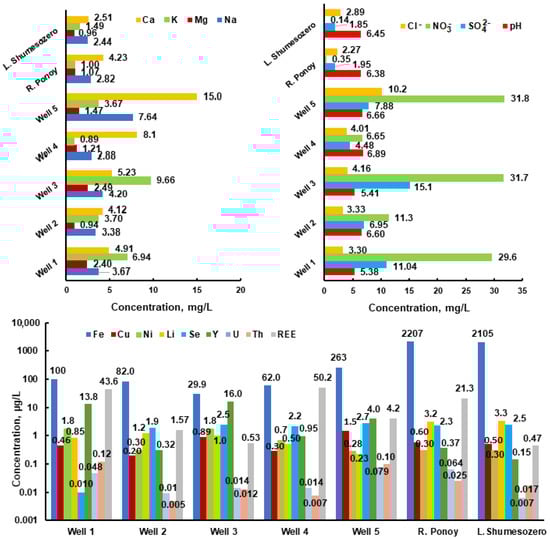
Figure 3.
The concentration of major cations, Na+, Ca2+, Mg2+, and K+; major anions, HCO3−, NO3−, Cl−, and SO42−; and some trace elements in the groundwater and surface waters in the study area.
This corresponds to background concentrations in the waters of the Vudyavryok River (0.3 mgL−1) in the Apatity–Kirovsk district of the Kola Peninsula [39]. The nitrate concentration in wells is ten times higher, which indicates their biogenic or man-made intake, but does not exceed the MCL, which is 45 mgL−1 [4]. It should be especially noted that the nitrate ion contains a nitrogen atom in the maximum oxidation state of +5 and is highly toxic [3,40]. High concentrations of nitrates contribute to children developing a blood disease called metaglobinemia, and nitrate derivatives in the body (nitrosamines) have carcinogenic properties [17,41]. According to SanPiN 2.1.4.1116-02 [13], the concentration of nitrates in bottled waters should not exceed 20 and 5 mgL−1 for waters of the first and highest categories, respectively. The latter indicates clearly overstated MCL values and high concentrations of NO3− in wells.
The iron concentration is 2.2 mgL−1 and exceeds the permissible value in surface waters (the Ponoy River and Shumesozero Lake). Its concentration does not exceed 0.3 mgL−1 (MCL 0.3 mgL−1; lower limits of the BSC 0.375 mgL−1) in wells [3,4].
The analytical data and modeling results of the chemical composition of the Ponoy River and well waters (Figure 2, point 5, Table 1) indicate higher concentration (several times) of the elements Ca, K, Na, Ba, Sr, Ce, La, Pr, Y, Cl, Zr, Cu, Co, and Zn in the well water. This can be explained by the “water–rock” interaction. Note that the predominant forms of lanthanide migration are nitrates, and in the well waters they are two orders of magnitude higher than in the surface waters (the Ponoy River).
The concentrations of Li and Be in the Ponoy River are significantly higher than in the well. This is most likely due to lithium and beryllium deposits in Keivy where the river flows. The high iron concentration in the river can be explained by the influence of swamps. Thus, the chemical composition of water is the result of the interaction between the water and rock, which reflects the history of the region, as well as biogenic or technogenic influences.
The data analysis (Table 2) shows that, from the standpoint of biological significance for the microelement balance of humans, important metals such as Co, Cu, Mn, Ni, V, Zn, and Cr have a lower concentration than the recommended lower limits of the BSC for them. Macroelements (Ca, Mg, and Na,) also have concentrations below the lower limits of the BSC. All this can lead to a violation of the micro- and macroelement balance in the human body and cause various diseases. Special attention should be paid to the fact that the detected concentrations of U, Th, and Y in wells are several times higher than their lower BSC limits.
Table 2.
Analytical data (AD) and modeling results (RM) of waters of the Ponoy River and the underground well; T 20 °C and P 1 bar.
Table 3 shows the composition of the phases that saturate the waters of the well and the Ponoy River at temperatures of 3 °C and 20 °C. The predominant phases in the Ponoy River are goethite and amorphous silica. This corresponds to the influence of the swamps and the weathering of the Keiv rocks on the chemical composition of the water. Silica predominates at 3 °C in the well waters.
Table 3.
Composition of phases with which the waters of the well and the Ponoy River are saturated (mol and %); T 20 °C and 3 °C.
The concentrations of Y, La, Ce, Sr, Li, and Be in the Ponoy River and well exceed the concentrations of these elements in the water intake of the “Central” location (city of Kirovsk) [21] and in the drinking water supply of the city of Murmansk [42].
In order to establish the connection between the elemental composition of the organism and the ecological and geochemical conditions of the studied area, within the framework of the Russian Science Foundation grant of 2018, we have developed a model of the stomach environment based on literary sources. Using modeling (PC “Selektor”), the qualitative and quantitative composition of the “solution–crystalline substance” system was studied taking into account environmental conditions and physiological indicators of the human body. In this case, the solution is natural drinking water, gastric juice, and a mixture of drinking water and gastric juice, and the crystalline substance is the newly formed phases in equilibrium with the solution [43]. The interaction of the gastric juice (GJ) with water essentially leads to the emergence of a geochemical barrier, i.e., the appearance of such physicochemical parameters when there is a sharp change in conditions and concentrations of elements, when solid phases can precipitate. This is a zone in which one geochemical environment is replaced by another [44]. The physicochemical modeling of the “natural waters–gastric juice” system was carried out under conditions of low acidity (pH = 6.24, Eh = 0.218 V, C(Cl−) = 2285 mgL−1) with 100 and 10 mL of gastric juice with different amounts of well water (T 38 °C). Such conditions are possible in elderly people, children, and a number of sick people. Figure 4 shows changes in pH, Eh, migration forms (using Nd as an example), and the composition of newly formed phases depending on the degree of interaction ξ (from 10−6 to 10−3).
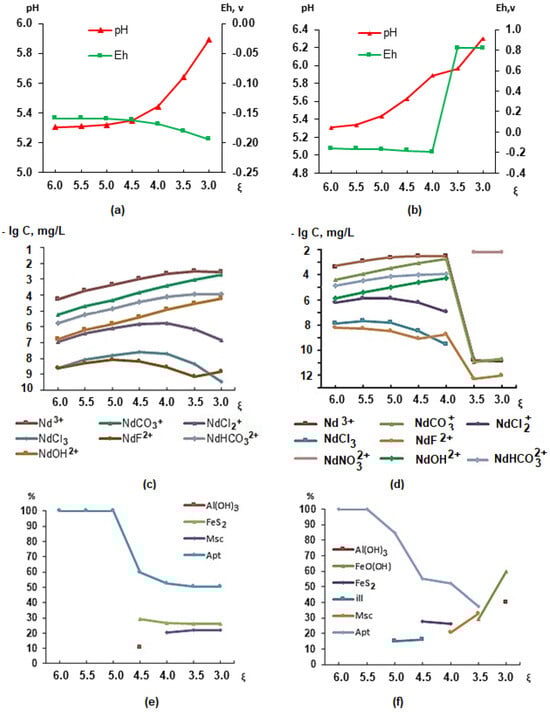
Figure 4.
Changes in parameters in the stomach during the interaction of 100 mL (a,c,e) and 10 mL (b,d,f) of gastric juice and a volume of water from 1 to 1000 mL.
The analysis of the results indicates that if there is 100 mL (Figure 4a) or 10 mL of gastric juice (Figure 4b) in the stomach at the time of water intake, then as its volume increases, the acidity and oxidation–reduction conditions in the stomach will change. A water volume of more than 200 mL (ξ = 3.7) will lead to positive Eh values (Figure 4b), a change in the forms of lanthanide migration (shown using the example of Nd, Figure 4d), the appearance of NdNO32+ instead of Nd3+, a change in the qualitative and quantitative composition of the phases and the appearance of illite and FeO(OH), and the disappearance of apatite (Figure 4f). Considering that the waters of wells in the village of Krasnoshchelye can contain up to 50 mgL−1 of rare earth elements (REEs), changes in their migration patterns can lead to accumulation in the human body. For REEs, except for yttrium, no BSC or MCL has been established, but their presence in the body can cause a number of diseases, including those of the nervous system [45,46,47]. An evaluation of the elemental status of children in the village of Lovozero (also located in the Lovozero district) confirmed the presence of REEs (Sc, Y, La, Ce, Pr, Nd, Sm, Eu, Gd, Tb, Dy, Ho, Er, Tm, Yb, and Lu) in the children’s hair [43]. The drinking water studied in the wells of the village of Krasnoshchelye also contains rare earth elements.
Changes in oxidation–reduction conditions will affect the behavior of other polyvalent elements, such as Cu, Fe, U, Al, V, etc. Uranium will transform from a four-valent form (UO2) to a six-valent form: UO22+, UO2OH+, and UO3. The valence of uranium is of great importance for the body since up to 20% of hexavalent uranium accumulates in the kidneys, 10–30% accumulates in the skeleton, and a small amount is deposited in the liver [46]. Up to 50% of tetravalent uranium accumulates in the liver and spleen; up to 10–20% is deposited in the bones and kidneys. In bone tissue, uranium is deposited on the surface of the smallest hydroxyapatite crystals as a result of the ion exchange of two Ca2+ ions for one UO22+ ion. Each UO22+ ion binds tightly to two adjacent phosphate groups on the crystal surface and releases two Ca2+ ions. The form of the uranium compound in bone tissue is apparently otenite Ca(UO2)2(PO4)28H2O. Uranium is not part of the crystalline structure of apatite but is adsorbed on it. It has been established that the uranium content in fish bones is ten times higher than in muscles [48].
Vanadium from the migration from VO+ passes into HVO42− and H3VO4. Barium, yttrium, nickel, lead, and boron migrate as Ba2+, Y3+, Ni2+, Pb2+, and H3BO3. The sum of the ratios of the concentration of components detected in water compared to their MCL values should not be greater than one in order to avoid an amplifying effect—the summation effect. This principle is applied to substances with the same type of toxic action mechanism: barium and strontium are nerve and muscle poisons; barium and boron together have a negative effect on the reproductive function of the body [3]. In our case, the toxicity index was less than one. Barium migrates in the form of Ba2+ cations, a toxic substance. The concentration of barium in the well is 0.037 mgL−1. This is above the lower limits for the BSC (0.02). Boron is represented by the toxic acid H3BO3. This is a highly toxic substance with a polytropic effect. The concentration of boron in the well is below the MCL (0.5 mgL−1) and the lower limits for the BSC (0.0325 mgL−1). As indicated in [3], high MCL values for a number of elements cannot serve as a characteristic of hydrochemical anomalies in specific areas.
4. Conclusions
This work is an important contribution to the study of water quality in the Lovozersky district, especially regarding the impact of the chemical composition of water on the health of the indigenous population. The detection of high concentrations of rare and rare earth elements in the drinking water of the village of Krasnoshchelye raises serious concerns, especially in the context of the high level of morbidity. Considering the importance of adhering to sanitary standards and maximum allowable concentrations, a detailed analysis of the chemical composition of water and its impact on human health was carried out. The results show that the composition of macroelements, such as Ca, Mg, Na, and K, and microelements (Co, Cu, Mn, Ni, V, Zn, and Cr) has less biological significance than suggested, which raises questions about the presence of sufficient nutrients to support health. Nevertheless, significant exceedances of biologically significant concentrations of U, Th, and Y have been recorded, which is a serious cause for concern.
This study also demonstrates an increase in the mobility of trace elements in the human body, showing that this depends not only on the chemical composition but also on individual physiological characteristics, such as the acidity and volume of gastric secretions. The presence of rare and rare earth elements in well water and the possibility of their accumulation in the body presents new horizons for further research, as this may have a negative impact on human health, including the development of diseases of the nervous system and other organs. Thus, this study raises important questions that require the attention of researchers, healthcare professionals, and authorities to initiate necessary measures for the protection of water resources and public health.
It should be noted that this study has been conducted on a limited number of samples and requires further continuation to clarify a number of points.
Author Contributions
Conceptualization, S.M. and S.D.; methodology, S.M. and S.D.; software, S.M.; validation, S.D., S.M., and V.M.; formal analysis, S.D.; investigation, S.D., V.R., and A.S. (Anna Shirokaya); resources, A.S. (Aleksandr Safonov) and S.S.; data curation, S.M., S.D., and A.S. (Anna Shirokaya ); writing—original draft preparation, S.M. and S.D.; writing—review and editing, S.D.; visualization, S.D.; supervision, V.M.; project administration, V.M.; funding acquisition, V.M. All authors have read and agreed to the published version of the manuscript.
Funding
This study was carried out with the financial support of the Russian Science Foundation 24-17-00114 “Evaluation of the chemical state of natural and drinking waters of the Murmansk region, forms of migration, impact on the elemental status of residents”.
Data Availability Statement
The original contributions presented in the study are included in the article. Further inquiries can be directed to the corresponding author.
Conflicts of Interest
The authors declare that they have no conflicts of interest. The funders had no role in the design of the study; in the collection, analyses, or interpretation of data; in the writing of the manuscript; or in the decision to publish the results.
References
- Dolgikh, P.G. Geoecological Features of the Chemical Composition of Waters and Bottom Sediments of the Ust-Ilimsky Reservoir. Doctoral Dissertation, AP.P. Vinogradov Institute of Geochemistry, Irkutsk, Russia, 2024. Available online: http://www.igc.irk.ru/ru/zashchita (accessed on 15 May 2024).
- Ushakova, E.S. Ecogeochemistry of Aquatic Ecosystems of Urbanized Territories of the Northern Caspian Sea. Doctoral Dissertation, Tomsk Polytechnic University, Tomsk, Russia, 2024. Available online: https://portal.tpu.ru/council/indcouncils/6080/worklist (accessed on 18 July 2024).
- Kayukova, E.P.; Filimonova, E.A. Quality of fresh groundwater of the Crimean Mountains (the Bodrak River Basin). Mosc. Univ. Bulletin. Ser. 4 Geol. 2022, 1, 79–88. [Google Scholar] [CrossRef]
- SanPiN 2.1.3684-21; Sanitary Rules and Standards. Hygienic Standards and Requirements for Ensuring the Safety and (or) Harmlessness of Envi-ronmental Factors for Humans. Ministry of Health of Russia: Moscow, Russia, 2021.
- Order of the Ministry of Agriculture of the Russian Federation Dated December 13, 2016, No. 552 “On the Approval of Water Quality Standards for Aquatic Objects of Fisheries Significance, Including Standards for Maximum Allowable Concentrations of Harmful Sub-stances in the Waters of Aquatic Objects of Fisheries Significance”; Ministry of agriculture of the Russian Federation: Moscow, Russia, 2016.
- Guidelines for Drinking-Water Quality: Fourth Edition Incorporating the First Addendum; World Health Organization: Geneva, Switzerland, 2017; p. 543.
- Su, K.; Wang, Q.; Li, L.; Cao, R.; Xi, Y. Water quality assessment of Lugu Lake based on Nemerow pollution index method. Sci. Rep. 2022, 12, 13613. [Google Scholar] [CrossRef]
- Chidiac, S.; El Najjar, P.; Ouaini, N.; El Rayess, Y.; El Azzi, D. A comprehensive review of water quality indices (WQIs): History, models, attempts and perspectives. Rev. Environ. Sci. Biotechnol. 2023, 22, 349–395. [Google Scholar] [CrossRef] [PubMed]
- Saha, P.; Paul, B. Water Quality Assessment Techniques. In Sustainable Agriculture Reviews 40; Lichtfouse, E., Ed.; Springer: Cham, Switzerland, 2020; pp. 179–216. [Google Scholar] [CrossRef]
- Das, S.; Roy, P.K.; Banerjee, G.A. Mazumdar, Water Quality Index Is an Important Tool of Groundwater: A Case Study. In Advances in Water Resources Management for Sustainable Use; Lecture Notes in Civil Engineering, Vol 131; Springer: Singapore, 2021; pp. 149–168. [Google Scholar] [CrossRef]
- Shaaban, N.A.; Stevens, D.K. Transforming Complex Water Quality Monitoring Data into Water Quality Indices. Water Resour. Manag. 2025, 39, 3883–3899. [Google Scholar] [CrossRef]
- Goncharuk, V.V.; Zui, O.V.; Melnik, L.A.; Mishchuk, N.A.; Nanieva, A.V.; Pelishenko, A.V. Assessment of the physiological adequacy of drinking water by biotesting. Chem. Sustain. Dev. 2021, 1, 35–41. [Google Scholar] [CrossRef]
- SanPiN 2.1.4.1116-02; Sanitary Rules and Standards. Drinking Water. Hygienic Requirements for the Quality of Water Packaged in Containers. Quality Control, Ministry of Health of Russia: Moscow, Russia, 2002.
- Sanitary Norms and Rules. Requirements for the Physiological Usefulness of Drinking Water; Sanitary Norms and Rules: Minsk, Belarus, 2012. [Google Scholar]
- DSTU 7525-2014; Drinking Water. Requirements and Methods of Quality Control. Ministry of Economic Development of Ukraine: Kiev, Ukraine, 2014.
- Kovalsky, V.V. Geochemical Ecology; Nauka Publ.: Moscow, Russia, 1974. [Google Scholar]
- Krainov, S.R.; Ryzhenko, B.N.; Shvets, V.M. Geochemistry of Groundwater. Theoretical, Applied and Environmental Aspects; CentrLitNefteGaz: Moscow, Russia, 2012. [Google Scholar]
- Barvish, M.V.; Schwartz, A.A. A new approach to the assessment of the microcomponent composition of underground waters used for drinking water supply. Geoecology 2000, 5, 467–473. [Google Scholar]
- Linnik, P.N.; Nabivanets, B.I. Forms of Metal Migration in Fresh Surface Waters; Gidrometeoizdat: Leningrad, Russia, 1986. [Google Scholar]
- Linnik, P.N.; Zhezherya, V.A. Aluminum in surface water of ukraine: Concentrations, migration forms, distribution among abiotic components. Water Resour. 2013, 40, 157–169. [Google Scholar] [CrossRef]
- Sandimirov, S.S.; Pozhilenko, V.I.; Mazukhina, S.I.; Drogobuzhskaya, S.V.; Shirokaya, A.A.; Tereshchenko, P.S. Chemical Composition of Natural Waters of the Lovozero Massif, Russia. Model. Earth Syst. Environ. 2022, 8, 4307–4315. [Google Scholar] [CrossRef]
- Mazukhina, S.I.; Sandimirov, S.S.; Drogobuzhskaya, S.V. Physiological adequacy assessment of potable water in Lovozero district, Murmansk region of Russia. In Biogenic—Abiogenic Interactions in Natural and Anthropogenic Systems; Frank-Kamenetskaya, O.V., Vlasov, D.Y., Panova, E.G., Alekseeva, T.V., Eds.; Springer Proceedings in Earth and Environmental Sciences; Springer: Cham, Switzerland, 2022; pp. 617–633. [Google Scholar] [CrossRef]
- Mazukhina, S.I.; Drogobuzhskaya, S.V.; Sandimirov, S.S.; Masloboev, V.A. Features of changes in chemical composition of drinking water as a result of water treatment (Lovozero, Kola peninsula). Bull. Tomsk. Polytech. Univ. Geo Assets Eng. 2023, 334, 243–252. [Google Scholar] [CrossRef]
- Mazukhina, S.; Drogobuzhskaya, S.; Sandimirov, S.; Masloboev, V. Effect of Water Treatment on the Chemical Composition of Drinking Water: A Case of Lovozero, Murmansk region, Russia. Sustainability 2022, 14, 16996. [Google Scholar] [CrossRef]
- Rospotrebnadzor. On the State of Epidemiological Well-Being of the Population in the Murmansk Region Were Prepared by a Working Group of Specialists: Sanitary-2022; Materials for the State Report; Rospotrebnadzor: Murmansk, Russia, 2023; Available online: https://51.rospotrebnadzor.ru/content/866/67906 (accessed on 10 March 2024).
- Rospotrebnadzor. On the State of the Sanitary and Epidemiological Well-Being of the Population in the Murmansk Region in 2023; Materials for the State Report; Rospotrebnadzor: Murmansk, Russia, 2024; 214p, Available online: https://51.rospotrebnadzor.ru/content/866/72395 (accessed on 12 July 2024).
- GOST R 56219-2014 (ISO 17294-2:2003); Water. Determination of 62 Elements by Inductively Coupled Plasma Mass Spectrometry (ICP-MS) Method. Water Quality—Application of Inductively Coupled Plasma Mass Spectrometry (ICP-MS)—Part 2: Determination of 62 Elements (MOD). Standardinform: Moscow, Russia, 2015; 32p.
- CV 3.18.05-2005; Water Quality. Methodology for Measuring the Elemental Composition of Drinking Water, Natural Water, Wastewater, and Atmospheric Precipitation Using Mass Spectrometry with Inductively Coupled Plasma Ionization. JSC: Saint Petersburg, Russia, 2005; 22p.
- Karpov, I.K.; Chudnenko, K.V.; Kulik, D.A.; Bychinskii, V.A. The convex programming minimization of five thermodynamic potentials other than Gibbs energy in geochemical modeling. Am. J. Sci. 2002, 302, 281–311. [Google Scholar] [CrossRef]
- Chudnenko, K.V. Thermodynamic Modeling in Geochemistry: Theory, Algorithms, Software, Applications; Akadem Publishing House “Geo”: Novosibirsk, Russia, 2010. [Google Scholar]
- Reid, R.; Prausnic, D.; Shervud, T. Gases and Liquids Properties; Him-ija: Leningrad, Russia, 1982; 592p. [Google Scholar]
- Reid, R.C.; Prausnitz, J.M.; Sherwood, T.K. The Properties of Gases and Liquids; McGraw-Hill Book Company: New York, NY, USA, 1977. [Google Scholar]
- Shock, E.L.; Helgeson, H.C. Calculation of the thermodynamic and transport properties of aqueous species at high pressures and temperatures: Correlation algorithms for ionic species and equation of state predictions to 5 kb and 100 °C. Geochim. Cosmochim. Acta 1988, 52, 2009–2036. [Google Scholar] [CrossRef]
- Yokokawa, H. Tables of thermodynamic properties of inorganic compounds. J. Nat. Chem. Lab. Indust. 1988, 83, 27–121. [Google Scholar]
- Shock, E.L.; Helgeson, H.C.; Sverjensky, D.A. Calculation of the thermodynamic and transport properties of aqueous species at high pressures and temperatures: Standard partial molal properties of inorganic neutral species. Geochim. Cosmochim. Acta 1989, 53, 2157–2183. [Google Scholar] [CrossRef]
- Johnson, J.W.; Oelkers, E.H.; Helgeson, H.C. SUPCRT92: Software package for calculating the standard molal thermodynamic properties of mineral, gases, aqueous species, and reactions from 1 to 5000 bars and 0 to 100 °C. Comput. Geosci. 1992, 18, 899–947. [Google Scholar] [CrossRef]
- Robie, R.A.; Hemingway, B.S. Thermodynamic Properties of Minerals and Related Substances at 298.15 K and 1 Bar (105 Pascals) Pressure and at Higher Temperatures; United States Geological Survey: Washington, DC, USA, 1995. [Google Scholar]
- Shock, E.L.; Sassani, D.C.; Willis, M.; Sverjensky, D.A. Inorganic species in geologic fluids: Correlation among standard molal thermodynamic properties of aqueous ions and hydroxide complexes. Geochim. Cosmochim. Acta 1997, 61, 907–950. [Google Scholar] [CrossRef]
- Tokarev, I.V. Isotope Reconstruction of the Origin, Evolution and Assessment of the Current State of Water and Ice Objects. Doctoral Dissertation, St Petersburg University, Saint Petersburg, Russia, 2024. Version 2. p. 48. Available online: https://crust.ru/newsfullarchive.html (accessed on 18 July 2024).
- Toolabi, A.; Bonyadi, Z.; Paydar, M.; Najafpoor, A.A.; Ramavandi, B. Spatial distribution, occurrence, and health risk assessment of nitrate, fluoride, and arsenic in Bam groundwater resource. Iran. Groundw. Sustain. Dev. 2021, 12, 100543. [Google Scholar] [CrossRef]
- Kubisiak-Banaszkiewicz, L.; Zukiewicz-Sobczak, W.; Starek-Wójcicka, A.; Mazur, J.; Sobczak, P. Methods of Assessing Water Quality in Terms of Public Health. Water 2025, 17, 70. [Google Scholar] [CrossRef]
- Mazukhina, S.I.; Drogobuzhskaya, S.V.; Ionov, N.V.; Rybachenko, V.V. Analysis of the chemical composition of tap water of Murmansk. In Ecological Problems of the Northern Regions and Ways to Their Solution. Proceedings of the VIII Russian Scientific Conference with International Participation, Apatity, Russia, 24–29 June 2024; Makarov, D.V., Ed.; Publishing house of the FIS of the KSC RAS: Apatity, Russia, 2024; pp. 279–280. [Google Scholar]
- Mazukhina, S.I.; Chudnenko, K.V.; Tereshchenko, P.S.; Drogobuzhskaya, S.V. Formation of Concretions in Human Body under the Influence of the State of Environment of the Kola Peninsula: Thermodynamic Modeling. Chem. Sustain. Dev. 2020, 28, 186–194. [Google Scholar] [CrossRef]
- Mazukhina, S.I.; Maksimova, V.V.; Chudnenko, K.V.; Masloboev, V.A.; Sandimirov, S.S.; Drogobuzhskaya, S.V.; Tereshchenko, P.S.; Senzhenko, V.I.; Gudkov, A.V. Water Quality of the Arctic Zone of the Russian Federation: Physico-Chemical Modeling of Water Formation, Forms of Migration of Elements, Influence on the Human Body; Publishing house of the FIS of the KSC RAS: Apatity, Russia, 2020. [Google Scholar]
- Belisheva, N.K.; Drogobuzhskaya, S.V. Rare Earth Element Content in Hair Samples of Children Living in the Vicinity of the Kola Peninsula Mining Site and Nervous System Diseases. Biology 2024, 13, 626. [Google Scholar] [CrossRef]
- Tong, S.L.; Zhu, W.Z.; Gao, Z.H.; Meng, Y.X.; Peng, R.L.; Lu, G.C. Distribution characteristics of rare earth elements in children’s scalp hair from a rare earths mining area in Southern China. J. Environ. Sci. Health Part A 2004, 39, 2517–2532. [Google Scholar] [CrossRef]
- Wang, W.; Yang, Y.; Wang, D.; Huang, L. Toxic Effects of Rare Earth Elements on Human Health: A Review. Toxics 2024, 12, 317. [Google Scholar] [CrossRef]
- Moskalev, Y.I. Mineral Exchange; Medicine: Moscow, Russia, 1985; 288p. [Google Scholar]


Disclaimer/Publisher’s Note: The statements, opinions and data contained in all publications are solely those of the individual author(s) and contributor(s) and not of MDPI and/or the editor(s). MDPI and/or the editor(s) disclaim responsibility for any injury to people or property resulting from any ideas, methods, instructions or products referred to in the content. |
© 2025 by the authors. Licensee MDPI, Basel, Switzerland. This article is an open access article distributed under the terms and conditions of the Creative Commons Attribution (CC BY) license (https://creativecommons.org/licenses/by/4.0/).