Article

Research on Evolutionary Patterns of Water Source–Water Use Systems from a Synergetic Perspective: A Case Study of Henan Province, China

1
Ecological Environment Geo-Service Center of Henan Geological Bureau, Zhengzhou 450000, China
2
Technology Research Center for Mine Environment and Ecological Restoration Engineering of Henan Province, Zhengzhou 450000, China
3
School of Water Conservancy and Transportation, Zhengzhou University, Zhengzhou 450001, China
*
Author to whom correspondence should be addressed.
Water 2025, 17(19), 2888; https://doi.org/10.3390/w17192888
Submission received: 26 August 2025 / Revised: 27 September 2025 / Accepted: 30 September 2025 / Published: 3 October 2025

Abstract

China faces the persistent challenge of uneven spatiotemporal water resource distribution, constraining economic and social development while exacerbating regional disparities. Achieving co-evolution between water source systems and water use systems is thus a critical proposition in water resources management. Based on synergetics theory, this study takes Henan Province, a typical water-scarce social–ecological system, as the research object, and constructs a quantitative analysis framework for supply–demand bidirectional synergy. It systematically reveals the evolution patterns of water resource systems under the mutual feedback mechanism between water sources and water use. Findings indicate that between 2012 and 2022, the synergy degree of Henan’s water resource system increased by nearly 40%, exhibiting significant spatiotemporal differentiation: spatially “lower north, higher south”, and dynamically shifting from demand-constrained to supply-optimized. Specifically, the water source system’s order degree showed a “higher northwest, lower southeast” spatial pattern. Since the operation of the South-to-North Water Diversion Middle Route Project, the provincial average order degree increased significantly (annual growth rate of 0.01 units), though with distinct regional disparities. The water use system’s order degree also exhibited “lower north, higher south” pattern but achieved greater growth (annual growth rate of 0.03 units), with narrowing north–south gaps driven by improved management efficiency and technological capacity. This study innovatively integrates water source systems and water use systems into a unified analytical framework, systematically elucidating the intrinsic evolution mechanisms of water resource systems from the perspective of supply–demand mutual feedback. It provides theoretical and methodological support for advancing systematic water resource governance.

1. Introduction

China’s total water resources rank sixth globally, yet their spatiotemporal distribution exhibits marked heterogeneity due to monsoon climate and topographic conditions [1,2], perpetuating a natural endowment pattern of “water scarcity in the north and abundance in the south [3].” Statistical data reveal that per capita water resources in northern provinces generally fall below 1000 m3/year, the threshold for severe water scarcity [4]. Under the dual pressures of climate change and anthropogenic activities, escalating variability in water resource systems and rising societal demand will further complicate supply–demand contradictions [5]. Addressing the synergistic evolution between water source systems and water use systems has emerged as a critical scientific challenge in water resources management.
Water resource systems inherently constitute coupled socio-ecological systems with nonlinear feedback characteristics. The water source system sustains water use systems through water endowment and hydraulic engineering operations, yet its development thresholds remain constrained by ecological carrying capacity [6]. Conversely, water use systems reciprocally enhance source systems via demand structure optimization and water-saving innovations, with their synergistic interactions forming the core mechanism for maintaining dynamic equilibrium in compound systems. Such mutual feedback is exemplified in inter-basin water transfer projects. The South-to-North Water Diversion Central Route has delivered over 23.7 billion m3 of water to Henan Province (2014–2024) [7], significantly alleviating water crises in critical urban clusters like Zhengzhou. However, it must be recognized that engineering solutions merely achieve spatial redistribution of water quantities, while the fundamental synergy between source system development and water use efficiency remains unrealized [8]. With water use efficiency still lagging behind international standards, optimizing the synergistic structure between water sources and usage remains pivotal.
Current academic understanding of quantitative synergistic relationships and evolutionary mechanisms in water resource systems remains limited. Traditional supply–demand equilibrium analyses relying on static water accounting methods fail to reveal dynamic feedback mechanisms [9]. Distributed hydrological models (e.g., SWAT, VIC) effectively simulate physical processes of underlying surface-meteorological interactions but inadequately couple socio-economic water use behaviors [10]. Although system dynamics approaches extend temporal dimension analyses, their predefined structures struggle to capture self-organizing evolutionary features [11]. For instance, groundwater overexploitation in the North China Plain and ecological degradation in inland river basins of Northwest China fundamentally manifest long-term imbalances between water supply capacity and demand expansion [12], a systemic driver poorly elucidated by conventional methods.
Notably, synergetics, a core branch of systems science, provides a theoretical framework for analyzing complex system interactions. Through concepts like order parameter dominance and self-organizing evolution, it reveals how nonlinear interactions between subsystems drive ordered structural formation in holistic systems, proving particularly applicable to giant complex systems characterized by fluctuation dynamics and dynamic equilibrium [13]. Recent applications of synergetics in water resources research have focused on macro-level water-economy synergies (e.g., urbanization-water carrying capacity coupling) [14,15] or optimization of water allocation decisions (e.g., reservoir group operations) [16,17], leaving a critical gap in dedicated studies on bidirectional synergies between water source and use subsystems.
To this end, this study takes Henan Province, a typical water-scarce socio-ecological system with per capita water resources amounting to less than one-fifth of the national average [18], as its research subject. Based on synergy theory, it constructs a quantitative analysis framework for bidirectional synergy between supply and demand. First, we analyze evolutionary trends of subsystem orderliness through water source and use system order degree indices. Second, a water resource synergy evaluation model integrating equity and efficiency is established using Lorenz curves and Gini coefficient. Finally, we elucidate the evolutionary mechanisms of water resource systems under source-use interactions through synergetic theory. This research not only advances theoretical understanding of water system synergies but also provides scientific support for institutional innovation in Yellow River Basin water resource constraints, offering practical value for transforming human-water relationship paradigms [5].

2. Materials and Methods

2.1. Overview of the Study Area

Henan Province is located in central China (Figure 1), covering a total area of 167,000 km2. Its terrain slopes from higher elevations in the west to lower elevations in the east, spanning the four major river basins: the Yangtze River, Huaihe River, Yellow River, and Haihe River. Most of Henan lies in the warm temperate zone and features a continental monsoon climate. It also exhibits a transitional climate pattern from plains to hilly and mountainous regions when moving from east to west. The province’s annual average temperature ranges between 15.1 °C and 15.9 °C, while the average annual precipitation decreases gradually from south to north, measuring between 512.6 mm and 1133.3 mm.
Henan Province comprises 17 prefecture-level cities, with Zhengzhou as its capital. It has a permanent population of 97.85 million and a per capita GDP of 60,100 CNY. As a core grain production area in China, Henan has approximately 75,100 km2 of cultivated land, of which 45,900 km2 (61%) are irrigated farmland, reflecting a high reliance on water resources. In 2020, the total water resources in Henan amounted to 40.86 billion m3, ranking 19th nationwide. However, the per capita water resources availability was only 411.9 m3, significantly below the national average.

2.2. Data Sources and Processing

Given data availability, this study utilizes water resource system data from Henan Province for 2012–2022. Order parameter data for water resource subsystems are sourced from the Henan Water Resources Bulletin and Henan Statistical Yearbook. These two datasets, publicly released by the Henan Provincial Department of Water Resources and the Henan Provincial Bureau of Statistics, respectively, provide annual records of various water source totals and sectoral water use volumes for each prefecture-level city in Henan Province. Ecological and domestic water use data for 2012–2019 are derived by extrapolating 2019–2022 data using per capita daily domestic water consumption (L/day) from the Henan Statistical Yearbook. Water resource utilization rates are calculated as the ratio of water consumption to total water resources, as reported in the Henan Water Resources Bulletin. Upper and lower bounds for each indicator are set as the maximum and minimum values observed during 2012–2022. To address dimensional heterogeneity among order parameters, raw data are standardized using the following formula:
x i j = x i j α i j β i j α i j
where x i j is the standardized value; x i j is the value of the j-th indicator in the i-th system; α i j and β i j are the lower and upper bounds of the j-th indicator, respectively; j ∈[1, n ].

2.3. Theoretical Foundations

2.3.1. Synergetics Theory

Synergetics, an interdisciplinary theory pioneered by German theoretical physicist Hermann Haken in the 1970s [19], investigates the self-organizing evolution of open systems, specifically, how subsystems transition from disorder to order and from low-level to high-level ordered states through nonlinear interactions. The theory posits that system evolution is driven by competition and synergy among subsystems: competition drives systems away from equilibrium, while synergy generates macroscopic ordered structures through coordinated interactions [20].
In synergetics, “synergy” refers to the holistic coordination effect arising from nonlinear interactions between subsystems, which can be characterized by the dynamics of state variables (parameters describing system states) [21]. Near critical thresholds (where qualitative changes occur), state variables bifurcate into two categories: fast variables (rapidly changing/decaying parameters) and slow variables (slow-evolving parameters that dominate system behavior). At this stage, fast variables stabilize under nonlinear interactions (slaved to slow variables), while a few slow variables emerge as order parameters that govern macroscopic system behavior and determine its degree of order [22]. The non-zero values of order parameters signify system synergy, through positive feedback or competition, order parameters establish stable patterns that drive systems toward specific ordered structures.
This theoretical breakthrough provides novel insights for analyzing nonlinear synergistic mechanisms in water resource systems. Both hydrological cycles (water source systems) and socio-economic water use behaviors exhibit synergetic characteristics such as self-organization and fluctuation dynamics [23]. Systems maintain adaptive regulation through dynamic equilibrium via material/energy exchange with external environments. Building on this, our specific contribution is the construction of a quantitative framework that applies synergetics to measure the bidirectional synergy between these subsystems.

2.3.2. Lorenz Curve and Gini Coefficient

The Lorenz Curve, introduced by American economist Max O. Lorenz in 1905, originally quantified fairness in income or wealth distribution [24]. It ranks study subjects (e.g., populations, regions) by a specific attribute (e.g., income, water resources) in ascending order and plots cumulative proportions of the attribute against cumulative proportions of the population [8]. When the curve aligns with the diagonal line (“line of absolute equality”), the distribution is perfectly equitable; greater curvature indicates higher inequality (Figure S1).
To address the qualitative limitations of the Lorenz Curve, Italian statistician Corrado Gini proposed the Gini Coefficient in 1912 [8]. Defined as the ratio of area A (between the Lorenz Curve and the equality line) to area A + B (total area under the equality line), G = A/(A + B), the coefficient ranges from 0 to 1: G = 0 represents perfect equality (Lorenz Curve matches the diagonal); G = 1 represents absolute inequality (Lorenz Curve forms a right angle).
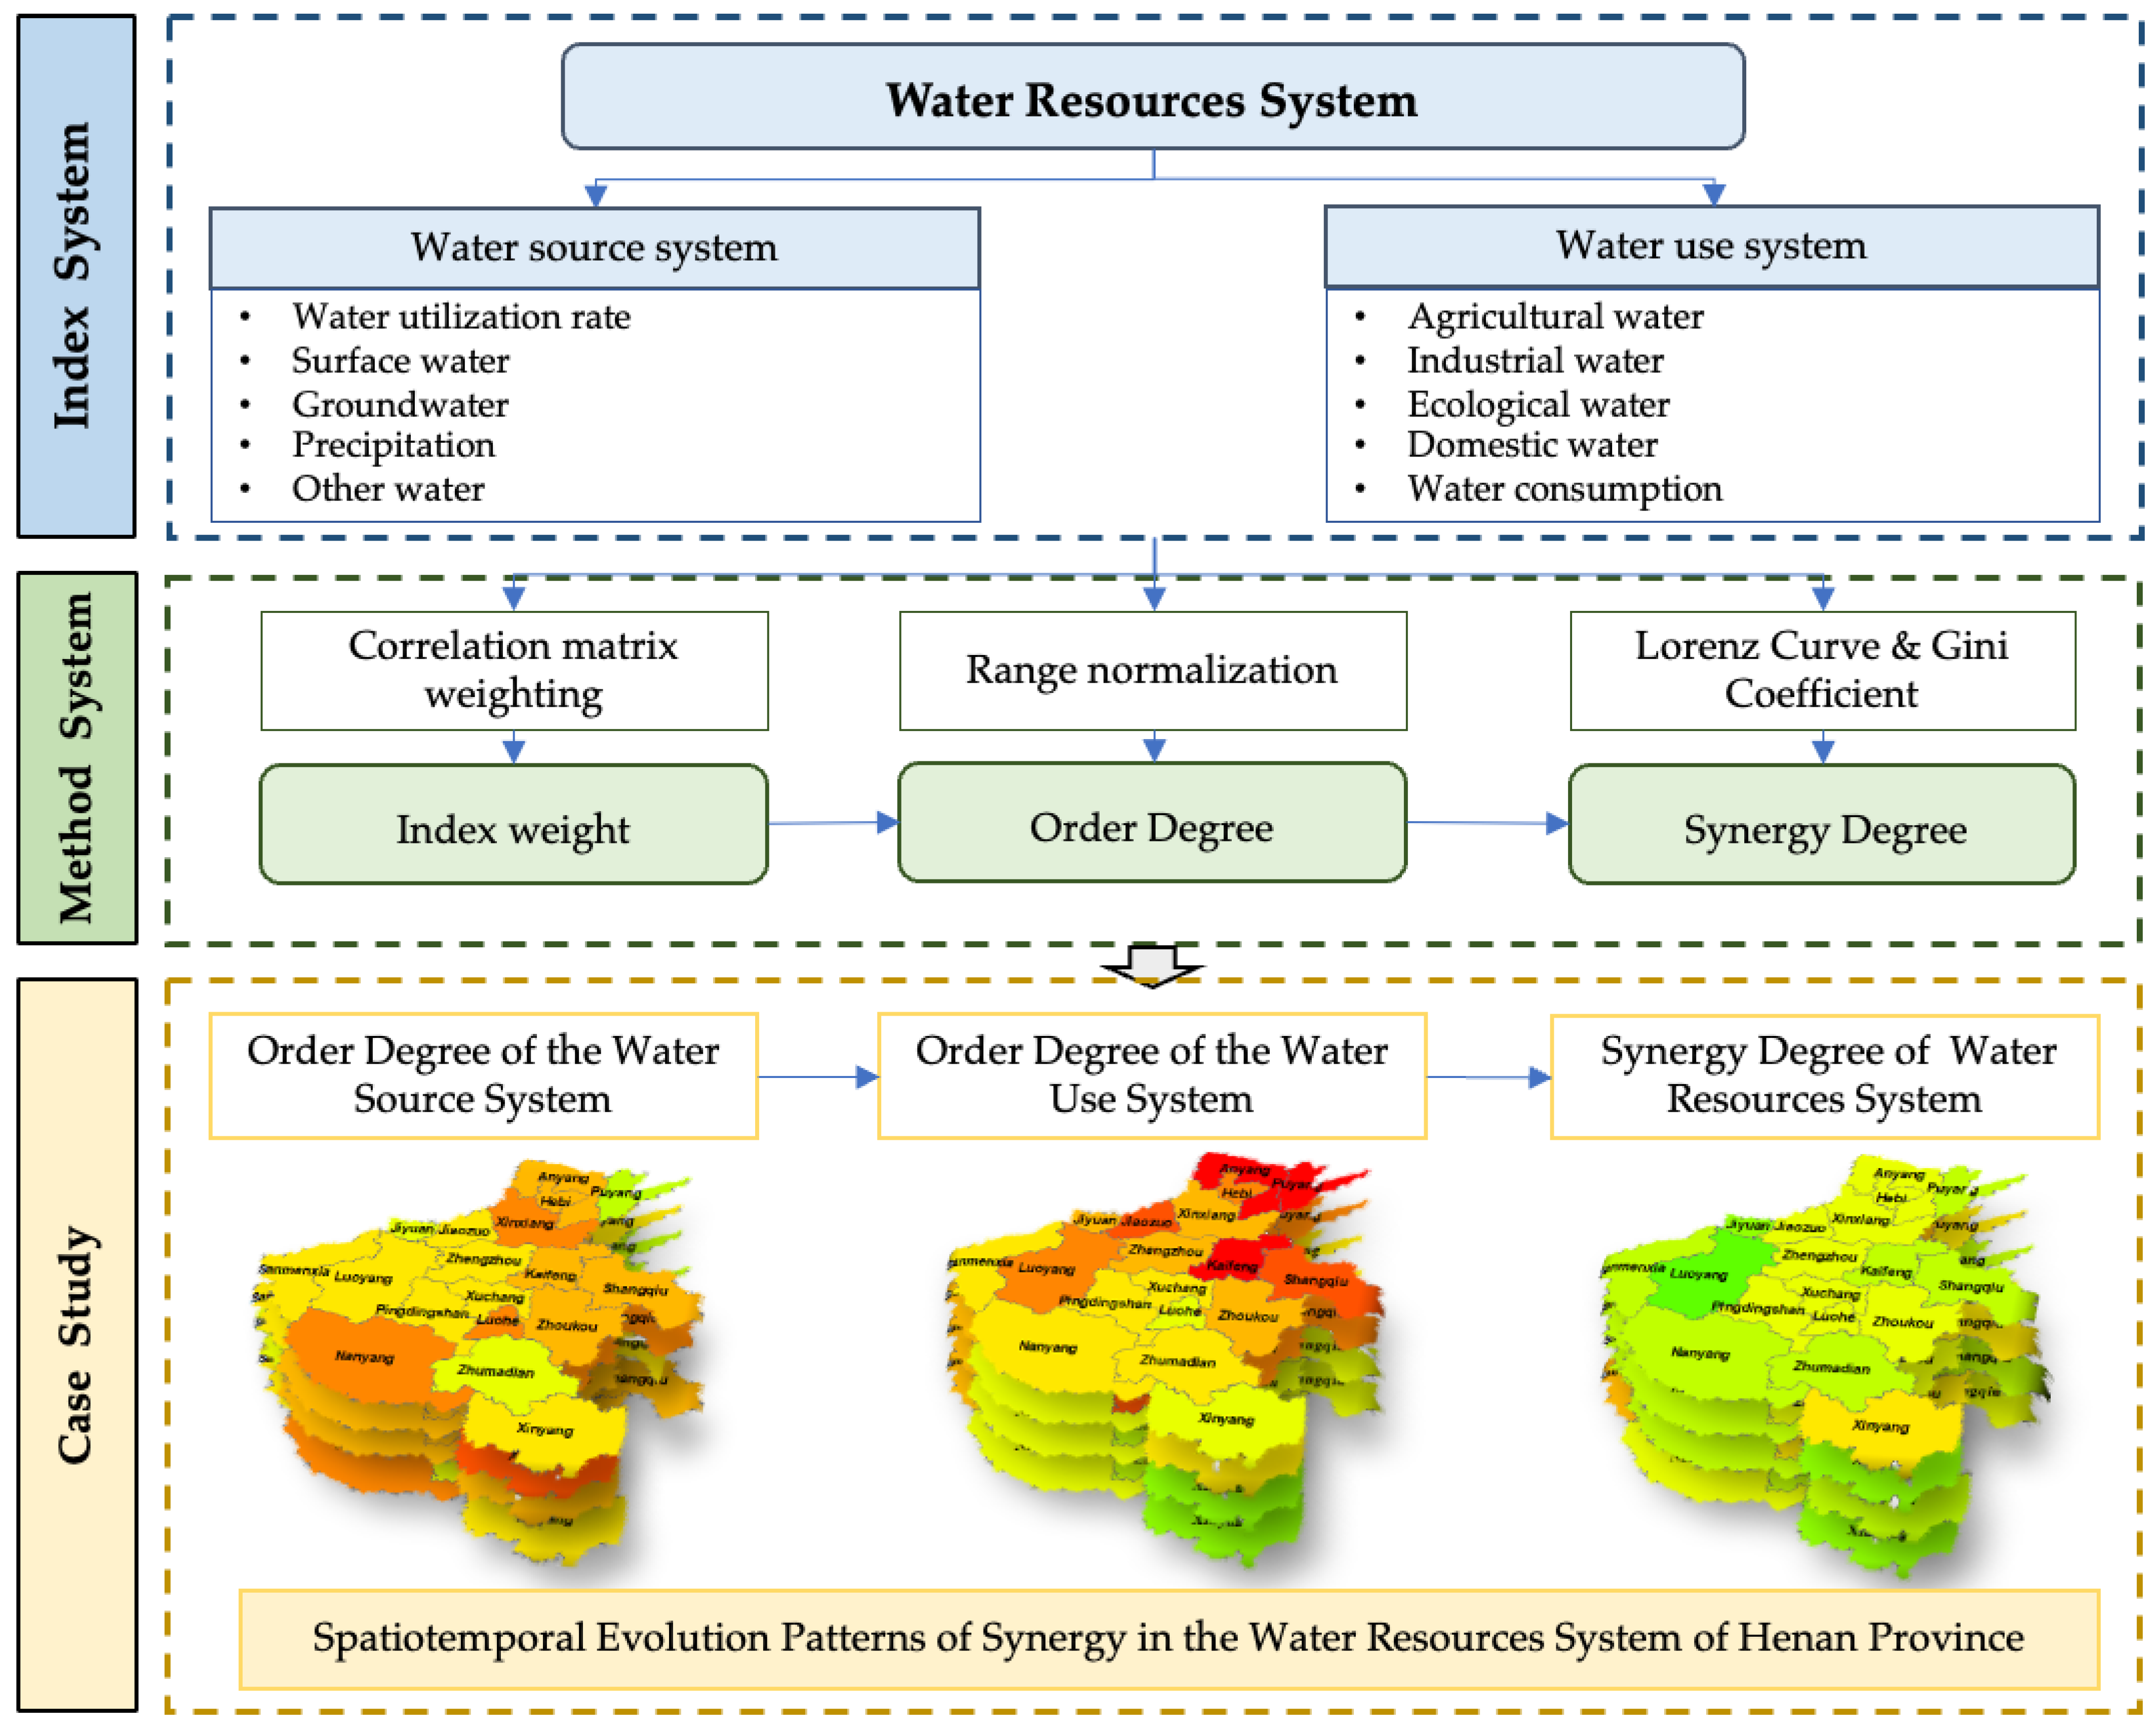
The Gini Coefficient method has become a key tool for quantitatively assessing equity in water resource system. Applied to synergy analysis, it evaluates disparities in subsystem orderliness by calculating Gini values for order parameters (e.g., water quantity, quality, efficiency). This approach provides critical technical support for quantifying water resource system synergies. The research framework and technical approach of this study are illustrated in Figure 2.

2.4. Index System

When constructing the evaluation method based on synergetics theory, it is necessary to first determine the order parameters of the water use system and water source system [25]. Order parameters are indicators that reflect the development status of the system. According to the principle of whether the order parameter can “influence the behavior of other parameters and control the delayed process”, combined with the characteristics of water supply and use structure in Henan Province and relevant research literature [26], appropriate order parameters are selected. As a major agricultural province, Henan’s agricultural water use accounts for a significant proportion in its water use structure. With the advancement of industrialization and urbanization in Henan Province, industrial water demand and urban domestic water demand have also increased [18]. Therefore, indicators such as industrial and agricultural water consumption, and ecological and domestic water consumption are selected. The water source system in Henan Province is characterized by uneven distribution of water resources, coexistence of surface water and groundwater supply, and significant seasonal differences in precipitation [27]. Based on these characteristics, indicators such as precipitation, water resources development and utilization efficiency, and water supply volume are selected. The constructed index system is shown in Table 1.
Assuming that the larger the value of a certain order parameter, the higher the degree of order in the system, and the smaller the value, the lower the degree of order. Such indicators are called benefit-type indicators, while the opposite are called cost-type indicators. On the water use side, the greater the industrial water consumption, the greater the water supply pressure on the water resources system, and conversely, the smaller the water supply pressure. This also implies that advanced production processes and technologies have improved water use efficiency and reduced industrial water consumption. Agricultural water demand is easily affected by precipitation and climate change; drought periods may lead to increased demand, while abundant rainfall periods may reduce water demand. Meanwhile, advanced irrigation and water-saving agricultural technologies can also reduce agricultural water consumption. Higher domestic water consumption indicates a higher quality of life for residents and also represents a higher local water endowment. The increase in ecological water consumption signifies an improvement in environmental sanitation, aligning with the construction concept of ecological civilization. Therefore, industrial and agricultural water consumption and water consumption volume are selected as cost-type indicators, while domestic and ecological water consumption are chosen as benefit-type indicators.
On the water supply side, according to the Henan Water Resources Bulletin, water resource quantity refers to the total storage of all water bodies in a specific region, including groundwater, rivers, lakes, wetlands, etc., reflecting the magnitude of the overall water resources available in a region [28]. Water supply volume refers to the amount of water extracted, treated, and supplied for human and ecosystem use, representing the actual volume of water utilized. Water utilization rate refers to the ratio of total water supply to total water resources, and therefore it was classified under the water source subsystem. Other water denotes rainfall harvesting and other non-conventional water sources, while precipitation represents the annual cumulative rainfall of the region. In our framework, all water source subsystem indicators are considered benefit-type indicators, meaning that larger values generally correspond to a higher order degree.

2.5. Evaluation of Water Resources Synergy Degree

2.5.1. Order Degree Evaluation Model for Subsystems

In synergetics, order degree is a crucial concept used to describe the degree of coordination and synchronization among subsystems within a system. It reflects the system’s trend of transitioning from disorder to order and provides a quantitative characterization of the system’s synergistic status [14,23].
Assume system Si (where i = 1,2; S1 represents the water use system, and S2 represents the water source system) has order parameters Xi = (xi1, xi2, …, xin), with n ≥ 1 and αijxijβij (where αij and βij are the lower and upper bounds, respectively, for the j-th indicator of system Si, j∈[1,n]). The order degree of the j-th order parameter component xij in system Si is defined as:
u i x i j = x i j α i j β i j α i j ,   when   x i j   is   a   benefit   type   indicator , j 1 , m β i j x i j β i j α i j ,   when   x i j   is   a   cost type   indicator , j m + 1 , n
Here, ui(xij)∈[0,1], and a higher value indicates a greater contribution of xij to the order degree of system Si. The order degree ui (Xi) of subsystem Si is calculated by weighted summation of the order degrees of individual order parameters:
u i X i = j = 1 n ω j u i x i j
where ωj is the weight of the j-th indicator. This study adopts the correlation matrix weighting method to calculate the weights of order parameters. The core idea of this method is that correlation coefficients reflect the degree of mutual influence among indicators: a higher absolute value of the correlation coefficient indicates a stronger mutual influence [29]. Specifically, the absolute value of the correlation coefficient |rij| is used to quantify the conflict or information overlap between indicators i and j. A higher |rij| indicates greater similarity in the information conveyed by the two indicators. If an indicator has a high total correlation with all other indicators, it exerts a greater influence on others and should be assigned a larger weight; conversely, it receives a smaller weight. This aligns with the synergetic principle that order parameters influence the behavior of other parameters and control the delayed process. The calculation steps for the correlation matrix weighting method are as follows:
For n indicators, let the correlation matrix be R = (rij), where rij is the correlation coefficient between the i-th and j-th indicators (i = 1,2,…,n; j = 1,2,…,n; note rii = 1). Define R i = j = 1 n r i j 1 , representing the total influence of the i-th indicator on the remaining n−1 indicators. A larger Ri indicates a greater influence of the i-th indicator, warranting a larger weight, and vice versa. Thus, normalizing Ri yields the weight of the corresponding indicator:
ω i = R i j = 1 n R i

2.5.2. Evaluation of Water Resources System Synergy Degree

The synergy degree refers to the state and extent of coordination and synchronization among multiple subsystems during their development process. Based on the calculated order degrees of order parameters in water resources subsystems, combining the Gini coefficient to measure the disparities in order degrees among order parameters can quantitatively evaluate the synergy degree of regional water resources systems, thereby constructing the water resources system synergy index FE. The water resources system synergy degree FE constructed in this study refers to the state and extent of coordination and synchronization between the two subsystems (water source system and water use system) within the water resources system. A larger FE indicates better ordered collaboration between the water source system and the water use system, enabling regulation of water supply and demand and alleviation of water supply–demand conflicts. Conversely, a smaller FE suggests a mutually inhibitory state between the water use system and the water source system, which may trigger a vicious cycle within the water resources system and exacerbate water resources issues [27,30,31].
The calculation method is as follows:
FE =1 − G
where G is the Gini coefficient of order parameters within the water resources system.
First, rearrange ui(xij) for each prefecture-level city in ascending order to generate a new sequence ui′(xij), then calculate the cumulative frequency pm:
p m = i = 1 m u i X i i = 1 K u i X i
where 1 ≤ mK; let p0 = 0.
The Gini coefficient G is calculated as:
G = 1 1 K i = 1 K p m 1 + p m = 1 1 K 2 i = 1 K 1 p m + 1
A lower G indicates stronger synergy and balanced development, while a higher G reflects significant order differences and weaker coordination [32]. Notably, the Gini coefficient measures the relative balance in the distribution of order degrees between subsystems, but does not reflect their absolute levels. A system with low but balanced order parameters for both subsystems would yield the same high FE as a system with high and balanced order parameters. Therefore, the synergy degree FE must be interpreted in conjunction with the absolute values of the subsystem order degrees to comprehensively assess the system’s health status.

3. Results

3.1. Order Degree of Water Source-Use Subsystem

3.1.1. Indicator Weight Calculation

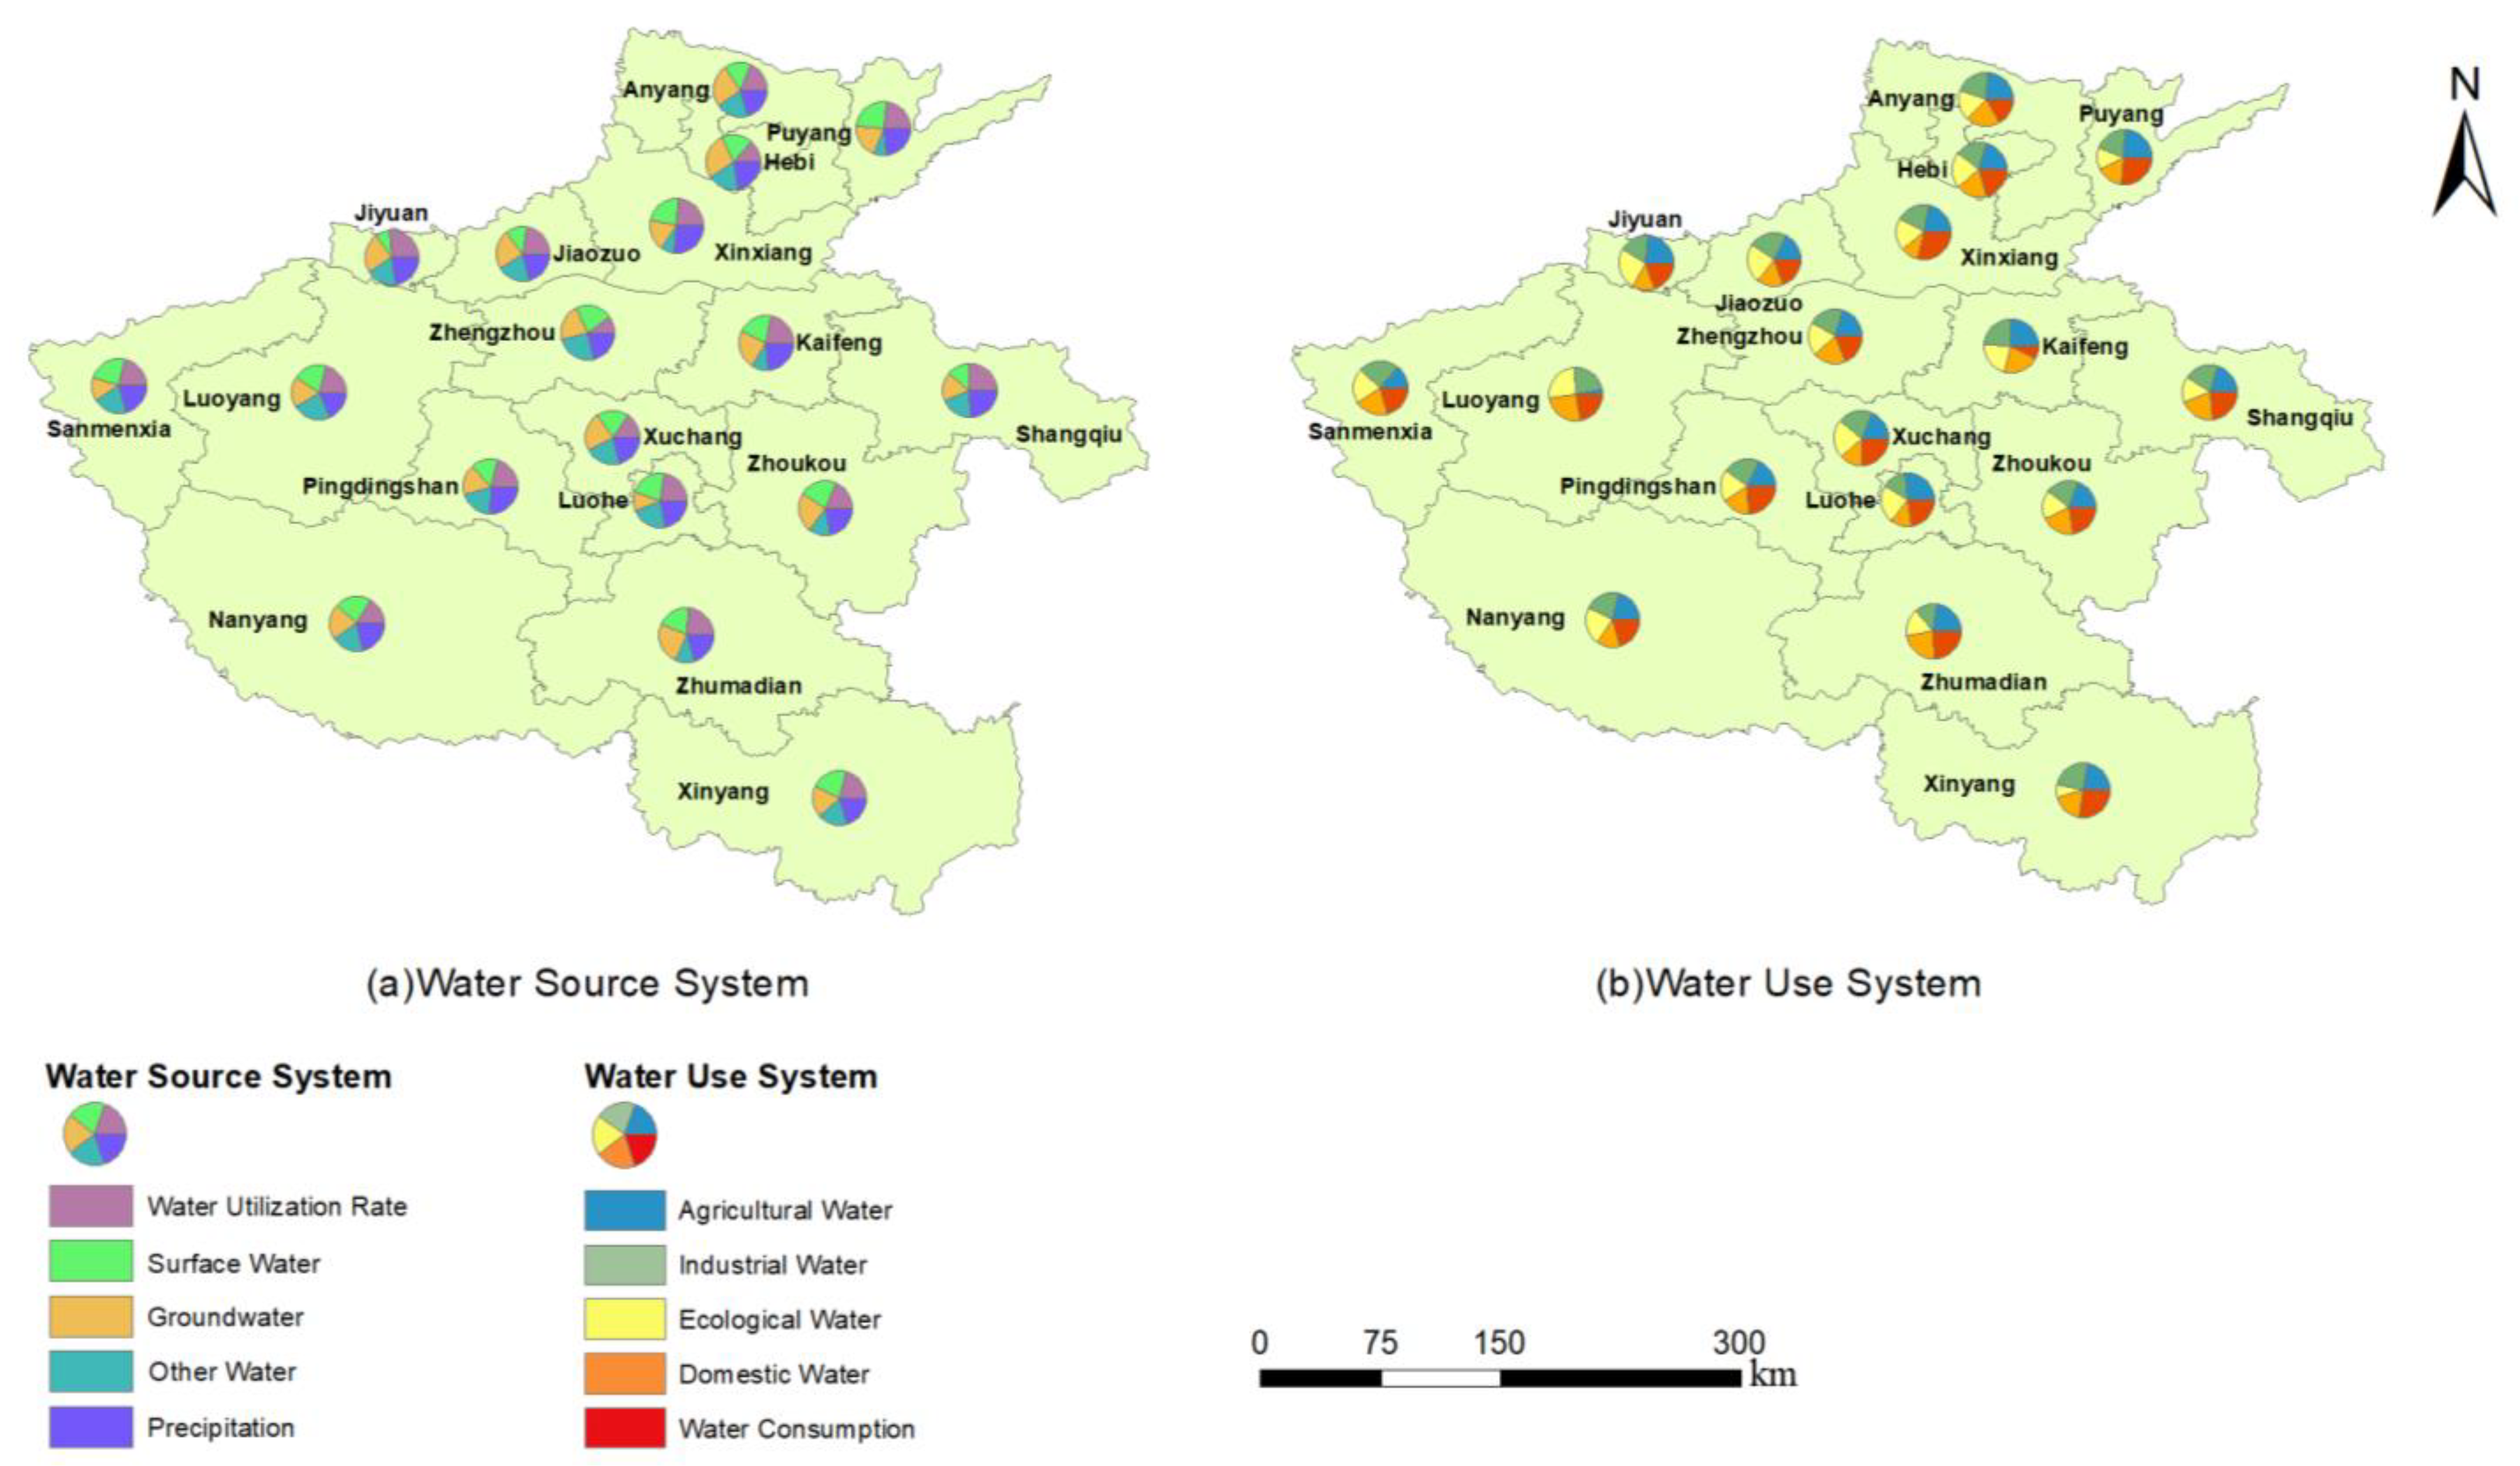
Based on the correlation matrix weighting method, the order parameter weights for each city were calculated and presented in Figure 3 and Tables S1 and S2. The weights of order parameters for both water source and water use systems across cities are approximately 0.2. Due to variations in water resource conditions, industrial structures, living standards, and economic development, significant differences exist in water supply-use structures among prefecture-level cities.
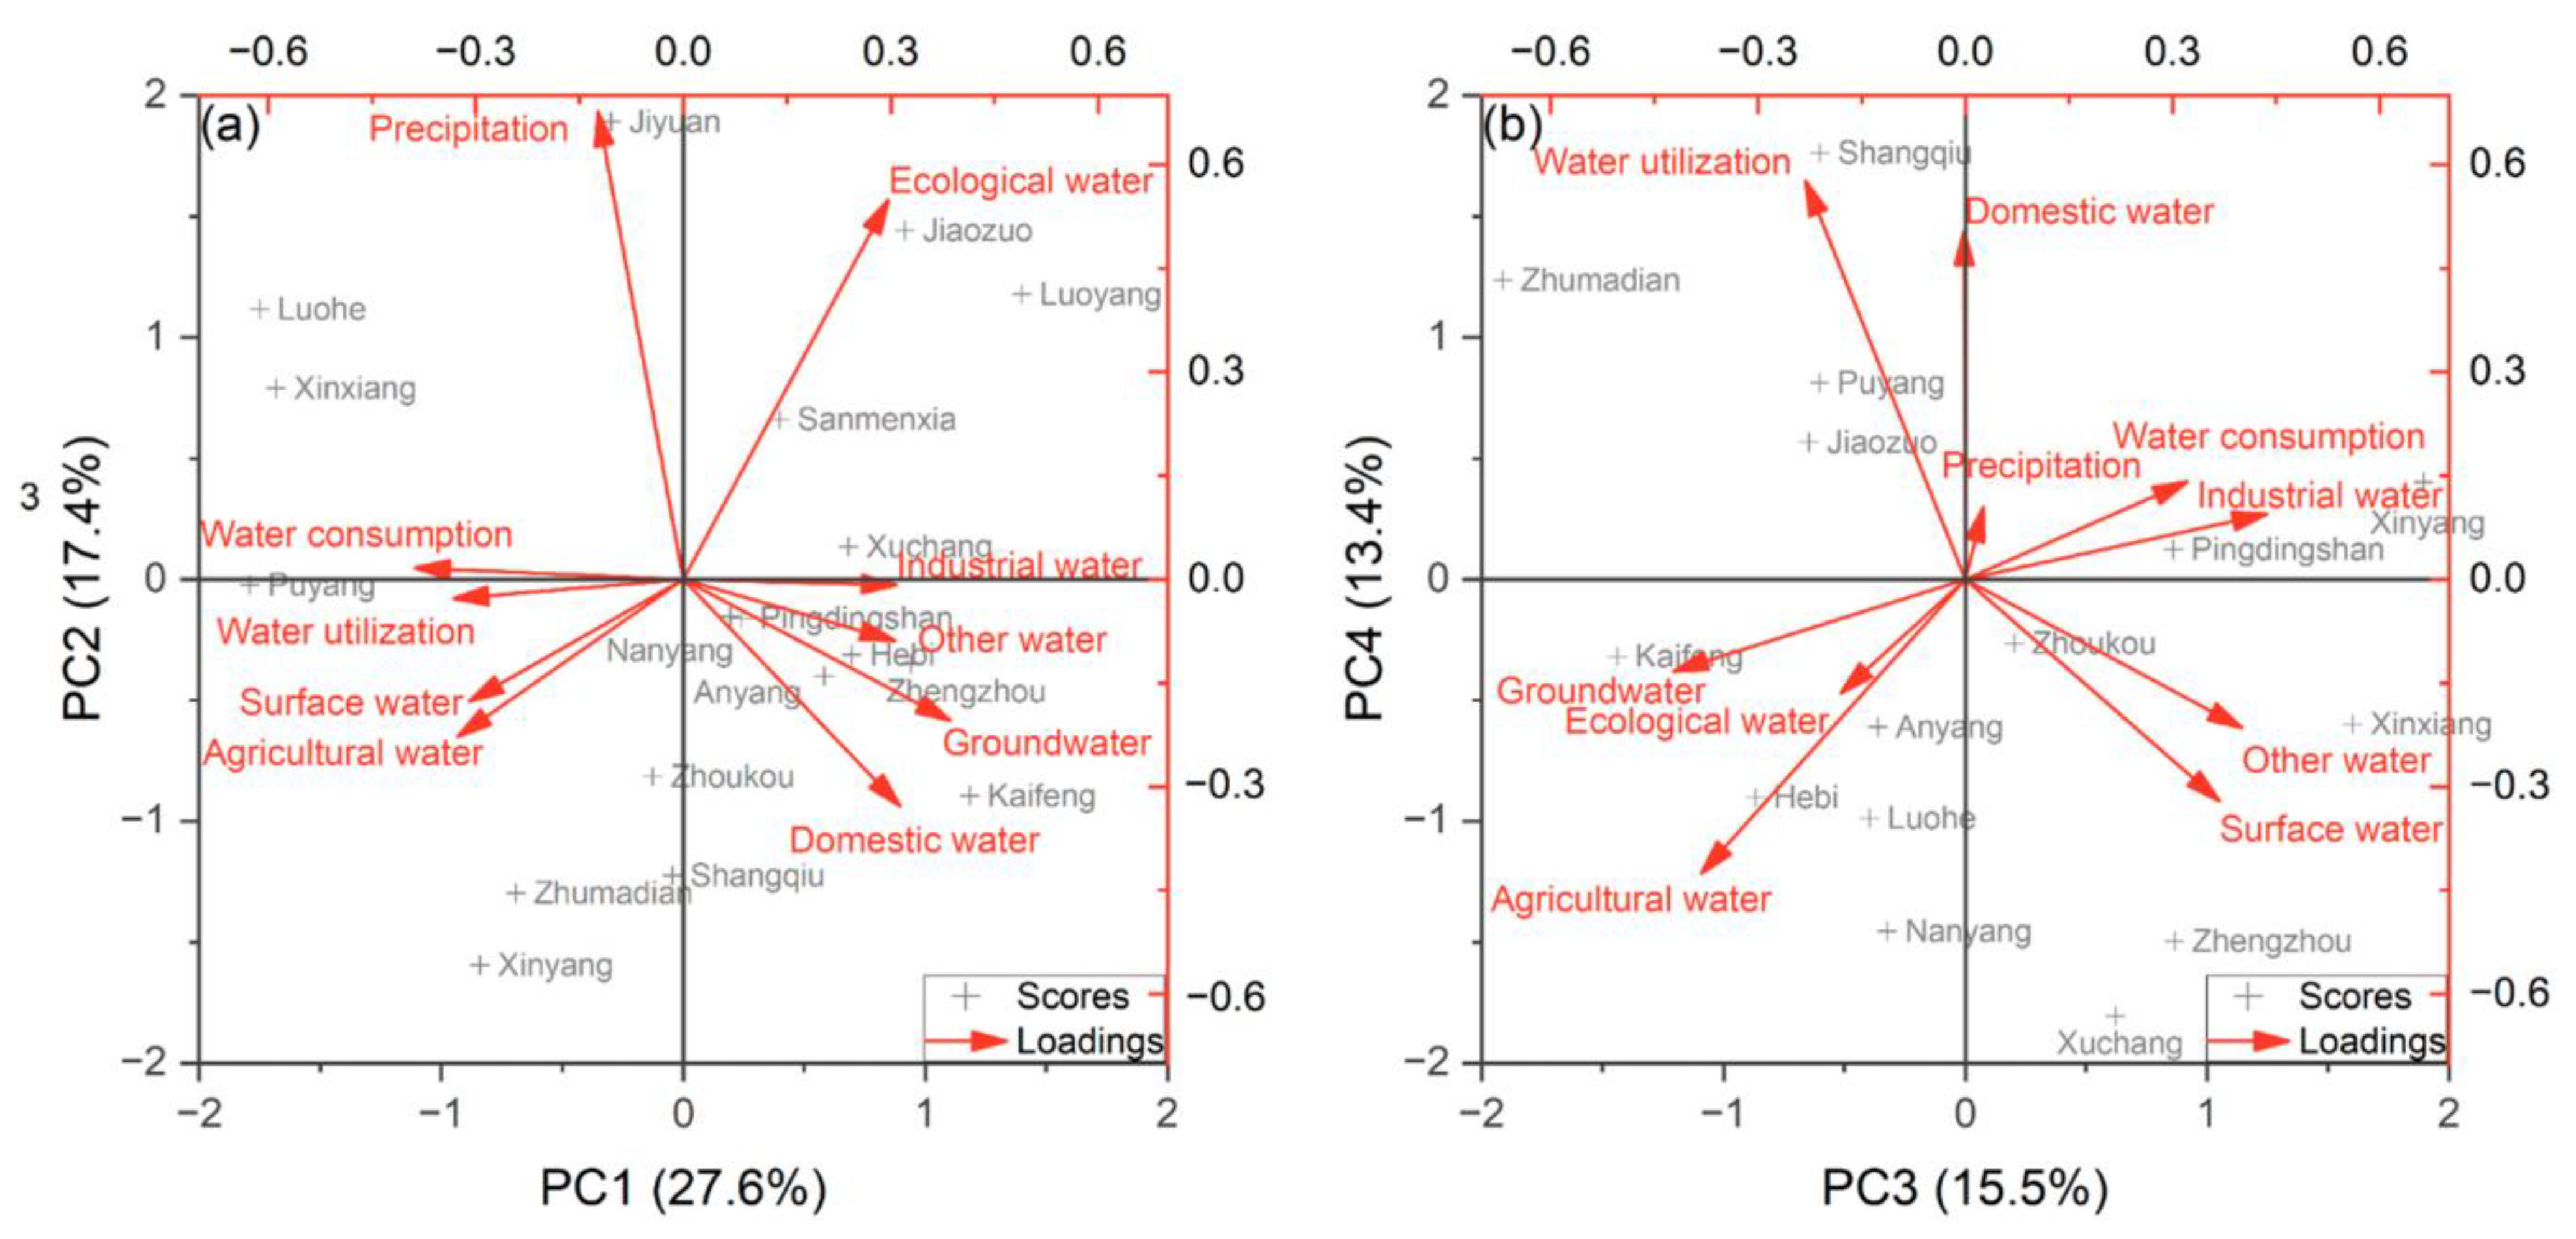
Principal component analysis (PCA) results (Figure 4) indicate that the first four principal components explain 74% of the total variance. The first principal component (PC1) reflects the overall characteristics of the water resources system, clearly distinguishing between the water source system (left) and the water use system (right), with a notable trade-off relationship. Specifically, Luohe, Xinxiang, and Puyang are primarily dominated by the water source system (PC1 < −1), while other cities exhibit tight coupling between water source and water use systems (−1 ≤ PC1 ≤ 1). The second principal component (PC2) mainly reflects water resource endowment conditions, with lower scores in southern regions and higher scores in northern regions. The third principal component (PC3) focuses on the structure of the water use system, and the fourth principal component (PC4) emphasizes characteristics of the water source system. These findings confirm that the assigned indicator weights are reasonable and reliable, effectively capturing the key features of the water resource system.

3.1.2. Order Degree of the Water Source System

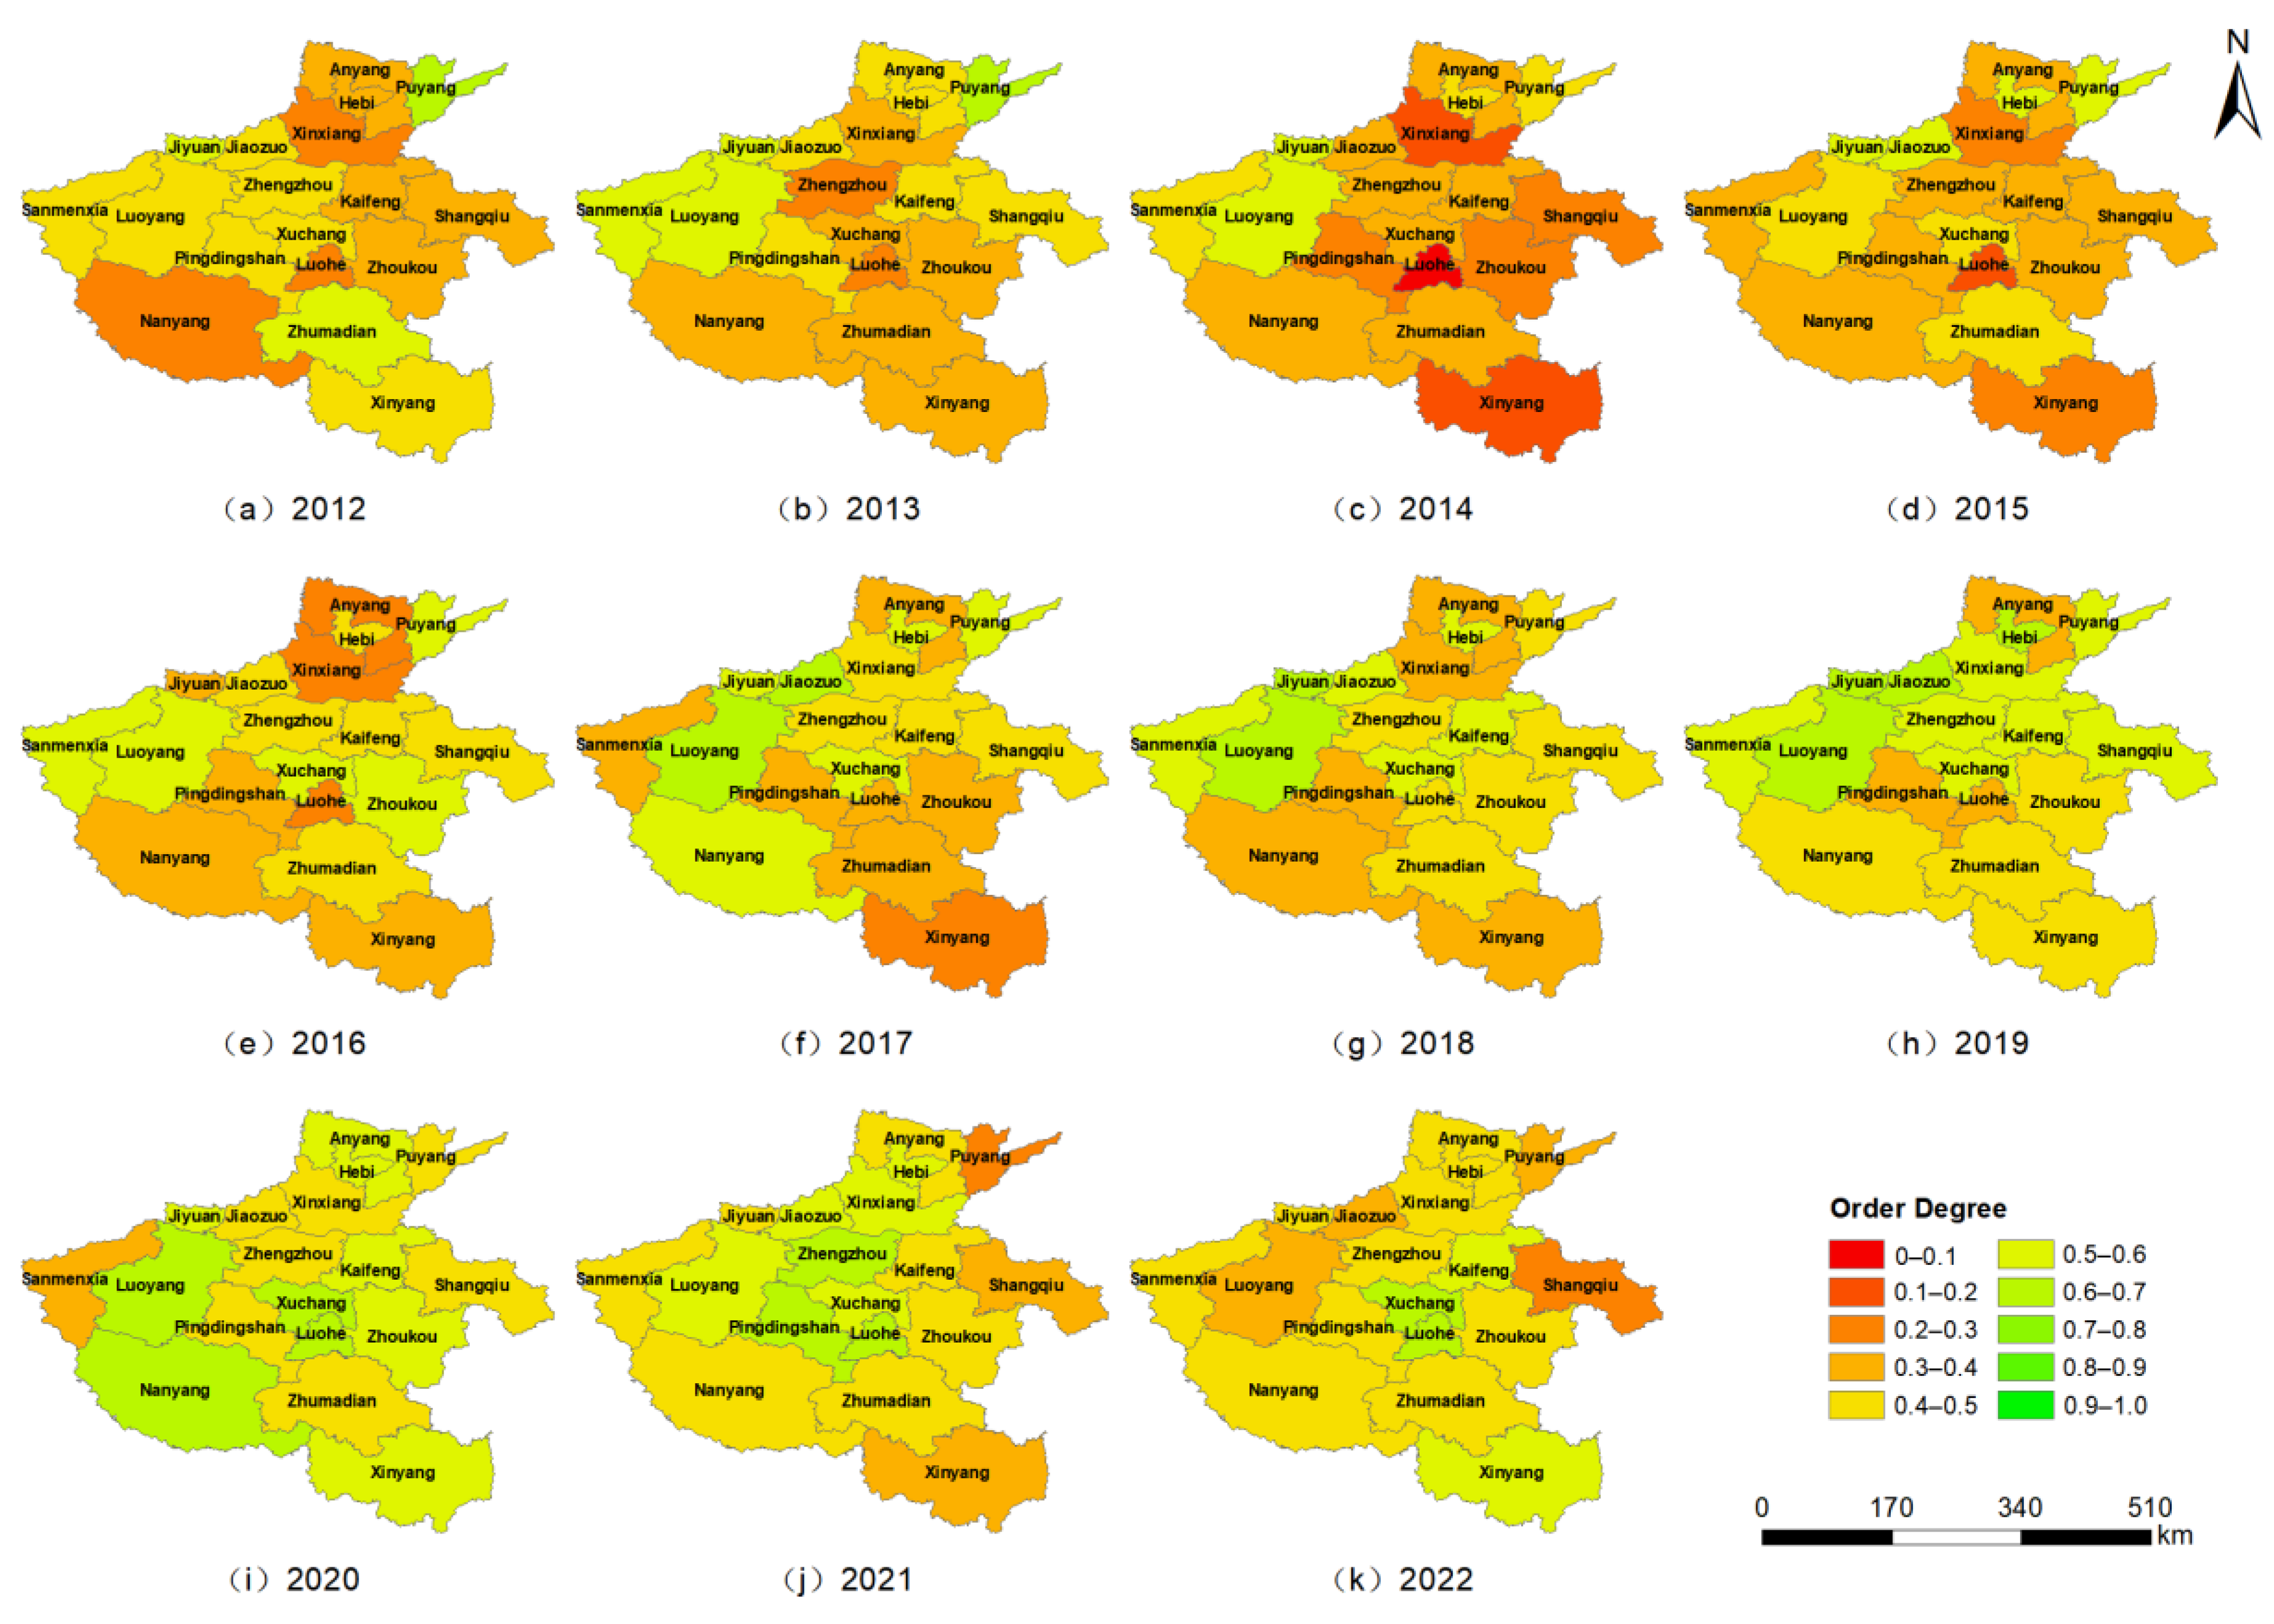
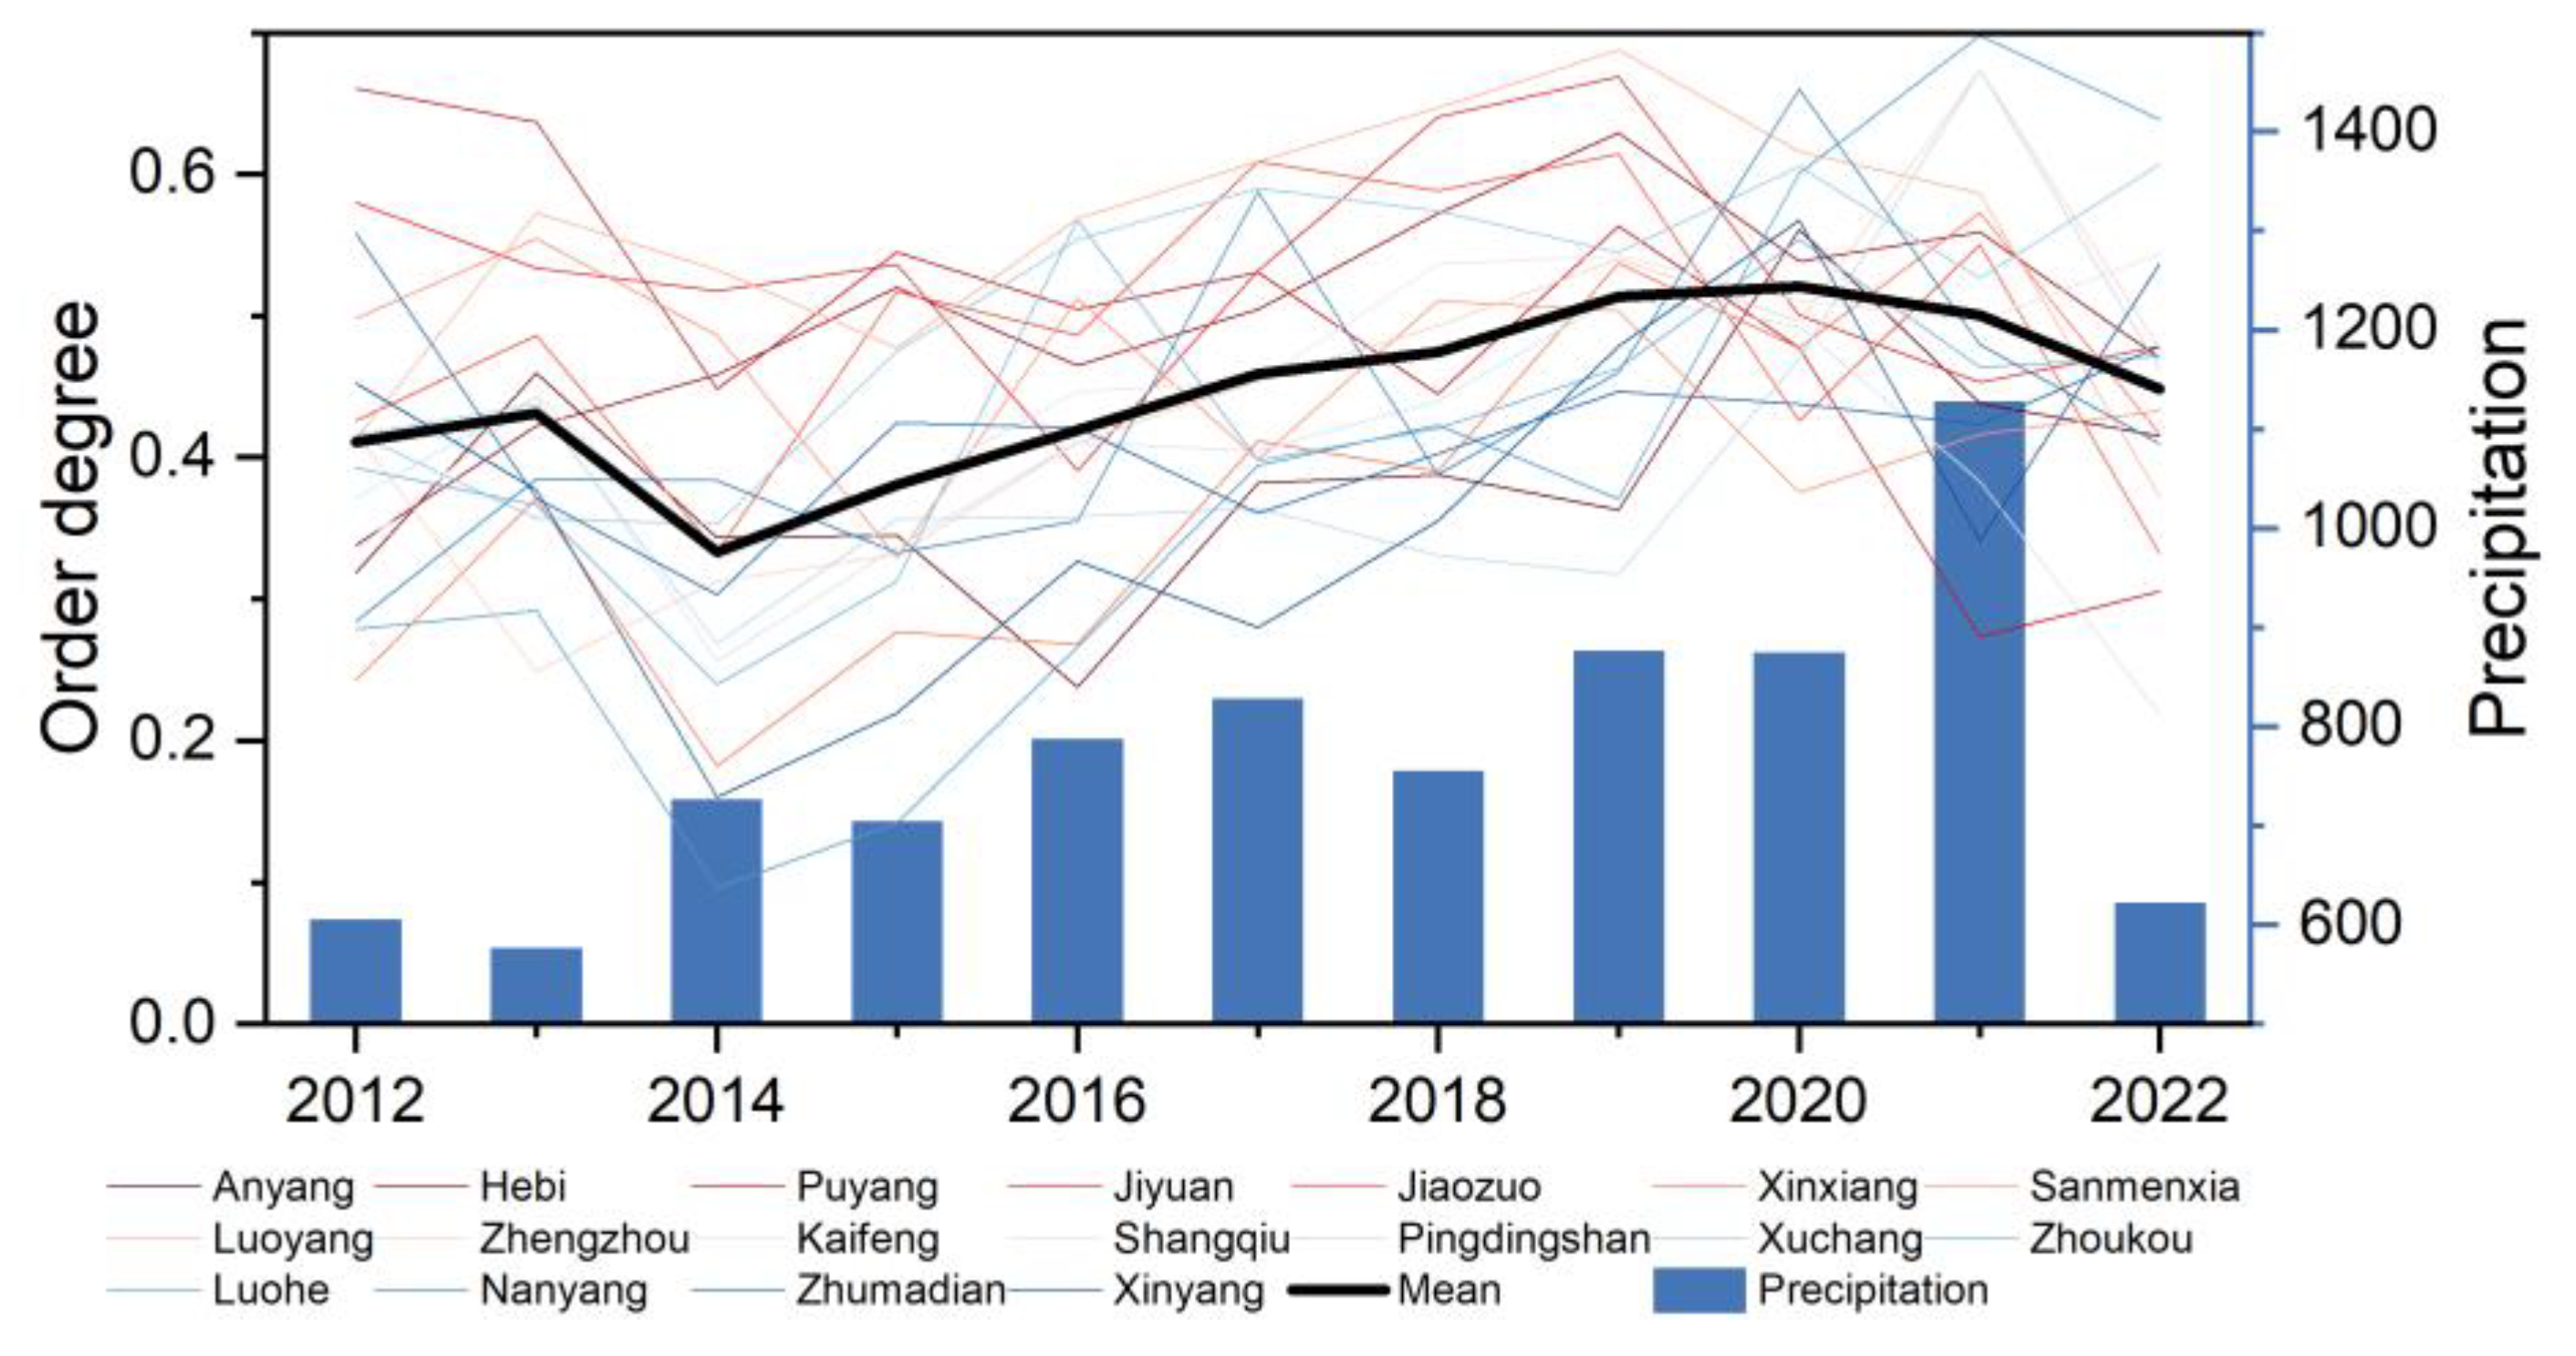
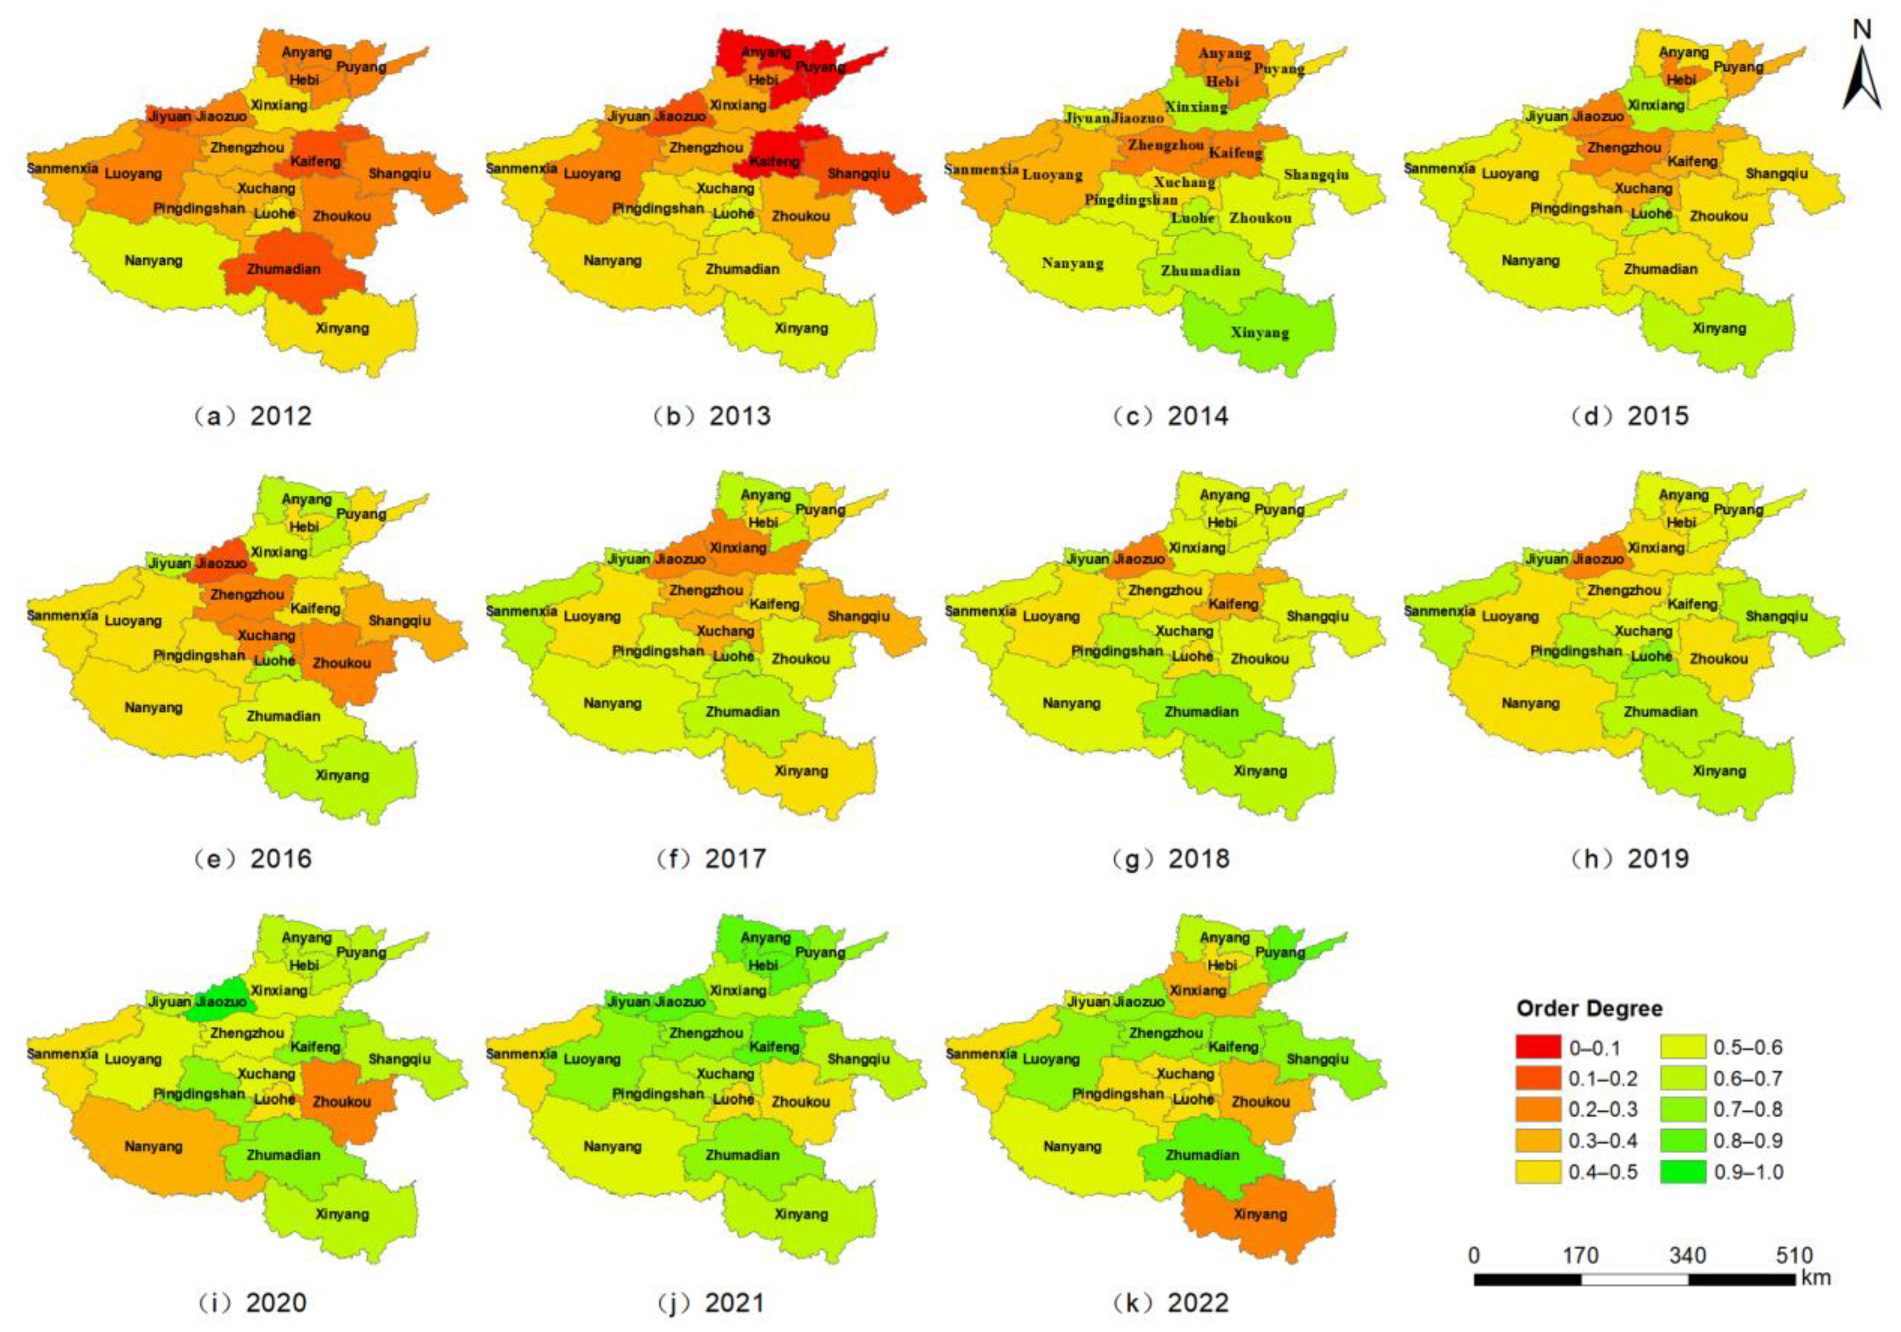
Using the method for the order degree of the water source system, the order degrees of water source systems in 18 prefecture-level cities of Henan Province from 2012 to 2022 were computed, as shown in Figure 5 and Figure 6 and Table S3.
Figure 5 reveals significant spatiotemporal differentiation characteristics in the order degree of water source systems across Henan’s cities. Spatially, cities in the northwest exhibit relatively high order degrees, while southern cities generally show lower levels, with Luoyang standing out prominently and Xinyang performing poorly. Temporally, the provincial average order degree of water source systems increased significantly from 2012 to 2022 (annual growth rate of 0.01, p < 0.05) (Figure 6). However, inter-city differences were substantial: approximately 60% of cities showed no significant change, and a few even experienced declines. Notably, after 2014, most cities began to exhibit rising order degrees, a turning point closely aligned with the operational timeline of the middle route of the South-to-North Water Diversion Project (officially commissioned in 2014).
Although precipitation is the core factor influencing total water resources, the correlation between water source system order degree and precipitation is not significant (Figure 6). From 2012 to 2021, total precipitation in Henan Province increased significantly (p < 0.05), but the interannual dynamics of water source system order degree did not align with precipitation trends. For example, during the low-precipitation period of 2012–2013, some cities had relatively high order degrees; when precipitation increased notably in 2014–2015, multiple cities saw order degrees decline; and in 2021, despite above-average precipitation, most cities still experienced reduced order degrees. This non-synchronicity may stem from three factors: first, the order degree of the water source system fundamentally reflects the rationality and coordination of water resource allocation, rather than being solely determined by water volume; second, while total water resources are dominated by natural meteorological conditions, the order degree of the water source system is more influenced by human factors such as engineering regulation and management measures, exhibiting a lag effect; third, abnormal fluctuations in water conditions (e.g., extreme wet or dry years) can disrupt system balance, leading to periodic reductions in order degree.

3.1.3. Order Degree of the Water Use System

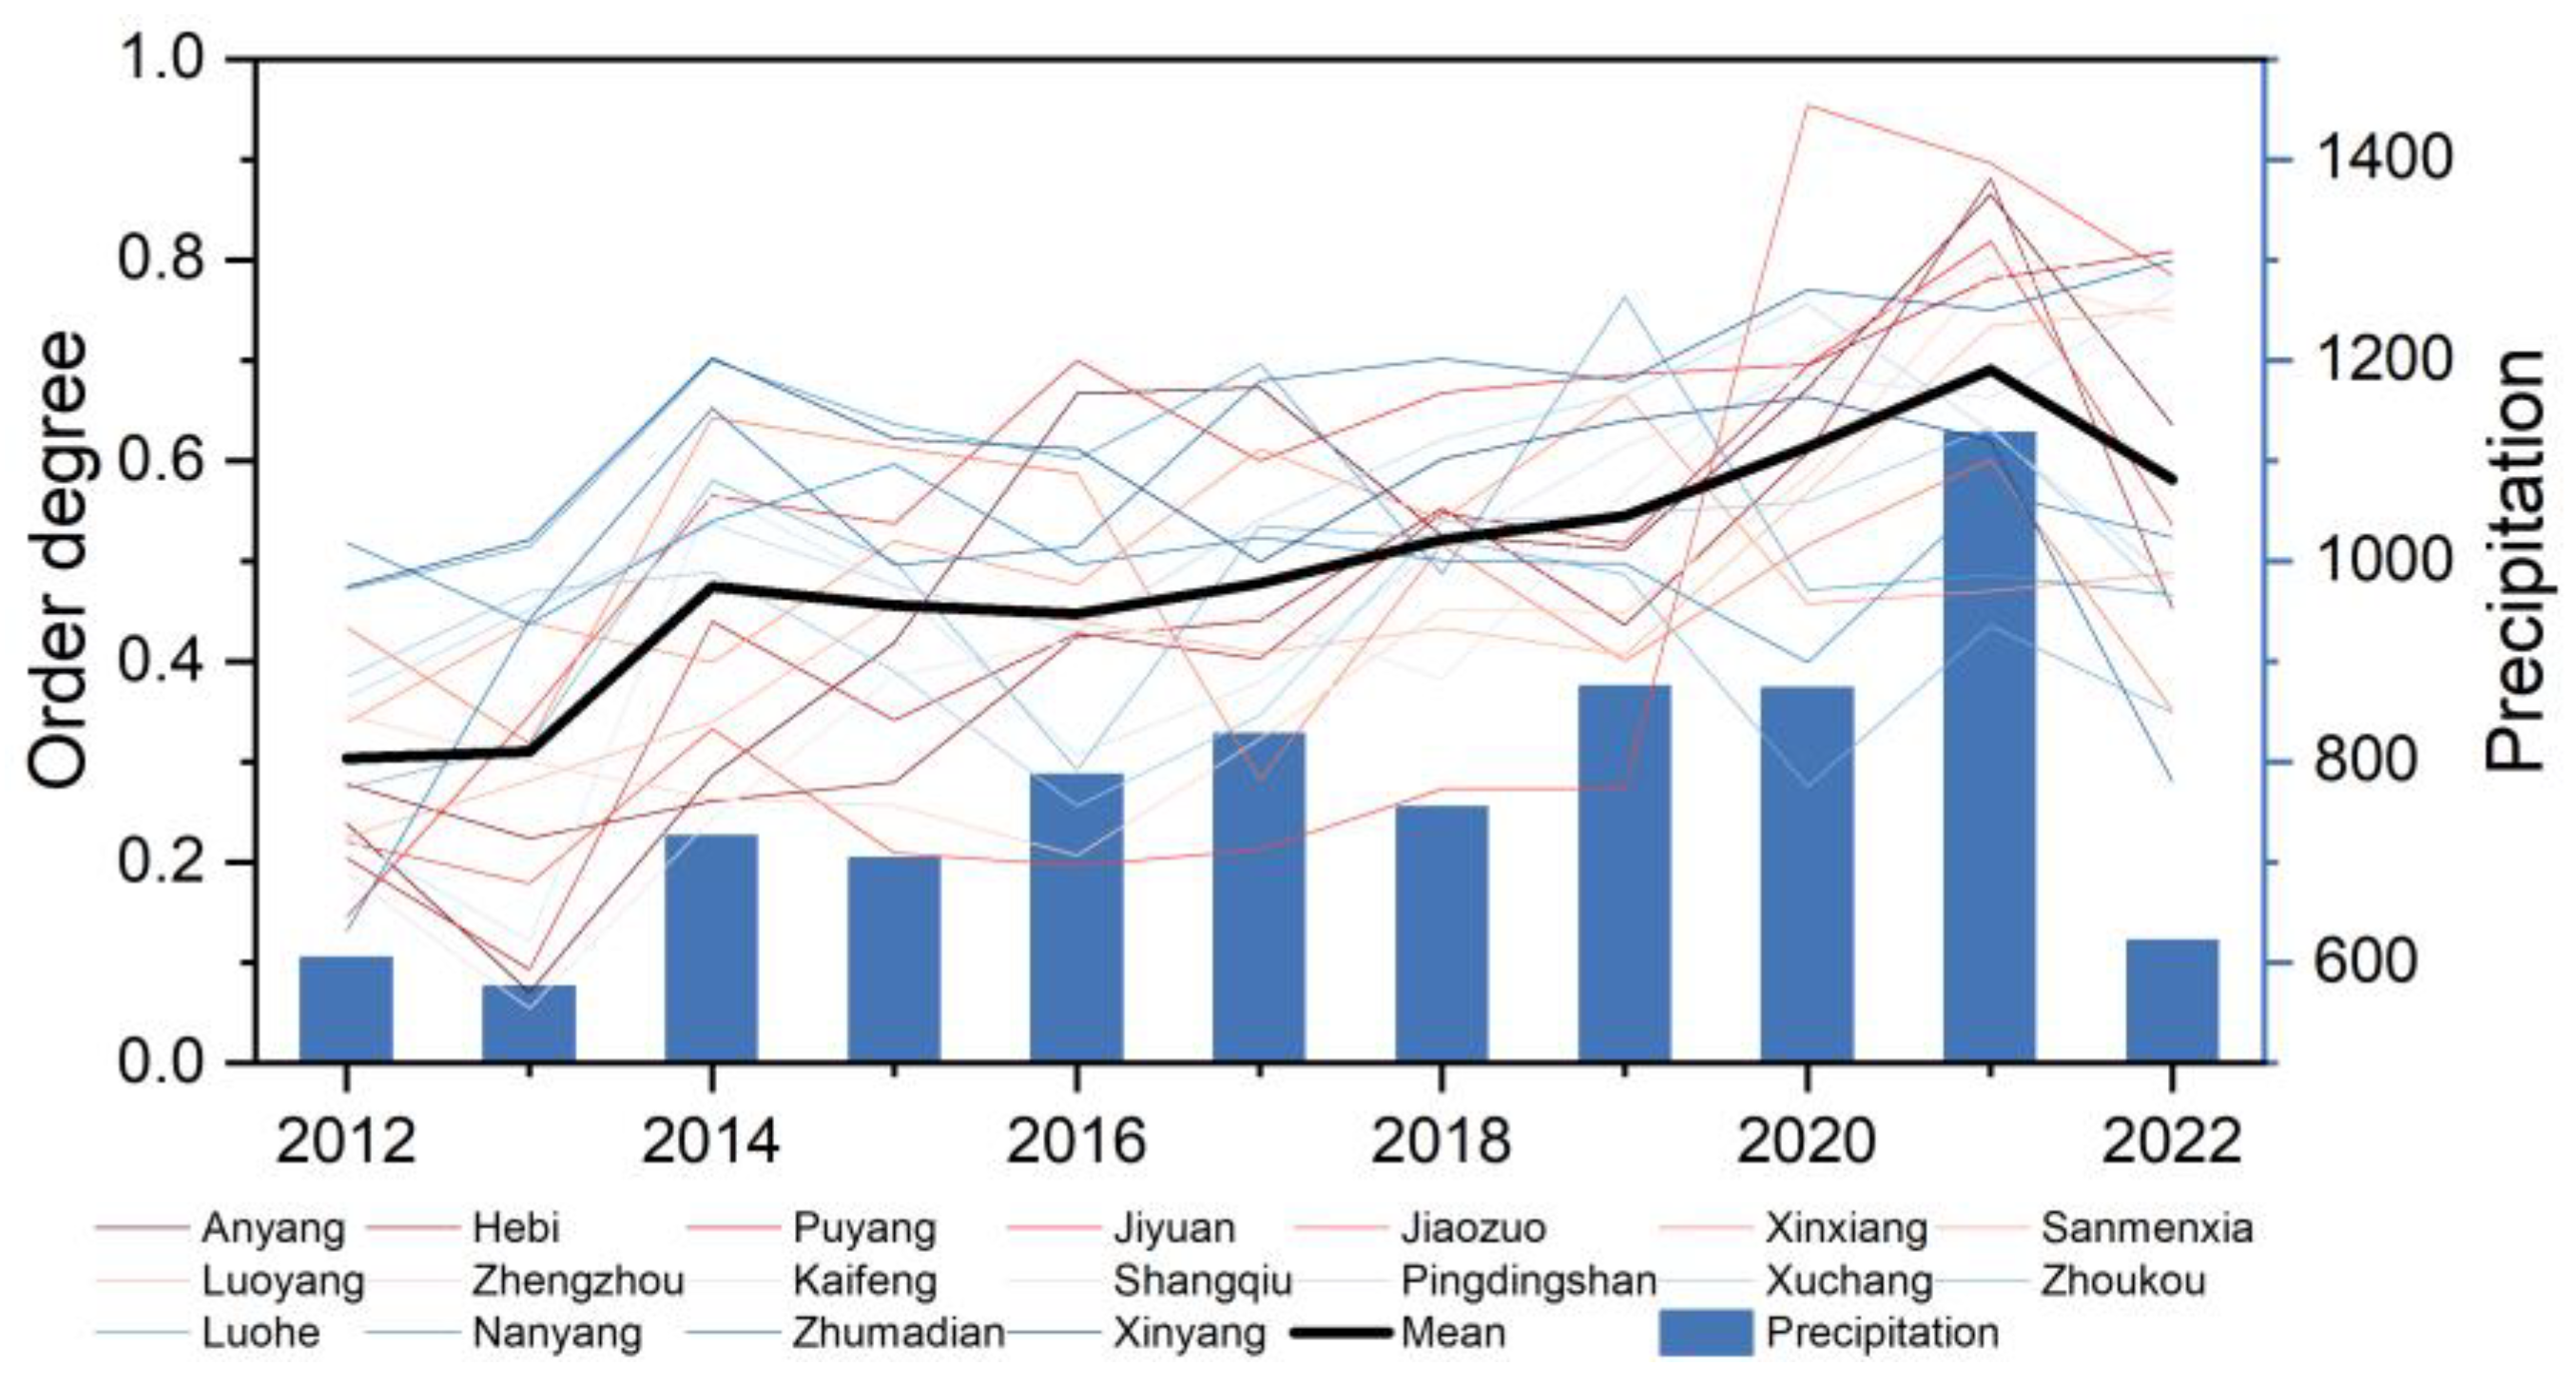
The order degrees of water source systems in 18 prefecture-level cities of Henan Province from 2012 to 2022 were computed, as shown in Figure 7 and Figure 8 and Table S4.
As shown in Figure 7, the order degree of the water use system in Henan Province’s prefecture-level cities from 2012 to 2022 exhibits significant spatiotemporal differentiation. Spatially, the overall pattern shows a “north-low, south-high” distribution: prior to 2018, northern cities generally had order degree values below 0.5, but by 2018, the pattern evolved into a relatively balanced north–south distribution. Temporally, the provincial average order degree increased significantly (annual growth rate of 0.033, p < 0.01) (Figure 8), rising from low order (order degree < 0.3) in 2012 to moderate-high order (order degree > 0.5) after 2018, reaching a historical peak of 0.69 in 2021. Spatial equilibrium also improved markedly—only Luohe, Zhoukou, and Sanmenxia had order degree slightly below 0.5, while all other cities entered an ordered state. Notably, northern regions exhibited higher annual growth rates and significance levels in order degree compared to southern regions.
Unlike the water source system order degree, the water use system order degree shows a significant positive correlation with precipitation (r = 0.78, p < 0.01) (Figure 8). This correlation indicates that precipitation changes directly influence socioeconomic water availability, thereby driving dynamic adjustments in the water use system’s order degree. Specifically, years with abundant precipitation provide foundational conditions for optimizing water use structure and allocating water resources, while drought years may constrain improvements in water use system order degree by limiting water availability.

3.2. Synergy Degree Results Analysis

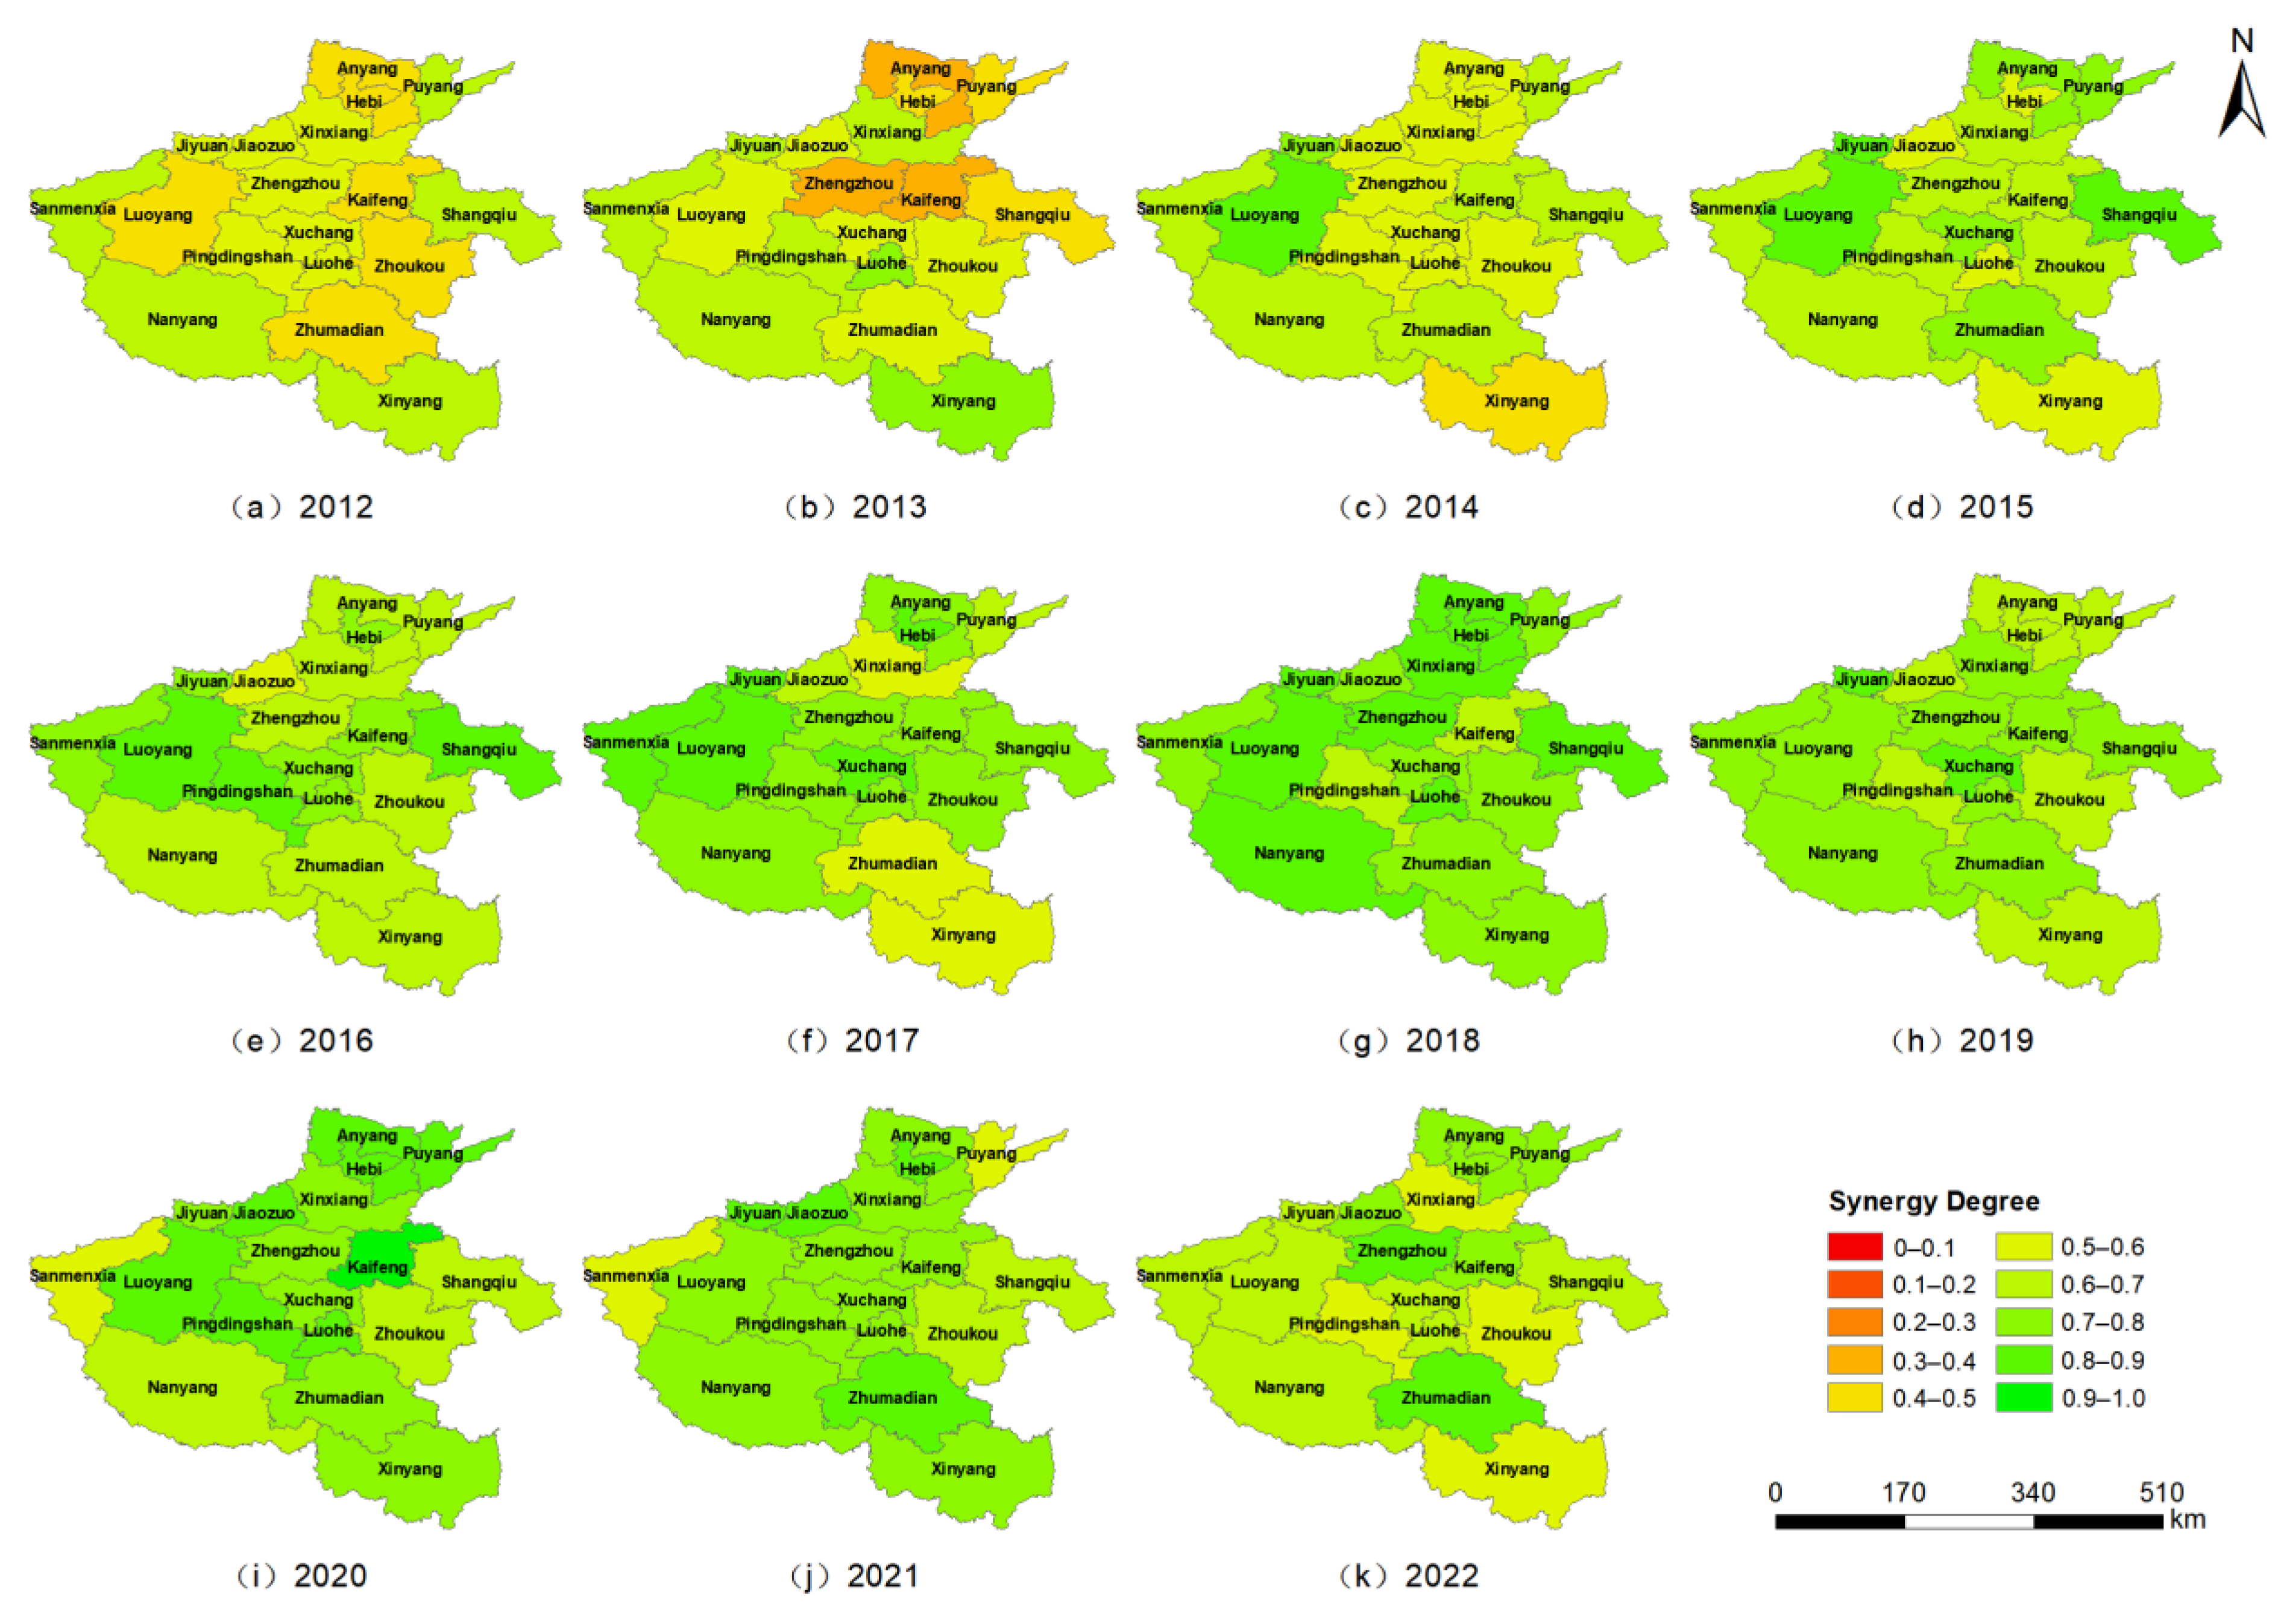
From 2012 to 2022, the synergy degree of Henan’s water resources system is shown in Figure 9 and Table S5. The spatial distribution of water resources system synergy degree in Henan Province exhibits a “low in the north, high in the south” pattern. During the period 2012–2022 (Figure 10), the provincial average synergy degree showed a significant overall upward trend (0.02 per year, p < 0.01), but declined after 2018. The synergy degree of the water resources system is the result of the coupling between the water source subsystem and the water use subsystem, following the “barrel effect” principle—that is, the overall system synergy level is primarily determined by the subsystem with lower order degree.
Based on the dynamic interaction between synergy degree and subsystem order degrees (Figure 10), the development process can be divided into three phases: Phase 1 (before 2015): The order degree of the water use subsystem remained low but showed an upward trend, driving a simultaneous increase in system synergy degree. Phase 2 (2015–2018): Both the water source and water use subsystems maintained growing order degrees, leading to a sustained improvement in system synergy degree. Phase 3 (after 2018): Despite continued increases in the water use subsystem’s order degree, the overall system synergy degree declined due to the decreasing order degree of the water source subsystem.
Notably, the turning point in 2018 aligns with the operational stabilization of the South-to-North Water Diversion Project, suggesting that while engineering measures enhance water supply capacity, their long-term effectiveness in improving system coordination requires simultaneous optimization of water use efficiency. This dynamic reflects the complex interplay between natural water resource conditions and human regulatory interventions in shaping regional water resources system synergy.

4. Discussion

4.1. Evolution of the Water Resources System Under the Interaction Between Water Source and Water Use

The water resources system can be divided into two subsystems, water source and water use, based on supply and demand, with complex interdependent relationships [17]. The water source system both supports and constrains the development of the water use system; conversely, changes in water use structure and scale drive adjustments in water source allocation and even incentivize the exploration and development of new water sources. A synergistic and orderly relationship between water source and water use systems is essential for the sound operation of the water resources system and high-quality socioeconomic development [33]. Conversely, vicious competition and mutual inhibition between subsystems can lead to a vicious cycle within the water resources system, exacerbating water-related issues [34].
Although Henan’s natural water resource endowment follows a “south-abundant, north-scarce” pattern, the order degree of the water supply system exhibits an inverse “north-high, south-low” distribution. This paradox can be explained by the synergetic slaving principle: in the water-scarce northern Henan region, competitive demands from the water use system (e.g., conflicts between agricultural irrigation and industrial water use) drive the engineering regulation capacity of the water source system to strengthen continuously through interventions such as inter-basin water transfer and groundwater recharge [35], forming a positive feedback loop of “demand coercion-supply optimization” [36]. In contrast, the relatively abundant water resources in southern Henan have led to a negative synergy between the inefficiency of the water use system and the developmental inertia of the water source system, resulting in low overall system order degree. This validates the optimizing role of synergistic mechanisms in spatial equilibrium.
From 2012 to 2022, the synergy degree of Henan’s water resources system increased by nearly 40%, with its leapfrog growth closely coupled with key events such as the commissioning of the middle route of the South-to-North Water Diversion Project (2014). From a synergetic perspective, inter-basin water transfer projects essentially introduce external control parameters (e.g., annual water supply of 2.97 billion m3) to disrupt the system’s original inefficient equilibrium: on one hand, transferred water compensates for the carrying capacity threshold of local water source systems, alleviating competitive pressure in the water use system; on the other hand, diversified water sources compel the water use system to implement adaptive adjustments such as tiered water pricing and industrial water-saving transformations, triggering self-organized optimization of “supply–demand bidirectional adaptation” [17]. This aligns with the theoretical expectation in Haken’s model that control parameters trigger the reorganization of order parameters [22].
Water resource systems exhibit typical characteristics of complex systems. Traditional studies on the evolution and management of water resource systems, which are mostly grounded in reductionist thinking (e.g., the principle of water balance) [37], tend to focus on long-term trends of individual components or on supply–demand equilibrium, making it difficult to uncover the intrinsic driving mechanisms of system evolution [38]. In response, this study adopts a holistic perspective and innovatively introduces synergetics to construct an analytical framework for water resource systems. The framework enables quantitative assessment of the system’s synergistic state and its evolutionary process under the coupling of water source and water use subsystems, thereby revealing the underlying driving forces from a systems science perspective and providing a new avenue for the macro-level understanding and management of water resources.

4.2. Managerial Implications and Research Limitations

This study offers the following managerial insights for promoting coordinated development between water source and water use systems: First, it is essential to deepen industrial restructuring, strictly control the expansion of water-intensive industries, and drive industrial transformation toward low water consumption and high efficiency through policy guidance and technological innovation. Second, accelerating the research, development, and application of water-saving technologies—and comprehensively promoting water-saving measures in production, domestic, and ecological domains—can enhance water use efficiency [39]. Concurrently, strengthening water diversion projects and water storage infrastructure will improve the water source system’s resilience to natural climate fluctuations, ensuring sustainable water supply. Ultimately, combining “water source expansion” and “water use efficiency” strategies can effectively alleviate supply–demand conflicts and advance coordinated development of water source and water use systems.
From the perspective of supply–demand interfeedback, this research integrates water source and water use into an analytical framework for water resources system evolution, revealing the impact of their synergistic relationship on overall system dynamics. It provides a new perspective and methodology for systematic water resources management. However, limited by data availability, the study has the following limitations: First, the evaluation index system could be further optimized. For example, by incorporating data on external water transfers and reclaimed water, as well as information on the water quality conditions of different water sources, and refining water use classifications to enhance result comprehensiveness and practical management relevance. Second, while driving factors of water resources system evolution were qualitatively described, future research should quantitatively analyze their mechanisms using models such as structural equation modeling or geographically weighted regression, integrating natural environmental factors (e.g., climate change, precipitation patterns) and socioeconomic factors (e.g., population growth, economic development levels) to more precisely grasp water resources system evolution laws.

5. Conclusions

The deep coupling of natural and human processes endows water resource systems with pronounced nonlinear characteristics, posing significant challenges to traditional hydrological approaches. To address this issue, this study introduces synergetics into water resource system research within the framework of systems science and develops a coordination degree evaluation model for water resource systems. Taking Henan Province as a case study to analyze the order degree evolution and synergistic characteristics of water source and water use systems from 2012 to 2022.
The results indicate that the synergy degree of Henan’s water resources system showed an overall upward trend (increasing by nearly 40%), but with significant spatiotemporal differentiation, characterized by a “low in the north, high in the south” spatial pattern and a “demand coercion-supply optimization” interaction mechanism. The order degree of the water source system was significantly influenced by engineering regulation; after the operation of the middle route of the South-to-North Water Diversion Project, northern Henan formed a positive feedback loop through inter-basin water transfer and groundwater recharge, driving an increase in system order degree. The order degree of the water use system exhibited a significant positive correlation with precipitation, with north–south disparities gradually narrowing due to the promotion of water-saving technologies. The synergy degree followed the “barrel effect,” with a decline after 2018 caused by the decreasing order degree of the water source subsystem, highlighting the importance of balanced subsystem development.
This research reveals the internal mechanisms of water resources system evolution from a supply–demand interfeedback perspective, providing theoretical support and practical pathways for systematic management. It emphasizes the need to achieve coordinated “water source expansion” and “water use efficiency” through industrial restructuring, water-saving technology application, and water source engineering optimization. Furthermore, the findings confirm that the synergetics-based analytical approach effectively identifies the evolutionary characteristics and patterns of water resource systems, thereby extending the methodological framework of traditional hydrology.

Supplementary Materials

The following supporting information can be downloaded at: https://www.mdpi.com/article/10.3390/w17192888/s1, Figure S1. Schematic diagram of the Lorenz Curve and Gini Coefficient; Table S1. Order parameter weights of water source system in each city of study area; Table S2. Order parameter weights of water use system in each city of study area; Table S3. Order degree of water source system; Table S4. Order degree of water use system; Table S5. Synergy degree of water source-use subsystem.

Author Contributions

Conceptualization, S.Z. and T.W.; methodology, T.L. and H.G.; software, S.H., Z.L., N.W. and Y.H.; validation, H.G., N.W. and Y.H.; resources, S.Z., T.L. and T.W.; writing—original draft preparation, S.Z., H.G. and T.W.; supervision, T.W.; funding acquisition, T.W. All authors have read and agreed to the published version of the manuscript.

Funding

This research was funded by the Natural Science Foundation of Henan (No. 252300421460) and Investigation and Assessment of Groundwater Environmental Conditions in Landfill Sites of Henan Province and Integration of “Two Sites” Achievements Project (No. 20241058A).

Data Availability Statement

All data used in this study were collected from the Henan Water Resources Bulletin and Henan Statistical Yearbook spanning 2012–2022. The download links are as follows: https://slt.henan.gov.cn/bmzl/szygl/szygb/ (accessed on 29 September 2025) (Henan Water Conservancy Department) and https://tjj.henan.gov.cn/tjfw/tjcbw/tjnj/ (accessed on 29 September 2025) (Statistics Bureau of Henan Province).

Conflicts of Interest

The authors declare no conflicts of interest.

References

  1. Bian, D.; Yang, X.; Wu, F.; Babuna, P.; Luo, Y.; Wang, B.; Chen, Y. A three-stage hybrid model investigating regional evaluation, pattern analysis and obstruction factor analysis for water resource spatial equilibrium in China. J. Clean. Prod. 2022, 331, 129940. [Google Scholar] [CrossRef]
  2. Bian, D.; Yang, X.; Lu, Y.; Chen, H.; Sun, B.; Wu, F.; Chen, Y.; Xiang, W. Analysis of the spatiotemporal patterns and decoupling effects of China’s water resource spatial equilibrium. Environ. Res. 2022, 216, 114719. [Google Scholar] [CrossRef]
  3. Li, Y.; Li, Y.; Guo, X.; Pan, Z.; Liu, W. Spatial-temporal distribution and variation characteristics of water resources in Chinaduring 1956—2016. Adv. Water Sci. 2025, 36, 18–27. [Google Scholar] [CrossRef]
  4. Zhou, D.; Zhou, F.; Zhong, S. “Club convergence” of per capita water resource distribution in China: Based on extended Markov chain model. Arid Land Geogr. 2018, 41, 867–873. [Google Scholar] [CrossRef]
  5. Li, Y.; Sun, K.; Men, R.; Wang, F.; Li, D.; Han, Y.; Qu, Y. Study on the Optimization of Multi-Objective Water Resources Allocation in the Henan Yellow River Water Supply Zone. Water 2023, 15, 4009. [Google Scholar] [CrossRef]
  6. He, F.; Lu, P.; Yin, J.; He, G.; Ou, Z.; Gu, B. Spatial equilibrium evaluation and spatial correlation analysis of water resources in China. Water Resour. Prot. 2023, 39, 148–155. [Google Scholar]
  7. Liu, Y.; Fan, Y.; Fang, Y.; Liu, Y.; Hou, Y.; Wang, S. Assessing the impact of incentive coordination effect on the equilibrium of agricultural water usage by China’s South-to-North Water Diversion Middle Route Project. Environ. Sci. Pollut. Res. 2024, 31, 17354–17371. [Google Scholar] [CrossRef]
  8. Lou, Y.; Qiu, Q.; Zhang, M.; Feng, Z.; Dong, J. Spatial Equilibrium Evaluation of the Water Resources in Tai’an City Based on the Lorenz Curve and Correlation Number. Water 2023, 15, 2617. [Google Scholar] [CrossRef]
  9. Delavar, M.; Morid, S.; Morid, R.; Farokhnia, A.; Babaeian, F.; Srinivasan, R.; Karimi, P. Basin-wide water accounting based on modified SWAT model and WA+ framework for better policy making. J. Hydrol. 2020, 585, 124762. [Google Scholar] [CrossRef]
  10. Younesi, M.; Saadatpour, M.; Afshar, A. Integration of the system of environmental economic accounting-ecosystem accounting (SEEA-EA) framework with a semi-distributed hydrological and water quality simulation model. Ecosyst. Serv. 2024, 70, 101672. [Google Scholar] [CrossRef]
  11. Harms, J.Z.; Malard-Adam, J.J.; Adamowski, J.F.; Sharma, A.; Nkwasa, A. Dynamically coupling system dynamics and SWAT+ models using Tinamit: Application of modular tools for coupled human-water system models. Hydrol. Earth Syst. Sci. 2023, 27, 1683–1693. [Google Scholar] [CrossRef]
  12. Yang, H.; Cao, W.; Zhi, C.; Li, Z.; Bao, X.; Ren, Y.; Liu, F.; Fan, C.; Wang, S.; Wang, Y. Evolution of groundwater level in the North China Plain in the past 40 years and suggestions on its overexploitation treatment. Geol. China 2021, 48, 1142–1155. [Google Scholar]
  13. Yang, G.; Liu, Z.; Ling, W.; Tian, G. Water resource compensation mechanism for water transfer projects from the perspective of synergistic development. Resour. Sci. 2025, 47, 469–484. [Google Scholar]
  14. Zhang, Q.; Bee, H.; Wang, Y.; He, J. Coupling coordination and sustainability among water resource carrying capacity, urbanization, and economic development based on the integrated model. Front. Environ. Sci. 2025, 13, 1563946. [Google Scholar] [CrossRef]
  15. Yang, R.; Wang, F.; Wang, H.; Liu, Y.; Li, Y.; Jiang, X.; Sun, X. Spatial equilibrium evaluation model of urban water resources and its application under territorial spatial planning system. Water Resour. Prot. 2023, 39, 130–136. [Google Scholar]
  16. Ni, X.; Dong, Z.; Xie, W.; Jia, W.; Duan, C.; Yao, H. Research on the Multi-Objective Cooperative Competition Mechanism of Jinsha River Downstream Cascade Reservoirs during the Flood Season Based on Optimized NSGA-III. Water 2019, 11, 849. [Google Scholar] [CrossRef]
  17. Shen, X.; Wu, X.; Xie, X.; Wei, C.; Li, L.; Zhang, J. Synergetic Theory-Based Water Resource Allocation Model. Water Resour. Manag. 2021, 35, 2053–2078. [Google Scholar] [CrossRef]
  18. Zhao, M.; Wei, J.; Han, Y.; Shi, J.; Wang, S. Water resource security evaluation and barrier analysis in Henan Province utilizing the DPSIR framework. Front. Environ. Sci. 2024, 12, 1354175. [Google Scholar] [CrossRef]
  19. Liu, Z.; Tan, Y.; Zhu, C. An Analysis of Influencing Factors in Collaborative Development of the Secondary Industry and the Tertiary Industry in Chengdu, China. Res. World Econ. 2013, 4, 35. [Google Scholar] [CrossRef]
  20. Feng, B.; Feng, C. SME-Platform System Development in China-ASEAN E-Commerce: A Synergetic Evolution Perspective. Systems 2025, 13, 218. [Google Scholar] [CrossRef]
  21. Li, Y.; Wei, Y.; Li, G.; Wang, W.; Bai, Z. Sustainability evaluation of water resource system in Beijing City from a synergized perspective. China Popul. Resour. Environ. 2019, 29, 71–80. [Google Scholar]
  22. Zheng, Z.; Xu, C.; Fan, J.; Liu, M.; Chen, X. Order parameter dynamics in complex systems: From models to data. Chaos Interdiscip. J. Nonlinear Sci. 2024, 34, 022101. [Google Scholar] [CrossRef]
  23. Wu, C.; Wang, X.; Jin, J.; Zhou, Y.; Bai, X.; Cui, Y. Ordered correlation degree entropy based approach for comprehensive evaluation analysis of water resource spatial equilibrium system. J. Hydraul. Eng. 2022, 53, 1304–1316. [Google Scholar]
  24. Jin, J.; Xu, X.; Cui, Y.; Zhou, R.; Wu, C.; Zhang, L. Water resources spatial equilibrium evaluation method based on connection number and Lorenz curve. Adv. Water Sci. 2021, 32, 387–395. [Google Scholar]
  25. Huang, F.; Huang, B.; Qiu, J. The spatial equilibrium of water resources of Guangdong based on equilibrium coefficient. Acta Sci. Nat. Univ. Sunyatseni 2021, 60, 86–93. [Google Scholar]
  26. Yan, Y.; Yang, X.; Fu, P.; Li, Z. Characteristics and driving factors of water supply and consumption in Henan section ofMiddle Route Project of South-to-North Water Diversion. Yangtze River 2025, 56, 126–133. [Google Scholar] [CrossRef]
  27. Hu, X.; Zhao, J.; Wang, B.; Gao, C. Changes of spatial synergies or trade-offs of ecosystem services in Heihe River Basin. Chin. J. Ecol. 2022, 41, 580–588. [Google Scholar]
  28. Yang, Q.; Wang, L.; Li, Y.; Qin, X. Land use spatial equilibrium from the perspective of supply and demand matching:A case study of Jiangsu Province. Resour. Sci. 2021, 43, 932–943. [Google Scholar]
  29. Liu, J.-Y.; Zhang, Z.-J.; Ma, X.-W.; Zhou, X.-G. Weight Determination of SIMU Error Coefficients Based on Gray Correlation Matrix. Fire Control Command Control 2013, 38, 45–47+51. [Google Scholar]
  30. Bian, D.; Yang, X.; Xiang, W.; Sun, B.; Chen, Y.; Babuna, P.; Li, M.; Yuan, Z. A new model to evaluate water resource spatial equilibrium based on the game theory coupling weight method and the coupling coordination degree. J. Clean. Prod. 2022, 366, 132907. [Google Scholar] [CrossRef]
  31. Haisch, T. Interplay between ecological and economic resilience and sustainability and the role of institutions: Evidence from two resource-based communities in the Swiss Alps. Resilience 2018, 6, 215–229. [Google Scholar] [CrossRef]
  32. Zhou, R.; Jin, J.; Cui, Y.; Ning, S.; Zhou, L.; Zhang, L.; Wu, C.; Zhou, Y. Spatial Equilibrium Evaluation of Regional Water Resources Carrying Capacity Based on Dynamic Weight Method and Dagum Gini Coefficient. Front. Earth Sci. 2022, 9, 790349. [Google Scholar] [CrossRef]
  33. Malakar, K.; Mishra, T.; Patwardhan, A. Inequality in water supply in India: An assessment using the Gini and Theil indices. Environ. Dev. Sustain. 2018, 20, 841–864. [Google Scholar] [CrossRef]
  34. Wang, T.; Wu, Z.; Wang, P.; Wu, T.; Zhang, Y.; Yin, J.; Yu, J.; Wang, H.; Guan, X.; Xu, H.; et al. Plant-groundwater interactions in drylands: A review of current research and future perspectives. Agric. For. Meteorol. 2023, 341, 109636. [Google Scholar] [CrossRef]
  35. Yao, Y.; Zheng, C.; Andrews, C.; He, X.; Zhang, A.; Liu, J. Integration of groundwater into China’s south-north water transfer strategy. Sci. Total Environ. 2018, 658, 550–557. [Google Scholar] [PubMed]
  36. Wang, L.; Nie, Z.; Liu, M.; Cao, L.; Zhu, P.; Yuan, Q. Rational Allocation of Water Resources in the Arid Area of Northwestern China Based on Numerical Simulations. Sustainability 2022, 15, 55. [Google Scholar] [CrossRef]
  37. Chang, F.-J.; Wang, Y.-C.; Tsai, W.-P. Modelling Intelligent Water Resources Allocation for Multi-users. Water Resour. Manag. 2016, 30, 1395–1413. [Google Scholar] [CrossRef]
  38. Hering, J.G.; Ingold, K.M. Water Resources Management: What Should Be Integrated? Science 2012, 336, 1234–1235. [Google Scholar] [CrossRef]
  39. Wu, C.; Nie, B.; Wang, X.; Jin, J.; Zhou, Y.; Bai, X.; Cui, Y.; Zhou, L.; Zhang, L. Set pair analysis and system dynamics coupling approach for structure simulation and variation trend evaluation of water resources spatial equilibrium system. J. Am. Water Resour. Assoc. 2025, 61, e13237. [Google Scholar] [CrossRef]
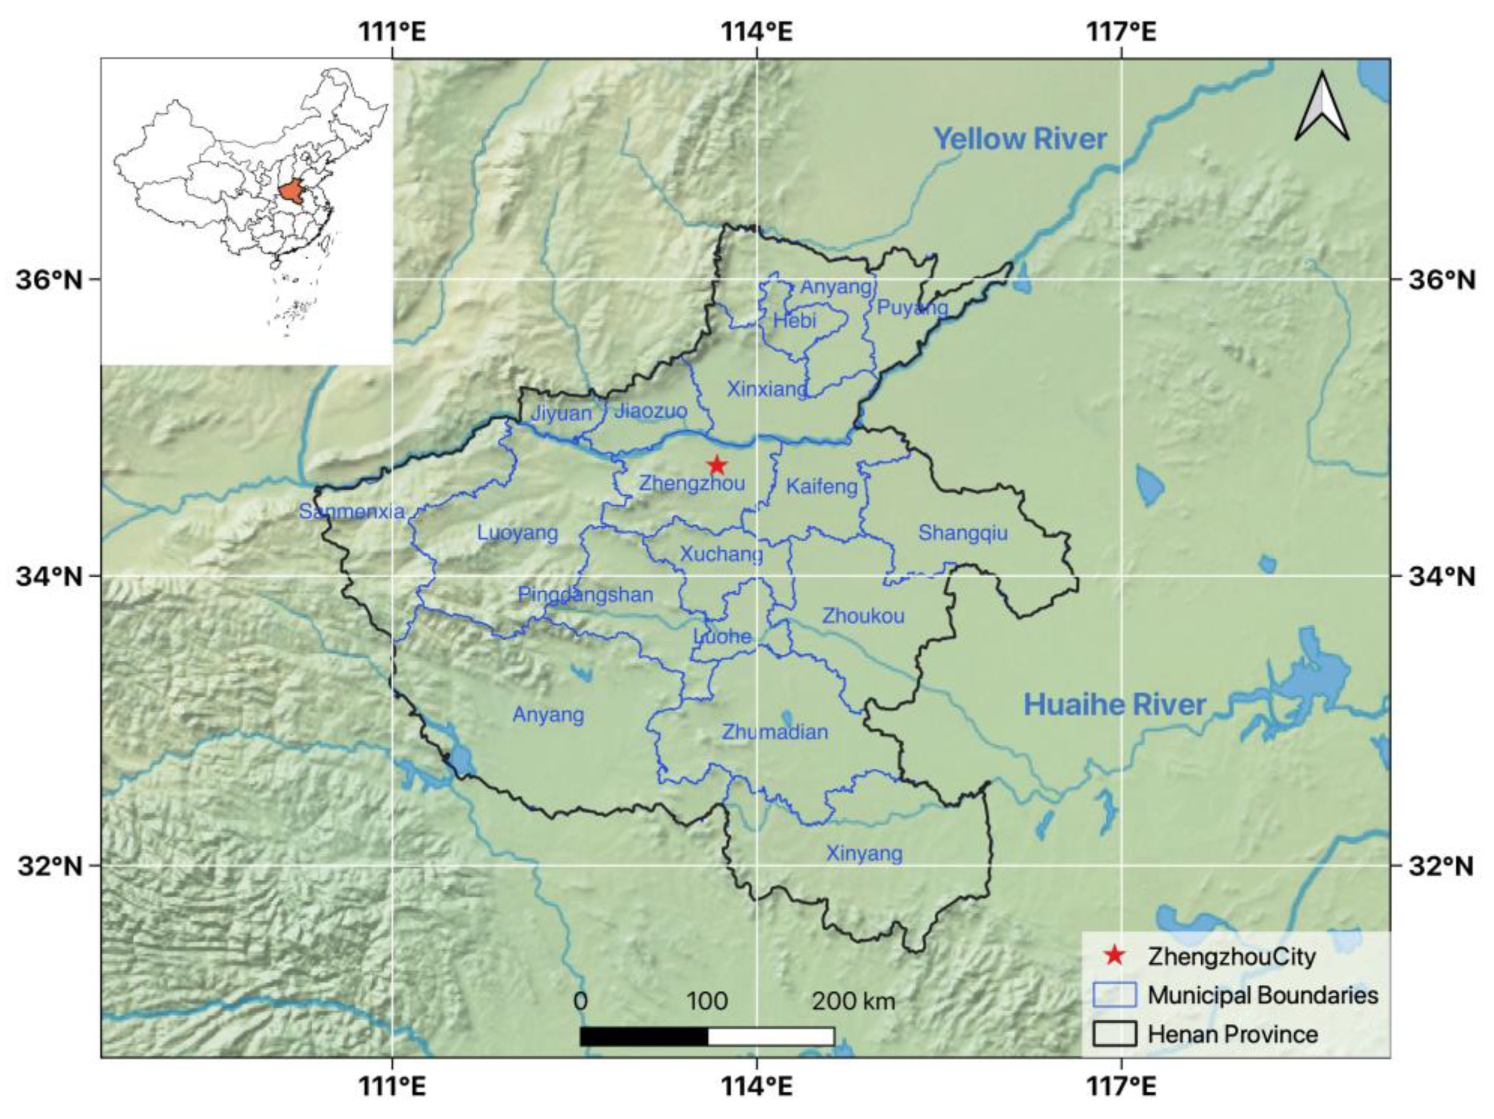
Figure 1. Location of the study area. The inset in the upper right corner shows the geographical location of Henan Province (marked in red) in China.
Water 17 02888 g001
Figure 2. Research framework and technical roadmap of this study.
Water 17 02888 g002
Figure 3. Spatial distribution of order parameter weights in the water resources system: (a) water use subsystem; (b) water source subsystem.
Water 17 02888 g003
Figure 4. Principal component analysis of indicator weights: (a) biplot of PC1 and PC2, (b) biplot of PC3 and PC4.
Water 17 02888 g004
Figure 5. Spatial distribution of the order degree of the water source system in Henan Province, 2012–2022.
Water 17 02888 g005
Figure 6. Time series of the order degree of the water source system in various cities from 2012 to 2022.
Water 17 02888 g006
Figure 7. Spatial distribution of the order degree of the water use system in Henan Province, 2012–2022.
Water 17 02888 g007
Figure 8. Time series of the order degree of the water use system in various cities from 2012 to 2022.
Water 17 02888 g008
Figure 9. Spatial distribution of the synergy degree of the water source system in Henan Province, 2012–2022.
Water 17 02888 g009
Figure 10. Time series of the synergy degree of the water resource system in various cities from 2012 to 2022.
Water 17 02888 g010
Table 1. Indicators for evaluating the synergy of water resources systems.
Water Resources SystemSubsystemsOrder ParametersIndicator Attributes
Synergy degreeWater use systemAgricultural watercost-type
Industrial watercost-type
Ecological waterbenefit-type
Domestic waterbenefit-type
Water consumptioncost-type
Water source systemWater utilization ratebenefit-type
Surface waterbenefit-type
Groundwaterbenefit-type
Other waterbenefit-type
Precipitationbenefit-type
Disclaimer/Publisher’s Note: The statements, opinions and data contained in all publications are solely those of the individual author(s) and contributor(s) and not of MDPI and/or the editor(s). MDPI and/or the editor(s) disclaim responsibility for any injury to people or property resulting from any ideas, methods, instructions or products referred to in the content.