Article

Spatiotemporal Patterns of Algal Blooms in Lake Bosten Driven by Climate and Human Activities: A Multi-Source Remote-Sensing Perspective for Sustainable Water-Resource Management

1
College of Resources and Environment, Xinjiang Agricultural University, Urumqi 830052, China
2
College of Grassland Science, Xinjiang Agricultural University, Urumqi 830052, China
*
Author to whom correspondence should be addressed.
These authors contributed equally to this work.
Water 2025, 17(16), 2394; https://doi.org/10.3390/w17162394
Submission received: 4 July 2025 / Revised: 5 August 2025 / Accepted: 9 August 2025 / Published: 13 August 2025
(This article belongs to the Special Issue Use of Remote Sensing Technologies for Water Resources Management)

Abstract

Algal blooms pose a serious threat not only to the lake ecosystem of Lake Bosten but also by negatively impacting its rapidly developing fisheries and tourism industries. This study focuses on Lake Bosten as the research area and utilizes multi-source remote sensing imagery from Landsat TM/ETM+/OLI and Sentinel-2 MSI. The Adjusted Floating Algae Index (AFAI) was employed to extract algal blooms in Lake Bosten from 2004 to 2023, analyze their spatiotemporal evolution characteristics and driving factors, and construct a Long Short Term Memory (LSTM) network model to predict the spatial distribution of algal-bloom frequency. The stability of the model was assessed through temporal segmentation of historical data combined with temporal cross-validation. The results indicate that (1) during the study period, algal blooms in Lake Bosten were predominantly of low-risk level, with low-risk bloom coverage accounting for over 8% in both 2004 and 2005. The intensity of algal blooms in summer and autumn was significantly higher than in spring. The coverage of medium- and high-risk blooms reached 2.74% in the summer of 2004 and 3.03% in the autumn of 2005, while remaining below 1% in spring. (2) High-frequency algal bloom areas were mainly located in the western and northwestern parts of the lake, and the central region experienced significantly more frequent blooms during 2004–2013 compared to 2014–2023, particularly in spring and summer. (3) The LSTM model achieved an R2 of 0.86, indicating relatively stable performance. The prediction results suggest a continued low frequency of algal blooms in the future, reflecting certain achievements in sustainable water-resource management. (4) The interactions among meteorological factors exhibited significant influence on bloom formation, with the q values of temperature and precipitation interactions both exceeding 0.5, making them the most prominent meteorological driving factors. Monitoring of sewage discharge and analysis of agricultural and industrial expansion revealed that human activities have a more direct impact on the water quality of Lake Bosten. In addition, changes in lake area and water environment were mainly influenced by anthropogenic factors, ultimately making human activities the primary driving force behind the spatiotemporal variations of algal blooms. This study improved the timeliness of algal-bloom monitoring through the integration of multi-source remote sensing and successfully predicted the future spatial distribution of bloom frequency, providing a scientific basis and decision-making support for the sustainable management of water resources in Lake Bosten.

1. Introduction

Lakes not only play key ecological functions in climate regulation, nutrient cycling, and maintenance of biodiversity, but also have a direct bearing on regional ecological security and sustainable socio-economic development, and they are an indispensable component of global freshwater resources [1,2]. However, with the recent acceleration in population growth and subsequent intensification of economic activities, pollutants such as agricultural drainage, industrial wastewater, and domestic sewage are being discharged into lakes in massive quantities. This has led to the increasingly serious problem of eutrophication, which creates the environmental basis for the growth of algal blooms [3,4,5].
Outbreaks of algal blooms can have severe adverse impacts on the health of a lake, ranging from water-quality degradation and to the partial or even full destruction of the lake’s ecosystems. The blooms can also cause a drastic drop in oxygen levels in the water column, which in turn leads to fish being killed and which is detrimental to the development of the local fisheries industry [6,7]. At the same time, some algal-bloom species release toxic secondary metabolites, which seriously threaten the water’s potability for humans and which endanger human health [8,9].
As the adverse impacts of algal blooms on lake ecosystems continue to increase, the environmental and public-health problems they pose have become a cause for global concern [10,11]. Therefore, comprehensive and continuous monitoring of algal blooms is crucial for scientifically assessing the water quality of lakes and formulating effective ecological management strategies [12,13]. Traditional algal-bloom monitoring relies on ship surveys and laboratory analyses, which, though relatively accurate, are high in cost, low in efficiency, and limited to local areas only. In contrast, satellite remote-sensing technology, with its wide coverage, low cost, and high timeliness, is capable of realizing large-scale and high-frequency algal-bloom monitoring. The satellite-based approach makes up for the shortcomings of the traditional methods in space and time scales and so has become an important strategy in the field of algal-bloom monitoring, showing prospects for a broad application [6,14].
Algae in the water column have a unique spectral reflectance profile: there is a clear absorption peak near the 620–630 nm band, a reflection peak near 650 nm, and a sharp increase in reflectance near 700 nm [10]. Based on this spectral property, many researchers have applied remote-sensing technology to the monitoring and identification of algal blooms and have achieved remarkable results. Hu [15] proposed the Floating Algae Index (FAI) and verified that it can efficiently identify algal-bloom areas on MODIS imagery. Zhou et al. [16] extracted Chaohu-Lake algal blooms from MODIS images using the FAI index and systematically analyzed their spatiotemporal variation characteristics. In order to enhance the adaptability of FAI on different remote-sensing images, Fang et al. [17] improved it and proposed the Adjusted Floating Algae Index (AFAI), which was successfully applied to the identification and monitoring of algal blooms in Lake Hulun in MODIS and Landsat images. Chen et al. [6], on the other hand, extracted information on algal blooms in Hulun Lake and Beier Lake, analyzing their spatiotemporal trends using the AFAI index on Landsat and Sentinel-2 data. Ma et al. [1] combined MODIS, Landsat, and Sentinel-2 multi-source remote-sensing images, and comprehensively applied NDVI, FAI, and peak chlorophyll reflectance intensity algorithms to monitor the spatiotemporal evolution of algal blooms in Chaohu Lake. Zhang et al. [14] then introduced Spatial Temporal data Fusion (STF), fused MODIS and Landsat images, and extracted algal blooms by combining Sentinel-2 optical images and radar remote-sensing data. The spatial distribution of algal blooms in Chaohu Lake was further analyzed in depth by Lin et al. [18], who combined Landsat images with land-use data. Luo et al. [19] predicted algal blooms in Lake Taihu by constructing a relevant machine-learning model. Current research on algal blooms primarily focuses on cyanobacterial blooms, as the phycocyanin in cyanobacteria exhibits a distinct absorption peak at 620–630 nm. This unique spectral reflectance characteristic enables higher-precision remote-sensing identification of cyanobacteria. In contrast, green algae (containing chlorophyll-a, chlorophyll-b, and lutein) and diatoms (containing chlorophyll-a, chlorophyll-c, and fucoxanthin) lack such distinctive spectral features. Their spectral signatures closely resemble those of aquatic vegetation, often leading to misclassification in remote-sensing detection. Therefore, supplementary validation using UAVs or other methods is typically required for accurate identification.
The study of algal-bloom drivers can help to reveal its formation mechanism, provide a scientific basis for lake ecological management, and promote water-quality management and ecological protection [20,21,22]. Currently, the drivers of algal blooms can be categorized into two main groups: meteorological factors and human activities. Meteorological factors mainly include air temperature, precipitation, evapotranspiration, sunshine hours, wind speed, and air pressure, etc., which indirectly or directly regulate the occurrence of the blooms by influencing the nutrient cycling, hydrodynamic conditions, and algal growth and metabolism in the water body [23,24].
Human activities, as unnatural factors, are important external drivers in the evolution of algal blooms and mainly include population growth, economic development, land-use change, pollutant discharge intensity, and lake-governance policies [25,26]. Among these factors, farmland drainage, domestic sewage, and industrial wastewater discharge have been found to directly lead to an increase in the nitrogen and phosphorus load of the water body, which will in turn exacerbate the eutrophication of the water body and trigger algal bloom [27,28]. Lake-ecological management measures, such as control of pollution sources, ecological restoration of water bodies, and regulation of water resources, can effectively inhibit the occurrence of algal blooms to a certain extent [29,30,31].
Current research on algal blooms in Chinese lakes focuses on Lake Tai [8,9,32], Lake Chaohu [16,18,20], and Dianchi Lake [27] in the south, and Lake Hulun [6,17] in the north. Due to the high eutrophication level and frequent occurrence of algal blooms, these lakes have become the key areas for algal-bloom monitoring and treatment research in China. Since 2000, with population growth and economic development, the area of arable land has expanded, water used for agricultural irrigation has increased, and a large amount of drainage water from farmland has flowed into Lake Bosten [33,34]. At the same time, industrial development and urbanization have accelerated, with industrial and domestic wastewater being discharged directly into the lake. These human activities have disrupted the lake’s ecological balance, increased its nutrient load, and provided favorable conditions for algal blooms.
Despite the serious decline in water quality mentioned above, there is currently a lack of systematic research on algal blooms in Lake Bosten. The present paper addresses these concerns, aiming to provide a theoretical basis for the management of the lake’s water quality. Our study uses LandsatTM/ETM+/OLI and Sentinel-2MSI multi-source remote-sensing image data to extract algal-bloom information during 2004–2023 and then analyzes the blooms’ spatiotemporal change characteristics. The driving factors of algal-bloom evolution are discussed by combining data on water level, area, meteorological, water quality, and socio-economic conditions. The study can provide data support and a theoretical basis for the monitoring of algal blooms in Lake Bosten and for the lake’s broader ecological management.

2. Materials and Methods

2.1. Overview of the Study Area

Lake Bosten is located in the Yanqi Basin (86°40′–87°56′ E, 41°56′–42°14′ N) in the southern foothills of the Tianshan Mountains in Xinjiang, China. A typical inland throughput lake in the arid region of northwestern China, Lake Bosten is the tailstock of the Kaidu River as well as the headwaters of the Peacock River (Figure 1). The lake’s major recharge rivers are the Kaidu, the Huangshuigou, and the Qingshui. At present, the Kaidu River is the only one that recharges the lake all year round, with an average recharge rate of 22 × 108–23 × 108 m3 [33].
The broader Lake Bosten region has a typical continental desert climate, characterized by extreme aridity, low precipitation, high evaporation, and large temperature differences between day and night. The region also enjoys long hours of sunshine, abundant light and heat resources, and constant winds. Winter and summer are long, spring and autumn are short, and there is a fast warming in the spring and a rapid cooling in autumn.
Along with plentiful sunshine, Lake Bosten is rich in fishery resources, making it one of two major fishery bases in Xinjiang. The lake’s high water temperature and abundant bait resources provide favorable conditions for freshwater aquaculture and for the reproduction of various kinds of plankton. In addition, Lake Bosten is one of the largest concentrated reed-production areas in China, especially in the Huangshuigou area, where reeds grow to be thick and lush. There are also marshes and salt ponds around the lake, forming a unique wetland ecological environment.
In recent years, the tourism industry in Lake Bosten has developed rapidly, with scenic spots such as Golden Beach in the north, Great Estuary in the west, and White Egret State in the south attracting large numbers of tourists and becoming an important pillar of the local economy. Along with its contributions to the fishery and tourism industries, the lake is a natural regulator of the spatiotemporal distribution of water resources in the Kaidu River–Kongchu River Basin. It provides an important reservoir of water resources for the Bayinguoleng Mongol Autonomous Prefecture (Bazhou for short) in Xinjiang and is known as the ‘Mother Lake of the Bazhou people’. Due to its rich natural resources and strategic location, Lake Bosten is of great significance to regional economic development.

2.2. Data Sources and Processing

The 2004–2023 Landsat image series from the USGS https://earthexplorer.usgs.gov/ (accessed on 10 February 2024) includes LandsatTM/ETM+/OLI, totaling 240 images. The 2016–2023 Sentinel-2MSI imagery from Google Earth Engine https://code.earthengine.google.com/ (accessed on 15 February 2024) totals 192 pairs of images. Data on elevation (DEM), temperature, precipitation, potential evapotranspiration, and sunshine hours were obtained from the Earth Resources Data Cloud Platform http://www.gis5g.com (accessed on 19 February 2024). Wind speed and barometric-pressure data were obtained from the National Earth System Science Data Centre of China http://www.geodata.cn/ (accessed on 19 February 2024). Socio-economic data are from the Resource Environmental Science Data Platform http://www.resdc.cn/ (accessed on 19 February 2024), water quality data were collected and tested in the field, and water level data are from the Bayinguoleng Administration of Tarim River Basin, Xinjiang Uygur Autonomous Region (Table 1).
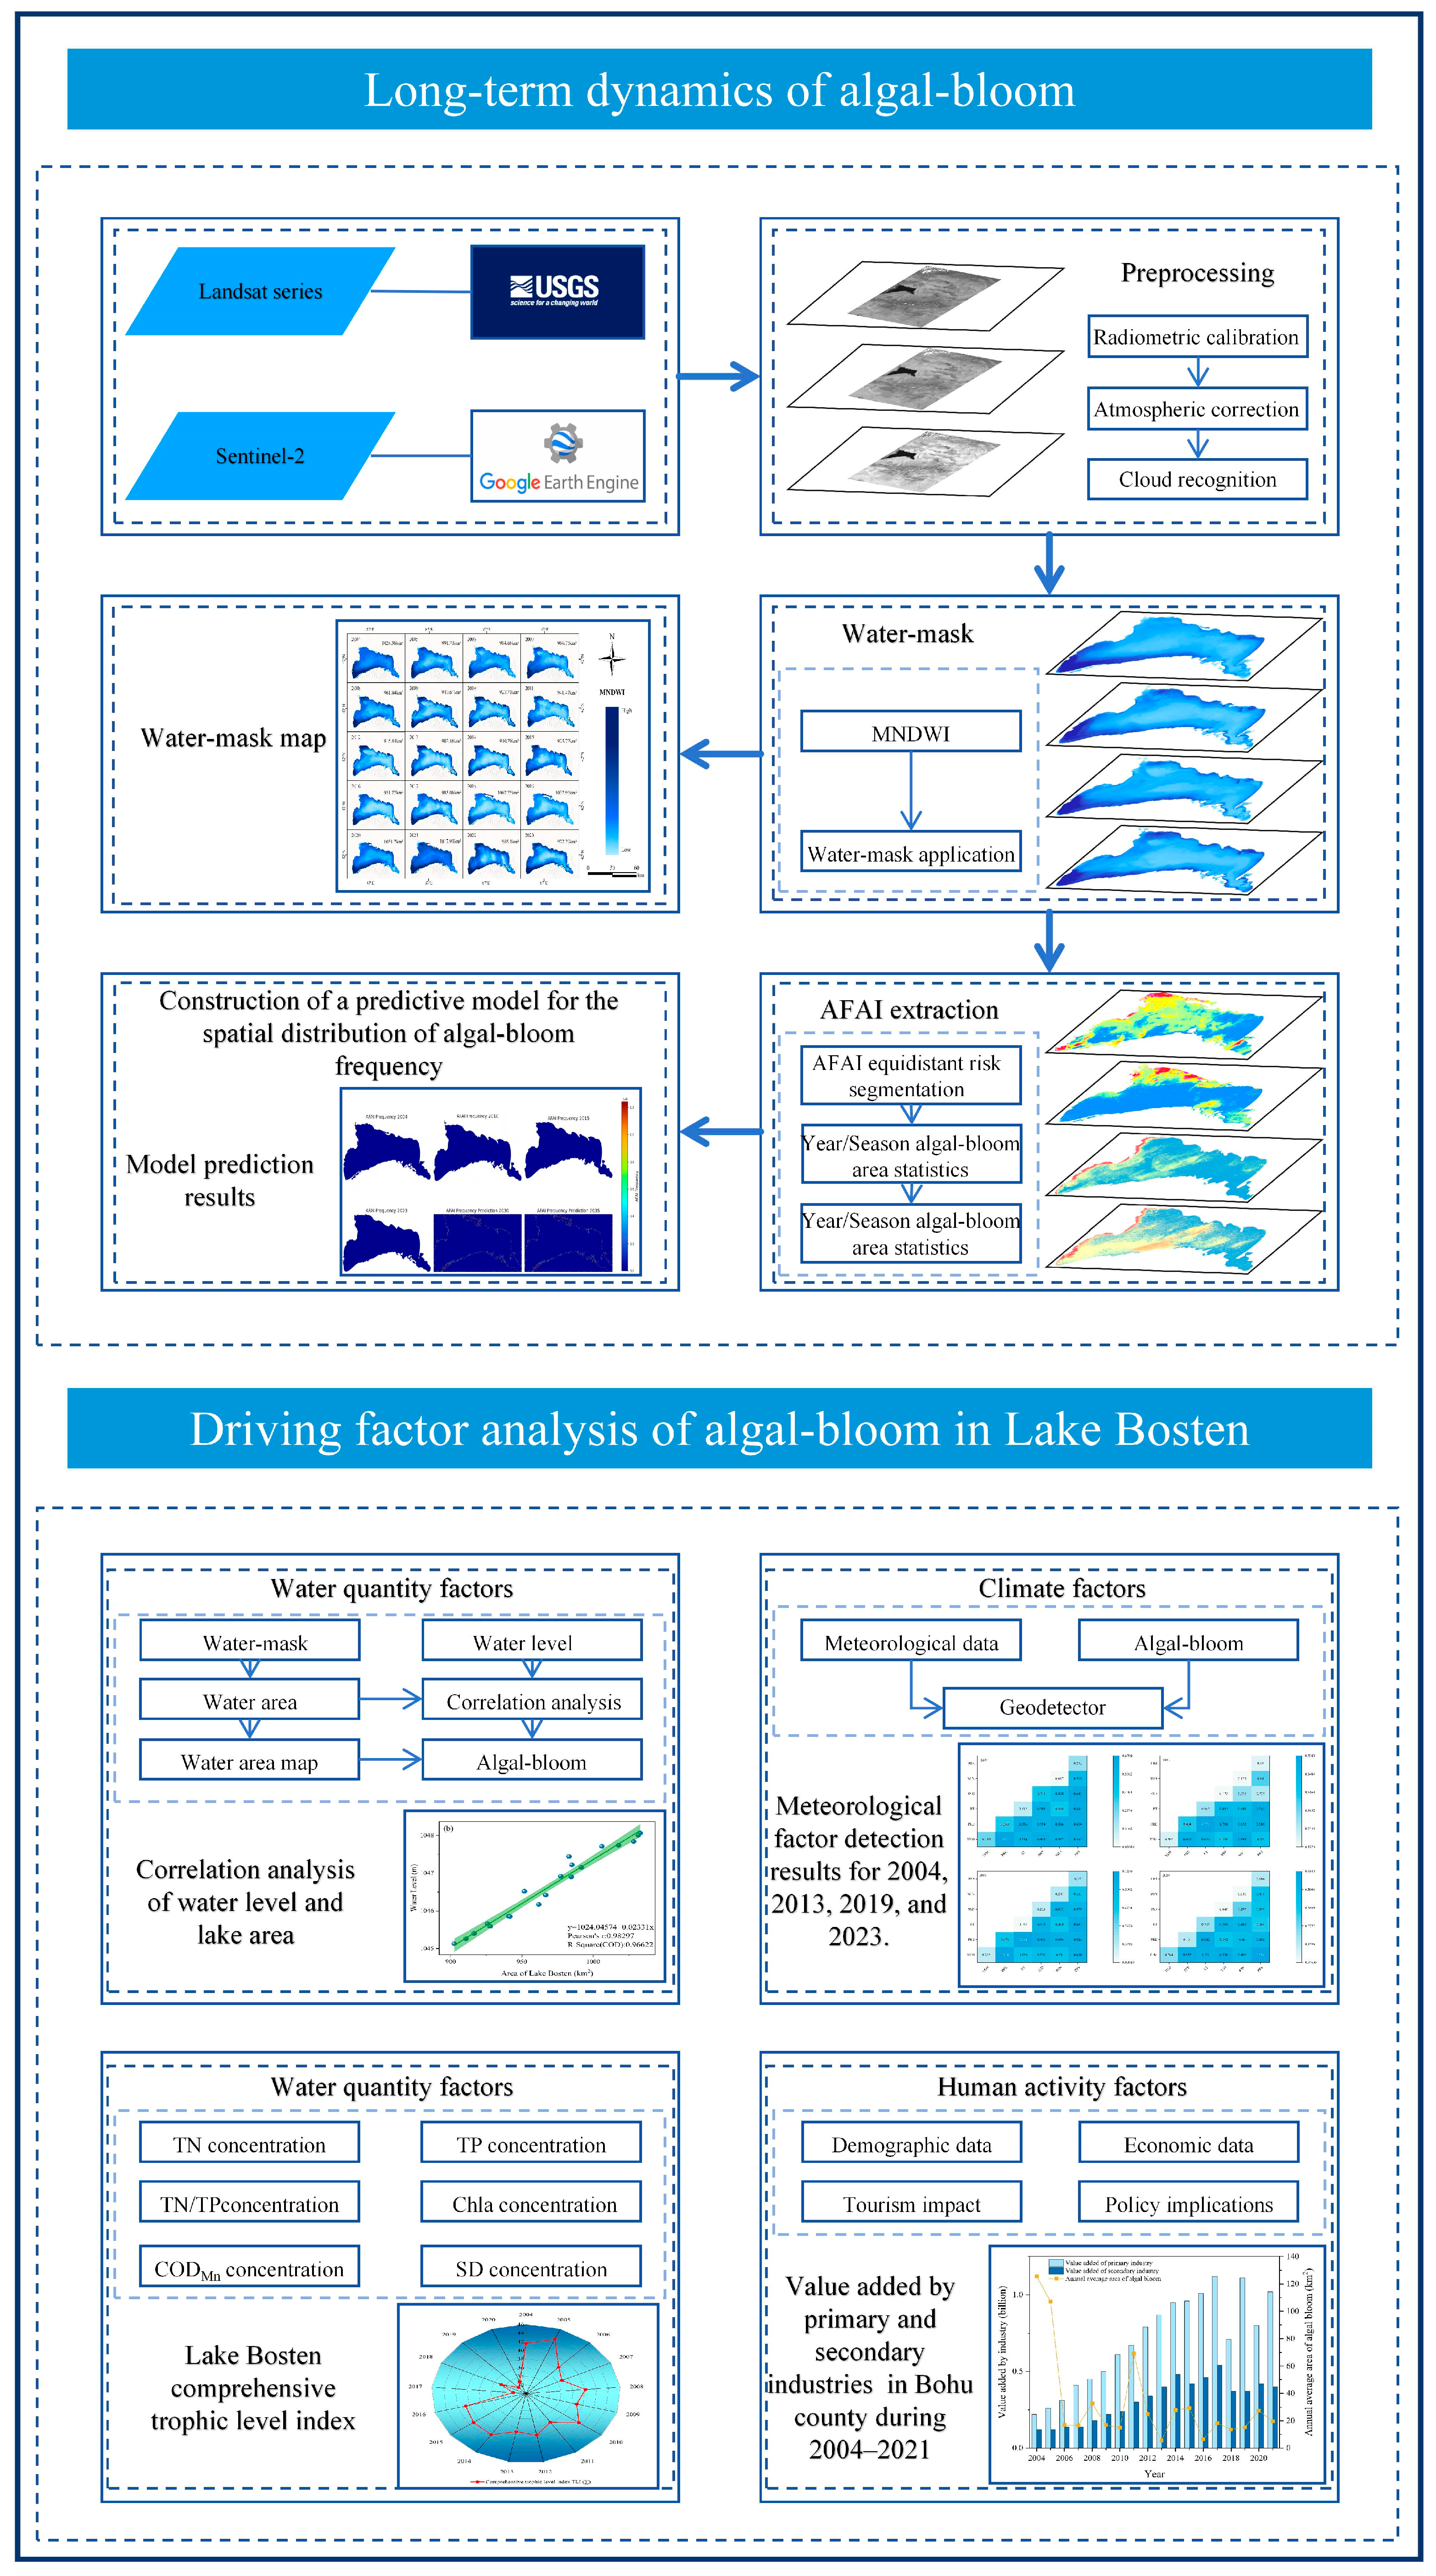
Atmospheric corrections were applied to Landsat series images after radiometric calibration, and strips were removed from Landsat7 ETM+ images. Sentinel-2 MSI images were pre-processed by Google Earth Engine (GEE) at the time of download (Figure 2).

2.3. Research Methodology

2.3.1. Modified Normalized Difference Water Index

The Modified Normalized Water Body Index (MNDWI) solves the problem of shadowing in water-body information by enabling easy and accurate extraction of water-body information and removing the effect of topographic differences [35,36]:
M N D W I = R r c , G r e e n R r c , S W I R R r c , G r e e n + R r c , S W I R
where R r c , G r e e n and R r c , S W I R are the reflectance in the G r e e n and S W I R bands, respectively.

2.3.2. Adjusted Floating Algae Index

The Adjusted Floating Algae Index (AFAI) can differentiate between clear water and algal blooms, thus accurately extracting information on the blooms [17]:
A F A I = R r c , N I R R r c , R E D R r c , S W I R R r c , R E D × 0.5
where R r c , N I R , R r c , R E D , and R r c , S W I R are the reflectance in the N I R band, R E D band, and S W I R band, respectively. The image elements with AFAI greater than the initial threshold 0 are identified as algal-bloom regions. After the regions are expanded to twice the initial size, two peaks appear in the histograph curve of the AFAI, including the clear-water region and the algal-bloom region. The optimal threshold is the minimum of the sum of the standard deviations of the left and right of the minimum value of the AFAI [17].

2.3.3. Extent of Lake-Area Dynamics

The degree of lake-area dynamics indicates the rate of change of the water body in different periods. The trend and rate of expansion and contraction of the water body [37,38] can thus be obtained as follows:
K = U b U a U a · 1 T · 100 %
where K is the degree of lake area dynamics, U a and U b are the lake surface area at the beginning and end of the study period, respectively, and T is the time interval.

2.3.4. Pearson Correlation Analysis

The Pearson’s (Pearson) correlation coefficient is used to indicate the strength of the relationship between two variables. It takes values between −1 and 1 [39]:
r x y = 1 i = 1 N ( x i x ¯ ) ( y i y ¯ ) i = 1 N ( x i x ¯ ) 2 ( y i y ¯ ) 2
where r x y is the correlation coefficient, x i and y i are the values of variable x and variable y , respectively, and x ¯ and y ¯ are the means of variable d and variable e, respectively.

2.3.5. LSTM (Long Short Term Memory)

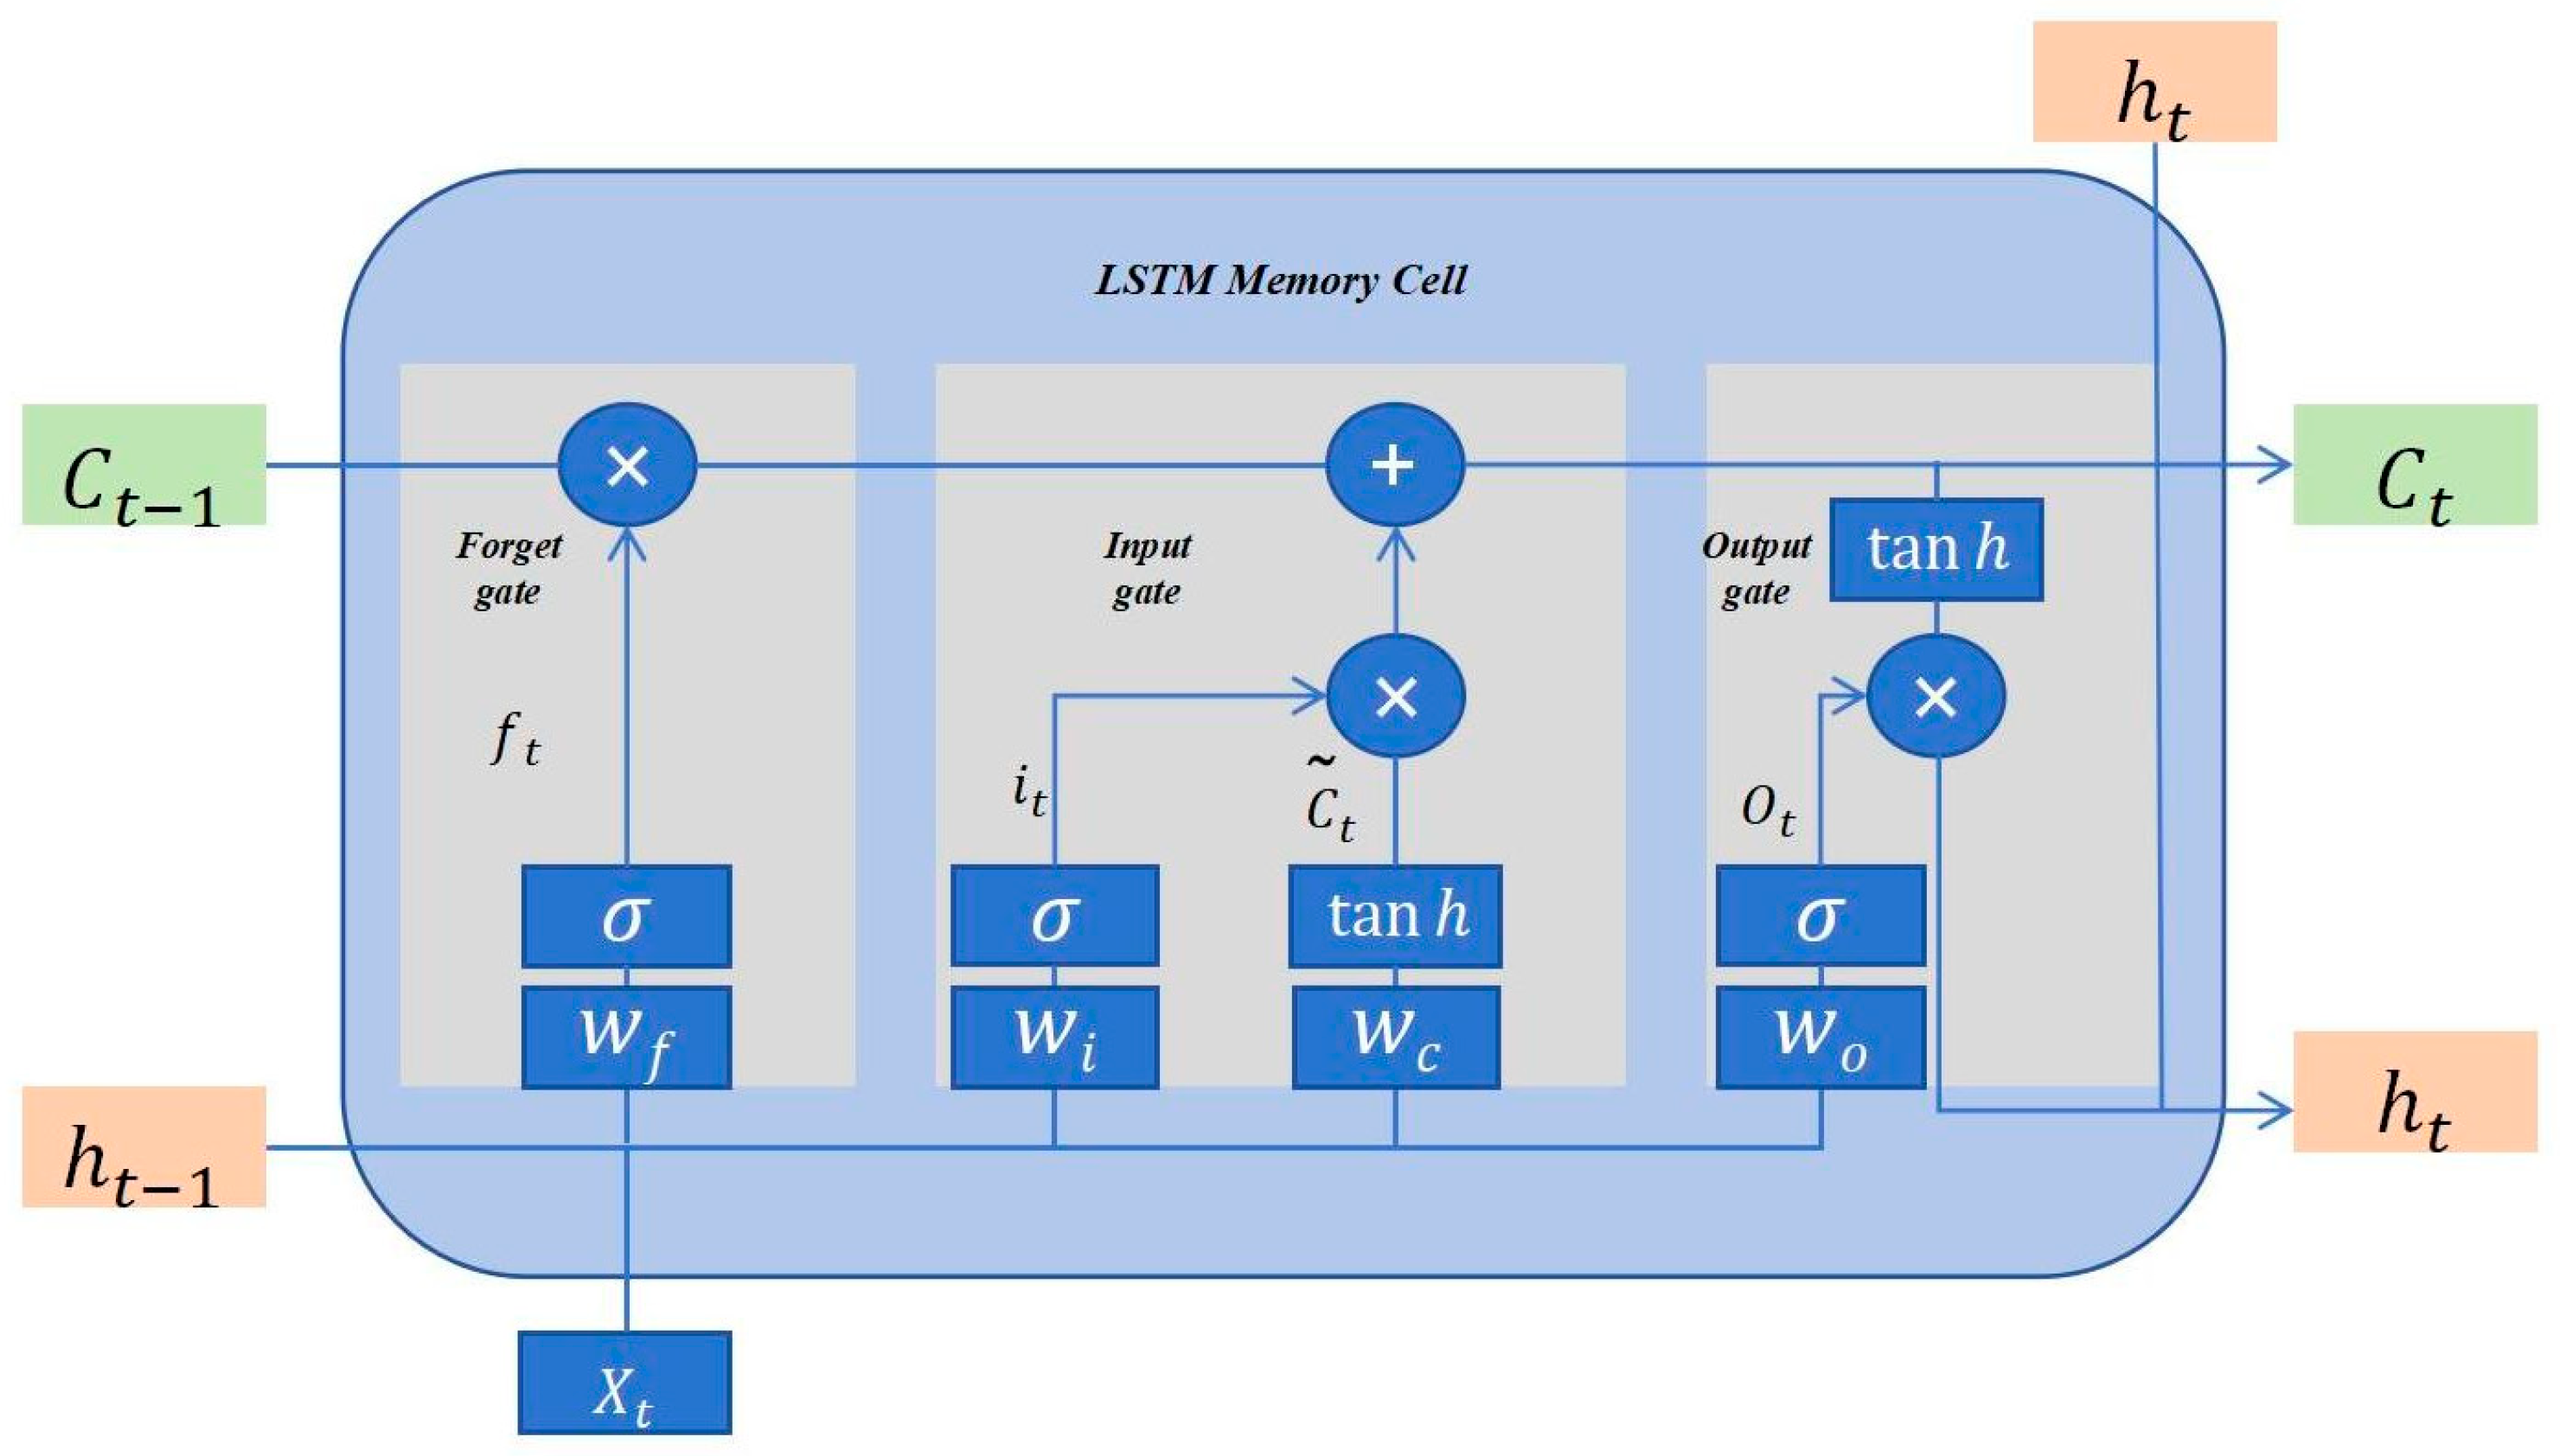
LSTM (Long Short Term Memory) is a deep learning model (Figure 3), consisting of forgetting gates, input gates, output gates, and storage units [40], as a special kind of recurrent neural network can make up for the difficulty of the traditional recurrent neural network RNN (Recurrent Neural Network) to learn long-term dependencies and nonlinear patterns, temporal dependencies, and nonlinear patterns, and is more suitable for dealing with long-term dependencies in sequence data. In this paper, we construct a prediction model of algal-bloom spatial distribution based on LSTM.
For the forget gate
f t = σ W f · h t 1 , x t + b f
where f t denotes the output of the forgetting gate at the current time step t, which is a vector between 0 and 1, with proximity to 1 denoting retention of past information and proximity to 0 denoting forgetting of past information; σ denotes the Sigmoid activation function; W f denotes the weight matrix of the forgetting gate; h t 1 , x t denotes a long vector spliced from the hidden state of the previous time step to the input of the current time step; and b f denotes the bias vector of the forgetting gate.
For the input gate
i t = σ W i · h t 1 , x t + b i
where i t denotes the output of the input gate at the current time step t, which controls the writing of new information into the cell state, with a value domain of [0, 1]; σ denotes the Sigmoid activation function; W i denotes the weight matrix of the input gate; h t 1 , x t denotes a long vector spliced from the hidden state of the previous time step to the input of the current time step; and b i denotes the bias vector of the input gate.
For the cell state update:
C ~ t = tan h W c · h t 1 , x t + b c
where C ~ t denotes the candidate memory content representing the current time step t, a vector of new information ready to be written to the unit state; tan h denotes the hyperbolic tangent function; W c denotes the weight matrix of the candidate state; h t 1 , x t denotes a long vector splicing the hidden state of the previous time step with the inputs of the current time step; and b c denotes the bias vector of the candidate state.
For short-term memory
h t = O t tan h C t
where h t denotes the hidden state of the current time step for passing to the next time step or output layer; O t denotes the control vector of the output gate; and tan h C t denotes the application of a hyperbolic tangent function to the cell state.
For long-term memory
C t = f t · C t 1 + i t · C ~ t
where C t denotes the cell state of the current time step; f t denotes the forget gate output; C t 1 denotes the cell state of the previous time step; i t denotes the input gate output; and C ~ t denotes the candidate memory content of the current time step t.

2.3.6. Geodetector

Geoprobes are used to detect spatial variability and its drivers with fewer constraints, overcoming the limitations of traditional statistical methods in dealing with variables [41,42], as follows:
q = 1 h = 1 L N h σ h 2 N σ 2 = 1 S S W S S T
S S W = h = 1 L N h σ h 2 , S S T = N σ 2
where q is the effect of the characterization driver, with a value range of [0, 1]; q = 0 indicates a random distribution, where the larger the value of q , the stronger the explanatory power of the driver; N h and N are the number of sample units at the next level and the whole study unit, respectively; and σ h 2 and σ 2 are the variance at the next level and the whole study unit, respectively.

2.3.7. Comprehensive Trophic Level Index TLI(Σ)

The integrated trophic state index, TLI(Σ), can be integrated and can comprehensively evaluate the degree of eutrophication of lakes [43]. In this study, Chla, TP, TN, SD, and CODMn were selected as parameters for the evaluation of lake eutrophication [44]:
T L I ( Σ ) = j = 1 m W j × T L I j
where T L I ( Σ ) is the composite trophic state index, W j is the weight associated with the trophic state index of the jth parameter, and T L I j is the trophic state index of the jth parameter [45].
Using Chla as the base parameter, the associated weight for the jth parameter is calculated as
W j = r i j 2 j = 1 m r i j 2
where r i j is the correlation coefficient between the jth parameter and the benchmark parameter Chla, and m is the number of evaluation parameters. r i j 2 and W j are shown in Table 2.
TLI(Chla) = 10(2.5 + 1.086 ln Chla)
TLI(TP) = 10(9.436 + 1.624 ln TP)
TLI(TN) = 10(5.453 + 1.694 ln TN)
TLI(SD) = 10(5.118 − 1.94 ln SD)
TLI(CODMn) = 10(0.109 + 2.661 ln CODMn)
where T N , T P , and C O D M n are in mg/L; C h l a is in mg/m3; and S D is in m.

3. Results

3.1. Analysis of Lake Bosten Area Extraction and Area Change

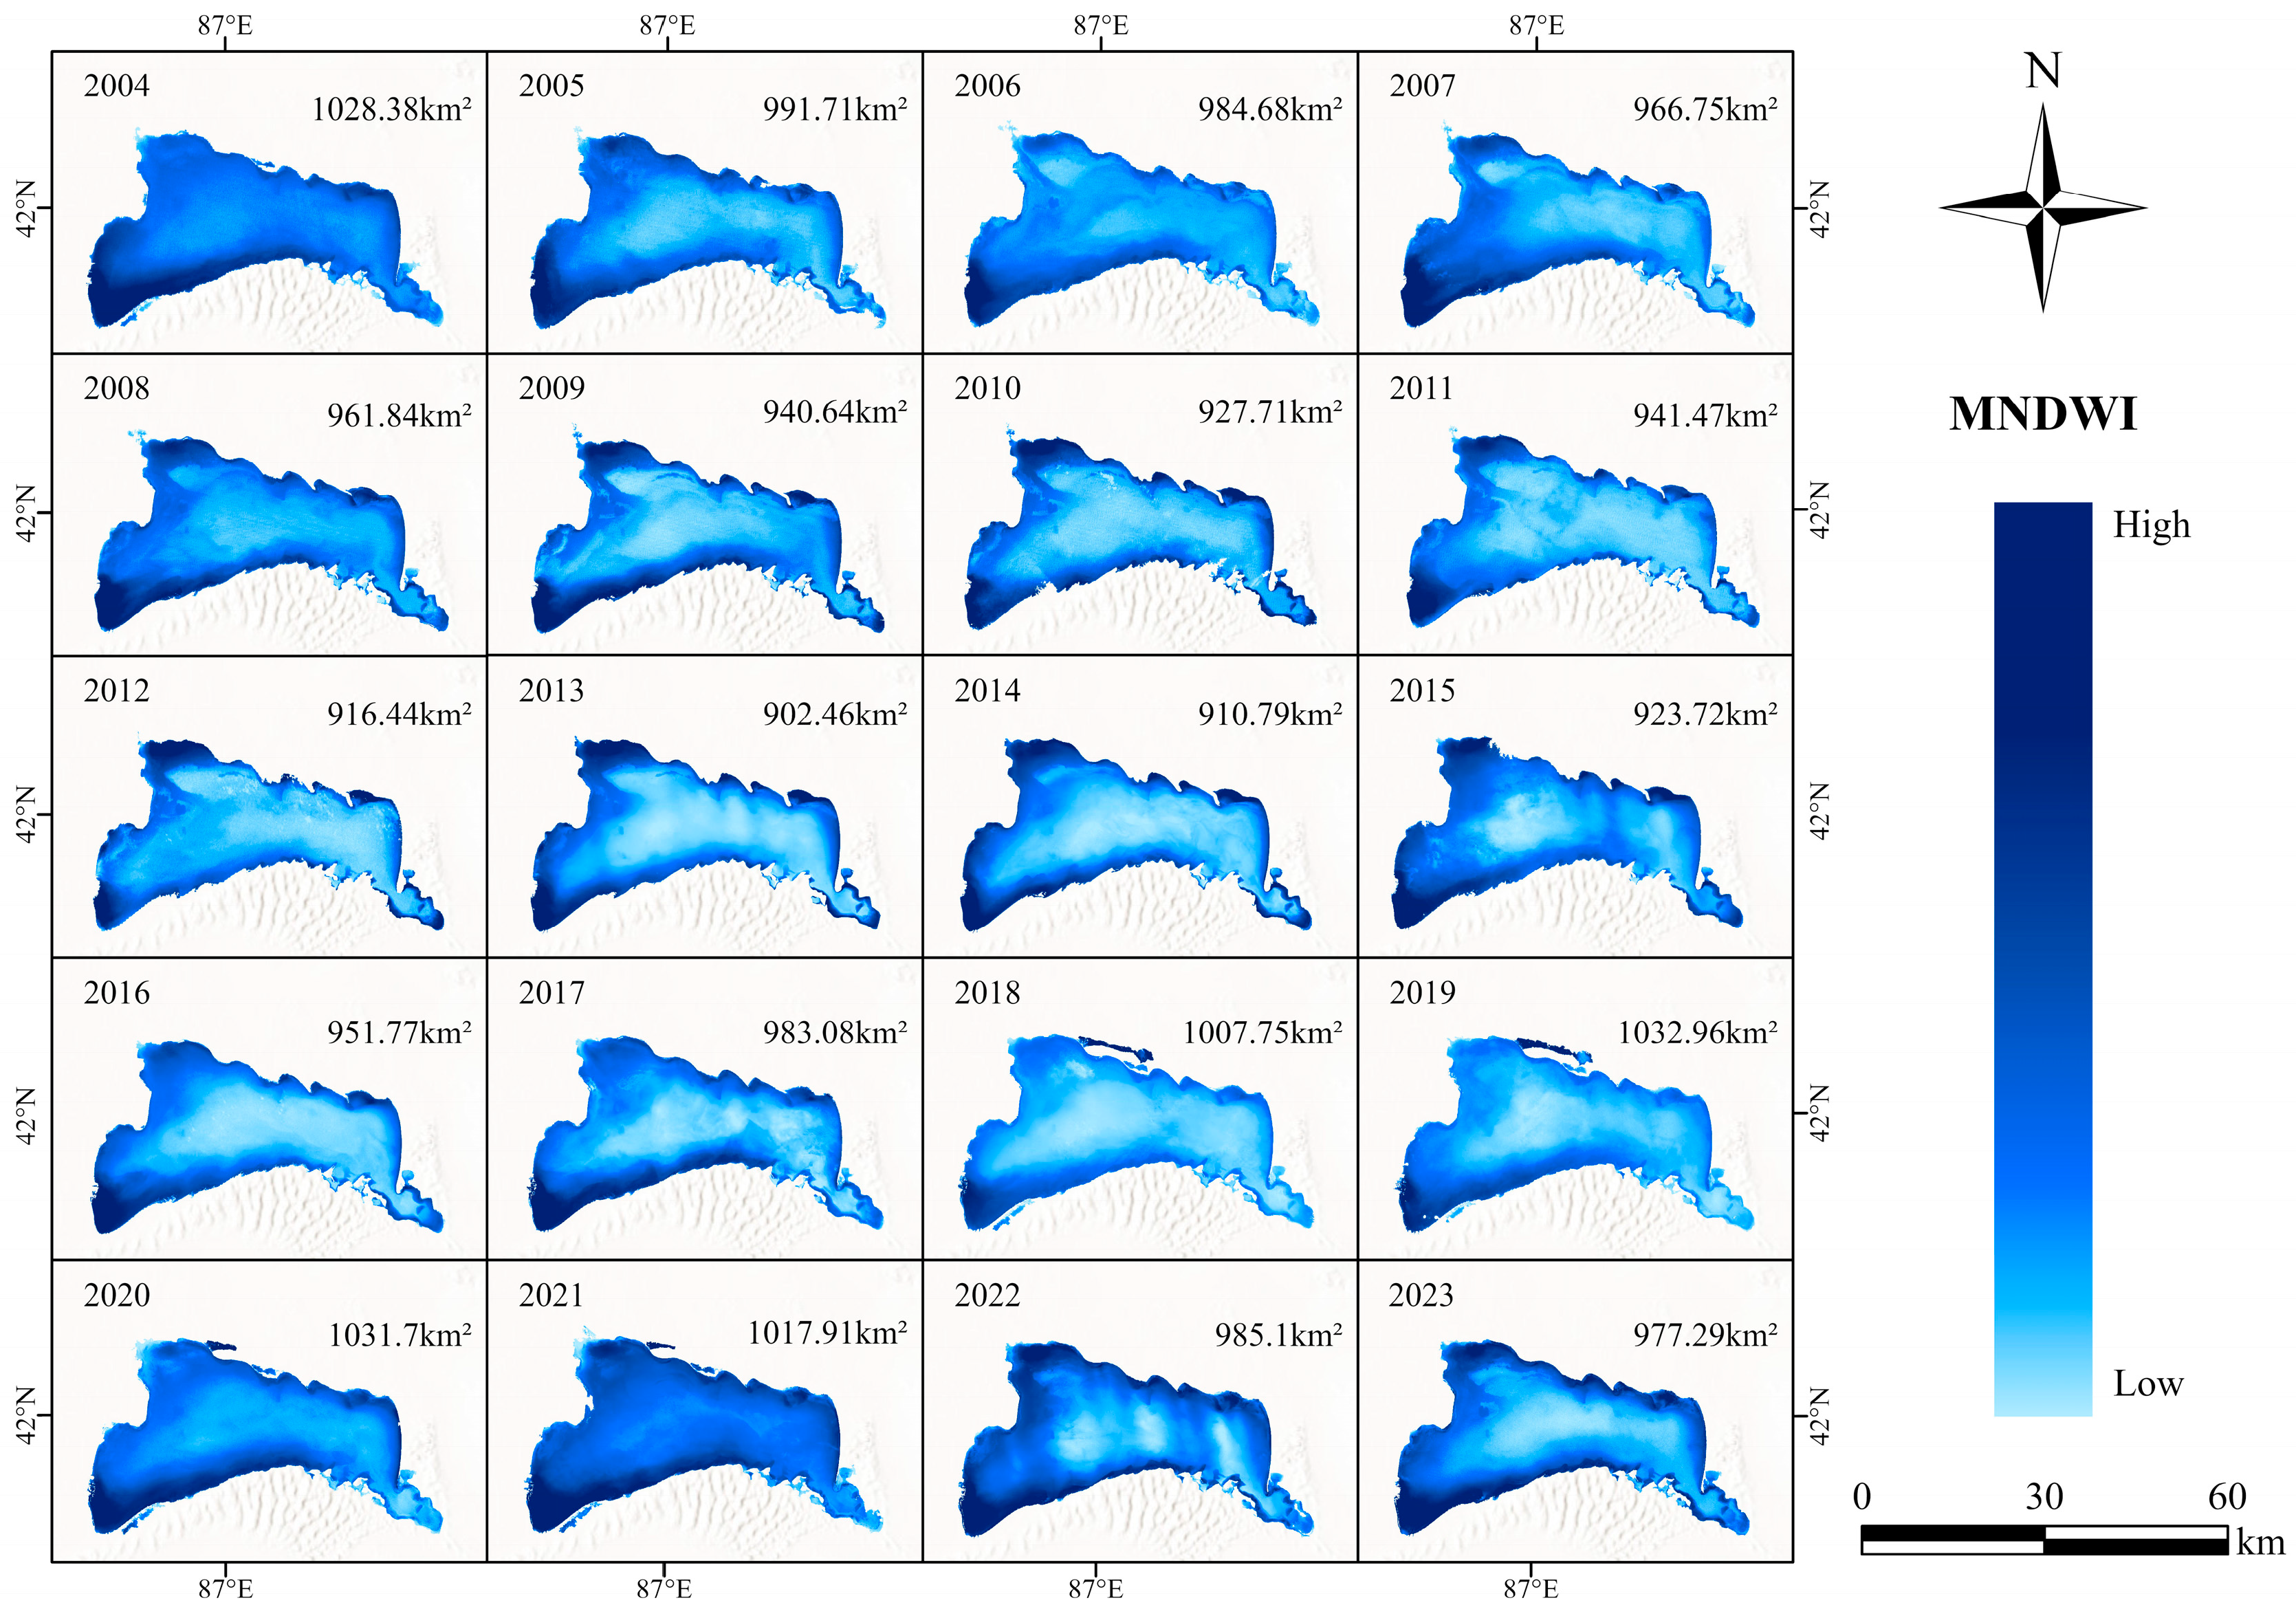
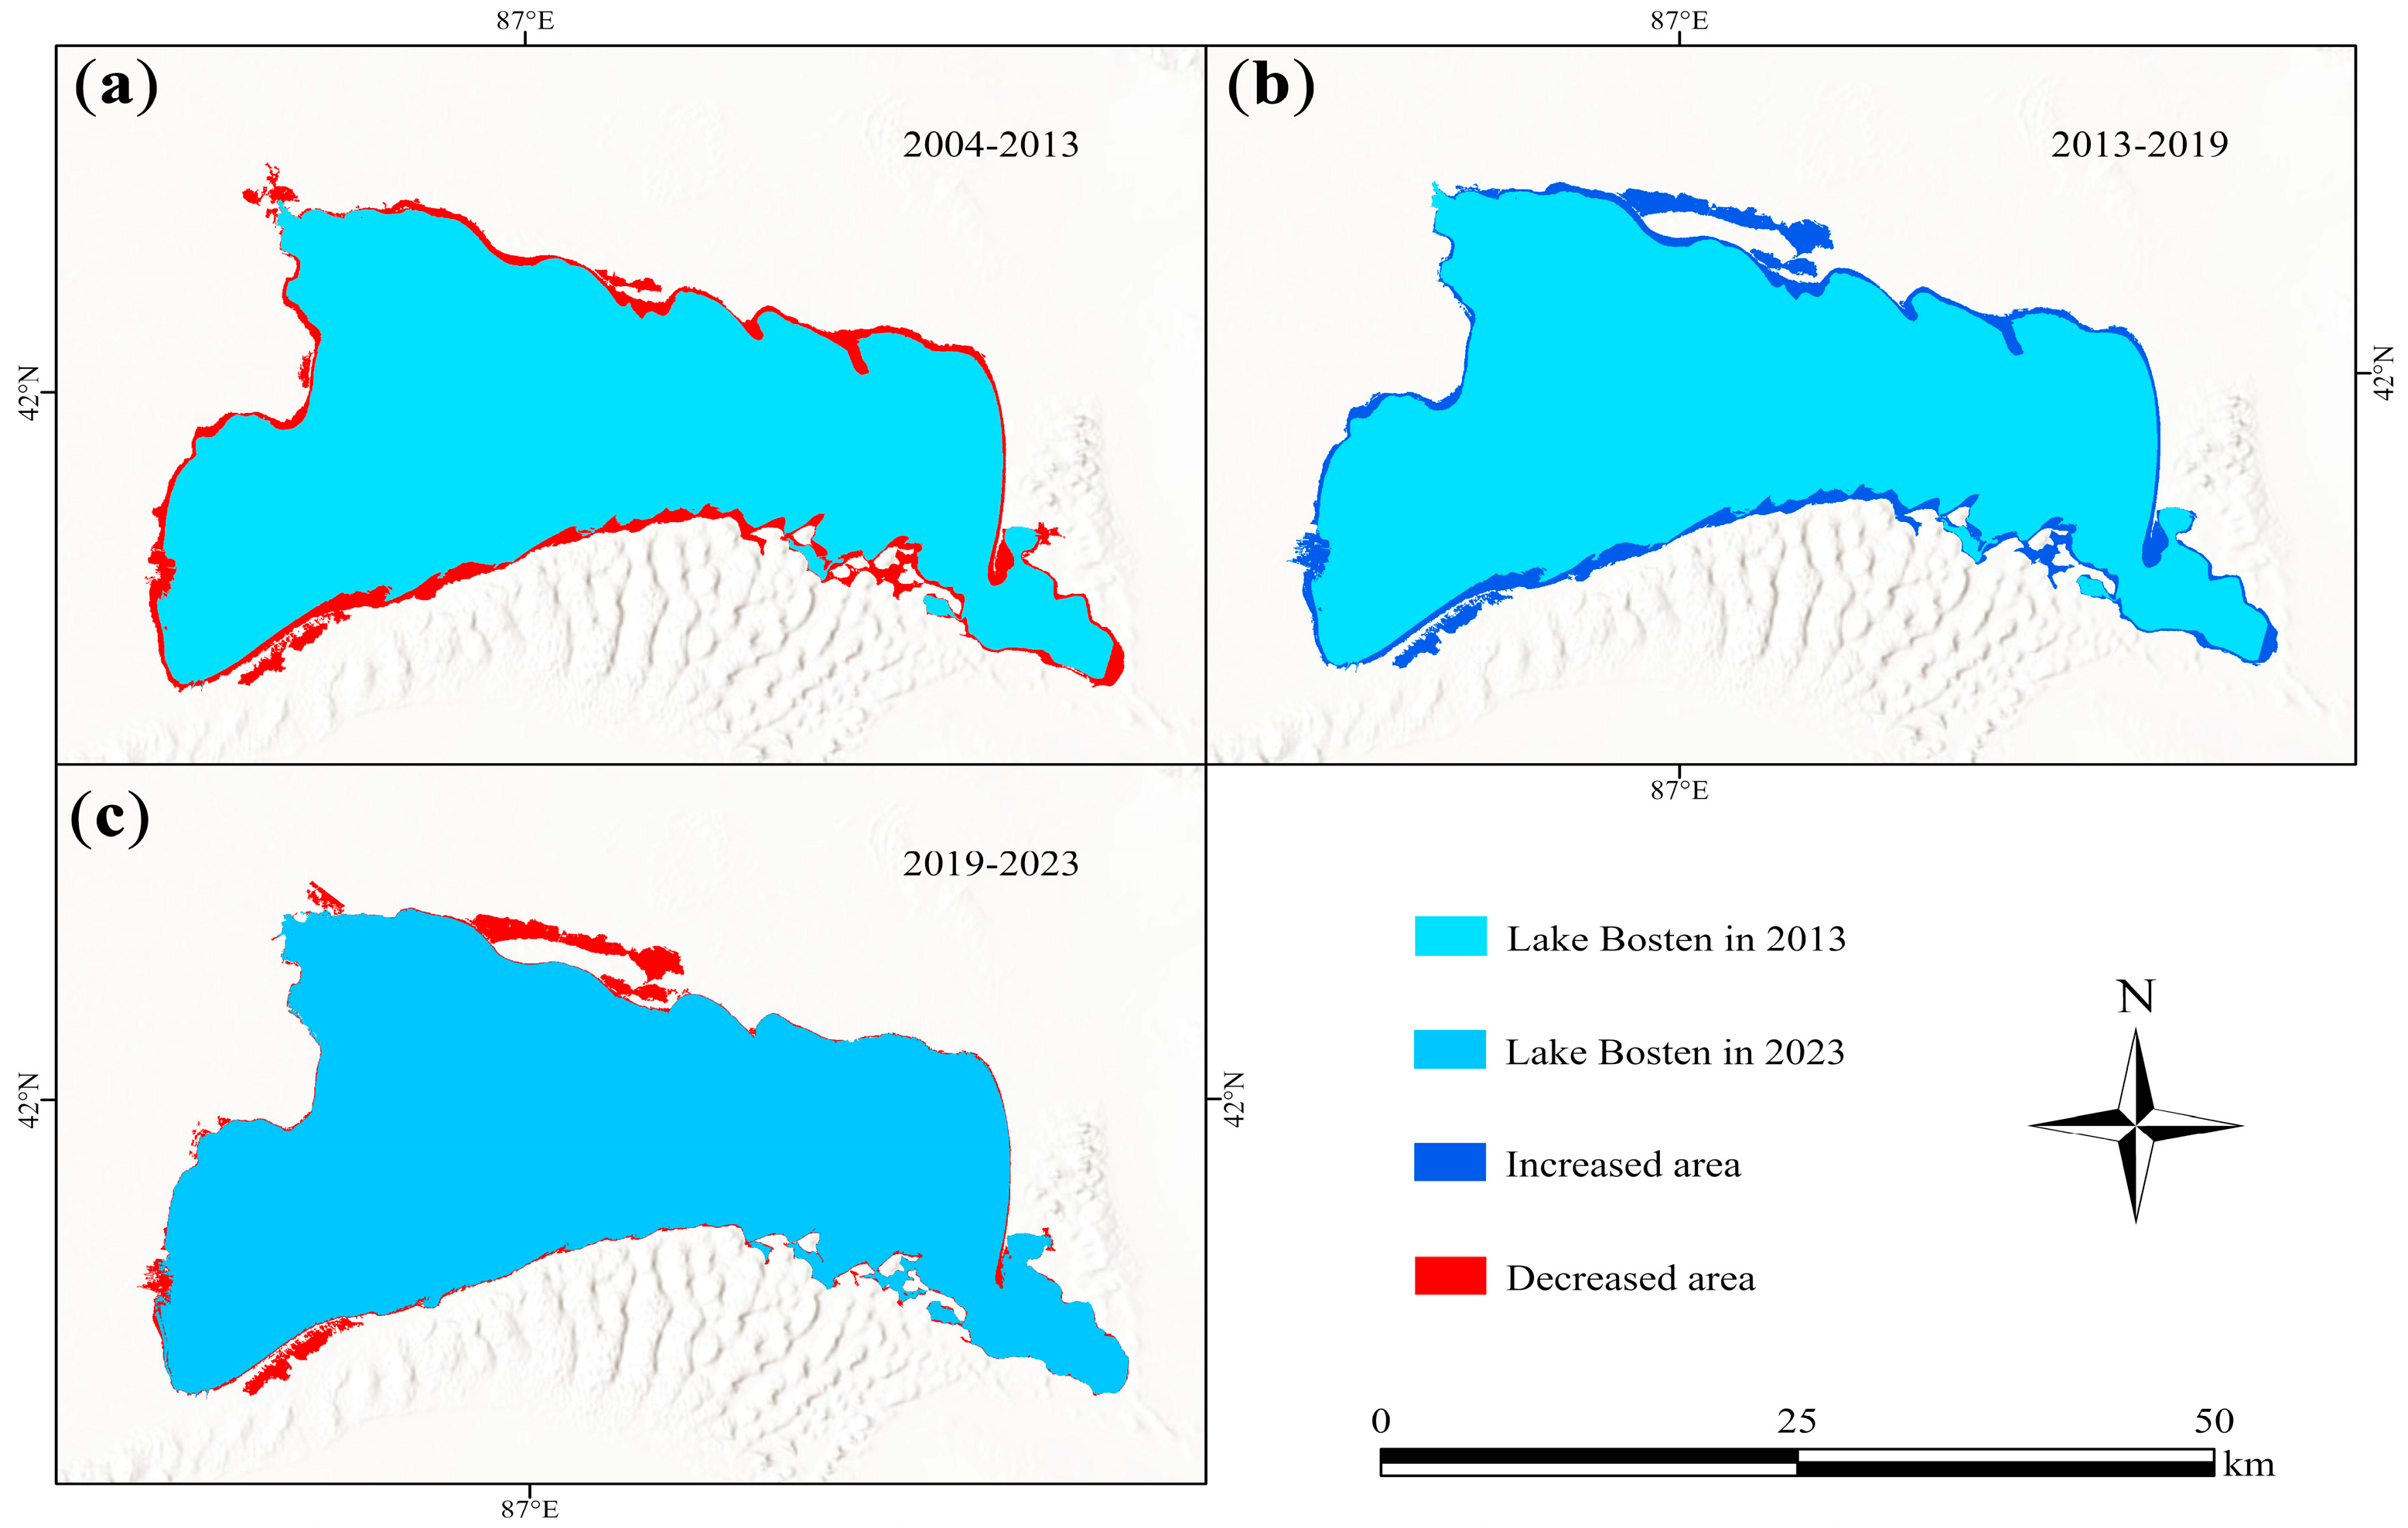
Using the Landsat series of images from 2004 to 2023, the lake-water information of Lake Bosten was extracted month by month based on the (MNDWI), and the water area was calculated for each month. The mean value of the sum of the lake area of each month of each year was used to represent the lake area of that year (Figure 4). Figure 4 shows that the change in the water can be roughly divided into three phases. In Phase 1 (2004–2013), the water area decreased, with a reduction of 125.92 km2 and a dynamic rate of change of −1.2%. The continuous shrinkage of the lake’s water body led to the drying up of some of the connected small lakes, and the water area dropped to 902.46 km2 by 2013. In Phase 2 (2013–2019), the lake area grew with an increase of 130.5 km2 and a dynamic rate of change of 2%. By 2019, the lake area was 1032.96 km2, with connected small lakes receiving a source of recharge water. In Phase 3 (2019–2023), the lake area shrank by a total of 55.67 km2 at a dynamic rate of change of −1%. The lake area was reduced to 977.29 km2 by 2023. Throughout the entire study period, the difference between the maximum and minimum lake area was 130.5 km2, with an average annual lake area of 969.21 km2. The lake area was generally lower than the annual average during 2007–2016.
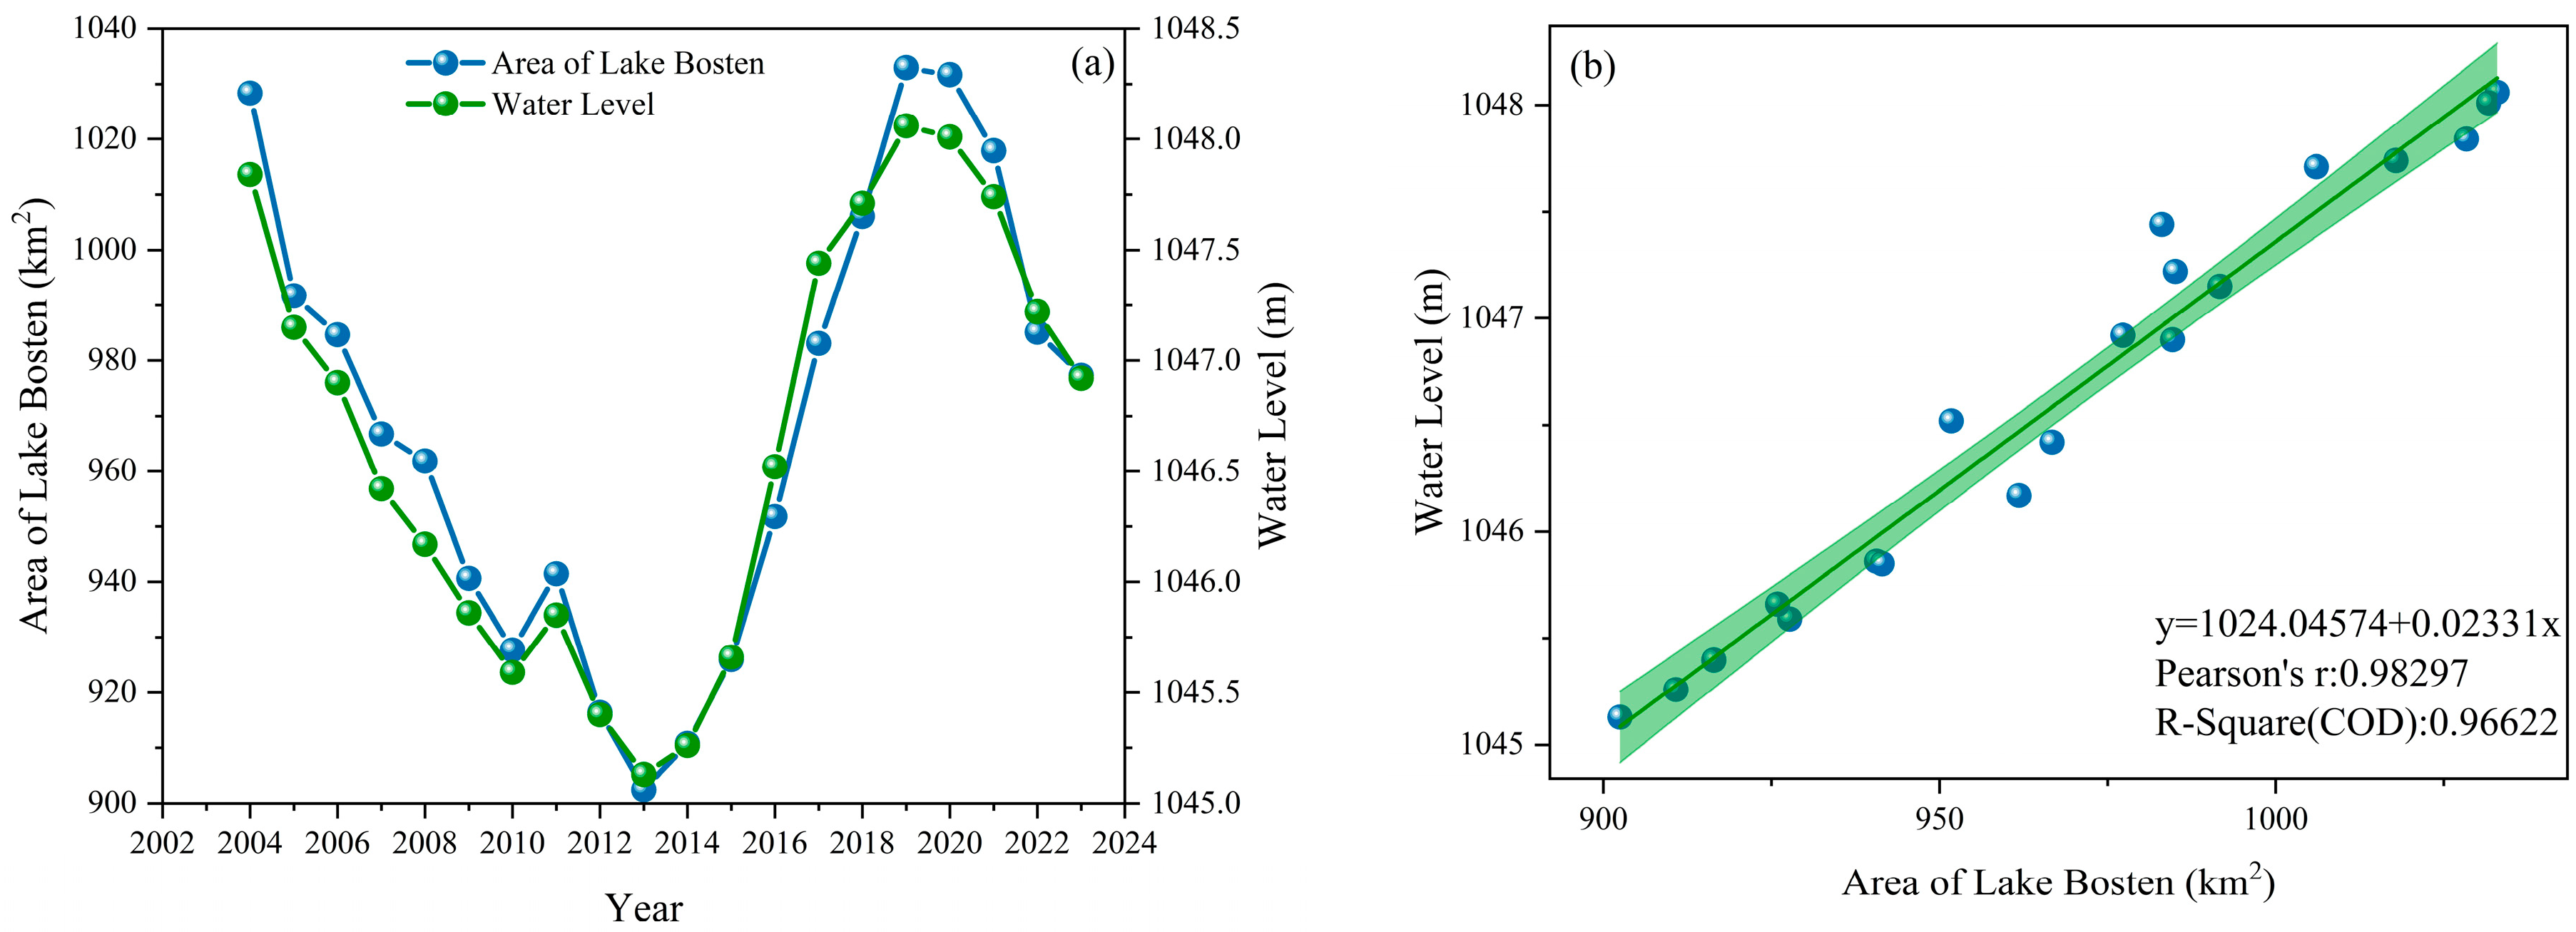
As can be seen in Figure 5, the extracted lake area during 2004–2023 is highly consistent with the trend of measured water-level changes, with a Pearson’s correlation coefficient of 0.98 and a coefficient of determination (R2) of 0.97, which indicates that the results of the lake-area extraction have a high degree of reliability.

3.2. Characteristics of the Spatiotemporal Distribution of Algal Blooms in Lake Bosten

3.2.1. Spatiotemporal Variability of Algal Blooms

A total of 240 Landsat series images and 192 Sentinel-2 images were downloaded for the period 2004 to 2023. The algal blooms in Lake Bosten were extracted from these images. The acquired AFAI data were then processed and statistically analyzed to reveal the spatiotemporal characteristics of the blooms.
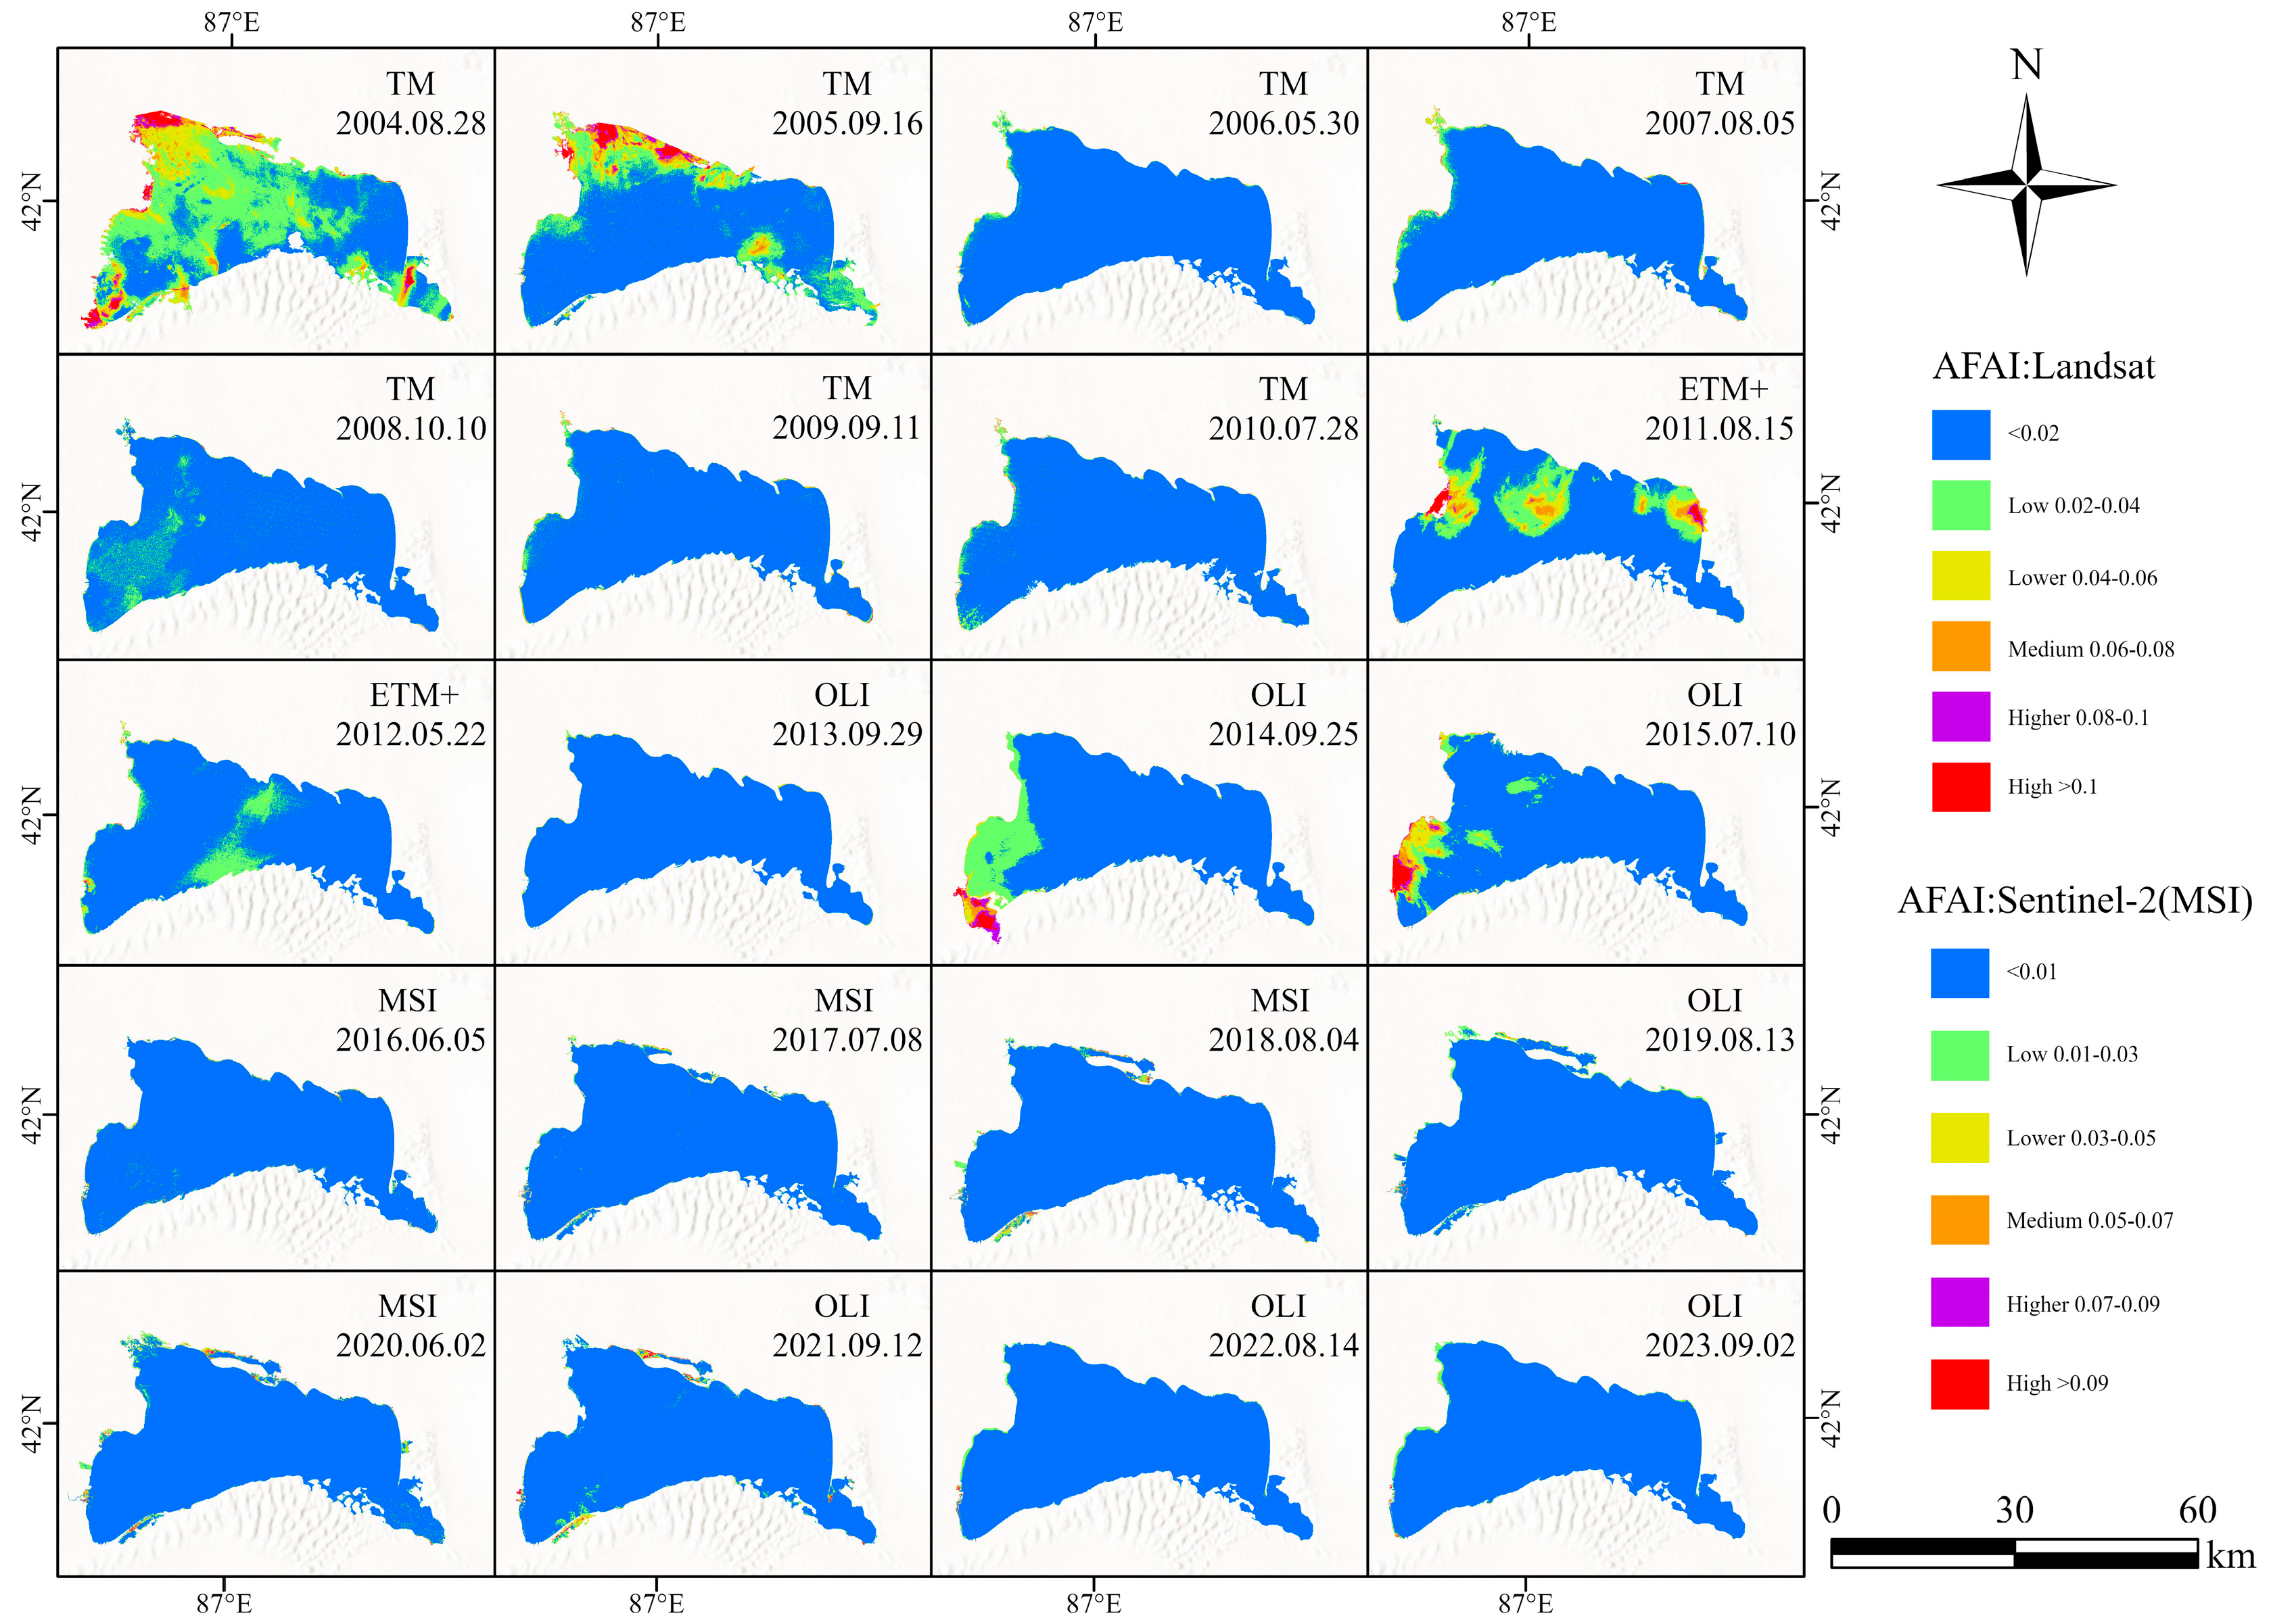
Figure 6 illustrates the AFAI grading of the maximum area covered by algal blooms for each year of the study period, keeping in mind that the AFAI values can reflect the risk level of algal blooms to some extent. As seen in the figure, the largest area covered by algal blooms was 675.5 km2, which occurred on 28 August 2004, and which accounted for 65.69% of the total area of the lake. On 16 September 2005, a smaller bloom measuring 304.56 km2 occurred, accounting for 30.71% of the total area. On 15 August 2011, algal blooms appeared in the western, central, and northeastern parts of the lake, covering 244.95 km2 and accounting for 26.02% of the total lake area. Nearly one year later, on 22 May 2012, an algal bloom measuring 100.58 km2 appeared in the central part of the lake, accounting for 10.98% of the total area. In addition, on 25 September 2014 and on 10 July 2015, large algal blooms were observed in the southwestern part of the lake, covering an area of 162.61 km2 (17.85%) and 123.29 km2 (13.35%), respectively.
Overall, as demonstrated in Figure 6, the algal blooms occurring in Lake Bosten during 2004–2023 were mainly dominated by low-risk grade blooms. It is worth noting that no large-scale algal blooms occurred between 2016 and 2023, indicating that the water-quality condition of the lake had substantially improved.

3.2.2. Trends in the Area Coverage of Algal Blooms at Different Levels of Risk

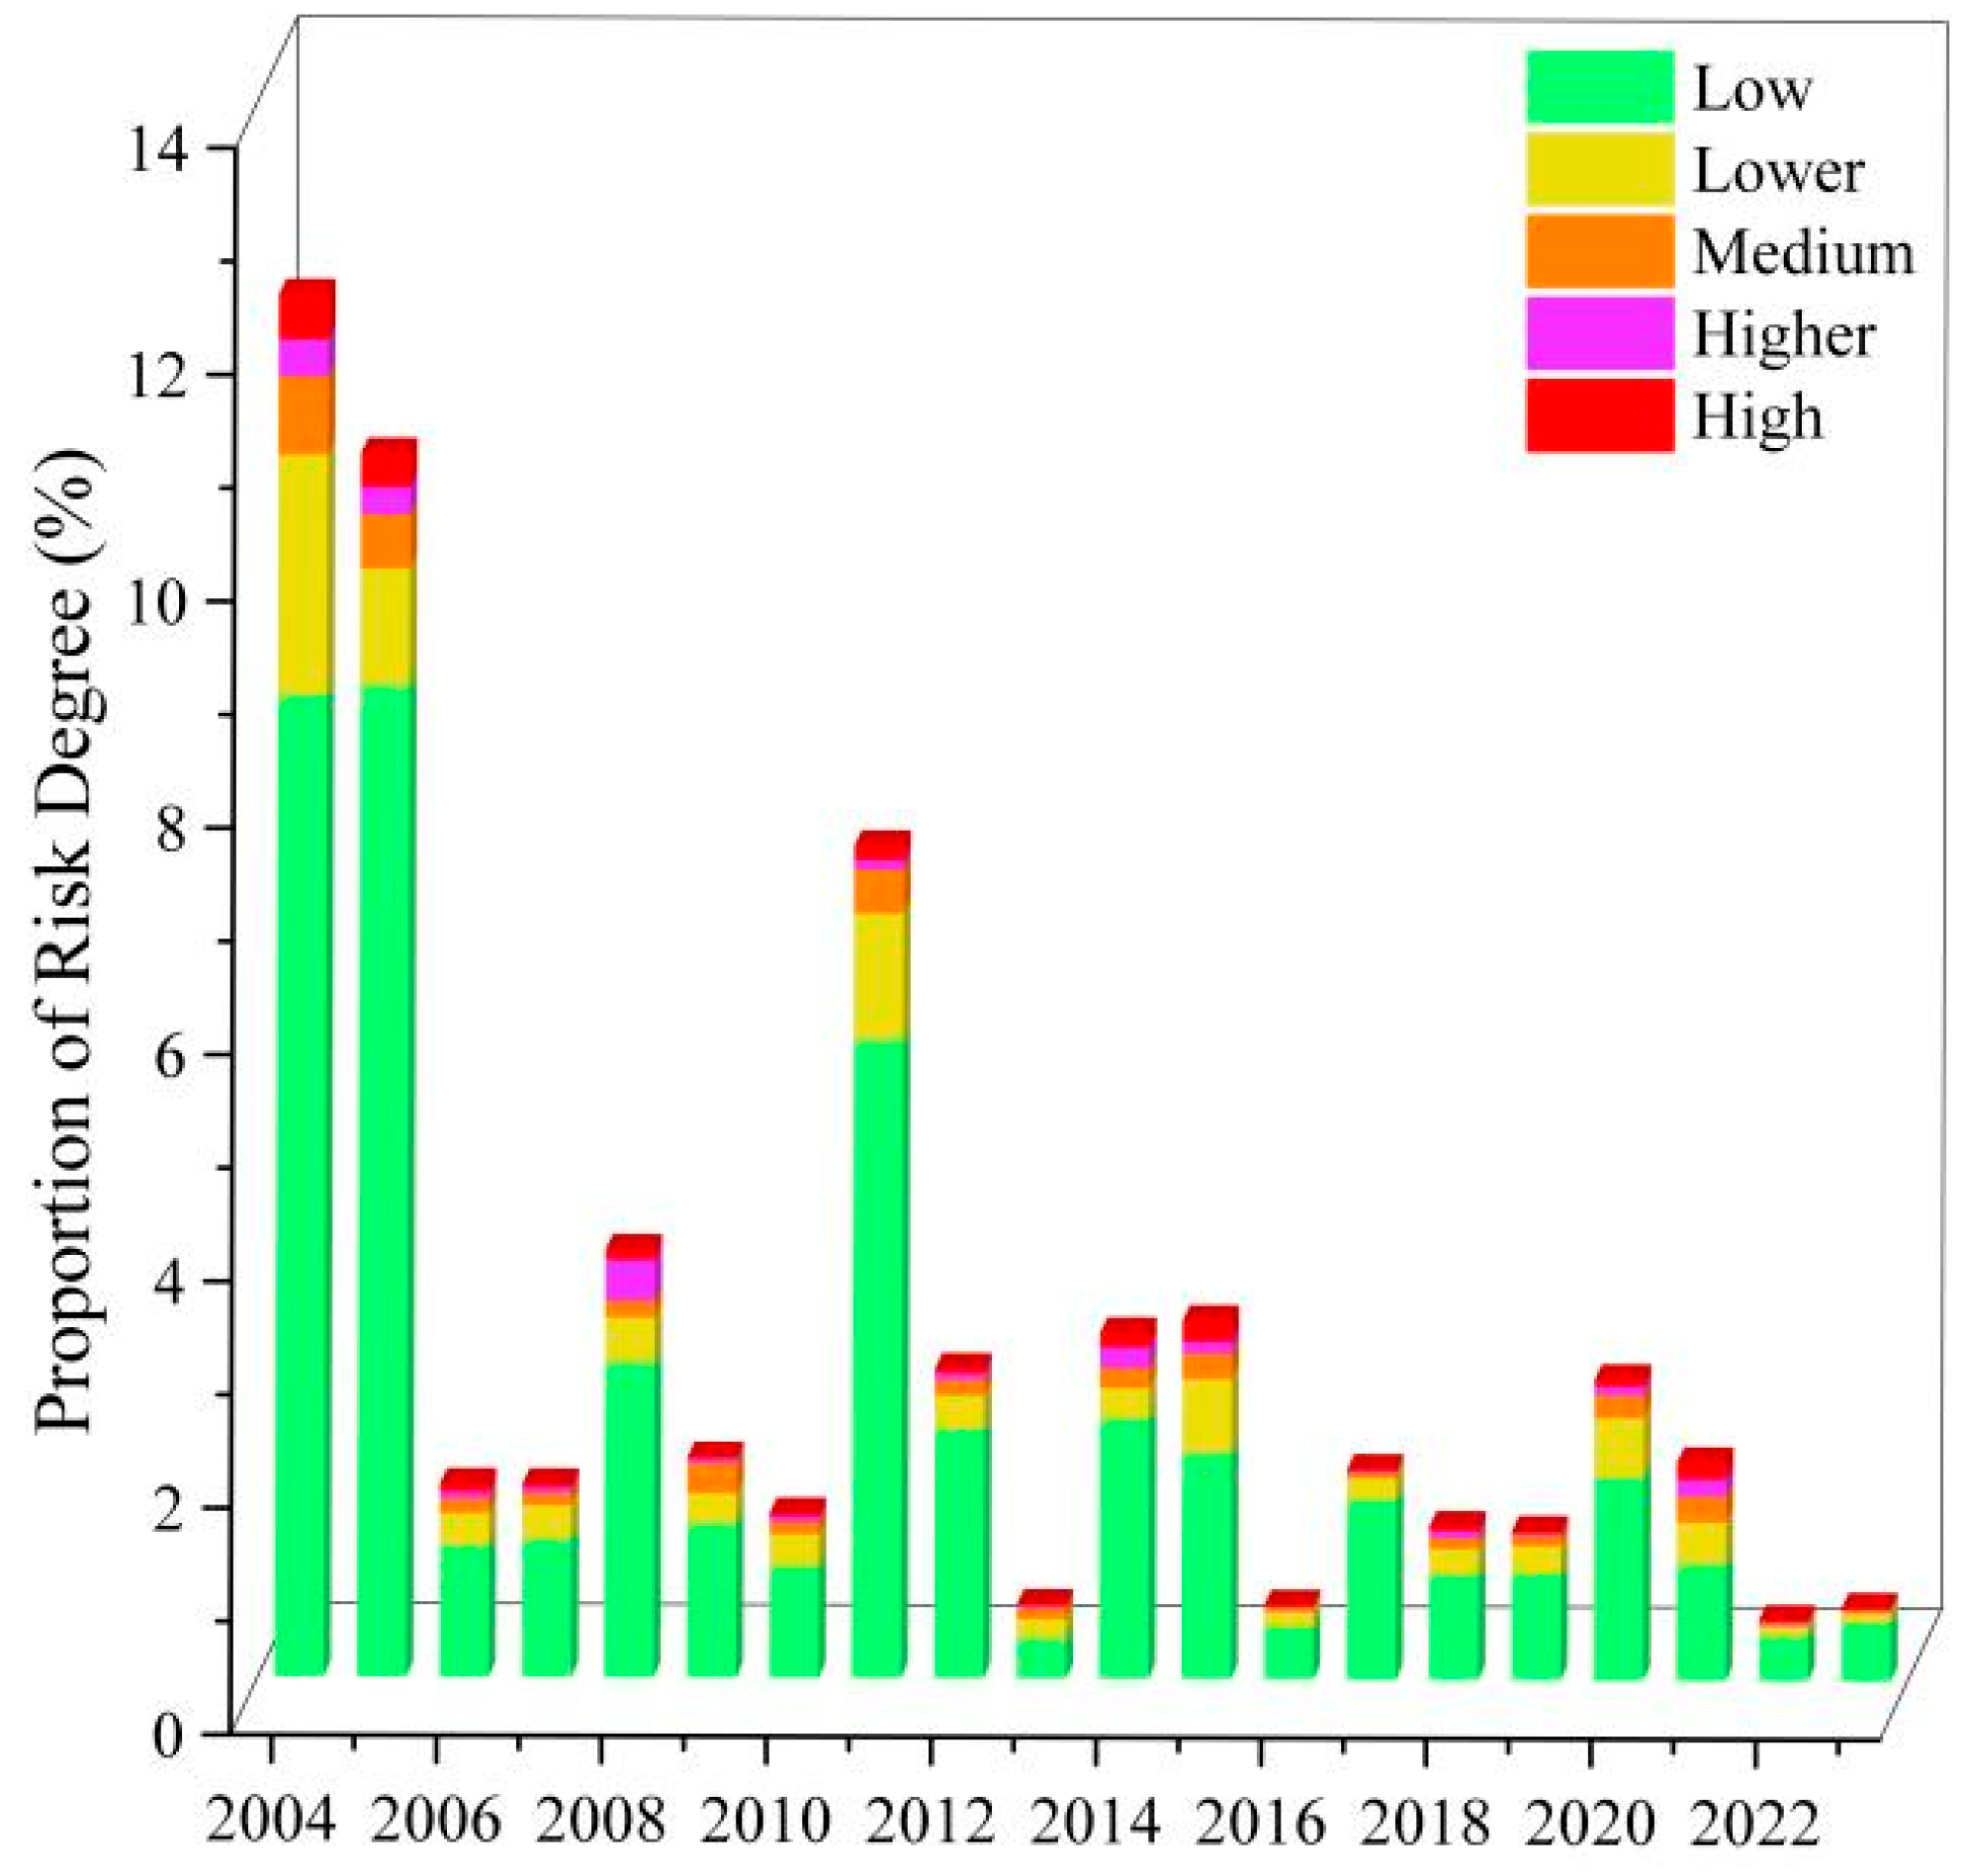
Based on the results of the statistical analyses of the AFAI data, the interannual risk classes of algal blooms in Lake Bosten were classified for the years 2004 to 2023. The results showed that the lake was mainly dominated by low-risk class algal blooms during that period. The percentage of area covered by lower-risk blooms was less than 1% for all years except 2004, 2005, and 2011, when it was 2.12%, 1.03%, and 1.12%, respectively. The average annual percentage of area covered by medium-, higher-, and high-risk algal blooms did not exceed 1% throughout the study period (Figure 7).
In terms of the overall area covered by algal blooms, 2004 experienced the highest level of risk, with blooms accounting for 12.2% of the total lake area. Of this area, the proportion of low-risk algal blooms was 8.66%. In 2005, the proportion of the area covered by algal blooms was 10.8%, of which the proportion of low-risk blooms was 8.75%, while in 2011, the proportion of the area covered by algal blooms was 7.35% and the proportion of low-risk blooms was 5.63%. In the remaining years, the percentage of area covered by algal blooms was less than 4%, indicating that the bloom outbreaks in Lake Bosten were relatively mild in most years and that the ecological risk was generally within a controllable range.
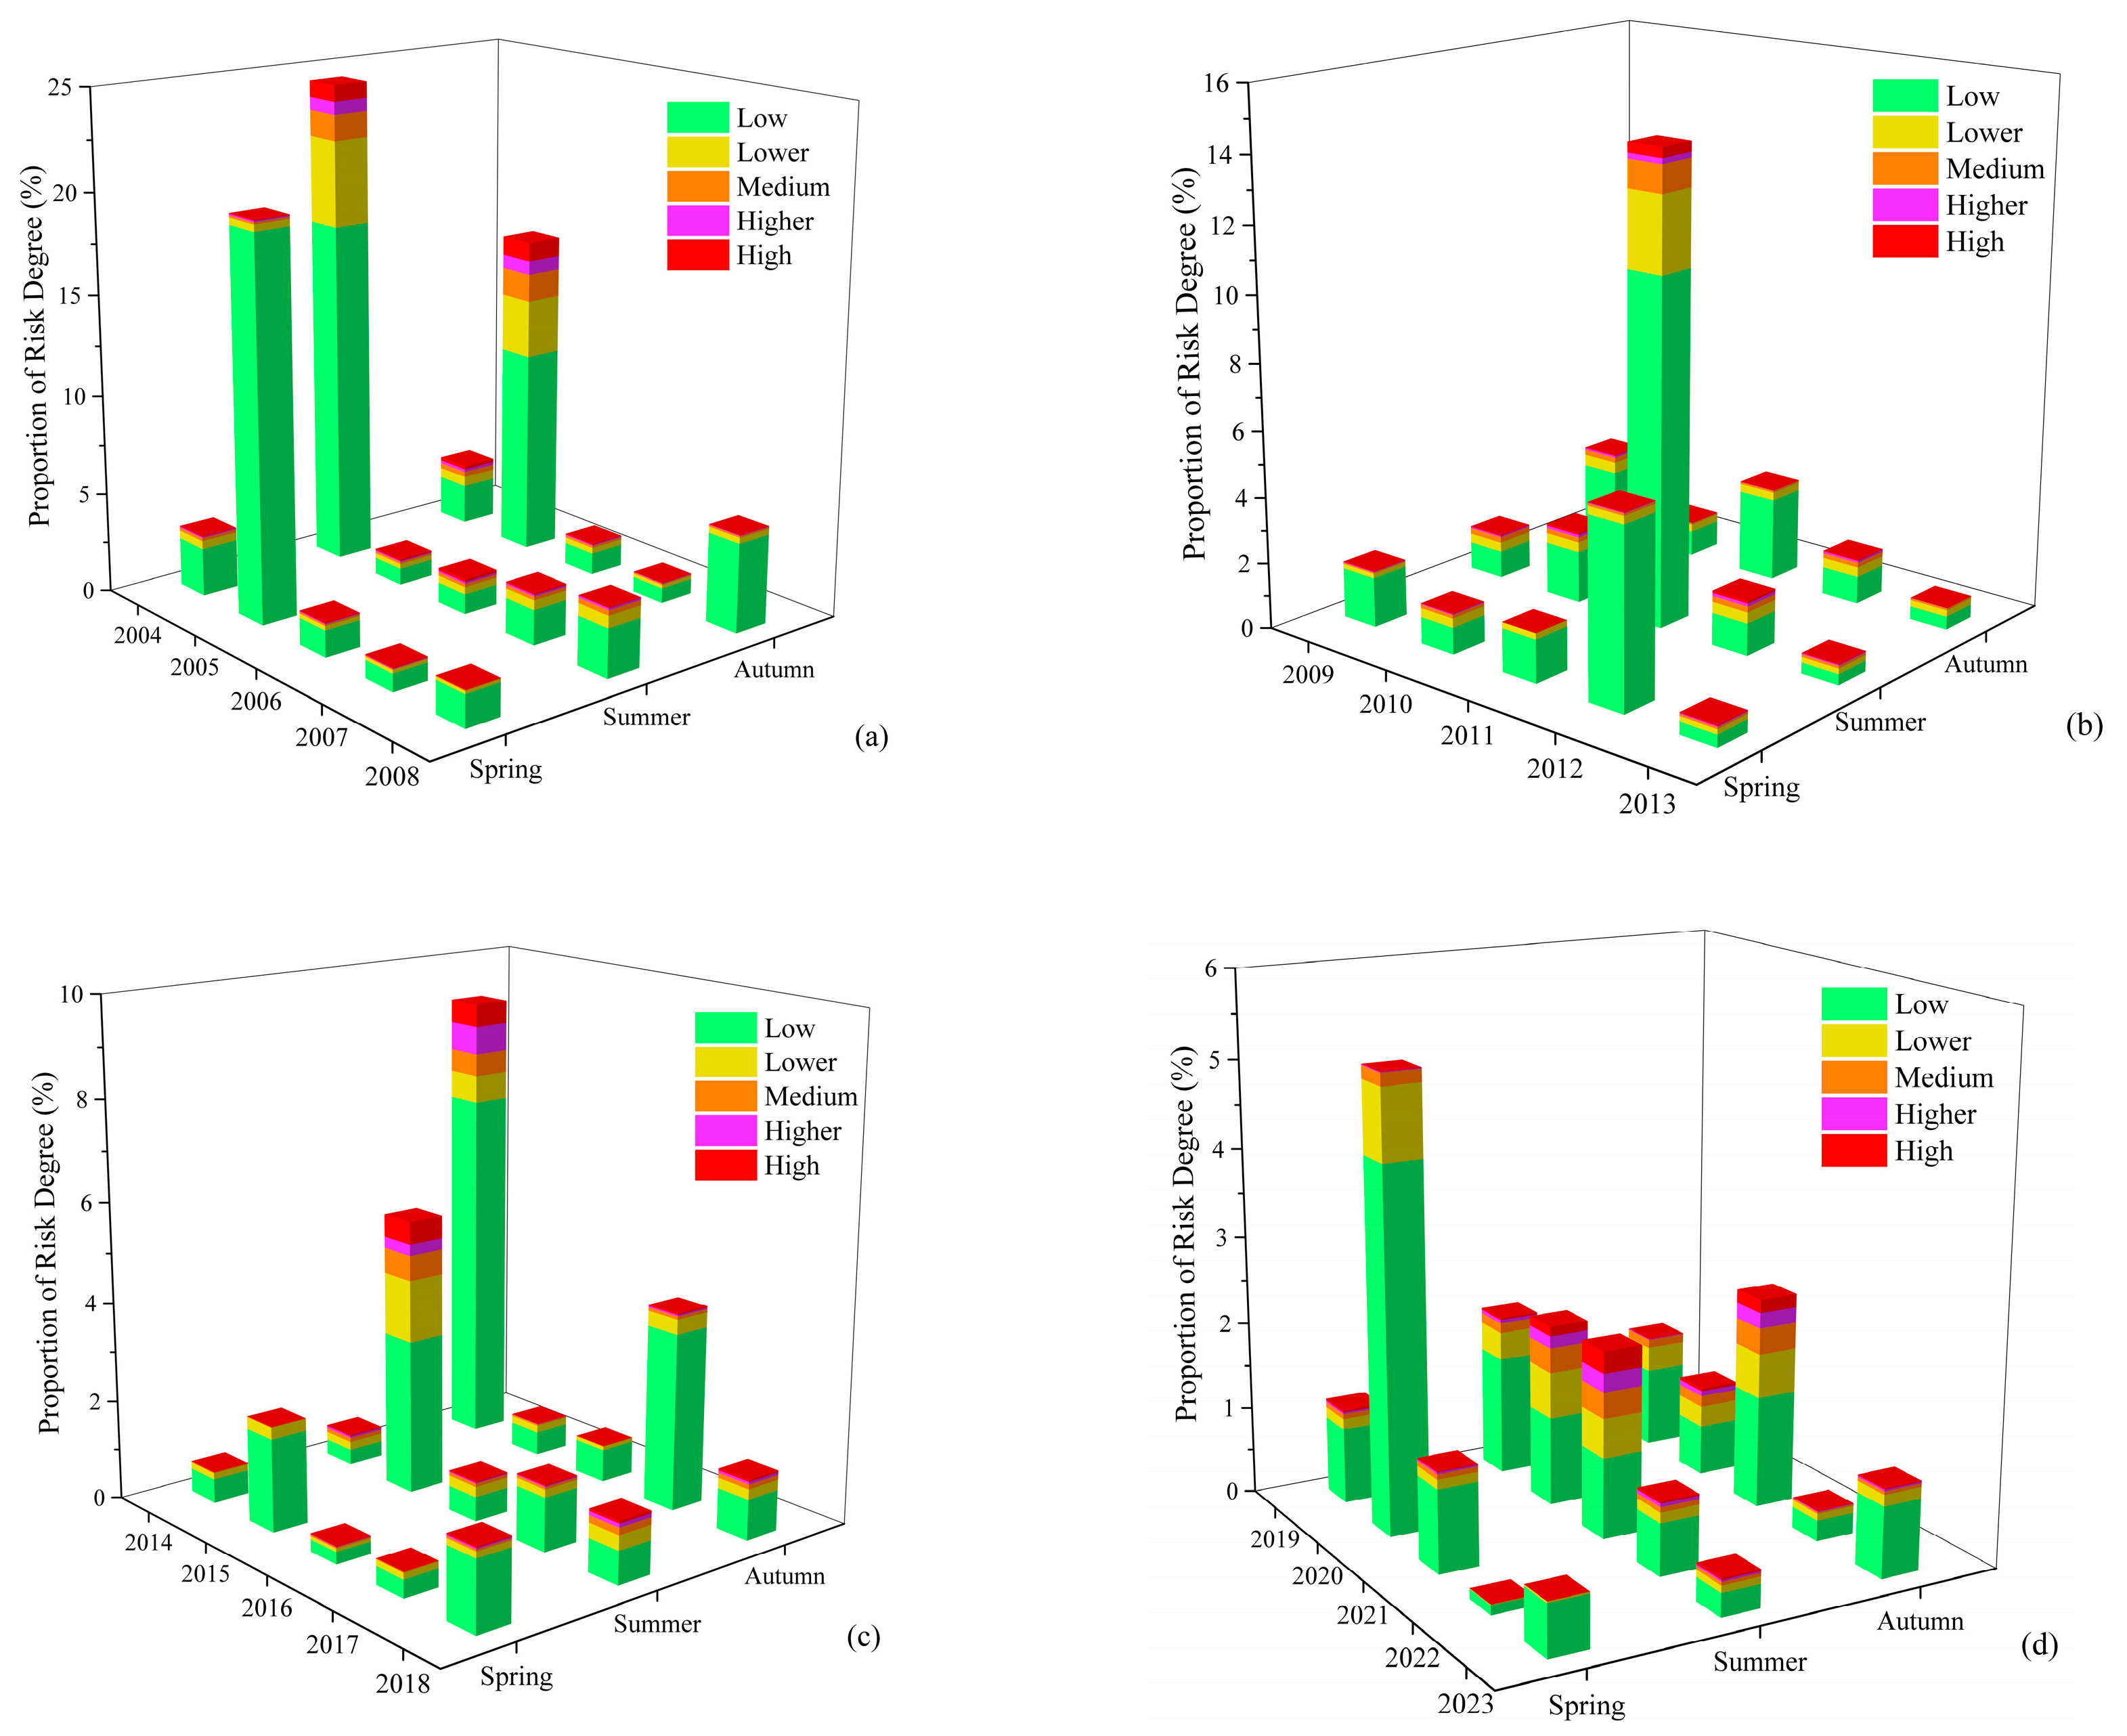
Using the results of the statistical analyses of the AFAI data, we classified the seasonal algal-bloom risk level for the entire study period. The results showed that the area covered by algal blooms with medium and higher risk levels was substantially larger in summer and autumn than in spring, reflecting the fact that the lake has more serious algal-bloom problems in summer and autumn (Figure 8). Specifically, the area covered by algal blooms in the summer of 2004 was 24.34% of the total lake area, of which 17.27% were low-risk blooms, 4.33% were lower-risk, 1.3% were medium-risk, 0.63% were higher-risk, and 0.81% were high-risk. In the spring of 2005, 19.69% of the area was covered by algal blooms, but low-risk blooms predominated, accounting for 19.12% of the area, while medium- and high-risk blooms accounted for less than 1%. In the autumn of the same year, 16.17% of the area was covered by blooms, of which 3.03% were medium- and higher-risk. In the summer of 2011, algal blooms accounted for 14.23% of the total lake area, of which the proportion of low-risk blooms was 10.57%, and the combined proportion of medium- and higher-risk blooms was 1.33%. In the remaining years, the proportion of the area covered by blooms in each season did not exceed 10%.
A comprehensive analysis of the proportion of the area covered by different risk classes of inter-annual and seasonal algal blooms indicates a significant downward trend. In recent years, algal blooms were mostly dominated by low-risk grades and the proportion of their covered area was low, indicating that the lake’s degree of eutrophication has been reduced and the water-quality condition has improved to a certain extent. This change reflects that the measures taken in recent years in watershed management and ecological restoration of water bodies have begun to bear fruit.

3.2.3. Average Area Covered by Algal Blooms

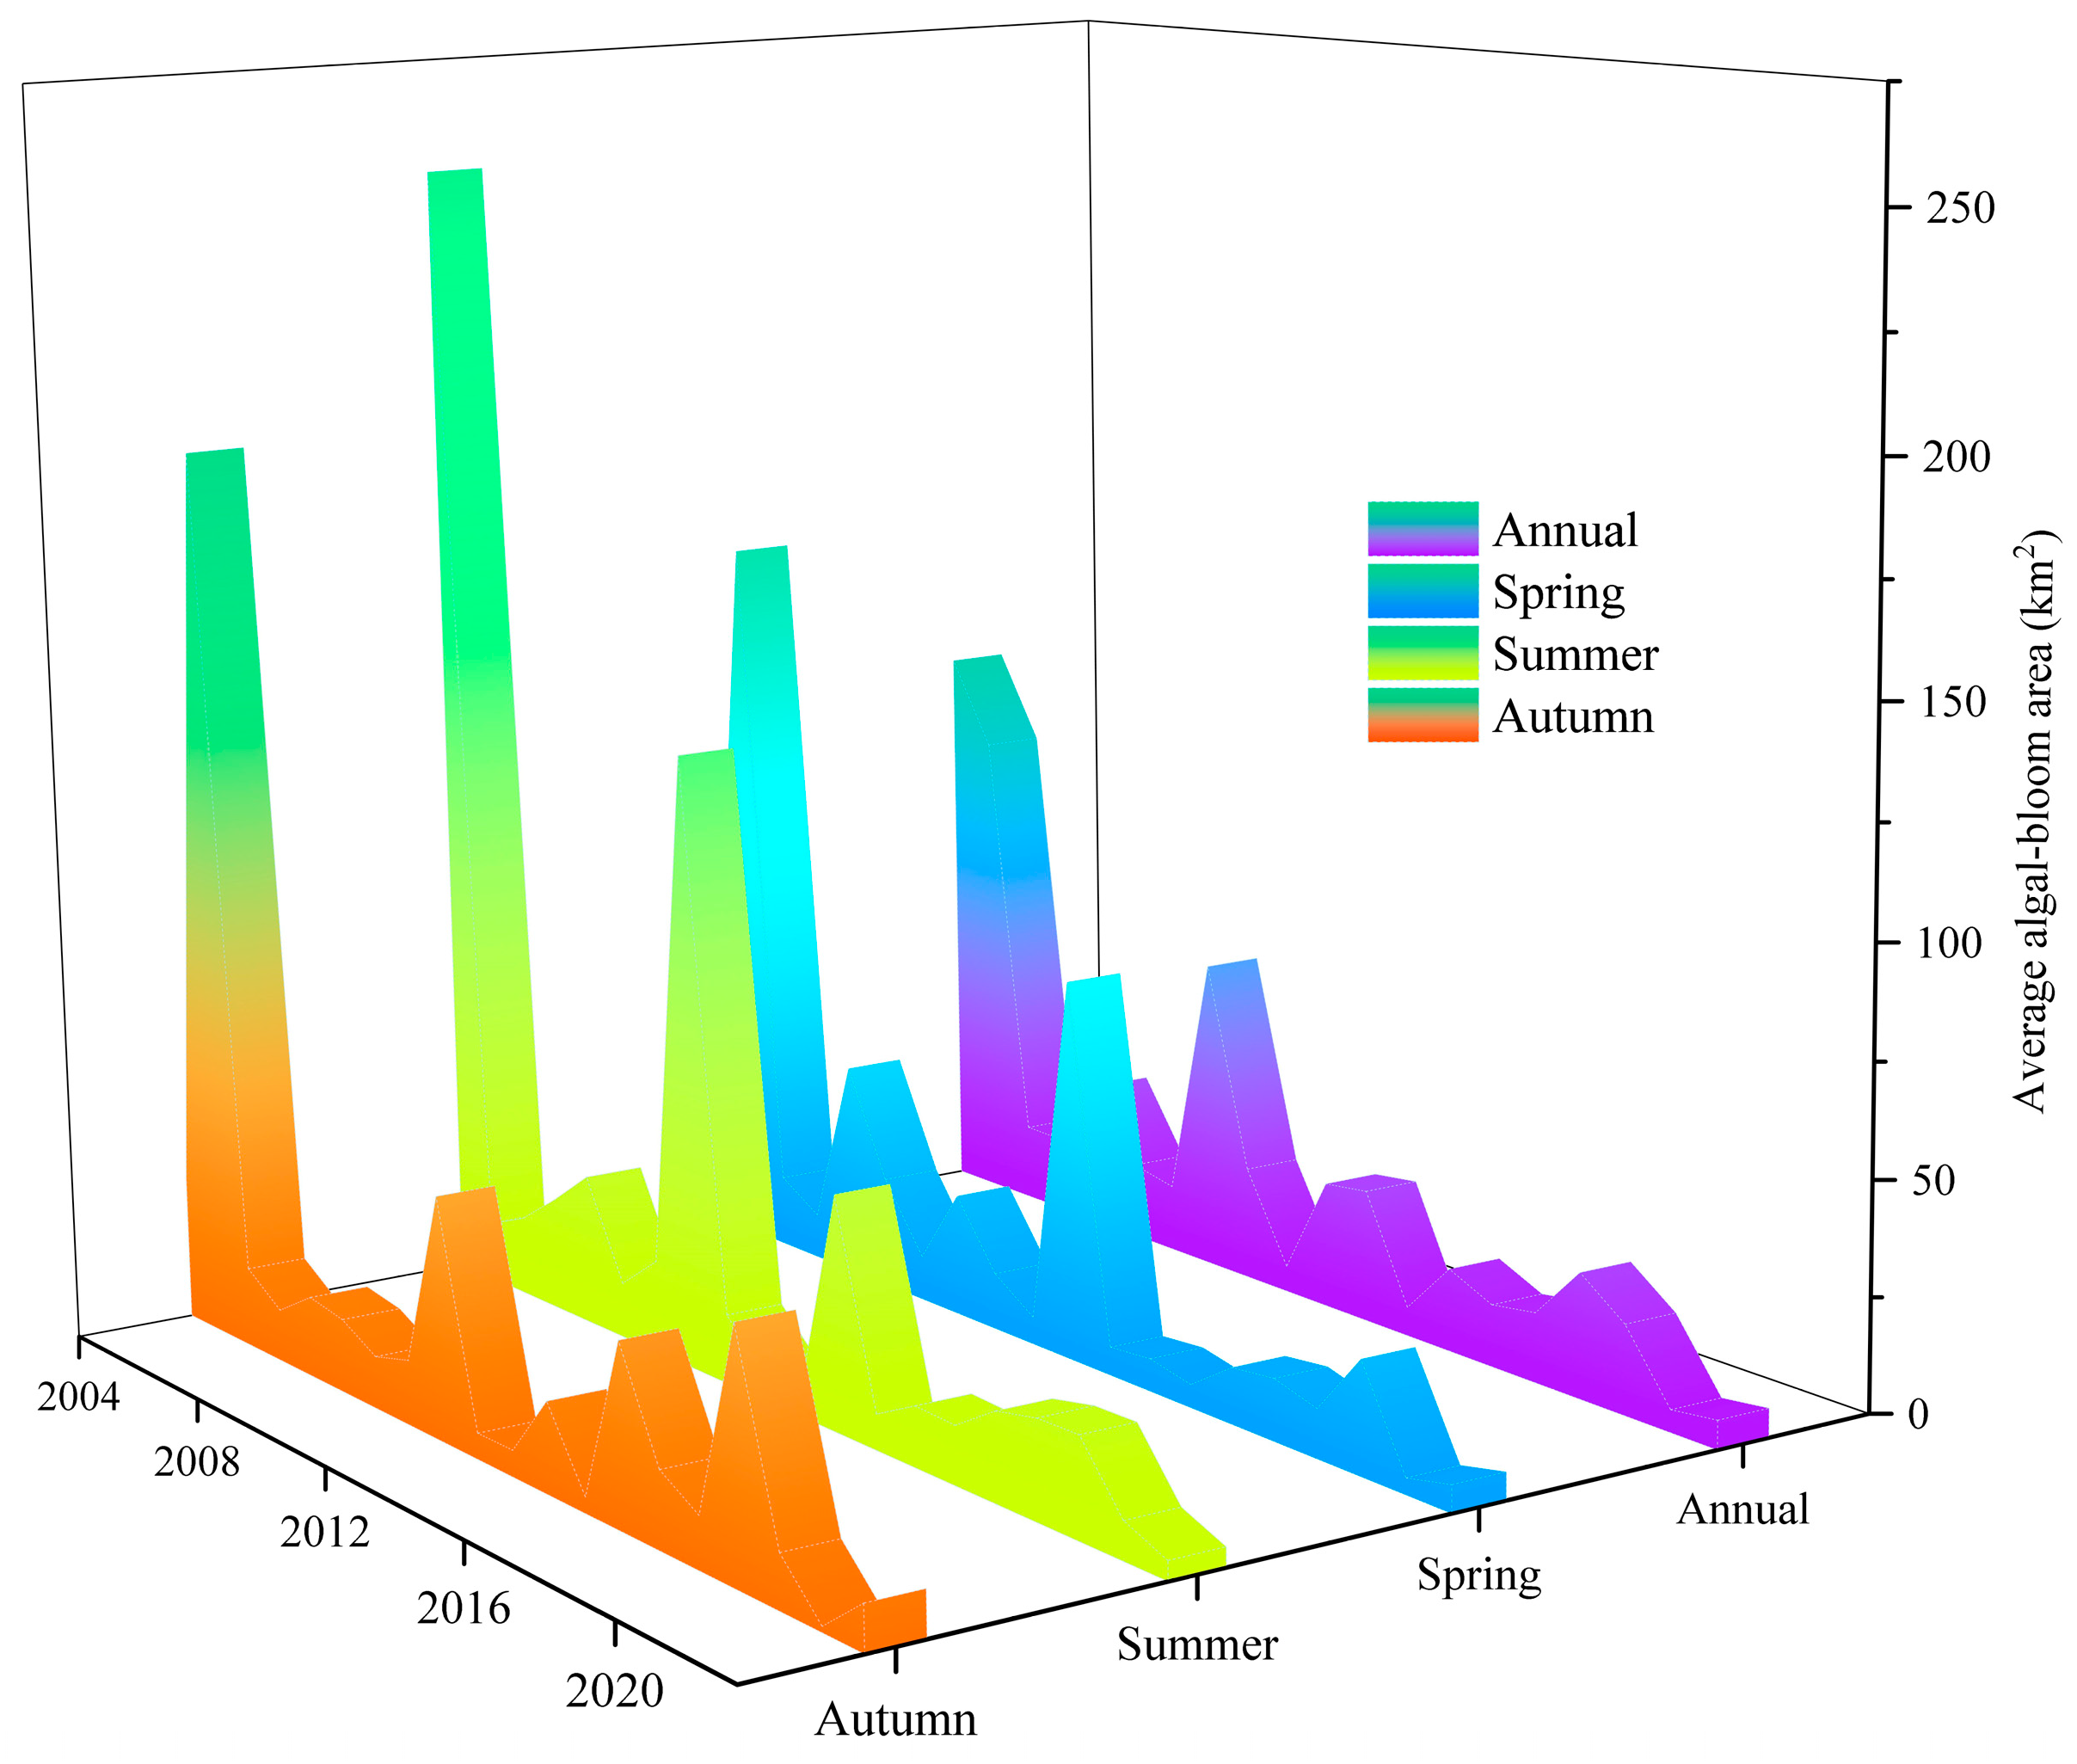
As shown in Figure 9, statistical analysis of the seasonal and annual mean algal-bloom coverage from 2004 to 2023 indicates the following. The summer bloom coverage in 2004 was 250.29 km2, which was the maximum value for this time period. The spring and autumn bloom coverage in 2005 reached 160.32 km2 and 195.24 km2 in spring and autumn, respectively, and these were the maximum values for that period. Overall, since 2005, the area covered by algal blooms in spring, summer, and autumn has shown a gradual downward trend, indicating that the frequency and intensity of algal blooms have been decreasing year by year. Despite the overall positive trend, there were still local peaks in individual years and seasons, such as a phased increase in the area covered by algal blooms in the spring of 2008, the summer of 2011, the autumn of 2012, the spring of 2014, the summer of 2015, the autumn of 2017, and the autumn of 2020. In terms of inter-annual variation, the area covered by algal blooms showed obvious peaks in 2004, 2005, and 2011 of 125.43 km2, 107.14 km2, and 69.17 km2, respectively, reflecting that these years may have been affected by specific climatic conditions or exogenous inputs, and that the algal-bloom outbreaks were more serious.
Combined with Figure 9 and the results of the previous analyses, Figure 9 shows that during the study period, the area covered by algal blooms in Lake Bosten revealed a strong decreasing trend on both seasonal and annual scales. This indicates that the overall frequency and intensity of algal blooms in the lake have been weakening year by year, and that the risk of bloom outbreaks continues to decline. Especially in recent years, there is no obvious peak of algal-bloom coverage, further reflecting that the water quality has been effectively improved, which shows that the ecological and environmental management measures implemented in recent years have begun to bear fruit.

3.2.4. Spatiotemporal Distribution of Bloom Frequency

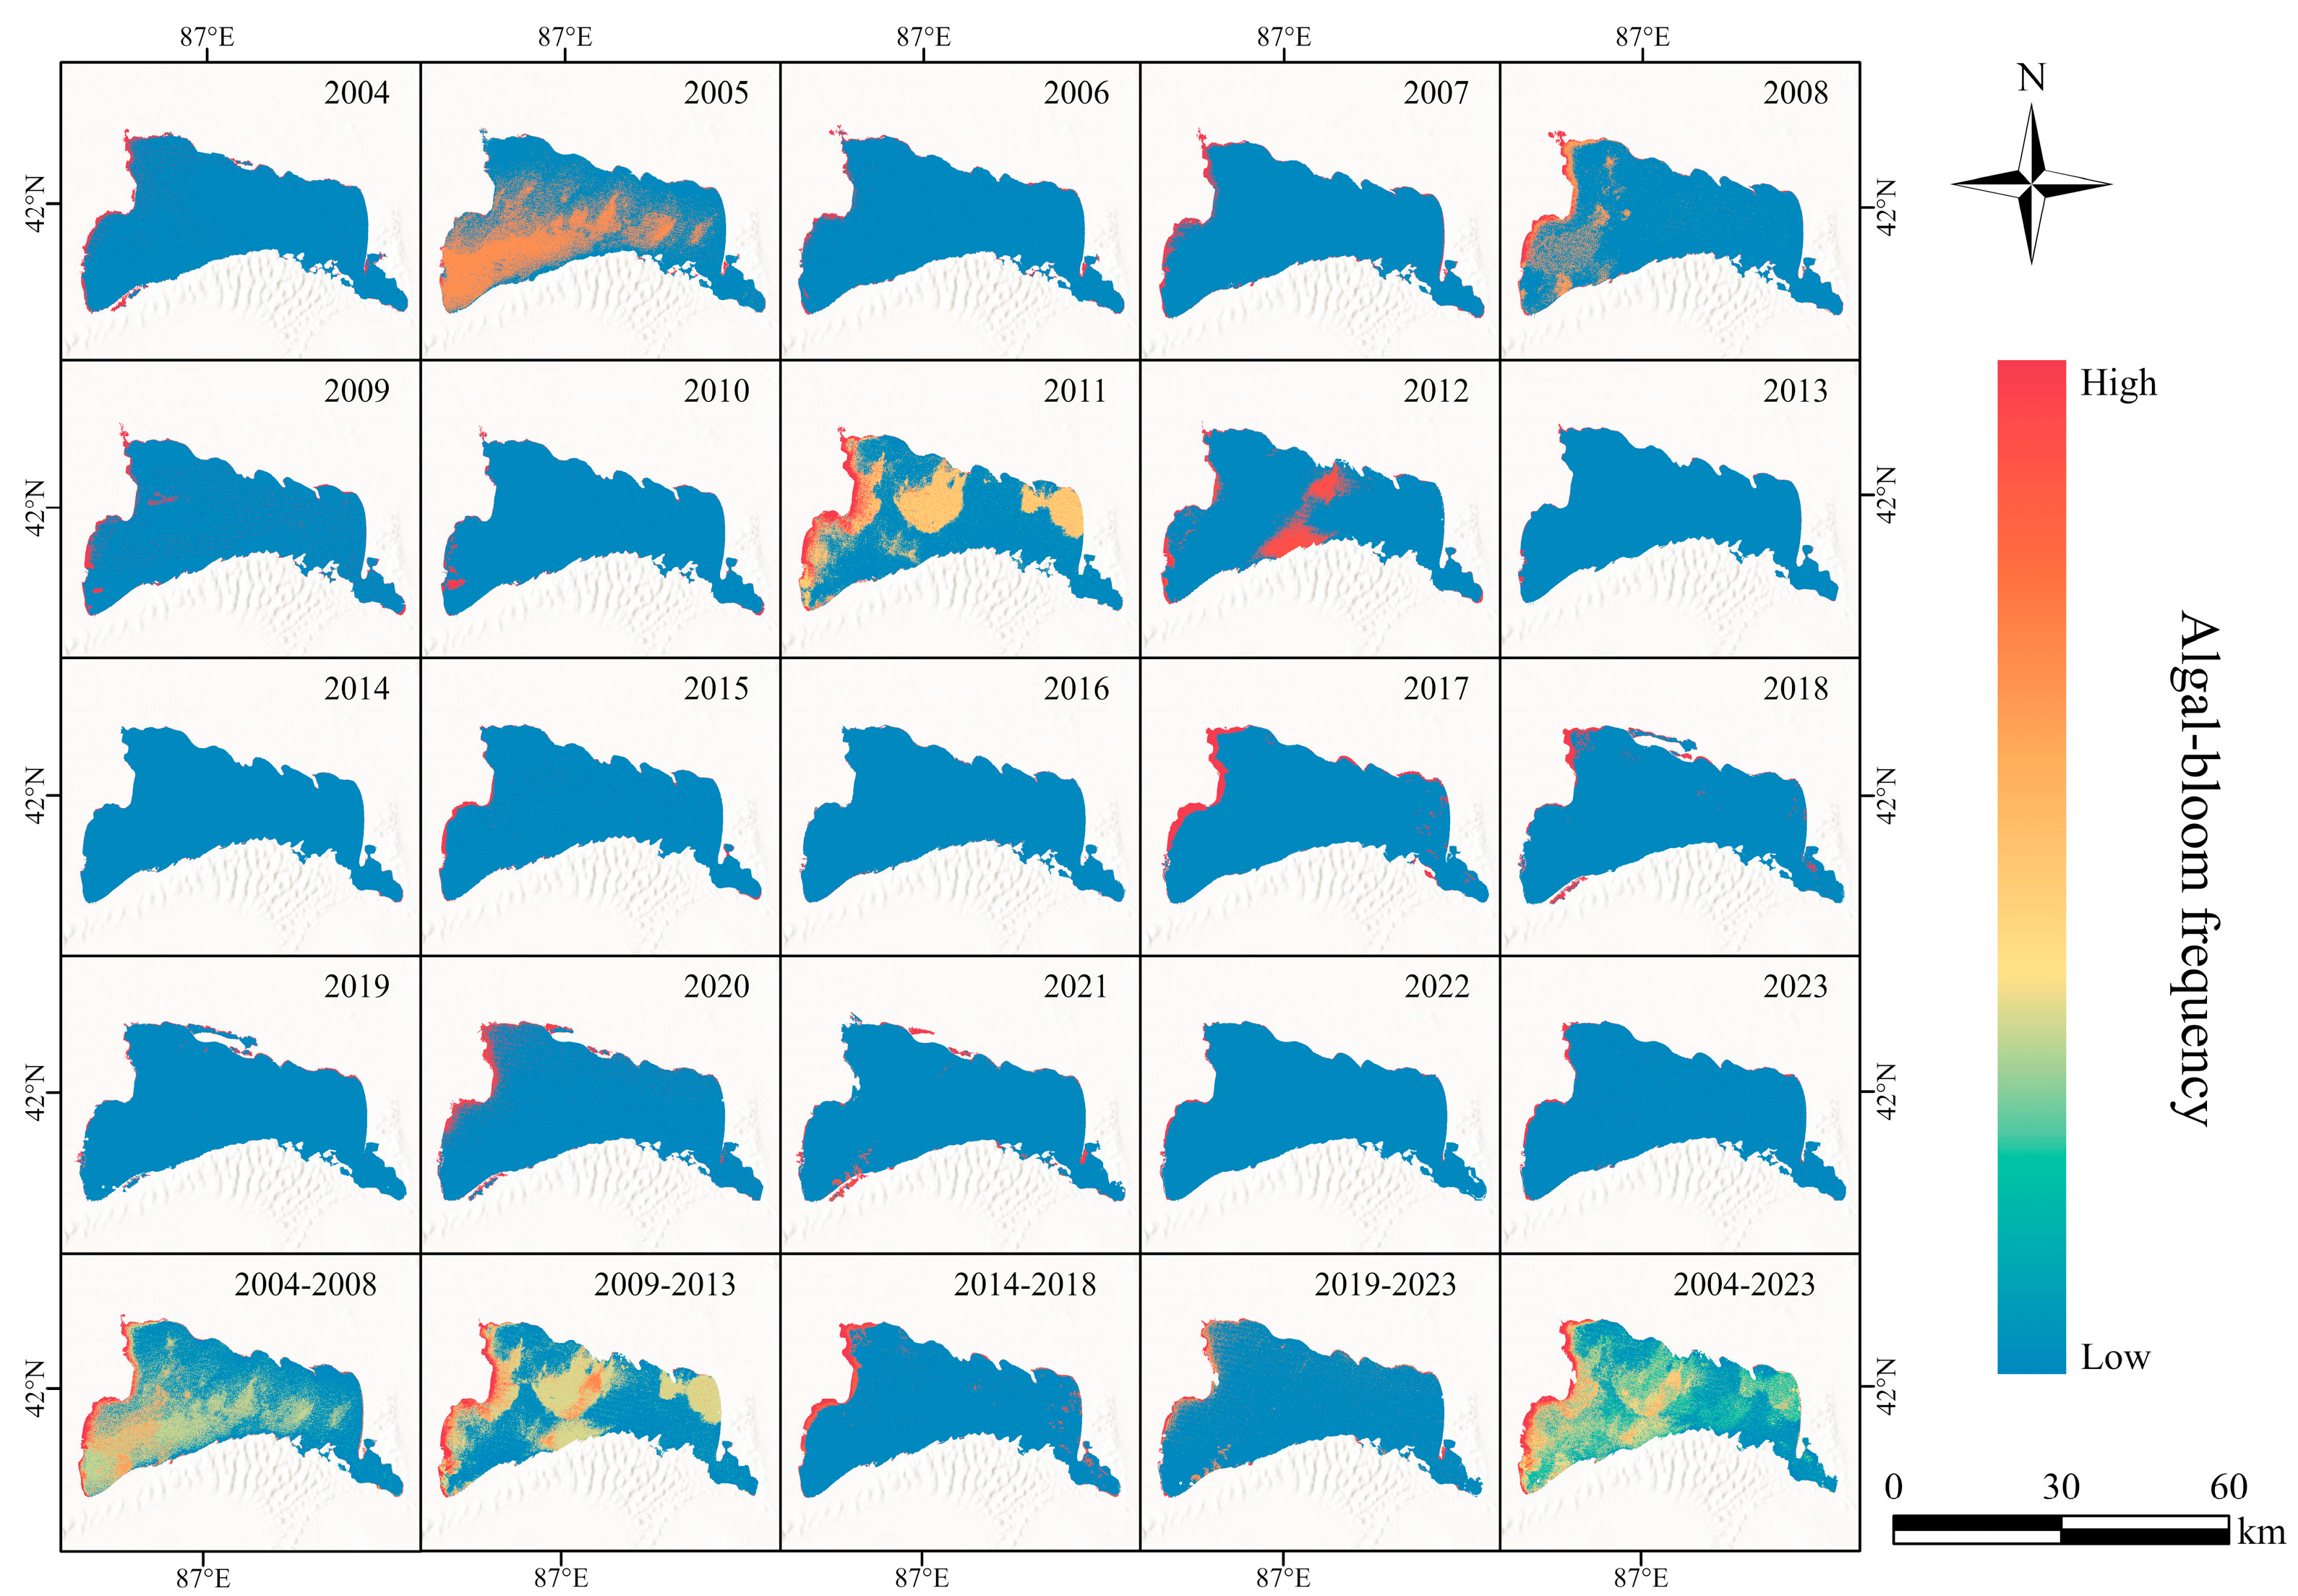
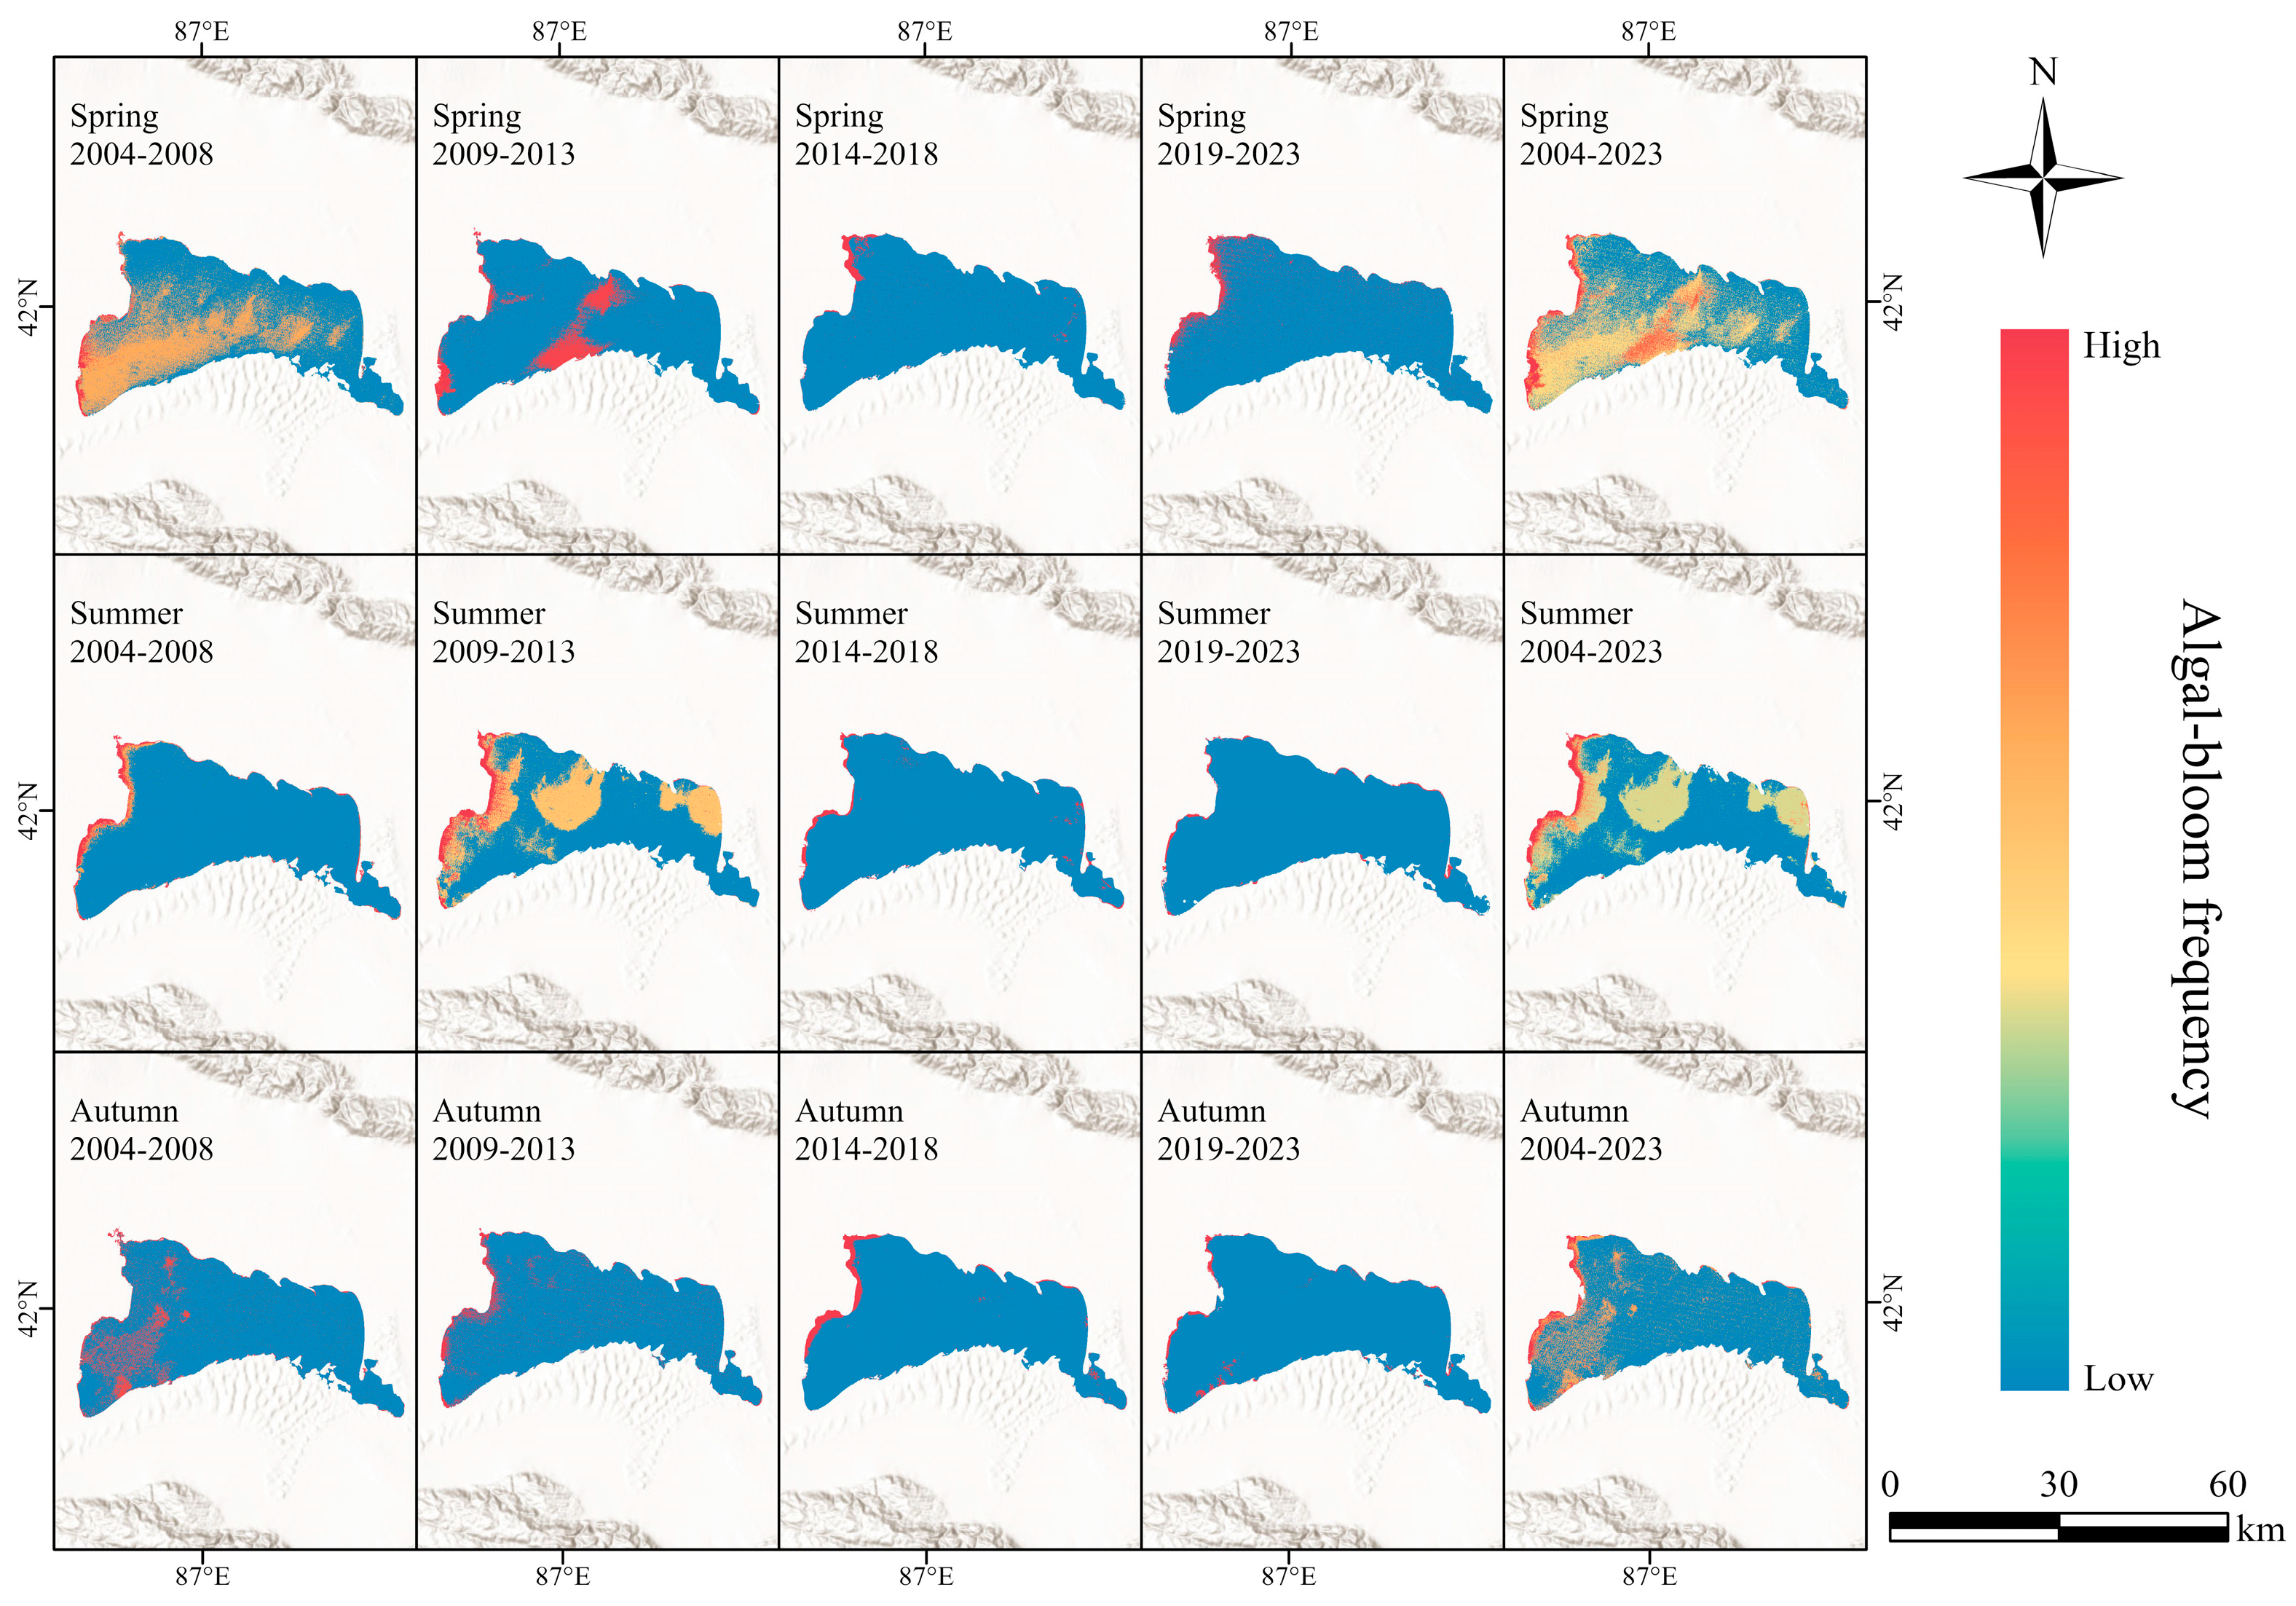
In order to deeply investigate the spatial distribution characteristics of algal blooms in Lake Bosten, we plotted annual-scale (Figure 10) and seasonal-scale (Figure 11) algal-bloom frequency maps. The results show that during 2004–2008, the high-frequency areas of blooms were mainly distributed in the western and northwestern margins of the lake, with the central and southwestern regions also showing some degree of blooming. During 2009–2013, the high-frequency areas of algal blooms were still mainly concentrated in the western and northwestern margins of the lake, whereas the central and northeastern parts displayed a lower frequency of bloom occurrence as well as a lower frequency of bloom distribution. Finally, during 2014–2018 and 2019–2023, the high-frequency areas of algal blooms were again concentrated in the western and northwestern edges of the lake. These data indicate that the high-frequency area of algal blooms throughout the entire study period was concentrated at the lake’s western and northwestern edges, which indicates that the spatiotemporal stability of algal blooms in this section of the lake is high.
On the seasonal scale, during 2004–2008, the highest frequency of spring blooms was mainly concentrated at the western and northwestern edges of the lake as well as in the southwestern part, with a tendency to expand towards the lake’s center. Summer and autumn blooms were concentrated in the western and northwestern parts. During 2009–2013, the highest frequency of spring blooms was concentrated in the western and southwestern margins as well as in the central part of the lake. Summer blooms continued to be concentrated in the west and northwest, while some blooms also occurred in the central and northeastern areas, though at a lower frequency. The high-frequency areas of autumn blooms remained stable along the western and northwestern margins.
The areas of high-frequency occurrence of algal blooms in all seasons stabilized in the 2014–2018 and 2019–2023 time periods, both of which were mainly concentrated on the western and north-western margins of the lake. Overall, throughout the entire study period, the high-frequency algal-bloom occurrence areas were mainly concentrated in the western and northwestern parts of the lake, indicating that these areas constitute the core of the high-risk continuous occurrence of algal blooms and thus need to be the focus of water-quality management.
Based on the analysis of the spatial distribution of annual and seasonal algal-bloom frequencies, it can be concluded that the western and northwestern parts of Lake Bosten have the highest frequency of algal blooms, indicating that the eutrophication degree of the water body in this region is the most serious. Since 2013, no algal blooms have occurred in the central part of the lake, suggesting that the water quality there has improved. In the future, the lake’s western and northwestern parts should be treated as the key areas, which means that effective measures should be taken to reduce the eutrophication phenomenon in order to further improve the water quality and prevent future expansion of algal blooms.

3.2.5. Construction of a Predictive Model for the Spatial Distribution of Algal-Bloom Frequency

Based on the fact that LSTM is more suitable for dealing with long-term dependencies in sequence data and more suitable for long time-span prediction, this paper constructs a spatial distribution prediction model based on the raster data of the frequency of algal-bloom occurrence in long time series. Using python3.8.2 software, all the tif data were arranged by year and resampled, the resampled tif data were transformed into time series data available for LSTM, the 3D raster data (year, height, width) were transformed into 2D arrays (number of pixel points, time step) through the data preprocessing work, and the time series data of each pixel were normalized.
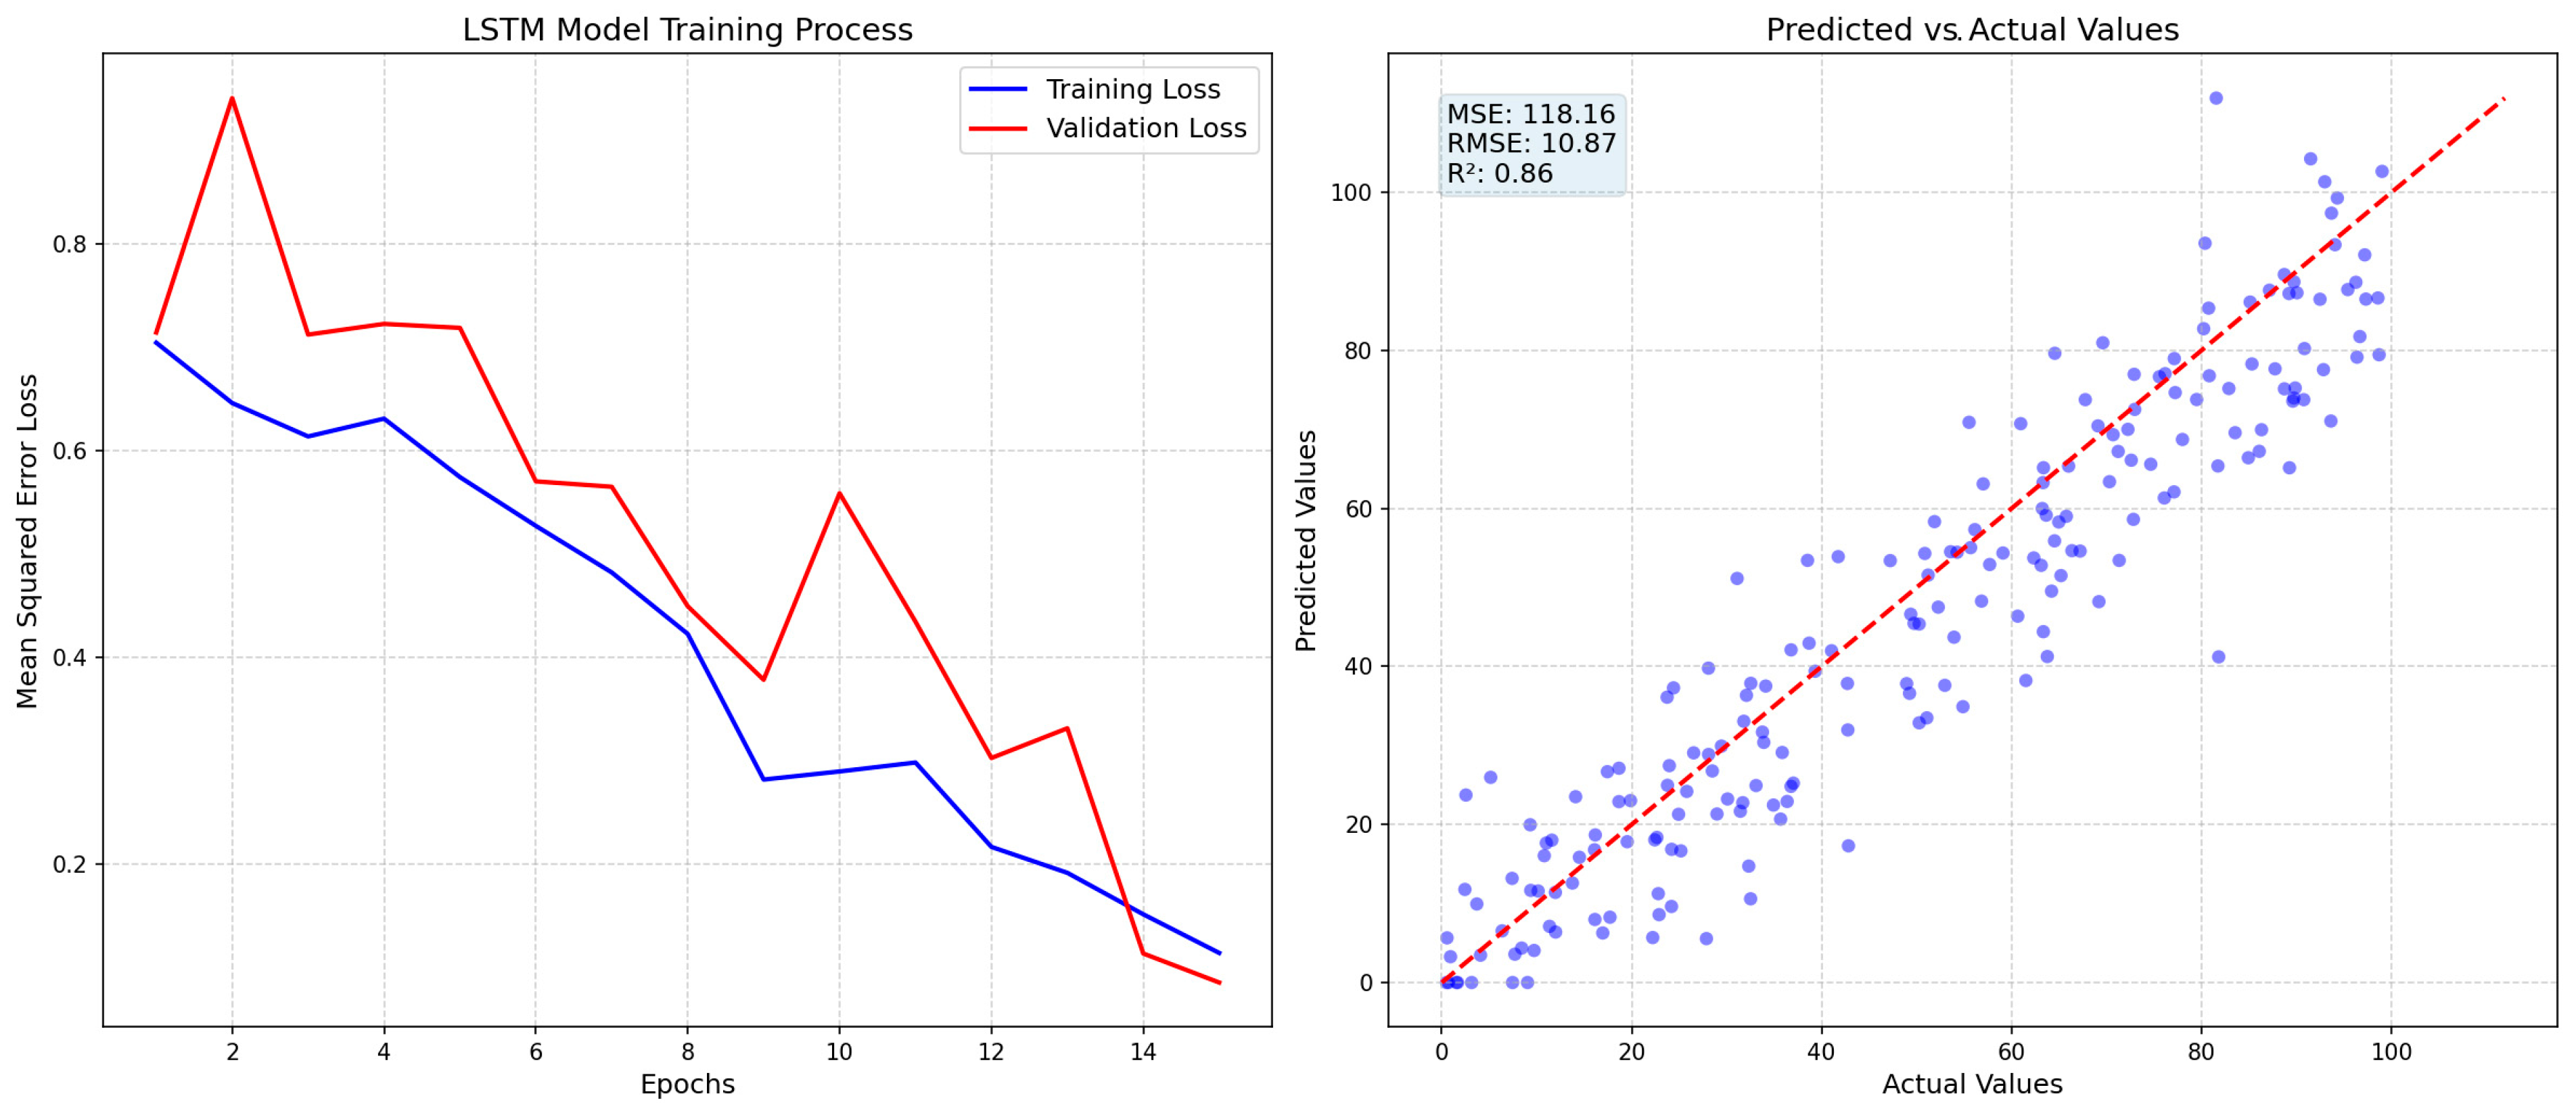
To validate the prediction accuracy of the model, the time-series division of historical data (from the training set to the test set) was employed to verify the predictive precision, with error metrics (e.g., MSE) between the true and predicted values used to intuitively reflect the accuracy. Additionally, time-series cross-validation (rolling validation) was applied to examine the model’s stability across different time periods, ensuring the reliability of the prediction results. The combination of these two approaches not only aligns with the characteristics of time-series data but also comprehensively evaluates the model’s performance. The training and evaluation of the model is shown in Figure 12. The MSE is 118.16, the RMSE is 10.87, R2 is 0.86, and the model is more stable.
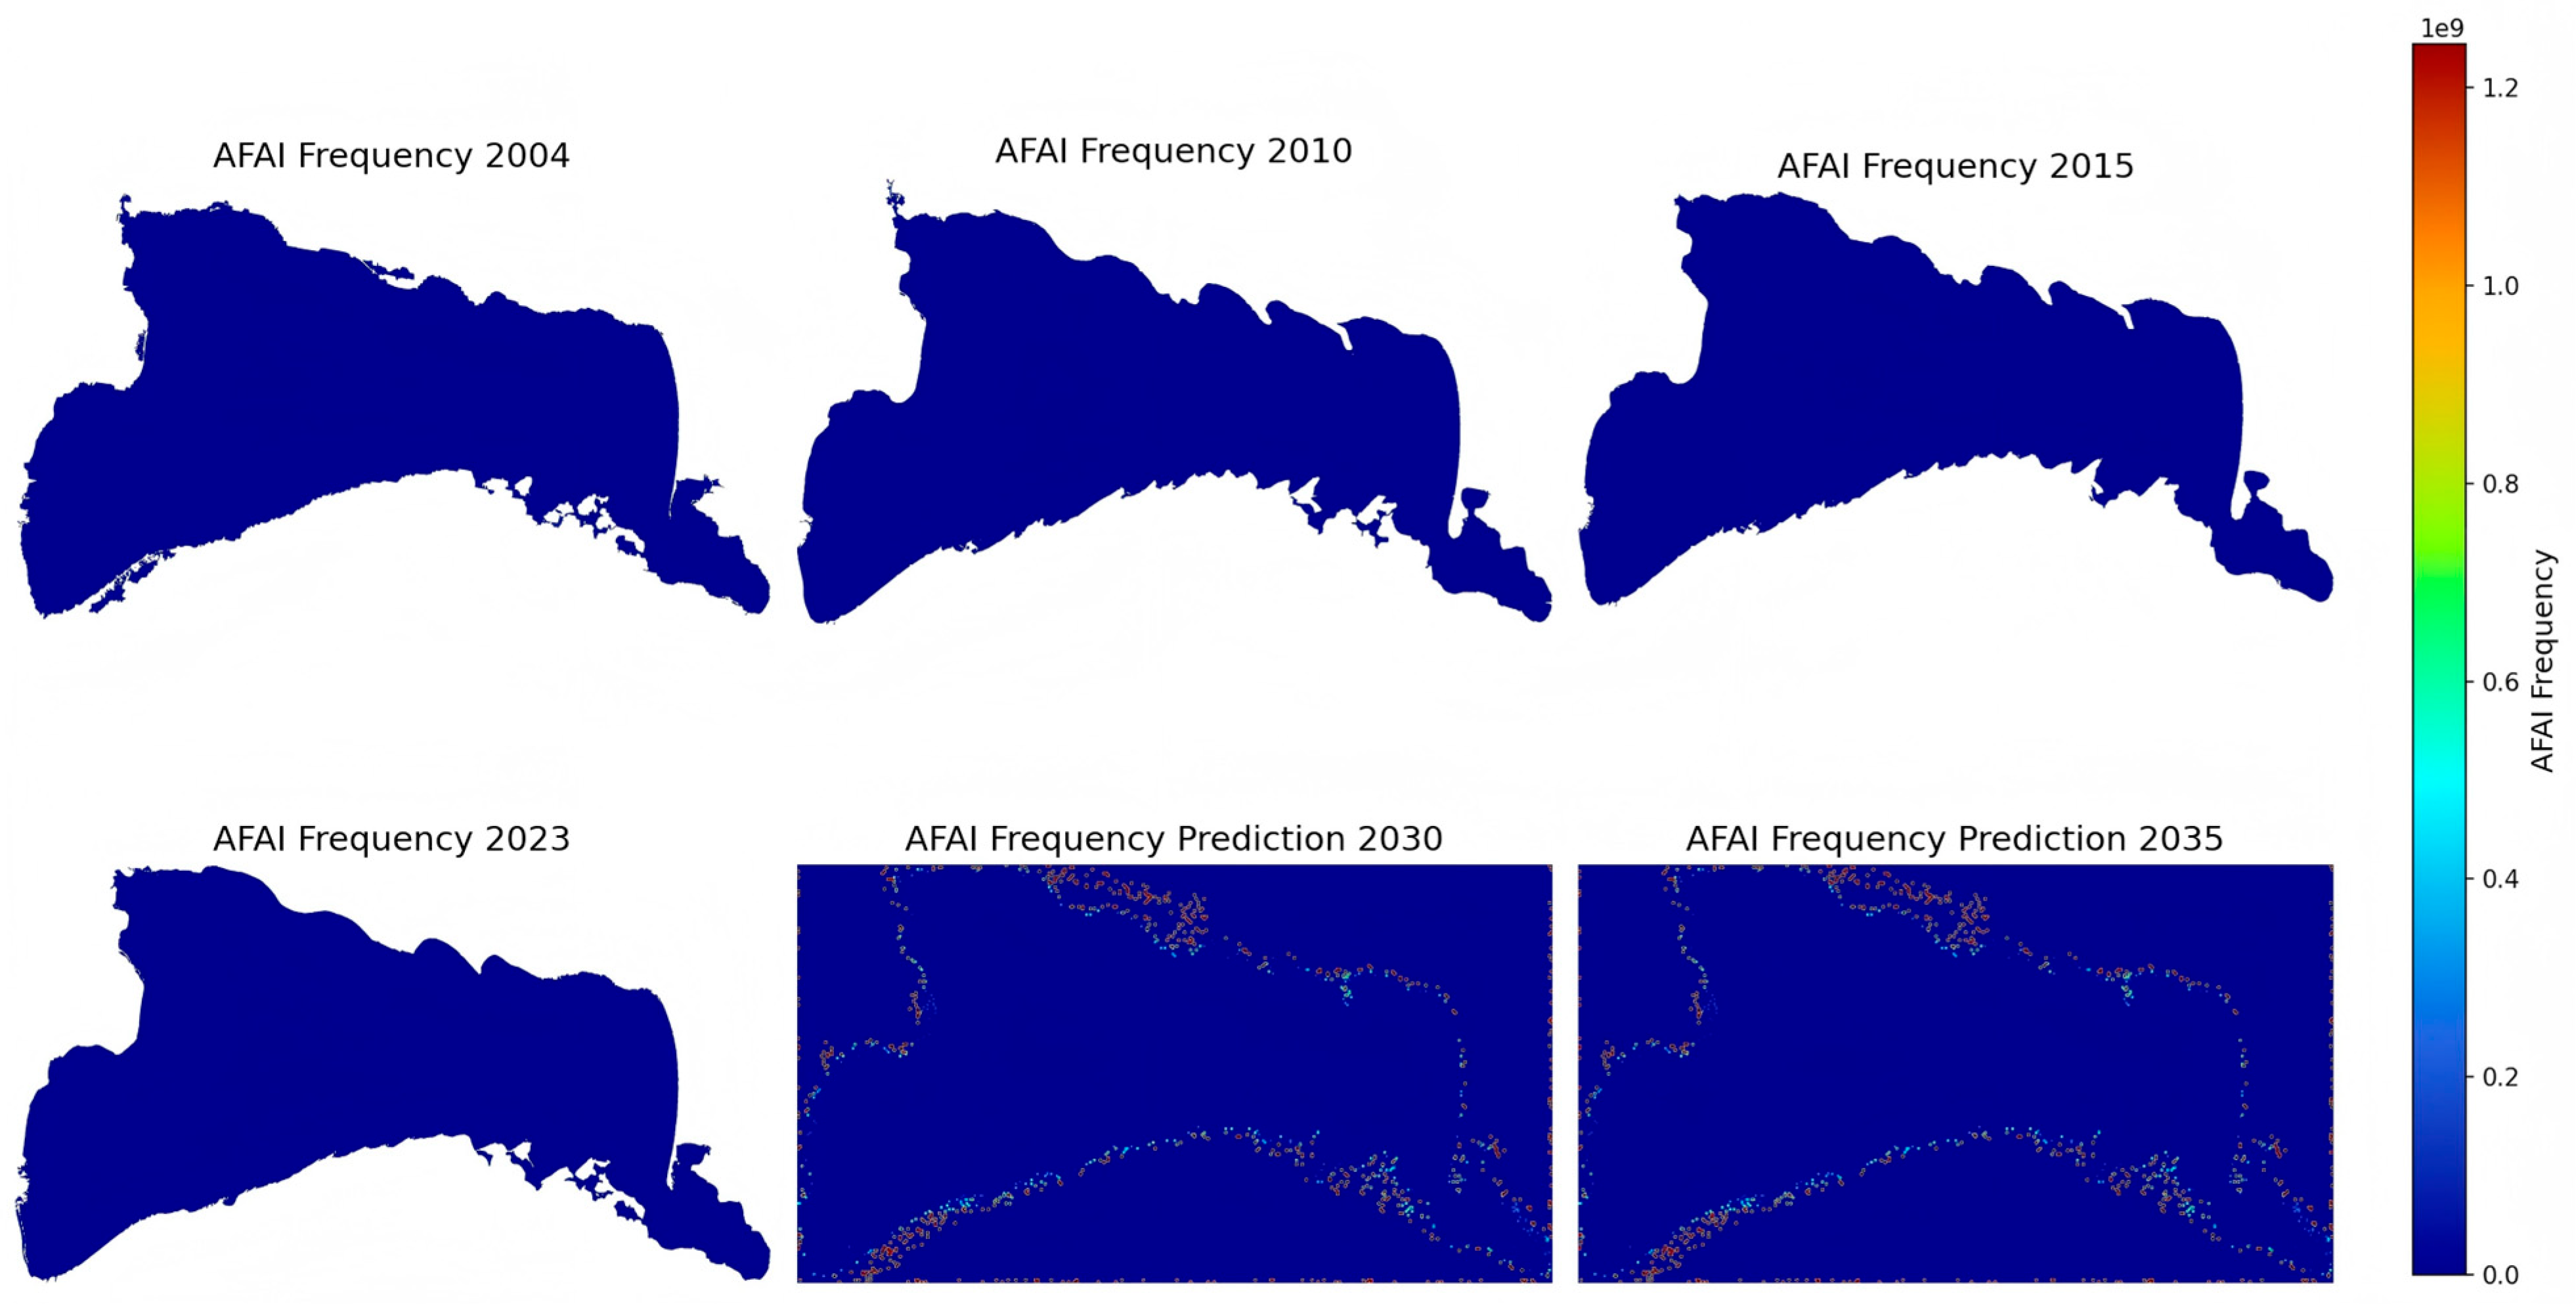
The trained LSTM model was used to predict the spatial distribution of algal-bloom frequency in 2030 and 2035, and the prediction results were saved in tif format and kept in the coordinate system of the original data, and the prediction results are shown in Figure 13, which shows that algal blooms in 2030 and 2035 only appeared in the edges of the lake area, which is in line with the trend of the spatial distribution of the bloom characteristics reflected in this paper. Based on the trend of historical data, the model can successfully predict the spatial distribution of algal blooms and provide reference for the sustainable management of Lake Bosten.

3.3. Analysis of Driving Factors

3.3.1. Analysis of the Impact of Changes in Water Area of Lake Bosten on Algal Blooms

The water level and size (area) of a lake have a considerable impact on the self-purification capacity and stability of the lake’s ecosystems [46,47,48]. Between 2004 and 2023, the lake area of Lake Bosten experienced a decreasing/increasing/decreasing trend (Figure 14). Between 2004 and 2013, the lake area decreased by 125.92 km2, reaching its minimum of only 902.46 km2 in 2013. During this period, the western and northwestern regions of the lake exhibited higher levels of eutrophication and more frequent algal blooms, while the central part of the lake also experienced a relatively high bloom frequency. The reduction in lake area led to a decrease in water volume, which significantly extended the hydraulic retention time under the same inflow conditions. The prolonged retention time reduced the diffusion rate of nutrients, thereby intensifying local nutrient accumulation. In addition, the decreased lake area weakened the dilution effect, resulting in higher pollutant concentrations per unit volume and increased concentrations of bioavailable nutrients, ultimately triggering algal blooms. Wind-driven water flow in the western and northwestern parts of the lake may have transported resuspended nutrients from sediments toward the central region, contributing to the increased frequency of algal blooms in that area.
Between 2013 and 2019, the lake area increased by 130.5 km2, reaching 1032.96 km2 in 2019. During this period, the frequency of algal blooms in the central part of the lake declined significantly. The expansion of the lake area shortened the hydraulic retention time, accelerating nutrient diffusion and thereby reducing local accumulation. In addition, the increased lake area enhanced the dilution effect, lowering the concentration of limiting nutrients required for algal growth. The larger water surface also intensified wind-induced wave action, promoting water circulation and reducing nutrient deposition in the central region, which contributed to the decreased frequency of algal blooms. From 2019 to 2023, the lake area decreased by 55.67 km2, but this reduction primarily occurred in the small sub-lake zones in the northern and southwestern parts of the lake, while the core eutrophication zones in the west and northwest did not shrink significantly. During this stage, the reduction was localized, and the main body of the lake remained relatively large, maintaining its dilution and circulation capacities and preserving ecosystem stability. Although the area loss in the small sub-lakes may have accelerated the release of nutrients from sediments, the overall impact was limited due to the stable size of the main lake body, and the spatial distribution of algal-bloom frequency remained largely unchanged.
In summary, the lake area of Lake Bosten is closely related to the frequency of algal blooms. Changes in lake area are strongly associated with the spatial distribution of algal-bloom frequency, particularly in the western and northwestern regions of the lake. Therefore, continuous monitoring of the lake area is essential for future management and restoration efforts in Lake Bosten.

3.3.2. Analysis of the Impact of Meteorological Factors on Algal Blooms

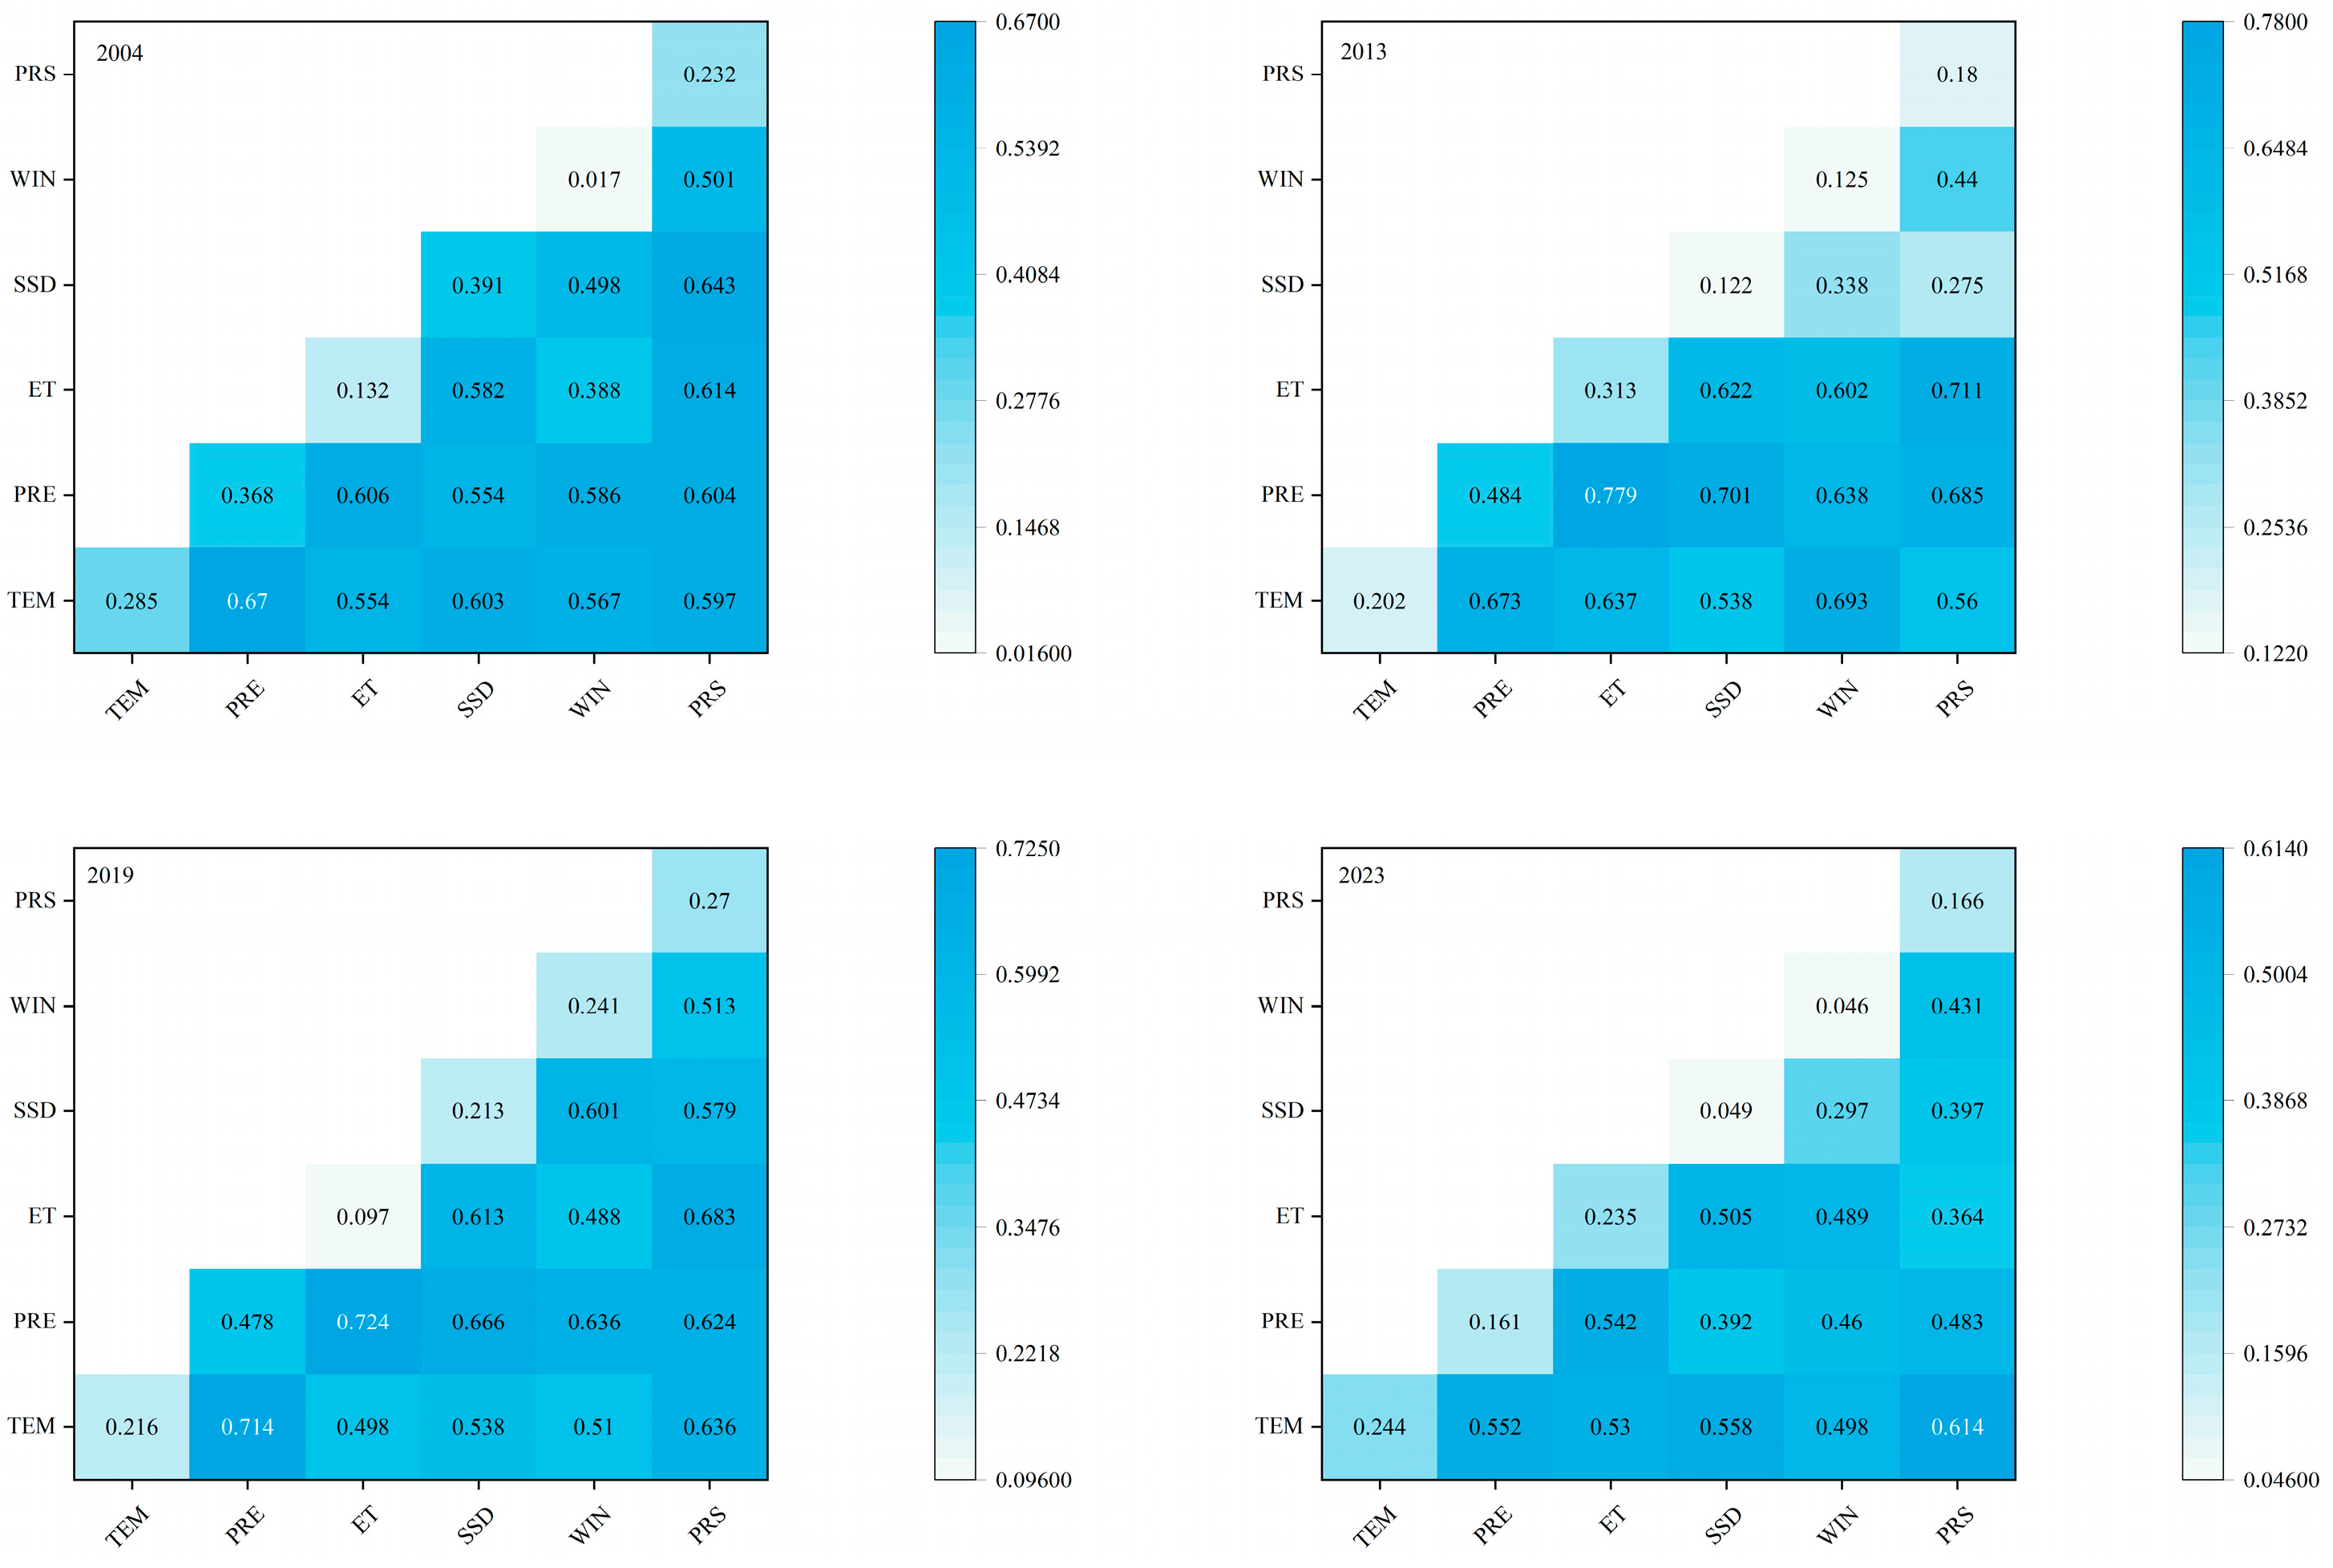
Based on the change trend (decrease/increase/decrease) for the lake area of Lake Bosten from 2004 to 2023, we selected 2013 and 2019 as the turning years. We then conducted geoprobe analyses for 2004, 2013, 2019, and 2023, respectively, in order to reveal the degree of influence of meteorological factors on the occurrence of algal blooms in the lake. Figure 15 shows the effects of meteorological factors (e.g., temperature, precipitation, potential evapotranspiration, etc.) on algal blooms in different years. Through this analysis, the degree of contribution of meteorological factors to the spatial distribution and frequency of algal blooms under different meteorological conditions can be clarified.
Based on the analysis of single-factor effects of meteorological factors, none of the explanatory power (q-values) of each meteorological factor on algal blooms in 2004 exceeded 0.4. In 2013, only the q-value of precipitation (0.484) exceeded 0.4, indicating that precipitation had a relatively strong effect on algal blooms. Similarly, in 2019, the q-value of precipitation (0.478) also showed strong explanatory power, exceeding 0.4. In contrast, none of the single-factor q-values of the meteorological factors exceeded 0.3 in 2023, suggesting that the influence of meteorological factors on algal blooms had weakened.
According to the results of the interaction analysis of meteorological factors, in 2004, the interaction of temperature and precipitation had the greatest explanatory power for algal blooms, with a q-value of 0.67. In 2013, the interaction of precipitation and evapotranspiration had the greatest explanatory power, with a q-value of 0.779. In 2019, precipitation and evapotranspiration again had the greatest explanatory power, with a q-value of 0.724. In 2023, temperature and barometric pressure interactions had the greatest explanatory power, with a q-value of 0.614.
Further analysis showed that in 2004, the q-values of the explanatory power of the interactions of temperature, precipitation, and barometric pressure with other meteorological factors were all greater than 0.5. In 2013, the q-values of the interactions of temperature, precipitation, and evapotranspiration with other meteorological factors were similarly greater than 0.5. In 2019, the q-values of the interactions of precipitation, sunshine hours, and barometric pressure with other meteorological factors were all greater than 0.5, and in 2023, the q-values of the interactions between temperature and other meteorological factors exceeded 0.49. In 2004, 2013, 2019, and 2023, the q-values of the interactions between temperature and precipitation were all greater than 0.5.
Based on single factor analysis of meteorological factors, precipitation was the most critical factor affecting algal blooms. When applying interactional analysis, however, the interactions between meteorological factors had a greater effect on algal blooms than any single meteorological factor, with air temperature and precipitation having the greatest effect.
In summary, changes in algal blooms in Lake Bosten during the study period were mainly driven by the interaction of meteorological factors, with hot and humid environmental conditions contributing to algal growth.

3.3.3. Analysis of the Impact of the Water Column Environment on Algal Blooms

The occurrence of algal blooms is mainly affected by the eutrophication of water bodies, in which total nitrogen (TN) and total phosphorus (TP) are the key elements of eutrophication. As well, chlorophyll-a (Chla) can be used as an indication of algal biomass, and the permanganate index (CODMn) and the transparency (SD) of the water body are important water-quality parameters. In China, TN, TP, and CODMn are typically included in the monitoring indicators of environmental quality standards for surface water.
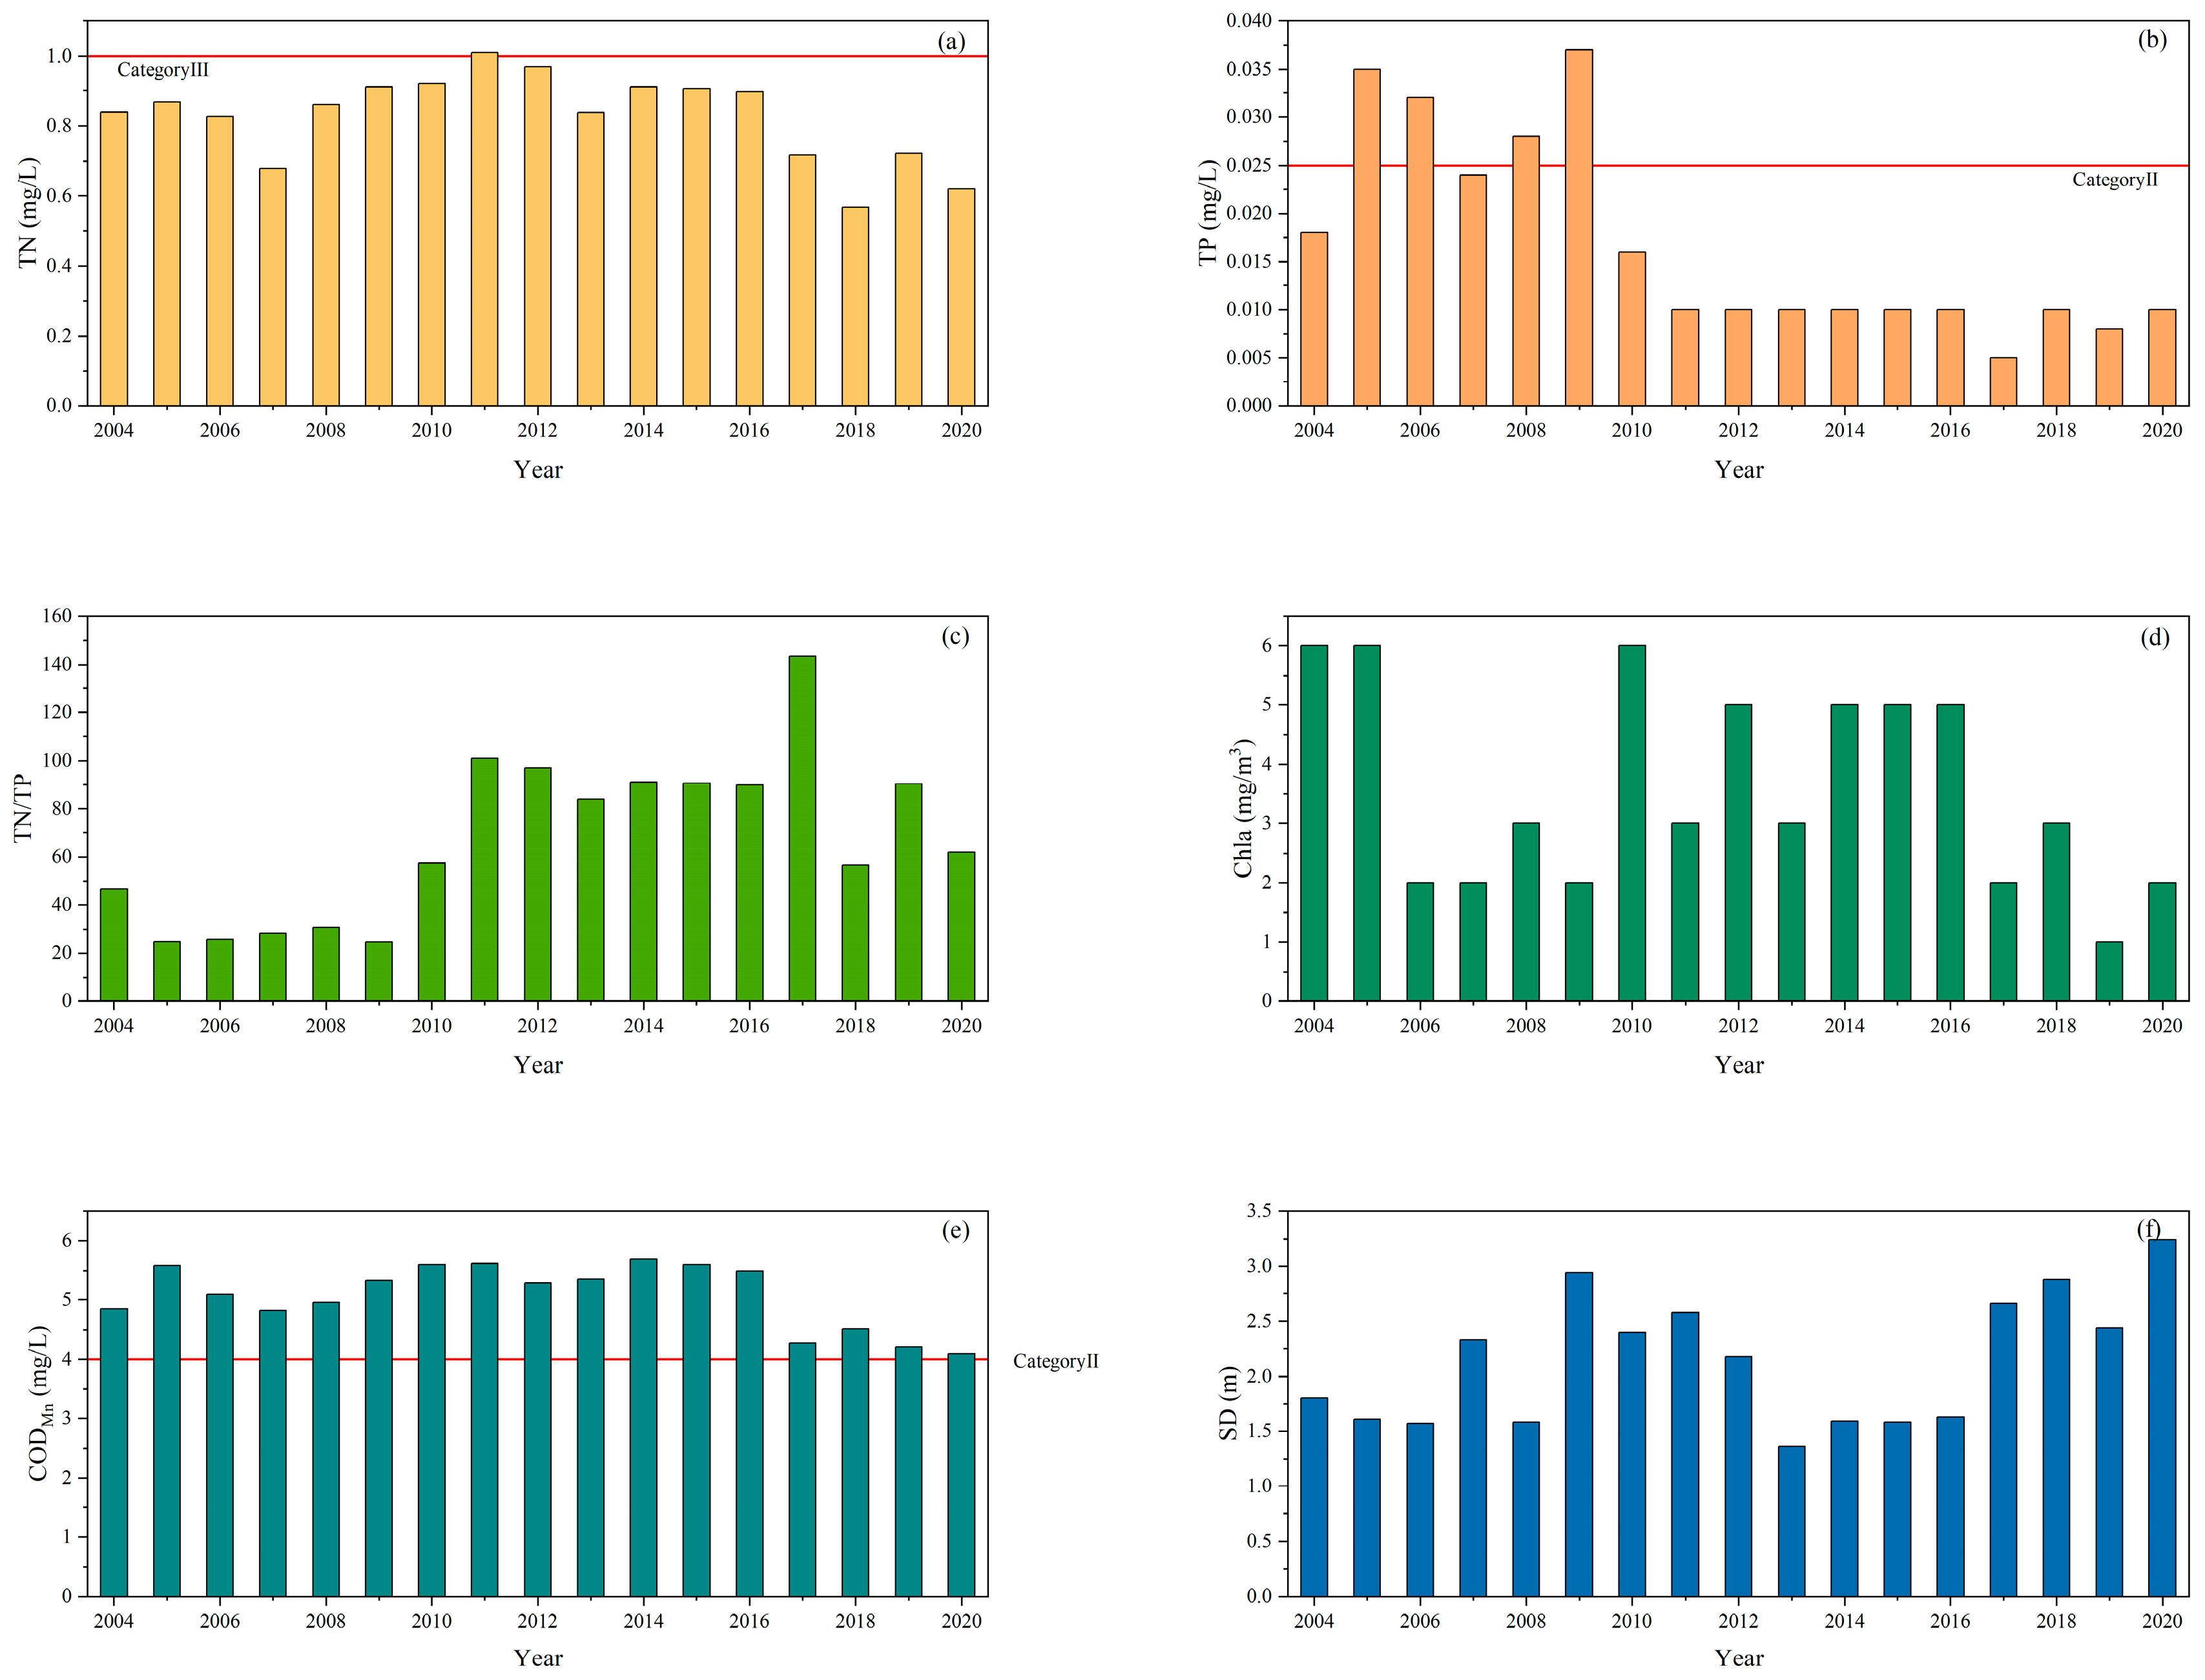
Figure 16 illustrates the changes in the concentrations of TN, TP, Chla, CODMn, and SD in Lake Bosten between 2017 and 2020. The trends in the TN/TP ratio are also presented. Between 2004 and 2020, TN concentrations met the Chinese environmental quality standard for surface water, Class III, in most years, with the exception of 2011, when TN values reached 1.01 mg/L, falling to Class IV. Since 2017, TN concentrations have steadily decreased following the implementation of lake-management measures.
For TP, there was an overall improvement during the study period. In 2005, 2006, 2008, and 2009, TP values complied with the Class III standard of China’s environmental quality standard for surface water. However, in 2004, 2007, and 2010, the values adhered to Class II, and from 2011 to 2020, they tended to stabilize and reached Class I standard in all cases. The TN/TP ratio was much lower during 2004–2010 than during 2011–2020 because of the generally high and less fluctuating TN values between 2004 and 2020 and the significant decrease in TP values from 2011 onwards.
For Chla, concentrations reached 6 mg/m3 in 2004, 2005, and 2010 and varied considerably between 2004 and 2016. From 2017 onwards, Chla concentrations decreased and then stabilized. The hypermobility index (CODMn) was maintained at the Class III level from 2004 to 2020. Although CODMn values dropped after 2017, they remained generally stable. SD values fluctuated between 2004 and 2016 but spiked after 2017, reaching 3.24 m in 2020, which is the highest value of the study period.
Based on changes in TN, TP, TN/TP, Chla, CODMn, and SD values from 2004 to 2020, it can be further inferred that the lake’s water quality was poor during the early period, which provided conditions for the occurrence of algal blooms. However, after 2017, the water quality steadily improved, indicating that the local relevant departments achieved positive results in the lake’s management measures, as verified by the findings in this paper. However, the TN and CODMn values were still high, which suggests that the organic matter pollution had not yet been adequately controlled. Therefore, it is still necessary to strengthen the management and treatment of water pollution and further limit the conditions for algal-bloom occurrence.

3.3.4. Analysis of the Impact of Human Activities on Algal Blooms

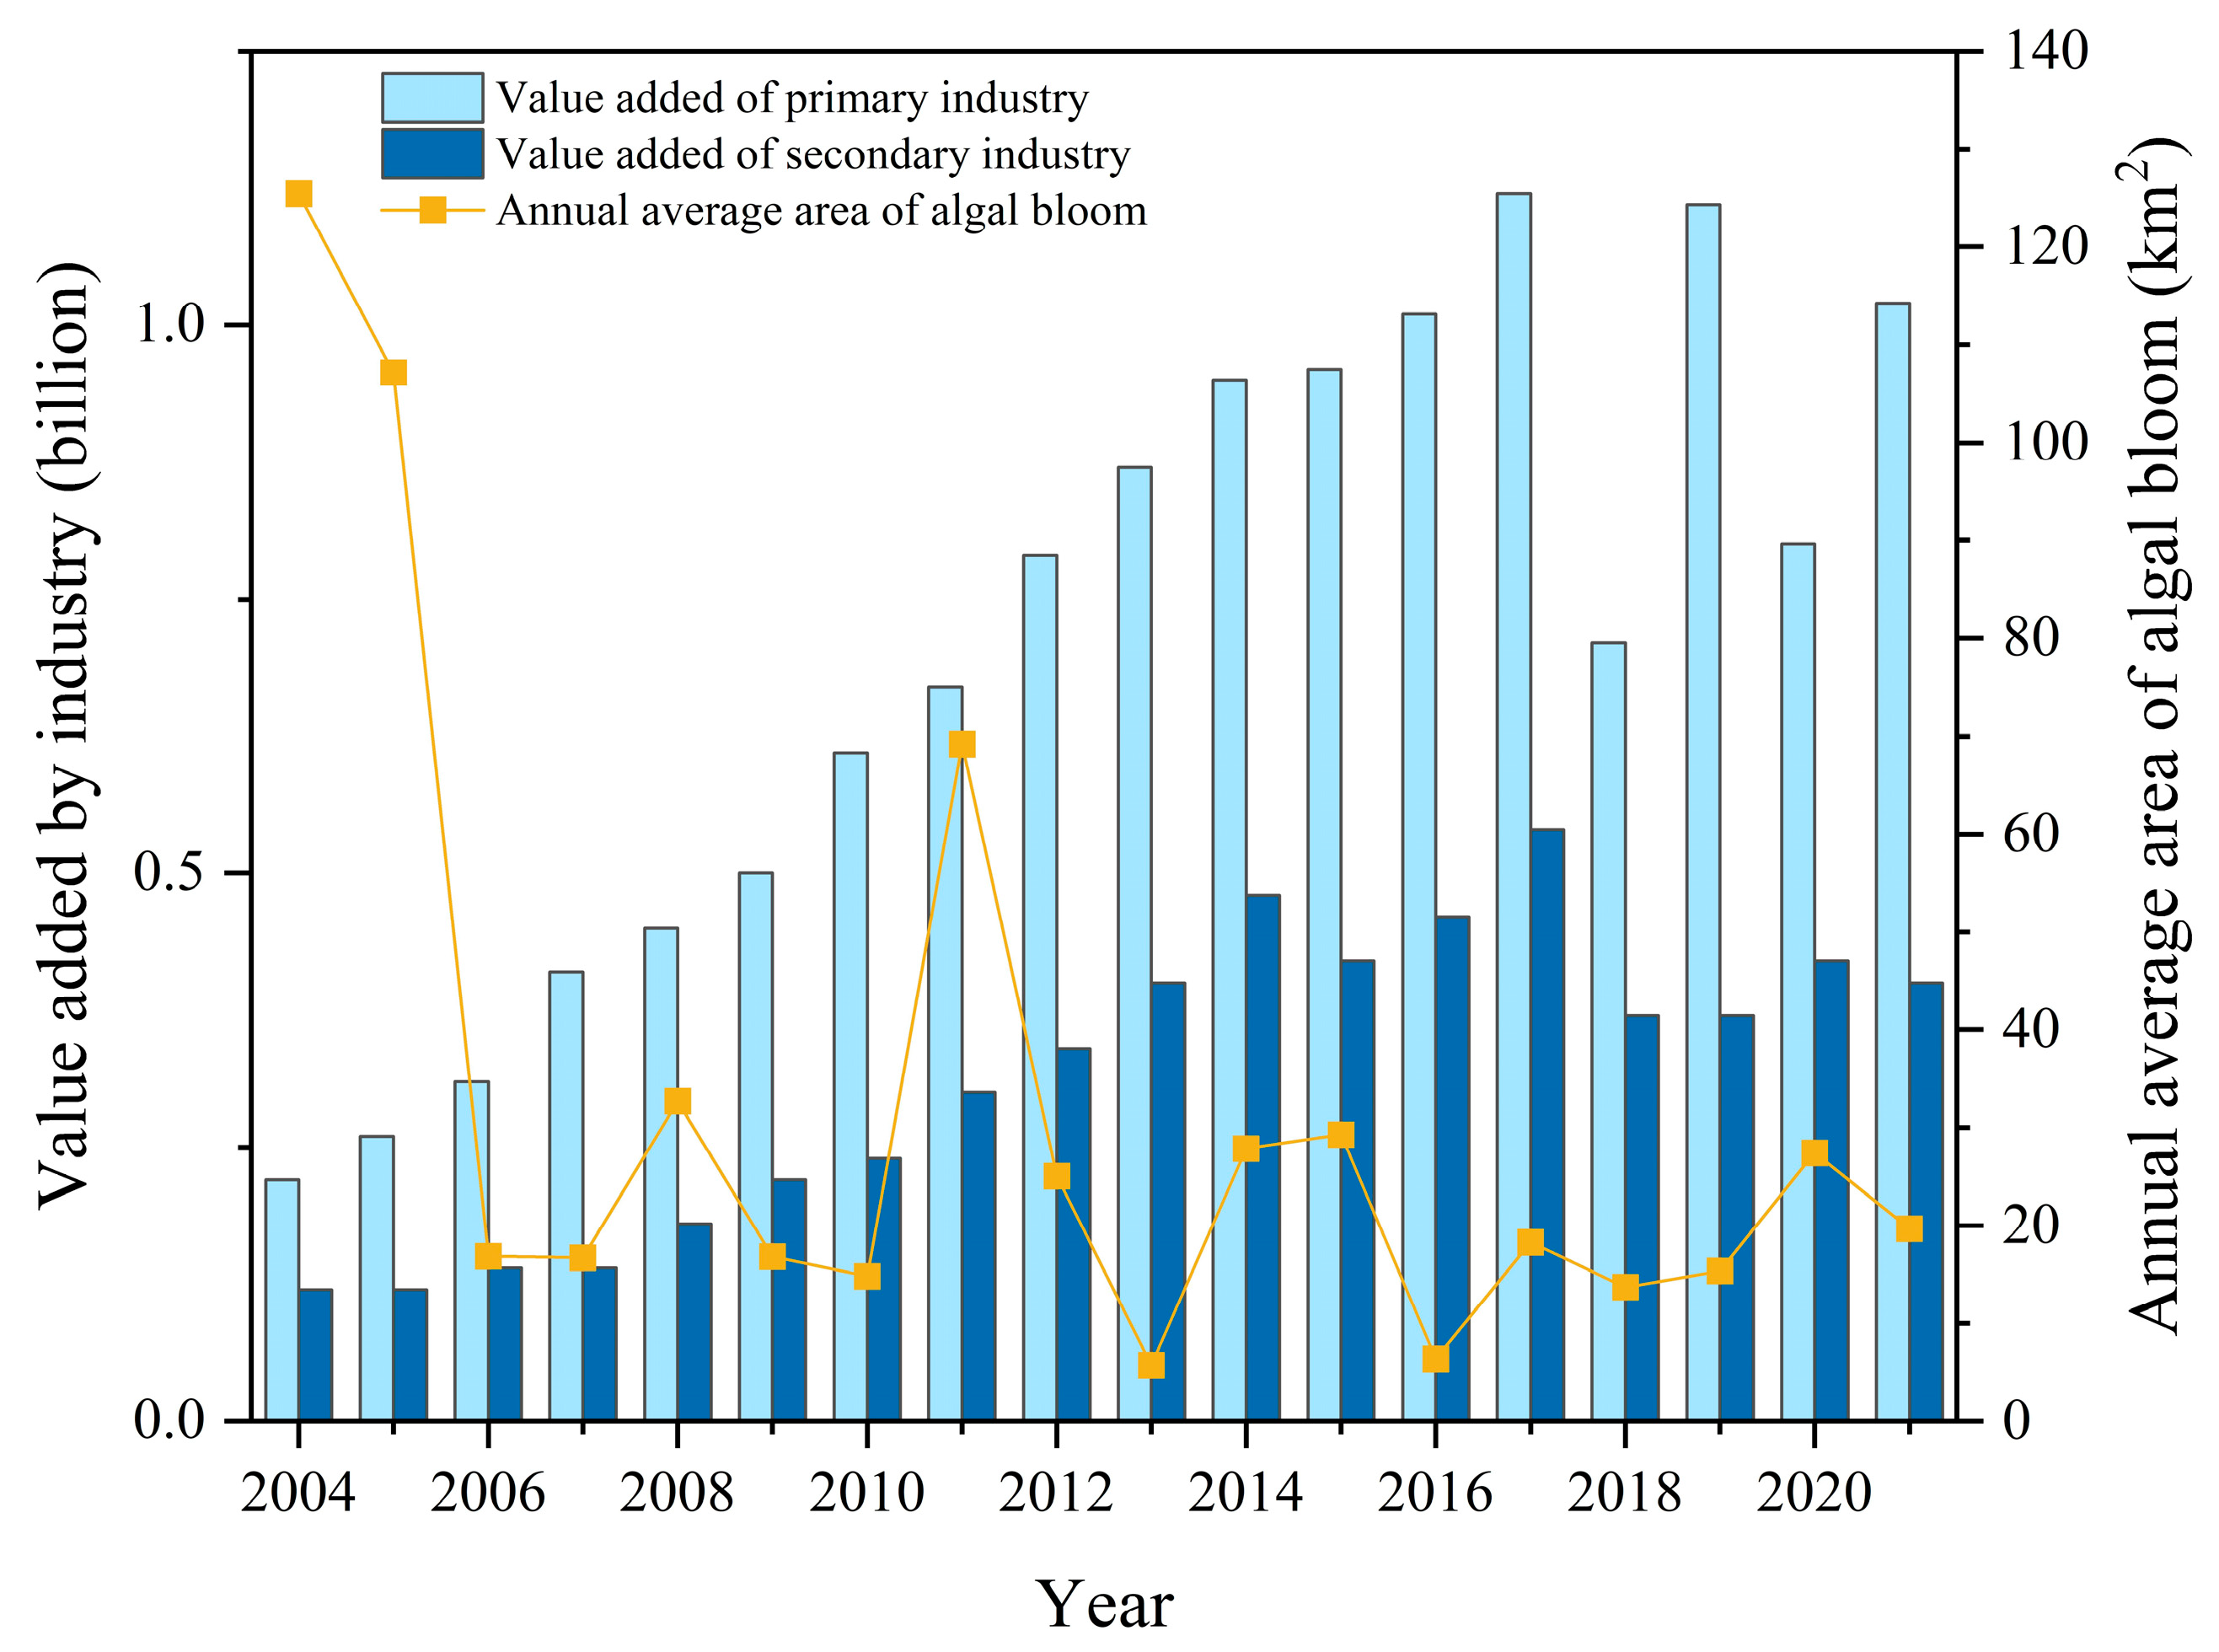
Human activities can cause ecological imbalances in lakes [49,50]. At the beginning of the 21st century, owing to accelerated population growth and the expansion of arable land, the development of agriculture and industry likewise accelerated. In Bohu county, for example, the value added by both the primary and secondary industries saw major increases between 2004 and 2021, reaching CNY 112 million and CNY 54 million in 2017, respectively (Figure 17). However, as a direct consequence of the rapid development of agriculture and industry, a large amount of untreated farmland drainage, industrial wastewater, and domestic sewage has been discharged into Lake Bosten. For instance, between 2000 and 2010, about 480 million cubic meters of farmland drainage and 20 million cubic meters of industrial wastewater and domestic sewage were discharged directly or indirectly into Lake Bosten in Yanqi, Hejing, Heshuo, and Bohu counties, as well as onto the lakeshore each year [34]. By considering Figure 16, it can be seen that early production methods had a detrimental effect on the lake’s water quality, as the nutrients in farmland drainage, industrial wastewater, and domestic sewage provided favorable conditions for the occurrence of algal blooms. This resulted in a large area and high frequency of algal blooms. Since 2017, however, the water quality of the lake has improved as the value added by the region’s primary and secondary industries has declined. This change is closely related to local government policies, such as the closure or relocation of factories in the lake district and the closure of outfalls, which have effectively reduced the input of nutrients. In response to these initiatives, the area and frequency of algal blooms have decreased.
Secondly, the discharge of domestic wastewater, restaurant waste, boat oil, and domestic garbage from local tourist attractions has contributed to the pollution in the lake [33]. In addition to reducing the water quality, the pollution has increased the nutrients in the lake and has provided favorable conditions for algal growth, thus promoting the occurrence of algal blooms. These factors indicate that the pollution from tourism activities has had a certain driving effect on the frequency, size, and duration of algal blooms.

4. Discussion

4.1. Water-Quality Trends in Lake Bosten

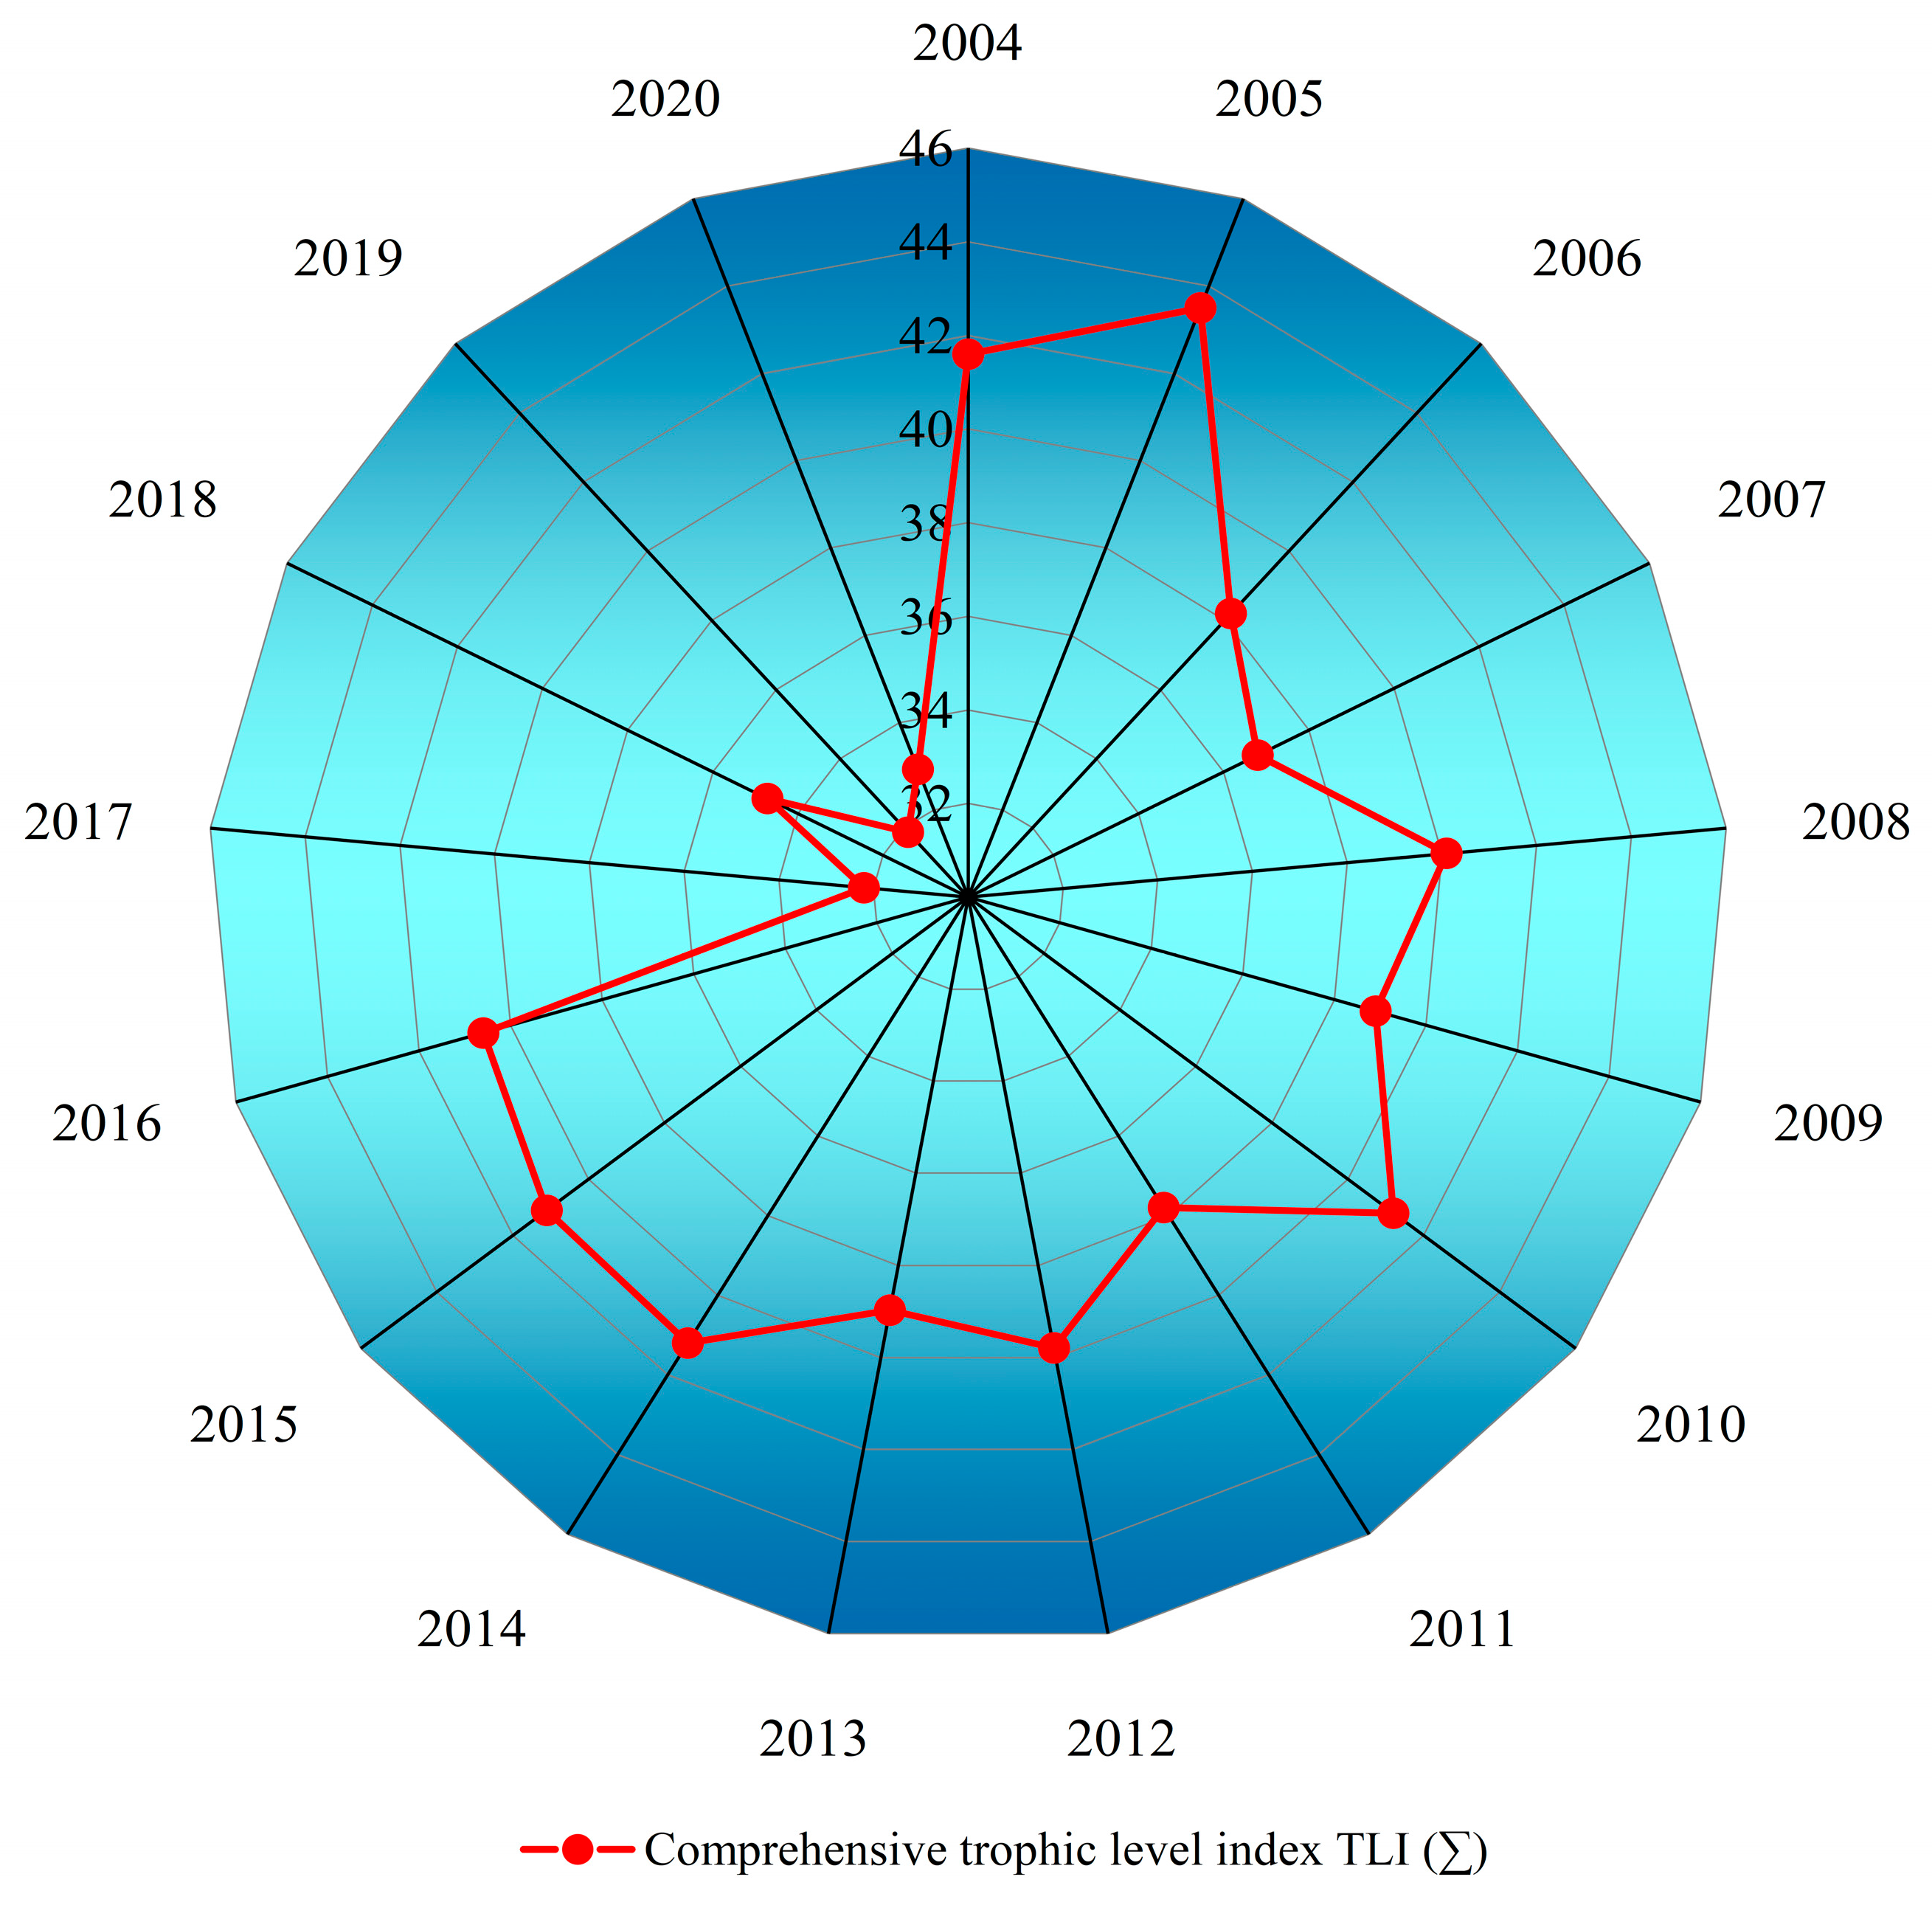
In order to have a more comprehensive understanding of the changing status of the water quality of Lake Bosten, the trend of the water quality of Lake Bosten was further analyzed by the integrated trophic state index TLI(Σ) in combination with the measured Chla, TP, TN, SD and CODMn data from 2004 to 2020. Figure 18 demonstrates the integrated trophic state index TLI(Σ) of Lake Bosten from 2004 to 2020.
Furthermore, by combining Figure 18 and Table 3, we can see that the TLI(Σ) did not exceed 44 from 2004 to 2020, and was always in the mesotrophic state. In 2005, the TLI(Σ) was the highest, reaching 43.5, which corresponds to the higher average algal-bloom area of that year and further verifies the unfavorable impacts of the region’s early production methods. In contrast, the TLI(Σ) in 2017 was the lowest (32.2), which corresponds to the lower average area of algal bloom for the same period and indicates that the water quality of the lake had significantly improved. For 2004–2020, the average value of the TLI(Σ) was 38.32 and showed an overall decreasing trend, indicating that the water quality was gradually improved and the area and frequency of algal bloom were reduced accordingly.
The boost in the lake’s water quality is closely related to the relevant management measures implemented by the local government. Starting in 2017, a series of water-resource management measures were introduced across the Lake Bosten region. These included the transfer of water to the Huangshui Gorge and Lake Bosten through the Kaidu River and the implementation of ecological water transfers to the Tarim River in winter, both of which promoted improved circulation of the targeted water body. In addition, the local government also took treatment measures such as closing the outfalls, which contributed substantially to water-quality improvement. This paper verifies the positive effects of these measures through data analysis. However, because Lake Bosten is still in a mesotrophic state, it is necessary to continue to maintain and strengthen water-quality management in the future to prevent further eutrophication of the lake.

4.2. Implications for Enhancing Ecological Management of Lakes

Since 2000, the expansion of arable land has led to a rise in water use for agricultural irrigation as the population increases and food demand rises. This, in turn, has reduced the amount of water flowing into Lake Bosten. In addition, between 2000 and 2010, the lake made a total of 11 ecological water transfers to the lower Tarim River, for a total volume of 19.11 × 10⁸ m3. The continued decline in water level and lake area during this process further increased the risk of water-quality deterioration [33,51].
The water issues in Lake Bosten have been exacerbated by the presence of outfalls, which are mainly located in the northwestern and western parts of the lake, next to the surrounding towns and agricultural zones. Discharge that has either directly or indirectly entered the lake via these outfalls includes farmland drainage and domestic sewage, along with industrial wastewater from nearby paper mills, sugar mills, tomato-paste factories, and other food-processing enterprises [33,52]. Farmland drainage in particular has become an important source of water-quality deterioration, with the large amounts of nutrient-rich untreated drainage water contributing to the occurrence of algal blooms. In addition, the northwestern and western parts of Lake Bosten (the Huangshuigou inlet area) are rich in reeds. Although reeds possess a certain capacity for water purification, they are insufficient to fully absorb the large amounts of nitrogen, phosphorus, and other nutrients originating from agricultural runoff, industrial effluents, and domestic sewage. Furthermore, the extensive reed coverage reduces water circulation in the surrounding areas, making it easier for pollutants to accumulate.
Currently, the booming fisheries and tourism industries have brought impressive economic benefits to the local community. However, in order to achieve sustainable development, the water environment of Lake Bosten cannot be sacrificed. Relying solely on the self-purification capacity of the lake to restore water quality is an unrealistic strategy. Therefore, necessary management measures must be taken to ensure the stability of the lake’s ecosystem and the long-term improvement of its water quality.
According to the analysis of driving factors in this study, the spatiotemporal variations of algal blooms in Lake Bosten are influenced by multiple factors, including lake area, meteorological conditions, water environment, and human activities. Among these, lake area and water environment are primarily affected by human activities.
In summary, to ensure the sustainable development of Lake Bosten, emphasis should be placed on maintaining the stability of the water level and lake area to ensure that the lake has a certain self-purification capacity. At the same time, the control of nutrient input should be strengthened to reduce the conditions for algal bloom from the source. In addition, the northwestern and western parts of the lake (i.e., where the yellow ditch water enters the lake) should be designated as the key management area, and targeted measures should be taken to manage the lake. However, these management measures cannot be implemented without the strong support of the local government in terms of policies and regulations.

4.3. Advantages and Disadvantages of Using Remote Sensing for Monitoring Algal Blooms

Remote-sensing technology can provide large-scale information on algal blooms and dynamically reflect the spatiotemporal characteristics of blooms, effectively overcoming the shortcomings of traditional monitoring methods in terms of cost and labor intensity. Therefore, remote-sensing technology has become an indispensable means of monitoring the environment of water bodies. The application of multi-source remote-sensing data provides a higher frequency of algal-bloom monitoring and richer spatial information, enabling us to monitor the spatiotemporal changes of algal blooms more comprehensively and accurately.
Monitoring the eutrophication process of water bodies and changes in cyanobacterial bloom expansion and gradual extinction by remote sensing is a challenge in remote sensing studies of algal blooms [53,54]. Although this paper has analyzed the spatial distribution of algal-bloom coverage area and bloom frequency for different risk classes in Lake Bosten, the remote-sensing imagery was not able to monitor the blooms effectively in winter due to the low temperatures and the cloud limitations of the remote-sensing imagery. Future studies could consider other methods to overcome this limitation so that seasonal algal-bloom monitoring and analysis can be carried out more comprehensively.
Due to the distinct absorption peak of phycocyanin (a characteristic pigment of cyanobacteria) at 620–630 nm, the Adjusted Floating Algae Index (AFAI) was primarily designed to detect algal blooms dominated by floating cyanobacteria. However, this spectral-based method shows limited accuracy in identifying blooms caused by other algal groups (e.g., green algae and diatoms) due to their lack of such specific spectral features. Therefore, the current study focuses specifically on extracting cyanobacterial blooms in Lake Bosten, while future research will incorporate additional methodologies to improve detection of other algal bloom types. In addition, future long-term monitoring of algal blooms using remote-sensing technology should be integrated with quantitative models of nutrient loading to enable a more precise analysis of the contributions of various pollution sources to the lake’s nutrient load.

5. Conclusions

In this paper, the MNDWI method was used to extract the watershed extent of Lake Bosten from 2004 to 2023, and the AFAI method was used to extract the algal-bloom coverage information. The spatiotemporal changes of algal blooms from 2004 to 2023 were comprehensively explored by classifying the blooms, counting the proportion of the coverage area of different bloom classes in the annual and seasonal dimensions, and analyzing the trends of the coverage area and their spatial distribution characteristics with the frequency of the blooms and construction of an LSTM model to predict the spatial distribution of algal-bloom frequency in 2030 and 2035. The driving effects of four aspects on algal blooms—namely, lake area, meteorological factors, water body environment, and human activities—were further analyzed. The results of the study are as follows.
(1) During the period from 2004 to 2023, algal blooms in Lake Bosten were primarily concentrated at low-risk levels, with the highest bloom coverage observed in 2004 and 2005, accounting for 12.2% and 10.8%, respectively. In summer and autumn, the proportion of medium- and high-risk algal bloom coverage was significantly higher than in spring; specifically, the coverage reached 2.74% in the summer of 2004 and 3.03% in the autumn of 2005, while it remained below 1% in spring throughout the study period. Overall, the degree of eutrophication in Lake Bosten has significantly improved, and water-quality management has achieved certain results, indicating a positive outlook;
(2) During 2004–2023, the high-frequency areas of algal bloom occurrence were mainly concentrated in the western and northwestern parts of the lake. Algal-bloom frequency was much higher in the central part in 2004–2013 compared to 2014–2023. Also in the central part, bloom frequency was higher in spring and summer than in autumn. Based on these findings, the continued management of Lake Bosten should focus on the western and northwestern parts as the key areas for management;
(3) The constructed LSTM model for predicting the spatial distribution of algal-bloom frequency achieved an R2 of 0.86, indicating high stability. The prediction results show that algal blooms in Lake Bosten in 2030 and 2035 will be limited to the lake’s peripheral areas, which is consistent with the future trends reflected by the spatiotemporal variations in the spatial distribution of algal-bloom frequency;
(4) The interactions among meteorological factors exhibit significant impacts on the formation of algal blooms, with the q values of temperature and precipitation interactions both exceeding 0.5, indicating their strong driving effects on algal blooms in Lake Bosten. However, the lake area and water environment are primarily influenced by human activities, making anthropogenic factors the main driving force behind the variations in algal blooms in Lake Bosten.

Author Contributions

H.W. performed the data analysis and paper writing; Z.L. contributed to the formulation of the research questions; Y.W. managed the project and funded this paper; and T.X. was responsible for data processing and interpretation of the results. All authors have read and agreed to the published version of the manuscript.

Funding

This research was support by Research and Development, Application of Key Technologies for the Utilization of Aquatic Plant and Animal Resources and Water Ecological Environment Protection in Bosten Lake of Xinjiang Uygur Autonomous Region, grant number 2023B02037.

Data Availability Statement

The data presented in this study are available on request from the corresponding author.

Conflicts of Interest

The authors declare no conflicts of interest.

References

  1. Ma, J.; Jin, S.; Li, J.; He, Y.; Shang, W. Spatio-temporal variations and driving forces of harmful algal blooms in Chaohu Lake: A multi-source remote sensing approach. Remote Sens. 2021, 13, 427. [Google Scholar] [CrossRef]
  2. Liu, D.; Ding, H.; Han, X.; Lang, Y.; Chen, W. Mapping algal blooms in aquatic ecosystems using long-term landsat data: A case study of Yuqiao reservoir from 1984–2022. Remote Sens. 2023, 15, 4317. [Google Scholar] [CrossRef]
  3. Duan, H.; Yao, X.; Zhang, D.; Jin, H.; Wei, Q. Long-term temporal and spatial monitoring of cladophora blooms in qinghai lake based on multi-source remote sensing images. Remote Sens. 2022, 14, 853. [Google Scholar] [CrossRef]
  4. Xie, R.; Pang, Y.; Bao, K. Spatiotemporal distribution of water environmental capacity—A case study on the western areas of Taihu Lake in Jiangsu Province, China. Environ. Sci. Pollut. Res. 2014, 21, 5465–5473. [Google Scholar] [CrossRef] [PubMed]
  5. Jiang, Y.-J.; He, W.; Liu, W.-X.; Qin, N.; Ouyang, H.-L.; Wang, Q.-M.; Kong, X.-Z.; He, Q.-S.; Yang, C.; Yang, B. The seasonal and spatial variations of phytoplankton community and their correlation with environmental factors in a large eutrophic Chinese lake (Lake Chaohu). Ecol. Indic. 2014, 40, 58–67. [Google Scholar] [CrossRef]
  6. Chen, J.; Wang, J.; Wang, Q.; Lv, J.; Liu, X.; Chen, J.; Li, N. Common fate of sister lakes in Hulunbuir Grassland: Long-term harmful algal bloom crisis from multi-source remote sensing insights. J. Hydrol. 2021, 594, 125970. [Google Scholar] [CrossRef]
  7. Zhen, Y.; Yan, Q. Improving spaceborne GNSS-R algal bloom detection with meteorological data. Remote Sens. 2023, 15, 3122. [Google Scholar] [CrossRef]
  8. Wu, J.Y.; Xu, Q.J.; Gao, G.; Shen, J.H. Evaluating genotoxicity associated with microcystin-LR and its risk to source water safety in Meiliang Bay, Taihu Lake. Environ. Toxicol. Int. J. 2006, 21, 250–255. [Google Scholar] [CrossRef]
  9. Hu, C.; Lee, Z.; Ma, R.; Yu, K.; Li, D.; Shang, S. Moderate resolution imaging spectroradiometer (MODIS) observations of cyanobacteria blooms in Taihu Lake, China. J. Geophys. Res. Oceans 2010, 115, C04002. [Google Scholar] [CrossRef]
  10. Wang, Y.; Guo, Y.; Zhao, Y.; Wang, L.; Chen, Y.; Yang, L. Spatiotemporal heterogeneities and driving factors of water quality and trophic state of a typical urban shallow lake (Taihu, China). Environ. Sci. Pollut. Res. 2022, 29, 53831–53843. [Google Scholar] [CrossRef] [PubMed]
  11. Zhou, Q.; Chen, H.; Cheng, B.; Cheng, Y.; Guo, B. A Study of the Effect of Lake Shape on Hydrodynamics and Eutrophication. Sustainability 2025, 17, 1720. [Google Scholar] [CrossRef]
  12. Wu, C.; Xie, M.; Lin, L.; He, S.; Luo, C.; Dong, H. A Study on Spatiotemporal Downscaling Methods for Chlorophyll-a Concentration in Taihu Lake Based on Remote Sensing Data from Sentinel-2 MSI and COMS-1 GOCI. Water 2025, 17, 855. [Google Scholar] [CrossRef]
  13. Jia, Y.; Xiao, Z.; Yang, L.; Liu, Q.; Jin, S.; Lv, Y.; Yan, Q. Enhancing Algal Bloom Level Monitoring with CYGNSS and Sentinel-3 Data. Remote Sens. 2024, 16, 3915. [Google Scholar] [CrossRef]
  14. Zhang, T.; Hu, H.; Ma, X.; Zhang, Y. Long-term spatiotemporal variation and environmental driving forces analyses of algal blooms in Taihu Lake based on multi-source satellite and land observations. Water 2020, 12, 1035. [Google Scholar] [CrossRef]
  15. Hu, C. A novel ocean color index to detect floating algae in the global oceans. Remote Sens. Environ. 2009, 113, 2118–2129. [Google Scholar] [CrossRef]
  16. Zhou, T.; Li, Y.; Jiang, B.; Alatalo, J.M.; Li, C.; Ni, C. Tracking spatio-temporal dynamics of harmful algal blooms using long-term MODIS observations of Chaohu Lake in China from 2000 to 2021. Ecol. Indic. 2023, 146, 109842. [Google Scholar] [CrossRef]
  17. Fang, C.; Song, K.; Shang, Y.; Ma, J.; Wen, Z.; Du, J. Remote sensing of harmful algal blooms variability for Lake Hulun using adjusted FAI (AFAI) algorithm. J. Environ. Inform. 2018, 34, 108–122. [Google Scholar] [CrossRef]
  18. Lin, Y.; Zhang, T.; Ye, Q.; Cai, J.; Wu, C.; Syed, A.K.; Li, J. Long-term remote sensing monitoring on LUCC around Chaohu Lake with new information of algal bloom and flood submerging. Int. J. Appl. Earth Obs. Geoinf. 2021, 102, 102413. [Google Scholar] [CrossRef]
  19. Luo, C.; Wang, X.; Chen, Y.; Luo, H.; Dong, H.; He, S. Predictive Modeling of Cyanobacterial Blooms and Diurnal Variation Analysis Based on GOCI. Water 2025, 17, 749. [Google Scholar] [CrossRef]
  20. Qin, X.; Xia, W.; Hu, X.; Shao, Z. Dynamic variations of cyanobacterial blooms and their response to urban development and climate change in Lake Chaohu based on Landsat observations. Environ. Sci. Pollut. Res. 2022, 29, 33152–33166. [Google Scholar] [CrossRef]
  21. Liu, H.; Sun, K.; Liu, X.; Yao, R.; Cao, W.; Zhang, L.; Wang, X. Spatial and temporal distributions of microplastics and their macroscopic relationship with algal blooms in Chaohu Lake, China. J. Contam. Hydrol. 2022, 248, 104028. [Google Scholar] [CrossRef]
  22. Zhang, Y.; Loiselle, S.; Shi, K.; Han, T.; Zhang, M.; Hu, M.; Jing, Y.; Lai, L.; Zhan, P. Wind effects for floating algae dynamics in eutrophic lakes. Remote Sens. 2021, 13, 800. [Google Scholar] [CrossRef]
  23. Xu, Y.; Xu, T. An evolving marine environment and its driving forces of algal blooms in the Southern Yellow Sea of China. Mar. Environ. Res. 2022, 178, 105635. [Google Scholar] [CrossRef] [PubMed]
  24. Zhou, Z.-X.; Yu, R.-C.; Zhou, M.-J. Evolution of harmful algal blooms in the East China Sea under eutrophication and warming scenarios. Water Res. 2022, 221, 118807. [Google Scholar] [CrossRef]
  25. Hu, M.; Zhang, Y.; Ma, R.; Xue, K.; Cao, Z.; Chu, Q.; Jing, Y. Optimized remote sensing estimation of the lake algal biomass by considering the vertically heterogeneous chlorophyll distribution: Study case in Lake Chaohu of China. Sci. Total Environ. 2021, 771, 144811. [Google Scholar] [CrossRef]
  26. Chen, C.; Wang, Y.; Chen, K.; Shi, X.; Yang, G. Using hydrogen peroxide to control cyanobacterial blooms: A mesocosm study focused on the effects of algal density in Lake Chaohu, China. Environ. Pollut. 2021, 272, 115923. [Google Scholar] [CrossRef] [PubMed]
  27. Jing, Y.; Zhang, Y.; Hu, M.; Chu, Q.; Ma, R. MODIS-satellite-based analysis of long-term temporal-spatial dynamics and drivers of algal blooms in a plateau lake Dianchi, China. Remote Sens. 2019, 11, 2582. [Google Scholar] [CrossRef]
  28. Zhao, C.; Shao, N.; Yang, S.; Ren, H.; Ge, Y.; Zhang, Z.; Feng, P.; Liu, W. Quantitative assessment of the effects of human activities on phytoplankton communities in lakes and reservoirs. Sci. Total Environ. 2019, 665, 213–225. [Google Scholar] [CrossRef]
  29. Khalil, M.; Iqbal, M.; Turan, V.; Tauqeer, H.M.; Farhad, M.; Ahmed, A.; Yasin, S. Household chemicals and their impact. In Environmental Micropollutants; Elsevier: Amsterdam, The Netherlands, 2022; pp. 201–232. [Google Scholar]
  30. Xia, R.; Zhang, Y.; Wang, G.; Zhang, Y.; Dou, M.; Hou, X.; Qiao, Y.; Wang, Q.; Yang, Z. Multi-factor identification and modelling analyses for managing large river algal blooms. Environ. Pollut. 2019, 254, 113056. [Google Scholar] [CrossRef]
  31. Busico, G.; Kazakis, N.; Cuoco, E.; Colombani, N.; Tedesco, D.; Voudouris, K.; Mastrocicco, M. A novel hybrid method of specific vulnerability to anthropogenic pollution using multivariate statistical and regression analyses. Water Res. 2020, 171, 115386. [Google Scholar] [CrossRef] [PubMed]
  32. Jia, T.; Zhang, X.; Dong, R. Long-term spatial and temporal monitoring of cyanobacteria blooms using MODIS on google earth engine: A case study in Taihu Lake. Remote Sens. 2019, 11, 2269. [Google Scholar] [CrossRef]
  33. Chen, Y.; Du, Q.; Chen, Y. Sustainable Water Use in the Bosten Lake Basin; Science Press: Beijing, China, 2013. [Google Scholar]
  34. Wu, J.; Ma, L.; Zeng, H. Water quality and quantity characteristics and its evolution in Lake Bosten, Xinjiang over the past 50 years. Sci. Geogr. Sin. 2013, 33, 231–237. [Google Scholar]
  35. Du, Y.; Zhang, Y.; Ling, F.; Wang, Q.; Li, W.; Li, X. Water bodies’ mapping from Sentinel-2 imagery with modified normalized difference water index at 10-m spatial resolution produced by sharpening the SWIR band. Remote Sens. 2016, 8, 354. [Google Scholar] [CrossRef]
  36. Chang, K.; Yue, W.; Wang, H.; Tan, K.; Liu, X.; Cao, X.; Chen, W. Research on the Method of Extracting Water Body Information in Central Asia Based on Google Earth Engine. Water 2025, 17, 804. [Google Scholar] [CrossRef]
  37. Li, X.Y.; Ma, Y.J.; Xu, H.Y.; Wang, J.H.; Zhang, D.S. Impact of land use and land cover change on environmental degradation in Lake Qinghai watershed, northeast Qinghai-Tibet Plateau. Land Degrad. Dev. 2009, 20, 69–83. [Google Scholar] [CrossRef]
  38. Wang, J.; Ding, J.; Li, G.; Liang, J.; Yu, D.; Aishan, T.; Zhang, F.; Yang, J.; Abulimiti, A.; Liu, J. Dynamic detection of water surface area of Ebinur Lake using multi-source satellite data (Landsat and Sentinel-1A) and its responses to changing environment. Catena 2019, 177, 189–201. [Google Scholar] [CrossRef]
  39. Xia, T.; Xue, X.; Wang, H.; Zhu, Z.; Li, Z.; Wang, Y. Mechanism of Vegetation Greenness Change and Its Correlation with Terrestrial Water Storage in the Tarim River Basin. Land 2024, 13, 712. [Google Scholar] [CrossRef]
  40. Chen, Y.; Yao, W.; Chen, Y. High-Precision Prediction of Total Nitrogen Based on Distance Correlation and Machine Learning Models—A Case Study of Dongjiang River, China. Water 2025, 17, 1131. [Google Scholar] [CrossRef]
  41. Zhang, S.; Wang, Y.; Wang, Y.; Li, Z.; Hou, Y. Spatiotemporal evolution and influencing mechanisms of ecosystem service value in the Tarim River Basin, Northwest China. Remote Sens. 2023, 15, 591. [Google Scholar] [CrossRef]
  42. Wang, Y.; Sheng, Z.; Wang, H.; Xue, X.; Hu, J.; Yang, Y. Characterization and Multi-Scenario Prediction of Habitat Quality Evolution in the Bosten Lake Watershed Based on the InVEST and PLUS Models. Sustainability 2024, 16, 4202. [Google Scholar] [CrossRef]
  43. Li, T.; Chu, C.; Zhang, Y.; Ju, M.; Wang, Y. Contrasting eutrophication risks and countermeasures in different water bodies: Assessments to support targeted watershed management. Int. J. Environ. Res. Public Health 2017, 14, 695. [Google Scholar] [CrossRef]
  44. Wang, T.; Yan, J.; Ma, J.; Li, F.; Liu, C.; Cai, Y.; Chen, S.; Zeng, J.; Qi, Y. A fuzzy comprehensive assessment and hierarchical management system for urban lake health: A case study on the lakes in Wuhan City, Hubei Province, China. Int. J. Environ. Res. Public Health 2018, 15, 2617. [Google Scholar] [CrossRef]
  45. Zeng, Y.; Wang, Z.; Zhao, Q.; Huang, N.; Li, J.; Wang, J.; Sun, F. Assessment of the Effects and Contributions of Natural and Human Factors on the Nutrient Status of Typical Lakes and Reservoirs in the Yangtze River Basin. Water 2025, 17, 559. [Google Scholar] [CrossRef]
  46. Xu, F.-L.; Zhao, Z.-Y.; Zhan, W.; Zhao, S.-S.; Dawson, R.; Tao, S. An ecosystem health index methodology (EHIM) for lake ecosystem health assessment. Ecol. Model. 2005, 188, 327–339. [Google Scholar] [CrossRef]
  47. Kane, D.D.; Gordon, S.I.; Munawar, M.; Charlton, M.N.; Culver, D.A. The Planktonic Index of Biotic Integrity (P-IBI): An approach for assessing lake ecosystem health. Ecol. Indic. 2009, 9, 1234–1247. [Google Scholar] [CrossRef]
  48. Mooij, W.M.; Trolle, D.; Jeppesen, E.; Arhonditsis, G.; Belolipetsky, P.V.; Chitamwebwa, D.B.; Degermendzhy, A.G.; DeAngelis, D.L.; De Senerpont Domis, L.N.; Downing, A.S. Challenges and opportunities for integrating lake ecosystem modelling approaches. Aquat. Ecol. 2010, 44, 633–667. [Google Scholar] [CrossRef]
  49. Chuai, X.-m.; Chen, X.; Yang, L.; Zeng, J.; Miao, A.; Zhao, H. Effects of climatic changes and anthropogenic activities on lake eutrophication in different ecoregions. Int. J. Environ. Sci. Technol. 2012, 9, 503–514. [Google Scholar] [CrossRef]
  50. Chislock, M.F.; Kaul, R.B.; Durham, K.A.; Sarnelle, O.; Wilson, A.E. Eutrophication mediates rapid clonal evolution in Daphnia pulicaria. Freshw. Biol. 2019, 64, 1275–1283. [Google Scholar] [CrossRef]
  51. Liu, L.; Zhao, J.; Zhang, J.; Peng, W.; Fan, J.; Zhang, T. Water balance of Lake Bosten using annual water-budget method for the past 50 years. Arid. Land Geogr. 2013, 36, 33–40. [Google Scholar]
  52. Zhou, H.; Li, W.; Chen, Y.; Fu, A. Water-salt succession patterns (1951–2011) and its response to climate change in Lake Bosten. J. Lake Sci. 2014, 26, 55–65. [Google Scholar]
  53. Cannizzaro, J.P.; Carder, K.L. Estimating chlorophyll a concentrations from remote-sensing reflectance in optically shallow waters. Remote Sens. Environ. 2006, 101, 13–24. [Google Scholar] [CrossRef]
  54. Shen, F.; Tang, R.; Sun, X.; Liu, D. Simple methods for satellite identification of algal blooms and species using 10-year time series data from the East China Sea. Remote Sens. Environ. 2019, 235, 111484. [Google Scholar] [CrossRef]
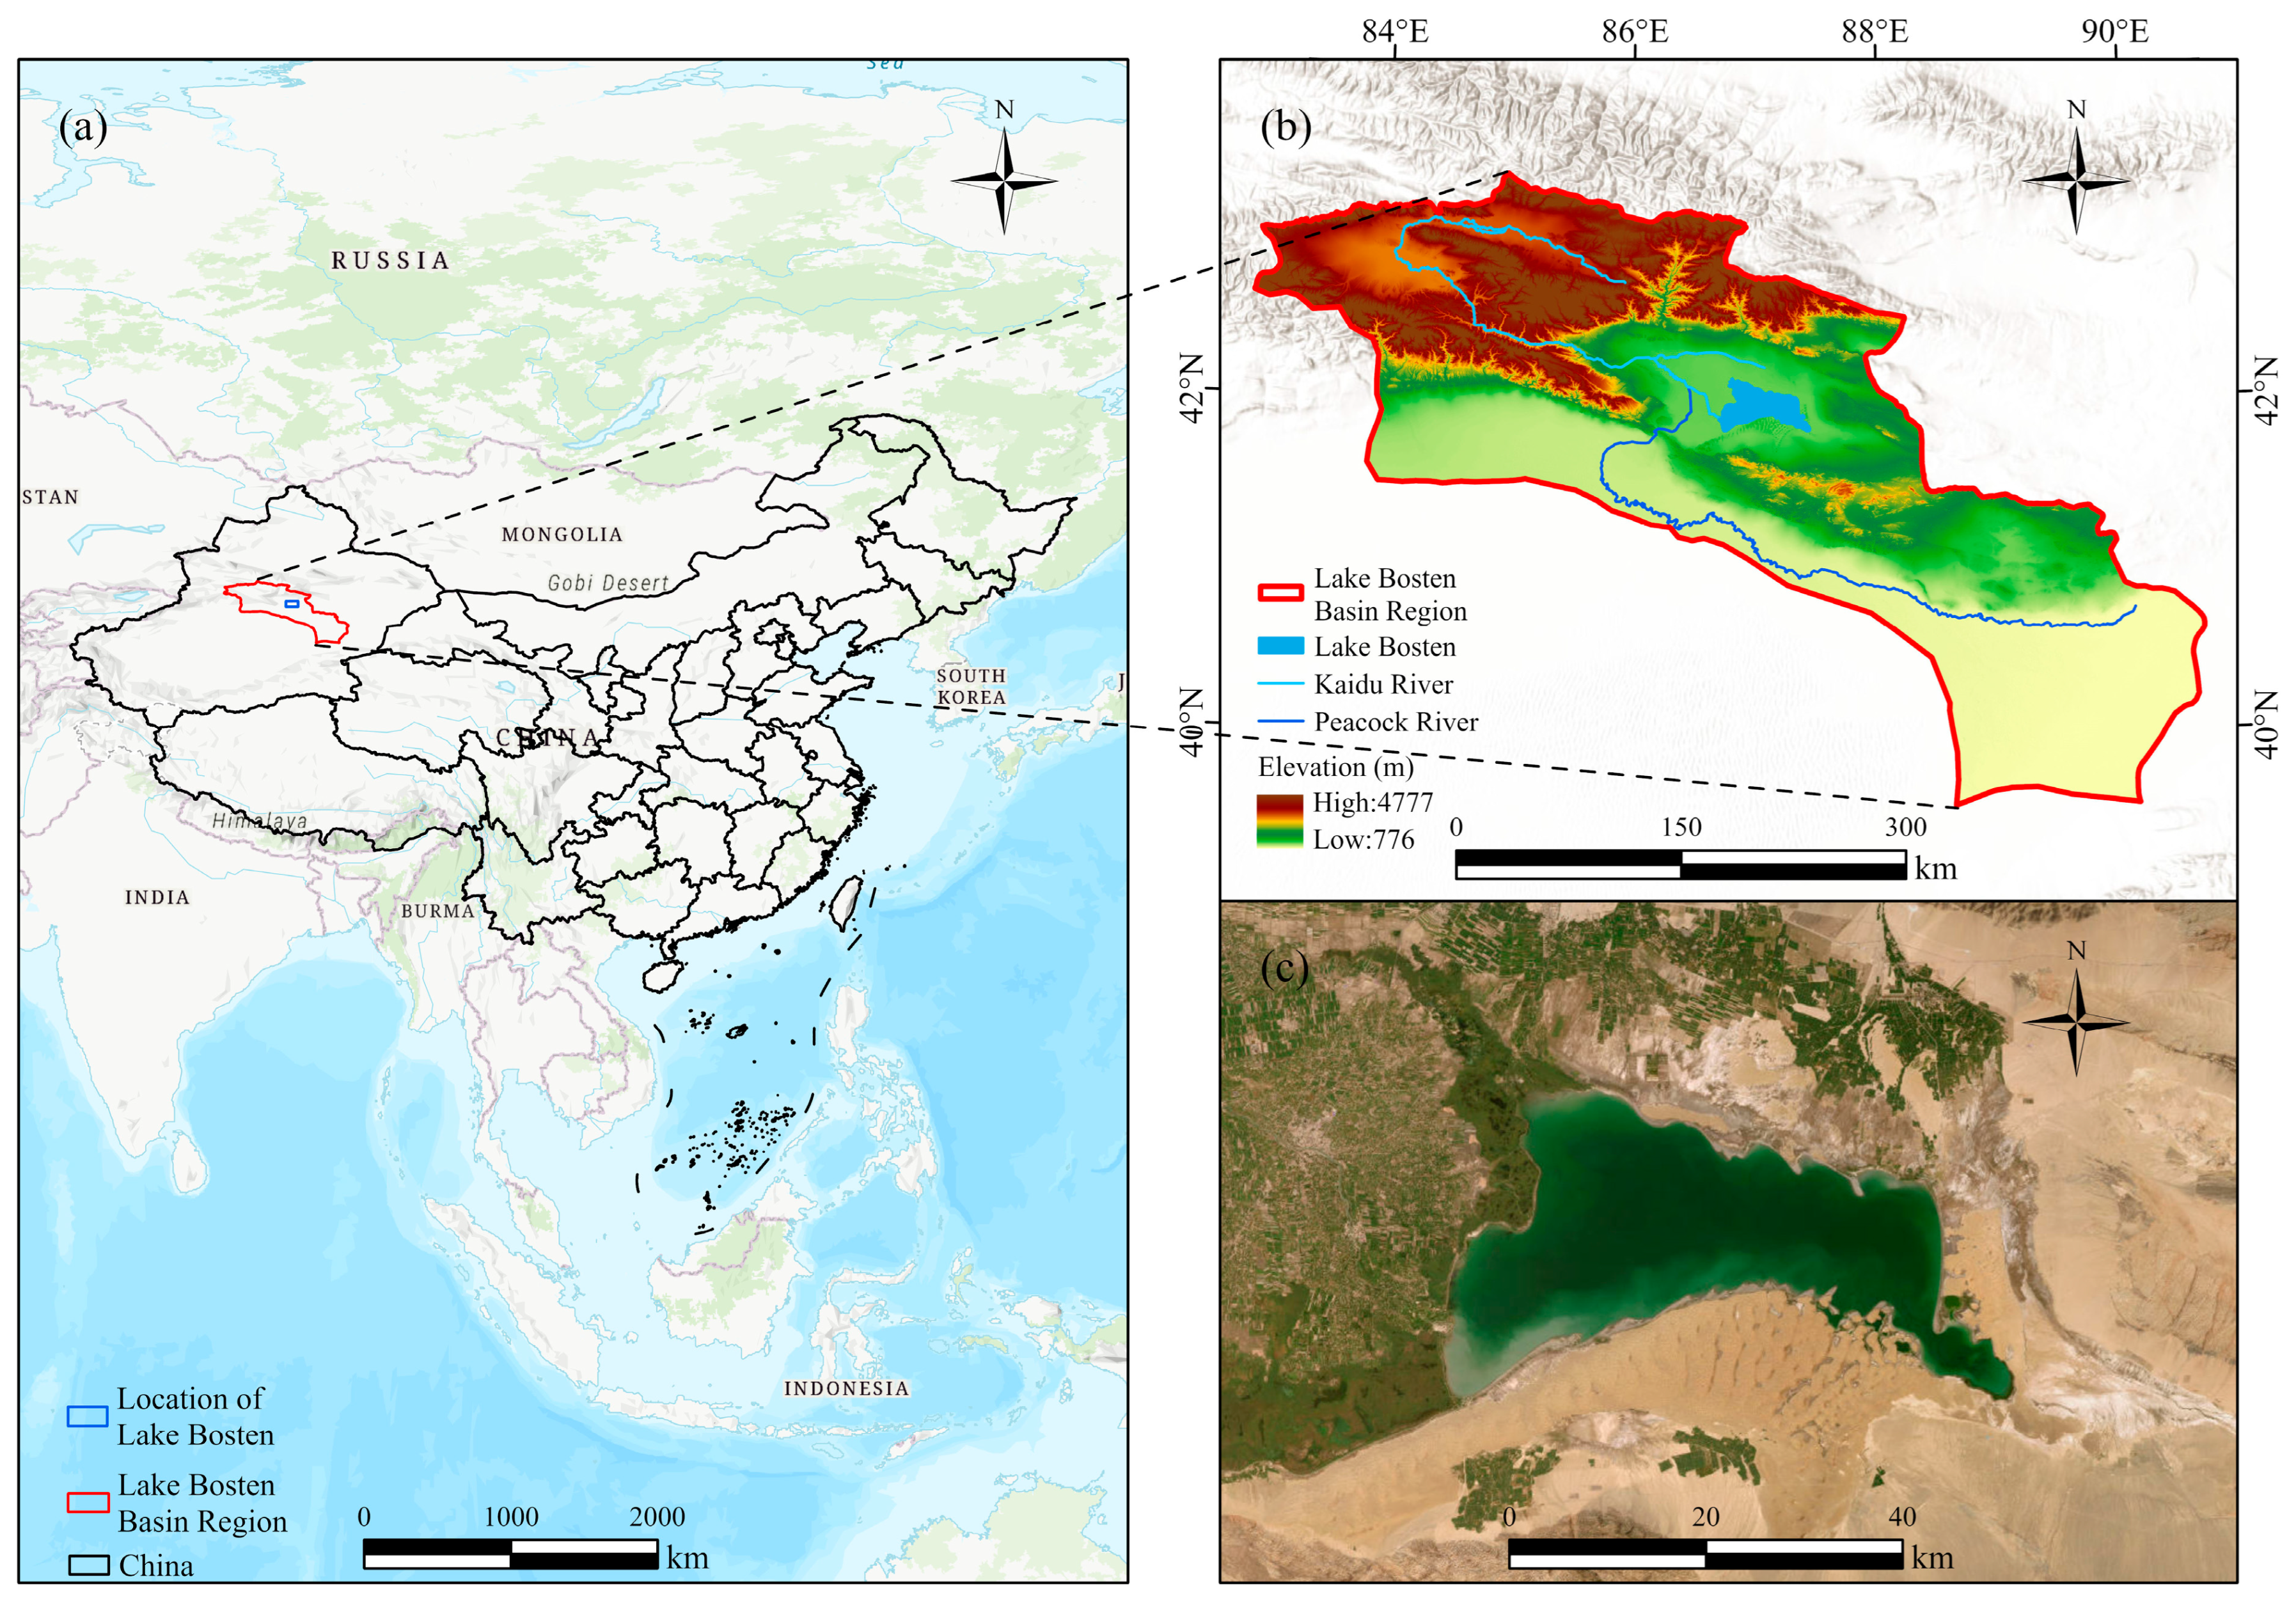
Figure 1. Sketch map of the study area. (Note: Drawing No. GS[2024]0650). (a) Location of Lake Bosten in China, (b) location of Lake Bosten in the Lake Bosten basin, (c) remote-sensing images of Lake Bosten.
Water 17 02394 g001
Figure 2. Technology roadmap.
Water 17 02394 g002
Figure 3. LSTM unfolding diagram.
Water 17 02394 g003
Figure 4. Map of Lake Bosten’s water area during 2004–2023.
Water 17 02394 g004
Figure 5. Trends and correlations between measured water level and lake area in Lake Bosten during 2004–2023. (a) Trend of water level and lake area. (b) Correlation analysis of water level and lake area.
Water 17 02394 g005
Figure 6. Plot of AFAI classification of the maximum area covered by algal blooms each year for the period 2004–2023. TM, ETM+, and OLI are sensors for Landsat5, Landsat7, and Landsat8, respectively, and MSI is a sensor for Sentinel-2.
Water 17 02394 g006
Figure 7. Proportion of area covered by algal blooms in years with different risk levels in Lake Bosten (2004–2023).
Water 17 02394 g007
Figure 8. Proportion of area covered by seasonal blooms at different risk levels in Lake Bosten. Proportion of area covered by seasonal algal blooms of different risk classes during (a) 2004–2008, (b) 2009–2013, (c) 2014–2018, and (d) 2019–2023.
Water 17 02394 g008
Figure 9. Average seasonal/annual algal-bloom coverage in Lake Bosten during 2004–2023.
Water 17 02394 g009
Figure 10. Spatiotemporal distribution of algal-bloom frequency in different years at Lake Bosten.
Water 17 02394 g010
Figure 11. Spatiotemporal distribution of algal-bloom frequency in different seasons at Lake Bosten.
Water 17 02394 g011
Figure 12. Training and evaluation of predictive models.
Water 17 02394 g012
Figure 13. Model prediction results.
Water 17 02394 g013
Figure 14. Spatial changes in the lake area of Lake Bosten during 2004–2023: (a) spatial changes during 2004–2013, (b) 2013–2019, and (c) 2019–2023.
Water 17 02394 g014
Figure 15. Meteorological factor detection results for 2004, 2013, 2019, and 2023.
Water 17 02394 g015
Figure 16. Concentrations of relevant water quality indicators in Lake Bosten during 2004–2020: (a) TN; (b) TP; (c) TN/TP; (d) Chla; (e) CODMn; and (f) SD.
Water 17 02394 g016
Figure 17. Value added by primary and secondary industries and average area covered by algal blooms in Bohu county during 2004–2021.
Water 17 02394 g017
Figure 18. Lake Bosten TLI(Σ) for 2004–2020.
Water 17 02394 g018
Table 1. Details of satellite remote-sensing data used in this study.
Data Source NameTime Scale Spatial Resolution/mTemporal Resolution/DayNumber of Bands
Landsat5 TM1982–201130167 bands
Landsat7 ETM+1999–present30168 bands
Landsat8 OLI2013–present30169 bands
Sentinel-22015–present20512 bands
Table 2. Values of the r i j 2 and W j trophic-level index formula.
ChlaTPTNSDCODMn
r i j 2 10.70560.67240.68890.6889
W j 0.26630.18790.1790.18340.1834
Table 3. Trophic-level classification of lakes.
TLI(Σ) < 30Oligotropher
30 ≤ TLI(Σ) ≤ 50Mesotropher
50 < TLI(Σ) ≤ 60Light eutropher
60 < TLI(Σ) ≤ 70Middle eutropher
TLI(Σ) > 70Hyper eutropher
Disclaimer/Publisher’s Note: The statements, opinions and data contained in all publications are solely those of the individual author(s) and contributor(s) and not of MDPI and/or the editor(s). MDPI and/or the editor(s) disclaim responsibility for any injury to people or property resulting from any ideas, methods, instructions or products referred to in the content.