Spatiotemporal Water Quality Assessment in Spatially Heterogeneous Horseshoe Lake, Madison County, Illinois Using Satellite Remote Sensing and Statistical Analysis (2020–2024)
Abstract
1. Introduction
2. Materials and Methods
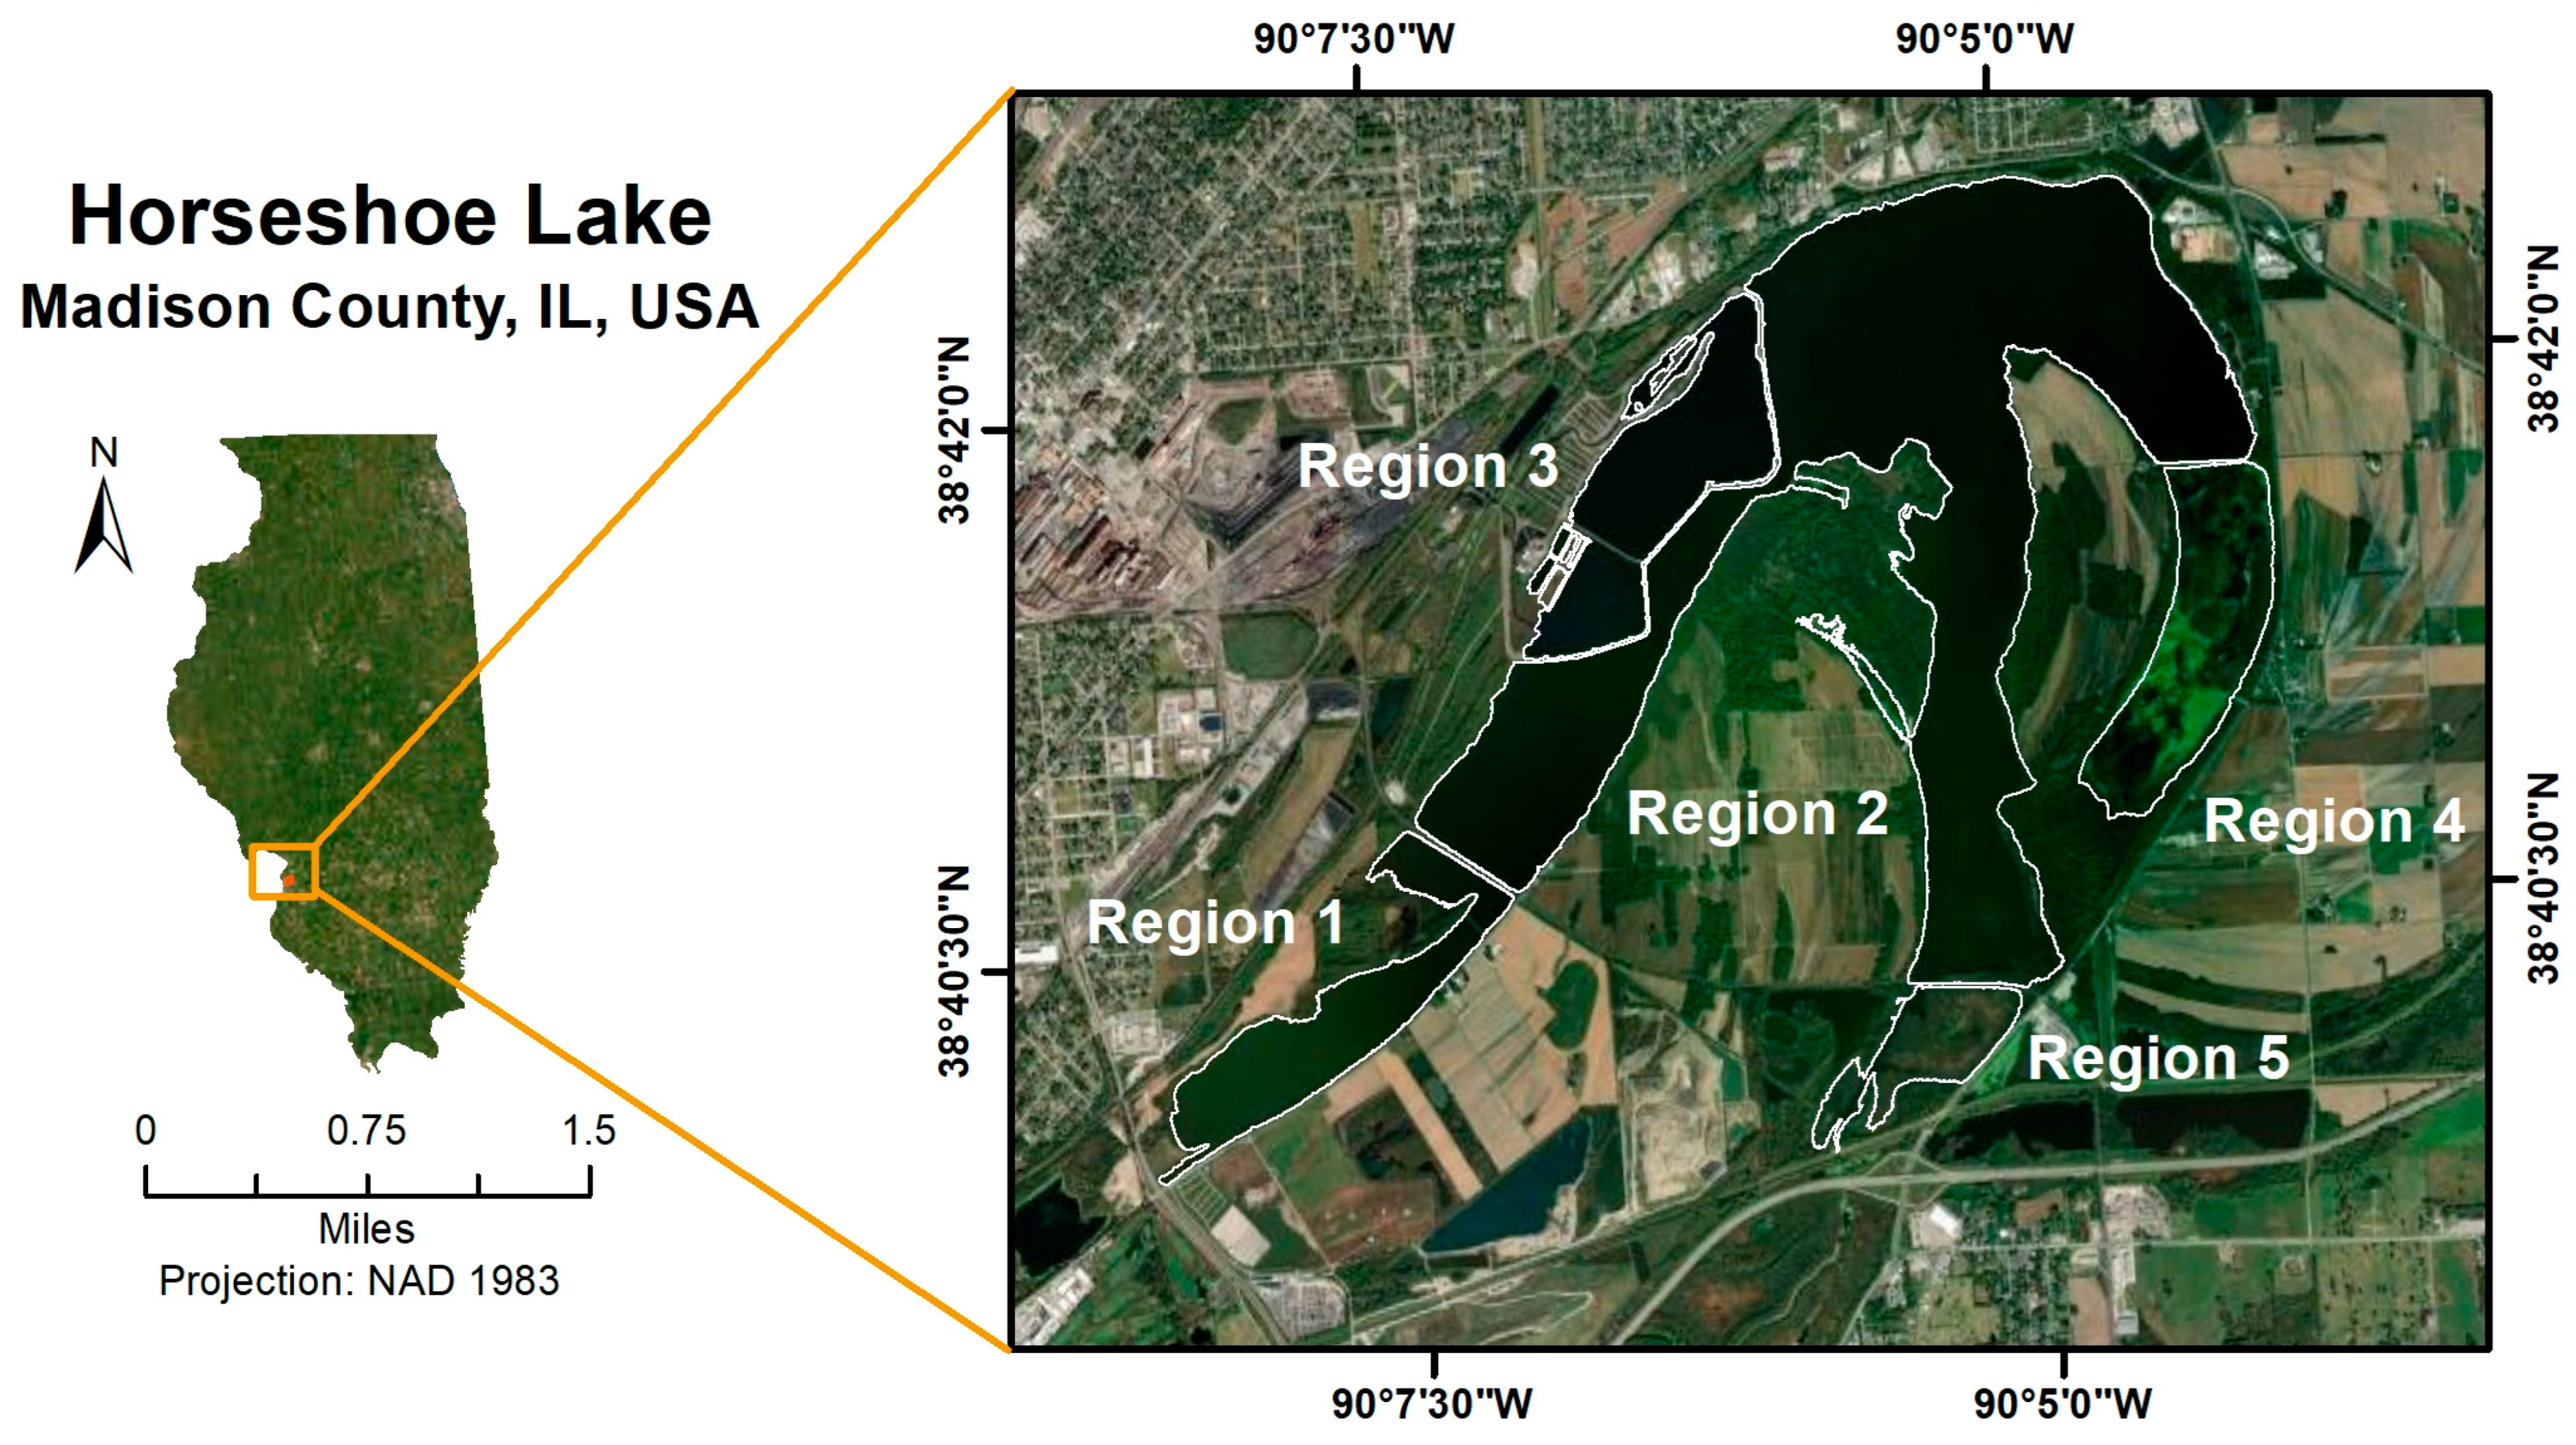
2.1. Study Area
- Region 1 (SW lobe): Long, narrow arm isolated by a causeway; receives drainage from the south/southwest; exchanges with the main basin through a narrow opening.
- Region 2 (Central basin): Largest open-water area surrounding Walker’s Island; primary mixing zone of the lake.
- Region 3 (NW embayment): Semi-enclosed basins adjacent to the industrial complex, bounded by levees/roads; historically influenced by intake/effluent infrastructure; limited connection to Region 2.
- Region 4 (Eastern arc): Elongate eastern arm along the outer oxbow, bordered by agriculture; multiple small ditch/culvert inputs; connected to Region 2 through a constricted channel at the north.
- Region 5 (SE pocket): Shallow embayment near southern diversion structures and local drains; hydraulically restricted relative to the central basin.
2.2. Data and Tools Used
2.2.1. Data Used
2.2.2. ArcGIS Pro
2.2.3. Google Earth Engine (GEE)
2.2.4. Programming Interface
2.3. Methodology
2.3.1. Water Quality Indices
- NDCI (Equation (1)) estimates chlorophyll-a concentration and detects algal blooms by combining Sentinel-2 Band 5 (red-edge, B5) and Band 4 (red, B4). Areas with high values indicate elevated phytoplankton activity [74].
- NDTI (Equation (2)) measures turbidity and suspended sediment levels using Sentinel-2 Band 4 (red, B4) and Band 3 (green, B3). Higher NDTI values typically correspond to poor water clarity due to sediment load [75].
- TP (Equation (3)) is derived using Sentinel-2 reflectance in a two-step procedure. First, Secchi depth (SD) was estimated from the red and near-infrared bands (B4, B8) with a log-linear band-ratio model shown to be effective for water clarity in turbid inland lakes [88,89]. Midwest-based studies suggest starting coefficients in the range α ≈ 2.0 to 3.0 and β ≈ −1.5 to −2.5 [16,88,89]. Based on this guidance, we adopt literature-informed priors of α = 2.5 and β = −2.2. Second, SD was mapped to the Carlson TP scale (unitless) by applying Carlson’s trophic state equations and expressing the trophic state index on the TP scale [78,90]. For brevity, we refer to this Carlson TP-scale, unitless estimate as “TP” throughout. This approach is well-suited to shallow, sediment-dominated systems such as Horseshoe Lake, where phosphorus is frequently bound to suspended particles rather than algal biomass [91]. Consistent with this context, the Illinois EPA Integrated Report Companion App lists Horseshoe Lake on the state’s 303(d) impaired-waters register in recent cycles [87].
2.3.2. Break Point and Trend Analysis
2.3.3. Time Series and Trend Correlations
2.3.4. Hierarchical Clustering for Regional Grouping
2.3.5. PCA and Trend Count Analysis for Maximum Pollution Windows
2.3.6. Spatial Mapping for High-Pollution Windows
3. Results
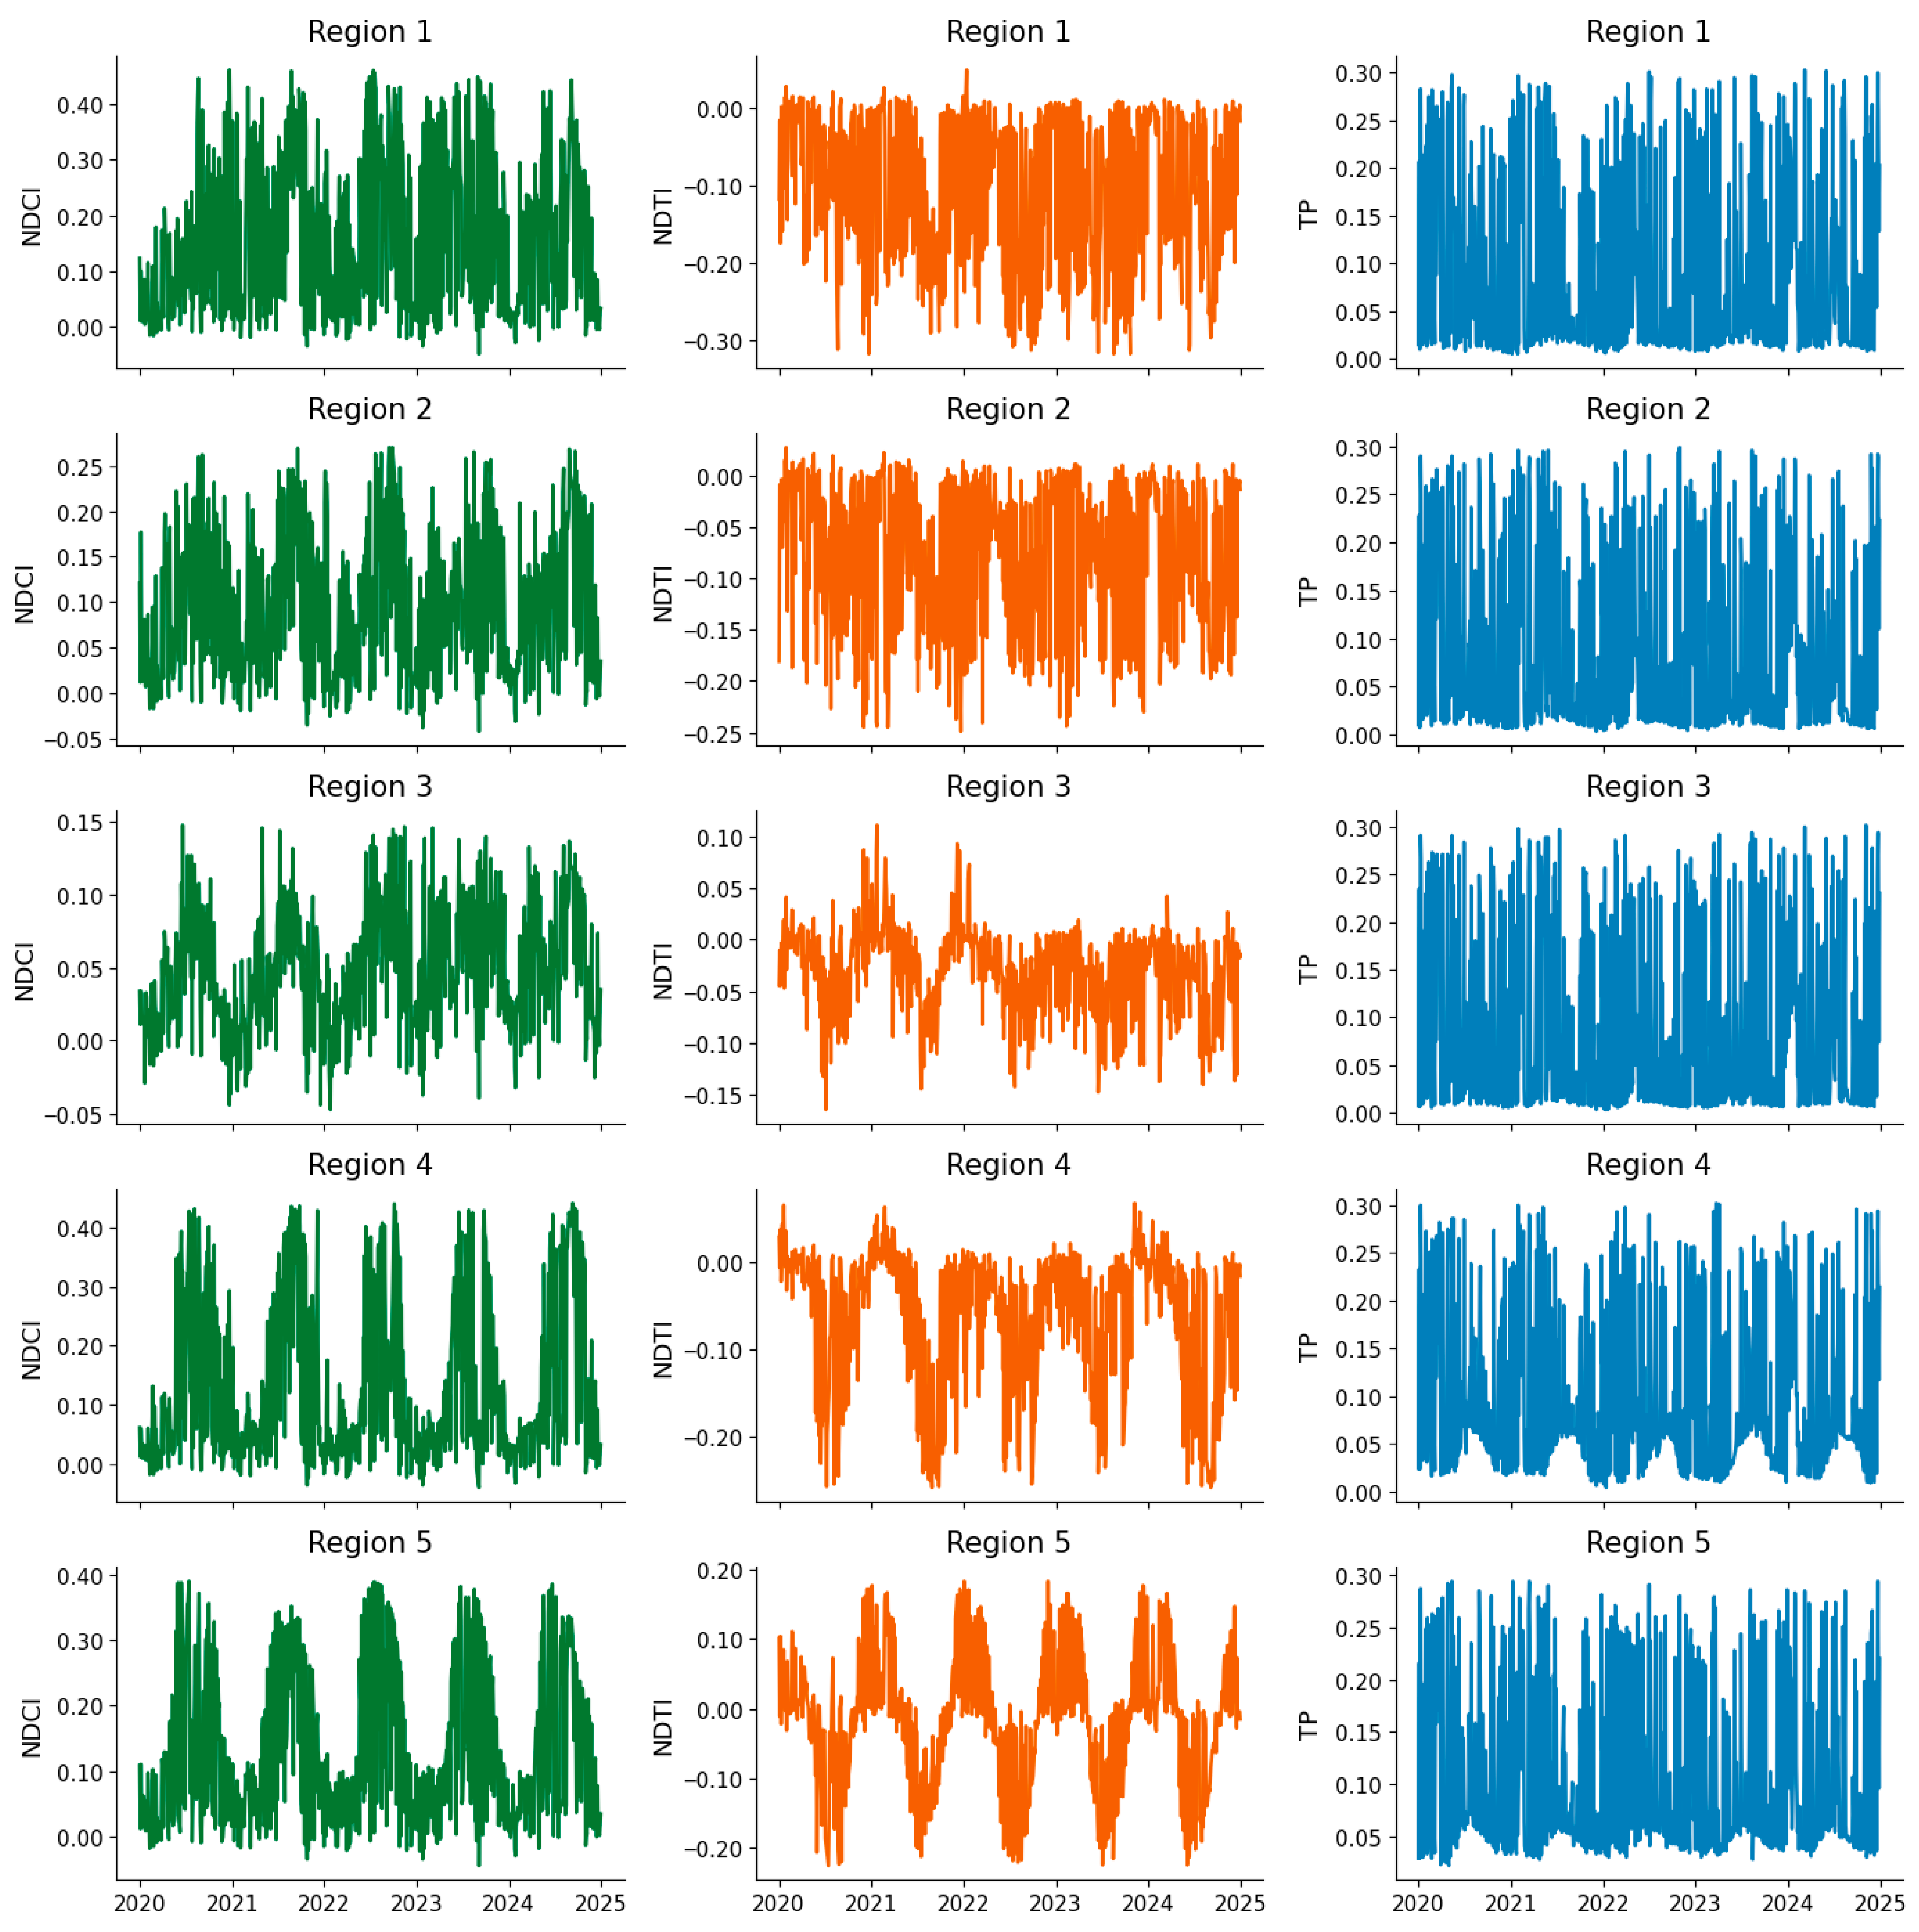
3.1. Time Series Extraction of Water Quality Indicators
3.2. Trends in Water Quality Parameters

- Trends in NDCI: Figure 5 shows NDCI trend segments across five lake regions. Region 1 experienced a fairly balanced sequence of increasing and decreasing trends, with a few non-significant periods. It shows recurring fluctuations, especially between 2021 and 2023. Region 2 started with short-term declines, followed by frequent alternating increases and decreases. Region 3 showed higher variability, with short trend segments and more frequent declines during 2021–2023. Region 4 had longer periods of consistent decline, especially from mid-2020 to late 2022, with limited signs of recovery. In contrast, Region 5 experienced some of the longest periods of both increase and decrease. It showed extended rises in NDCI during 2022 and early 2024, followed by a decline through the end of the study period. Figure 6 summarizes trend distributions across annual, seasonal, and monthly scales for NDCI. Annually, decreasing trends dominated in 2020 and 2023, while 2021 and 2022 showed more frequent increases. Seasonally, fall had the strongest NDCI declines, with 86% of periods showing decreasing trends. Spring and summer displayed a mix of increases and decreases. Winter recorded the highest share of increasing trends at 58%. Monthly patterns followed these trends, with February and July showing peaks in increases, while September and October were entirely marked by declines.


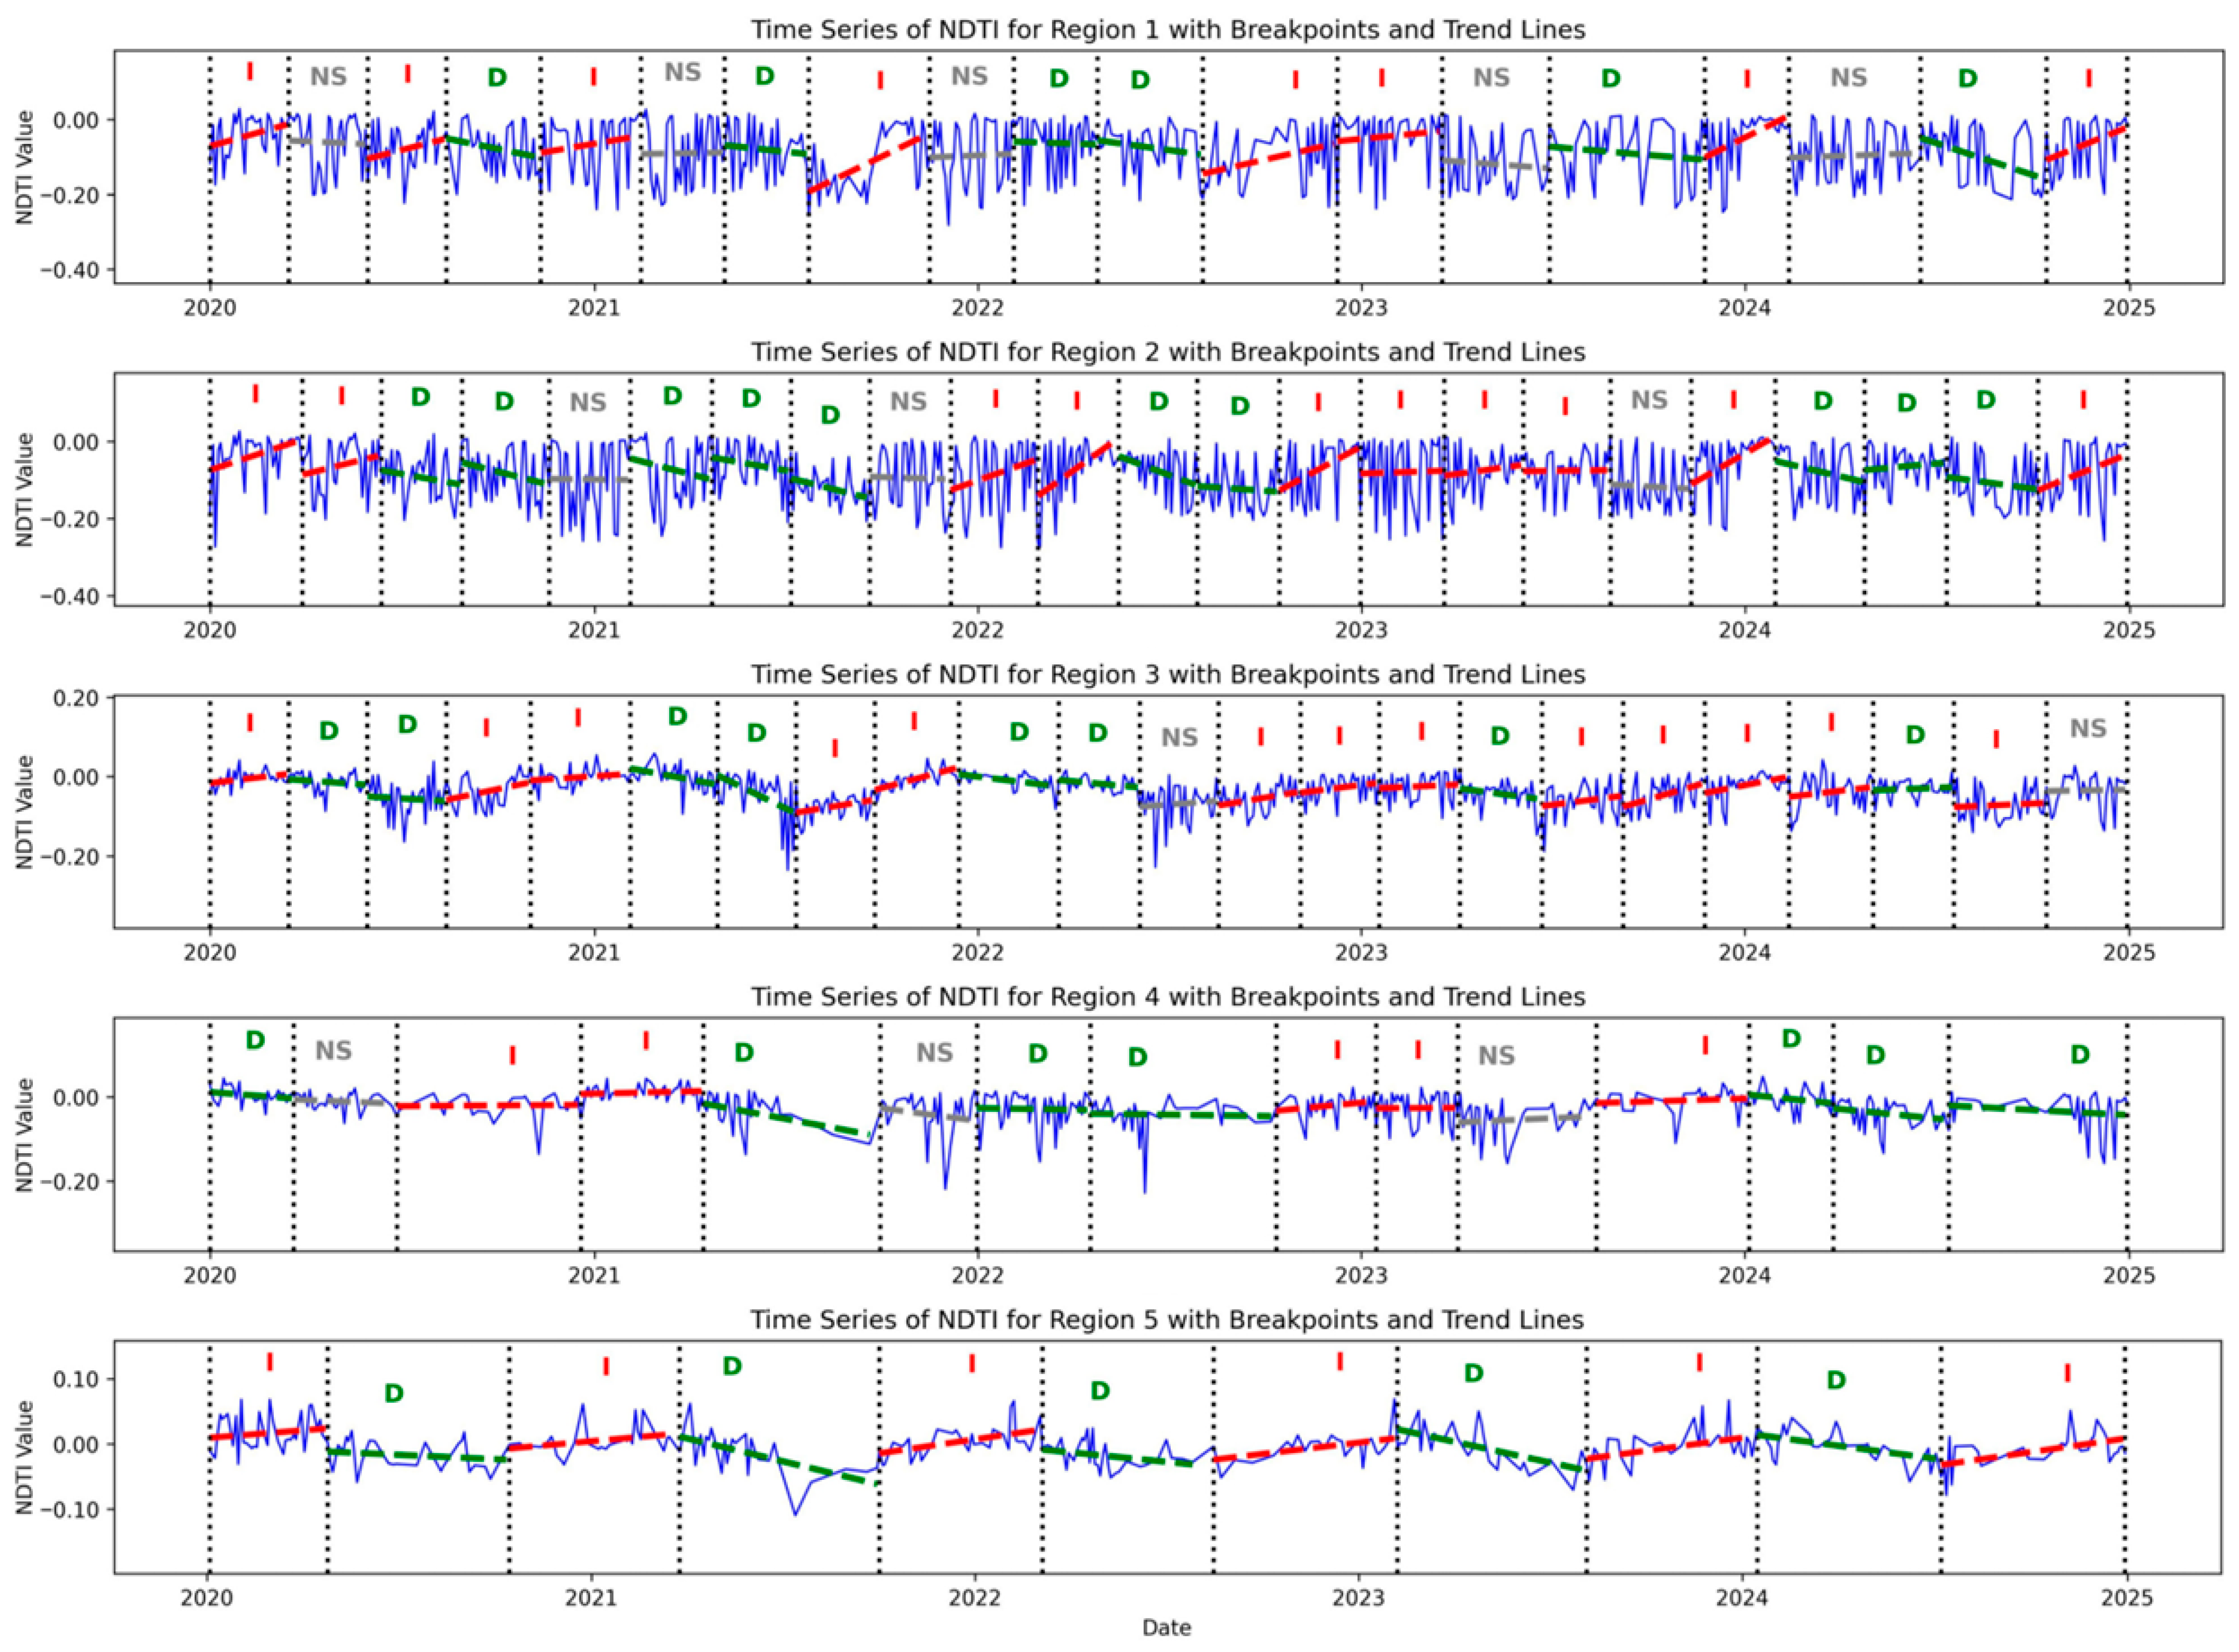
- Trends in NDTI: Figure 7 shows NDTI trends from 2020 to 2024 across the five lake regions. Region 1 had a mix of trends, with several short periods of increase and a few longer decreasing segments, showing alternating turbidity behavior. Region 2 showed mostly increasing trends early on, but more decreasing periods appeared between 2021 and 2023. A few increases returned in 2024. Region 3 was the most dynamic, with many short segments and a balance of increases and decreases. However, there was a cluster of persistent increases from late 2022 through 2024. Region 4 was dominated by long periods of decreasing turbidity from 2021 to 2023, followed by several shorter increases, suggesting recovery followed by new disturbances. Region 5 had the most consistent increases, especially in 2020, late 2022, and throughout 2024. Figure 8 shows NDTI trends by year, season, and month. In 2020 and 2023, increasing trends were most common, reaching up to 59%. In 2021 and 2024, decreasing trends were more frequent, reaching 55% to 58%. Spring had the highest share of decreasing trends at 74%. Fall showed the most increasing trends at 77%. Summer had a mix of both. Winter showed nearly equal shares of increases and decreases. At the monthly level, April and May had the strongest decreases, with up to 88%. August, October, and November showed the highest increases.
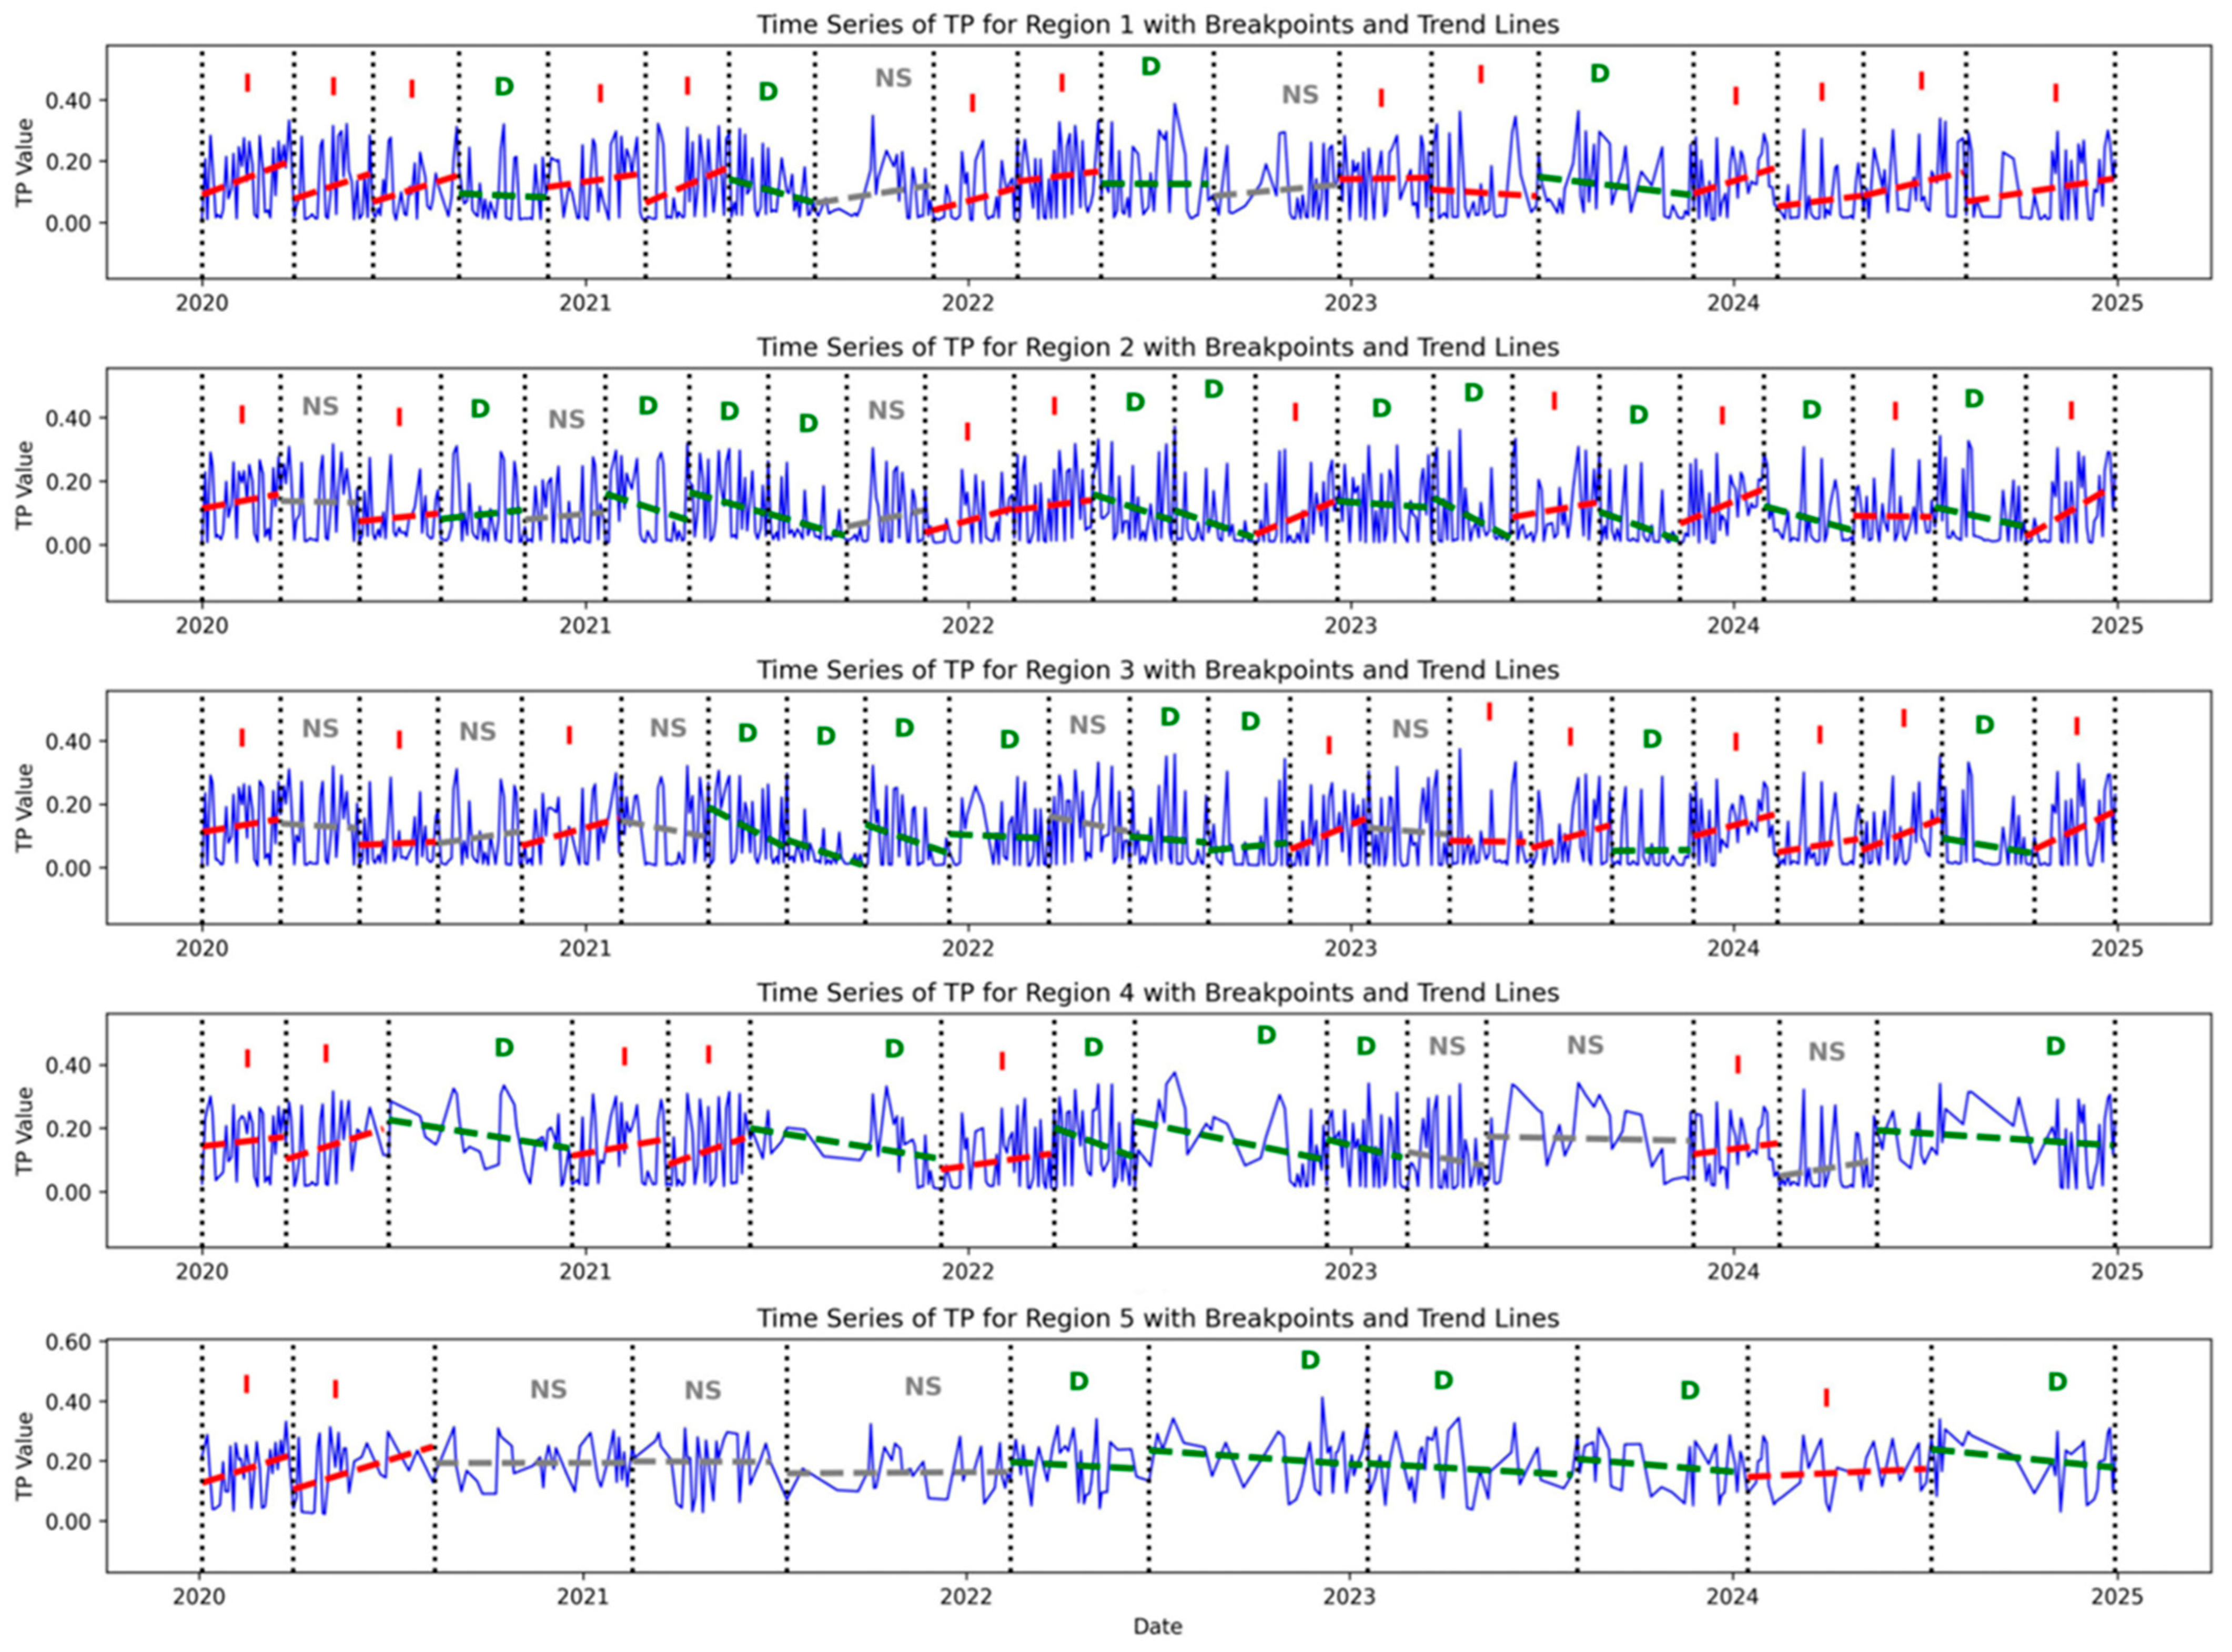
- Trends in TP: Figure 9 shows TP trends in Horseshoe Lake from 2020 to 2024. Region 1 had mostly increasing trends throughout the period, with short declines in late 2020 and mid-2021. Region 2 showed a mix of patterns, with early increases, mid-period declines, and more increases in 2024. Region 3 started with mostly increasing and non-significant trends, but showed consistent declines in mid to late 2022 and again in 2024. Region 4 had an early increasing phase, followed by a long declining trend from mid-2021 to late 2023, then returned to short increases and stable periods. Region 5 showed the most prolonged and consistent increases, especially from early 2020 and again in late 2023 to the end of 2024, with only a few brief declining periods. Figure 10 summarizes annual, seasonal, and monthly TP trends. In 2020, increasing trends were highest at 59%. In 2021 and 2022, decreasing trends were more common, peaking at 66% in 2022. Increases returned in 2023 and 2024. Summer had the highest share of decreasing trends at 64%. Fall showed the most increasing trends at 72%. Spring and winter had more balanced patterns. Monthly trends followed this pattern. June and September had the strongest decreases. October and November showed the highest increases, close to 100%. February and August had more non-significant trends.


3.3. Time Series and Trend Correlations
3.4. Hierarchical Clustering for Regional Grouping
3.5. PCA & Trend Count Analysis for Maximum Pollution Windows
- 31 December 2022–15 January 2023: PC1 values ranged from 1.33 to 2.26, with a peak of 2.26 on 3 January 2023. Values were ≥2.0 from 31 December 2022 through 8 January 2023. This indicates strong pollution across chlorophyll-a, turbidity, and phosphorus. The increasing-segments count reached 11 (highest in the full series), suggesting a fast, steady rise in pollution indicators.
- 24 November 2023–10 January 2024: PC1 values rose from −0.51 (24 November 2023) to a peak of 2.67 (10 January 2024), remaining >2.0 through early January (≈2.00–2.67). The increasing-trend count stayed between 9 and 10, indicating a longer-lasting pollution event with steady upward changes in water-quality indicators.

3.6. Regional Water Quality Patterns During Pollution Peaks
- 31 December 2022–15 January 2023: The NDCI map shows high chlorophyll-a levels in Region 1 and Region 5 (green areas), indicating strong algal activity. Region 2 has moderate values, mostly in its southern part. Region 3 records the lowest NDCI (purple), suggesting clearer water. Region 4 shows a mix of low and moderate values. These patterns suggest that biological stress was highest in the southern and southeastern zones, aligning with the PC1 pollution peak. The NDTI map highlights elevated turbidity in Region 5, likely from sediment or surface runoff. Region 4 has small patches of moderate turbidity. Regions 1, 2, and 3 mostly show low values (purple), reflecting clearer conditions. This suggests turbidity stress was concentrated in Region 5. TP values were also highest in Region 5 and parts of Region 4. These areas likely received nutrients from nearby agriculture or disturbed sediments. In contrast, Regions 1, 2, and 3 show low phosphorus levels. Together, these findings show that nutrient and turbidity-related pollution was localized in the southeastern part of the lake.
- 24 November 2023–10 January 2024: During this period, high NDCI values appear in Region 1 and parts of Region 5, indicating strong algal growth. Region 3 has the lowest chlorophyll-a levels, while Regions 2 and 4 show moderate values with a few high-value patches. The spatial spread points to increased biological stress in the southern and southeastern lake zones. Turbidity was again highest in Region 5, shown by green areas on the NDTI map. Region 4 has moderate turbidity, while the rest of the lake (Regions 1, 2, and 3) shows lower values. This indicates that physical disturbance was concentrated in Region 5. The TP map shows a similar pattern. Regions 4 and 5 had the highest phosphorus levels, suggesting nutrient inputs from runoff or sediments. The other regions remained low in TP. The overlap of high NDCI, NDTI, and TP confirms a strong, localized pollution hotspot in the southern zones during this window.
3.7. Validation and Uncertainty
4. Discussion
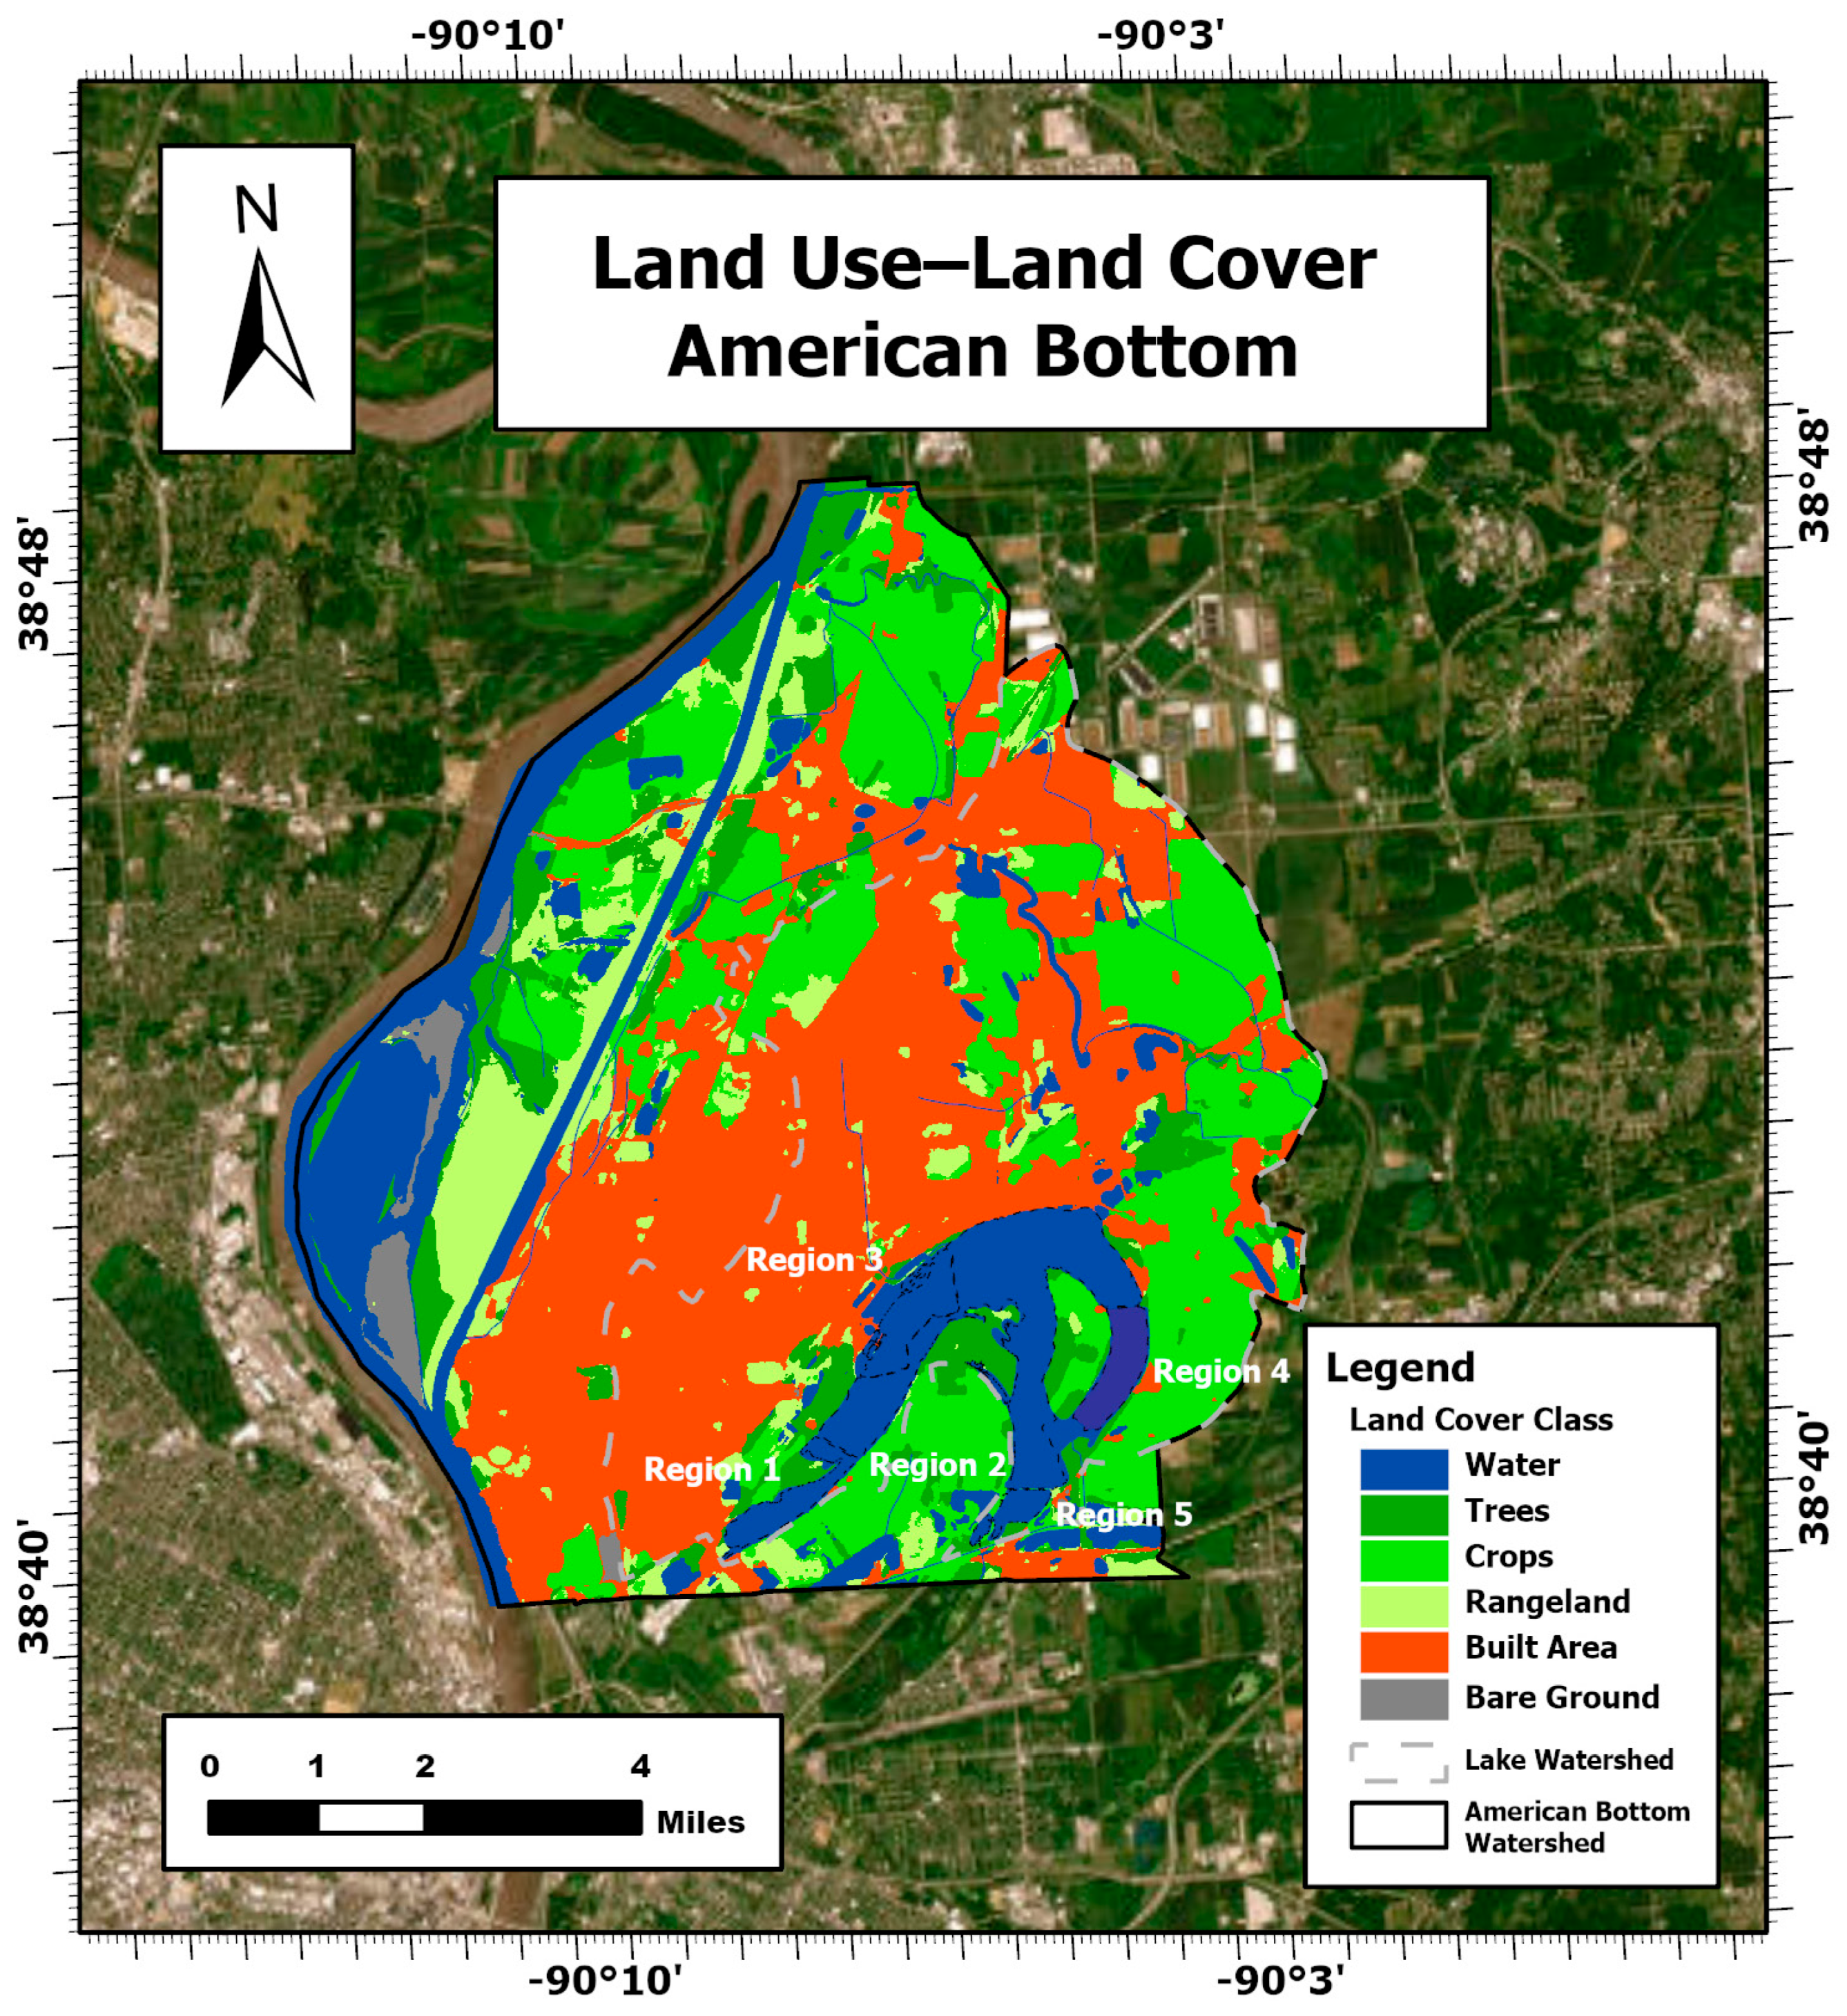
- Regional Drivers of Pollution and Spatial Heterogeneity: Horseshoe Lake is situated within the American Bottom watershed, a floodplain of the Mississippi River where land use land cover is dominated by urban development and agriculture (Figure 15) [60,61]. Our results validate the urban inflows hypothesis and the agricultural discharge hypothesis, showing that different land use-land cover contexts leave distinct ecological signatures in the lake. The consistently high chlorophyll-a levels in the north are best understood as a consequence of stormwater culverts draining Granite City into Region 1, aligning with elevated NDCI values and repeated chlorophyll-a spikes. On the eastern margin, croplands surround Region 5 and deliver multiple agricultural discharges, producing persistent hotspots of turbidity and phosphorus enrichment. The combination of nutrient-rich inflows, shallow bathymetry, and sediment resuspension reinforces a chronic stress regime evident across multiple indicators and time windows. The industrial legacy on the western shore has diminished since effluent discharges ceased [57,58]. As a result, the lake’s dominant external drivers are now stormwater, agricultural runoff, and seasonal snowmelt. Inflows from Elm Slough, Long Lake, and the Cahokia Drainage Canal further reinforce watershed-lake connectivity, producing synchrony among central and eastern regions. These patterns demonstrate that land use, hydrology, and connectivity jointly structure water quality outcomes. Although these findings are specific to Horseshoe Lake, they can be generalized to other shallow floodplain lakes across the American Midwest. In such systems, urban, agricultural, and historical industrial inputs combine to produce highly variable water quality patterns across different areas of the lake [16,88,89]. More broadly, they illustrate a global principle for eutrophic-turbid lakes [91]. Region-specific management is often more effective in these systems than uniform lake-wide interventions.
- Temporal Disruption and Seasonality in Trends: Breakpoint detection confirmed that Horseshoe Lake’s water quality dynamics are nonlinear and event-driven, validating the seasonal latent stress hypothesis. Abrupt shifts were frequently triggered by storm events, flood diversions, or seasonal nutrient pulses [103,104]. Seasonal summaries showed that fall and winter carried elevated risks, with high turbidity and phosphorus persisting even when algal activity was low [105]. Such “latent stress” periods illustrate the hidden dimensions of eutrophication that can be missed by summer-centric monitoring [103,106]. This finding has broad implications for Midwestern lakes, where freeze–thaw cycles, storm-driven runoff, and nutrient flushes occur outside of the summer growing season [107,108]. Globally, it resonates with floodplain and monsoon-influenced lakes where episodic events dominate water quality trajectories. The general lesson is that year-round, event-sensitive monitoring frameworks are essential to accurately capture eutrophication stress in turbid, nutrient-rich systems.
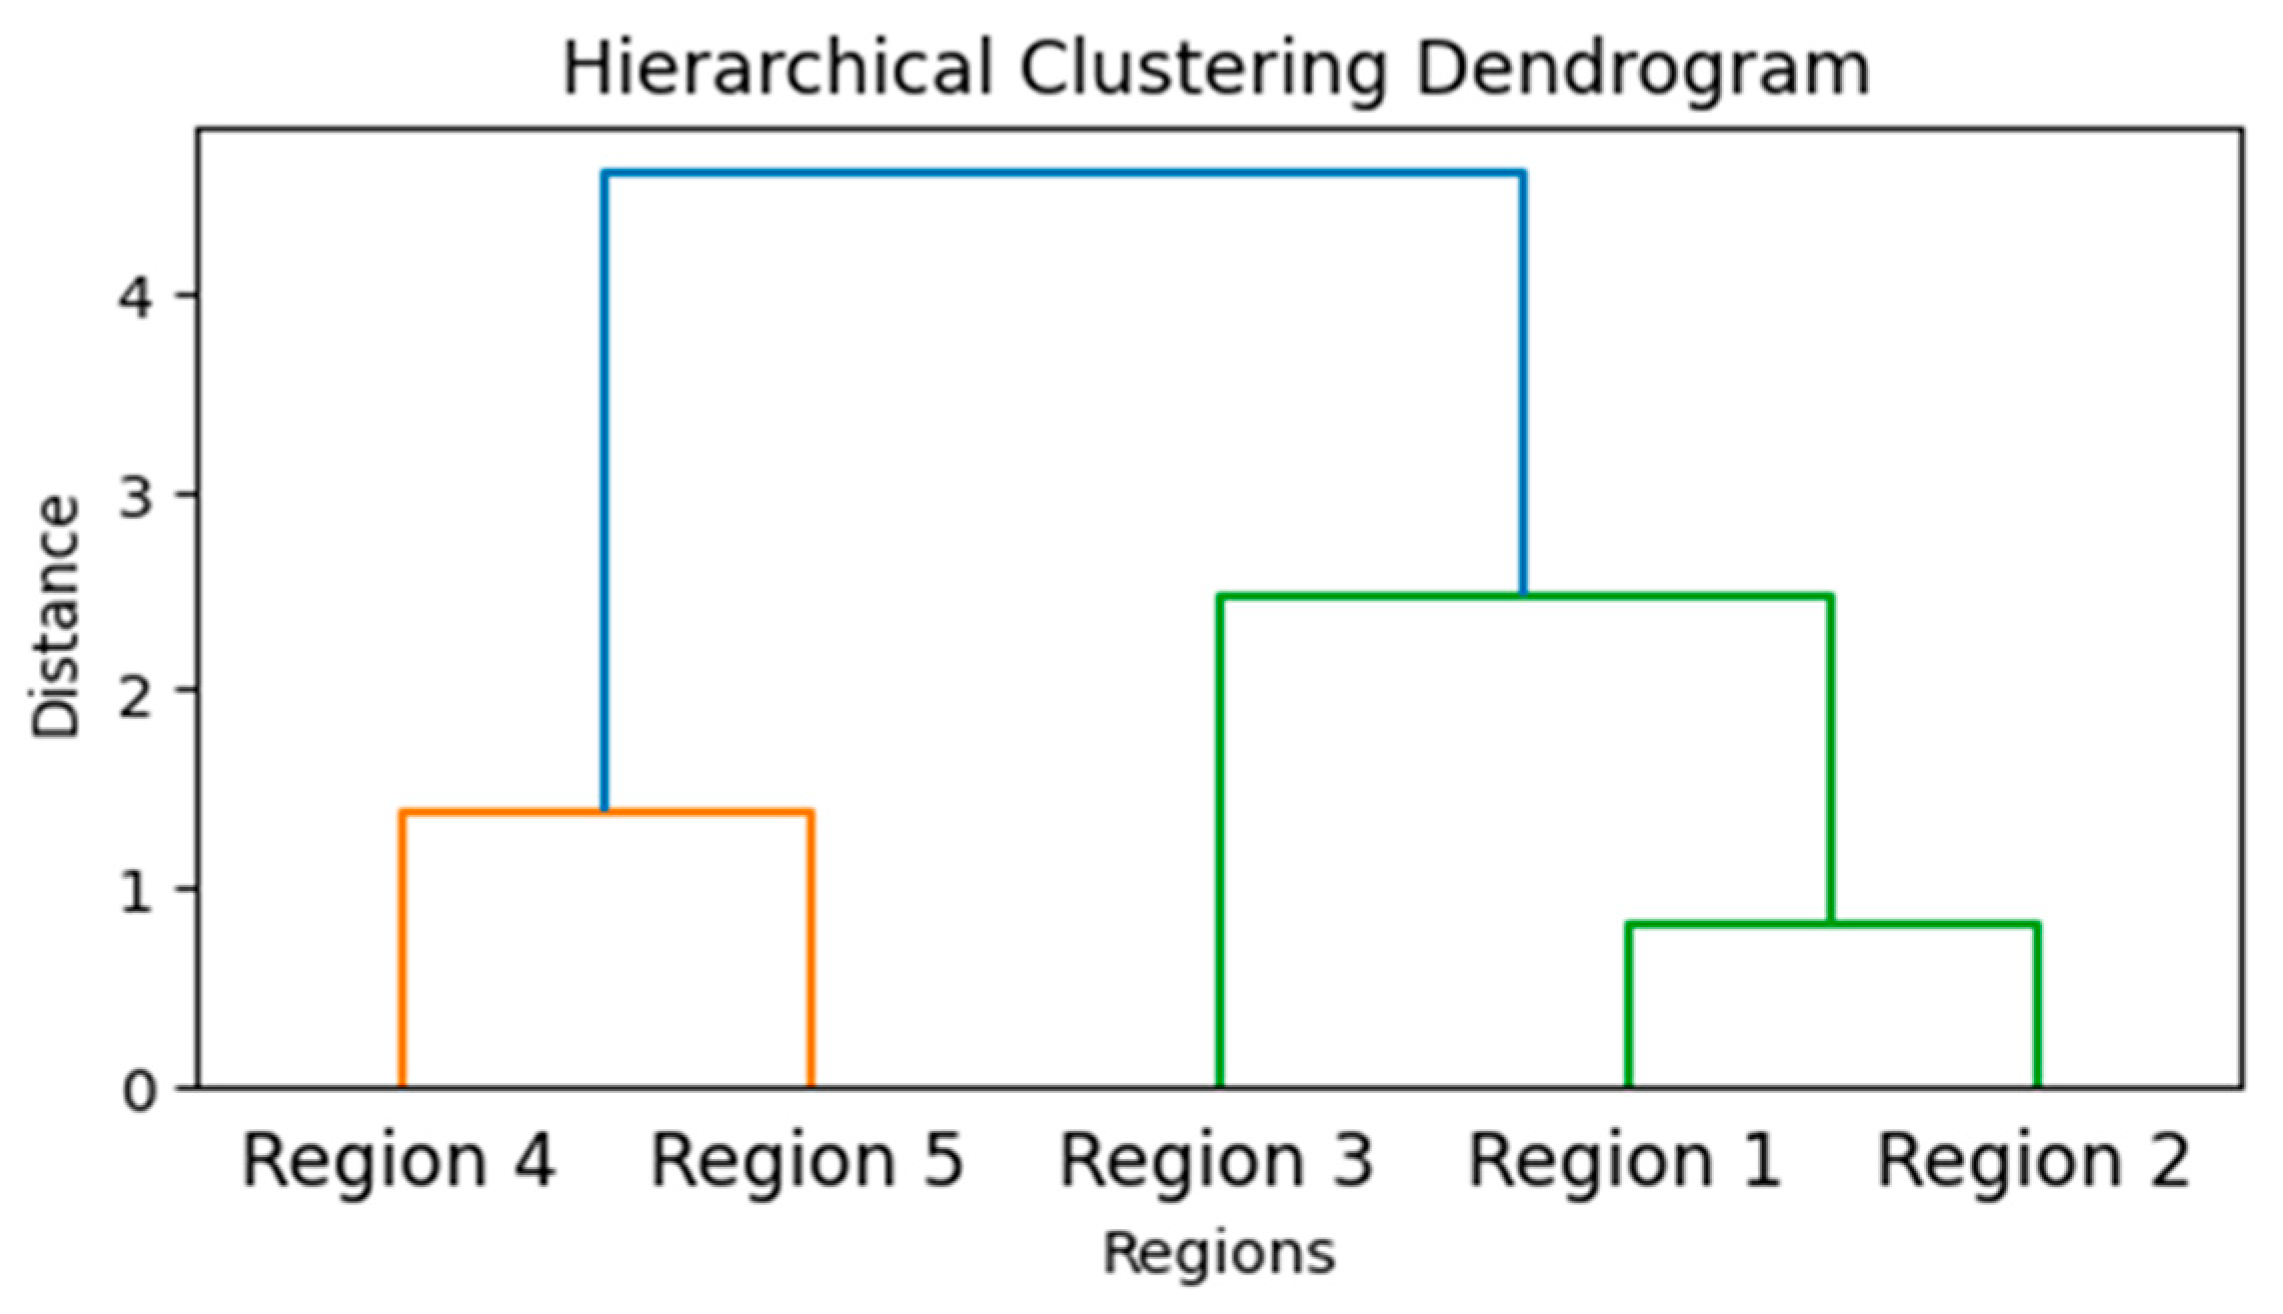
- Inter-Zonal Synchronization and Spatial Clustering: Spatial clustering analysis further supported the urban inflows and agricultural discharge hypotheses, revealing that Horseshoe Lake is not a uniform system but a mosaic of zones shaped by distinct external drivers. Regions 1 and 2 clustered together under the influence of urban runoff, while Regions 4 and 5 consistently grouped under agricultural and turbidity pressures. Region 3 stood apart as a transitional buffer, reflecting mixed inputs but reduced stress. These patterns emphasize that sub-regional variation is not noise but an organizing feature of eutrophic–turbid lakes. Similar clustering has been documented in other Midwestern floodplain lakes [109]. These patterns show that land use-land cover and hydrological setting create consistent and predictable water quality signatures [104]. Beyond the Midwest, this principle holds in shallow lakes worldwide, where spatial heterogeneity means that lake-wide averages can obscure critical dynamics [110,111]. For both science and management, the implication is clear [109,112]. Tailored, zone-specific strategies are more effective than one-size-fits-all approaches.
- Framework Utility and Broader Application: Beyond site-specific findings, our results also demonstrate the value of an integrated methodological framework for monitoring eutrophic and turbid lakes such as Horseshoe Lake. The combination of Sentinel-2 imagery with key water quality indicators, NDCI, NDTI, and TP, proved effective in capturing the dominant stressors in this shallow floodplain system [16,78,90]. Breakpoint detection highlighted abrupt disruptions in these indicators, contrasting with earlier studies that largely relied on seasonal or annual averages to describe trophic dynamics [113,114,115]. More recent work has similarly shown the value of event-focused detection in lake time series, supporting our approach [116,117]. In parallel, non-parametric trend and correlation analyses provided robust assessments of temporal variability, offering a more sensitive alternative to the linear regression approaches commonly applied in past limnological studies [81,82,83]. Similar non-parametric tools have gained traction in recent aquatic monitoring studies, reinforcing their suitability for complex lake dynamics [118]. The integrative use of PCA with trend counts further allowed us to identify periods of maximum pollution intensity by combining signals across indicators. This extends beyond single-variable thresholds typically applied in trophic state monitoring [119] and aligns with more recent applications of multivariate methods in inland water quality assessments [120,121]. Finally, hierarchical clustering exposed distinct spatial groupings within the lake, underscoring heterogeneity that would have been masked if lake-wide averages were the sole basis of assessment [122,123]. Taken together, these results show that the framework is capable of detecting both short-term pollution spikes and longer-term structural patterns within a single pipeline. This provides a finer-grained, event-sensitive view of water quality than earlier approaches, which tended to emphasize either individual indicators or coarse temporal summaries [114,115]. In sum, this integrated pipeline offers a transferable, decision-support tool for eutrophic–turbid lakes, pinpointing when and where to focus monitoring and guiding cost-effective, region-specific management actions. Its scalability is strongest in lakes with frequent satellite coverage, shallow depths, and strong land-water interactions where episodic events drive water quality dynamics. By contrast, its application is more limited in optically complex systems dominated by submerged vegetation, in high-latitude regions with persistent cloud and ice cover, or in deep stratified lakes where surface reflectance poorly represents nutrient dynamics.
5. Conclusions
Author Contributions
Funding
Data Availability Statement
Acknowledgments
Conflicts of Interest
Abbreviations
| AppEEARS | Application for Extracting and Exploring Analysis-Ready Samples (NASA) |
| BOD | Biochemical Oxygen Demand |
| DO | Dissolved Oxygen |
| Dynp | Dynamic Programming algorithm (ruptures library) |
| EC | Electrical Conductivity |
| EPA | U.S. Environmental Protection Agency |
| GEE | Google Earth Engine |
| GIS | Geographic Information System |
| MARs | Multivariate Autoregressive Models |
| mgd | Million Gallons per Day |
| MSI | (Sentinel-2) Multispectral Instrument |
| NASA | National Aeronautics and Space Administration |
| NDCI | Normalized Difference Chlorophyll Index |
| NDTI | Normalized Difference Turbidity Index |
| NDVI | Normalized Difference Vegetation Index |
| NHD | National Hydrography Dataset |
| NLCD | National Land Cover Database |
| NIR | Near-Infrared |
| PCA | Principal Component Analysis |
| K-PCA | Kernel Principal Component Analysis |
| QA60 | Sentinel-2 Cloud Mask Bitmask |
| RBF | Radial Basis Function (kernel) |
| SD | Secchi Depth |
| SOMs | Self-Organizing Maps |
| SWIR | Short-Wave Infrared |
| TDS | Total Dissolved Solids |
| TP | Total Phosphorus |
| USGS | United States Geological Survey |
| WBD | (USGS) Watershed Boundary Dataset |
| WWTP | Wastewater Treatment Plant |
References
- Smith, S.V.; Renwick, W.H.; Bartley, J.D.; Buddemeier, R.W. Distribution and significance of small, artificial water bodies across the United States landscape. Sci. Total Environ. 2002, 299, 21–36. [Google Scholar] [CrossRef]
- Karpatne, A.; Khandelwal, A.; Chen, X.; Mithal, V.; Faghmous, J.; Kumar, V. Global monitoring of inland water dynamics: State-of-the-art, challenges, and opportunities. In Computational Sustainability; Springer: Cham, Switzerland, 2016; pp. 121–147. [Google Scholar]
- Goodell, E.B. A Review of the Laws Forbidding Pollution of Inland Waters in the United States; U.S. Government Publishing Office: Washington, DC, USA, 1904.
- Marstrand, P.K. Pollution of Inland Waters. In Environmental Pollution Control; Routledge: Oxfordshire, UK, 2019; pp. 89–104. [Google Scholar]
- Dodds, W.K.; Bouska, W.W.; Eitzmann, J.L.; Pilger, T.J.; Pitts, K.L.; Riley, A.J.; Schloesser, J.T. Eutrophication of U.S. freshwaters: Analysis of potential economic damages. Environ. Sci. Technol. 2009, 43, 12–19. [Google Scholar] [CrossRef]
- Behmel, S.; Damour, M.; Ludwig, R.; Rodriguez, M.J. Water quality monitoring strategies, A review and future perspectives. Sci. Total Environ. 2016, 571, 1312–1329. [Google Scholar] [CrossRef]
- Sandhwar, V.K.; Saxena, S.; Saxena, D.; Tiwari, A.; Parikh, S.M. Future trends and emerging technologies in water quality management. Comput. Autom. Water Secur. 2025, 229–249. [Google Scholar] [CrossRef]
- Cao, Q.; Yu, G.; Qiao, Z. Application and recent progress of inland water monitoring using remote sensing techniques. Environ. Monit. Assess. 2023, 195, 125. [Google Scholar] [CrossRef] [PubMed]
- Deng, Y.; Zhang, Y.; Pan, D.; Yang, S.X.; Gharabaghi, B. Review of recent advances in remote sensing and machine learning methods for lake water quality management. Remote Sens. 2024, 16, 4196. [Google Scholar] [CrossRef]
- Liu, M.; Ling, H.; Wu, D.; Su, X.; Cao, Z. Sentinel-2 and Landsat-8 observations for harmful algae blooms in a small eutrophic lake. Remote Sens. 2021, 13, 4479. [Google Scholar] [CrossRef]
- Meng, H.; Zhang, J.; Zheng, Z. Retrieving inland reservoir water quality parameters using landsat 8–9 OLI and sentinel-2 MSI sensors with empirical multivariate regression. Int. J. Environ. Res. Public Health 2022, 19, 7725. [Google Scholar] [CrossRef]
- Declaro, A.; Kanae, S. Enhancing surface water monitoring through multi-satellite data-fusion of Landsat-8/9, Sentinel-2, and Sentinel-1 SAR. Remote Sens. 2024, 16, 3329. [Google Scholar] [CrossRef]
- Gorelick, N.; Hancher, M.; Dixon, M.; Ilyushchenko, S.; Thau, D.; Moore, R. Google Earth Engine: Planetary-scale geospatial analysis for everyone. Remote Sens. Environ. 2017, 202, 18–27. [Google Scholar] [CrossRef]
- AppEEARS. Application for Extracting and Exploring Analysis Ready Samples (AppEEARS). NASA LP DAAC. 2024. Available online: https://appeears.earthdatacloud.nasa.gov/ (accessed on 15 March 2025).
- Melton, F.S.; Huntington, J.; Grimm, R.; Herring, J.; Hall, M.; Rollison, D.; Erickson, T.; Allen, R.; Anderson, M.; Fisher, J.B.; et al. OpenET: Filling a critical data gap in water management for the western United States. JAWRA J. Am. Water Resour. Assoc. 2022, 58, 971–994. [Google Scholar] [CrossRef]
- Brezonik, P.; Menken, K.D.; Bauer, M. Landsat-based remote sensing of lake water quality characteristics, including chlorophyll and colored dissolved organic matter (CDOM). Lake Reserv. Manag. 2005, 21, 373–382. [Google Scholar] [CrossRef]
- Yang, Z.; Anderson, Y. Estimating chlorophyll-a concentration in a freshwater lake using Landsat 8 Imagery. J. Environ. Earth Sci 2016, 6, 134–142. [Google Scholar]
- Boucher, J.M.; Weathers, K.C.; Norouzi, H.; Prakash, S.; Saberi, S.J. Assessing the effectiveness of Landsat 8 chlorophyll-a retrieval algorithms for regional freshwater management. In AGU Fall Meeting Abstracts; AGU: Washington, DC, USA, 2016; Volume 2016, p. B43A-0555. [Google Scholar]
- Xu, M.; Liu, H.; Beck, R.; Lekki, J.; Yang, B.; Shu, S.; Kang, E.L.; Anderson, R.; Johansen, R.; Emery, E.; et al. A spectral space partition guided ensemble method for retrieving chlorophyll-a concentration in inland waters from Sentinel-2A satellite imagery. J. Great Lakes Res. 2019, 45, 454–465. [Google Scholar] [CrossRef]
- Pahlevan, N.; Smith, B.; Schalles, J.; Binding, C.; Cao, Z.; Ma, R.; Alikas, K.; Kangro, K.; Gurlin, D.; Nguyen, H.; et al. Seamless retrievals of chlorophyll-a from Sentinel-2 (MSI) and Sentinel-3 (OLCI) in inland and coastal waters: A machine-learning approach. Remote Sens. Environ. 2020, 240, 111604. [Google Scholar] [CrossRef]
- Ogashawara, I.; Kiel, C.; Jechow, A.; Kohnert, K.; Ruhtz, T.; Grossart, H.-P.; Hölker, F.; Nejstgaard, J.C.; Berger, S.A.; Wollrab, S. The use of Sentinel-2 for chlorophyll-a spatial dynamics assessment: A comparative study on different lakes in northern Germany. Remote Sens. 2021, 13, 1542. [Google Scholar] [CrossRef]
- Mallin, M.A.; Johnson, V.L.; Ensign, S.H. Comparative impacts of stormwater runoff on water quality of an urban, a suburban, and a rural stream. Environ. Monit. Assess. 2009, 159, 475–491. [Google Scholar] [CrossRef]
- Yang, Y.Y.; Lusk, M.G. Nutrients in urban stormwater runoff: Current state of the science and potential mitigation options. Curr. Pollut. Rep. 2018, 4, 112–127. [Google Scholar] [CrossRef]
- Toming, K.; Kutser, T.; Laas, A.; Sepp, M.; Paavel, B.; Nõges, T. First experiences in mapping lake water quality parameters with Sentinel-2 MSI imagery. Remote Sens. 2016, 8, 640. [Google Scholar] [CrossRef]
- Mamun, M.; Ferdous, J.; An, K.G. Empirical estimation of nutrient, organic matter and algal chlorophyll in a drinking water reservoir using landsat 5 tm data. Remote Sens. 2021, 13, 2256. [Google Scholar] [CrossRef]
- Dey, S.; Dutta Roy, A. Satellite-Based Monitoring of Water Quality in Mukutmanipur Dam: A Google Earth Engine Approach. In Remotely Sensed Rivers in the Age of Anthropocene; Springer Nature: Cham, Switzerland, 2025; pp. 637–657. [Google Scholar]
- Gholizadeh, M.H.; Melesse, A.M.; Reddi, L. A comprehensive review on water quality parameters estimation using remote sensing techniques. Sensors 2016, 16, 1298. [Google Scholar] [CrossRef]
- Cardall, A.; Tanner, K.B.; Williams, G.P. Google Earth Engine tools for long-term spatiotemporal monitoring of chlorophyll-a concentrations. Open Water J. 2021, 7, 4. [Google Scholar]
- Taheri Dehkordi, A.; Valadan Zoej, M.J.; Ghasemi, H.; Jafari, M.; Mehran, A. Monitoring long-term spatiotemporal changes in iran surface waters using landsat imagery. Remote Sens. 2022, 14, 4491. [Google Scholar] [CrossRef]
- Navabian, M.; Vazifedoust, M.; Varaki, M.E. A Multi-Sensor Framework in Google Earth Engine for Spatio-Temporal Trend Analysis of Water Quality Parameters in Anzali Lagoon. Springer Science and Business Media LLC: Berlin/Heidelberg, Germany, 2023. [Google Scholar]
- Meals, D.W.; Spooner, J.; Dressing, S.A.; Harcum, J.B. Statistical analysis for monotonic trends. Tech Notes 2011, 6, 1–23. [Google Scholar]
- Kundzewicz, Z.; Robson, A. Detecting Trend and Other Changes in Hydrological Data; World Meteorological Organization: Geneva, Switzerland, 2000. [Google Scholar]
- Anderson, N.J. Landscape disturbance and lake response: Temporal and spatial perspectives. Freshw. Rev. 2014, 7, 77–120. [Google Scholar] [CrossRef]
- Osgood, R.A. Inadequacy of best management practices for restoring eutrophic lakes in the United States: Guidance for policy and practice. Inland Waters 2017, 7, 401–407. [Google Scholar] [CrossRef]
- Wang, Y.; Guo, Y.; Zhao, Y.; Wang, L.; Chen, Y.; Yang, L. Spatiotemporal heterogeneities and driving factors of water quality and trophic state of a typical urban shallow lake (Taihu, China). Environ. Sci. Pollut. Res. 2022, 29, 53831–53843. [Google Scholar] [CrossRef] [PubMed]
- Su, S.; Ma, K.; Zhou, T.; Yao, Y.; Xin, H. Advancing methodologies for assessing the impact of land use changes on water quality: A comprehensive review and recommendations. Environ. Geochem. Health 2025, 47, 101. [Google Scholar] [CrossRef]
- Ngamile, S.; Madonsela, S.; Kganyago, M. Trends in remote sensing of water quality parameters in inland water bodies: A systematic review. Front. Environ. Sci. 2025, 13, 1549301. [Google Scholar] [CrossRef]
- Lv, Y.; Jia, L.; Menenti, M.; Zheng, C.; Jiang, M.; Lu, J.; Zeng, Y.; Chen, Q.; Bennour, A. A novel remote sensing method to estimate pixel-wise lake water depth using dynamic water-land boundary and lakebed topography. Int. J. Digit. Earth 2024, 17, 2440443. [Google Scholar] [CrossRef]
- Knight, J.F.; Voth, M.L. Application of MODIS imagery for intra-annual water clarity assessment of Minnesota lakes. Remote Sens. 2012, 4, 2181–2198. [Google Scholar] [CrossRef]
- Torbick, N.; Hession, S.; Hagen, S.; Wiangwang, N.; Becker, B.; Qi, J. Mapping inland lake water quality across the Lower Peninsula of Michigan using Landsat TM imagery. Int. J. Remote Sens. 2013, 34, 7607–7624. [Google Scholar] [CrossRef]
- Xie, Y.; Huang, Q.; Chang, J.; Liu, S.; Wang, Y. Period analysis of hydrologic series through moving-window correlation analysis method. J. Hydrol. 2016, 538, 278–292. [Google Scholar] [CrossRef]
- Schröder, T.; Schmidt, S.I.; Kutzner, R.D.; Bernert, H.; Stelzer, K.; Friese, K.; Rinke, K. Exploring Spatial Aggregations and Temporal Windows for Water Quality Match-Up Analysis Using Sentinel-2 MSI and Sentinel-3 OLCI Data. Remote Sens. 2024, 16, 2798. [Google Scholar] [CrossRef]
- Read, E.K.; Patil, V.P.; Oliver, S.K.; Hetherington, A.L.; Brentrup, J.A.; Zwart, J.A.; Winters, K.M.; Corman, J.R.; Nodine, E.R.; Woolway, R.I.; et al. The importance of lake-specific characteristics for water quality across the continental United States. Ecol. Appl. 2015, 25, 943–955. [Google Scholar] [CrossRef] [PubMed]
- Ding, J.; Cao, J.; Xu, Q.; Xi, B.; Su, J.; Gao, R.; Huo, S.; Liu, H. Spatial heterogeneity of lake eutrophication caused by physiogeographic conditions: An analysis of 143 lakes in China. J. Environ. Sci. 2015, 30, 140–147. [Google Scholar] [CrossRef]
- Openshaw, S. The modifiable areal unit problem. In Concepts and Techniques in Modern Geography; Geo Books: Norwich, UK, 1984. [Google Scholar]
- Chakraborty, J.; Maantay, J.A.; Brender, J.D. Disproportionate proximity to environmental health hazards: Methods, models, and measurement. Am. J. Public Health 2011, 101, S27–S36. [Google Scholar] [CrossRef]
- Wong, D.W. The modifiable areal unit problem (MAUP). In WorldMinds: Geographical Perspectives on 100 Problems: Commemorating the 100th Anniversary of the Association of American Geographers 1904–2004; Springer: Dordrecht, The Netherlands, 2004; pp. 571–575. [Google Scholar]
- Longley, P.A.; Goodchild, M.F.; Maguire, D.J.; Rhind, D.W. Geographic Information Science and Systems; John Wiley & Sons: Hoboken, NJ, USA, 2015. [Google Scholar]
- Tang, W.; Lu, Z. Application of self-organizing map (SOM)-based approach to explore the relationship between land use and water quality in Deqing County, Taihu Lake Basin. Land Use Policy 2022, 119, 106205. [Google Scholar] [CrossRef]
- Gu, Q.; Hu, H.; Ma, L.; Sheng, L.; Yang, S.; Zhang, X.; Zhang, M.; Zheng, K.; Chen, L. Characterizing the spatial variations of the relationship between land use and surface water quality using self-organizing map approach. Ecol. Indic. 2019, 102, 633–643. [Google Scholar] [CrossRef]
- Liu, C.; Pan, C.; Chang, Y.; Luo, M. An integrated autoregressive model for predicting water quality dynamics and its application in Yongding River. Ecol. Indic. 2021, 133, 108354. [Google Scholar] [CrossRef]
- Jumber, M.B.; Damtie, M.T.; Tegegne, D. Integration of multivariate adaptive regression splines and weighted arithmetic water quality index methods for drinking water quality analysis. Water Conserv. Sci. Eng. 2024, 9, 6. [Google Scholar] [CrossRef]
- Elsayed, S.; Ibrahim, H.; Hussein, H.; Elsherbiny, O.; Elmetwalli, A.H.; Moghanm, F.S.; Ghoneim, A.M.; Danish, S.; Datta, R.; Gad, M. Assessment of water quality in Lake Qaroun using ground-based remote sensing data and artificial neural networks. Water 2021, 13, 3094. [Google Scholar] [CrossRef]
- Ding, F.; Zhang, W.; Cao, S.; Hao, S.; Chen, L.; Xie, X.; Li, W.; Jiang, M. Optimization of water quality index models using machine learning approaches. Water Res. 2023, 243, 120337. [Google Scholar] [CrossRef] [PubMed]
- Deboeck, G.; Kohonen, T. (Eds.) Visual Explorations in Finance: With Self-Organizing Maps; Springer Science & Business Media: London, UK, 2013. [Google Scholar]
- Perelman, L.; Arad, J.; Housh, M.; Ostfeld, A. Event detection in water distribution systems from multivariate water quality time series. Environ. Sci. Technol. 2012, 46, 8212–8219. [Google Scholar] [CrossRef] [PubMed]
- Hill, T.E.; Evans, R.L.; Bell, J.S. Water quality assessment of Horseshoe Lake. In ISWS Contract Report CR 249; Illinois State Water Survey: Champaign, IL, USA, 1981. [Google Scholar]
- Brugam, R.; Bala, I.; Martin, J.; Vermillion, B.; Retzlaff, W. The sedimentary record of environmental contamination in Horseshoe Lake, Madison County, Illinois. Trans. Ill. State Acad. Sci. 2003, 96, 205–217. [Google Scholar]
- Google Developers. Harmonized Sentinel-2 MSI: MultiSpectral Instrument, Level-2A|Earth Engine Data Catalog. Retrieved. Available online: https://developers.google.com/earth-engine/datasets/catalog/COPERNICUS_S2_SR_HARMONIZED (accessed on 15 January 2025).
- U.S. Geological Survey. National Hydrography Dataset (NHD) Waterbodies; U.S. Geological Survey: Reston, VA, USA, 2016.
- U.S. Geological Survey & Natural Resources Conservation Service. Watershed Boundary Dataset (WBD); U.S. Geological Survey & Natural Resources Conservation Service: Washington, DC, USA, 2016.
- Dewitz, J. National Land Cover Database (NLCD) 2021 Products; U.S. Geological Survey data release; USGS: Reston, VA, USA, 2023. [CrossRef]
- ArcGIS Pro, Version 3.1; Environmental Systems Research Institute: Redlands, CA, USA, 2023.
- European Space Agency (ESA). Sentinel-2 MSI Technical Guide. Copernicus Open Access Hub. 2020. Available online: https://documentation.dataspace.copernicus.eu/Data/Sentinel2.html (accessed on 10 March 2025).
- Zekoll, V.; Main-Knorn, M.; Alonso, K.; Louis, J.; Frantz, D.; Richter, R.; Pflug, B. Comparison of masking algorithms for sentinel-2 imagery. Remote Sens. 2021, 13, 137. [Google Scholar] [CrossRef]
- Bisong, E. Google colaboratory. In Building Machine Learning and Deep Learning Models on Google Cloud Platform; Apress: Berkeley, CA, USA, 2019; pp. 59–64. [Google Scholar]
- McKinney, W. Data structures for statistical computing in Python. Scipy 2010, 445, 51–56. [Google Scholar]
- Harris, C.R.; Millman, K.J.; van der Walt, S.J.; Gommers, R.; Virtanen, P.; Cournapeau, D.; Wieser, E.; Taylor, J.; Berg, S.; Smith, N.J.; et al. Array programming with NumPy. Nature 2020, 585, 357–362. [Google Scholar] [CrossRef]
- Virtanen, P.; Gommers, R.; Oliphant, T.E.; Haberland, M.; Reddy, T.; Cournapeau, D.; Burovski, E.; Peterson, P.; Weckesser, W.; Bright, J.; et al. SciPy 1.0: Fundamental algorithms for scientific computing in Python. Nat. Methods 2020, 17, 261–272. [Google Scholar] [CrossRef]
- Pedregosa, F.; Varoquaux, G.; Gramfort, A.; Michel, V.; Thirion, B.; Grisel, O.; Blondel, M.; Prettenhofer, P.; Weiss, R.; Dubourg, V.; et al. Scikit-learn: Machine learning in Python. J. Mach. Learn. Res. 2011, 12, 2825–2830. [Google Scholar]
- Hunter, J.D. Matplotlib: A 2D graphics environment. Comput. Sci. Eng. 2007, 9, 90–95. [Google Scholar] [CrossRef]
- Waskom, M.L. Seaborn: Statistical data visualization. J. Open Source Softw. 2021, 6, 3021. [Google Scholar] [CrossRef]
- Akbarnejad Nesheli, S.; Quackenbush, L.J.; McCaffrey, L. Estimating Chlorophyll-a and phycocyanin concentrations in inland temperate lakes across new York state using sentinel-2 images: Application of Google Earth engine for efficient satellite image processing. Remote Sens. 2024, 16, 3504. [Google Scholar] [CrossRef]
- Mishra, S.; Mishra, D.R. Normalized difference chlorophyll index: A novel model for remote estimation of chlorophyll-a concentration in turbid productive waters. Remote Sens. Environ. 2012, 117, 394–406. [Google Scholar] [CrossRef]
- Kolli, M.K.; Chinnasamy, P. Estimating turbidity concentrations in highly dynamic rivers using Sentinel-2 imagery in Google Earth Engine: Case study of the Godavari River, India. Environ. Sci. Pollut. Res. 2024, 31, 33837–33847. [Google Scholar] [CrossRef] [PubMed]
- Gower, J.F.R.; Doerffer, R.; Borstad, G.A. Interpretation of the 685nm peak in water-leaving radiance spectra in terms of fluorescence, absorption and scattering, and its observation by MERIS. Int. J. Remote Sens. 1999, 20, 1771–1786. [Google Scholar] [CrossRef]
- Salls, W.B.; Schaeffer, B.A.; Pahlevan, N.; Coffer, M.M.; Seegers, B.N.; Werdell, P.J.; Ferriby, H.; Stumpf, R.P.; Binding, C.E.; Keith, D.J. Expanding the application of Sentinel-2 chlorophyll monitoring across United States lakes. Remote Sens. 2024, 16, 1977. [Google Scholar] [CrossRef] [PubMed]
- Carlson, R.E. A trophic state index for lakes 1. Limnol. Oceanogr. 1977, 22, 361–369. [Google Scholar] [CrossRef]
- Rigaill, G. A pruned dynamic programming algorithm to recover the best segmentations with 1 to Kmax change-points. J. Société Française Stat. 2015, 156, 180–205. [Google Scholar]
- Truong, C.; Oudre, L.; Vayatis, N. ruptures: Change point detection in Python. arXiv 2018, arXiv:1801.00826. [Google Scholar] [CrossRef]
- Mann, H.B. Nonparametric tests against trend. Econometrica 1945, 13, 245–259. [Google Scholar] [CrossRef]
- Kendall, M.G. Rank Correlation Methods, 4th ed.; Charles Griffin: London, UK, 1975. [Google Scholar]
- Yue, S.; Wang, C. The Mann-Kendall test modified by effective sample size to detect trend in serially correlated hydrological series. Water Resour. Manag. 2004, 18, 201–218. [Google Scholar] [CrossRef]
- Hussain, M.; Mahmud, I. pyMannKendall: A python package for non parametric Mann Kendall family of trend tests. J. Open Source Softw. 2019, 4, 1556. [Google Scholar] [CrossRef]
- Shenbagalakshmi, G.; Shenbagarajan, A.; Thavasi, S.; Nayagam, M.G.; Venkatesh, R. Determination of water quality indicator using deep hierarchical cluster analysis. Urban Clim. 2023, 49, 101468. [Google Scholar] [CrossRef]
- Yang, Y.H.; Zhou, F.; Guo, H.C.; Sheng, H.; Liu, H.; Dao, X.; He, C.J. Analysis of spatial and temporal water pollution patterns in Lake Dianchi using multivariate statistical methods. Environ. Monit. Assess. 2010, 170, 407–416. [Google Scholar] [CrossRef] [PubMed]
- Illinois Environmental Protection Agency. Illinois Integrated Water Quality Report and Section 303(d) List; Bureau of Water: Springfield, IL, USA, 2024.
- Chipman, J.W.; Lillesand, T.M.; Schmaltz, J.E.; Leale, J.E.; Nordheim, M.J. Mapping lake water clarity with Landsat images in Wisconsin, USA. Can. J. Remote Sens. 2004, 30, 1–7. [Google Scholar] [CrossRef]
- Olmanson, L.G.; Brezonik, P.L.; Finlay, J.C.; Bauer, M.E. Comparison of Landsat 8 and Landsat 7 for regional measurements of CDOM and water clarity in lakes. Remote Sens. Environ. 2016, 185, 119–128. [Google Scholar] [CrossRef]
- Carlson, R.E.; Simpson, J. A coordinator’s guide to volunteer lake monitoring methods. N. Am. Lake Manag. Soc. 1996, 96, 305. [Google Scholar]
- Søndergaard, M.; Bjerring, R.; Jeppesen, E. Persistent internal phosphorus loading during summer in shallow eutrophic lakes. Hydrobiologia 2013, 710, 95–107. [Google Scholar] [CrossRef]
- Helsel, D.R.; Hirsch, R.M. Statistical Methods in Water Resources; Elsevier: Amsterdam, The Netherlands, 1993; Volume 49. [Google Scholar]
- Feng, H.; Yan, J.; Xia, J. Application of time series and multivariate statistical models for water quality assessment and pollution source apportionment in an Urban River, New Jersey, USA. Environ. Sci. Pollut. Res. 2020, 27, 30887–30902. [Google Scholar]
- Jaiswal, A.; Kumar, A.; Kumari, S.; Singh, R.K. Trend Analysis on Water Quality Index Using the Least Squares Regression Models. Environ. Ecol. Res. 2022, 10, 561–571. [Google Scholar] [CrossRef]
- Friedman, J. The Elements of Statistical Learning: Data Mining, Inference, and Prediction; Springer: New York, NY, USA, 2009. [Google Scholar]
- Ward, J.H., Jr. Hierarchical grouping to optimize an objective function. J. Am. Stat. Assoc. 1963, 58, 236–244. [Google Scholar] [CrossRef]
- Rousseeuw, P.J. Silhouettes: A graphical aid to the interpretation and validation of cluster analysis. J. Comput. Appl. Math. 1987, 20, 53–65. [Google Scholar] [CrossRef]
- Davies, D.L.; Bouldin, D.W. A cluster separation measure. IEEE Trans. Pattern Anal. Mach. Intell. 1979, PAMI-1, 224–227. [Google Scholar] [CrossRef]
- Schölkopf, B.; Smola, A.; Müller, K.R. Nonlinear component analysis as a kernel eigenvalue problem. Neural Comput. 1998, 10, 1299–1319. [Google Scholar] [CrossRef]
- Zhao, Y.; Yu, T.; Hu, B.; Zhang, Z.; Liu, Y.; Liu, X.; Liu, H.; Liu, J.; Wang, X.; Song, S. Retrieval of water quality parameters based on near-surface remote sensing and machine learning algorithm. Remote Sens. 2022, 14, 5305. [Google Scholar] [CrossRef]
- Ojewole, C.O. Monitoring the Occurrence of Fecal Indicator Bacteria and Waterborne-Disease Pathogens in Horseshoe Lake and Dunlap Lake; Southern Illinois University at Edwardsville: Edwardsville, IL, USA, 2023. [Google Scholar]
- Dimpor, J.J.; Lucky, O.P.; Kwarkye, D.F.; Watts, S.; Oguayo, C.P.; Ojewole, C.O.; Kusi, J. Identifying spatiotemporal patterns and drivers of fecal indicator bacteria in an urban lake for water quality assessment and management. Heliyon 2025, 11, e40955. [Google Scholar] [CrossRef]
- Woolway, R.I.; Zhang, Y.; Jennings, E.; Zohary, T.; Jane, S.F.; Jansen, J.; Weyhenmeyer, G.A.; Long, D.; Fleischmann, A.; Feng, L.; et al. Extreme and compound events in lakes. Nat. Rev. Earth Environ. 2025, 6, 593–611. [Google Scholar] [CrossRef]
- Xue, F.; Zhang, Q.; Melack, J.M.; Tang, H.; Yuan, S.; Jia, Y.; Xue, C.; Song, Y. Floodplain lakes: Linking hydrology to ecology and conservation. Earth-Sci. Rev. 2024, 258, 104967. [Google Scholar] [CrossRef]
- Geng, Y.; Cao, Z.; Yu, R.; Li, X.; Sun, H.; Wang, X. Delving into nitrogen and phosphorus dynamics in shallow eutrophic lakes: Multi-interface response to freeze-thaw cycles. Sci. Total Environ. 2024, 955, 177052. [Google Scholar] [CrossRef] [PubMed]
- Bhagowati, B.; Ahamad, K.U. A review on lake eutrophication dynamics and recent developments in lake modeling. Ecohydrol. Hydrobiol. 2019, 19, 155–166. [Google Scholar] [CrossRef]
- Eilers, J.M.; Brakke, D.F.; Landers, D.H. Chemical and physical characteristics of lakes in the Upper Midwest, United States. Environ. Sci. Technol. 1988, 22, 164–172. [Google Scholar] [CrossRef] [PubMed]
- Pearce, A.R. Characterizing Limiting Nutrient Distributions and Fluxes in a Eutrophic Midwestern Reservoir. Master’s Thesis, Saint Louis University, St. Louis, MO, USA, 2016. [Google Scholar]
- Carlson Mazur, M.L.; Smith, B.; Bird, B.; McMillan, S.; Pyron, M.; Hauswald, C. Hydrologic connectivity and land cover affect floodplain lake water quality, fish abundance, and fish diversity in floodplain lakes of the Wabash-White River basin. River Res. Appl. 2022, 38, 160–172. [Google Scholar] [CrossRef]
- Hu, M.; Ma, R.; Xue, K.; Cao, Z.; Xiong, J.; Loiselle, S.A.; Shen, M.; Hou, X. Eutrophication evolution of lakes in China: Four decades of observations from space. J. Hazard. Mater. 2024, 470, 134225. [Google Scholar] [CrossRef] [PubMed]
- Zhang, F.; Tang, H.; Jin, G.; Zhu, Y.; Zhang, H.; Stewart, R.A.; Bertone, E.; Yuan, S. Evaluating nutrient distribution and eutrophication pattern in a shallow impounded lake: Exploring the influence of floods. Int. J. Sediment Res. 2024, 39, 375–385. [Google Scholar] [CrossRef]
- Lin, S.S.; Shen, S.L.; Zhou, A.; Lyu, H.M. Assessment and management of lake eutrophication: A case study in Lake Erhai, China. Sci. Total Environ. 2021, 751, 141618. [Google Scholar] [CrossRef]
- Jones, J.R.; Bachmann, R.W. Prediction of phosphorus and chlorophyll levels in lakes. J. (Water Pollut. Control Fed.) 1976, 48, 2176–2182. [Google Scholar]
- Organisation for Economic Co-operation and Development. Eutrophication of Waters: Monitoring, Assessment and Control; OECD: Paris, France, 1982. [Google Scholar]
- Wetzel, R.G. Limnology: Lake and River Ecosystems, 3rd ed.; Academic Press: Cambridge, MA, USA, 2001. [Google Scholar]
- Hipsey, M.R.; Bruce, L.C.; Ivey, G.N. Modeling and management of hydrodynamics and water quality in aquatic ecosystems. Environ. Model. Softw. 2020, 125, 104616. [Google Scholar]
- Sharma, S.; Gadhvi, A. Multi-temporal analysis of lake surface area using Landsat satellite data: A case study of Sukhna Lake, India. Int. J. Adv. Remote Sens. GIS 2018, 7, 2291–2301. [Google Scholar]
- Demir, H.; Uyumaz, A.; Ozer, Y. Suitability of Non-Parametric Tools for Complex Lake Dynamics: A Case Study from Turkey. In Hydrology of Small Catchments: New Approaches to Hydrological and Environmental Problems; Springer: Berlin/Heidelberg, Germany, 2021; pp. 143–156. [Google Scholar]
- Håkanson, L.; Boulion, V.V. The Driving Forces of Lake and Reservoir Ecology; Springer: Berlin/Heidelberg, Germany, 2002. [Google Scholar]
- Grizzetti, B.; Pistocchi, A.; Cinnirella, S. A fuzzy-based multi-criteria method for the assessment of water quality in rivers. Environ. Model. Softw. 2017, 97, 176–188. [Google Scholar]
- Kutser, T.; Metsamaa, L.; Paavel, B. Hyperspectral remote sensing of inland waters: A review. Geocarto Int. 2016, 31, 841–854. [Google Scholar]
- Kaufman, L.; Rousseeuw, P.J. Finding Groups in Data: An Introduction to Cluster Analysis; Wiley: Hoboken, NJ, USA, 2005. [Google Scholar]
- Buscaino, G.; Buscaino, L.; Mazzola, M.; Vella, A. Using cluster analysis to assess the spatial heterogeneity of water quality parameters in a large shallow lake. Limnol.—Ecol. Manag. Inland Waters 2020, 84, 125810. [Google Scholar]


| Band Name | Band Number | Band Description | Central Wavelength (nm) | Spatial Resolution (m) |
|---|---|---|---|---|
| B1 | Band 1 | Coastal aerosol | 443 | 60 |
| B2 | Band 2 | Blue | 490 | 10 |
| B3 | Band 3 | Green | 560 | 10 |
| B4 | Band 4 | Red | 665 | 10 |
| B5 | Band 5 | Red edge 1 | 705 | 20 |
| B6 | Band 6 | Red edge 2 | 740 | 20 |
| B7 | Band 7 | Red edge 3 | 783 | 20 |
| B8 | Band 8 | NIR (Near-Infrared) | 842 | 10 |
| B8A | Band 8A | Narrow NIR | 865 | 20 |
| B9 | Band 9 | Water vapor | 945 | 60 |
| B11 | Band 11 | SWIR 1 (Short-Wave Infrared) | 1610 | 20 |
| B12 | Band 12 | SWIR 2 | 2190 | 20 |
| QA60 | - | Cloud mask bitmask | - | 60 |
Disclaimer/Publisher’s Note: The statements, opinions and data contained in all publications are solely those of the individual author(s) and contributor(s) and not of MDPI and/or the editor(s). MDPI and/or the editor(s) disclaim responsibility for any injury to people or property resulting from any ideas, methods, instructions or products referred to in the content. |
© 2025 by the authors. Licensee MDPI, Basel, Switzerland. This article is an open access article distributed under the terms and conditions of the Creative Commons Attribution (CC BY) license (https://creativecommons.org/licenses/by/4.0/).
Share and Cite
Tiwari, A.; Hsuan, E.; Goswami, S. Spatiotemporal Water Quality Assessment in Spatially Heterogeneous Horseshoe Lake, Madison County, Illinois Using Satellite Remote Sensing and Statistical Analysis (2020–2024). Water 2025, 17, 2997. https://doi.org/10.3390/w17202997
Tiwari A, Hsuan E, Goswami S. Spatiotemporal Water Quality Assessment in Spatially Heterogeneous Horseshoe Lake, Madison County, Illinois Using Satellite Remote Sensing and Statistical Analysis (2020–2024). Water. 2025; 17(20):2997. https://doi.org/10.3390/w17202997
Chicago/Turabian StyleTiwari, Anuj, Ellen Hsuan, and Sujata Goswami. 2025. "Spatiotemporal Water Quality Assessment in Spatially Heterogeneous Horseshoe Lake, Madison County, Illinois Using Satellite Remote Sensing and Statistical Analysis (2020–2024)" Water 17, no. 20: 2997. https://doi.org/10.3390/w17202997
APA StyleTiwari, A., Hsuan, E., & Goswami, S. (2025). Spatiotemporal Water Quality Assessment in Spatially Heterogeneous Horseshoe Lake, Madison County, Illinois Using Satellite Remote Sensing and Statistical Analysis (2020–2024). Water, 17(20), 2997. https://doi.org/10.3390/w17202997


