Abstract
Ecological security evaluation serves as the cornerstone for ecological management decision-making and spatial optimization. This study focuses on the Dongping Lake Basin. Based on the Pressure–State–Response (PSR) model framework, it integrates ecological risk, ecosystem health, and ecosystem service indicators. Utilizing methods including Local Indicators of Spatial Association (LISA), Transition Matrix, and GeoDetector, it analyzes the spatio-temporal evolution characteristics and driving mechanisms of watershed ecological security from 2000 to 2020. The findings reveal that the Watershed Ecological Security Index (WESI) exhibited a trend of “fluctuating upward followed by periodic decline”. In 2000, the status was “relatively unsafe”. It peaked in 2015 (index 0.332, moderately safe) and experienced a slight decline by 2020. Spatially, a significantly clustered pattern of “higher in the north and lower in the south, higher in the east and lower in the west” was observed. In 2020, “High-High” clusters of ecological security aligned closely with Shandong Province’s ecological conservation red line, concentrating in core protected areas such as the foothills of the Taihang Mountains and Dongping Lake Wetland. Level transitions were characterized by “predominant continuous improvement in low levels alongside localized reverse fluctuations in middle and high levels,” with the “relatively unsafe” and “moderately safe” levels experiencing the largest transfer areas. Geographical detector analysis indicates that the Human Interference Index (HI), Ecosystem Service Value (ESV), and Annual Afforestation Area (AAA) were key drivers of watershed ecological security change, influenced by dynamic interactive effects among multiple factors. This study advances watershed-scale ecological security assessment methodologies. The revealed spatio-temporal patterns and driving mechanisms provide valuable insights for protecting the ecological barrier in the lower Yellow River and informing ecological security strategies within the Dongping Lake Watershed.
1. Introduction
Ecological security has emerged as one of the critical challenges facing sustainable human development amid global environmental change. Safeguarding ecological security has become a global consensus [1]. As the basis and important guarantee of energy and material circulation, watershed system carries multiple service functions, such as water resource supply, biodiversity maintenance, climate regulation, etc. [2], and as the materialization and extension of ecological security on the watershed scale, watershed ecological security is an emerging research field promoted by ecological protection and restoration [3], and the maintenance of watershed ecological security is an important foundation and prerequisite for ensuring national ecological security. Watershed ecological security evaluation, as the basis for the scientific development of watershed management decisions, is one of the hotspots that many scholars have paid attention to and researched. Current research mainly focuses on the exploration of the application of methods [4,5], ecological security measurements, and the analysis of dominant factors [6,7]. In terms of research methods, the characteristic index method and index system method are mainly applied, in which the Pressure–State–Response (PSR) model promoted and developed by the Organization for Economic Cooperation and Development (OCED) and the United Nations Environment Programme (UNEP) is widely used in complex evaluation studies of environmental systems [8]. In terms of research objects, there has been a gradual shift from the previous large scales, such as global [9], national [10], provincial [11], and urban agglomerations [12], to small scales, such as watersheds [13], nature reserves [14], and wetlands [15]. These studies provide a theoretical basis for the restoration, development, and management of watershed ecosystems.
As an important part of the ecological security barrier of the lower reaches of the Yellow River, Dongping Lake Basin not only plays an important role in supporting the water resource supply and climate regulation in the Beijing–Tianjin–Hebei region, but also has an irreplaceable and important role in providing water conservation and production capacity for the development of Xiong’an New Area [16]. However, under the condition of high-speed economic development, the aggregation and intensification of human production and life have continuously coerced the ecological security of the region, leading to ecological security problems such as fragile ecological environment, landscape fragmentation, ecosystem service function decline, etc. [17], and in the context of the era of ecological civilization construction as well as the strategic deployment of the ecological protection and high-quality development of the lower reaches of the Yellow River, there is an urgent need to alleviate the urbanization and ecological system, and improve the quality of ecological environment in the watershed. Currently, studies in the basin only involve landscape pattern analysis [18], ecosystem service assessment [19], and ecological health evaluation [20], and have not yet carried out a comprehensive ecological security evaluation of the Dongping Lake Basin with the objectives of risk avoidance, maintenance of health, and provision of services.
Therefore, taking the Dongping Lake Basin as the research object, this study establishes an ecological security evaluation framework integrating ecological risk, ecosystem health, and ecosystem services based on the PSR model. By applying Local Indicators of Spatial Association (LISA) and an ecological security grade transition matrix, it reveals the spatio-temporal differentiation characteristics of ecological security in the basin in 2000, 2005, 2010, 2015, and 2020. Additionally, the driving mechanisms of ecological security changes in the basin are analyzed using GeoDetector, providing references for ecological security management and spatial planning of the watershed.
2. Methods and Data Sources
2.1. Study Area
The Dongping Lake Basin is located in the center of Shandong Province, covering an area of 8948 km2, with geographic coordinates ranging from 116°7′ to 18°6′ E and 35°48′ to 36°45′ N. It flows from east to west through nine districts and counties in Tai’an and Jinan before being injected into the Dongping Lake, and then merging into the Yellow River (Figure 1). The average temperature of the basin has been 12–14 °C for many years, and the seasonal distribution of precipitation is uneven. Its water system is complex, with a drop of 362 m from its origin to the river mouth. It is one of China’s rare east-to-west flowing rivers [21]. The terrain of the basin is high in the north and low in the south, high in the east and low in the west, and the eastern part of the basin is a high and steep stony mountainous area; the hills, as a transition area between the plains and the mountains, are mainly distributed in the central west of the basin; the western part is a lake depression and plains, which are suitable for agricultural cultivation and habitation. At this stage, Dongping Lake Basin faces a series of ecological issues: fragile ecosystems in the upstream area, insufficient total forest resources, low vegetation cover, and prominent soil erosion [22]; in the middle and lower reaches, there is intensive utilization of arable land, a relatively dense population, and problems such as water shortages, over-exploitation of water resources development, and agricultural non-point source pollution; from a basin-wide perspective, the spatio-temporal distribution of precipitation in the Dongping Lake Basin is uneven, with droughts and floods occurring occasionally [23]. In summary, the Dongping Lake Basin is characterized by the complexity of ecosystem structure, the particularity of the geographical environment, and the multidimensionality of human activity interference, offering ideal conditions for comprehensive research on watershed ecological security issues.
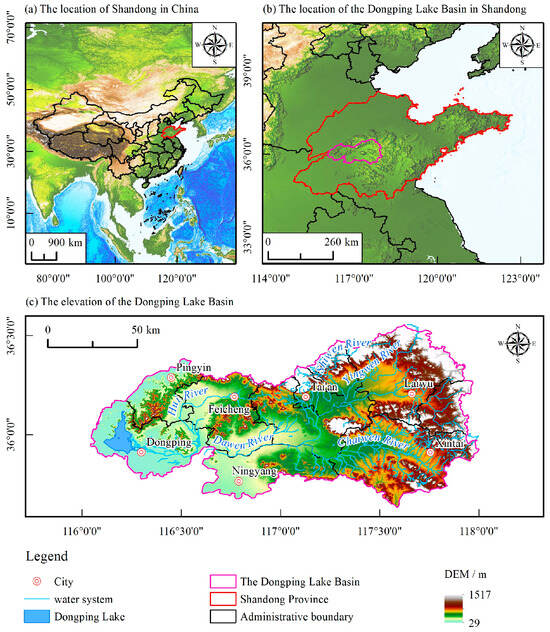
Figure 1.
Geographical location of the study area. (a) The location of Shandong in China; (b) The location of the Dongping Lake Basin in Shandong; (c) The elevation of the Dongping Lake Basin. The map of China’s geography uses the map review number GS (2024) 0650, with no modifications to the base map. The DEM elevation data were downloaded from the Geospatial Data Cloud (http://www.gscloud.cn/), with a resolution of 30 m × 30 m.
2.2. Data Sources
The datasets used in this study are from domestic and international public databases (Table 1). The land use/cover type data are divided into six categories, namely, cropland, forest land, grassland, watershed, construction land, and unutilized land, based on land resources and their utilization attributes.

Table 1.
Data type and source.
2.3. Methodology
2.3.1. Evaluation Modeling
Based on the PSR model, this study deconstructs the relationships among ecological risk, ecosystem health, and ecosystem services into three layers: Pressure, State, and Response (Figure 2). Traditional risk assessment typically follows the “probability × loss” paradigm. Here, we adjust this approach by quantifying ecological risk probability through the actual disturbance intensity of risk sources. The product of this probability and ecosystem services constitutes the negative effect on ecological security, reflecting risk threats [24]. Meanwhile, the widely adopted VORS model (Vigor–Organization–Resilience–Services) for ecosystem health assessment represents the product of natural ecosystem health and ecosystem services. This denotes the positive effect on ecological security, indicating an ecosystem’s capacity for self-maintenance, self-regulation, self-recovery, and sustained service provision [25]. Critically, however, a secure ecosystem must be healthy, but a healthy ecosystem is not necessarily secure—its safety depends on contextual hazardous conditions. Thus, this study integrates positive and negative effects to construct an ecological security evaluation index model. This reveals that ecological security levels are governed by the synergy between ecological risk and ecosystem health in shaping ecosystem services.
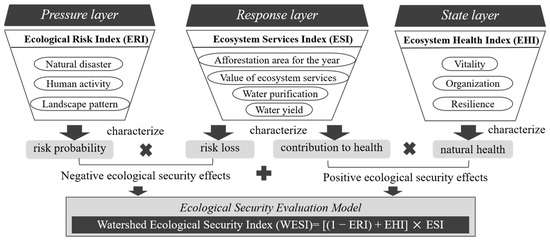
Figure 2.
Watershed ecological security evaluation framework. solid arrows denote characterization relationships, multiplication signs denote product operation, plus signs denote additive effects.
2.3.2. Selection of the Indicator System
The evaluation indicators are categorized according to the main ecological issues faced by the watershed (Table 2).
- (1)
- Ecological risk evaluation
Basin ecosystems are subject to landscape patterns and natural and social factors, and it is difficult to comprehensively assess their multiple risks with a single indicator. Therefore, this study refers to previous studies and combines the actual situation of the study area, from the three dimensions of natural disaster risk, human activity risk and landscape pattern risk [26], using hierarchical analysis and entropy weighting method to comprehensively calculate the weights of the indicators, and then carry out a weighted summation to construct the ERI [23].
- (2)
- Ecological health evaluation
The evaluation of ecosystem health comprehensively considers the vitality, organization, and resilience of ecosystems [27]. Vitality is measured by Total Water Resources (TWR) and NDVI, reflecting the resource utilization and energy conversion efficiency of ecosystems [28]. Organization is reflected by landscape heterogeneity, characterizing the complexity of internal structures within ecosystems [24]. Resilience is assessed through the Habitat Quality (HQ), where the higher the HQ is, the better the ecosystem’s self-repair and disturbance resistance capabilities are [29]. The EHI is calculated by multiplying the normalized indicators by comprehensive weights [30].
- (3)
- Ecological service evaluation
Referring to the policy documents such as “Technical Specification for Ecological Functional Zoning” (draft for comments) and “Guidelines for the Delineation of Ecological Protection Red Line”, and combining them with the ecological characteristics of the study area and data accessibility, this study selected five indicators, Annual Afforestation Area (AAA), Water Yield (WY), Nitrogen Export (NE), Phosphorus Export (PE), and Ecosystem Services Value (ESV), and the various service indexes were normalized and multiplied by the composite weight to obtain the ESI [31].

Table 2.
Watershed ecological security evaluation indicator system.
Table 2.
Watershed ecological security evaluation indicator system.
| Type | Element | Indicate | Characterization | Calculation Method | Reference |
|---|---|---|---|---|---|
| Press | Ecological Risk | Aridity Index (AI) | Drought risk | Ratio Method is the mean annual precipitation, and is the mean annual reference evapotranspiration. | [32] |
| Soil Erosion (SE/t·km−2·a−1) | Geological risk | Soil Loss Equation is the rainfall erosivity factor representing the potential erosive capability of a rain event, is the soil erodibility factor, is the slope length factor, is the slope gradient factor, is the vegetation cover and biological practice factor, is the SWC factor, and is the tillage and management factor. | [33] | ||
| Human Interference Index (HI) | Impact of human activities | Weighted Summation Method is the area of the land use type, is the number of land use types, is the disturbance index corresponding to the land use type, and is the area of a single grid cell. | [34] | ||
| Patch Density (PD) | Degree of landscape fragmentation | Landscape Pattern Index is the total number of patches, and is the total analysis area. | [35] | ||
| State | Ecological Health | Total Water Resources (TWR/108 m3) | Water availability and supply/demand balance | Panel Data | |
| Normalized Difference Vegetation Index (NDVI) | Forest and grass coverage | Remote Sensing Imagery Inversion | |||
| Shannon Diversity Index (SHDI) | Species richness and complexity | Landscape Pattern Index is the number of landscape patches, and is the proportion of the area of landscape patch type relative to the total area of all landscape patches. | [36] | ||
| Habitat Quality (HQ) | Overall ecosystem health and environmental quality | InVEST Model is the degree of habitat degradation, is the habitat adaptability of grid x in land use type j; is the half-saturation constant. | [37] | ||
| Response | Ecological Service | Annual Afforestation Area (AAA/hm2) | Degree of greening and effectiveness of ecological civilization | Panel Data | |
| Nitrogen Export (NE/kg·hm−2) | Water purification and conditioning services | InVEST Model is the or load of pixel (kg/year), consists of surface runoff load and underground runoff load, and is expressed as the runoff. | |||
| Phosphorus Export (PE/kg·hm−2) | [38] | ||||
| Water Yield (WY/mm) | Water supply capacity | InVEST Model is the annual precipitation for each pixel and is the annual actual evapotranspiration for each pixel . | [39] | ||
| Ecosystem Services Value (ESV/billion CNY) | Ability of the system to maintain multiple functions or services | Weighted Summation Method is the area, and is the value coefficient (billion CNY/ha/yr) for land use category k. | [40] |
2.3.3. Evaluation Rating
Currently, the natural breakpoint method is mostly used to classify the ecological security levels, which aims to minimize the intra-class differences while maximizing the inter-class differences. Therefore, ArcGIS 10.8 was used to reclassify the WESI using the natural breakpoint method. As shown in Table 3, the WESI was classified into five classes: safe level, relatively safe level, moderately safe level, relatively unsafe level, and unsafe level, which reflects the relative degree of ecological security within the watershed. The description of the level status refers to Ref. [41].

Table 3.
Dongping Lake Basin ecological security evaluation indicator system.
2.3.4. GeoDetector
Geographic detectors are a set of statistical methods proposed by Jinfeng Wang et al. [42] to quantitatively assess stratified heterogeneity and reveal the driving forces behind it. Factor detection is the use of q-values to measure the explanatory power of each driver X on the spatial divergence of the attributes of the dependent variable Y. The factor probes are used to measure the spatial heterogeneity of the dependent variable Y.
where h = 1,2,3,…….,l is stratification of or ; (N) are numbers of units in layer and the entire area, respectively; ) are variances of layer and the entire area, respectively; takes a value between 0 and 1, and the dominant factors affecting ecological security are determined by this value.
Interaction detection is used to identify the explanatory power of the interaction between different factors on the dependent variable , whose main modes of comparison are , , and ; the interaction results are shown in Table 4. Reprinted from Ref. [43].

Table 4.
Types of interactive detector results.
2.4. Indicator Data
To systematically assess the ecological security status of the study area, this study utilizes publicly available data sources to calculate and compile 13 evaluation indicators (Table 5). All data were converted to a unified spatial coordinate system to ensure the accuracy of spatial analysis. Table 5 details the key statistical characteristics of each indicator after this processing, including the Maximum (Max), Minimum (Min), Mean, and Standard deviation (SD), establishing a solid data foundation for subsequent model construction and comprehensive analysis.

Table 5.
Descriptive statistics of ecological security evaluation indicators.
3. Results and Analysis
3.1. Trend of Changes in Evaluation Indicators
Using 2 km grid cells as statistical units, the changing characteristics of various evaluation indicators in the Dongping Lake Basin from 2000 to 2020 were analyzed, as shown in Figure 3, Figure 4 and Figure 5.
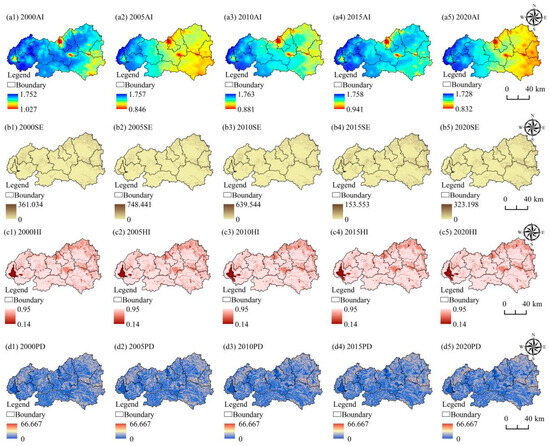
Figure 3.
Spatio-temporal distribution maps of ecological risk characterization indicators in the Dongping Lake Basin from 2000 to 2020. AI (a1–a5), SE (b1–b5), HI (c1–c5), and PD (d1–d5).
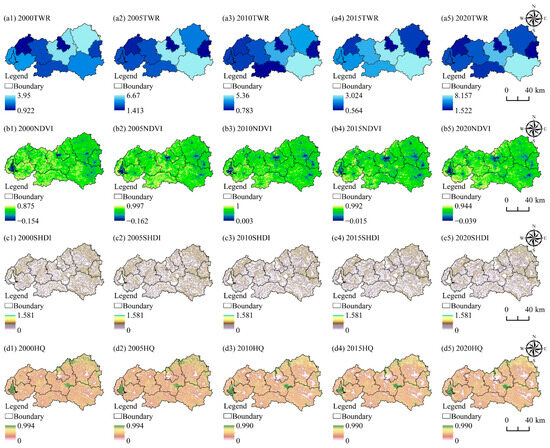
Figure 4.
Spatio-temporal distribution maps of ecological health characterization indicators in the Dongping Lake Basin from 2000 to 2020. TWR (a1–a5), NDVI (b1–b5), SHDI (c1–c5), and HQ (d1–d5).
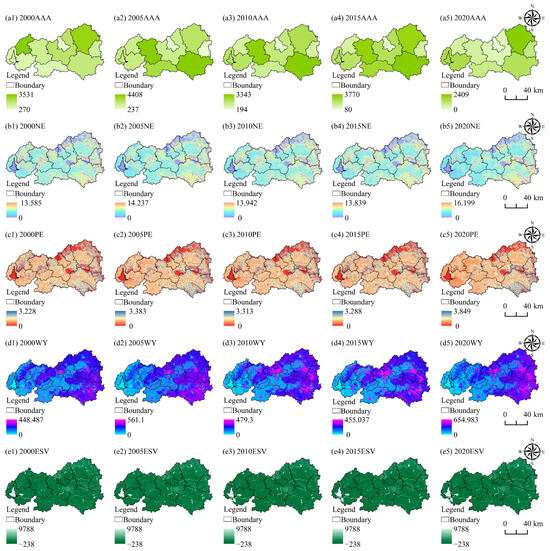
Figure 5.
Spatio-temporal distribution maps of ecological services characterization indicators in the Dongping Lake Basin from 2000 to 2020. AAA (a1–a5), NE (b1–b5), PE (c1–c5), WY (d1–d5), and ESV (e1–e5).
From 2000 to 2020, natural and anthropogenic pressures in the Dongping Lake Basin were notably pronounced (Figure 3). The AI exhibited a fluctuating downward trend, with its mean value decreasing from 1.608 in 2000 to 1.374 in 2020 (Figure 3(a1–a5)). Spatially, AI values were higher in the west than in the east. The southwestern part of the basin (e.g., Dongping County and Pingyin County), characterized by flat terrain and intense evaporation, faced relatively higher drought risks compared to the northeastern mountainous areas (e.g., Taishan District and Gangcheng District). Conversely, the SE showed a fluctuating upward trend, increasing from a mean of 4.561 t·km−2·a−1 to 5.426 t·km−2·a−1 (Figure 3(b1–b5)). Spatially, SE was higher in the east than in the west, primarily driven by rainfall erosivity. The steep terrain and specific vegetation cover in the eastern mountains heightened susceptibility to soil erosion [44]. Human activity impacts were reflected in the HI, which displayed a slight increase with a multi-year average of 0.68. By 2020, HI had risen by 0.015 compared to 2000 (Figure 3(c1–c5)). Spatially, lower values occurred in the northeastern upstream areas, indicating reduced human activity intensity, while higher values dominated the southwestern downstream regions. Cultivation-intensive counties (e.g., Ningyang County and Dongping County) and highly urbanized cities (e.g., Feicheng City and Xintai City) recorded significantly higher values, whereas the lake and river zones exhibited the lowest. Regarding landscape pattern pressure, the PD peaked in 2005 and subsequently declined, signaling reduced landscape fragmentation, more uniform patch distribution, and increasingly regular patch shapes (Figure 3(d1–d5)). Spatially, PD was highest in the east, followed by the west, and lowest in the central region. Gangcheng District, Pingyin County, and Laiwu District in Jinan City recorded the highest multi-year averages, attributable to rapid urbanization that fragmented natural landscapes and compromised connectivity [45].
The resource and environmental conditions of the basin underwent observable changes during this period (Figure 4). The TWR experienced an initial rise followed by a decline before rebounding substantially, with 2015 marking the lowest point (Figure 4(a1–a5)). Spatially, TWR was higher in the east than in the west, and Xintai City recorded the highest values, benefiting from well-developed karst water systems and strong water retention capacity of forested lands in the eastern mountains, coupled with favorable topographic convergence conditions and effective water management measures in Xintai City [46]. Vegetation coverage showed continuous improvement, as indicated by the upward trend in the NDVI. Its mean value increased from 0.678 in 2000 to 0.725 in 2020 (Figure 4(b1–b5)). Spatially, NDVI decreased gradually from the southeast to the northwest, with higher coverage in the southeastern regions due to abundant precipitation. As a state indicator reflecting landscape-type richness and evenness, the SHDI—with its temporal trend (peaking in 2005 followed by fluctuating decline) and spatial pattern (highest in the east)—further corroborated the state characteristics of the ecological structure (Figure 4(c1–c5)). The HQ exhibited a slow decline over the two decades, decreasing from an average of 0.414 to 0.36 (Figure 4(d1–d5)). Spatially, medium-to-high habitat quality dominated the basin. High-value areas were clustered in the northeastern zone (stretching from Mount Tai to Xueye Lake), Mount Culai, Mount Xinpu, Mount Lianhua, and the Dongping Lake area. Low-value areas were concentrated in urban zones with intense human activities, such as Daiyue District, Feicheng City, and parts of Xintai City.
In response to the aforementioned pressure and state changes, the measures implemented in the basin and their effects are as follows (Figure 5): The AAA showed continuous growth from 2000 to 2015 but declined sharply in 2020, decreasing by 32.93% compared to 2000 (Figure 5(a1–a5)). This reflects a strategic shift in forestry policy from pursuing expansion to optimizing existing stocks [47]. Around 2020, Shandong Province refocused its key forestry projects on forest tending, degraded forest restoration, and low-efficiency forest improvement, reducing targets for new afforestation. Spatially, larger afforestation areas were concentrated in the eastern mountainous zones suitable for forestry, such as Laiwu District, Xintai City, and Feicheng City. Regarding environmental governance, the NE and PE followed identical trends: peaking in 2005, declining thereafter, with a minor rebound in 2020 (Figure 5(b1–b5,c1–c5)). Nevertheless, total emissions decreased from 5.521 kg·hm−2 to 5.493 kg·hm−2, indicating enhanced water purification capacity overall. Spatially, emissions in mountainous areas were significantly lower than in plains, primarily due to the strong interception and purification capacity of forest-grassland ecosystems in mountains. In contrast, higher loads in plains stemmed from chemical fertilizer/pesticide application on croplands and domestic sewage discharge in urban systems [48]. The WY exhibited an overall fluctuating upward trend, increasing from a mean of 195.887 mm to 290.538 mm (Figure 5(d1–d5)). Spatially, WY was higher in the east than in the west. Key drivers included urbanization-induced expansion of impervious surfaces, increased precipitation in upstream areas, and decreased potential evapotranspiration. Downstream regions recorded lower yields due to upstream water storage projects [49]. The ESV demonstrated a progressive rise, increasing from 990.428 billion CNY to 1058.553 billion CNY (Figure 5(e1–e5)). Spatially, ESV was generally higher in the east than the west, confirming that green ecosystems (e.g., forests, wetlands) provide higher service value than croplands. The highest ESV occurred in Dongping County (extensive lake-wetland conservation), Taishan District, and northern Laiwu City (significant forest coverage), where these ecosystems play critical roles in water conservation and climate regulation. Lower values in Feicheng City, Ningyang County, and Pingyin County demonstrated the negative impact of construction land on ecosystem benefits provision.
3.2. Analysis of Changes in the Dynamics of the Various Element Layers
3.2.1. Analysis of the Evolution of Ecological Risk Index
From 2000 to 2020, the ERI of the basin exhibited a fluctuating trend (Figure 6): ascending initially, followed by a decline, and then rebounding. Between 2000 and 2005, ERI surged from 0.355 to 0.392 (Figure 6a,b), registering an average annual growth rate of 2.09%, which signified a pronounced upward trend and the gradual intensification of ecological risks to the basin’s ecosystem during this phase. In the 2005–2010 period, ERI dropped from 0.392 to 0.37 (Figure 6b,c), suggesting that certain ecological protection measures implemented during this time might have yielded results, leading to a mitigation of ecological risks. Over the course of 2010 to 2015, the ERI continued its downward trajectory, falling from 0.37 to 0.359 (Figure 6c,d), with ecological risks further alleviated and the environment steadily improving. The average annual decline rate between 2005 and 2015 stood at 0.83%. From 2015 through to 2020, ERI rebounded from 0.359 to 0.392 (Figure 6d,e), returning to the same level as in 2005, indicating a resurgence of ecological risks in the basin and new challenges to the ecological environment. The “fluctuating upward” trend in SE, HI, and PD from 2000 to 2020 essentially stemmed from the long-term interplay between the backdrop of natural erosion risk and the intensity of human activities [50]. Natural conditions dictate the sensitivity of the basin’s ecosystem, while human activities evolved from destructive development in the early phase (2000–2005), to a coexistence of restoration and development during 2005–2015, and then to high-intensity orderly development post-2015. Although ecological measures periodically mitigated adverse effects, the overall expansion of development scale and intensity ultimately drove these indicators to rise amid fluctuations. This highlights that, against the backdrop of rapid urbanization, a dynamic balance between ecological protection and economic development has yet to be fully established in the basin, necessitating strengthened systematic and long-term ecological governance.
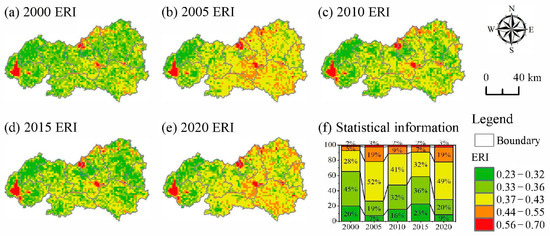
Figure 6.
Changes in the ERI of the Dongping Lake Basin from 2000 to 2020.
3.2.2. Analysis of the Evolution of Ecological Health Index
From 2000 to 2020, EHI of the watershed showed a significant fluctuation of “rise-fall-rise” (Figure 7): from 2000 to 2005, it rose from 0.424 to 0.496, and then gradually dropped to 0.38 (in 2010, it dropped to 0.441), and then rebounded to 0.499 from 2015 to 2020. It was 0.380 from 2000 to 2005, gradually decreasing to 0.441 from 2005 to 2015, and then rising to 0.499 from 2015 to 2020, showing the trend of “oscillating rebound driven by stage-by-stage restoration” under the alternating influences of anthropogenic disturbances and ecological restoration measures. This fluctuation is closely related to the adjustment of the implementation strength and focus of watershed protection policies at different times and in different regions. Earlier, between 2003 and 2006, through the closure of paper industries, other backward production capacities, and industrial pollution control, there was the first rise in the index; in 2007, the province’s first watershed ecological compensation pilot started, which guided local government and social forces to participate in ecological restoration measures, such as returning farmland to the wetlands, to the subsequent accumulation of the institutional foundation [51]; after 2009, the ecosystem’s restoration became comprehensive, with Tai’an City promoting the comprehensive development of the Dawen River project, the construction of storage projects, and the creation and building of an ecological water surface. There was also the construction of detention and storage projects, the creation of other ecological water surfaces, and the synchronization and implementation of rural drinking water safety projects; in 2017, there was the comprehensive implementation of the river chief system, the strengthening of water quality monitoring, shoreline control and agricultural surface pollution management, and the formation of long-term management and care mechanisms [52]. The evolution of these policies from single pollution control to systematic protection has systematically improved ecological resilience, repaired the ecological function of the watershed, promoted the improvement of vegetation coverage, enhanced soil water storage capacities, and further optimized the efficiency of water resource use, forming a positive linkage of “policy-driven-ecological response”.
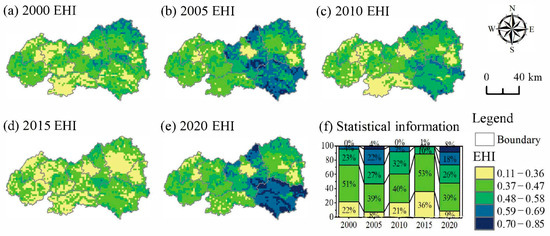
Figure 7.
Changes in the EHI of the Dongping Lake Basin from 2000 to 2020.
3.2.3. Analysis of the Evolution of Ecological Services Index
From 2000 to 2020, ESI showed an “inverted V-shaped” change (Figure 8): 0.268 in 2000 and from 2005 to 2015 (Figure 8b–d), with the AAA increasing from 1768.704 hm2 (mean value) to 2690.164 hm2 (mean value) (Table 5); with NE and PE decreasing, the index steadily rose to a peak of 0.326; from 2015 to 2020, as afforestation area plummeted to 1122.859 hm2 (a 58.26% decrease from 2015) (Figure 8d,e) and nitrogen and phosphorus pollution emissions increased, ESI plummeted to 0.268, even though WY and ESV were at record highs in 2020 (Figure 8e). The analysis reveals that the earlier rise in ESI can be attributed to the “green barrier” established through large-scale afforestation. The expansion of forested areas not only directly intercepted pollutants but also enhanced soil and water conservation capabilities (SE decreased by 18.68% in 2015 compared to 2000), thereby reducing sediment and pollutant inflow into rivers at the source and fostering a virtuous cycle of “increased vegetation→reduced pollution→enhanced ecosystem functions.” Conversely, the subsequent decline in ESI stemmed from the “discontinuity effect” of ecological protection efforts [53]. The discontinuation of vegetation restoration projects led to the widespread degradation of riverine buffer zones and shelter forests around wetlands, weakening pollution control barriers and resulting in increases of 0.48% and 0.86% in NE and PE, respectively, compared to 2015 (Figure 8d). Simultaneously, the surge in WY, accompanied by high-intensity runoff, which was not effectively filtered by vegetation, became a “carrier” for pollutant diffusion, further exacerbating water quality deterioration and ecological function decline [54]. To enhance the ecosystem service functions of the basin and safeguard its ecological security, it is imperative to establish a long-term protection system centered on vegetation restoration. This involves restarting the “ecological foundation consolidation” project, strengthening the synergistic linkage between pollution control and afforestation initiatives, and genuinely achieving the sustainable development goals of “stabilizing soil with greenery, purifying water with greenery, and improving quality with greenery” to fortify the ecological security barrier of the basin.
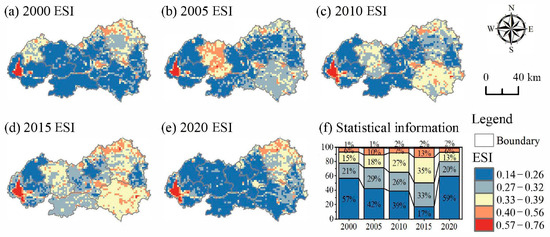
Figure 8.
Changes in the ESI of the Dongping Lake Basin from 2000 to 2020.
4. Discussion
4.1. Analysis of the Spatio-Temporal Evolution of Ecological Security
4.1.1. Time-Series Evolution Pattern of Watershed Ecological Security Index
From time to time between 2000 and 2020, the level of ecological security of the basin presented the core characteristics of “from relatively unsafe to moderately safe continued to progress, small fluctuations in the local stage”, and the overall trend of improvement was significant (Figure 9). In 2000, the WESI was 0.288 IV (relatively unsafe (Figure 9a)) in the nine counties and districts through which the river flows. In 2000, the WESI was 0.288 IV (relatively unsafe), and the nine counties and districts through which it flowed had six ecological grades of IV, and Taishan District was the only V (unsafe) region, with a weak ecological security foundation; in 2005, the WESI rose to 0.323 (III, moderately safe) (Figure 9b), and with the help of large-scale afforestation, pollution control, and other measures, the seven counties and districts rose to Class III for the first time to realize the grade leap, and the whole basin had no V grade region; in 2010–2015, it maintained a stable and favorable trend and reached a peaked at 0.332 (Class III) (Figure 9d,e); Ningyang County entered the III grade for the first time, Xintai City rose to Class II (relatively safe), and the WESI of Taishan District was raised to 0.23 (still Class V but with reduced risk).
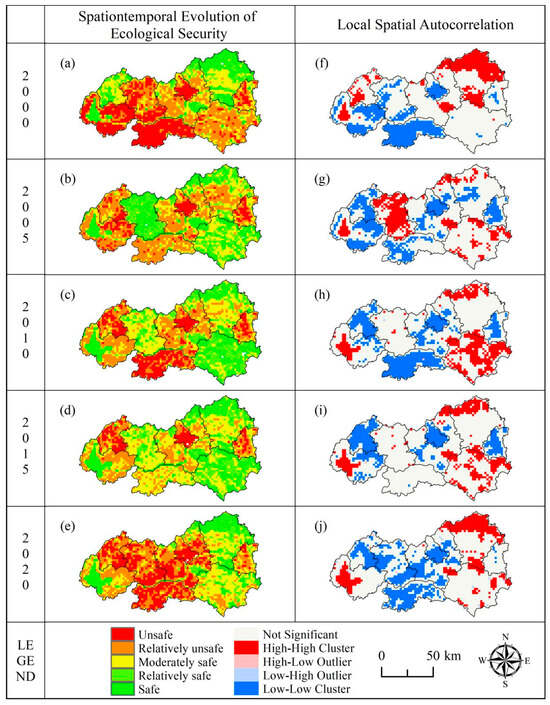
Figure 9.
Evolution of WESI in Dongping Lake Basin from 2000 to 2020. (a–e) Spatio-temporal evolution; (f–j) Local spatial autocorrelation.
In 2020, WESI fell slightly from the peak to 0.295 (Class III) (Figure 9e), with some areas experiencing grade fluctuations; for example, Daiyue District retreated from III to IV, and Xintai City retreated from II to III, but there were still no Class V areas in the entire basin, and the city of Gangcheng rose from IV to III for the first time, with more than 70% of the administrative districts maintaining Class III and above. This change was essentially a “structural adjustment within the moderately safe level” rather than a substantial degradation: WESI in 2020 was 11.14% lower than in 2015 but still higher than in 2000 (+2.43%), and the level of ecological security changed from “66.7% of the area is in Class IV–V” to “66.7% of the area is in Class IV–V”. The ecological security level changed from “66.7% of the area is in Class IV–V” to “only 22.2% of the area is in Class IV”. The ecological buffer formed by the accumulated ecological protection results in the previous period effectively resisted the local pollution rebound [55] and the impact of development activities [56], and the overall anti-disturbance ability of the basin was significantly enhanced, which was due to the systematic enhancement of soil and water conservation and pollution interception ability by the continuous input of ecological engineering [57].
4.1.2. Characteristics of Spatial Distribution of Watershed Ecological Security Index
From the perspective of spatial distribution, the WESI presents a significant spatial differentiation of “high in the north and low in the south, high in the east and low in the west, better in the mountainous areas than in the plains, and concentrated risk in the urbanized areas” (Figure 9a–e), which is closely related to the natural endowment, the intensity of human activities, and the strength of ecological protection. Laiwu District (0.363) and Xintai City (0.356) in the northern mountainous area have reached the average value of Class II (relatively safe), which relies on the low mountainous terrain of the Taishan Mountain Range, with a forest coverage rate of more than 45%; Laiwu District has the Xueye Reservoir Water Resource Protection Zone, Xintai City promotes the restoration of the wetland of Qingyun Lake, and human activities are mainly based on ecological conservation and industrial pollution, making it the only “relatively safe” area in the watershed. The average of index in Feicheng City (0.314), Dongping County (0.306), and Daiyue District (0.301) within the central transition zone is Class III (moderately safe), and this area is mainly plains and hills, with a high intensity of agricultural development but through the clearing of the main stream of Dawen River, other river channel improvements, the return of farmland to Dongping Lake, and remediation and wetland protection measures, such as returning farmland to wetlands in Dongping Lake [58], which balances the pressure of surface source pollution and maintains a moderately safe level; in the southern plains and urbanized areas, the mean value of the steel city (0.265), Pingyin County (0.264), and Ningyang County (0.244) is Class IV (relatively unsafe), and Taishan District (0.215) is the only Class V (unsafe) area; the steel city is affected by the legacy pollution of the traditional iron and steel industry [59]. Moreover, the steel city is affected by the legacy pollution of the steel industry [59], and Ningyang County and Pingyin County are affected by nitrogen and phosphorus loss and ecosystem homogenization due to excessive fertilizer inputs [60], resulting in a weak resistance to disturbance; Taishan District, as the main urban area of Tai’an, has a high population density, with the proportion of built-up land accounting for more than 60% of the total. The ecological space has been seriously crowded, and the pollution of life brought by the development of tourism has continued to exert pressure.
Overall, the natural geographic conditions of the topography and vegetation cover laid the foundation of ecological security, while human activities brought about by industrial pollution, agricultural expansion, urbanization, etc., is a key driving factor exacerbating spatial differentiation; the ecological advantages of the north’s “beautiful mountains and rivers” and the south’s “development pressure concentration” have jointly shaped the spatial pattern of ecological security in the basin.
4.1.3. Spatial Self-Relevance of Ecological Security
In order to show the spatial distribution pattern of ecological security more intuitively, LISA agglomeration maps of ecological security in Dongping Lake Basin in 2000, 2005, 2010, 2015, and 2020 were drawn using GeoDa 1.22 and ArcGIS 10.8 software. The spatial clustering characteristics of ecological security were classified into five categories [61]: “High-High” cluster, “High-Low” outlier, “Low-High” outlier, “Low-Low” cluster, and “Not Significant” (Figure 9). The ecological security of watersheds was obviously not randomly distributed but had a certain internal relationship, i.e., it shows a certain spatial aggregation trend. High-value ecological security areas tended to be adjacent to high-value areas, and low-value ecological security areas tended to be adjacent to low-value areas, with the “High-Low” outlier and “Low-High” outlier accounting for a very small proportion of the study area, mainly distributed in the “High-High” cluster and “Low-Low” cluster. The “High-Low” outlier and “Low-High” outlier areas accounted for only a small proportion of the study area and were mainly distributed in the periphery of the “High-High” cluster and “Low-Low” cluster.
Specifically, from 2000 to 2020, the “High-High” cluster was mainly distributed in the northeast of the study area and Dongping Lake, in which the “High-High” cluster area in 2020 was consistent with the Shandong Province ecological protection red-line planning (2016–2020) (Figure 9f–j), and the spatial distribution shows the spatial distribution of density in the northeast and sparseness in the west and south. They were characterized by mountain-type ecological protection red-line areas, which were mainly in the east, such as Taishan National Geopark, Feedback Lai Shan National Forest Park, Laiwu Huashan National Forest Park, etc., and water-type ecological protection red-line areas were mainly distributed in the west, such as Dongping Binhu National Wetland Park in Shandong Province, Dawen River Provincial Wetland Park in Ningyang County, Kangwang River National Park in Feicheng City, etc. [62]. These results are consistent with the ecological security conditions of the watershed mentioned above, indicating that the “High-High” cluster areas were concentrated in areas with high ecosystem services, mainly including woodlands, grasslands, and wetland nature reserves, which are the key protected areas in the watershed.
The “Low-Low” cluster represents the area where the grid value was as low as the surrounding grid value, and this form of agglomeration was mainly distributed in the southwestern part of the study area, as well as the urban areas with a higher degree of economic development. There were different changes in the “Low-Low” cluster from 2000 to 2020 (Figure 9f–j), and the area of the “Low-Low” cluster decreased from 2000 to 2015, mainly in Ningyang County and Feicheng City (Figure 9f–i). During 2000–2015, the area of the “Low-Low” cluster kept decreasing, mainly in Ningyang County and Feicheng City. Although there was a slow increase in 2015–2020 (Figure 9i,j), the overall trend was still fluctuating and decreasing. The distribution of the “Low-Low” cluster was consistent with the low ecological security areas, which were mostly cultivated land and construction land with a high degree of human interference. From the perspective of Ningyang County, which has the lowest ecological security level, as a large agricultural county and a large fertilizer consuming county, it has long been facing the problem of ecological pollution caused by irrational application and the low utilization of fertilizers [63], and although systematic improvements to the ecological environment have been made since 2015 through measures such as greening projects (Figure 9i), sewage treatment, integrated sanitation, and environmental protection inspections, there are still urgent shortcomings to be addressed, including the lack of characteristic pastoral industries, lagging intensive living standards, weak environmental awareness among villagers, and backward-pollutant treatment models. Areas with relatively severe ecological security in Taishan District are mainly distributed in densely populated urban areas and the karst collapse area in the old county zone of the urban district. In recent years, with the development of the economy, the expansion of the town scale, and the increase in population, the local demand for construction land and agricultural land has increased in the process of economic development, and ultimately, a large amount of unutilized land and garden land, mainly barren grassland, has been developed, sorted out, and drastically transformed into arable land, settlements, and industrial and mining land [18]. Blindness and sloppiness in land development coexist, and additional resource investment is simply exchanged for short-term benefits, thus affecting the local ecological environment to a certain extent. These problems will hinder the sustainable use of land, sustainable economic development, and the rational and efficient use of resources in Taishan District. Therefore, the government should, on the one hand, avoid the transformation of the “High-High” cluster into low-value areas, and, on the other hand, intensify the management of the “Low-Low” cluster, so as to promote the enhancement of the overall ecological security level of the watershed.
4.2. Characterization of Ecological Security Level Transitions
Using ArcGIS 10.8, the ecological security changes in the Dongping Lake Basin during 2000–2005, 2005–2010, 2010–2015, 2015–2020, and 2000–2020 were mapped (Figure 10), with transitions visualized via chord diagrams using an ecological security level transfer matrix constructed based on land use change matrices (Figure 11). The period 2000–2005 marked an “expansion-driven improvement and systemic restructuring” phase, where 33.97% of the area was upgraded in security level, forming contiguous core improvement zones in Feicheng, Xintai, Ningyang, and Dongping Counties, while Pingyin County and Laiwu City deteriorated (Figure 10a); a total of 3025.98 km2 (including Daiyue District) has remained stable. Notable features have included active low-level upgrades (1346.19 km2 shifting from “unsafe” to “relatively unsafe” with cross-level improvements), bidirectional flows in “relatively unsafe” areas, high upward mobility in “moderately safe” zones despite some degradation, and “safe” areas only transitioning to middle levels—collectively creating a dynamic “full-spectrum interaction” pattern (Figure 11a). From 2005 to 2010, the trend shifted to “shrinking improvement zones and rebounding deterioration,” with eastern regions improving while previously upgraded areas like Feicheng and Ningyang reversed (Figure 10b); a total of 5645.79 km2 has remained stable (an 86.58% increase). Key changes have included 911.89 km2 of “relatively unsafe” being degraded to “unsafe” (a 6.7-fold increase from the previous period), 109.03 km2 of “safe” land being downgraded to middle/low levels, and “moderately safe” areas balancing 521.2 km2 of degradation with 780.55 km2 of improvement (Figure 11b), acting as a “hub” between low and high security levels. This phase featured a buffer transition from active adjustment to stability. The 2010–2015 stage was characterized by “high stability with minor adjustments,” as 72.56% of the area (the highest during the study period) maintained its status; only Ningyang County improved notably, while Xintai City had isolated deteriorations (Figure 10c). A unidirectional progression chain emerged: “unsafe” areas were upgraded to “relatively unsafe” (351.41 km2) and “moderately safe” (522.86 km2), “relatively unsafe” to “moderately safe” (810.85 km2), “moderately safe” to “relatively safe” (398.35 km2), and “relatively safe” to “safe” (287.32 km2), with only 67.92 km2 reversing to lower levels (Figure 11c), solidifying a stable ecological foundation. However, 2015–2020 saw a sharp reversal, with improvement areas dropping to 4.84% and 22.31% of central regions degrading (Figure 10d): 1353.19 km2 of “moderately safe” land fell to “relatively unsafe”, 991.29 km2 plummeted to “unsafe,” 1239.82 km2 of “relatively safe” land reverted to “moderately safe,” and 472.1 km2 of “safe” land shifted to “relatively safe” (Figure 11d). Positive transitions were less than 1/10 of negative ones, indicating “expanding deterioration and intensified reverse transitions.” The ecological security of the watershed has shown a stage of change in “large-scale enhancement→shock adjustment→smooth optimization→reverse return”, which not only reflects the ecosystem’s response to regional development activities, but also provides a spatial and temporal decision-making basis for the subsequent precise delineation of key ecological protection zones, and the curbing of degradation of medium and low grades.
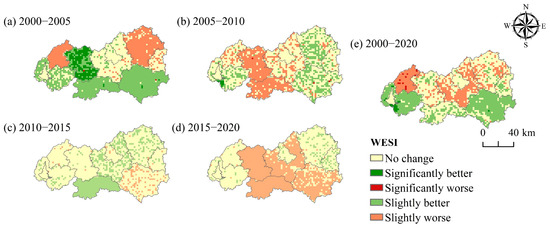
Figure 10.
Changes in ecological security of Dongping Lake Basin from 2000 to 2020.
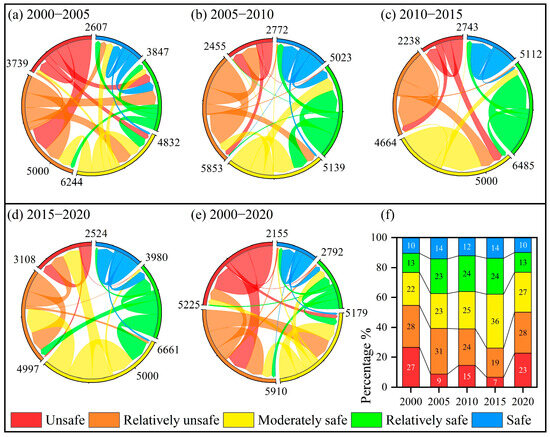
Figure 11.
Ecological security level transitions of Dongping Lake Basin from 2000 to 2020. (a–e) show transitions in specific periods, (f) presents percentage distribution across years.
From 2000 to 2020, ecological security in the Dongping Lake Basin was characterized by “sustained improvements in low-security levels as the main trend with localized reverse fluctuations in mid-high security levels” (Figure 11e): low-to-high security conversions totaled 3283 km2 (30.88% of the basin), significantly exceeding reverse high-to-low transitions (1458.39 km2, 13.72%), while 4548.96 km2 (42.79%) remained stable, forming a pattern of “predominant improvement, secondary stability, and localized fluctuations.” Improvement zones were concentrated in Dongping, Xintai, and Ningyang Counties, where “unsafe” areas were primarily upgraded to “relatively unsafe” (1158.76 km2), with 215.07 km2 achieving cross-level jumps to “moderately safe,” reflecting foundational improvements in low-security zones; “relatively unsafe” areas advanced to “moderately safe” (1190.72 km2), which served as the core pathway for mid-low security transitions, and “moderately safe” areas transferred 536.68 km2 to higher “relatively safe” and “safe” levels.
Reverse transition areas, dominated by Pingyin County and Daiyue District, exhibited notable fluctuations in mid-high security levels (Figure 10e): 555.66 km2 of “moderately safe” areas degraded to “relatively unsafe,” and 316.45 km2 plummeted to “unsafe,” serving as the primary sources of high-level reverse flows; “relatively safe” areas saw 846 km2 degrade to “unsafe”—far exceeding their 194.76 km2 transition to “safe,” reflecting the “rebound effect” in previously improved zones—and 309.62 km2 of “safe” areas shifted to “relatively safe,” accounting for 73.58% of this level’s total reverse transitions, primarily driven by construction land expansion in Pingyin and Daiyue Districts [64,65], which triggered downward shifts from “moderately safe” and “safe” to lower security levels (Figure 11e).
4.3. Analysis of Driving Factors for Ecological Security
4.3.1. Analysis of Factor Detection Results
The q-value of the factor detector is used to measure the explanatory degree of influencing factors on ecological security. The larger the q-value, the more obvious the spatial heterogeneity of ecological security, and the stronger the explanatory ability of influencing factors on ecological security [66]. Given that the selection of evaluation indicators in this study is based on a comprehensive review of the current ecological environment in the study area, an in-depth analysis of existing ecological issues, and a comprehensive consideration of various components of the ecosystem and related ecological processes, encompassing natural, human-induced, and other multi-faceted factors. Based on this scientific and reasonable indicator selection, this study uses 13 evaluation indicators to detect their explanatory degree for ecological security. The factor detection results can intuitively reflect the magnitude of the explanatory power of each factor on ecological security changes, and the specific results are shown in Figure 12.
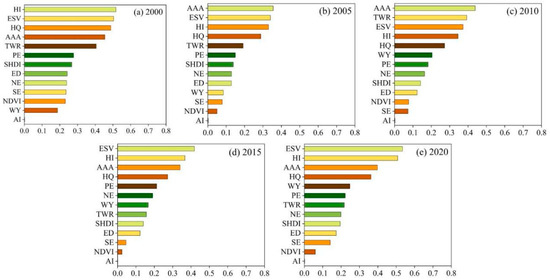
Figure 12.
The detection results of ecological security factors in Dongping Lake Basin from 2000 to 2020.
From the ranking of q-values for each factor in 2000–2020, HI, ESV, AAA, HQ, and TWR consistently emerged as key influencers of ecological security in the Dongping Lake Basin. In 2000, HI and ESV showed strong explanatory power (both q-values > 0.5) (Figure 12a), highlighting the critical impact of human activities and ecosystem service functions on that year’s ecological security. By 2005, AAA ranked first in q-value (Figure 12b), indicating its prominent role in maintaining ecological security that year. In 2010, AAA (0.439) and TWR (0.393) became key factors with significantly enhanced explanatory power (Figure 12c), demonstrating their substantial support for ecological security. In 2015, ESV (0.418) dominated as the core factor affecting ecological security (Figure 12d). By 2020, ESV (0.534) and HI (0.508) again showed significant impacts, re-emerging as dominant drivers (Figure 12e).
Looking across these years, ESV maintained high q-values in 2000, 2015, and 2020, consistently serving as a key factor influencing the basin’s ecological security and reflecting its importance for ecological security stability. The high q-values of HI in 2000 and 2020 also indicate that human activities had extremely prominent impacts on ecological security during specific periods. Notably, the explanatory power of AAA increased significantly in 2005, 2010, and 2020, indirectly suggesting that afforestation activities have become increasingly prominent in improving the ecological security of the Dongping Lake Basin over time, gradually emerging as an important means for maintaining ecological security [67]. Overall, key factors such as HI and ESV have exhibited varying impacts on watershed ecological security across different years, but have consistently played a core role, deeply involved in shaping the overall pattern of watershed ecological security. This not only provides important clues for analyzing the evolutionary mechanisms of watershed ecological security but also identifies the key directions for formulating scientific and reasonable ecological protection and restoration strategies in the future.
4.3.2. Analysis of Interactive Detector Results
To further explore the degree of influence of the interaction between the above influencing factors on ecological security, an interactive detector was used for detection analysis, and the detection results are shown in Figure 13. The interaction of two factors on ecological security each year manifests as double-factor enhancement or nonlinear enhancement.
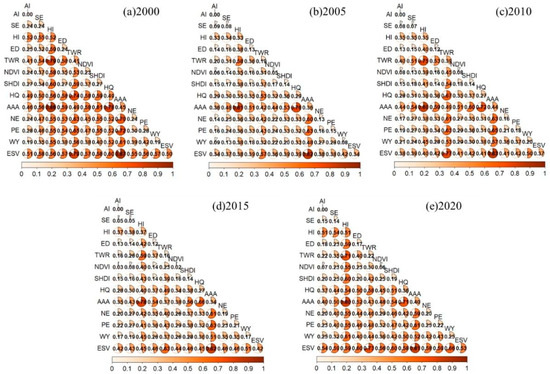
Figure 13.
The interactive effects of ecological security driving factors in Dongping Lake Basin from 2000 to 2020.
Commonly observed, the two interactive combinations of ESV and AAA, as well as AAA and HI, consistently ranked top two across all years, with q-values all exceeding 0.77. This demonstrates a long-term stable and strong synergistic effect among ecosystem service enhancement, afforestation project implementation, and human activity disturbances, highlighting their role as the core interactive driving forces influencing watershed ecological security. The interactions of TWR and HI, ESV and TWR, as well as AAA and HQ, showed q-values stably ranging from 0.5 to 0.8 in most years, indicating sustained and significant interactive relationships among water resource supply, ecological service capacity, vegetation coverage, and human activity pressures [68]. Interactive combinations of pollution indicators (e.g., PE, NE) and AAA exhibited active interactions across all years, revealing the potential long-term regulatory effects of afforestation projects on pollutant diffusion [69].
In terms of dynamic differences, the watershed in 2000 manifested a unique pattern of “wide-ranging strong interactions,” with 12 two-factor interaction pairs showing q-values > 0.6 (Figure 13a), involving ecological processes such as pollutant diffusion, biodiversity maintenance, and water resource regulation. This widespread and intense interactive relationship indicates more complex and diversified linkages among ecosystem components during this period. By 2005, the “pollution-vegetation” interactive response was particularly prominent (Figure 13b), with the q-values of NE, PE, and AAA reaching the relatively highest level throughout the study period—an indication that vegetation restoration played a more critical role in pollutant purification regulation. In 2010, the “water resource hub effect” was significantly enhanced, with five interaction pairs between TWR and other factors exhibiting q-values ≥ 0.6—markedly more than other years—fully reflecting the elevated pivotal role of water resources in the ecosystem (Figure 13c). A new feature of “multidimensional ecological linkages” emerged in 2015, as q-values of interactions between SE, SDHI, and AAA all exceeded 0.5, suggesting the synergistic effects of vegetation restoration in soil and water conservation and biodiversity protection began to emerge (Figure 13d). By 2020, the prominent characteristic was the “hydrological-ecological-anthropogenic” interactive coupling relationship, with all three interaction pairs related to water yield showing q-values > 0.6 (Figure 13e), indicating significantly intensified coupling among water resource cycling, ecosystem services, and human activity disturbances.
Overall, the ecological security of the Dongping Lake Basin is influenced by the comprehensive interaction of multiple factors, where core interactive combinations continuously dominate the ecological security pattern, while the unique interaction modes in each year reflect the dynamic response process of the watershed ecosystem under natural evolution and human activity intervention.
5. Deficiencies and Prospects
This study has four main limitations:
- (1)
- Constraints in aquatic ecosystem service accounting: Due to data accessibility limitations, the service values of aquatic ecosystems (e.g., lakes and rivers) were not assessed separately but incorporated into terrestrial system accounting, which may lead to undervaluation. Developing integrated water–terrestrial ecosystem service assessment methods represents a critical future research direction.
- (2)
- Adaptability challenges in validation methods: As ecological security assessments yield relative measures, direct validation through field observations is difficult. This study, therefore, primarily analyzes spatio-temporal evolution patterns.
- (3)
- Need for expanded driver mechanism research: While the current indicator system covers natural background and socioeconomic dimensions, it shows insufficient consideration of external factors like policy interventions. Future work should deepen the understanding of interaction pathways in human-environment coupled systems.
- (4)
- Practical gaps in scenario analysis: Current research only identifies spatial differentiations of ecological security under natural development scenarios. Future studies should conduct multi-scenario simulations comparing ecological security effects under different policy development pathways to enhance anticipatory capacity for decision-making.
6. Conclusions
Based on the PSR model, we have integrated indicators of ecological risk, ecosystem health, and ecosystem services and combined spatial autocorrelation, a transfer matrix, and a GeoDetector to analyze the spatio-temporal differentiation characteristics and driving mechanisms of ecological security in the basin. The main conclusions are as follows:
- (1)
- The WESI of the Dongping Lake Basin exhibited a fluctuating trend of “first increasing then decreasing” over 20 years, essentially resulting from the long-term interaction between the natural erosion background and human activities; the EHI showed a “fluctuating recovery” characteristic, benefiting from the policy-driven evolution from single pollution control to systematic protection; the ecosystem service index presented an “inverted V-shaped” change, with the late-stage decline mainly due to the sharp reduction in afforestation area and rebound of nitrogen–phosphorus pollution—highlighting the critical significance of vegetation restoration projects in maintaining the basin’s ecological functions.
- (2)
- From 2000 to 2020, the ecological security of the basin advanced from “relatively unsafe” to “moderately safe”, and the anti-interference ability has been significantly enhanced due to the investment in ecological projects. Spatially, it has shown a distribution pattern of “higher in the north than in the south, and higher in the east than in the west”. The “High-High” clusters, such as the mountainous areas in the northeast and the Dongping Lake wetland, were consistent with the provincial ecological protection red line. The “Low-Low” clusters were formed in the agricultural and urbanized areas in the southwest, where it is necessary to strengthen pollution control and intensive land use to improve the overall level.
- (3)
- The ecological security level of the basin has gone through four stages: “expansion-driven improvement→fluctuating adjustment→steady optimization→reverse regression”. In the early stage, ecological projects promoted contiguous improvements in low-security zones, while in the later stage, intensified development led to mid–high security degradation in central areas. The overall transition pattern was “predominantly characterized by sustained low-security improvements with localized mid-high security fluctuations”: core improvement zones concentrated in Dongping, Xintai, and Ningyang Counties, while development-active areas such as Pingyin and Daiyue have experienced reverse changes due to anthropogenic impacts.
- (4)
- The GeoDetector analysis revealed that HI, ESV, and AAA were core factors driving changes in the ecological security of the basin. Among them, ESV showed significant dominant effects in 2000, 2015, and 2020, while the positive effect of AAA intensified over time. The interactive detector analysis indicated that the synergistic effects between ESV and AAA, as well as between AAA and HI, were the strongest (q-values > 0.77), forming the core driving combinations. Differentiated characteristics were observed across periods. This provides a scientific basis for accurately identifying key protection factors and formulating differentiated strategies.
Author Contributions
All authors contributed to the study conception and design. Y.W.: Form analysis software, methodology, writing—draft. G.G., M.L., K.M., S.G., H.S. and T.Z.: Data collection. X.W.: Read and approved the final manuscript. H.A.: Model construction, data analysis. All authors have read and agreed to the published version of the manuscript.
Funding
This study was jointly supported by the Geological Survey Project of the China Geological Survey (Grant No. DD20230505, “Investigation of lakes in the northern part of the plain lake region in eastern China”), and the Open Research Fund Program of the Hebei Provincial Research Center for Applied Technology of Ecological Environment Geology in Universities (Grant No. JSYF-202306).
Data Availability Statement
The datasets used and analyzed during the current study are available from the corresponding author on reasonable request.
Conflicts of Interest
All authors declare that there were no commercial or financial relationships that might constitute potential conflicts of interest during the research process.
Abbreviations
The following abbreviations are used in this manuscript:
| Noun | Abbreviation |
| Pressure–State–Response model | PSR |
| Local Indicators of Spatial Association | LISA |
| Watershed Ecological Security Index | WESI |
| Ecological Risk Index | ERI |
| Ecological Health Index | EHI |
| Ecological Services Index | ESI |
| Aridity Index | AI |
| Soil Erosion | SE |
| Human Interference Index | HI |
| Patch Density | PD |
| Total Water Resources | TWR |
| Normalized Difference Vegetation Index | NDVI |
| Shannon Diversity Index | SHDI |
| Habitat Quality | HQ |
| Annual Afforestation Area | AAA |
| Nitrogen Export | NE |
| Phosphorus Export | PE |
| Water Yield | WY |
| Ecosystem Services Value | ESV |
References
- Wen, J.F.; Hou, K. Research on the progress of regional ecological security evaluation and optimization of its common limitations. Ecol. Indic. 2021, 127, 107797. [Google Scholar] [CrossRef]
- Huang, L.T.; Wang, H.X.; Liu, H.F.; Zhangsong, A.; Guo, W.X. Quantitatively linking ecosystem service functions with soil moisture and ecohydrology regimes in watershed. Sci. Total Environ. 2024, 955, 176866. [Google Scholar] [CrossRef]
- Zhang, J.J.; Hao, X.M.; Li, X.W.; Fan, X.; Zhang, S. Evaluation and regulation strategy for ecological security in the Tarim River Basin based on the ecological footprint. J. Clean. Prod. 2024, 435, 140488. [Google Scholar] [CrossRef]
- Shen, Y.; Cao, H.M.; Tang, M.F.; Deng, H.B. The Human Threat to River Ecosystems at the Watershed Scale: An Ecological Security Assessment of the Songhua River Basin, Northeast China. Water 2017, 9, 219. [Google Scholar] [CrossRef]
- Li, Y.; Huang, Y.L.; Zhang, X.Y.; Jiang, Y.W.; Jing, X.S.; Deng, Y.H.; Li, R.M.; Jiang, D.G.; Mu, J.L. Ecosystem health assessment: A PSR analysis combining AHP and EW methods for Sansha Bay, China. Front. Mar. Sci. 2024, 11, 1396026. [Google Scholar] [CrossRef]
- Zhang, D.W.; Jing, M.; Chang, B.H.; Chen, W.W.; Li, Z.M.; Zhang, S.; Li, T. Coordination Analysis and Driving Factors of “Water-Land-Energy-Carbon” Coupling in Nine Provinces of the Yellow River Basin. Water 2025, 17, 1138. [Google Scholar] [CrossRef]
- Li, Y.; Xie, W.Q.; Zhang, J.D.; Zhang, D.M. Spatiotemporal changes and driving factors of ecological environmental quality in the Yongding-Luan River Basin based on RSEI. Front. Environ. Sci. 2024, 12, 1494098. [Google Scholar] [CrossRef]
- Hazbavi, Z.; Sadeghi, S.H.; Gholamalifard, M.; Davudirad, A.A. Watershed health assessment using the pressure–state–response (PSR) framework. Land Degrad. Dev. 2020, 31, 3–19. [Google Scholar] [CrossRef]
- Li, L.J.; Fu, M.C.; Zhu, Y.X.; Kang, H.Y.; Wen, H.Y. The current situation and trend of land ecological security evaluation from the perspective of global change. Ecol. Indic. 2024, 167, 112608. [Google Scholar] [CrossRef]
- Li, Y.C.; Lian, Z.K.; Zhai, T.L.; Xie, X.T.; Wang, Y.C.; Li, M.H. Assessment of Land Ecological Security Based on the Boston Model: A Case Study from China. Land 2023, 12, 1348. [Google Scholar] [CrossRef]
- Li, P.H.; Yan, L.D.; Pan, S.L.; Ma, Y.F. Evaluation of Agricultural Ecological Security in Hubei Province. J. Resour. Ecol. 2017, 8, 620–627. [Google Scholar] [CrossRef]
- Yang, Y.; Cai, Z.X. Ecological security assessment of the Guanzhong Plain urban agglomeration based on an adapted ecological footprint model. J. Clean. Prod. 2020, 260, 120973. [Google Scholar] [CrossRef]
- Wang, B.; Yu, F.; Teng, Y.G.; Cao, G.Z.; Zhao, D.; Zhao, M.Y. A SEEC Model Based on the DPSIR Framework Approach for Watershed Ecological Security Risk Assessment: A Case Study in Northwest China. Water 2022, 14, 106. [Google Scholar] [CrossRef]
- Zhao, Y.D.; De, R.S.; Shi, H.L.; Zhi, R.Z.; Sheng, X.Y.; Yi, S.J. A Study of Ecological Security Assessment for Natural Reserve. Adv. Mater. Res. 2015, 3848, 1081–1086. [Google Scholar] [CrossRef]
- Zhang, Y.H.; Zang, P.; Guo, H.L.; Yang, G.D. Wetlands ecological security assessment in lower reaches of Taoerhe river connected with Nenjiang river using modified PSR model. HydroResearch 2023, 6, 156–165. [Google Scholar] [CrossRef]
- Sun, R.; Wei, J.L.; Zhang, S.S.; Pei, H.Y. The dynamic changes in phytoplankton and environmental factors within Dongping Lake (China) before and after the South-to-North Water Diversion Project. Environ. Res. 2024, 246, 118138. [Google Scholar] [CrossRef] [PubMed]
- Wei, W.; Wang, M.T.; Wei, X.X.; Yang, S.L.; Xie, B.B.; Ma, Z.Y.; Yu, L.N.; Zhou, J.J.; Liu, T.; Lu, D. The coordination evaluation of ecological environment-economic development-carbon emission and spatiotemporal evolution in the important ecological functional area—A case study in the Yellow River Basin. Environ. Dev. Sustain. 2025, 1–26. [Google Scholar] [CrossRef]
- Li, J.C.; Shan, R.; Yuan, W.H. Constructing the Landscape Ecological Security Pattern in the Dawen River Basin in China: A Framework Based on the Circuit Principle. Int. J. Environ. Res. Public Health 2023, 20, 5181. [Google Scholar] [CrossRef]
- Li, K.; Hou, Y.; Fu, Q.; Randall, M.T.; Andersen, P.S.; Qiu, M.K.; SkovPetersen, H. Integrating decision-making preferences into ecosystem service conservation area identification: A case study of water-related ecosystem services in the Dawen River watershed, China. J. Environ. Manag. 2023, 340, 117972. [Google Scholar] [CrossRef]
- Wei, S.M.; Zhang, Y.X.; Cai, Z.Z.; Bi, D.W.; Wei, H.H.; Zheng, X.F.; Man, X.B. Evaluation of groundwater quality and health risk assessment in Dawen River Basin, North China. Environ. Res. 2025, 264 Pt 1, 120292. [Google Scholar] [CrossRef]
- Li, Y.; Zhao, L.; Zhang, Z.; Li, J.X.; Hou, L.; Liu, J.Q.; Wang, Y.B. Research on the Hydrological Variation Law of the Dawen River, a Tributary of the Lower Yellow River. Agronomy 2022, 12, 1719. [Google Scholar] [CrossRef]
- Zhang, S.H.; Li, X.; Ren, Z.; Zhang, C.; Fang, L.; Mo, X.B.; Yang, W.; Liu, X.H. Influence of precipitation and temperature variability on anthropogenic nutrient inputs in a river watershed: Implications for environmental management. J. Environ. Manag. 2025, 375, 124294. [Google Scholar] [CrossRef] [PubMed]
- Shen, Z.T.; Zhao, Q.; Li, X.F. Analysis of Rainfall-Runoff Variation Characteristics and Influencing Factors in the Dawen River Basin in the Past 50 Years. IOP Conf. Ser. Earth Environ. Sci. 2020, 619, 012091. [Google Scholar] [CrossRef]
- Zhu, Q.; Cai, Y.L. Construction and Simulation Prediction of Ecological Security Evaluation Framework Based on “Risk-Health-Service”—Taking the Huaihe River Basin as an Example. J. Nat. Resour. 2024, 39, 2676–2690. [Google Scholar]
- Peng, J.; Liu, Y.C.; Wu, J.S.; Lv, H.L.; Hu, X.X. Linking ecosystem services and landscape patterns to assess urban ecosystem health: A case study in Shenzhen City, China. Landsc. Urban Plan. 2015, 143, 56–68. [Google Scholar] [CrossRef]
- Xu, M.L.; Matsushima, H. Multi-dimensional landscape ecological risk assessment and its drivers in coastal areas. Sci. Total Environ. 2023, 908, 168183. [Google Scholar] [CrossRef]
- Hernández-Blanco, M.; Costanza, R.; Chen, H.J.; de Groot, D.; Jarvis, D.; Kubiszewski, I.; Montoya, J.; Sangha, K.; Stoeckl, N.; Turner, K.; et al. Ecosystem health, ecosystem services, and the well-being of humans and the rest of nature. Glob. Change Biol. 2022, 28, 5027–5040. [Google Scholar] [CrossRef]
- Chen, W.X.; Gu, T.C.; Zeng, J. Urbanisation and ecosystem health in the Middle Reaches of the Yangtze River urban agglomerations, China: A U-curve relationship. J. Environ. Manag. 2022, 318, 115565. [Google Scholar] [CrossRef]
- Pan, N.H.; Du, Q.Q.; Guan, Q.Y.; Tan, Z.; Sun, Y.F.; Wang, Q.Z. Ecological security assessment and pattern construction in arid and semi-arid areas: A case study of the Hexi Region, NW China. Ecol. Indic. 2022, 138, 108797. [Google Scholar] [CrossRef]
- Das, M.; Inácio, M.; Das, A.; Barcelo, D.; Pereira, P. Mapping and assessment of ecosystem health in the Vilnius functional zone (Lithuania). Sci. Total Environ. 2023, 912, 168891. [Google Scholar] [CrossRef]
- Wang, C.; Tang, C.J.; Fu, B.J.; Lü, Y.H.; Xiao, S.S.; Zhang, J. Determining critical thresholds of ecological restoration based on ecosystem service index: A case study in the Pingjiang catchment in southern China. J. Environ. Manag. 2022, 303, 114220. [Google Scholar] [CrossRef] [PubMed]
- Zomer Robert, J.; Xu, J.C.; Trabucco, A. Version 3 of the Global Aridity Index and Potential Evapotranspiration Database. Sci. Data 2022, 9, 409. [Google Scholar] [CrossRef]
- Duan, X.W.; Bai, Z.W.; Rong, L.; Li, Y.B.; Ding, J.H.; Tao, Y.Q.; Li, J.X.; Li, J.S.; Wang, W. Investigation method for regional soil erosion based on the Chinese Soil Loss Equation and high-resolution spatial data: Case study on the mountainous Yunnan Province, China. Catena 2020, 184, 104237. [Google Scholar] [CrossRef]
- Chi, Y.; Shi, H.H.; Zheng, W.; Sun, J.K.; Fu, Z.Y. Spatiotemporal characteristics and ecological effects of the human interference index of the Yellow River Delta in the last 30 years. Ecol. Indic. 2018, 89, 880–892. [Google Scholar] [CrossRef]
- Hu, C.G.; Zeng, H. The landscape pattern characteristics of urban built-up land significantly influence urban thermal comfort: Evidence from large cities in China. Sustain. Cities Soc. 2025, 126, 106402. [Google Scholar] [CrossRef]
- Djedi, T. Effect of generational diversity on the need for green spaces. Shannon’s index reading, measurement and evaluation tool. Urbe-Rev. Bras. Gest. Urbana 2021, 13, e20200037. [Google Scholar] [CrossRef]
- Shi, G.; Chen, C.; Cao, Q.C.; Zhang, J.R.; Xu, J.H.; Chen, Y.; Wang, Y.T.; Liu, J.H. Spatiotemporal Dynamics and Prediction of Habitat Quality Based on Land Use and Cover Change in Jiangsu, China. Remote Sens. 2024, 16, 4158. [Google Scholar] [CrossRef]
- Wang, Y.N.; Yang, G.S.; Li, B.; Wang, C.; Su, W.Z. Measuring the zonal responses of nitrogen output to landscape pattern in a flatland with river network: A case study in Taihu Lake Basin, China. Environ. Sci. Pollut. Res. Int. 2022, 29, 34624. [Google Scholar] [CrossRef]
- Kim, Y.I.; Engel, B.; Jang, W.S.; Yun, Y.J. Evaluating Wildfire-Induced Changes in a Water-Yield Ecosystem Service at the Local Scale Using the InVEST Model. Water 2025, 17, 1260. [Google Scholar] [CrossRef]
- Ligate, E.J.; Chen, C.; Wu, C.Z. Evaluation of tropical coastal land cover and land use changes and their impacts on ecosystem service values. Ecosyst. Health Sustain. 2018, 4, 188–204. [Google Scholar] [CrossRef]
- Xu, Y.J.; Liu, J.J.; Zhao, W.Q.; Ding, X.Y.; Qin, M.T.; Ma, Y.G.; Yang, J.J.; Xu, Z.L. An evaluation study on the spatial and temporal evolution of water ecological security in the Hotan River Basin. Sustainability 2024, 16, 9724. [Google Scholar] [CrossRef]
- Wang, J.F.; Xu, C.D. Geodetector: Principle and prospective. Acta Geogr. Sin. 2017, 72, 116–134. [Google Scholar] [CrossRef]
- Han, J.J.; Wang, J.P.; Chen, L.; Xiang, J.Y.; Ling, Z.Y.; Li, Q.K.; Wang, E.L. Driving factors of desertification in Qaidam Basin, China: An 18-year analysis using the geographic detector model. Ecol. Indic. 2021, 124, 107404. [Google Scholar] [CrossRef]
- Zhang, X.; She, D.L.; Hou, X.L.; Zheng, X.J. Precipitation, topography, and soil conservation measures determine the spatiotemporal pattern of sediment yield at the regional scale. Catena 2024, 240, 107990. [Google Scholar] [CrossRef]
- Yu, G.T.; Liu, T.W.; Wang, Q.; Li, T.; Li, X.J.; Song, G.H.; Feng, Y.G. Impact of Land Use/Land Cover Change on Ecological Quality during Urbanization in the Lower Yellow River Basin: A Case Study of Jinan City. Remote Sens. 2022, 14, 6273. [Google Scholar] [CrossRef]
- Ma, X.Y.; Xu, Y.F.; Sun, Q.; Liu, W.J.; Qi, W. Contributing to Carbon Neutrality Targets: A Scenario Simulation and Pattern Optimization of Land Use in Shandong Province Based on the PLUS Model. Sustainability 2024, 16, 5180. [Google Scholar] [CrossRef]
- Gao, L.; Li, H. Improving Carbon Sequestration Capacity of Forest Vegetation in China: Afforestation or Forest Management? Forests 2023, 14, 1077. [Google Scholar] [CrossRef]
- Lang, M.; Li, P.; Yan, X.Y. Runoff concentration and load of nitrogen and phosphorus from a residential area in an intensive agricultural watershed. Sci. Total Environ. 2013, 458–460, 238–245. [Google Scholar] [CrossRef]
- Yin, L.C.; Feng, X.M.; Fu, B.J.; Wang, S.; Wang, X.F.; Chen, Y.Z.; Tao, F.L.; Hu, J. A coupled human-natural system analysis of water yield in the Yellow River basin, China. Sci. Total Environ. 2012, 762, 143141. [Google Scholar] [CrossRef]
- Fan, W.J. Assessing Habitat Quality and Identifying Influencing Factors in the Township Areas of Dawen River Basin. Adv. Educ. Humanit. Soc. Sci. Res. 2023, 6, 169. [Google Scholar] [CrossRef]
- Liu, A.B.; Yan, T.T.; Shi, S.X.; Zhao, W.J.; Ke, S.H.; Zhang, F.S. Trade-Off and Coordination between Development and Ecological Protection of Urban Agglomerations along Rivers: A Case Study of Urban Agglomerations in the Shandong Section of the Lower Yellow River. Land 2024, 13, 1368. [Google Scholar] [CrossRef]
- Wang, Y.; Wang, K.X.; Guo, F.L. Green Development Evaluation of Tai’an Based on Entropy Method. Wirel. Commun. Mob. Comput. 2022, 2022, 8472758. [Google Scholar] [CrossRef]
- Hao, D.; Liu, Y.H.; Cui, J.; Zhu, M.S.; Ji, W.X. Spatial and Temporal Variations of Vegetation Cover and Its Influencing Factors in Shandong Province Based on GEE. Environ. Monit. Assess. 2023, 195, 1023. [Google Scholar] [CrossRef]
- Guo, Y.Z.; Wang, X.Y.; Melching, C.; Nan, Z. Identification Method and Application of Critical Load Contribution Areas Based on River Retention Effect. J. Environ. Manag. 2022, 305, 114314. [Google Scholar] [CrossRef]
- Jin, Z.X.; Wang, C.X.; Jiao, X.M.; Yu, S.K.; Yang, C.; Xie, F.C.; Miao, Y. Spatiotemporal Pattern and Influencing Factors of Urbanization Quality in County Areas of Shandong Province, China. Ecol. Indic. 2024, 163, 112132. [Google Scholar] [CrossRef]
- Zheng, Y.; Cheng, L.L.; Wang, Y.F. Measuring the Spatial Conflict of Resource-Based Cities and Its Coupling Coordination Relationship with Land Use. Land 2022, 11, 1460. [Google Scholar] [CrossRef]
- Shang, H.D.; Liu, Y.Y.; Zhang, L.J.; Zhang, M.Z.; Hu, Q.H.; Zhang, L.; Shi, L. Research on the Spatial Differentiation Characteristics and Ecological Protection Paths of “Mountains, Rivers, Forests, Fields, Lakes, and Grasslands” in the Shandong Section of the Yellow River Basin. J. Tour. Manag. 2024, 1, 30–39. [Google Scholar] [CrossRef]
- Zhou, K. Study on Wetland Landscape Pattern Evolution in the Dongping Lake. Appl. Water Sci. 2022, 12, 200. [Google Scholar] [CrossRef]
- Zhou, Q.Z.; Song, Y.; Zhang, Y.; Ping, Z.L.; Zheng, Y.F.; Chen, H.Y.; Liu, P.; Hong, P.Z.; Zheng, Z.Y. Land Use Transition and Its Effect on Ecosystem Service Value with Introducing ‘Three Wastes’ Factor in the Industrial County, China. Environ. Sci. Pollut. Res. 2024, 31, 34962–34980. [Google Scholar] [CrossRef]
- Yin, G.Y.; Jiang, X.L.; Sun, J.; Qiu, M.L. Discussing the Regional-Scale Arable Land Use Intensity and Environmental Risk Triggered by the Micro-Scale Rural Households’ Differentiation Based on Step-by-Step Evaluation-a Case Study of Shandong Province, China. Environ. Sci. Pollut. Res. 2020, 27, 8271–8284. [Google Scholar] [CrossRef] [PubMed]
- Liu, J.H.; Pu, L.Y.; Huang, L.C.; Shi, T.L. Research on the Coupling Evaluation and Driving Factors of Water-Energy-Carbon in the Yellow River Basin. Water 2023, 15, 2377. [Google Scholar] [CrossRef]
- Wang, N.; Zu, J.; Li, M.; Zhang, J.Y.; Hao, J.M. Spatial Zoning of Cultivated Land in Shandong Province Based on the Trinity of Quantity, Quality and Ecology. Sustainability 2020, 12, 1849. [Google Scholar] [CrossRef]
- Hou, L.; Niu, B.B.; Li, X.J.; Shen, H.X.; Li, F.Q.; Wang, Y. Analysis of Soil Fertility Quality and Heavy Metal Pollution in the Dawen River Basin, China. Open J. Soil Sci. 2020, 10, 602–615. [Google Scholar] [CrossRef]
- Guo, J.; Wang, H.Y.; Liu, S.J.; Wang, Z.S. Chemical Characteristics and Source Apportionment of PM2.5 in Western Industrial Region of Jinan. Atmosphere 2023, 14, 864. [Google Scholar] [CrossRef]
- Wei, J.; Liu, L.L.; Wang, H.Y.; Zhang, Y.X.; Wang, C.L.; Liu, J.T.; Fu, T.G.; Gao, H.; Liang, H.Z.; Liu, Y.C. Spatiotemporal Patterns of Land-Use Change in the Taihang Mountain (1990–2020). Chin. J. Eco-Agric. 2022, 30, 1123–1133. [Google Scholar]
- Li, M.R.; Abuduwaili, J.; Liu, W.; Feng, S.; Saparov, G.; Ma, L. Application of Geographical Detector and Geographically Weighted Regression for Assessing Landscape Ecological Risk in the Irtysh River Basin, Central Asia. Ecol. Indic. 2024, 158, 111540. [Google Scholar] [CrossRef]
- Dong, D.J.; Zhao, Z.L.; Gao, H.D.; Zhou, Y.F.; Gong, D.H.; Du, H.Q.; Fujioka, Y. Analysis of Spatiotemporal Evolution and Driving Forces of Vegetation from 2001 to 2020: A Case Study of Shandong Province, China. Forests 2024, 15, 1245. [Google Scholar] [CrossRef]
- Kordrostami, F.; Attarod, P.; Abbaspour, K.C.; Ludwig, R.; Etemad, V.; Alilou, H.; Bozorg-Haddad, O. Identification of Optimum Afforestation Areas Considering Sustainable Management of Natural Resources, Using Geo-Environmental Criteria. Ecol. Eng. 2021, 168, 106259. [Google Scholar] [CrossRef]
- Qi, Y.; Lian, X.H.; Wang, H.W.; Zhang, J.L.; Yang, R. Dynamic Mechanism between Human Activities and Ecosystem Services: A Case Study of Qinghai Lake Watershed, China. Ecol. Indic. 2020, 117, 106528. [Google Scholar] [CrossRef]
Disclaimer/Publisher’s Note: The statements, opinions and data contained in all publications are solely those of the individual author(s) and contributor(s) and not of MDPI and/or the editor(s). MDPI and/or the editor(s) disclaim responsibility for any injury to people or property resulting from any ideas, methods, instructions or products referred to in the content. |
© 2025 by the authors. Licensee MDPI, Basel, Switzerland. This article is an open access article distributed under the terms and conditions of the Creative Commons Attribution (CC BY) license (https://creativecommons.org/licenses/by/4.0/).