Article

Marker- and Microbiome-Based Microbial Source Tracking and Evaluation of Bather Health Risk from Fecal Contamination in Galveston, Texas

1
Water Management and Hydrologic Science Program, Texas A&M University, College Station, TX 77843, USA
2
Department of Environmental and Occupational Health Sciences, UTHealth Houston School of Public Health, El Paso, TX 77905, USA
3
Harte Research Institute, Texas A&M University-Corpus Christi, Corpus Christi, TX 78412, USA
4
Department of Soil and Crop Sciences, Texas A&M University, College Station, TX 77843, USA
5
Institute for Biotechnology Research and Innovation, Division of Research, Innovation, and Economic Development, Tarleton State University, Stephenville, TX 76401, USA
6
Texas A&M AgriLife Extension, College Station, TX 77843, USA
7
Texas General Land Office, Austin, TX 78701, USA
8
Texas A&M AgriLife Extension, Temple, TX 76502, USA
*
Author to whom correspondence should be addressed.
Water 2025, 17(15), 2310; https://doi.org/10.3390/w17152310
Submission received: 30 May 2025 / Revised: 14 July 2025 / Accepted: 19 July 2025 / Published: 3 August 2025
(This article belongs to the Section Water Quality and Contamination)

Abstract

(1) The beach areas of Galveston, Texas, USA are heavily used for recreational activities and often experience elevated fecal indicator bacteria levels, representing a potential threat to ecosystem services, human health, and tourism-based economies that rely on suitable water quality. (2) During the span of 15 months (March 2022–May 2023), water samples that exceeded the U.S. Environmental Protection Agency-accepted alternative Beach Action Value (BAV) for enterococci of 104 MPN/100 mL were analyzed via microbial source tracking (MST) through quantitative polymerase chain reaction (qPCR) assays. The Bacteroides HF183 and DogBact as well as the Catellicoccus LeeSeaGull markers were used to detect human, dog, and gull fecal sources, respectively. The qPCR MST data were then utilized in a quantitative microbial risk assessment (QMRA) to assess human health risks. Additionally, samples collected in July and August 2022 were sequenced for 16S rRNA and matched with fecal sources through the Bayesian SourceTracker2 program. (3) Overall, 26% of the 110 samples with enterococci exceedances were positive for at least one of the MST markers. Gull was revealed to be the primary source of identified fecal contamination through qPCR and SourceTracker2. Human contamination was detected at very low levels (<1%), whereas dog contamination was found to co-occur with human contamination through qPCR. QMRA identified Campylobacter from canine sources as being the primary driver for human health risks for contact recreation for both adults and children. (4) These MST results coupled with QMRA provide important insight into water quality in Galveston that can inform future water quality and beach management decisions that prioritize public health risks.

1. Introduction

Fecal pollution is the primary source of waterborne pathogens to be introduced into waterways and has the potential to cause illness in humans. Exposure routes can include activities that may or may not result in head submersion (e.g., swimming, wading, boating, and fishing) with adverse health effects ranging from acute gastrointestinal illnesses to non-enteric illnesses of the respiratory system, ear, eye, and/or skin. Economic losses from these illnesses nationwide are estimated to be USD 2.9 billion, which includes lost productivity, treatment costs, and possibly death, with an estimated 50 million people infected every year [1]. This estimate does not include the loss in tourism revenue due to potential beach closures. Fecal indicator bacteria (FIB) such as enterococci and Escherichia coli (E. coli) are monitored in recreational waters to identify the presence of fecal contamination; however, they may not be entirely accurate indicators. Environmental conditions have been shown to impact the abundance of enterococci and E. coli [2,3,4] and there have also been cases of FIB naturally occurring in sediments, specifically in tropical regions [5]. Testing for FIB is widely available, but these tests do not provide any information on microbial origin.
Microbial source tracking (MST) is a process that can be used to identify fecal sources, often by detecting microbial DNA from a known source using the molecular technique of quantitative polymerase chain reaction (qPCR). Unique genetic markers can be utilized for a known source based on microorganisms that are specific to the gut of that organism. This technique is often referred to as marker-based MST. The HF183 marker is a gene marker that is highly specific (>95%) for human-associated Bacteroides, a genus of anaerobic bacteria found more abundantly in the gut than traditional FIB and widely used as an MST marker [6,7,8]. Bacteroides appear to be specific to animal gut environments and are typically short lived outside of a host [6]. DogBact is a gene marker that has been used in multiple studies for identifying canine fecal contamination (>98% specificity) and targets the genus Bacteroides [9,10] but has been observed to cross-react with coyote [11]. Unlike the DogBact and HF183 marker, the gull marker (i.e., LeeSeaGull) targets Catellicoccus marimmalium, a bacterium that is abundant in the gut microbiome of gulls. This abundance remains true for different gull species in varying geographic regions [12]. The LeeSeaGull assay has been found to be highly sensitive but has exhibited non-target amplification with pigeons due to habitat overlap (86% specificity) [13].
Recently, a microbiome-based MST approach through 16S rRNA gene sequencing has been used as a method of identifying fecal pollution. This method requires a library of sources that are analyzed by the entire source community rather than individual isolates. SourceTracker2 is a program that uses a Bayesian approach to identify fecal contamination based on microbial community composition of known sources compared to unknown sinks [14]. This program has been found to be accurate in marine environments [15,16] but can only detect recent contamination events [17].
In addition to determining the presence or absence of fecal pollution, quantitative MST marker concentrations can be incorporated into a quantitative microbial risk assessment (QMRA) to estimate human health risks associated with specific exposure events. QMRA is defined by four components—hazard identification, exposure assessment, dose-response, and risk characterization [18]—and has been extensively used to assess human health risks in recreational waters [19,20,21,22]. Studies have found that the risk of illness in recreational waters is driven primarily by human fecal contamination, with untreated sources (i.e., failing septic systems) posing the greatest threat [23]. While human-associated sources are considered the highest risk, the presence of co-occurring fecal contamination sources from nonhuman sources may also influence health risk [21,22,24].
This study aims to use marker and microbiome MST methods to categorize and quantify fecal pollution in Galveston, Texas, and develop a human health risk assessment based on these findings. Galveston Island, Texas, is a barrier island south of Houston that encompasses the City of Galveston, the City of Jamaica Beach, and unincorporated areas of Galveston County. The statewide coastal water quality monitoring program, Texas Beach Watch (TBW), has identified localized “hot spots” representing areas of concern where high levels of FIB have been increasing over time [25]. Several locations around the island have been identified as having a high number of days (>10%) over a 13-year data collection period exceeding the U.S. Environmental Protection Agency-accepted alternative Beach Action Value (BAV) of 104 MPN/100 mL. Enterococci results exceeding this limit are thought to have a higher microbial load and require beach advisories to limit human exposure to potential fecal pathogens. Information from this study will allow better management of site-specific recreational areas for protecting public health.

2. Materials and Methods

Samples were collected from March 2022 to May 2023 across 40 Texas General Land Office (TGLO) TBW sampling stations on Galveston Island (Figure 1A). The island is divided into three sections: The West End, Seawall, and East End. The West End of the island is primarily rural and residential, relying on septic systems, whereas the Seawall and East End are considered more urban and rely on wastewater treatment plants. Stations were selected by TBW based on population densities and areas of highest beach use. TBW collects water samples for enterococci testing weekly from March through October and every other week from November through February. If a sample exceeds 104 MPN/100 mL, that station is resampled daily until water quality has improved to acceptable levels. For the entire sampling period (15 months), a total of 110 water samples that exceeded Texas’s recreational water quality limit were collected and analyzed across all stations.
Water samples were collected by TBW and sent to a third-party lab (Eastex Labs, Coldspring, TX, USA) for IDEXX Enterolert testing the same day. When a result exceeded Texas’s recreational water quality limit (104 MPN/100 mL), 100 μL of unused sample (reserved from the Enterolert test and stored in the freezer) was filtered onto 0.2 µm Supor filters (Pall Corporation, Ann Arbor, MI, USA), frozen, and sent to the Soil and Aquatic Microbiology Lab in College Station, Texas, for further analysis. DNA extraction was performed using a DNeasy PowerWater kit (QIAGEN, Hilden, Germany) following the manufacturer’s instructions. The DNA concentration and A260/280 were measured for each sample extract using a Nanodrop (ThermoFisher Scientific, Waltham, MA, USA) to confirm extraction quality. All DNA extracts were stored at −80 °C until further use.
All samples were screened for the human, dog, and gull fecal markers using qPCR. Primers, probes, and positive control gBlocks are shown in Table S1. HF183 was used as the human-associated Bacteroides marker, following EPA Method 1696 [26]. Each reaction had a total volume of 10 μL that consisted of 0.125 μL at 100μM concentration of BacR287 and HF183 primers, 0.01 μL of the 100μM BacP234MGB Taqman Probe (Integrated DNA Technologies, Coralville, IA, USA), 0.2 μL of 10 mg/mL Bovine Serum, 5 μL of TaqMan Environmental Master Mix (Applied Biosystems, Waltham, MA, USA), 3.04 μL of Hypure™ Molecular Biology Grade Water (ThermoFisher Scientific, Waltham, MA, USA), and 1.5 μL of extracted sample template. Cycling parameters consisted of an initial denaturation of 95 °C for 10 min, followed by 40 cycles of 95 °C for 15 s and 60 °C for one minute using the QuantStudio5 thermocycler (Applied Biosystems, ThermoFisher Scientific, Waltham, MA, USA).
DogBact was used as the canine marker [27] where the PCR mix contained 0.125 μL at 100μM concentration of the DF475R forward primer and Bac708R reverse primer, 0.08 μL of 100μM DogBactP Taqman probe, 5 μL of TaqMan Environmental Master Mix, 0.02 μL BSA, and 3.15 μL of Hypure™ Molecular Biology Grade Water with 1.5 μL of sample. Cycling parameters consisted of an initial denaturation of 95 °C for 10 min, followed by 40 cycles of 95 °C for 15 s and 60 °C for 1 min.
The LeeSeaGull assay used for the gull Catellicoccus marker contained 1.75 μL of TaqMan Environmental Master Mix per reaction, with a final reaction volume of 10 μL containing 250 nM concentration of the CaT#998F and CaT#998 primers and 125 nM of the CaT#998 probe, and 2.5 µL of extracted sample template [12]. Cycling parameters consisted of an initial denaturation of 95 °C for 10 min, followed by 40 cycles of 95 °C for 15 s and 56 °C for 1 min.
Copy numbers for each marker gene were quantified using the creation of a standard curve. No template controls (NTCs) and positive controls were included in each run. For human and dog markers, quality control limits were a reaction efficiency between 90 and 110%, and an R-squared value higher than 0.98. The LeeSeaGull marker quality control limits had a reaction efficiency between 80 and 100%, and an R-squared value higher than 0.98. Standard curves ranged from 101 to 105 copies per reaction. The lower limit of quantification (LOQ) values for human, dog, and gull were 430, 358, and 723 copies per 100 mL, respectively. The HF183 assay had the addition of an internal amplification control (IAC; listed in Table S1) as per EPA Method 1696.
Due to the nature of the host-associated marker data, censored statistical tests were utilized to analyze the qPCR data. A censored Kendall’s tau correlation test was performed using the cenken command from the NADA package (v1.6-1.1) in R [28] to test correlations between all host-associated markers as well as enterococci. The cendiff command from the NADA package (v1.6-1.1) in R [28] was used to test differences between marker concentrations based on zone, by comparing empirical cumulative distribution functions (ECDFs). Differences between enterococci concentrations in the three zones were tested with ANOVA, followed by a Tukey HSD posthoc test (aov and TukeyHSD commands from the stats package in R) (v4.1.2; R Core Team, 2021).
A subset of water samples collected in July and August 2022 that exceeded 104 MPN/100 mL were used to compare source-sink proportions through 16S rRNA gene sequencing (Table 1). Known source samples were collected from raw WWTP sewage, WWTP treated effluent, onsite sewage facilities (OSSFs), dogs, gulls, and coyotes. Samples were sequenced at the Texas A&M Institute for Genome Science and Society (TIGSS) using the MiSeq Illumina platform with V5 and V6 primers (Table S1) [29]. Raw paired-end sequencing reads (2 × 300 bp) were analyzed with the QIIME2 software package version 2022.8 (https://qiime2.org (accessed on 22 May 2023)) [30] and plugins associated with this version. After importing raw reads to the QIIME2 pipeline, paired-end sequencing reads were demultiplexed using the demux plugin. Quality control, filtering chimeric sequences, and feature table construction were carried out using the q2-dada2 plugin [31] with trimming parameters (--p-trim-left-f 20--p-trim-left-r 20--p-trunc-len-f 280--p-trunc-len-r 280) based on the demux output visualization files. SourceTracker2 [14] software with QIIME Gibbs Sampler plugin was used for the comparison of source-sink proportions.
The human health risks associated with exposure to reference pathogens (as estimated through the quantification of the MST markers for human, dog, and gull) while swimming was developed using QMRA. Estimated human health risks were compared to the U.S. EPA risk threshold for recreational water quality, which is 32 illnesses per 1000 recreators or a probability of 0.032 [32]. It is important to note that this threshold corresponds to the 2012 U.S. EPA recreational water quality criteria for enterococci of (1) a geometric mean less than 30 MPN and (2) a statistical threshold value (STV) of 110 MPN that should not be exceeded in more than 10% of samples, rather than the single sample standard of 104 MPN currently employed by the TBW program.
The QMRA models utilized point estimate values and data distributions for the environmental MST marker concentrations. An analysis was completed with samples that tested positive for all three MST markers (i.e., GAL003, GAL005, GAL007, GAL032, GAL047, collected in April and May 2023), and analyzed with point estimates representing the minimum, geometric mean, and maximum concentrations of each marker. An additional QMRA analysis was completed using all samples, where all non-detects were replaced with half the LOQ for each marker (human: 215, dog: 179, gull: 361, copies/100 mL). When assessing health risks across all stations, best fit distributions for the environmental MST marker data were determined using R (v4.1.2) and RStudio (v2022.07+554) and performed using maximum likelihood estimation with the fitdistrplus (version 1.1-11) package [33]. Distributions tested included gamma, exponential, normal, lognormal, uniform, exponential, Weibull, beta (using data transformed to fit the confines of [0, 1]), pareto, and triangular distributions (using the actuar package (version 3.3-2) [34]. Distributions were assessed for each marker by reviewing the Akaike Information Criterion (AIC) values, quantile-quantile (QQ) plots, cumulative distribution function (CDF) plots, and probability-probability (PP) plots from the fitdistrplus package [33]. Optimal distribution parameters were estimated using the egamma and elnorm commands in the EnvStats package (version 2.7.0) [35]. Data distributions benefit the QMRA by incorporating variability into the risk estimates and the opportunity to assess the sensitivity of this parameter (environmental data) on the overall model output.
Given that the MST markers are indicators of fecal pollution, reference pathogens were utilized to estimate the risk of a gastrointestinal illness for individuals engaging in contact recreation (swimming). The reference pathogens for the human sewage source (HF183 marker) included Campylobacter, Salmonella, E. coli O157:H7, Cryptosporidium, Giardia, norovirus, and adenovirus [24,36,37]. Gull feces (LeeSeaGull marker) included Campylobacter and Salmonella [20,37,38] and dog fecal waste (DogBact marker) was represented by the reference pathogen Campylobacter [39,40,41]. Incidental ingestion, which is assumed to occur while swimming, such as during head submersion, was described for both children (average of 36 mL) and adults (average of 9 mL) based on a study that collected self-reported ingestion volumes from over 68,000 participants [42]. It is important to note that while HF183 marker is commonly used as an indicator for untreated human sewage, it can also originate from treated wastewater effluent [6] and from bather shedding via the skin [43]. All parameters included in the QMRA are described in Table 2.
The following equation was used to estimate the dose for each source-specific reference pathogen and has been applied in previous MST-QMRA studies [22,23,38,60]:
d o s e R P s = C M S T F M S T S × 100 × R R P s × P s × V
For this equation, S represents each fecal source (human, gull, dog); MST represents each MST marker (HF183, LeeSeaGull, DogBact); RP is the reference pathogen; CMST represents the environmental concentration of that marker in water (gene copies 100 mL−1); F M S T S represents the concentration of the marker in either sewage or feces (gene copies mL−1 or gene copies g−1); R R P s is the concentration of the reference pathogen in sewage or feces (n g−1 or n L−1); P s is the fraction of pathogenicity for non-human pathogens; and V is the volume of water ingested (mL) during a swimming event. A conversion factor of 0.001 was used while calculating the dose for human sewage because the volume ingested is measured in mL and the R R P s is measured in L.
Once the dose for each reference pathogen was estimated, dose-response equations were applied to estimate the probability of infection for adults and children. These equations include exponential, Beta-Poisson, and Fractional Poisson models listed in Table 3. To extrapolate the probability of infection ( P i n f ) to the probability of illness ( P i l l ) , each probability of infection estimate was multiplied by pathogen-specific morbidity ratios (Table 3). Equation (2) was utilized to estimate the cumulative probability of illness assuming exposure to all three fecal sources (and therefore reference pathogens) in recreational waters. For mixed sources that included the same reference pathogens (specifically Salmonella and Campylobacter), the dose for each reference pathogen was estimated independently for each fecal source and then summed together for a total dose of pathogen. When estimating the cumulative risk of illness, we assumed statistically independent exposures [37,61].
P i l l S = 1 R P ( 1 P i l l , R P )
The QMRA model includes parameters described by statistical distributions to incorporate variability when possible. The Crystal Ball Pro® Software (version 11.1.3.0) was used to conduct Monte Carlo simulations (10,000 iterations) to estimate human health risks.

3. Results

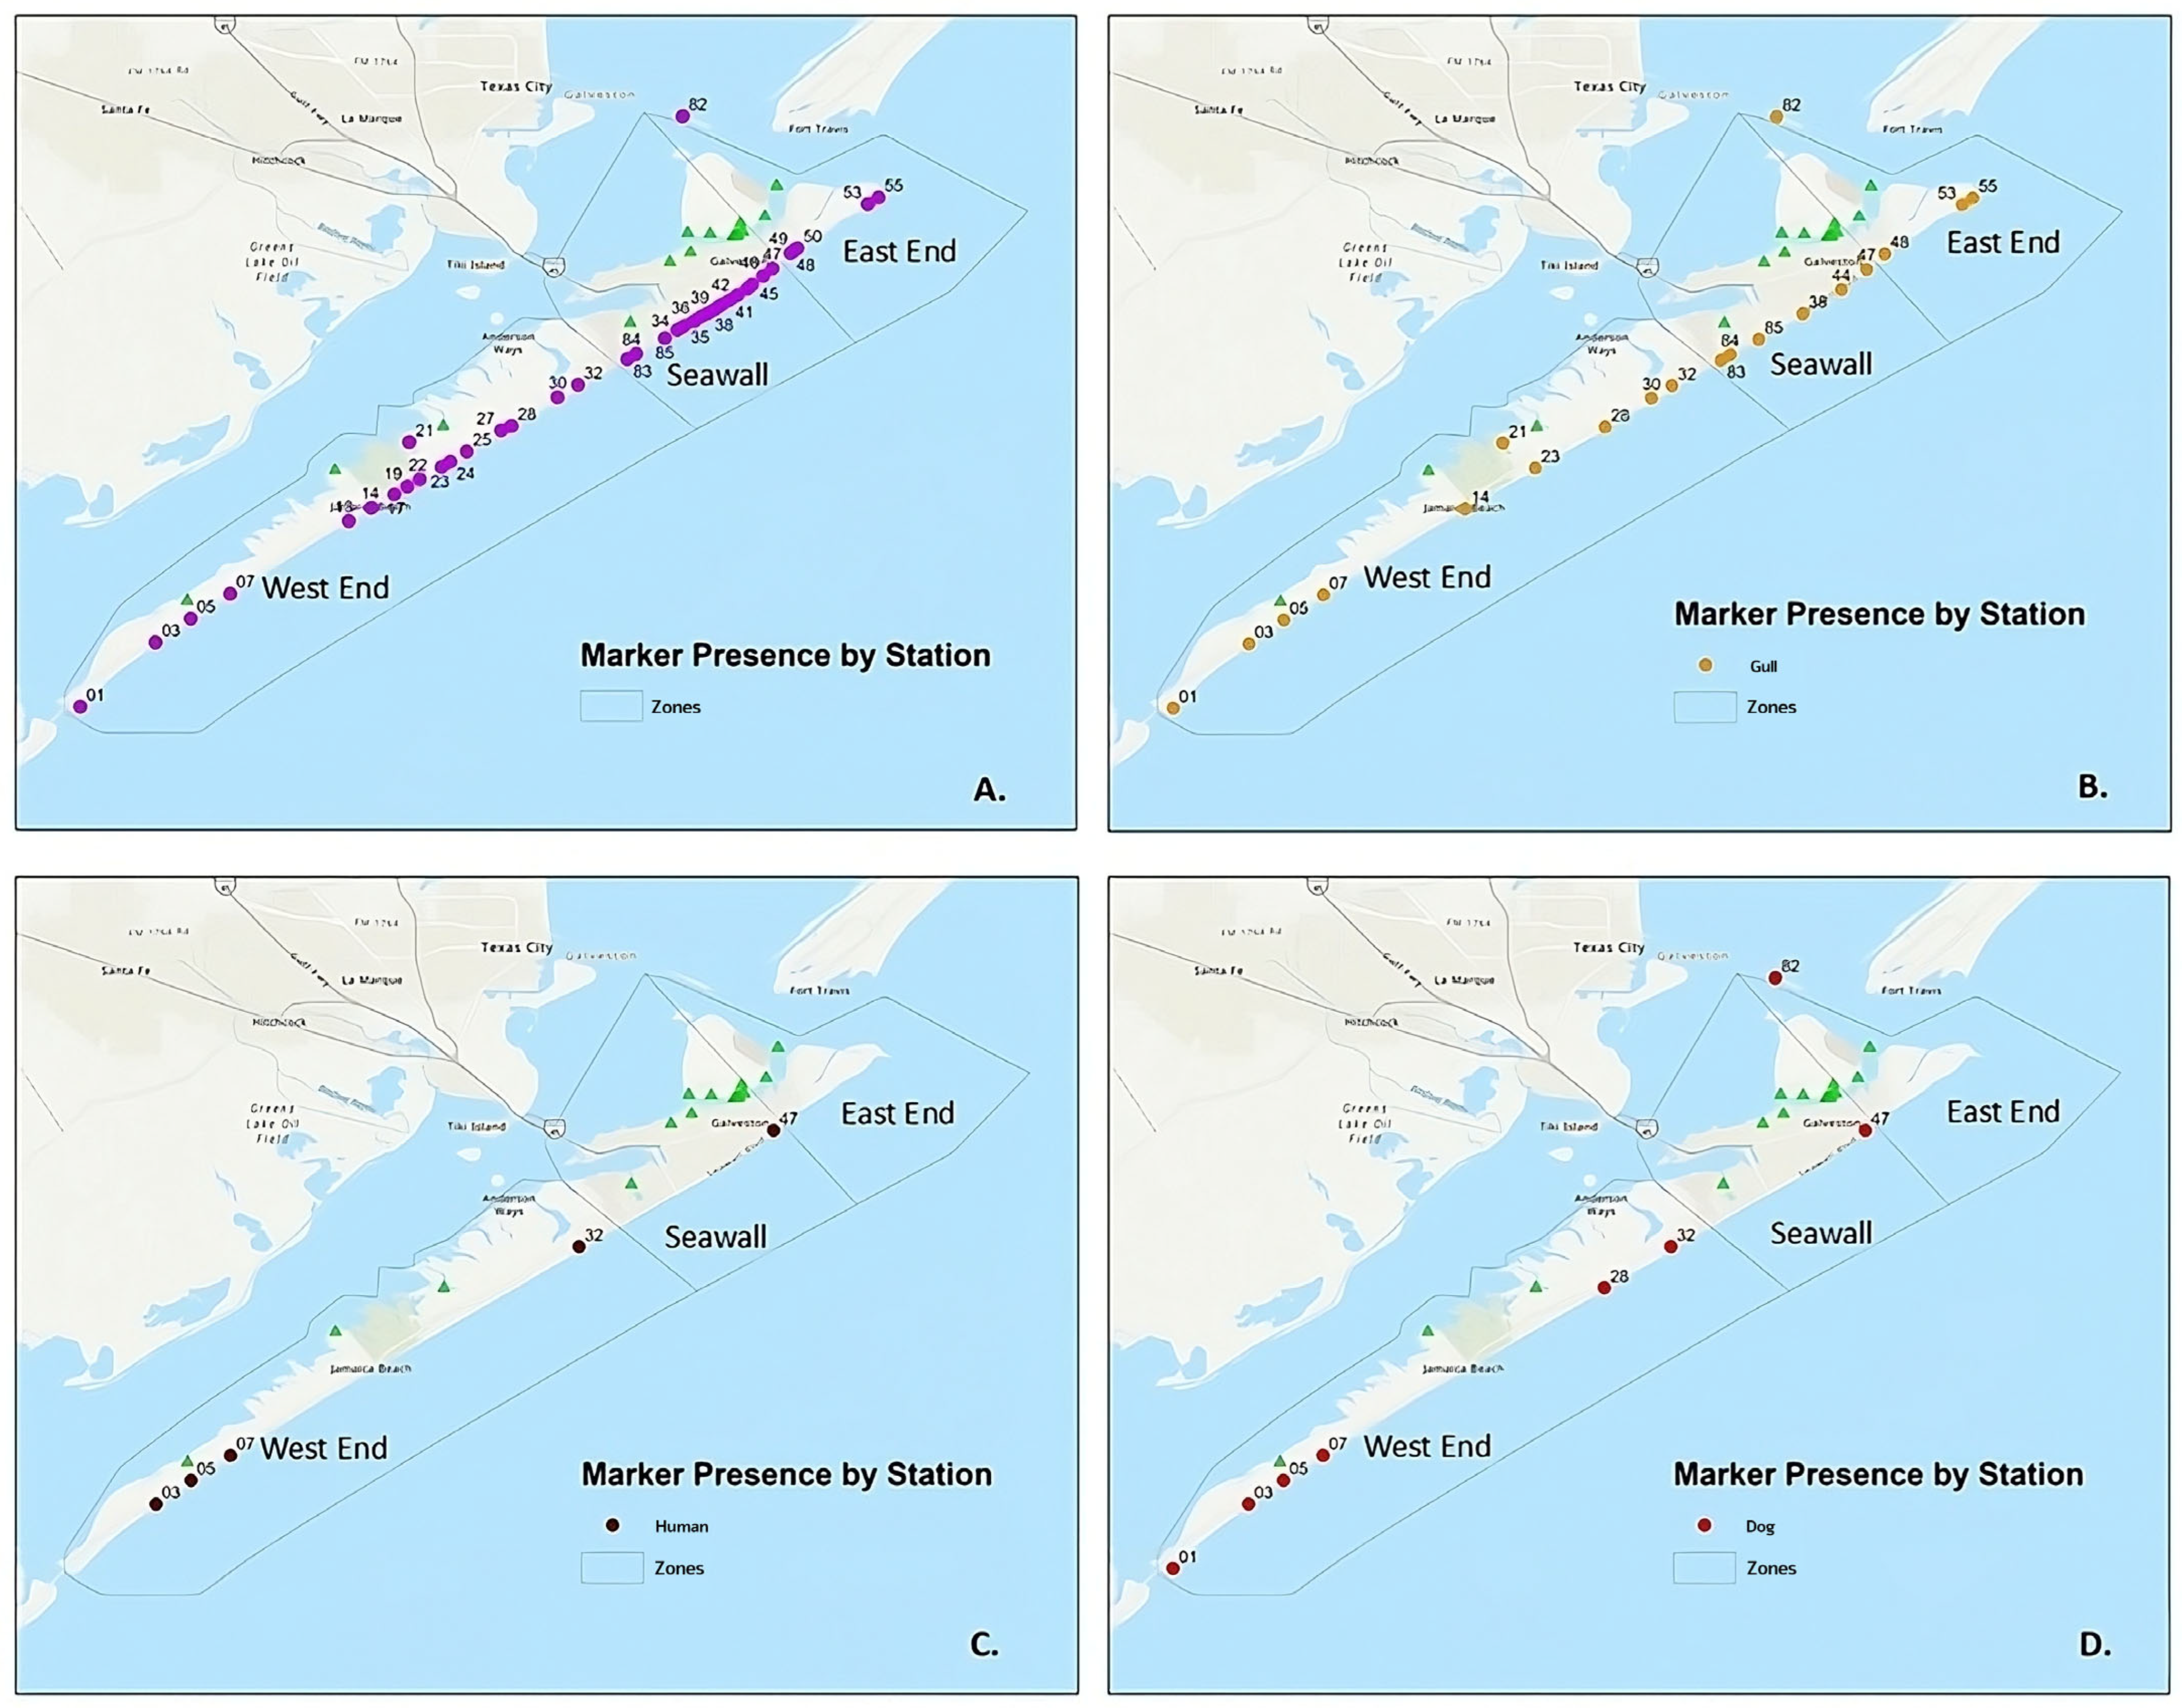
3.1. Marker-Based MST

Overall, 26% of the 110 samples tested positive for at least one qPCR marker. The gull was the most commonly detected and abundant marker (Figure 1B), ranging from approximately 600–48,000 gene copies per 100 mL. Gull fecal contamination was distributed throughout the island, with higher copy numbers detected in the West End and East End, although the difference was not statistically significant (Figure S1). The HF183 human marker was detected the least often and was more geographically concentrated in the West End where wastewater treatment is predominantly OSSFs (Figure 1C). The detection of the human marker was often below the LOQ but above the limit of detection (LOD); therefore, it was present but not accurately quantifiable. The samples that tested positive for the dog marker often overlapped with the location of the human marker but were seen in higher copy numbers and at several additional stations (Figure 1D). The dog and gull markers experienced a weak correlation (Kendall’s tau: 0.16; p < 0.001), although the human marker was not correlated with either marker. None of the host-associated markers were found to correlate with enterococci. Individual marker copy numbers for each sample can be found in Table S2.

3.2. Microbiome-Based MST

The largest microbial community source for most samples was categorized as “unknown”, but closer examination of the bacteria within this source suggested they were primarily naturally occurring bacteria. Similar to the qPCR results, the microbiome-based MST results indicated the largest identified known source detected was gull. Stations that were shown as having large gull contamination in SourceTracker2 did not necessarily test positive for the LeeSeaGull qPCR marker. Additionally, SourceTracker2 gull contributions appeared to be higher in the West End. Figure 2 shows the microbiome-based MST results categorized into large and small source contributions. WWTP outlet (treated effluent) is categorized as a large source contribution, although not nearly as high as unknown or gull. Small source contributions were human WWTP (untreated sewage), septic, dog, and coyote.

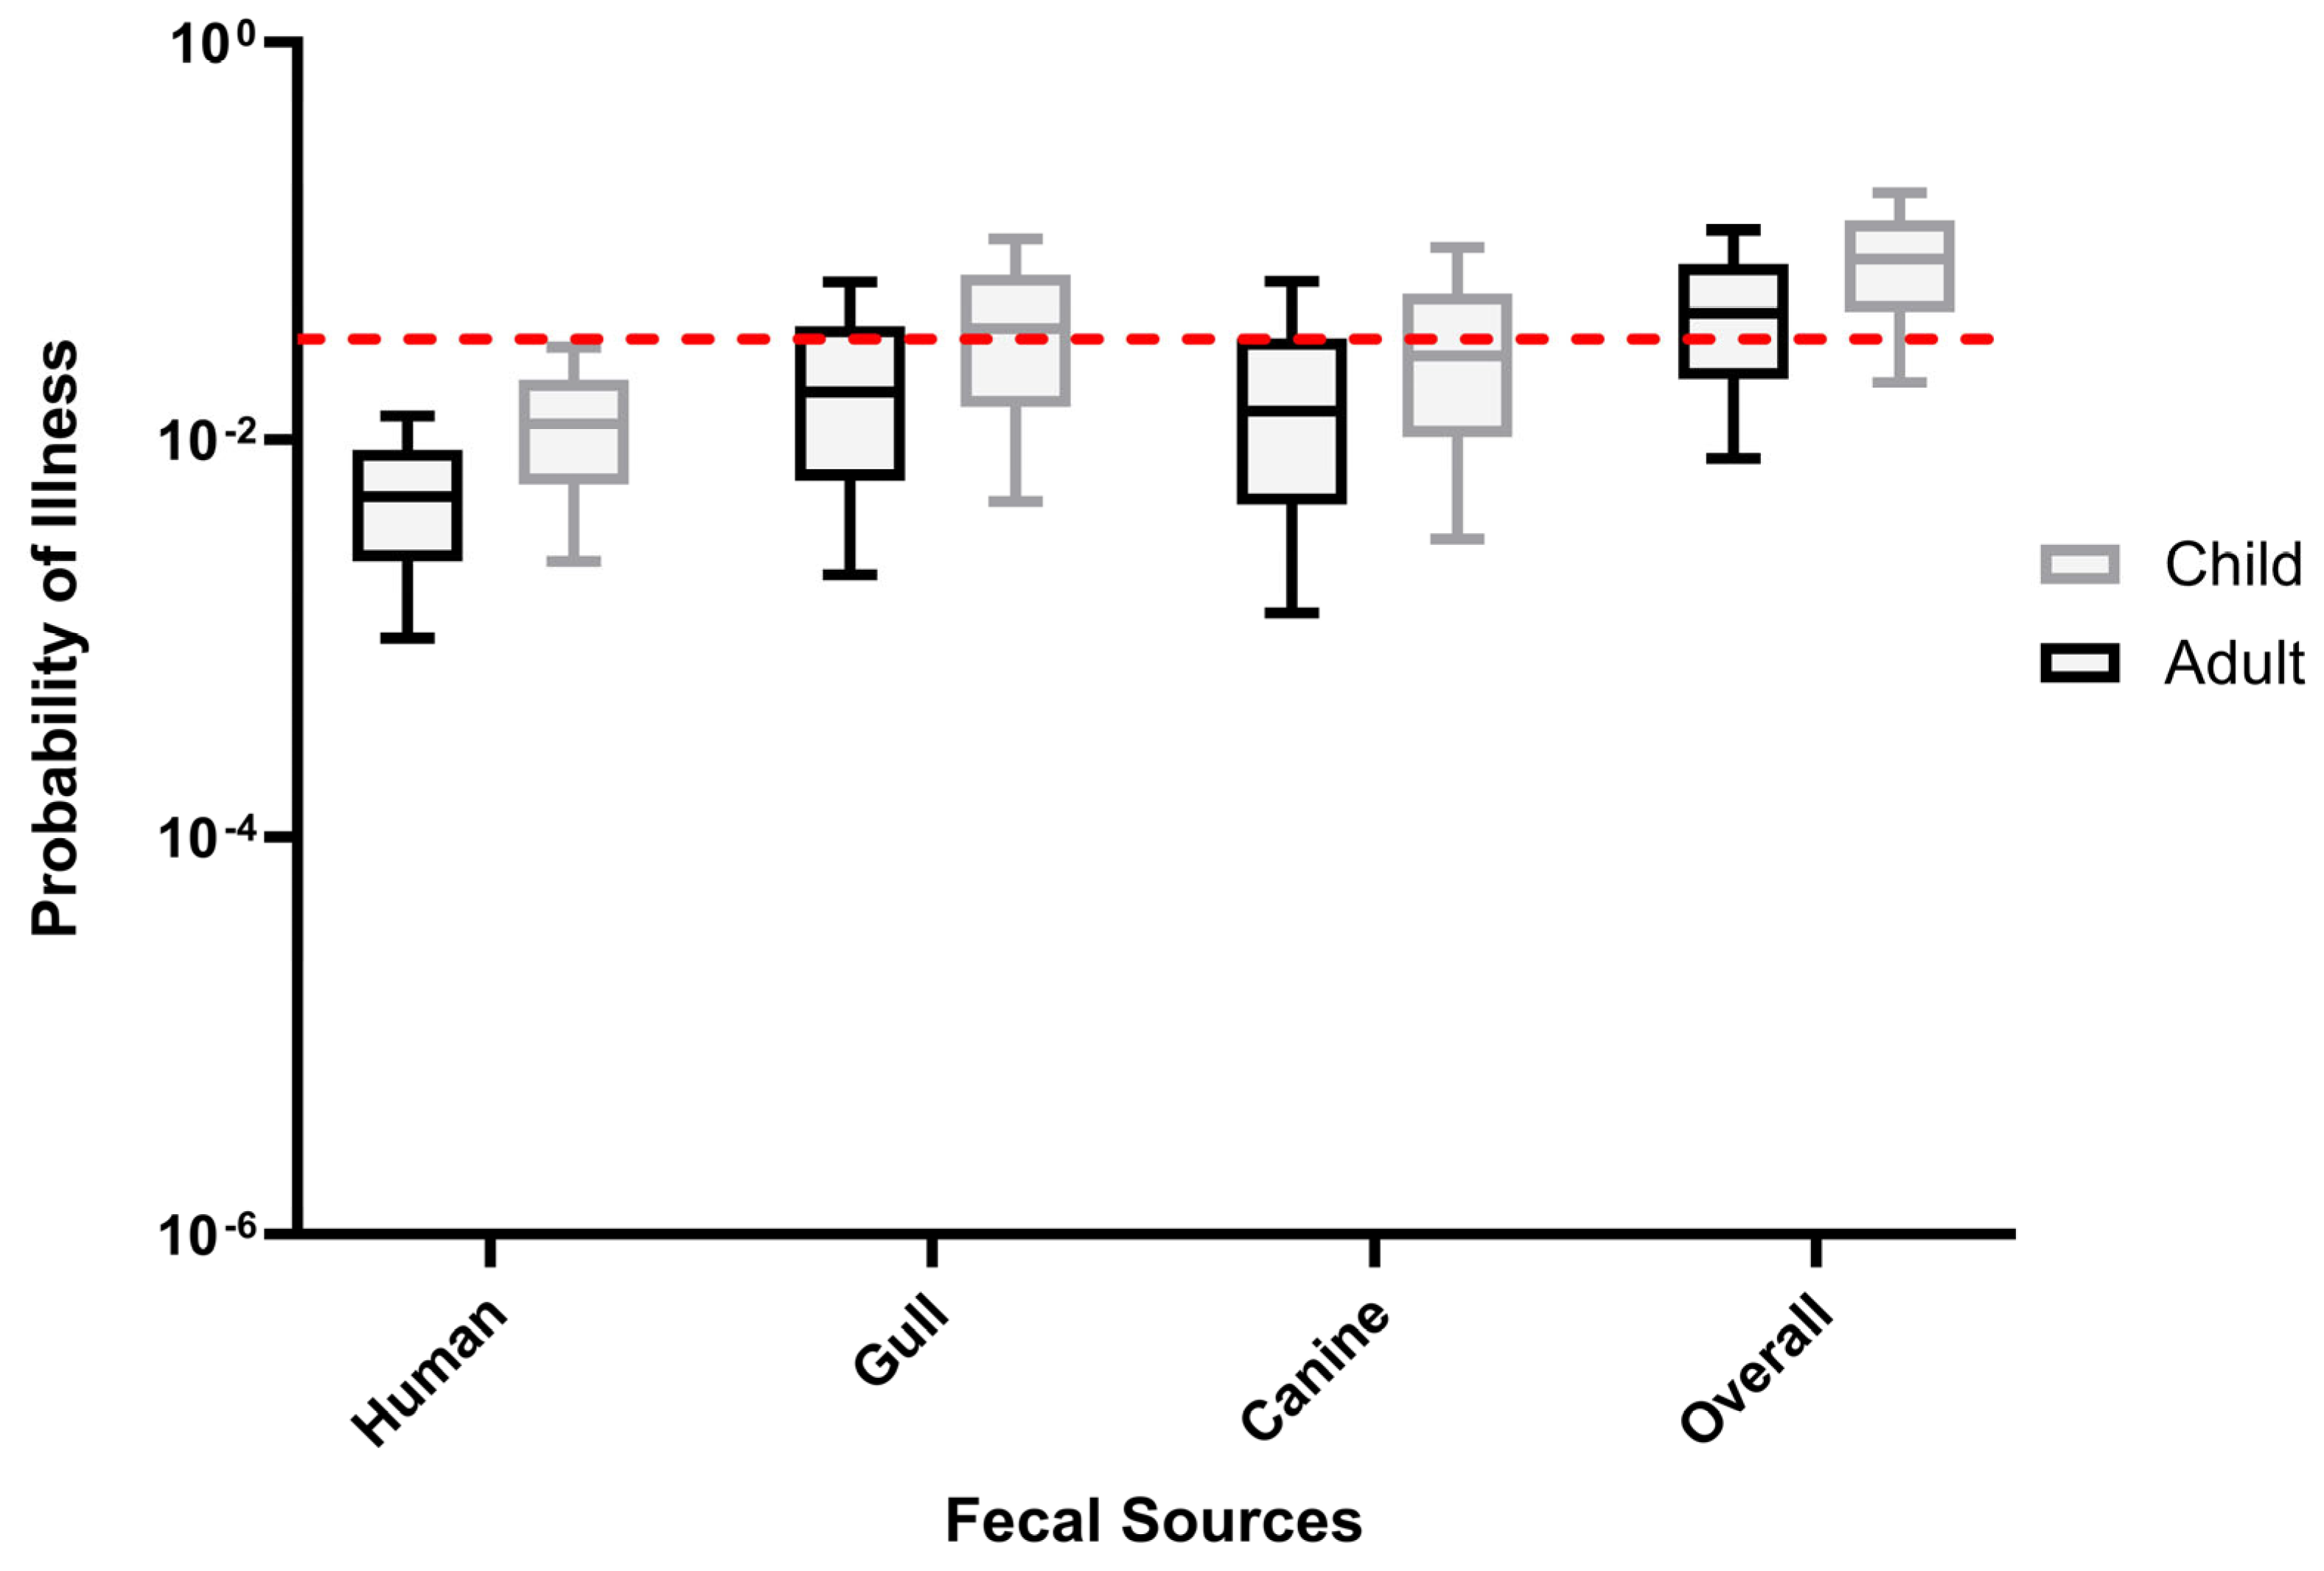
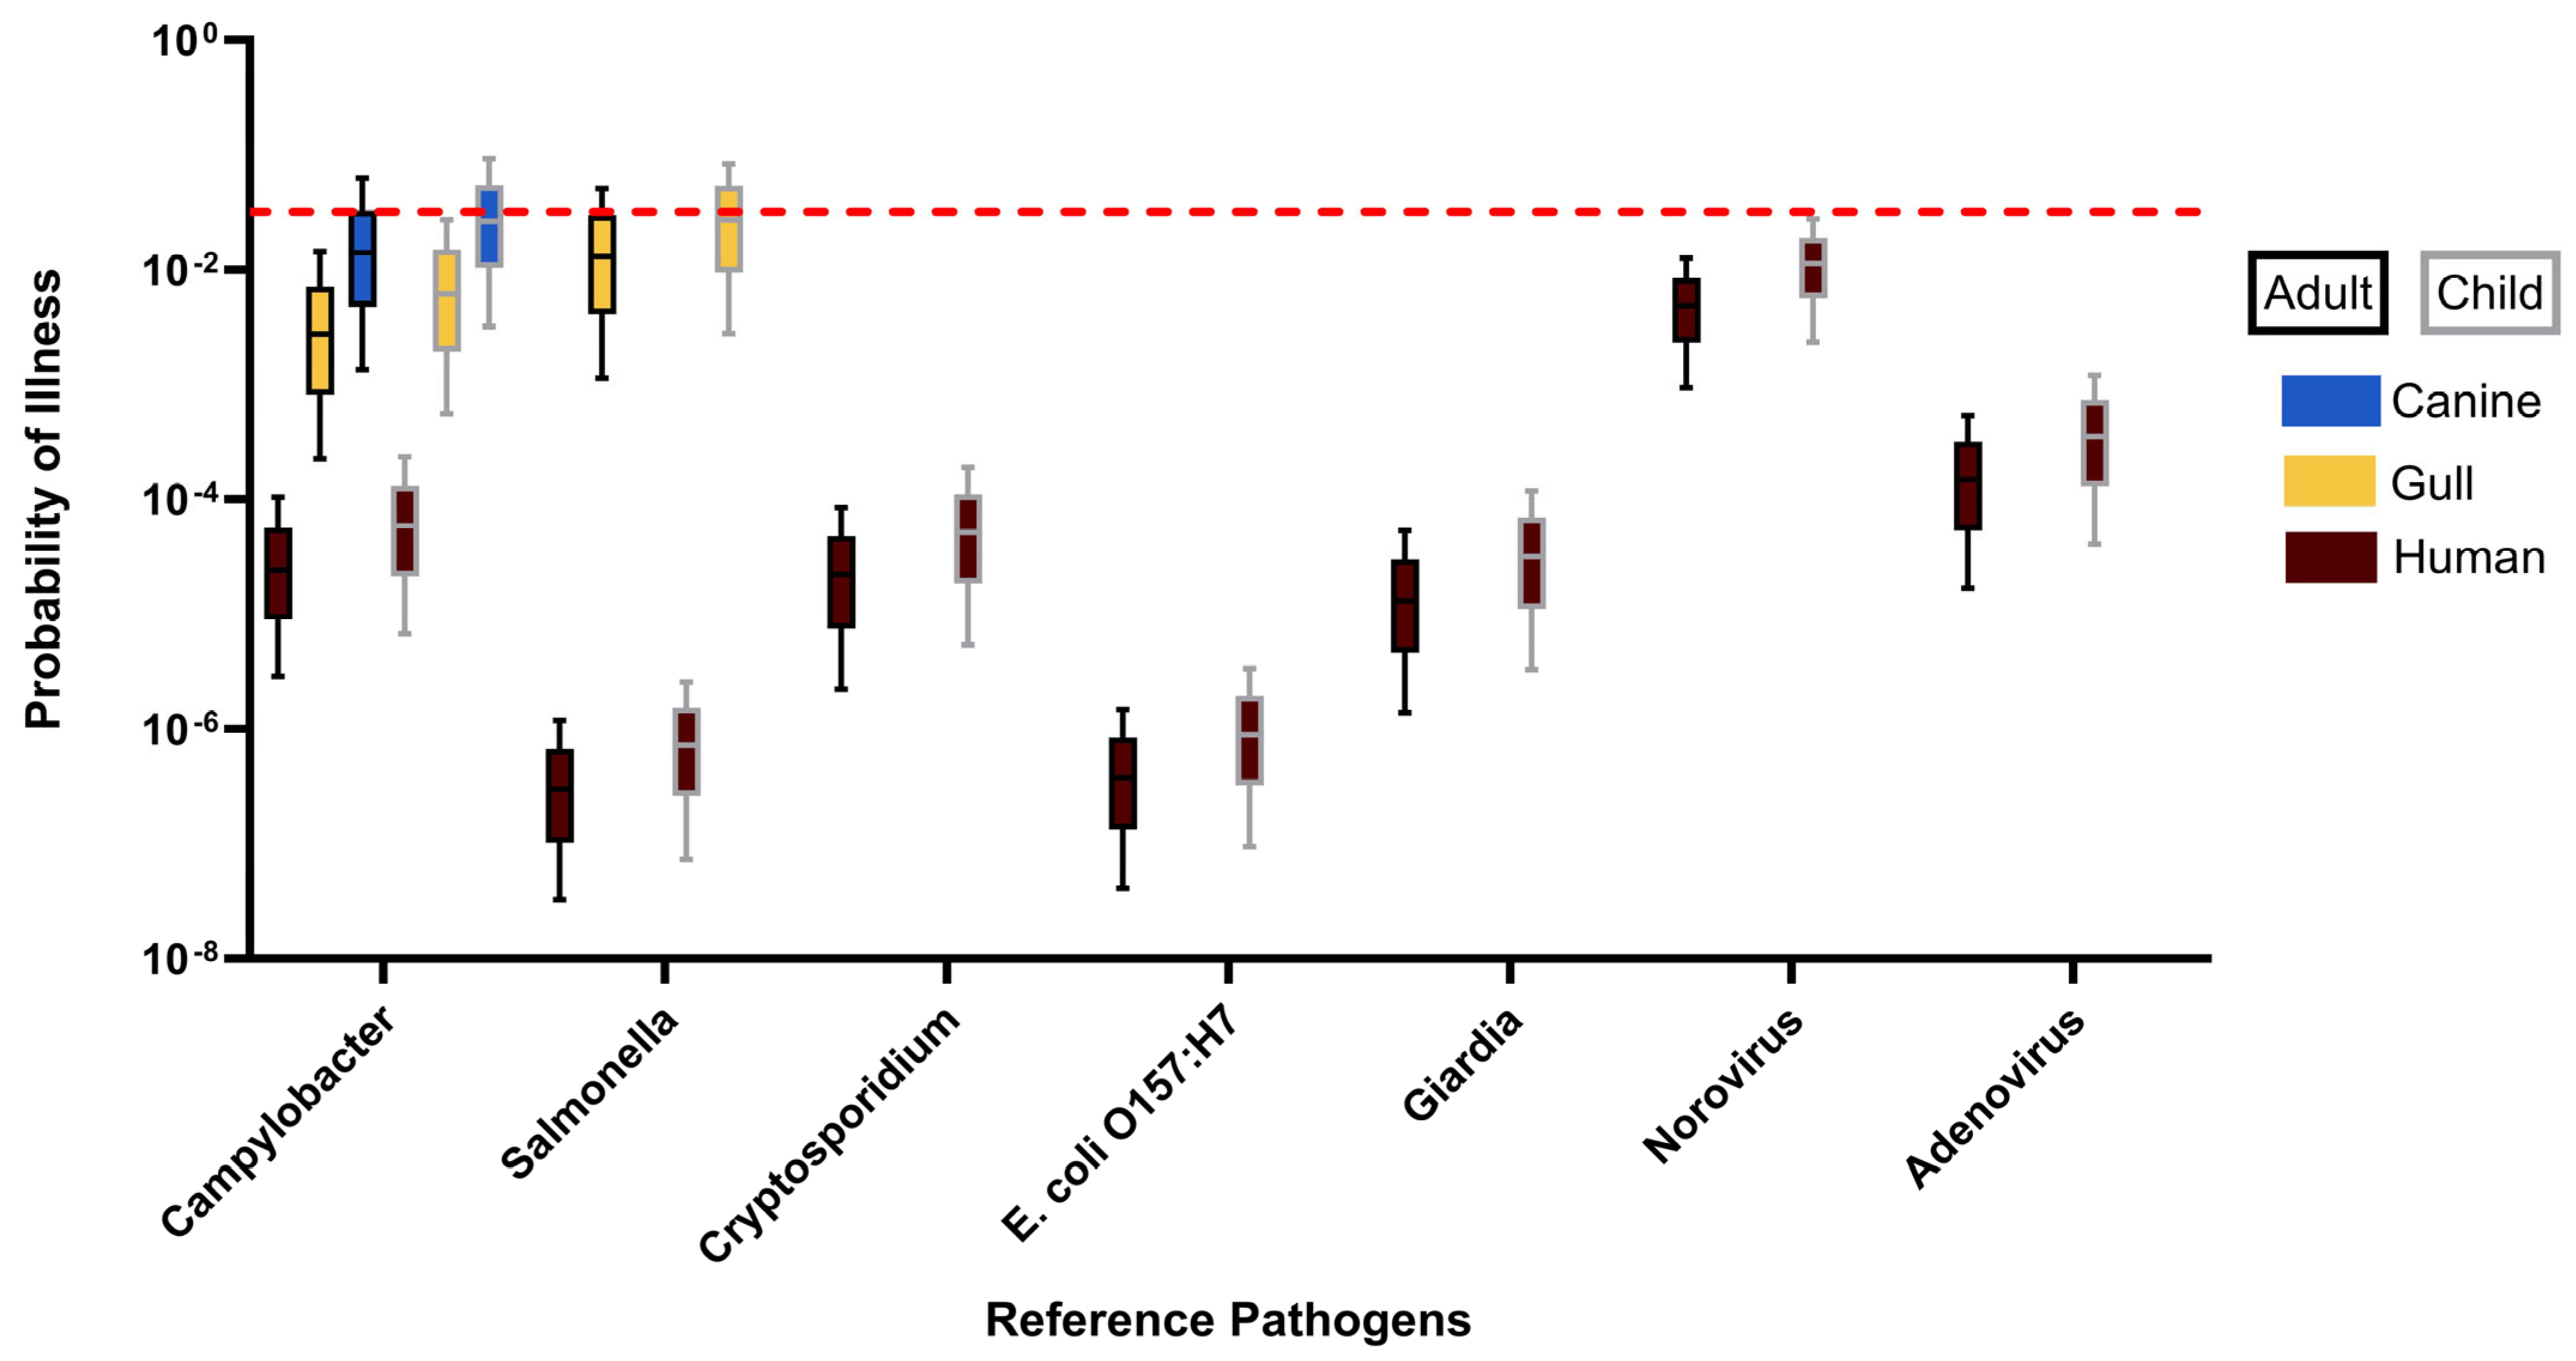
3.3. Human Health Risk Estimates

Based on the qPCR marker results, the risk of gastrointestinal illness from exposure to human and non-human fecal sources and their associated reference pathogens in recreational waters were estimated for adults and children. We first estimated the human health risks using MST marker concentrations from the five samples where the human, gull, and dog markers were co-occurring. Due to the smaller dataset, we utilized the minimum, geometric mean, and maximum values of each marker to conduct this assessment (see Table 2). The estimated median health risks, assuming the geometric mean MST marker concentrations, tended to be greater for the non-human fecal sources (adult: gull: 1.73 × 10⁻², dog: 1.40 × 10⁻²; child: gull: 3.62 × 10⁻², dog: 2.64 × 10⁻²) than for the human fecal source (adult: 5.17 × 10⁻³; child: 2.00 × 10⁻²) (Figure 3, Table S3). The same trend was evident when estimating health risks associated with the minimum and maximum MST marker concentrations (Figures S2 and S4, Table S3). However, when estimating health risks across all stations (as a distribution), the dog marker was identified to have the greatest health risk (adult: 3.00 × 10⁻³; child: 6.48 × 10⁻³), while the health risks from the gull (adult: 3.36 × 10⁻⁵; child: 7.35 × 10⁻⁵) and human (adult: 2.20 × 10⁻⁵; child: 5.02 × 10⁻⁵) were two orders of magnitude lower (Figure S6, Table S3).
The overall human health risks, defined as the cumulative risks when simultaneously exposed to pathogens co-occurring from human, canine, and gull fecal sources, tended to exceed the U.S. EPA risk threshold (32 illnesses per 1000 recreators) for the five stations for the geometric mean (adult: 4.32 × 10⁻²; children: 8.10 × 10⁻²), minimum (adult: 1.89 × 10⁻²; children: 3.83 × 10⁻²), and maximum (adult: 1.18 × 10⁻¹; children: 2.00 × 10⁻¹) MST marker concentrations (Table S3). When considering all stations combined, the median health risks were not as elevated and did not exceed the U.S. EPA recreational threshold (adult: 8.24 × 10⁻³; children: 1.70 × 10⁻²) (Table S3).
When comparing the risk of illness among the different reference pathogens, generally Campylobacter in canine feces posed the greatest risk for both adults (geometric mean median health risk: 1.40 × 10⁻²) and children (geometric mean median health risk: 2.64 × 10⁻²) (Figure 4; Table S3) as well as Salmonella in gull feces (geometric mean median health risk: adults: 1.30 × 10⁻²; children: 2.72 × 10⁻²) (Table S3, Figure 4 and Figure S3). However, when considering the maximum MST marker concentrations, norovirus in human sewage contributed to the greatest health risk (geometric mean median: adult: 3.15 × 10⁻²; child: 6.91 × 10⁻²) (Table S3; Figure S5). When considering all stations (distribution), Campylobacter in canine feces posed the greatest risk (adult: 3.00 × 10⁻³; child: 6.48 × 10⁻³) while Salmonella in gull feces (adult: 2.38 × 10⁻⁵; child: 5.17 × 10⁻⁵) and norovirus in human sewage (adult: 2.08 × 10⁻⁵; child: 4.74 × 10⁻⁵) were comparable (Table S4; Figure S7).
A sensitivity analysis was also conducted using the rank correlation approach to identify which input parameters had the greatest effect on the overall risk output. When evaluating all parameters except for the MST marker concentrations in environmental waters (assumed to be the minimum, geometric mean, or maximum values), the ingestion volume had the greatest influence on human health risks, while secondary parameters driving health risks varied (fraction of pathogenic species in gull feces, Campylobacter morbidity, and an inverse contribution of the dog marker in feces) (Figures S8–S13). For both adults and children (when considering all parameters with distributions, including the MST markers), the concentration of the canine marker in water, followed by the ingestion volume while recreating, were the two parameters found to have the greatest influence on the human health risk estimates (Figures S14 and S15). Identifying which parameters “drive the risk” can aid in developing water quality management strategies that are most protective for public health.

4. Discussion

Gull fecal contamination was the most abundant source detected in both the marker- and microbiome-based analyses, followed by dog and human. Marker persistence may play a role in the elevated levels of gull fecal contamination compared to the other MST markers. Catellicoccus marimmalium (gull marker) has been shown to persist for up to 10 days in marine water, whereas the HF183 Bacteroides has been shown to persist in environmental waters for up to 4 days [6,72]. Additionally, markers can cross-react with non-target fecal sources, thus low detected concentrations of a marker (e.g., human) might not be indicative that contamination from that specific source is actually present [15]. However, similar results have recently been reported for other sites on the Texas Gulf Coast [73,74].
There is currently no regulatory standard for MST markers, but a risk-based threshold for HF183 (525 gene copies/100 mL) has been proposed that corresponds with the U.S. EPA risk benchmark of 0.032 [24]. Only one station exceeded this proposed risk-based threshold of HF183 with 892 copies per 100 mL at station GAL032 on 23 May 2023. The estimated risk-based threshold for gulls for an unknown age of contamination is 200,000 copies/100 mL. The highest number of copies for the LeaSeaGull marker reported was 47,713 copies/100 mL. However, mixtures of fecal sources that are co-occurring affect these proposed RBTs. For example, if 22,500 genes copies/100 mL of the gull marker is present, only 1 gene copy/100 mL of HF183 can be present while still meeting the U.S. EPA risk benchmark of 0.032 [24].
DNA sequencing results suggested low level human contributions (<1%) in approximately 66% of the 38 tested environmental samples. This finding suggests that although human contamination may not be the predominant form of fecal contamination, it could be consistently present at low levels in marine water throughout the island. In addition to wastewater related inputs these low-level marker detections may be contributed to bather shedding. Prior studies have shown that both skin-associated and fecal shedding can release HF183 into marine waters during recreational activity [75,76,77]. However, one study evaluated the limitations of earlier versions of the SourceTracker2 program through lab and field tests and found that SourceTracker performed well when large portions of a source were present but reported high standard deviations (>100%) in sources with low concentrations (<1%) [78]. These are the levels in which we saw raw sewage in the SourceTracker2 analysis, which may indicate uncertainty about the amount of human contamination present.
Although microbiome members from raw sewage were detected at low levels, microbiome similarities to treated WWTP effluent were detected in every sample at varying abundance. The presence of treated effluent does not necessarily mean there is a public health risk. Other MST studies using SourceTracker2 conducted in southern California have confirmed the presence of WWTP effluent in marine water [43,79]. One study observed that the concentration of HF183 increased after a WWTP effluent discharge event [80]. Ideally, there should be low levels of indicator bacteria present in wastewater effluent and enterococci have been shown to reactivate minimally when exposed to natural light [81,82]. It is possible that effluent could contribute to the enterococci load around the island, which could have caused the high levels of fecal indicators but relatively low fecal source contributions.
In 34 samples, <0.1% of the overall bacterial community was shown to originate from dog fecal waste. Fecal waste from coyotes was also seen in low levels throughout the island but had spikes on 8/23/2022 at stations GAL037 and GAL044 contributing to 2.25% and 0.38% of sample bacteria, respectively. The DogBact marker is not able to distinguish between pets and coyote fecal contamination [11], so it is possible the qPCR marker is also detecting coyote. GAL037 and GAL044 did not test positive for the DogBact marker, indicating that detection for coyote may be more robust using a microbiome-MST approach.
Human fecal pollution has been found to be the primary driver for human health risks in several integrated MST-QMRA studies [21,22,24]; however, in this study we identified that the canine source Campylobacter as having the greatest health risk among the three fecal sources. This finding may be due to several reasons, which include detecting very low levels of the human marker in water samples across the island, only utilizing qPCR for three fecal sources when other fecal sources of human health concern may co-occur, and only analyzing samples that exceeded the recreational water quality limit based on enterococci. Samples positive for the HF183 human marker were also positive for the LeeSeaGull and/or DogBact markers, indicating that these sources may overlap with human activity. A similar study found dog to be the primary driver in model-based E. coli concentrations in a freshwater system [83]. Texas Beach Watch does not currently monitor for E. coli as a FIB.
Utilizing MST data in a QMRA provides the opportunity to assess site-specific health risks for recreational waters. Given that the QMRA relies on assumptions for pathogen occurrence and prevalence, recent work has indicated that some source-specific reference pathogen health risks may be overestimated (human source: norovirus, adenovirus, and Campylobacter jejuni) while others may be underestimated (human source: E. coli and Cryptosporidium) after detecting both HF183 and pathogens in recreational creeks [84]. Additionally, it is important to not focus solely on a single fecal source when assessing human health risks, since several studies have indicated that mixtures of fecal sources contribute a much greater risk [85].
Although this study focused on microbial indicators and source tracking, we initially considered environmental parameters such as rainfall to assess potential associations with FIB and MST marker concentrations. However, no significant relationships were observed during the study period, and these data were therefore excluded from the main analysis. This is consistent with prior findings in similar subtropical coastal systems, where rainfall is not always correlated with MST markers [86]. Additionally, while chemical tracers such as nitrate, phosphate, and sulfate can provide further insight into contamination sources, these parameters were not measured due to resource limitations and the study’s microbial focus. Although not formally analyzed, spatial data on sanitary infrastructure—such as the WWTP outfalls shown in Figure 1A—may provide additional context for interpreting contamination patterns and should be further integrated into future studies. Incorporating hydrological data and chemical analyses may help further refine source attribution and improve understanding of how environmental conditions interact with microbial contamination dynamics.

5. Conclusions

In this study, marker- and microbiome-based MST methods were used to identify fecal contamination around Galveston, Texas, which has been identified as a bacterial hotspot by long-term beach monitoring programs. Marker-based results were then used to estimate risk of illness to swimmers for both children and adults using QMRA. Gulls were identified as the primary fecal pollution source by both marker and microbiome-based MST, although QMRA results indicated that the risk of illness was impacted more by the canine fecal source. Although the human fecal source was not detected in high concentrations or determined to be the primary driver of health risks for most samples, the SourceTracker2 program identified the presence of bacterial populations throughout the island as similar to those in treated WWTP effluent samples. This finding raises new questions about the impact of the presence of WWTP effluent on water quality throughout the island. Overall, the combined approach of marker and microbiome-based MST coupled with QMRA provides important insight into water quality in Galveston that can inform future water quality and beach management decisions.

Supplementary Materials

The following supporting information can be downloaded at: https://www.mdpi.com/article/10.3390/w17152310/s1, Figure S1: Enterococci and host-associated molecular marker concentrations in West End, Seawall, and East End zones; Figure S2: Overall probability of illness for each fecal source for adult and children (minimum); Figure S3: Probability of illness associated with each reference pathogen per fecal source for adults and children, assuming the minimum concentration of the MST markers; Figure S4: Overall probability of illness for each fecal source for adult and children (maximum); Figure S5: Probability of illness associated with each reference pathogen per fecal source for adults and children, assuming the maximum concentration of the MST markers; Figure S6: Overall probability of illness for each fecal source for adult and children (distribution), Figure S7: Probability of illness associated with each reference pathogen per fecal source for adults and children, assuming the distribution of the MST markers; Figure S8: Sensitivity analysis of the overall adult human health risk output assuming geomean MST marker concentrations; Figure S9: Sensitivity analysis of the overall child human health risk output assuming geomean MST marker concentrations; Figure S10: Sensitivity analysis of the overall adult human health risk output assuming minimum MST marker concentrations; Figure S11: Sensitivity analysis of the overall child human health risk output assuming minimum MST marker concentrations; Figure S12: Sensitivity analysis of the overall adult human health risk output assuming maximum MST marker concentrations; Figure S13: Sensitivity analysis of the overall child human health risk output assuming maximum MST marker concentrations; Figure S14: Sensitivity analysis of the overall adult human health risk output assuming MST marker concentrations (distribution of all sites); Figure S15: Sensitivity analysis of the overall child human health risk output assuming MST marker concentrations (distribution of all sites); Table S1: Primers, probes, and gBlocks; Table S2: Copy number by marker for individual samples. Values under the LOQ (human: 430, dog: 358, gull: 723, copies/100 mL) were detected but are not accurately quantifiable; Table S3: Median probability of illness from each reference pathogen with the associated fecal source (min, geomean, and max MST marker concentrations at 5 stations); Table S4: Median probability of illness from each reference pathogen with the associated fecal source (across all stations).

Author Contributions

Conceptualization, A.J. and T.G.; methodology, T.G., A.G. and N.C.P.; software, K.A.C., M.S.H., N.C.P., A.G. and V.R.; formal analysis, K.A.C., M.S.H., N.C.P., A.G. and V.R.; investigation, K.A.C.; resources, T.G.; data curation, K.A.C. and N.C.P.; writing—original draft preparation, K.A.C. and A.G.; writing—review and editing, A.G., V.R., N.C.P., M.S.H., G.B., L.F., J.P., A.J. and T.G.; visualization, K.A.C., N.C.P., V.R. and G.B.; supervision, T.G. and A.J.; funding acquisition, J.P. and L.F. All authors have read and agreed to the published version of the manuscript.

Funding

This research was funded by the Texas General Land Office (Contract No. 21-060-025-D274) and USDA NIFA Hatch program (Project 8092-0).

Data Availability Statement

The raw data supporting the conclusions of this article will be made available by the authors on request.

Acknowledgments

We would like to thank John Hamilton of Tideland Grease Trap and Septic Service and Josh Henderson for their assistance with this project.

Conflicts of Interest

The authors declare no conflicts of interest.

Abbreviations

The following abbreviations are used in this manuscript:
MSTMicrobial source tracking
QMRAQuantitative microbial risk assessment
BAVBeach Action Value
TBWTexas Beach Watch
TGLOTexas General Land Office
STVStatistical threshold value
OSSFOn Site Sewer Facilities
WWTPWastewater treatment plant
LOQLimit of quantification
LODLimit of detection
qPCRQuantitative polymerase chain reaction
TIGSSTexas A&M Institute for Genome Science and Society
AICAkaike Information Criterion
QQQuantile-quantile
CDFCumulative distribution plots
PPProbability-probability

References

  1. DeFlorio-Barker, S.; Wing, C.; Jones, R.M.; Dorevitch, S. Estimate of Incidence and Cost of Recreational Waterborne Illness on United States Surface Waters. Environ. Health 2018, 17, 3. [Google Scholar] [CrossRef]
  2. Jennings, W.C.; Chern, E.C.; O’Donohue, D.; Kellogg, M.G.; Boehm, A.B. Frequent Detection of a Human Fecal Indicator in the Urban Ocean: Environmental Drivers and Covariation with Enterococci. Environ. Sci. Process. Impacts 2018, 20, 480–492. [Google Scholar] [CrossRef] [PubMed]
  3. Tomenchok, L.E.; Abdool-Ghany, A.A.; Elmir, S.M.; Gidley, M.L.; Sinigalliano, C.D.; Solo-Gabriele, H.M. Trends in Regional Enterococci Levels at Marine Beaches and Correlations with Environmental, Global Oceanic Changes, Community Populations, and Wastewater Infrastructure. Sci. Total Environ. 2021, 793, 148641. [Google Scholar] [CrossRef] [PubMed]
  4. Nevers, M.B.; Byappanahalli, M.N.; Nakatsu, C.H.; Kinzelman, J.L.; Phanikumar, M.S.; Shively, D.A.; Spoljaric, A.M. Interaction of Bacterial Communities and Indicators of Water Quality in Shoreline Sand, Sediment, and Water of Lake Michigan. Water Res. 2020, 178, 115671. [Google Scholar] [CrossRef]
  5. Anderson, K.L.; Whitlock, J.E.; Harwood, V.J. Persistence and Differential Survival of Fecal Indicator Bacteria in Subtropical Waters and Sediments. Appl. Environ. Microbiol. 2005, 71, 3041–3048. [Google Scholar] [CrossRef] [PubMed]
  6. Ahmed, W.; Hughes, B.; Harwood, V.J. Current Status of Marker Genes of Bacteroides and Related Taxa for Identifying Sewage Pollution in Environmental Waters. Water 2016, 8, 231. [Google Scholar] [CrossRef]
  7. Harwood, V.J.; Staley, C.; Badgley, B.D.; Borges, K.; Korajkic, A. Microbial Source Tracking Markers for Detection of Fecal Contamination in Environmental Waters: Relationships between Pathogens and Human Health Outcomes. FEMS Microbiol. Rev. 2014, 38, 1–40. [Google Scholar] [CrossRef]
  8. Shanks, O.C.; White, K.; Kelty, C.A.; Sivaganesan, M.; Blannon, J.; Meckes, M.; Varma, M.; Haugland, R.A. Performance of PCR-Based Assays Targeting Bacteroidales Genetic Markers of Human Fecal Pollution in Sewage and Fecal Samples. Environ. Sci. Technol. 2010, 44, 6281–6288. [Google Scholar] [CrossRef]
  9. Dick, L.K.; Bernhard, A.E.; Brodeur, T.J.; Santo Domingo, J.W.; Simpson, J.M.; Walters, S.P.; Field, K.G. Host Distributions of Uncultivated Fecal Bacteroidales Bacteria Reveal Genetic Markers for Fecal Source Identification. Appl. Environ. Microbiol. 2005, 71, 3184–3191. [Google Scholar] [CrossRef]
  10. Sinigalliano, C.D.; Fleisher, J.M.; Gidley, M.L.; Solo-Gabriele, H.M.; Shibata, T.; Plano, L.R.W.; Elmir, S.M.; Wanless, D.; Bartkowiak, J.; Boiteau, R.; et al. Traditional and Molecular Analyses for Fecal Indicator Bacteria in Non-Point Source Subtropical Recreational Marine Waters. Water Res. 2010, 44, 3763–3772. [Google Scholar] [CrossRef]
  11. Ervin, J.S.; Van De Werfhorst, L.C.; Murray, J.L.S.; Holden, P.A. Microbial Source Tracking in a Coastal California Watershed Reveals Canines as Controllable Sources of Fecal Contamination. Environ. Sci. Technol. 2014, 48, 9043–9052. [Google Scholar] [CrossRef] [PubMed]
  12. Lee, C.; Marion, J.W.; Lee, J. Development and Application of a Quantitative PCR Assay Targeting Catellicoccus marimammalium for Assessing Gull-Associated Fecal Contamination at Lake Erie Beaches. Sci. Total Environ. 2013, 454–455, 1–8. [Google Scholar] [CrossRef] [PubMed]
  13. Sinigalliano, C.D.; Ervin, J.S.; Van De Werfhorst, L.C.; Badgley, B.D.; Ballesté, E.; Bartkowiak, J.; Boehm, A.B.; Byappanahalli, M.; Goodwin, K.D.; Gourmelon, M.; et al. Multi-Laboratory Evaluations of the Performance of Catellicoccus marimammalium PCR Assays Developed to Target Gull Fecal Sources. Water Res. 2013, 47, 6883–6896. [Google Scholar] [CrossRef] [PubMed]
  14. Knights, D.; Kuczynski, J.; Charlson, E.S.; Zaneveld, J.; Mozer, M.C.; Collman, R.G.; Bushman, F.D.; Knight, R.; Kelley, S.T. Bayesian Community-Wide Culture-Independent Microbial Source Tracking. Nat. Methods 2011, 8, 761–763. [Google Scholar] [CrossRef]
  15. O’Dea, C.; Zhang, Q.; Staley, C.; Masters, N.; Kuballa, A.; Fisher, P.; Veal, C.; Stratton, H.; Sadowsky, M.J.; Ahmed, W.; et al. Compositional and Temporal Stability of Fecal Taxon Libraries for Use with SourceTracker in Sub-Tropical Catchments. Water Res. 2019, 165, 114967. [Google Scholar] [CrossRef]
  16. Ahmed, W.; Staley, C.; Kaiser, T.; Sadowsky, M.J.; Kozak, S.; Beale, D.; Simpson, S. Decay of Sewage-Associated Bacterial Communities in Fresh and Marine Environmental Waters and Sediment. Appl. Microbiol. Biotechnol. 2018, 102, 7159–7170. [Google Scholar] [CrossRef]
  17. Mathai, P.P.; Staley, C.; Sadowsky, M.J. Sequence-Enabled Community-Based Microbial Source Tracking in Surface Waters Using Machine Learning Classification: A Review. J. Microbiol. Methods 2020, 177, 106050. [Google Scholar] [CrossRef]
  18. Haas, C.N.; Rose, J.B.; Gerba, C.P. Quantitative Microbial Risk Assessment; John Wiley & Sons: Hoboken, NJ, USA, 2014; ISBN 978-1-118-91002-3. [Google Scholar]
  19. Boehm, A.B.; Soller, J.A.; Shanks, O.C. Human-Associated Fecal Quantitative Polymerase Chain Reaction Measurements and Simulated Risk of Gastrointestinal Illness in Recreational Waters Contaminated with Raw Sewage. Environ. Sci. Technol. Lett. 2015, 2, 270–275. [Google Scholar] [CrossRef]
  20. Brown, K.I.; Graham, K.E.; Boehm, A.B. Risk-Based Threshold of Gull-Associated Fecal Marker Concentrations for Recreational Water. Environ. Sci. Technol. Lett. 2017, 4, 44–48. [Google Scholar] [CrossRef]
  21. Soller, J.A.; Schoen, M.E.; Varghese, A.; Ichida, A.M.; Boehm, A.B.; Eftim, S.; Ashbolt, N.J.; Ravenscroft, J.E. Human Health Risk Implications of Multiple Sources of Faecal Indicator Bacteria in a Recreational Waterbody. Water Res. 2014, 66, 254–264. [Google Scholar] [CrossRef]
  22. Gitter, A.; Gidley, M.; Mena, K.D.; Ferguson, A.; Sinigalliano, C.; Bonacolta, A.; Solo-Gabriele, H. Integrating Microbial Source Tracking with Quantitative Microbial Risk Assessment to Evaluate Site Specific Risk Based Thresholds at Two South Florida Beaches. Front. Microbiol. 2023, 14, 1210192. [Google Scholar] [CrossRef]
  23. Soller, J.A.; Schoen, M.E.; Bartrand, T.; Ravenscroft, J.E.; Ashbolt, N.J. Estimated Human Health Risks from Exposure to Recreational Waters Impacted by Human and Non-Human Sources of Faecal Contamination. Water Res. 2010, 44, 4674–4691. [Google Scholar] [CrossRef] [PubMed]
  24. Boehm, A.B.; Soller, J.A. Refined Ambient Water Quality Thresholds for Human-Associated Fecal Indicator HF183 for Recreational Waters with and without Co-Occurring Gull Fecal Contamination. Microb. Risk Anal. 2020, 16, 100139. [Google Scholar] [CrossRef]
  25. Powers, N.C.; Pinchback, J.; Flores, L.; Huang, Y.; Wetz, M.S.; Turner, J.W. Long-Term Water Quality Analysis Reveals Correlation between Bacterial Pollution and Sea Level Rise in the Northwestern Gulf of Mexico. Mar. Pollut. Bull. 2021, 166, 112231. [Google Scholar] [CrossRef] [PubMed]
  26. USEPA. Method 1696: Characterization of Human Fecal Pollution in Water by HF183/BacR287 TaqMan® Quantitative Polymerase Chain Reaction (qPCR) Assay; USEPA: Washington, DC, USA, 2019. [Google Scholar]
  27. Dick, L.K.; Simonich, M.; Field, K. Microplate Subtractive Hybridization To Enrich for Bacteroidales Genetic Markers for Fecal Source Identification|Applied and Environmental Microbiology. Available online: https://journals.asm.org/doi/full/10.1128/aem.71.6.3179-3183.2005 (accessed on 21 May 2025).
  28. Lee, L. NADA: Nondetects and Data Analysis for Environmental Data. R Package Version 1.6-1.1. Available online: https://CRAN.R-Project.Org/package=NADA (accessed on 1 April 2024).
  29. Claesson, M.J.; Wang, Q.; O’Sullivan, O.; Greene-Diniz, R.; Cole, J.R.; Ross, R.P.; O’Toole, P.W. Comparison of Two Next-Generation Sequencing Technologies for Resolving Highly Complex Microbiota Composition Using Tandem Variable 16S rRNA Gene Regions. Nucleic Acids Res. 2010, 38, e200. [Google Scholar] [CrossRef]
  30. Bolyen, E.; Rideout, J.R.; Dillon, M.R.; Bokulich, N.A.; Abnet, C.C.; Al-Ghalith, G.A.; Alexander, H.; Alm, E.J.; Arumugam, M.; Asnicar, F.; et al. Reproducible, Interactive, Scalable and Extensible Microbiome Data Science Using QIIME 2. Nat. Biotechnol. 2019, 37, 852–857. [Google Scholar] [CrossRef]
  31. Callahan, B.J.; McMurdie, P.J.; Rosen, M.J.; Han, A.W.; Johnson, A.J.A.; Holmes, S.P. DADA2: High-Resolution Sample Inference from Illumina Amplicon Data. Nat. Methods 2016, 13, 581–583. [Google Scholar] [CrossRef]
  32. USEPA. Recreational Water Quality Criteria; USEPA: Washington, DC, USA, 2012. [Google Scholar]
  33. Delignette-Muller, M.L.; Dutang, C. Fitdistrplus: An R Package for Fitting Distributions. J. Stat. Softw. 2015, 64, 1–34. [Google Scholar] [CrossRef]
  34. Schoen, M.E.; Ashbolt, N.J.; Jahne, M.A.; Garland, J. Risk-Based Enteric Pathogen Reduction Targets for Non-Potable and Direct Potable Use of Roof Runoff, Stormwater, and Greywater. Microb. Risk Anal. 2017, 5, 32–43. [Google Scholar] [CrossRef]
  35. Millard, S.; Kowarik, A. EnvStats: Package for Environmental Statistics, Including US EPA Guidance. 2023. Available online: https://cran.r-project.org/web/packages/EnvStats/index.html (accessed on 23 September 2023).
  36. USEPA. Quantitative Microbial Risk Assessment to Estimate Illness in Freshwater Impacted by Agricultural Animal Sources of Fecal Contamination; USEPA: Washington, DC, USA, 2010. [Google Scholar]
  37. Brown, K.I.; Graham, K.E.; Soller, J.A.; Boehm, A.B. Estimating the Probability of Illness Due to Swimming in Recreational Water with a Mixture of Human- and Gull-Associated Microbial Source Tracking Markers. Environ. Sci. Process. Impacts 2017, 19, 1528–1541. [Google Scholar] [CrossRef]
  38. Schoen, M.E.; Ashbolt, N.J. Assessing Pathogen Risk to Swimmers at Non-Sewage Impacted Recreational Beaches. Environ. Sci. Technol. 2010, 44, 2286–2291. [Google Scholar] [CrossRef] [PubMed]
  39. Campagnolo, E.R.; Philipp, L.M.; Long, J.M.; Hanshaw, N.L. Pet-Associated Campylobacteriosis: A Persisting Public Health Concern. Zoonoses Public Health 2018, 65, 304–311. [Google Scholar] [CrossRef] [PubMed]
  40. Gras, L.M.; Smid, J.H.; Wagenaar, J.A.; Koene, M.G.J.; Havelaar, A.H.; Friesema, I.H.M.; French, N.P.; Flemming, C.; Galson, J.D.; Graziani, C.; et al. Increased Risk for Campylobacter Jejuni and C. Coli Infection of Pet Origin in Dog Owners and Evidence for Genetic Association between Strains Causing Infection in Humans and Their Pets. Epidemiol. Infect. 2013, 141, 2526–2535. [Google Scholar] [CrossRef] [PubMed]
  41. Acke, E. Campylobacteriosis in Dogs and Cats: A Review. N. Z. Vet. J. 2018, 66, 221–228. [Google Scholar] [CrossRef]
  42. DeFlorio-Barker, S.; Arnold, B.F.; Sams, E.A.; Dufour, A.P.; Colford, J.M.; Weisberg, S.B.; Schiff, K.C.; Wade, T.J. Child Environmental Exposures to Water and Sand at the Beach: Findings from Studies of over 68,000 Subjects at 12 Beaches. J. Expo. Sci. Environ. Epidemiol. 2018, 28, 93–100. [Google Scholar] [CrossRef]
  43. Li, D.; Van De Werfhorst, L.C.; Steets, B.; Ervin, J.; Murray, J.L.S.; Smith, J.; Holden, P.A. Assessing Multiple Fecal Sources to Surf Zone Waters of Two Recreational Beaches by Bacterial Community Analysis. Water Res. 2022, 221, 118781. [Google Scholar] [CrossRef]
  44. Chaban, B.; Ngeleka, M.; Hill, J.E. Detection and Quantification of 14 Campylobacter Species in Pet Dogs Reveals an Increase in Species Richness in Feces of Diarrheic Animals. BMC Microbiol. 2010, 10, 73. [Google Scholar] [CrossRef]
  45. Lévesque, B.; Brousseau, P.; Bernier, F.; Dewailly, É.; Joly, J. Study of the Bacterial Content of Ring-Billed Gull Droppings in Relation to Recreational Water Quality. Water Res. 2000, 34, 1089–1096. [Google Scholar] [CrossRef]
  46. Koivunen, J.; Siitonen, A.; Heinonen-Tanski, H. Elimination of Enteric Bacteria in Biological–Chemical Wastewater Treatment and Tertiary Filtration Units. Water Res. 2003, 37, 690–698. [Google Scholar] [CrossRef]
  47. Lemarchand, K.; Lebaron, P. Occurrence of Salmonella Spp. and Cryptosporidium Spp. in a French Coastal Watershed: Relationship with Fecal Indicators. FEMS Microbiol. Lett. 2003, 218, 203–209. [Google Scholar] [CrossRef]
  48. Stampi, S.; Varoli, O.; Zanetti, F.; De Luca, G. Arcobacter cryaerophilus and Thermophilic Campylobacters in a Sewage Treatment Plant in Italy: Two Secondary Treatments Compared. Epidemiol. Infect. 1993, 110, 633–639. [Google Scholar] [CrossRef]
  49. García-Aljaro, C.; Bonjoch, X.; Blanch, A.R. Combined Use of an Immunomagnetic Separation Method and Immunoblotting for the Enumeration and Isolation of Escherichia Coli O157 in Wastewaters. J. Appl. Microbiol. 2005, 98, 589–597. [Google Scholar] [CrossRef] [PubMed]
  50. Harwood, V.J.; Levine, A.D.; Scott, T.M.; Chivukula, V.; Lukasik, J.; Farrah, S.R.; Rose, J.B. Validity of the Indicator Organism Paradigm for Pathogen Reduction in Reclaimed Water and Public Health Protection. Appl. Environ. Microbiol. 2005, 71, 3163–3170. [Google Scholar] [CrossRef] [PubMed]
  51. Crockett, C.S. The Role of Wastewater Treatment in Protecting Water Supplies Against Emerging Pathogens. Water Environ. Res. 2007, 79, 221–232. [Google Scholar] [CrossRef] [PubMed]
  52. Nasser, A.M. Removal of Cryptosporidium by Wastewater Treatment Processes: A Review. J. Water Health 2015, 14, 1–13. [Google Scholar] [CrossRef]
  53. Yang, J.; Schneider, O.D.; Jjemba, P.K.; Lechevallier, M.W. Microbial Risk Modeling for Main Breaks. J. Am. Water Work. Assoc. 2015, 107, E97–E108. [Google Scholar] [CrossRef]
  54. Kitajima, M.; Haramoto, E.; Iker, B.C.; Gerba, C.P. Occurrence of Cryptosporidium, Giardia, and Cyclospora in Influent and Effluent Water at Wastewater Treatment Plants in Arizona. Sci. Total Environ. 2014, 484, 129–136. [Google Scholar] [CrossRef]
  55. Eftim, S.E.; Hong, T.; Soller, J.; Boehm, A.; Warren, I.; Ichida, A.; Nappier, S.P. Occurrence of Norovirus in Raw Sewage—A Systematic Literature Review and Meta-Analysis. Water Res. 2017, 111, 366–374. [Google Scholar] [CrossRef]
  56. Hurst, C.J.; McClellan, K.A.; Benton, W.H. Comparison of Cytopathogenicity, Immunofluorescence and In Situ DNA Hybridization as Methods for the Detection of Adenoviruses. Water Res. 1988, 22, 1547–1552. [Google Scholar] [CrossRef]
  57. Hewitt, J.; Leonard, M.; Greening, G.E.; Lewis, G.D. Influence of Wastewater Treatment Process and the Population Size on Human Virus Profiles in Wastewater. Water Res. 2011, 45, 6267–6276. [Google Scholar] [CrossRef]
  58. Soller, J.A.; Schoen, M.; Steele, J.A.; Griffith, J.F.; Schiff, K.C. Incidence of Gastrointestinal Illness Following Wet Weather Recreational Exposures: Harmonization of Quantitative Microbial Risk Assessment with an Epidemiologic Investigation of Surfers. Water Res. 2017, 121, 280–289. [Google Scholar] [CrossRef]
  59. Fenlon, D.R. A Comparison of Salmonella Serotypes Found in the Faeces of Gulls Feeding at a Sewage Works with Serotypes Present in the Sewage. Epidemiol. Infect. 1983, 91, 47–52. [Google Scholar] [CrossRef]
  60. Gitter, A.; Mena, K.D.; Wagner, K.L.; Boellstorff, D.E.; Borel, K.E.; Gregory, L.F.; Gentry, T.J.; Karthikeyan, R. Human Health Risks Associated with Recreational Waters: Preliminary Approach of Integrating Quantitative Microbial Risk Assessment with Microbial Source Tracking. Water 2020, 12, 327. [Google Scholar] [CrossRef]
  61. Regli, S.; Rose, J.B.; Haas, C.N.; Gerba, C.P. Modeling the Risk From Giardia and Viruses in Drinking Water. J. Am. Water Work. Assoc. 1991, 83, 76–84. [Google Scholar] [CrossRef]
  62. Teunis, P.F.M.; Nagelkerke, N.J.D.; Haas, C.N. Dose Response Models For Infectious Gastroenteritis. Risk Anal. 1999, 19, 1251–1260. [Google Scholar] [CrossRef] [PubMed]
  63. Medema, G.J.; Teunis, P.F.M.; Havelaar, A.H.; Haas, C.N. Assessment of the Dose-Response Relationship of Campylobacter jejuni. Int. J. Food Microbiol. 1996, 30, 101–111. [Google Scholar] [CrossRef] [PubMed]
  64. Teunis, P.F.M.; Ogden, I.D.; Strachan, N.J.C. Hierarchical Dose Response of E. Coli O157:H7 from Human Outbreaks Incorporating Heterogeneity in Exposure. Epidemiol. Infect. 2008, 136, 761–770. [Google Scholar] [CrossRef]
  65. USEPA National Primary Drinking Water Regulations: Long Term 2 Enhanced Surface Water Treatment Rule 2006. Available online: https://www.regulations.gov/document/EPA-HQ-OW-2002-0039-0720 (accessed on 18 July 2025).
  66. Rose, J.B.; Gerba, C.P. Use of Risk Assessment for Development of Microbial Standards. Water Sci. Technol. 1991, 24, 29–34. [Google Scholar] [CrossRef]
  67. Eisenberg, J.N.; Seto, E.Y.W.; Olivieri, A.W.; Spear, R.C. Quantifying Water Pathogen Risk in an Epidemiological Framework. Risk Anal. 1996, 16, 549–563. [Google Scholar] [CrossRef]
  68. Messner, M.J.; Berger, P.; Nappier, S.P. Fractional Poisson—A Simple Dose-Response Model for Human Norovirus. Risk Anal. 2014, 34, 1820–1829. [Google Scholar] [CrossRef]
  69. Van Abel, N.; Schoen, M.E.; Kissel, J.C.; Meschke, J.S. Comparison of Risk Predicted by Multiple Norovirus Dose–Response Models and Implications for Quantitative Microbial Risk Assessment. Risk Anal. 2017, 37, 245–264. [Google Scholar] [CrossRef]
  70. Couch, R.B.; Knight, V.; Douglas, R.G.; Black, S.H.; Hamory, B.H. The Minimal Infectious Dose of Adenovirus Type 4; the Case for Natural Transmission by Viral Aerosol. Trans. Am. Clin. Climatol. Assoc. 1969, 80, 205–211. [Google Scholar]
  71. Crabtree, K.D.; Gerba, C.P.; Rose, J.B.; Haas, C.N. Waterborne Adenovirus: A Risk Assessment. Water Sci. Technol. 1997, 35, 1–6. [Google Scholar] [CrossRef]
  72. Brown, K.I.; Boehm, A.B. Comparative Decay of Catellicoccus marimmalium and Enterococci in Beach Sand and Seawater. Water Res. 2015, 83, 377–384. [Google Scholar] [CrossRef]
  73. Dhar, D.A.; Vadde, K.K.; Narimani, R.; Murgulet, D.; Felix, J.D.; Matta, A.; Pinchback, J.; Kapoor, V. Occurrence of Fecal Indicator Bacteria and Microbial Source Tracking Markers along the Texas Gulf Coast Adjoining Two Barrier Islands. Sci. Total Environ. 2025, 975, 179323. [Google Scholar] [CrossRef] [PubMed]
  74. Sefcik, K.; Speshock, J.; Brady, S.; Meik, J.M.; Brady, J.A. Tracking the Culprits: Microbial Source Tracking Uncovers Elevated Fecal Indicators along the Texas Coast. Adv. Microbiol. 2025, 15, 217–231. [Google Scholar] [CrossRef]
  75. Li, D.; Van De Werfhorst, L.C.; Steets, B.; Ervin, J.; Murray, J.L.S.; Devarajan, N.; Holden, P.A. Bather Shedding as a Source of Human Fecal Markers to a Recreational Beach. Front. Microbiol. 2021, 12, 673190. [Google Scholar] [CrossRef] [PubMed]
  76. Gerba, C.P. Assessment of Enteric Pathogen Shedding by Bathers during Recreational Activity and Its Impact on Water Quality. Quant. Microbiol. 2000, 2, 55–68. [Google Scholar] [CrossRef]
  77. Elmir, S.M.; Shibata, T.; Solo-Gabriele, H.M.; Sinigalliano, C.D.; Gidley, M.L.; Miller, G.; Plano, L.R.W.; Kish, J.; Withum, K.; Fleming, L.E. Quantitative Evaluation of Enterococci and Bacteroidales Released by Adults and Toddlers in Marine Water. Water Res. 2009, 43, 4610–4616. [Google Scholar] [CrossRef]
  78. Henry, R.; Schang, C.; Coutts, S.; Kolotelo, P.; Prosser, T.; Crosbie, N.; Grant, T.; Cottam, D.; O’Brien, P.; Deletic, A.; et al. Into the Deep: Evaluation of SourceTracker for Assessment of Faecal Contamination of Coastal Waters. Water Res. 2016, 93, 242–253. [Google Scholar] [CrossRef]
  79. Zimmer-Faust, A.G.; Steele, J.A.; Xiong, X.; Staley, C.; Griffith, M.; Sadowsky, M.J.; Diaz, M.; Griffith, J.F. A Combined Digital PCR and Next Generation DNA-Sequencing Based Approach for Tracking Nearshore Pollutant Dynamics Along the Southwest United States/Mexico Border. Front. Microbiol. 2021, 12, 674214. [Google Scholar] [CrossRef]
  80. Lobos, A.E.; Brandt, A.M.; Gallard-Góngora, J.F.; Korde, R.; Brodrick, E.; Harwood, V.J. Persistence of Sewage-Associated Genetic Markers in Advanced and Conventional Treated Recycled Water: Implications for Microbial Source Tracking in Surface Waters. mBio 2024, 15, e00655-24. [Google Scholar] [CrossRef]
  81. Locas, A.; Demers, J.; Payment, P. Evaluation of Photoreactivation of Escherichia Coli and Enterococci after UV Disinfection of Municipal Wastewater. Can. J. Microbiol. 2008, 54, 971–975. [Google Scholar] [CrossRef] [PubMed]
  82. Dragoni-Rosado, J.J.; Tavárez-Hernández, G.; González-Mederos, A.; Pérez-Matos, A.E. Evaluation of Photoreactivation and Dark Repair of Total and Fecal Coliforms and Enterococci in Wastewater Treated with Ultraviolet Light. Am. J. Water Resour. 2022, 10, 54–58. [Google Scholar] [CrossRef]
  83. McKee, B.A.; Molina, M.; Cyterski, M.; Couch, A. Microbial Source Tracking (MST) in Chattahoochee River National Recreation Area: Seasonal and Precipitation Trends in MST Marker Concentrations, and Associations with E. coli Levels, Pathogenic Marker Presence, and Land Use. Water Res. 2020, 171, 115435. [Google Scholar] [CrossRef] [PubMed]
  84. Skiendzielewski, K.; Burch, T.; Stokdyk, J.; McGinnis, S.; McLoughlin, S.; Firnstahl, A.; Spencer, S.; Borchardt, M.; Murphy, H.M. Two Risk Assessments: Evaluating the Use of Indicator HF183 Bacteroides versus Pathogen Measurements for Modelling Recreational Illness Risks in an Urban Watershed. Water Res. 2024, 259, 121852. [Google Scholar] [CrossRef]
  85. Burch, T.R.; Stokdyk, J.P.; Firnstahl, A.D.; Opelt, S.A.; Cook, R.M.; Heffron, J.A.; Brown, A.; Hruby, C.; Borchardt, M.A. Quantitative Microbial Risk Assessment with Microbial Source Tracking for Mixed Fecal Sources Contaminating Recreational River Waters, Iowa, USA. ACS EST Water 2024, 4, 2789–2802. [Google Scholar] [CrossRef]
  86. Powers, N.C.; Wallgren, H.R.; Marbach, S.; Turner, J.W. Relationship between Rainfall, Fecal Pollution, Antimicrobial Resistance, and Microbial Diversity in an Urbanized Subtropical Bay. Appl. Environ. Microbiol. 2020, 86, e01229-20. [Google Scholar] [CrossRef]
Figure 1. (A) Texas Beach Watch sample collection stations and wastewater treatment plant outfalls. Stations present for specific markers: (B) gull, (C) human, and (D) dog.
Water 17 02310 g001
Figure 2. Microbiome-based microbial source tracking results for Galveston, TX, USA. (A) Source percentages for the West End sites; top row = large source contributors and bottom row = smaller source contributors. (B) Source percentages for the Seawall and East End sites; top row = large source contributors and bottom row = smaller source contributors.
Water 17 02310 g002
Figure 3. Overall probability of illness for each fecal source for adult and children (geometric mean). The black box plots represent risk to adults and the gray box plots represent risk to children. The U.S. EPA risk threshold of 32 illnesses per 1000 recreators is represented by the dashed red line.
Water 17 02310 g003
Figure 4. Probability of illness associated with each reference pathogen per fecal source for adults and children, assuming the geometric mean of the MST markers. The U.S. EPA risk threshold of 32 illnesses per 1000 recreators is represented by the dashed red line.
Water 17 02310 g004
Table 1. Samples from July and August used in SourceTracker2 analysis.
NumberStationDate CollectedEnterococci Result (MPN/100 mL)
1GAL00131 August 2022496
2GAL00331 August 2022512
3GAL01317 August 2022161
4GAL01424 August 2022295
5GAL01429 August 2022288
6GAL02124 August 2022350
7GAL02324 August 2022193
8GAL02329 August 2022311
9GAL02525 August 20229210
10GAL02624 August 20221020
11GAL02629 August 2022331
12GAL0274 July 2022122
13GAL02724 August 20221470
14GAL02729 August 2022206
15GAL02824 August 20221240
16GAL02829 August 2022243
17GAL03024 August 20222590
18GAL03029 August 2022399
19GAL03224 August 202214,100
20GAL03226 August 2022459
21GAL03229 August 2022345
22 *GAL03214 September 202230
23GAL03512 July 2022148
24GAL03726 July 2022108
25GAL03723 August 2022309
26GAL04423 August 2022122
27GAL04425 August 2022107
28GAL04429 August 2022351
29GAL04523 August 2022132
30GAL04529 August 2022404
31GAL04623 August 2022135
32GAL04625 August 2022109
33GAL04629 August 2022332
34GAL04723 August 2022108
35GAL04923 August 2022132
36GAL05331 August 2022106
37GAL05523 August 2022108
38GAL05531 August 2022138
* Used as a reference for station GAL032 with low enterococci value.
Table 2. Model parameters and concentrations used in QMRA.
ParameterUnitsConcentrationSource
HF183 measured in the environmentCopies/100 mLDistribution: (0, 383.43, 0.12) aEnvironmental data
Geometric mean: 131.50
Maximum: 892.36
Minimum: 46.72
LeeSeaGull in environmentCopies/100 mLDistribution: (0, 39,761.29, 0.10) aEnvironmental data
Geometric mean: 12,248.21
Maximum: 47,713.34
Minimum: 2125.37
DogBact in environmentCopies/100 mLDistribution: (3558.99, 34,528.73) bEnvironmental data
Geometric mean: 1828.64
Maximum: 3692.74
Minimum: 1390.84
HF183 in human sewageCopies/mL(5.21, 0.57) c[8]
LeeSeaGull in gull wasteCopies/g(0, 8.7, 8.3) d[20]
DogBact marker in dog wasteCopies/g(5, 9) e[11]
Campylobacter in dog fecesOrganisms/g(3, 8) e[44]
Campylobacter in gull fecesCFU/g(3.3, 6) e[45]
Salmonella in gull fecesCFU/g(2.3, 9.0) e[45]
Salmonella in sewageCFU/L(0.5, 5) e[46,47]
Campylobacter in sewageMPN/L(2.9, 4.6) e[48]
E. coli O157:H7 in sewageCFU/L(−1, 3.3) e,f[49]
Cryptosporidium in sewageoocysts/L(−0.52, 3.7) e[34,50,51,52,53]
Giardia in sewagecysts/L(0.51, 4.2) e[50,54]
Norovirus in sewagecopy/L(4.7, 1.5) c[55]
Adenovirus in sewageIU/L(1.75, 3.84) e[56,57,58]
Volume water ingested (swimming)Adults (mL)9, 64 g,j[42]
Children (mL)36, 150 g,k[42]
Fraction of pathogenic speciesGull0.01–0.4 h[38,59]
Sewage1 iAssumed
Dog0.02–0.1 h[40]
a Gamma distribution (location, scale, shape); b lognormal distribution (mean, stand deviation); c log10-normal distribution (mean, standard deviation); d log10-weibull distribution (location, scale, shape); e log10-uniform distribution (minimum, maximum); f the lower range was not detected and −1 is used as a lower bound for E. coli O157:H7; g normal distribution (mean, 90th percentile); h uniform distribution (minimum, maximum); i point estimate; j ingestion value for adults age 35 and over recreating in marine water; k ingestion values for children age 6–12 recreating in marine water.
Table 3. Dose-response relationship and morbidities for each reference pathogen.
PathogenProbability of InfectionMorbidity RatioReference
Salmonella spp. 1 ( 1 + d o s e / 2884 ) 0.3126 0.17–0.4 a[18,62]
Campylobacter 1 ( 1 + d o s e / 7.59 ) 0.145 0.1–0.6 a[63]
E. coli 0157:H7 1 ( 1 + d o s e / 48.8 ) 0.248 0.2–0.6 a[64]
Cryptosporidium 1 e x p ( 0.09 × d o s e ) 0.3–0.7 a[65]
Giardia 1 e x p ( 0.01982 × d o s e ) 0.2–0.7 a[66,67]
Norovirus 0.72 × ( 1 e x p ( d o s e / 1 ) )  c0.3–0.8 a[68,69]
Adenovirus 1 e x p ( 0.4172 × d o s e ) 0.5 b[70,71]
a Uniform distribution (minimum, maximum); b point estimate; c Full particle disaggregation is assumed with μ = 1.
Disclaimer/Publisher’s Note: The statements, opinions and data contained in all publications are solely those of the individual author(s) and contributor(s) and not of MDPI and/or the editor(s). MDPI and/or the editor(s) disclaim responsibility for any injury to people or property resulting from any ideas, methods, instructions or products referred to in the content.

