


Impact Analysis of Inter-Basin Water Transfer on Water Shortage Risk in the Baiyangdian Area


Abstract
1. Introduction
2. Materials and Methods
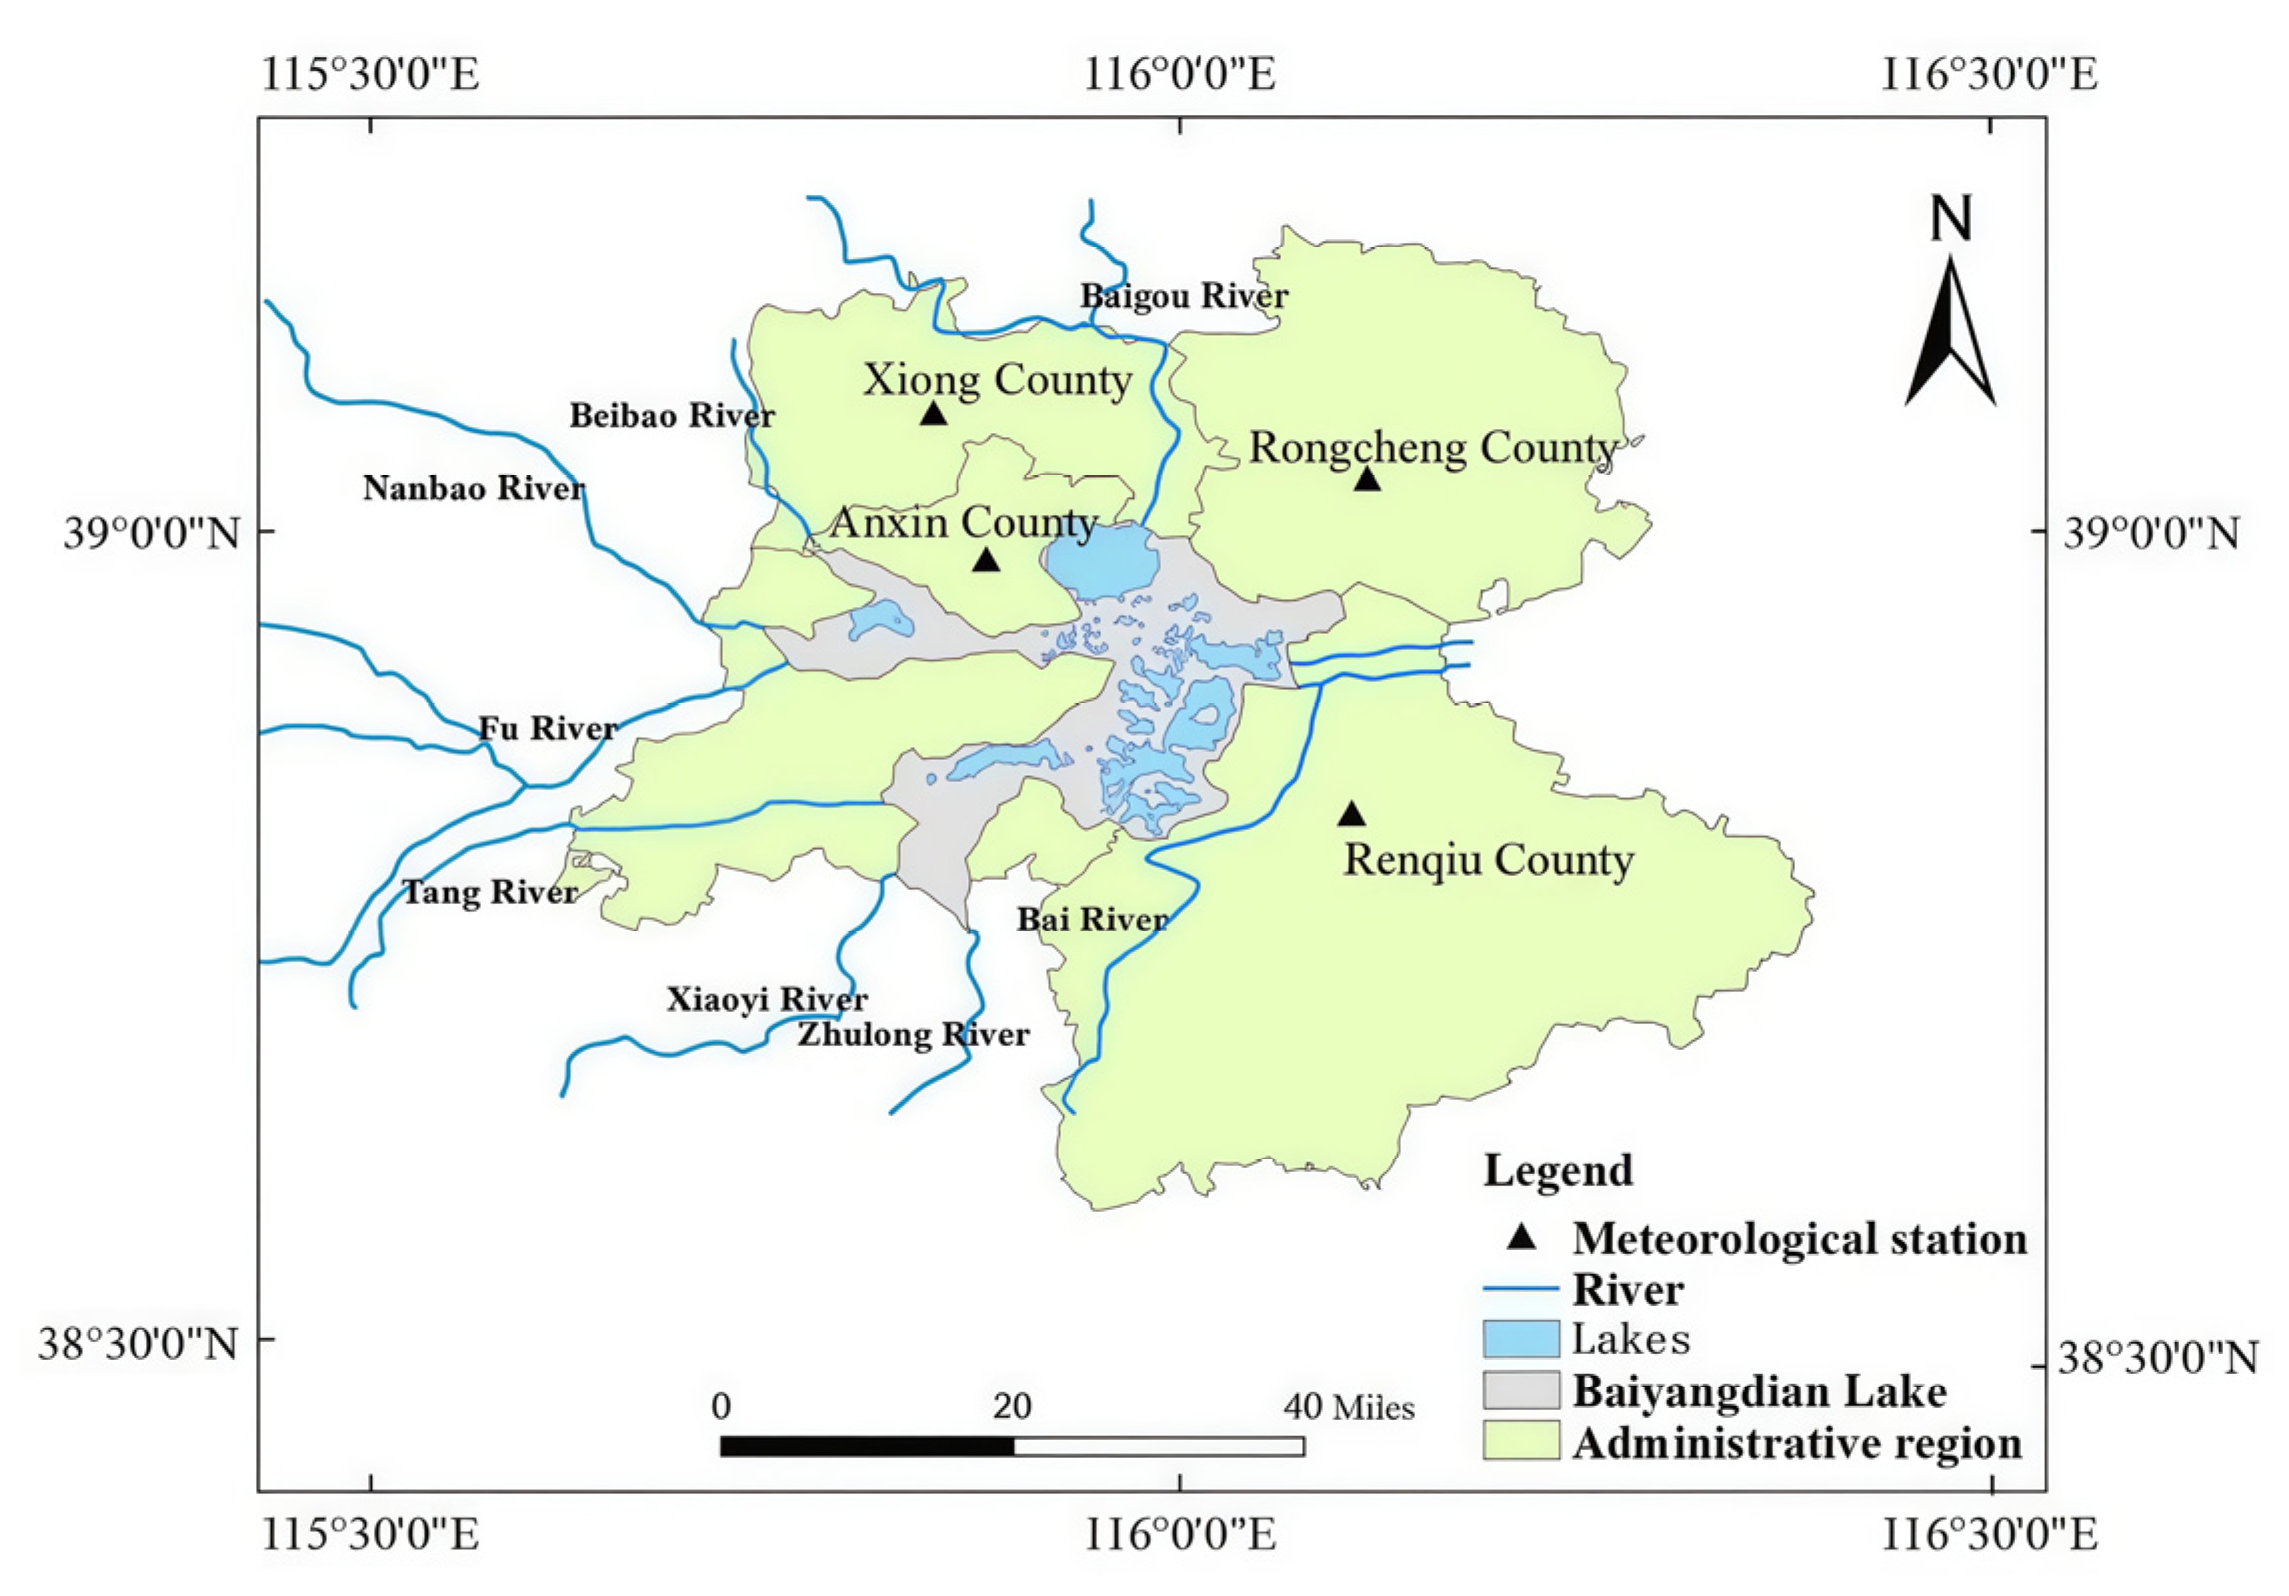
2.1. Study Area
2.2. Data Source
2.3. Copula Function
2.4. Water Balance Formula
3. Results and Discussions
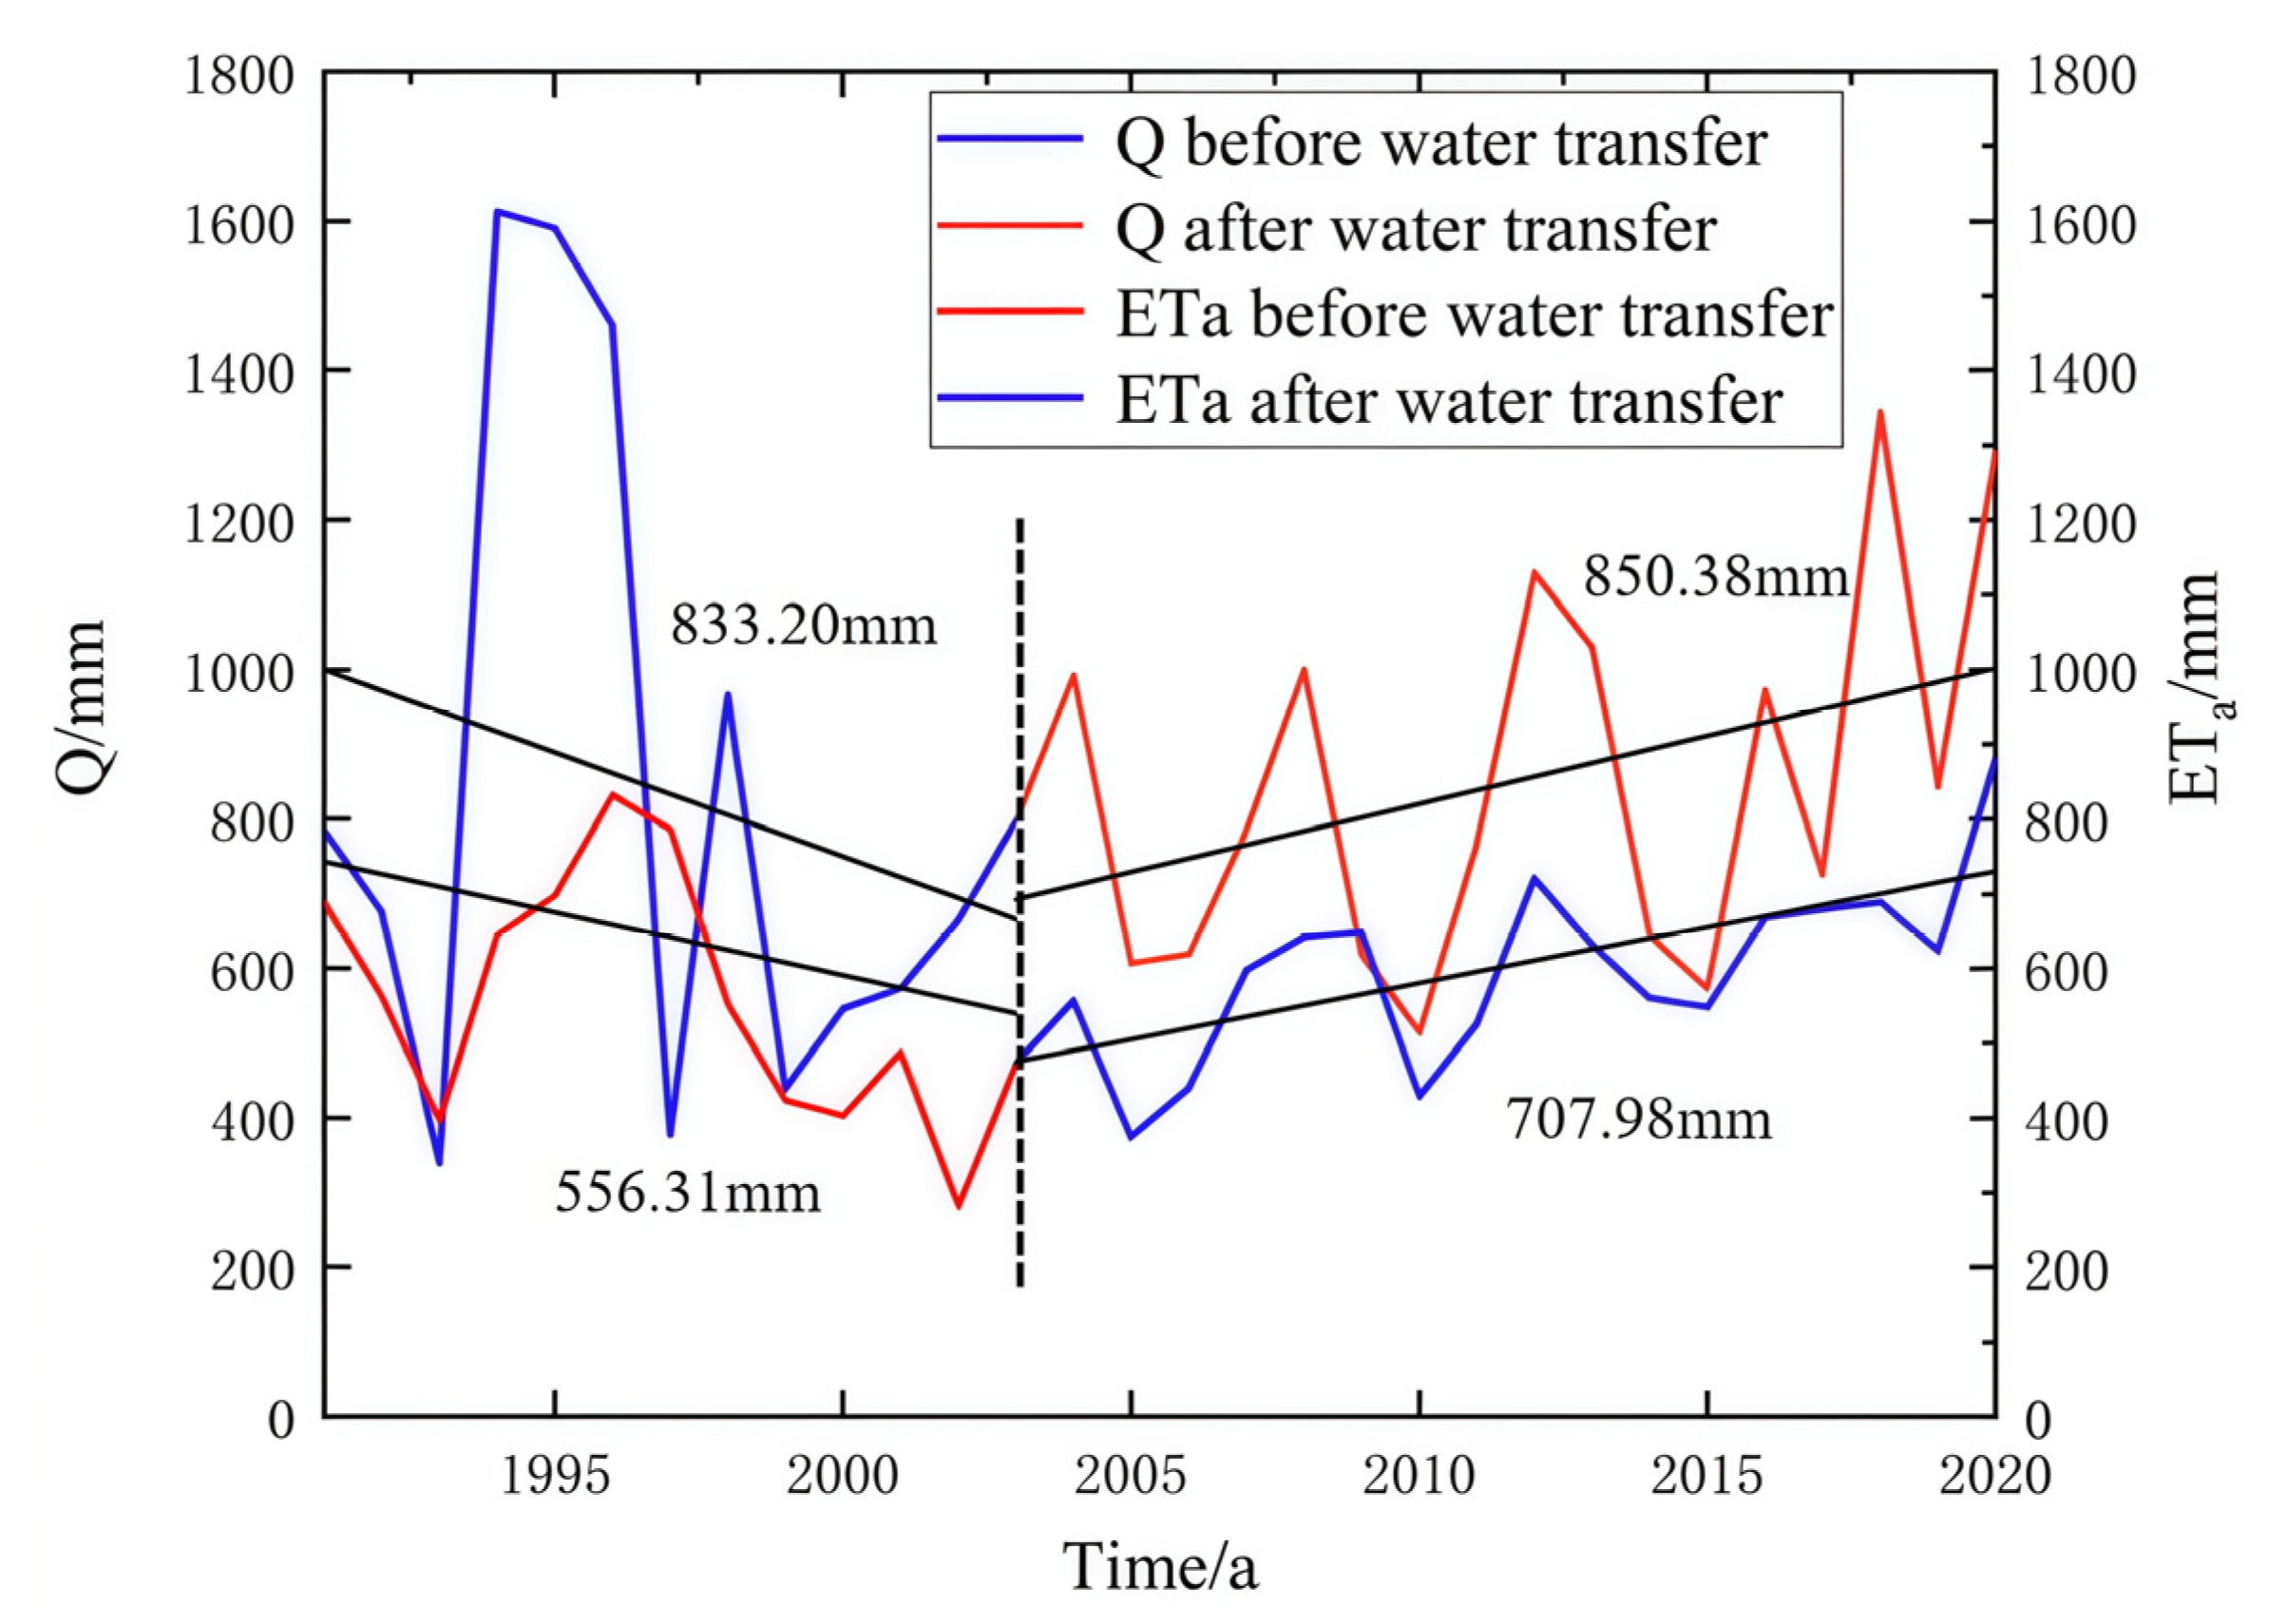
3.1. Changes in Underlying Surface Water Supply and ETa
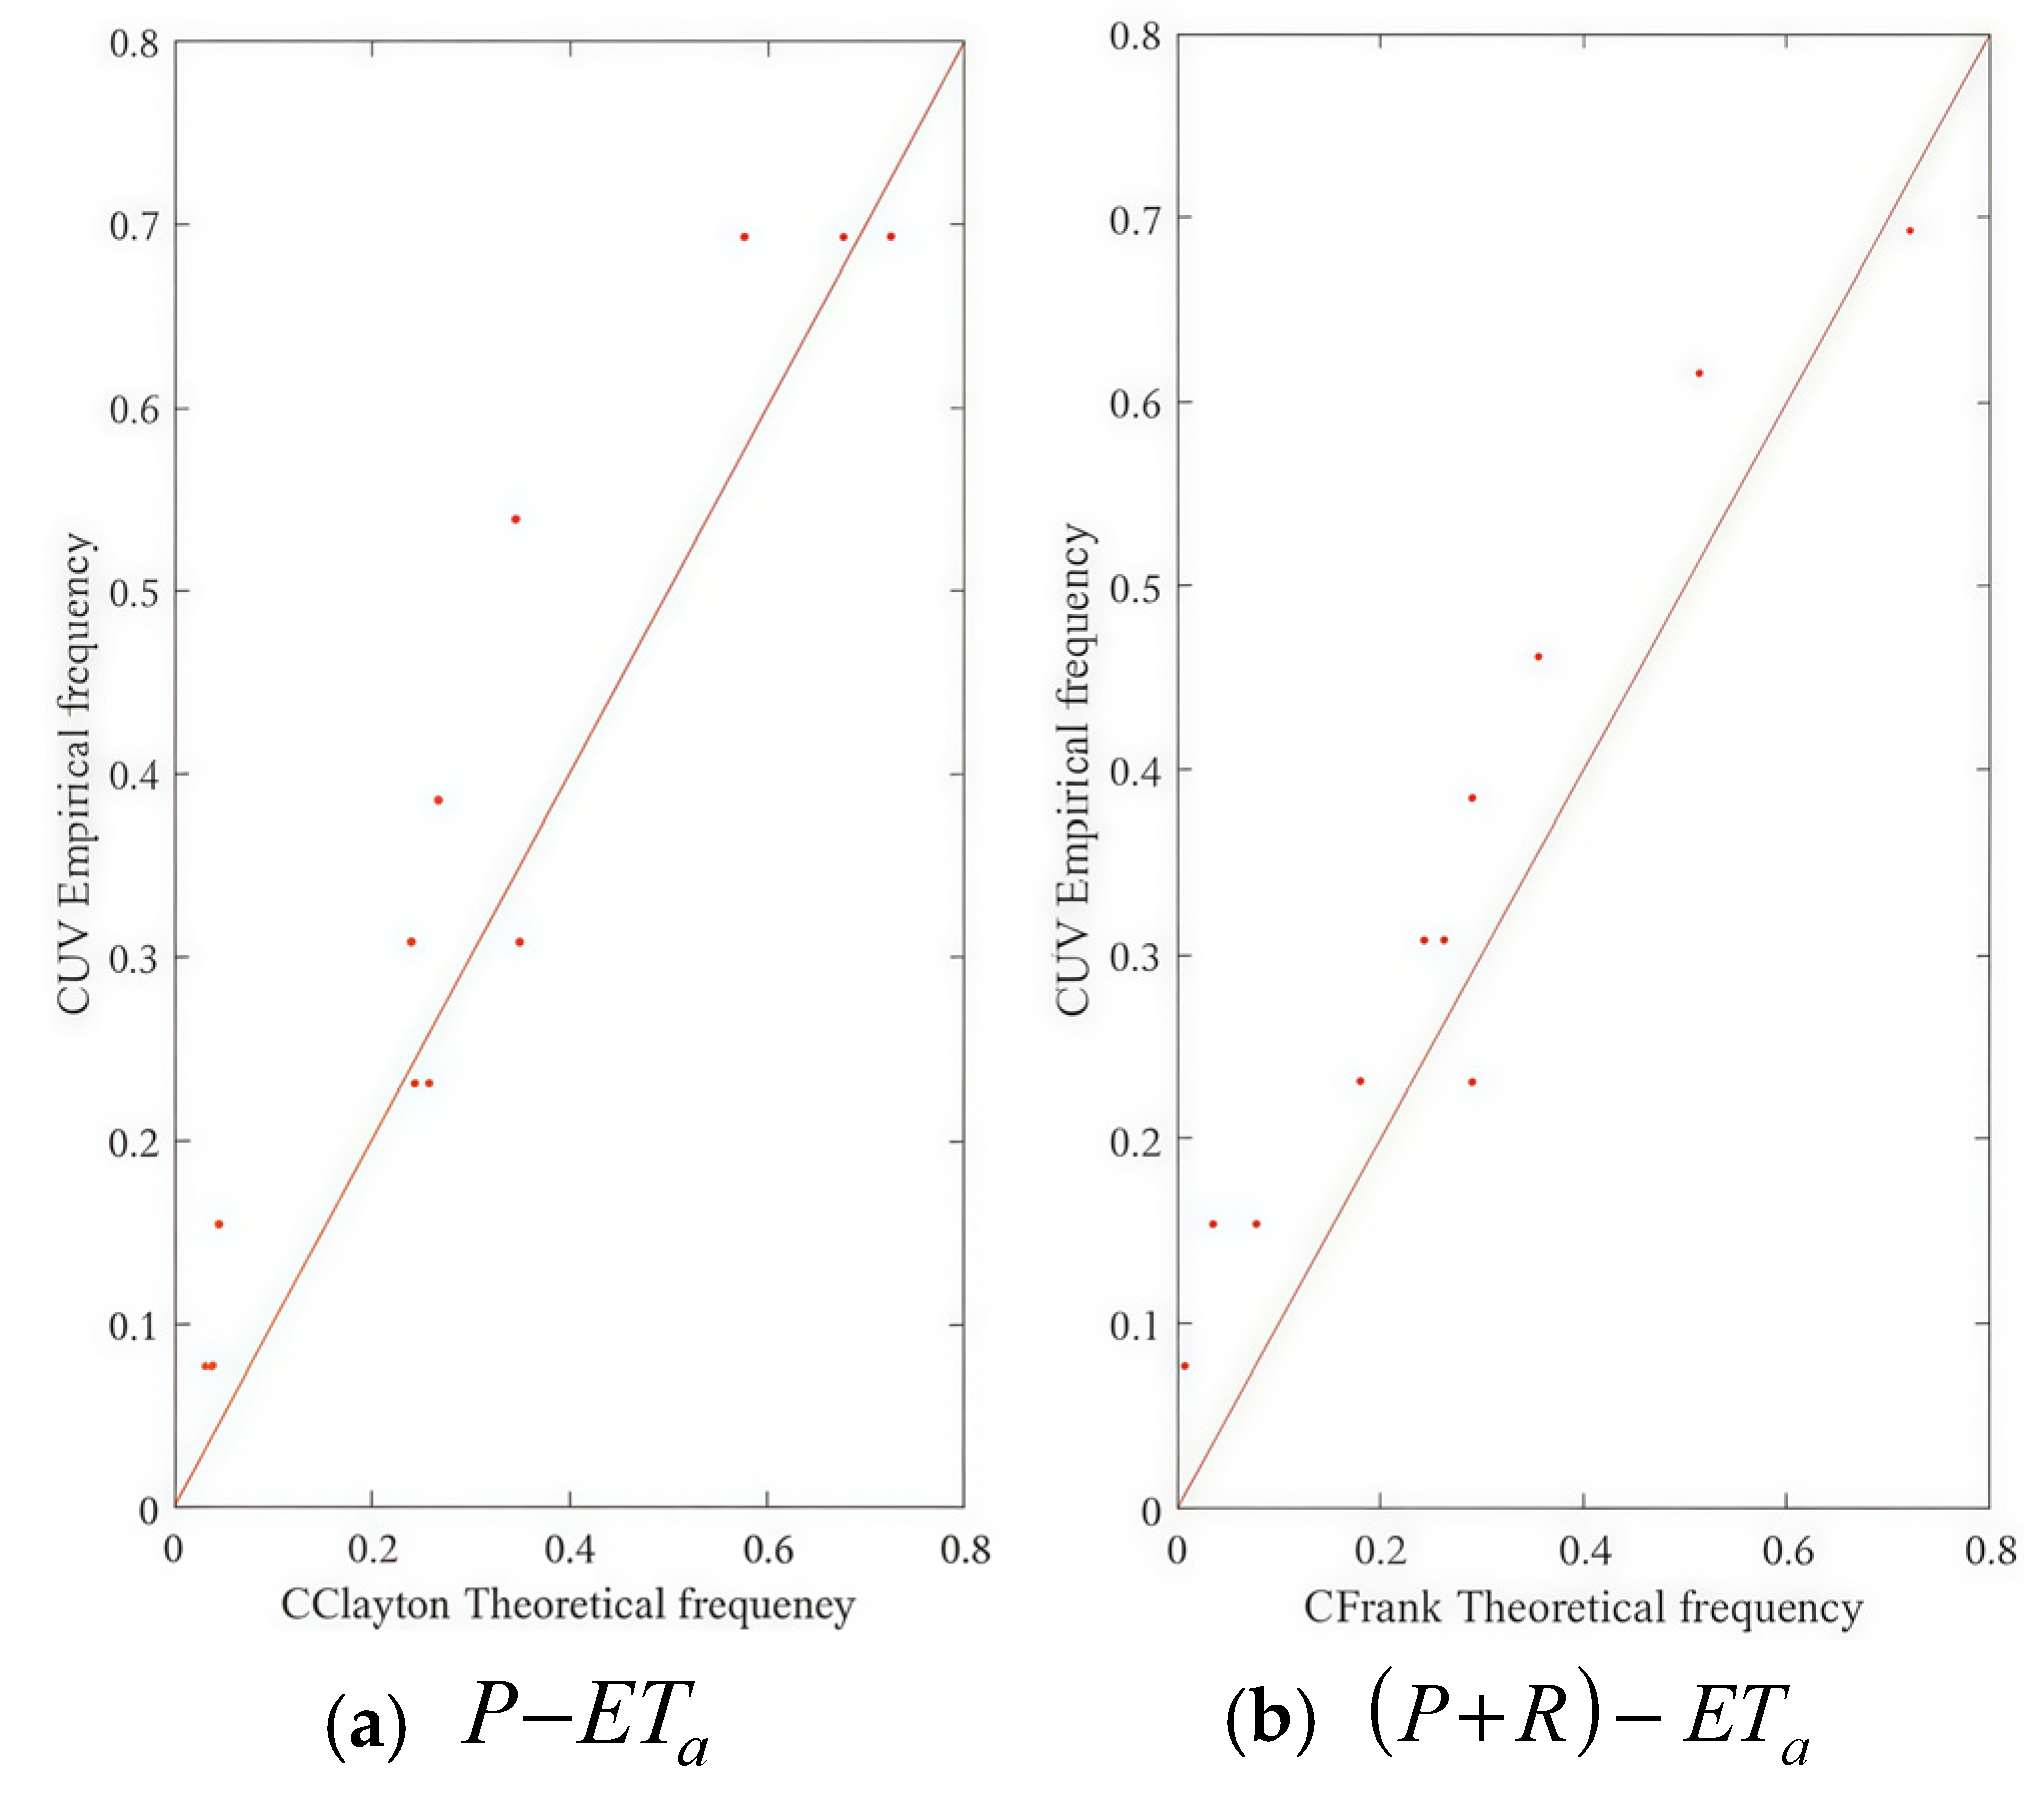
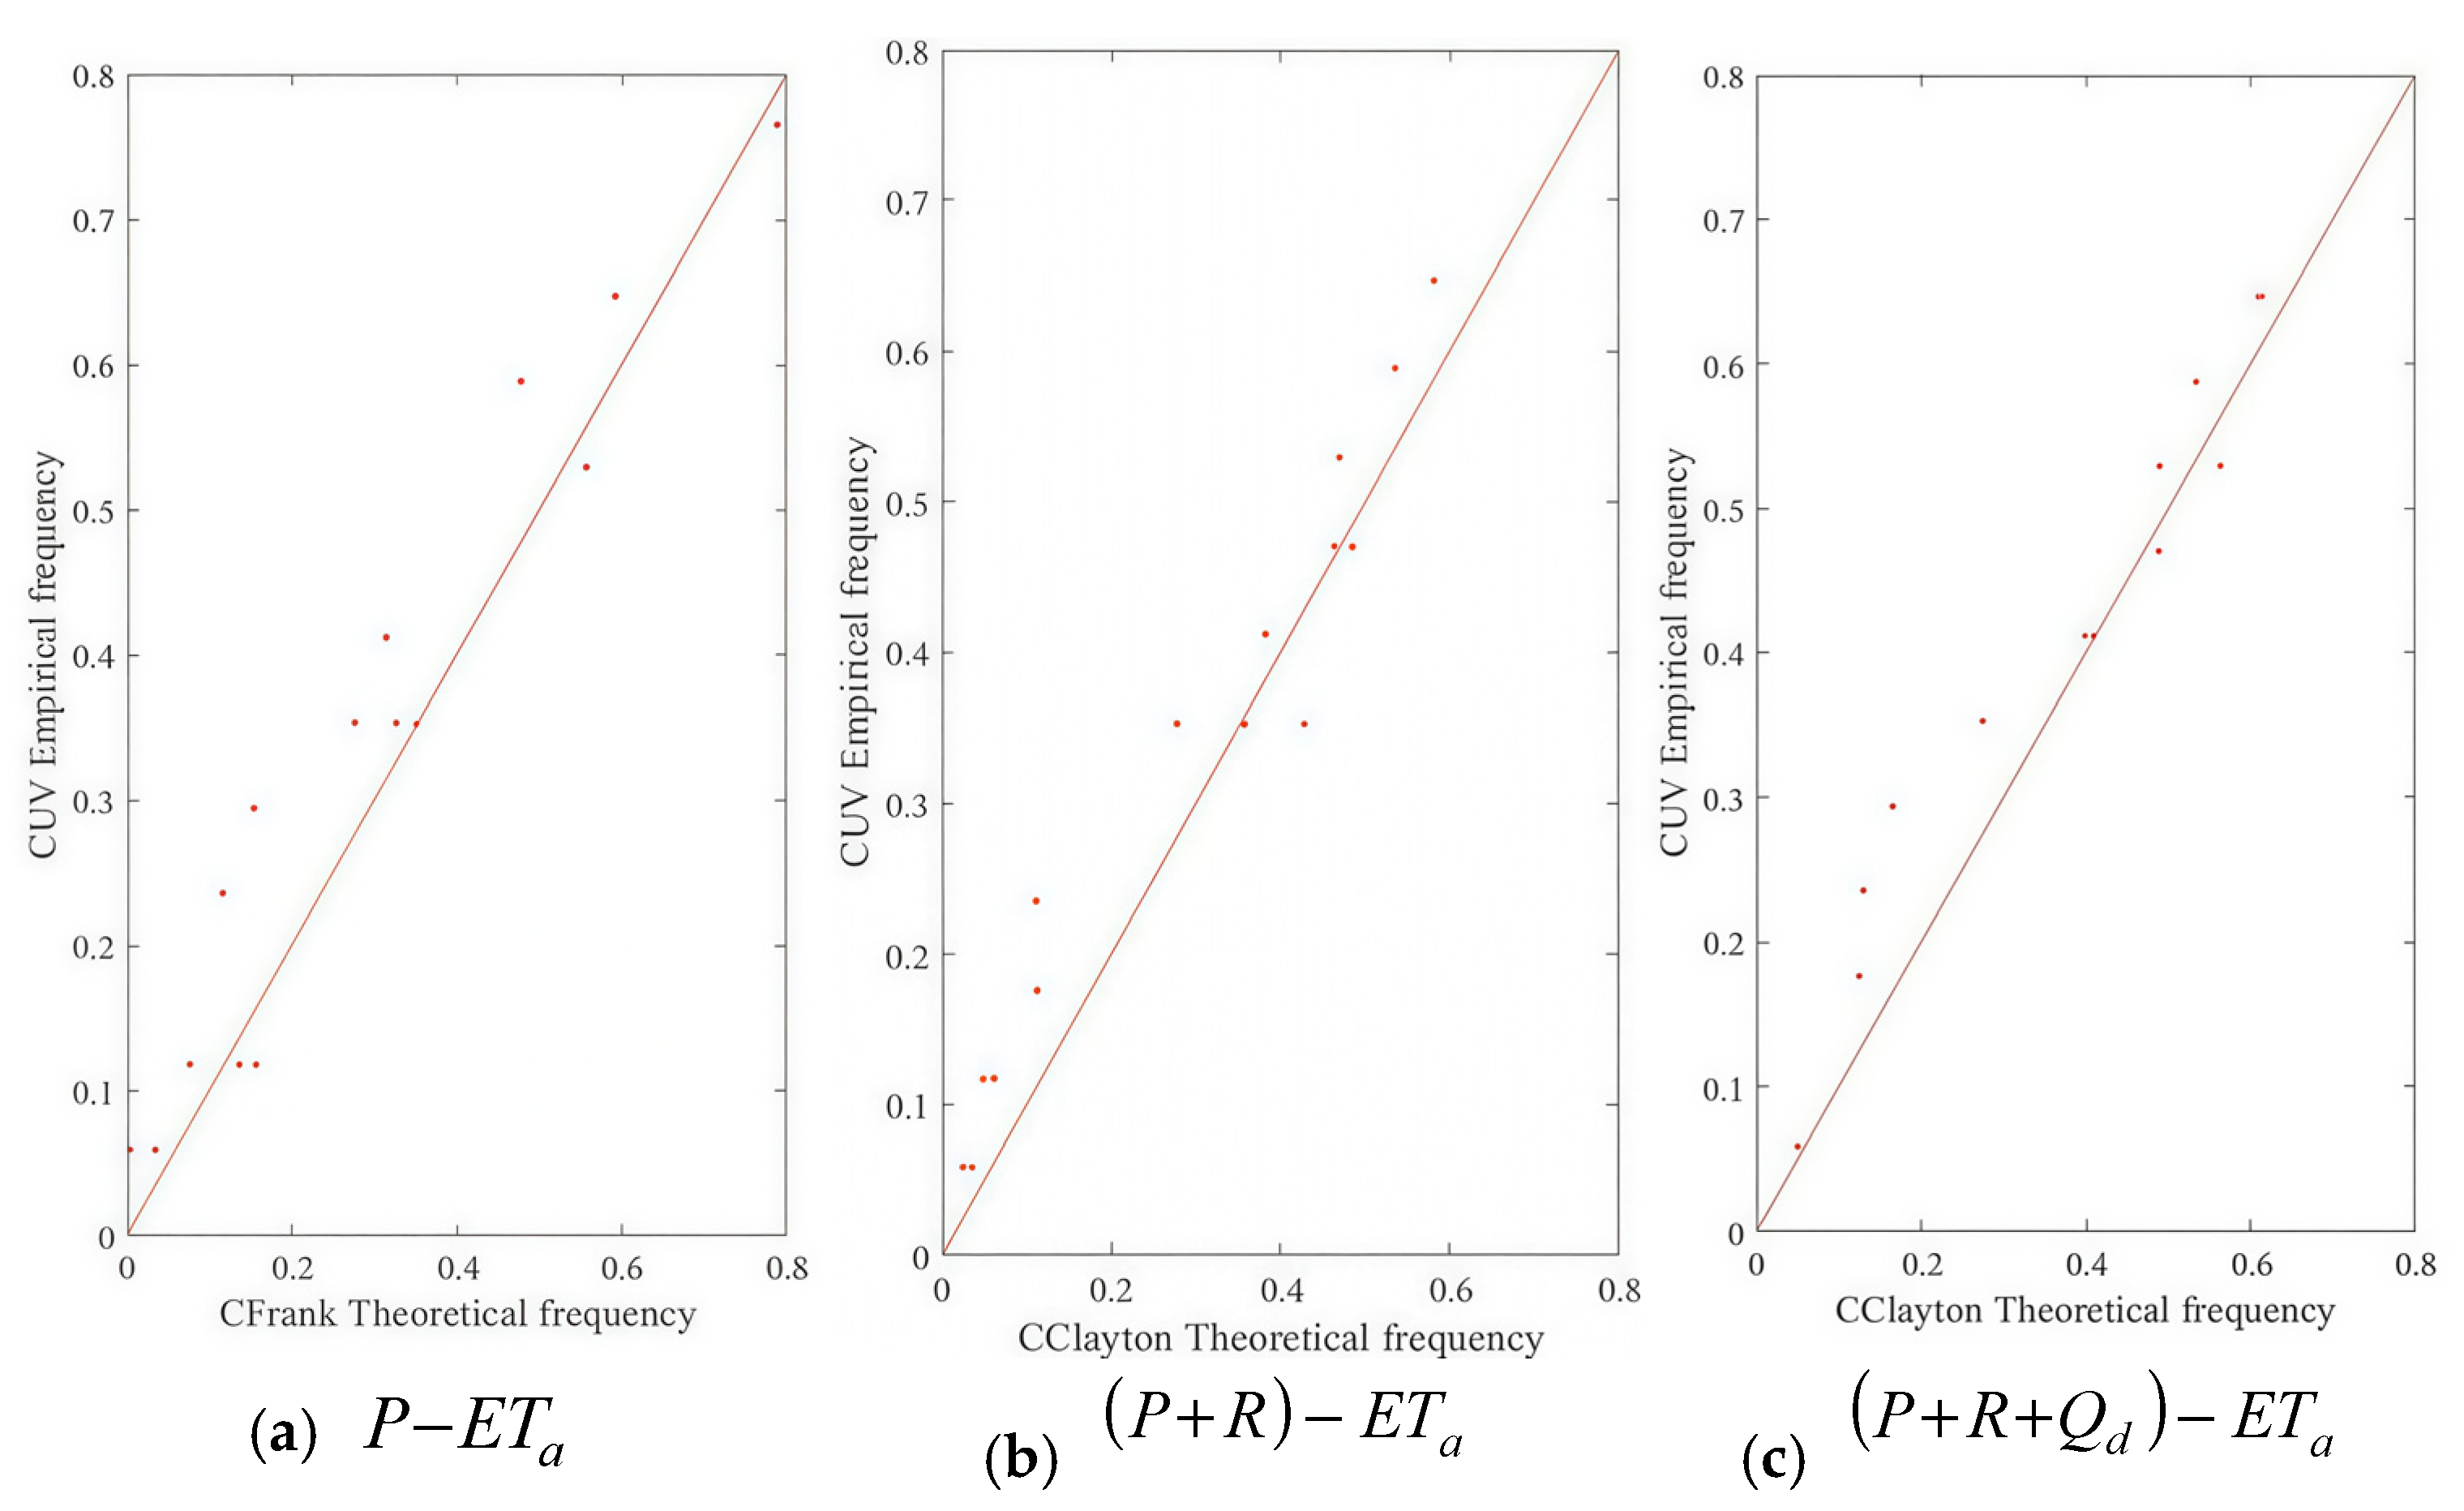
3.2. Construction of the Joint Distribution Model of Underlying Surface Water Supply and ETa
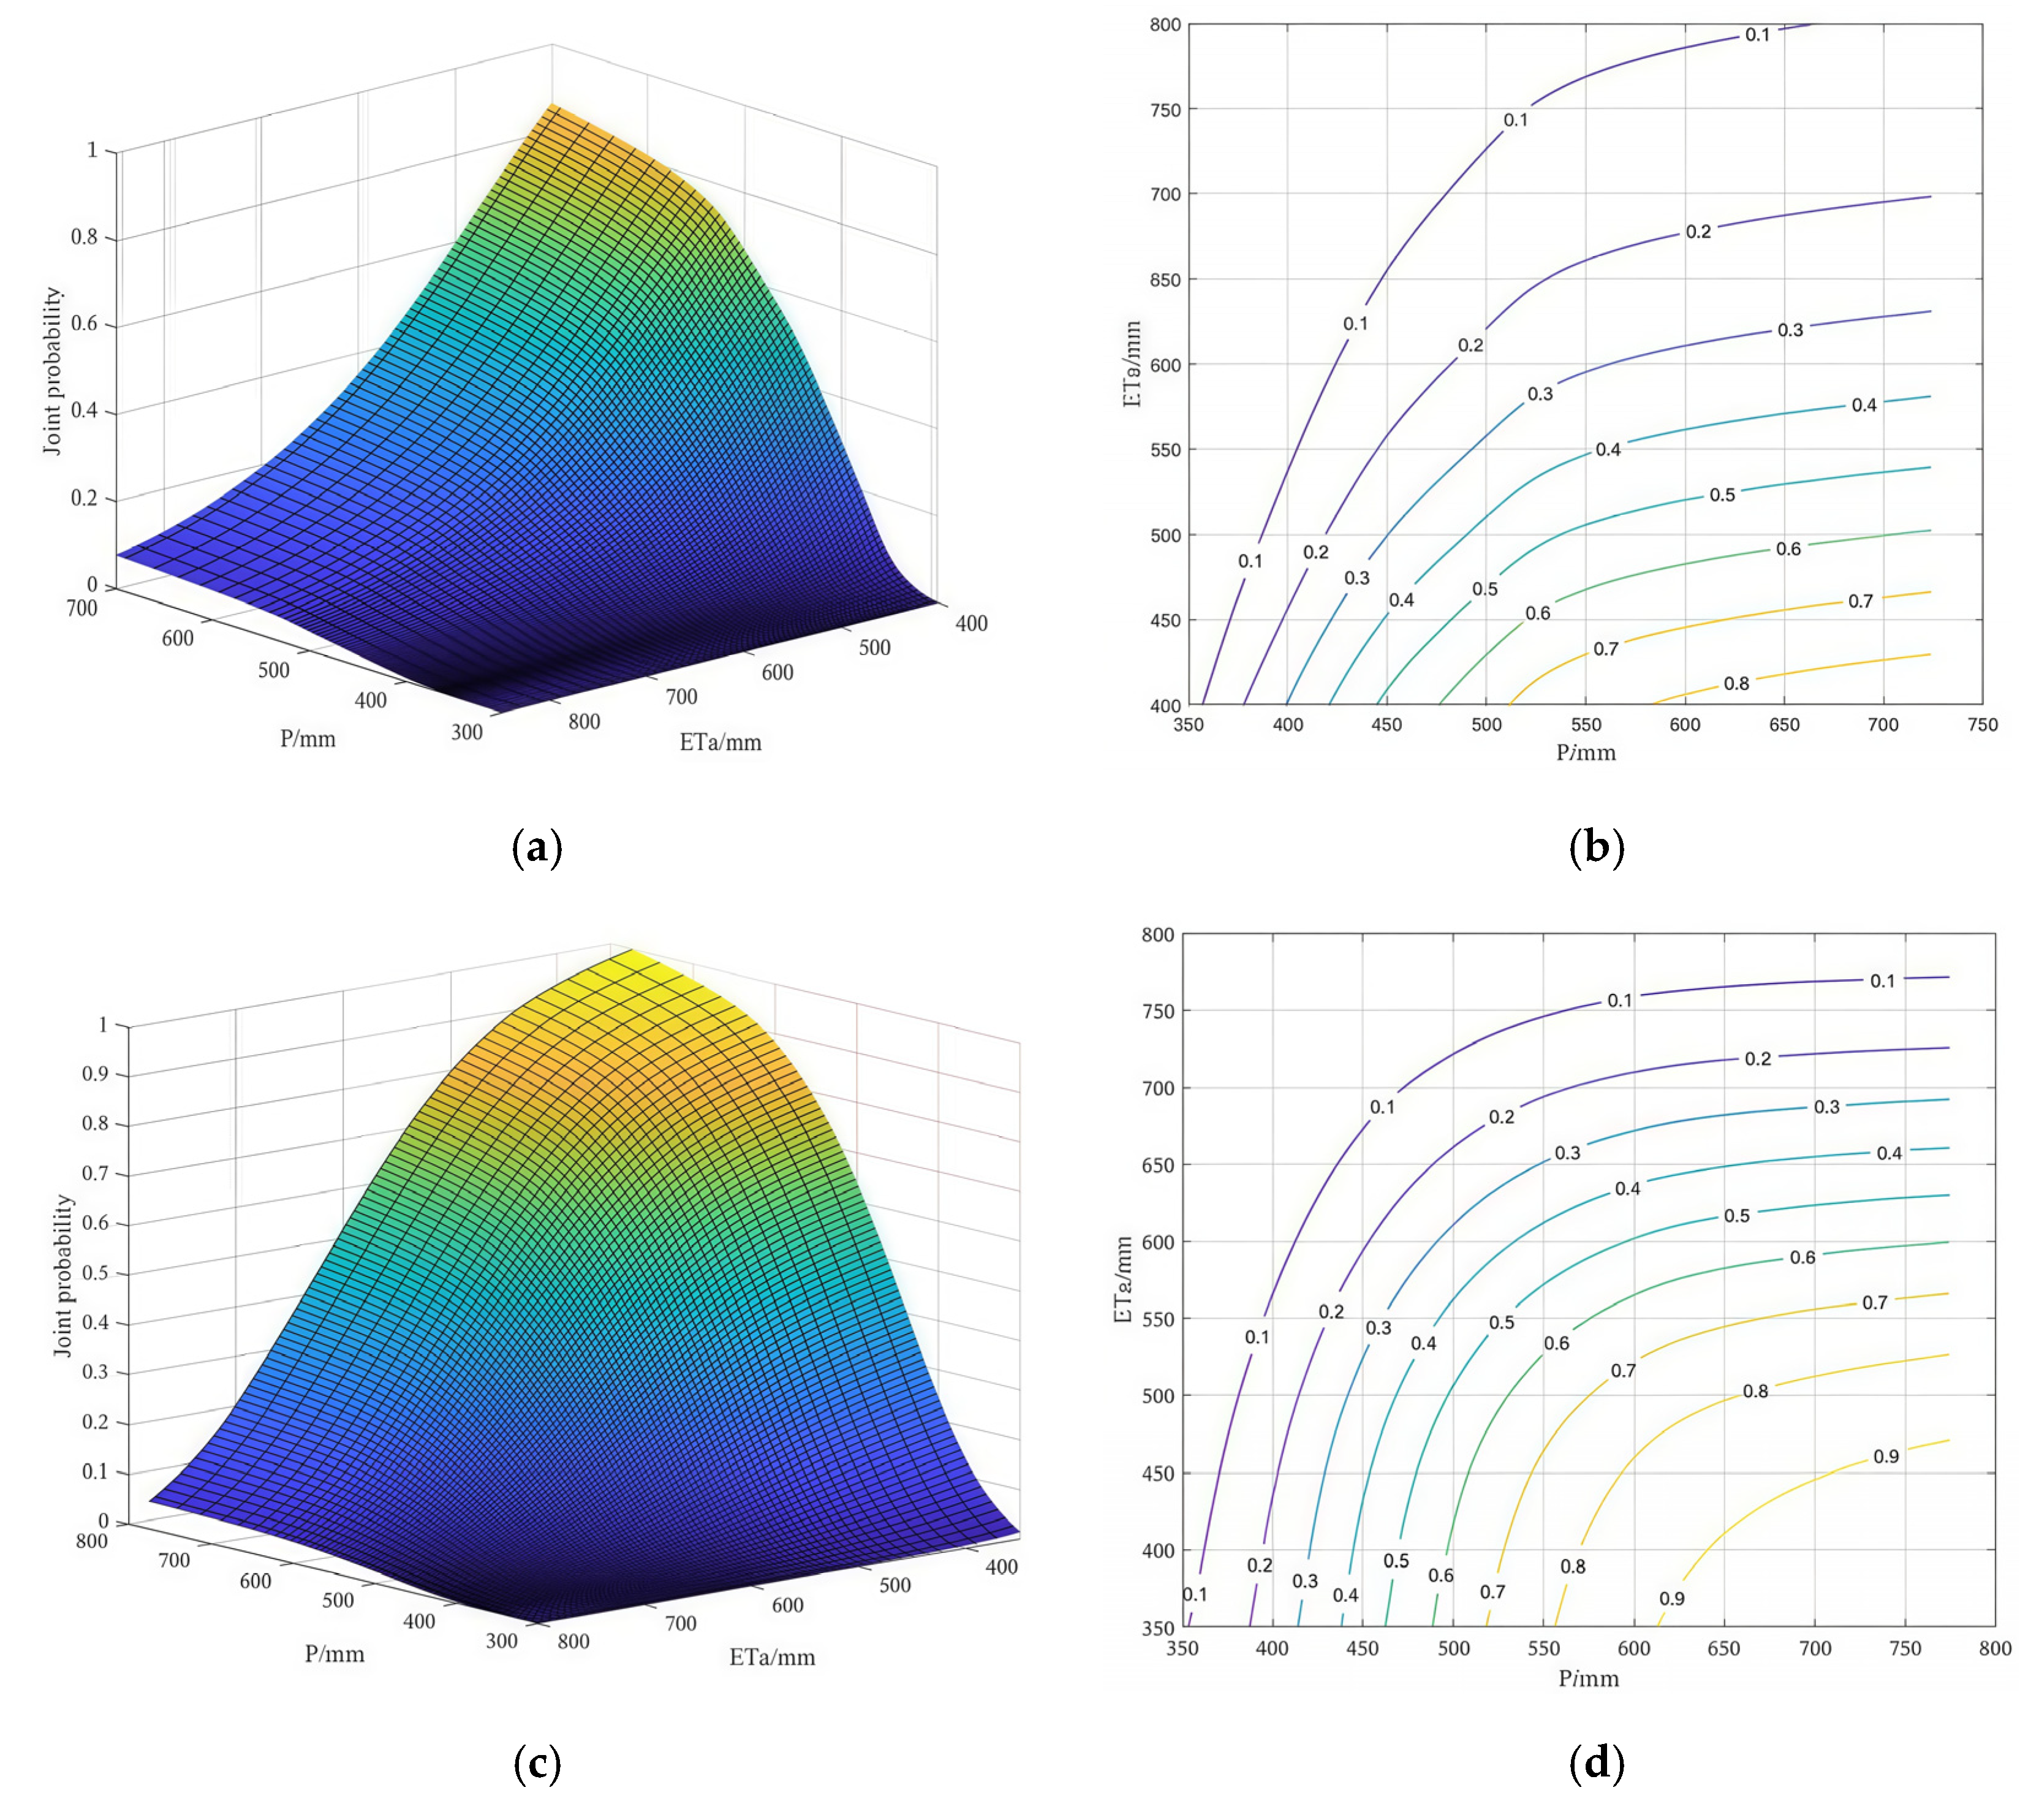
3.3. Joint Probability Analysis
- (1)
- P − ETa Joint Probability
- (2)
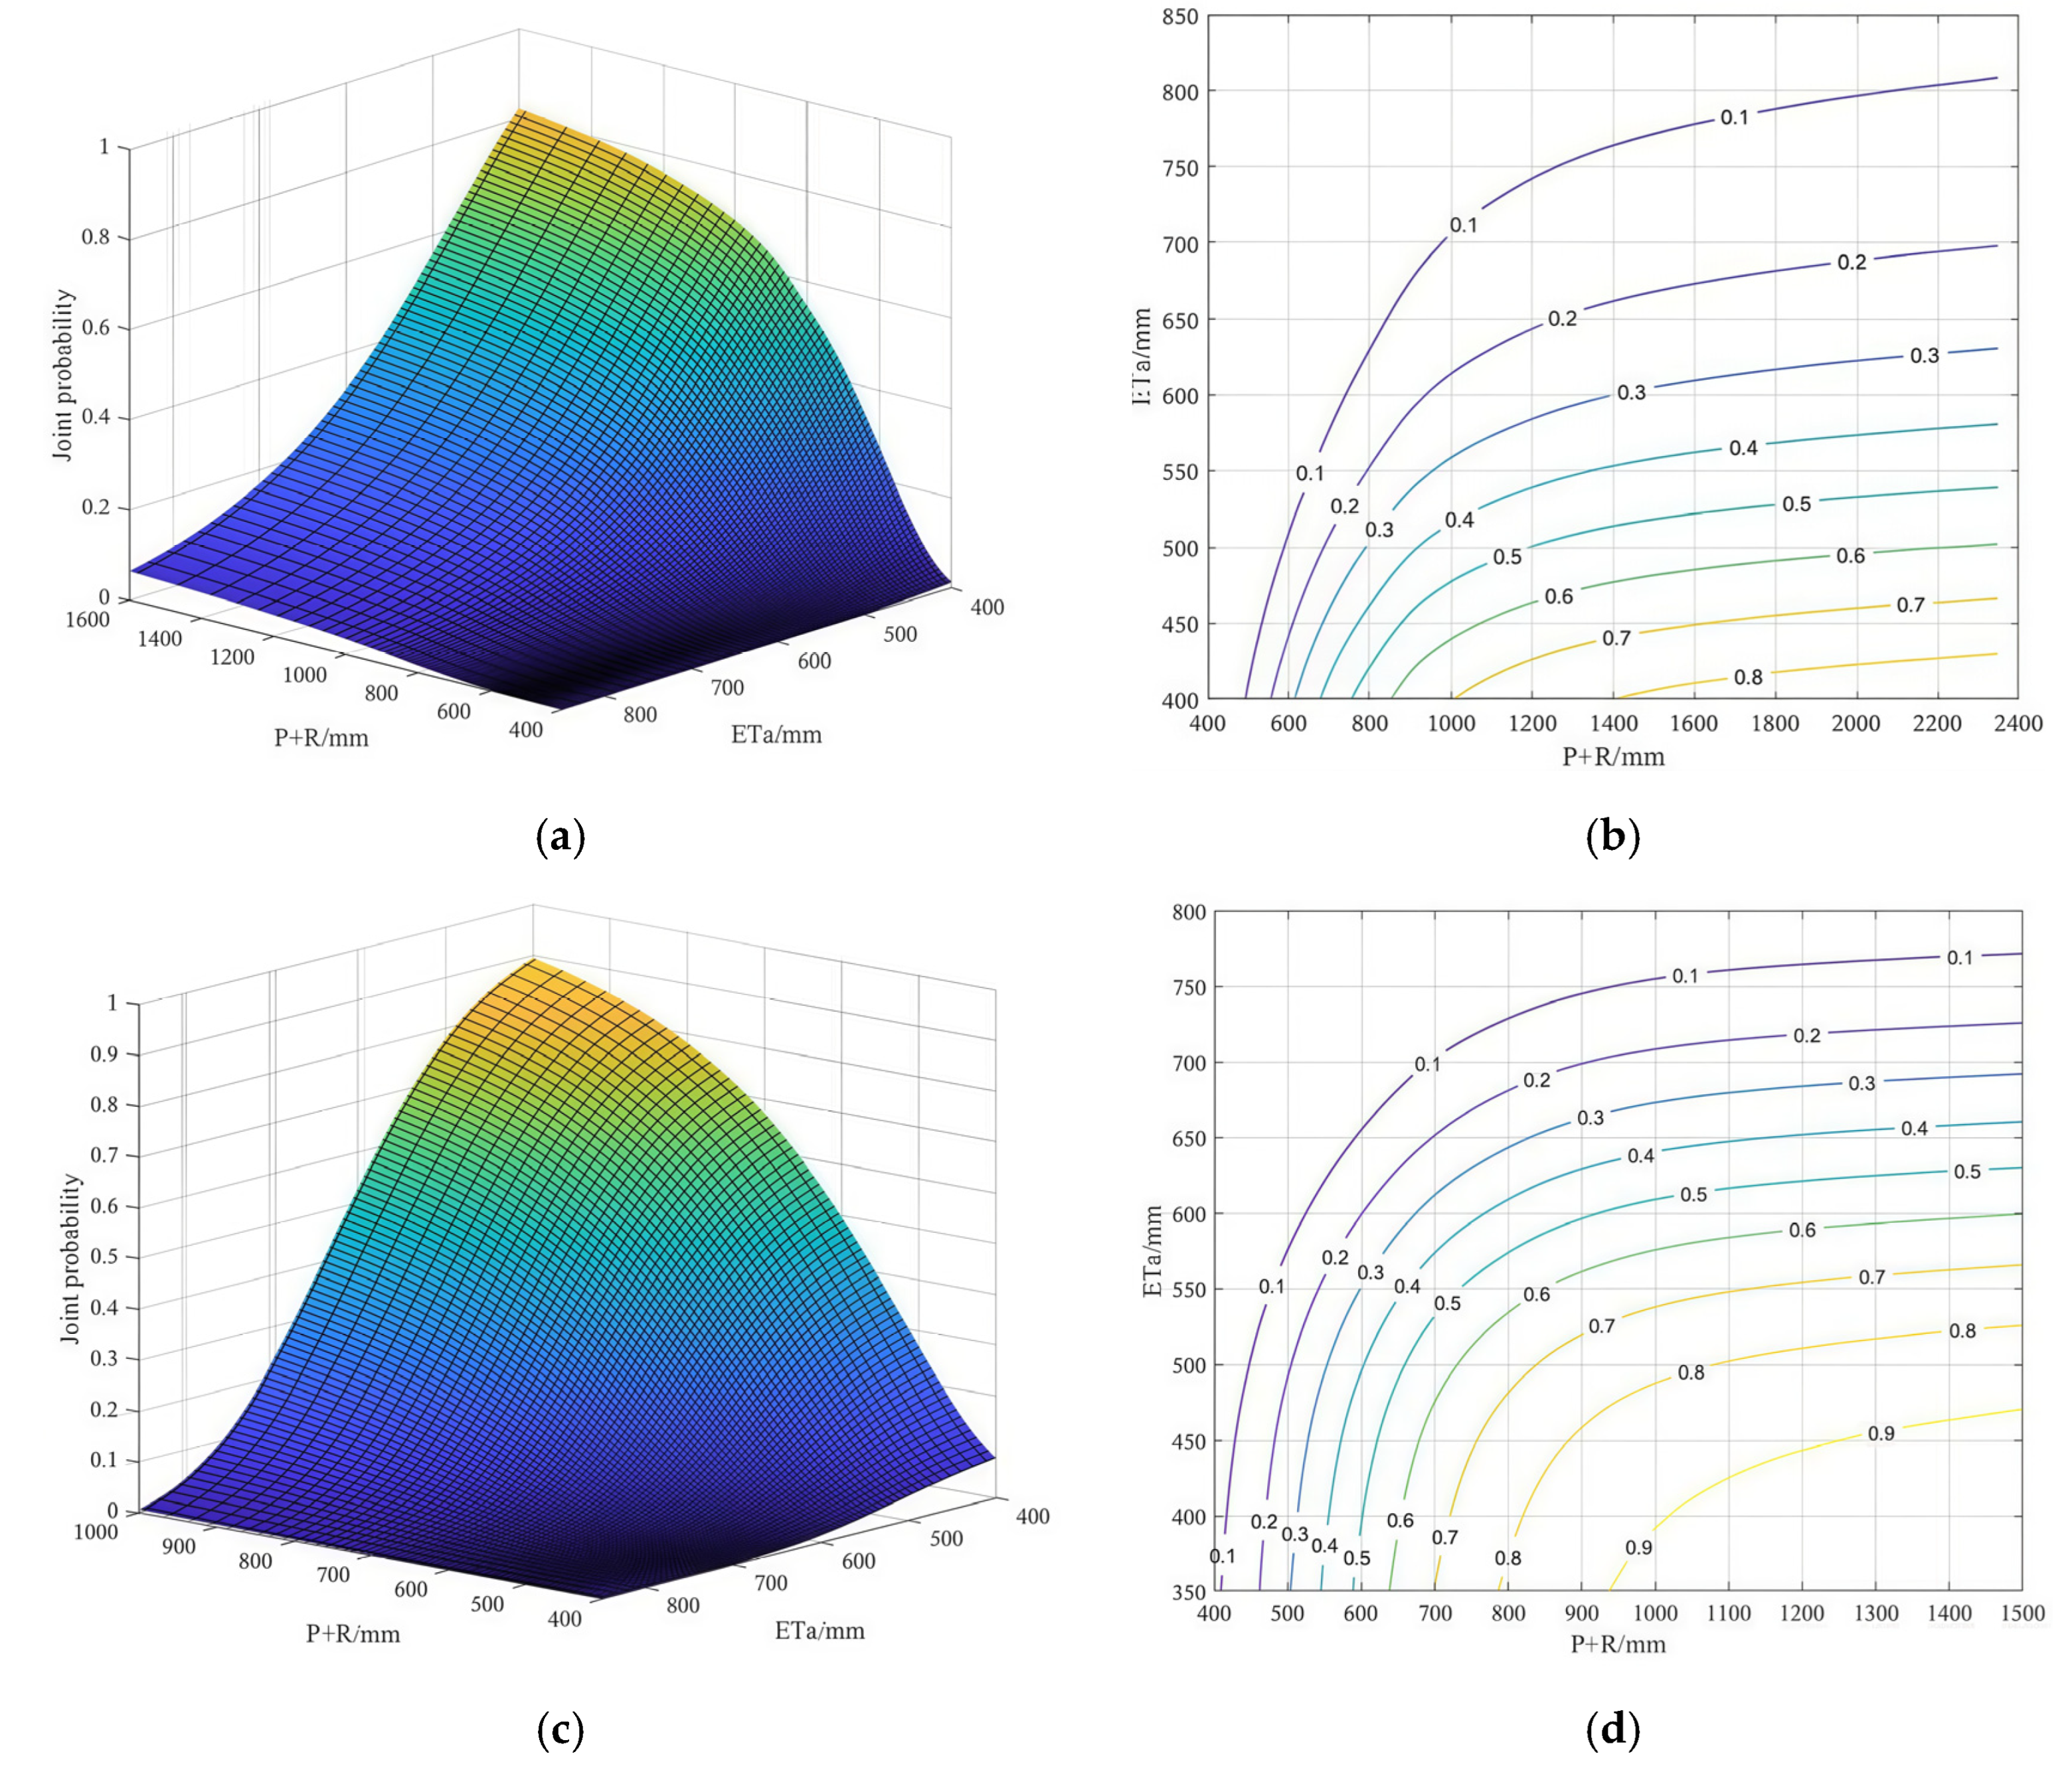
- Joint Probability of P + R − ETa
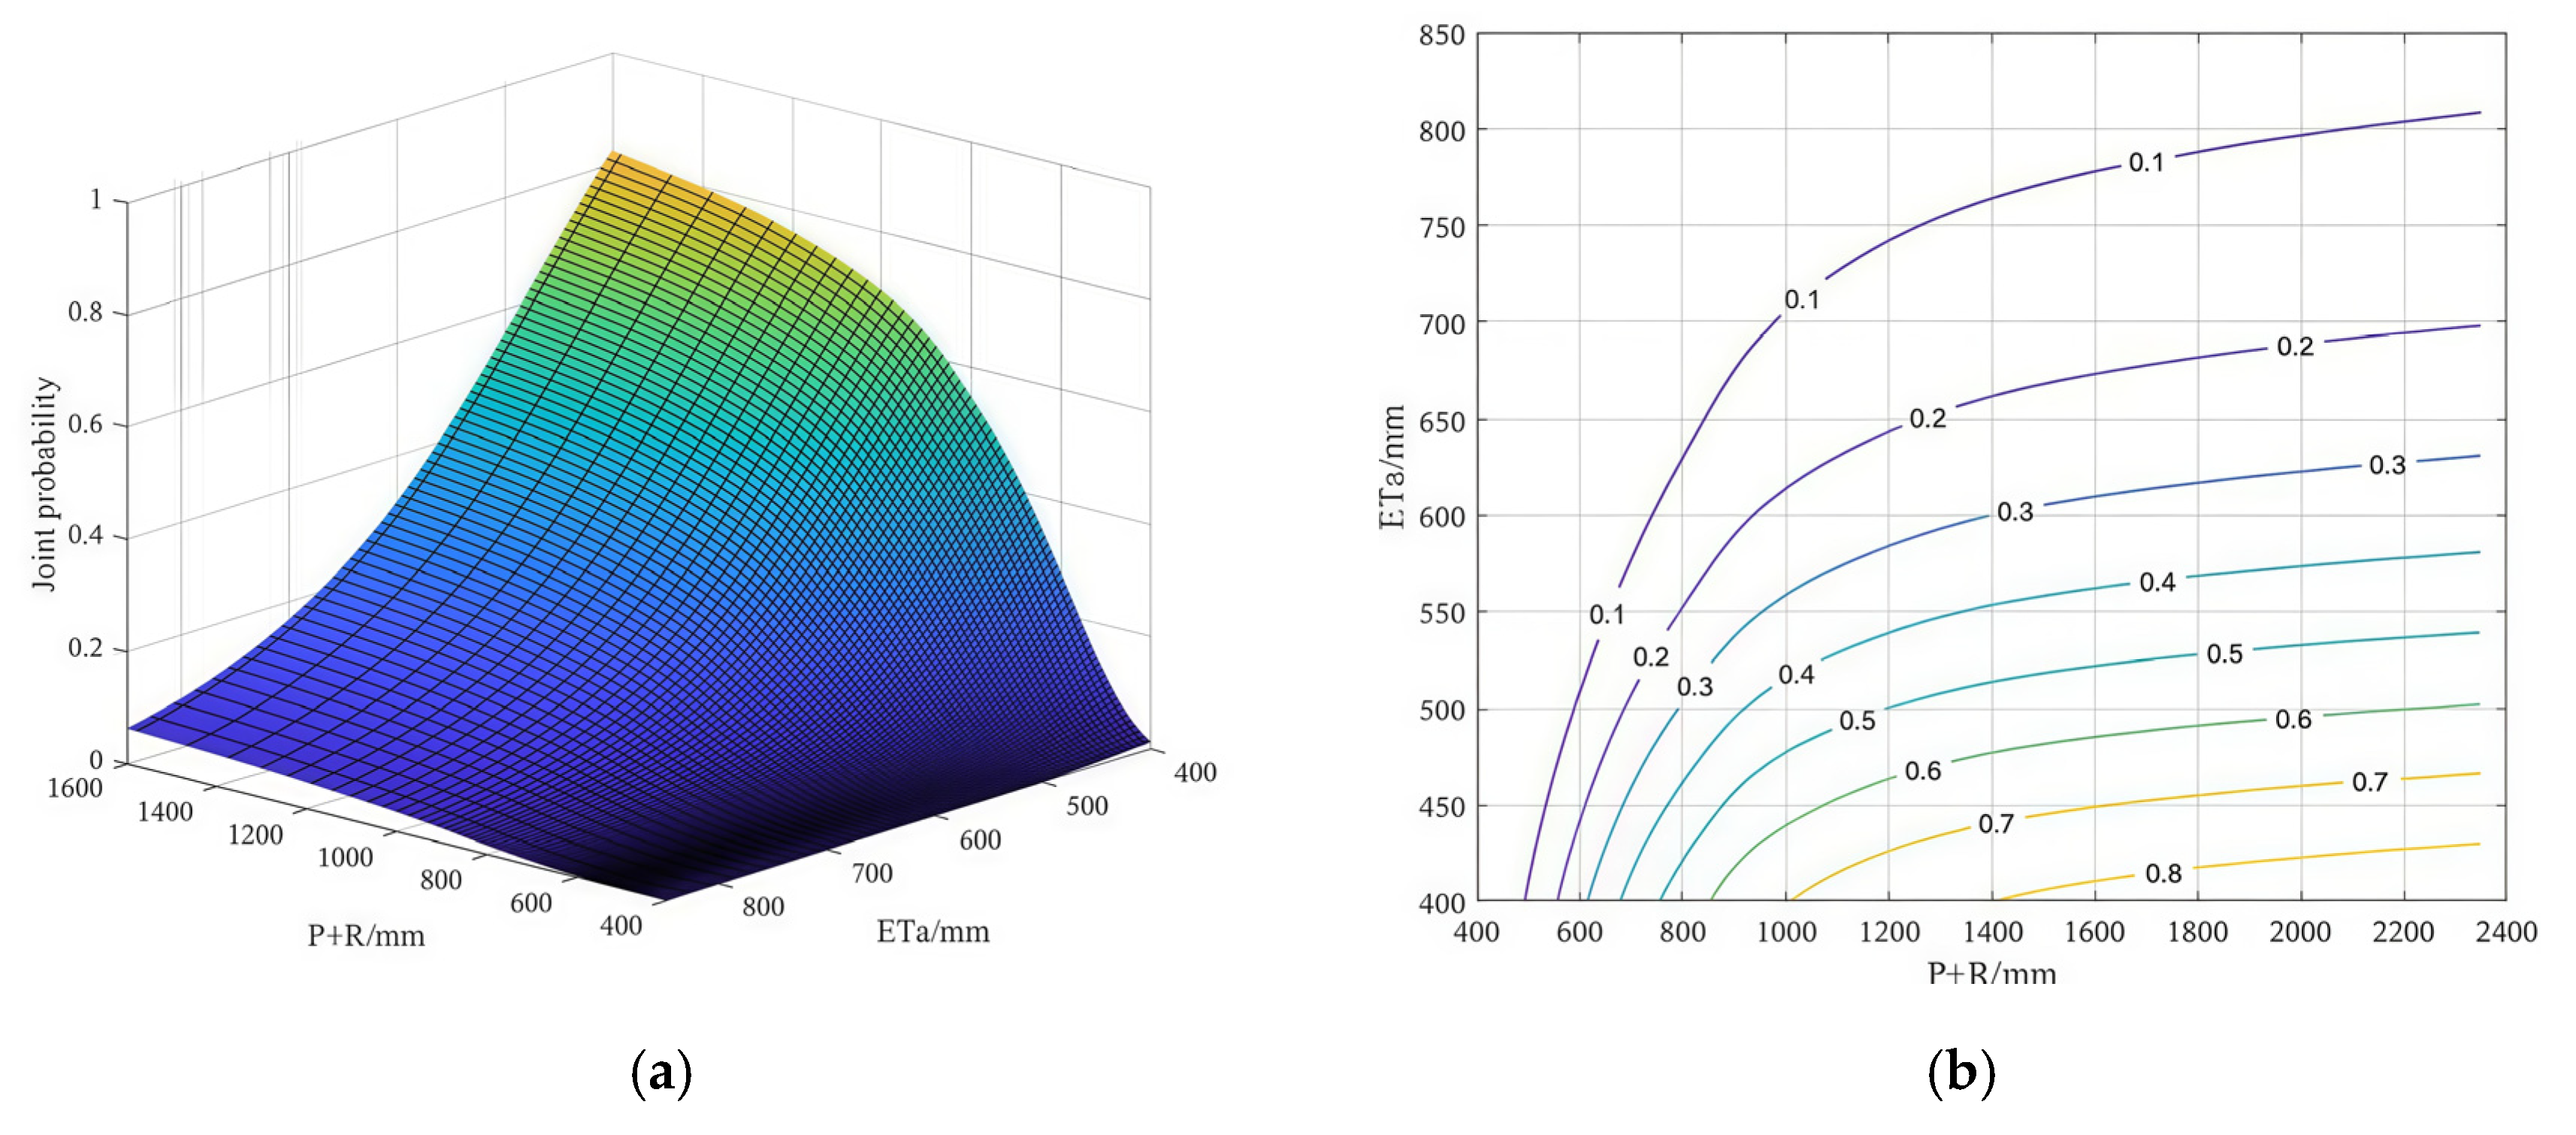
- (3)
- The joint probability of
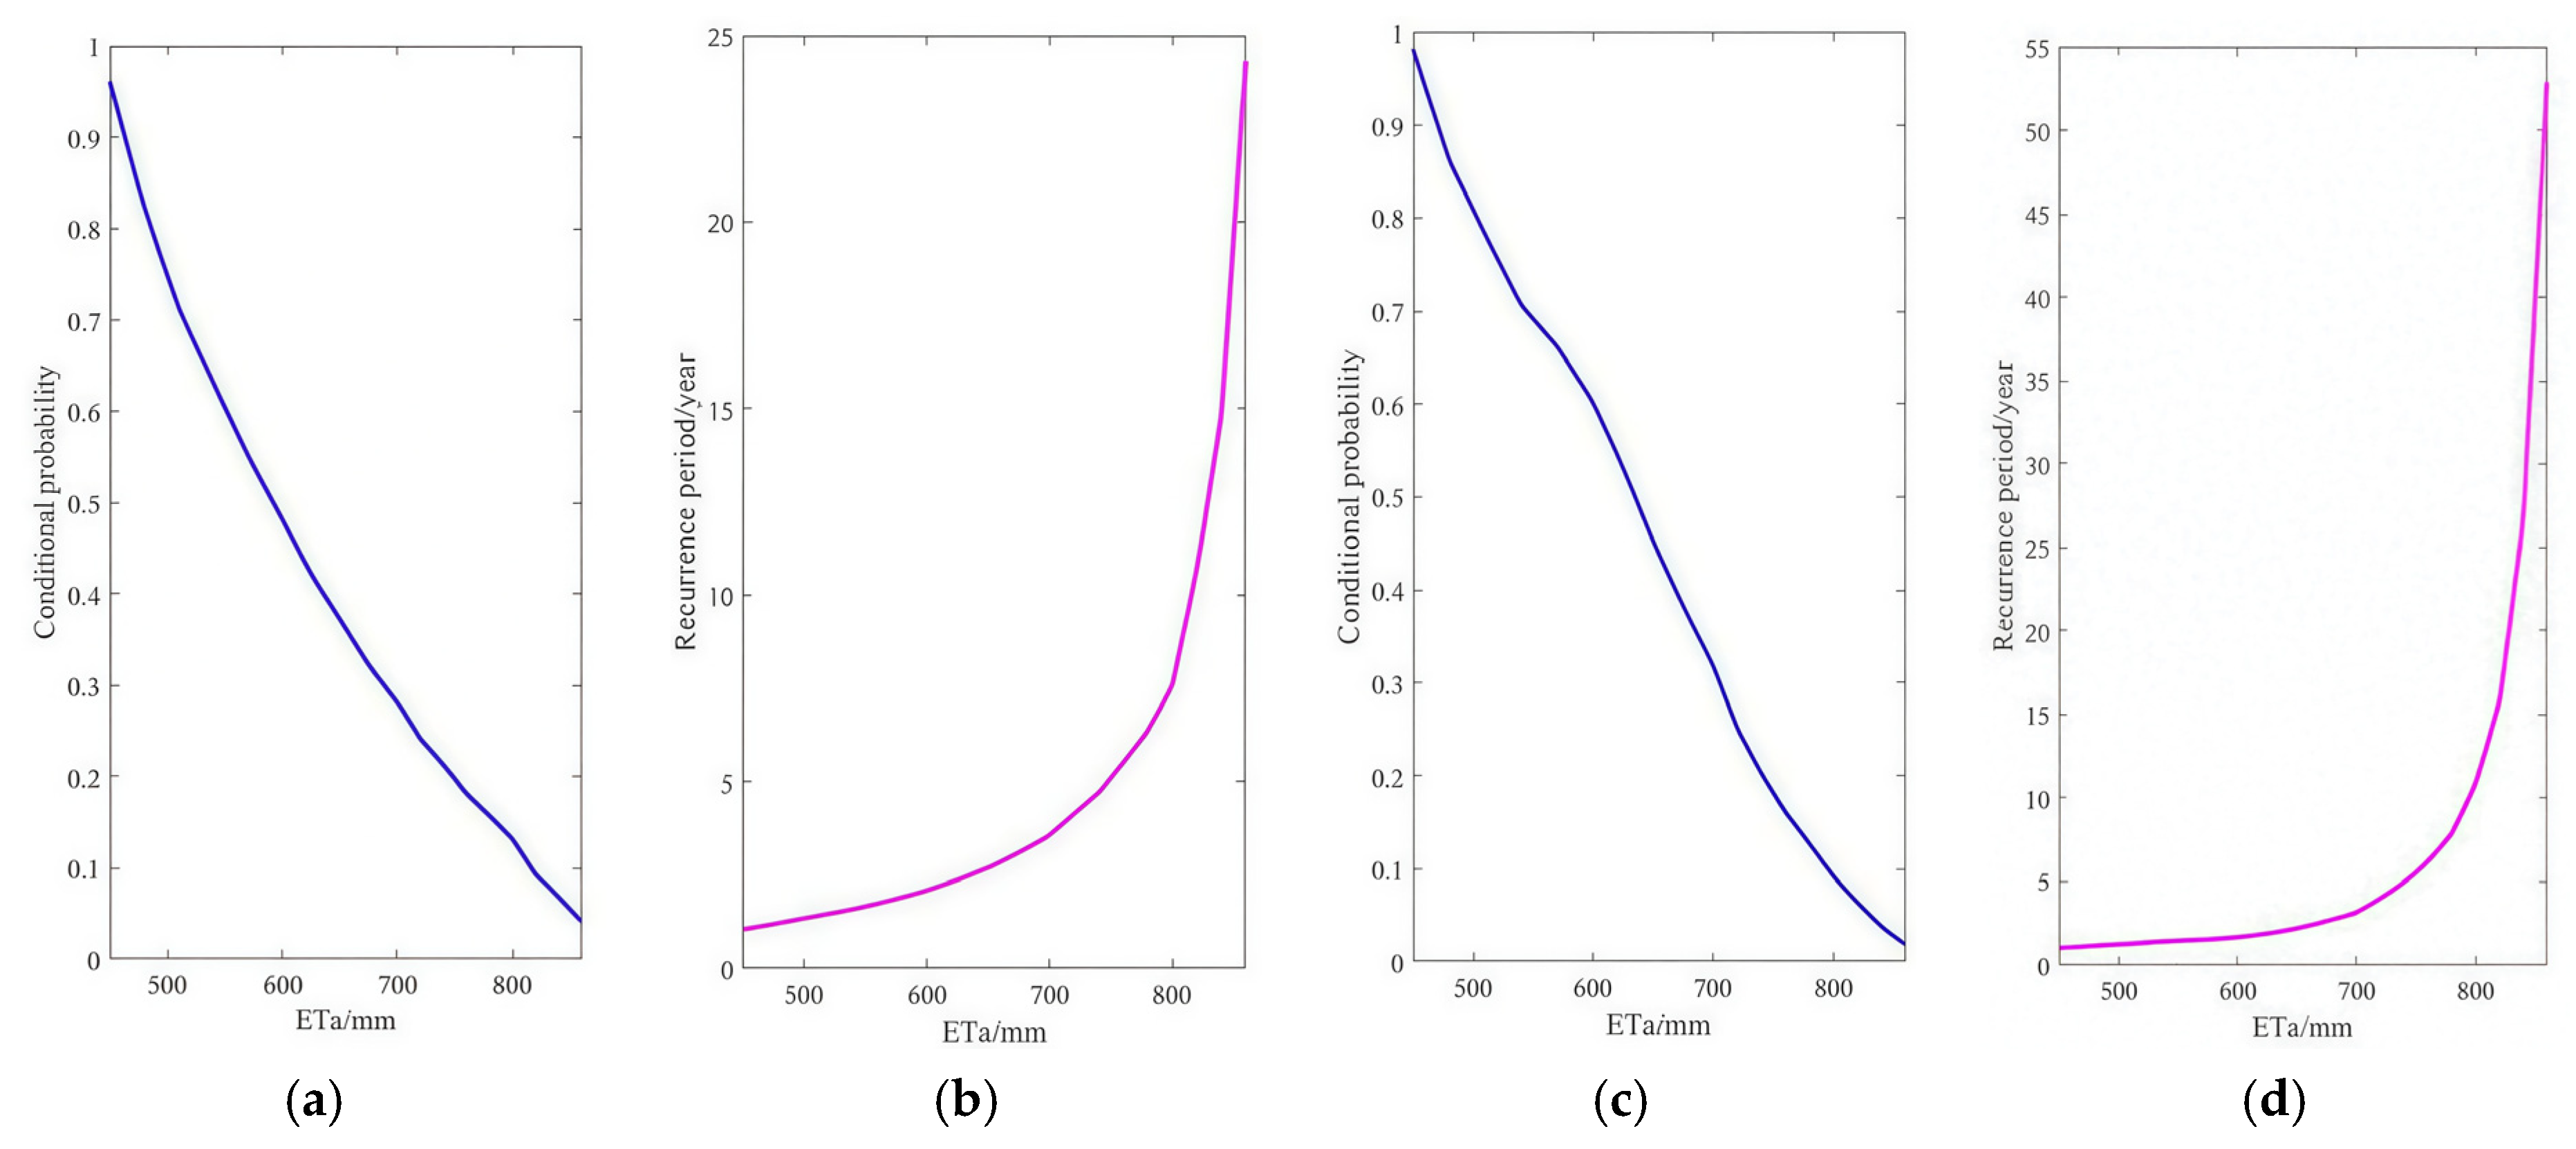
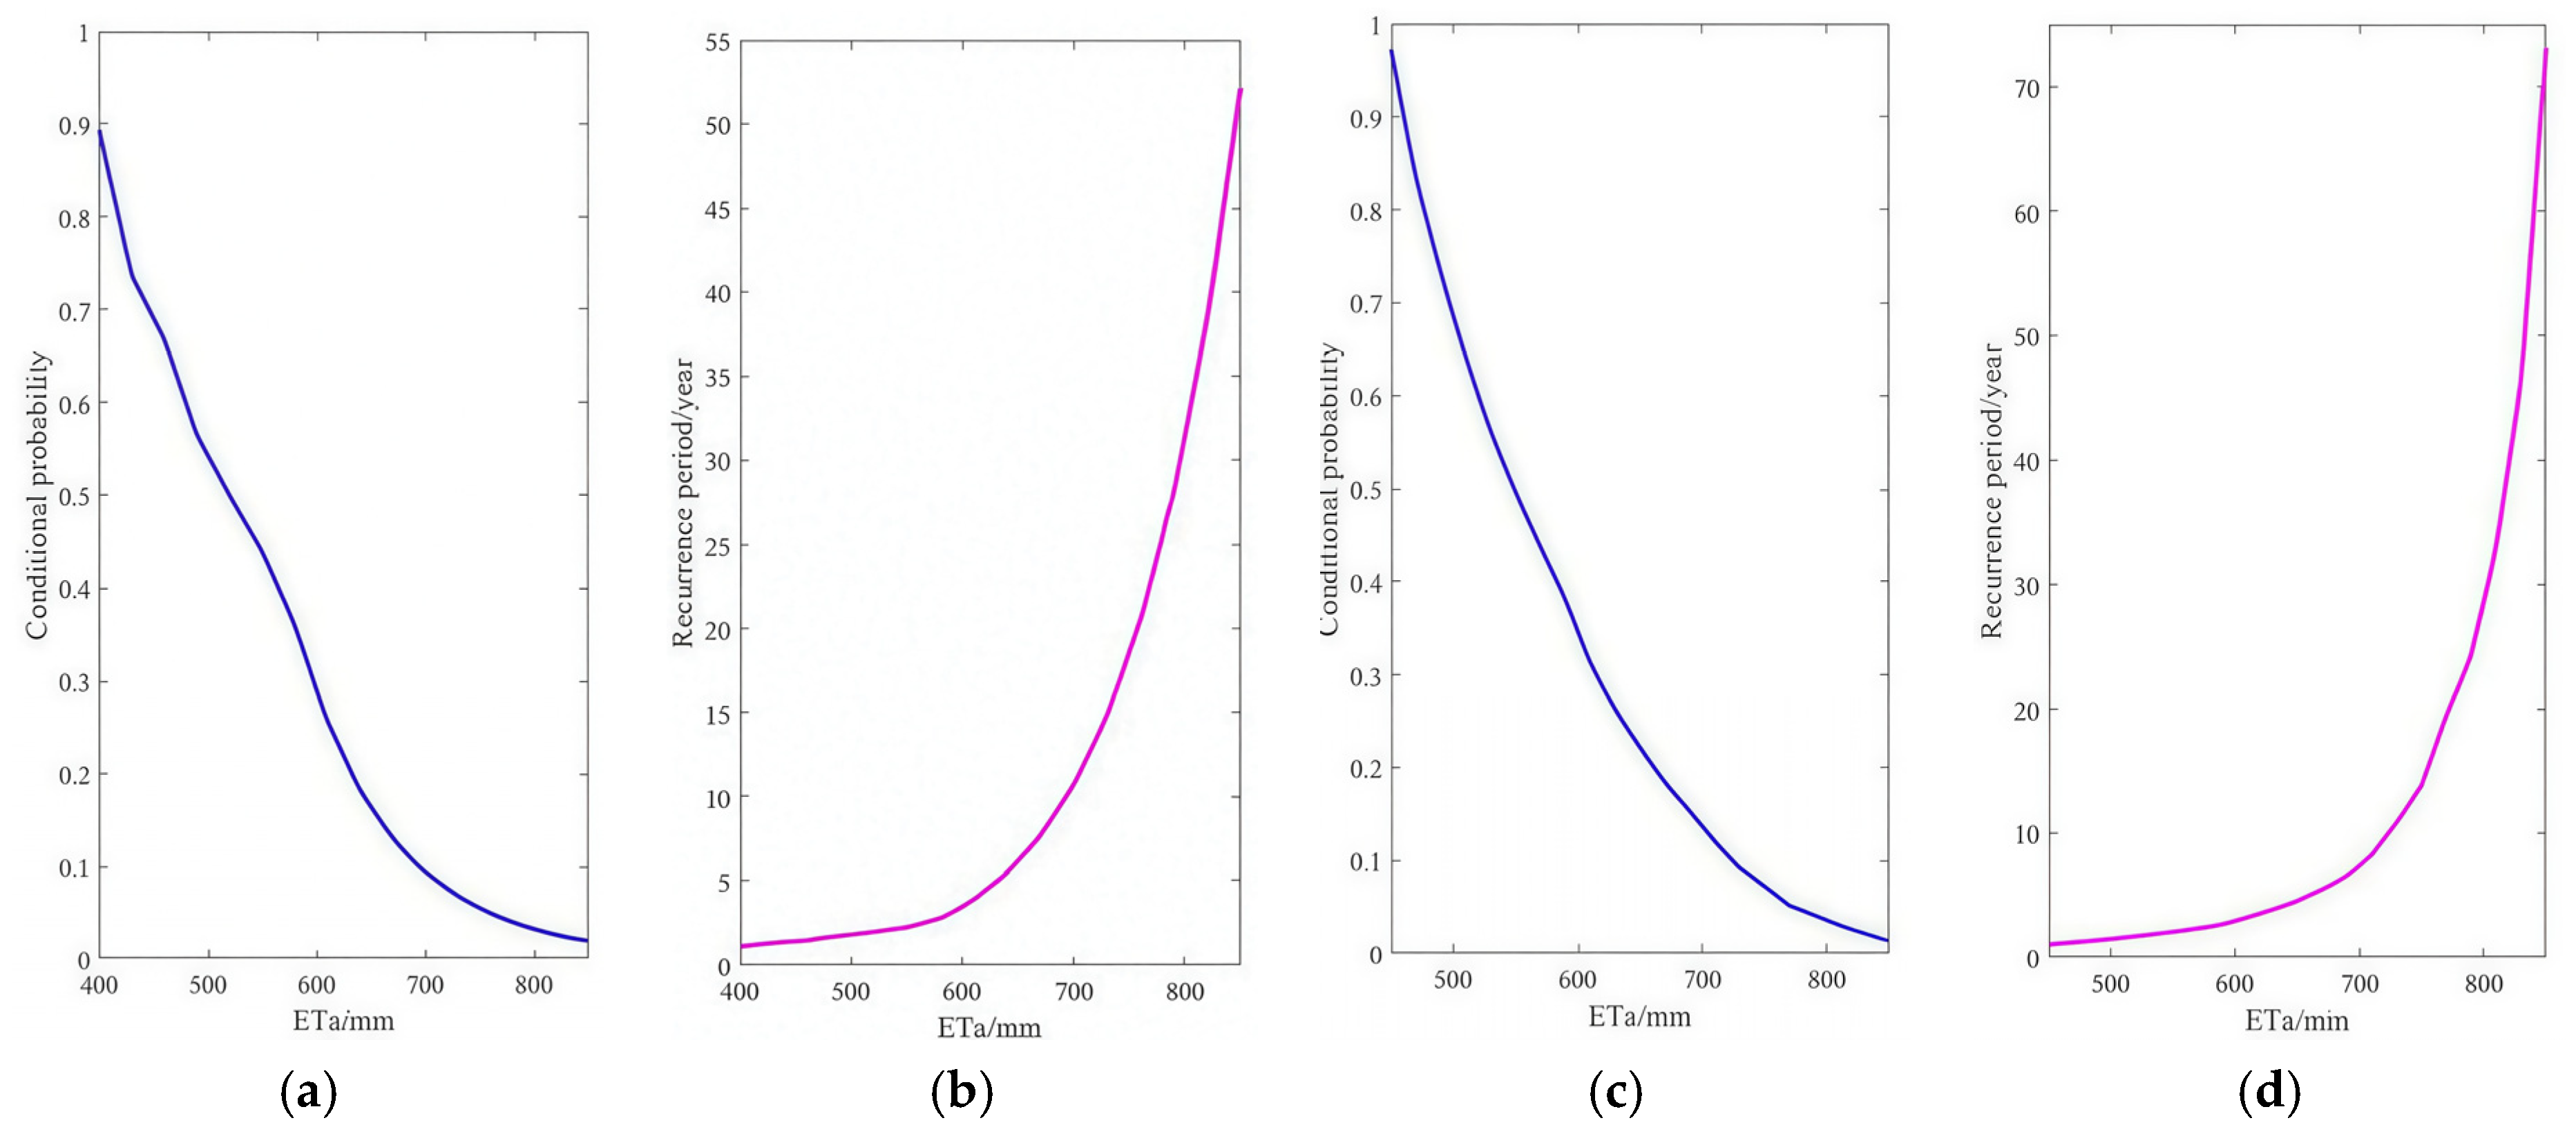
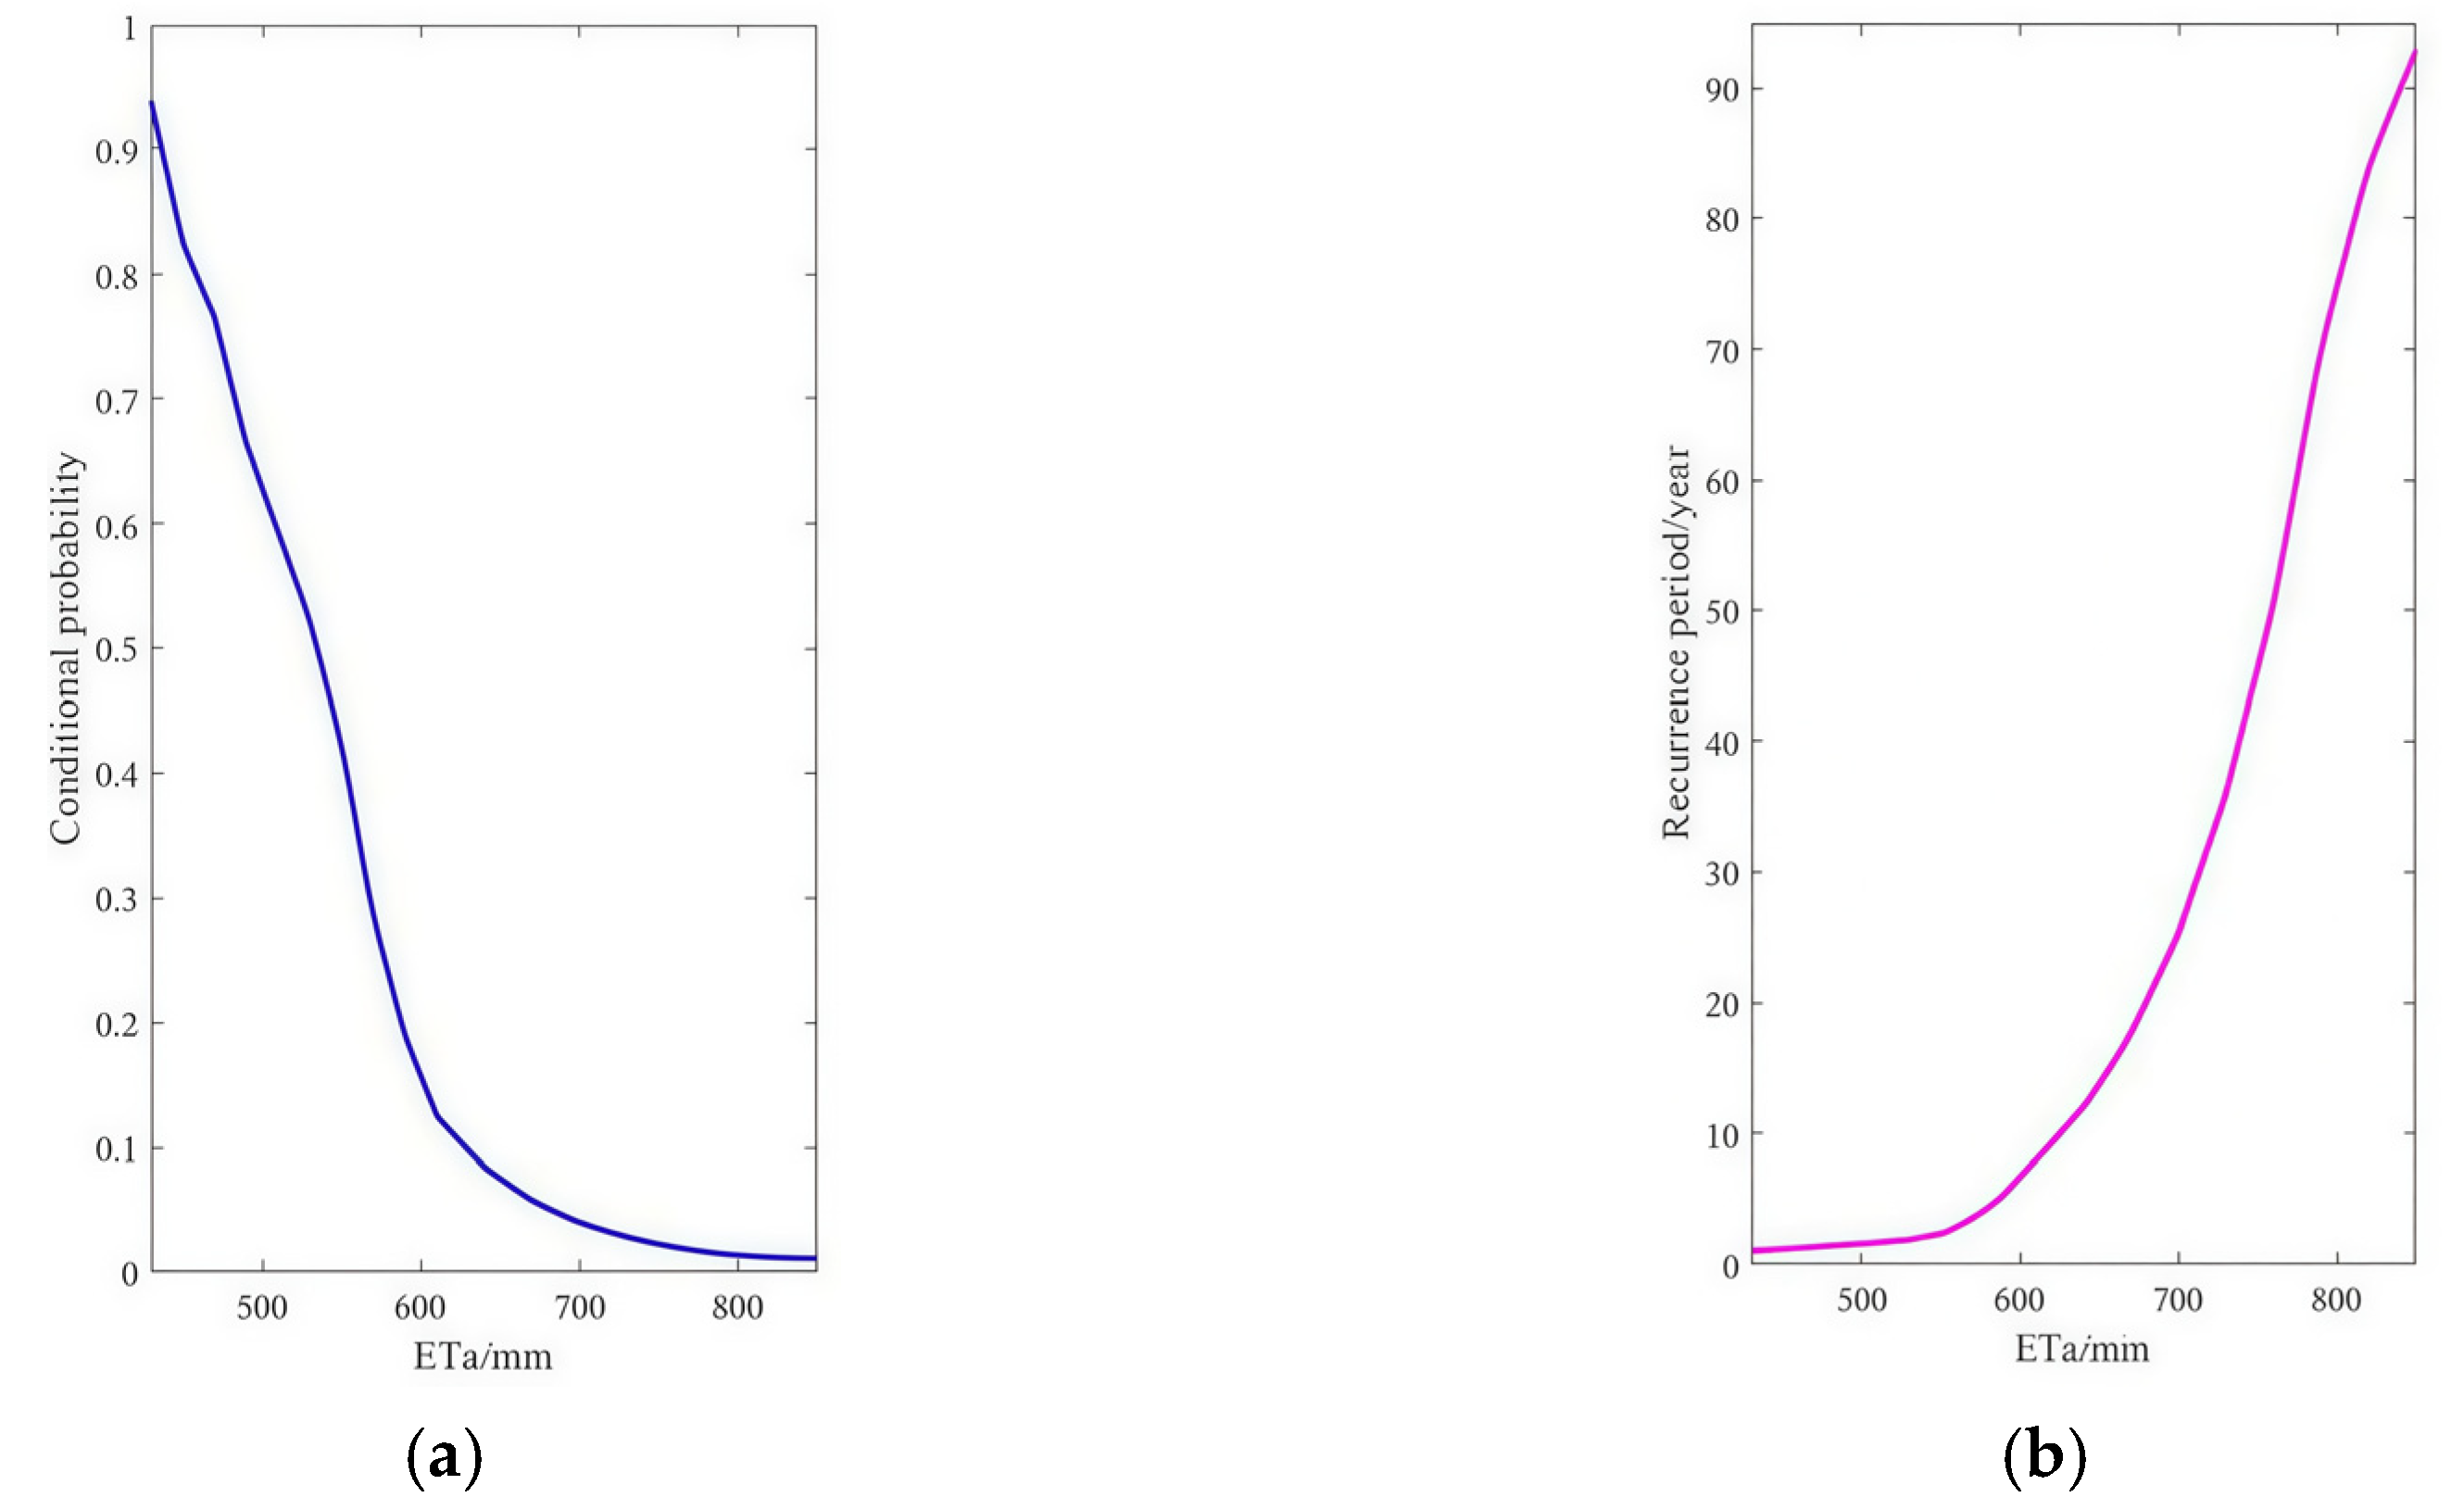
3.4. Conditional Probability and Conditional Recurrence Period Analysis
3.5. Probability Analysis of Abundant and Dry Encounters
4. Discussion
5. Conclusions
Author Contributions
Funding
Data Availability Statement
Conflicts of Interest
References
- An, C.; Dou, M.; Zhang, J.; Li, G. Method for analyzing Copula-Based water shortage risk in multisource water supply cities. Water Resour. Manag. 2021, 35, 4877–4894. [Google Scholar] [CrossRef]
- Bian, H.; Guo, H.; Zhang, W.; Li, Q.; Bai, S.; Shan, B. Characteristics and environmental significance of organic carbon deposition in Baiyangdian Lake, China, 1969–2020. Ecol. Indic. 2023, 157, 111213. [Google Scholar] [CrossRef]
- Kuang, B.; Xiao, R.; Wang, C.; Zhang, L.; Wei, Z.; Bai, J.; Zhang, K.; Campos, M.; Jorquera, M.A. Bacterial community assembly in surface sediments of a eutrophic shallow lake in northern China. Ecohydrol. Hydrobiol. 2022, 24, 828–838. [Google Scholar] [CrossRef]
- Chen, L.; Yang, Z.; Liu, H. Assessing the eutrophication risk of the Danjiangkou Reservoir based on the EFDC model. Ecol. Eng. 2016, 96, 117–127. [Google Scholar] [CrossRef]
- Du, Z.; Ge, L.; Ng, A.H.-M.; Lian, X.; Zhu, Q.; Horgan, F.G.; Zhang, Q. Analysis of the impact of the South-to-North water diversion project on water balance and land subsidence in Beijing, China between 2007 and 2020. J. Hydrol. 2021, 603, 126990. [Google Scholar] [CrossRef]
- Han, Y.L.; Bu, H.M. The impact of climate change on the water quality of Baiyangdian Lake (China) in the past 30 years (1991–2020). Sci. Total Environ. 2023, 870, 161957. [Google Scholar] [CrossRef]
- Holding, S.; Allen, M.D. Risk to water security for small islands: An assessment framework and application. Reg. Environ. Chang. 2016, 16, 827–839. [Google Scholar] [CrossRef]
- Hu, S.; Liu, C.; Zheng, H.; Wang, Z.; Yu, J. Assessing the impacts of climate variability and human activities on streamflow in the water source area of Baiyangdian Lake. J. Geogr. Sci. 2012, 22, 895–905. [Google Scholar] [CrossRef]
- Jiang, Z.; Jiang, W.; Ling, Z.; Wang, X.; Peng, K.; Wang, C. Surface Water Extraction and Dynamic Analysis of Baiyangdian Lake Based on the Google Earth Engine Platform Using Sentinel-1 for Reporting SDG 6.6.1 Indicators. Water 2021, 13, 138. [Google Scholar] [CrossRef]
- Kuo, Y.-M.; Liu, W.-W.; Zhao, E.; Li, R.; Muñoz-Carpena, R. Water quality variability in the middle and down streams of Han River under the influence of the Middle Route of South-North Water Diversion Project, China. J. Hydrol. 2018, 569, 218–229. [Google Scholar] [CrossRef]
- Li, L.; Chen, X.; Zhang, M.; Zhang, W.; Wang, D.; Wang, H. The spatial variations of water quality and effects of water landscape in Baiyangdian Lake, North China. Environ. Sci. Pollut. Res. Int. 2021, 29, 16716–16726. [Google Scholar] [CrossRef]
- Li, L.; Zhang, L.; Xia, J.; Gippel, C.J.; Wang, R.; Zeng, S. Implications of Modelled Climate and Land Cover Changes on Runoff in the Middle Route of the South to North Water Transfer Project in China. Water Resour. Manag. 2015, 29, 2563–2579. [Google Scholar] [CrossRef]
- Li, W.; Zhou, J.; Yao, X.; Feng, K.; Luo, C.; Sun, N. Flood Hazard Analysis Based on Copula Connect Function. Nat. Hazards Rev. 2023, 24, 04022041. [Google Scholar] [CrossRef]
- Liang, H.; Zhang, D.; Wang, W.; Yu, S.; Wang, H. Quantifying future water and energy security in the source area of the western route of China’s South-to-North water diversion project within the context of climatic and societal changes. J. Hydrol. Reg. Stud. 2023, 47, 101443. [Google Scholar] [CrossRef]
- Liu, Y.; Fan, Y.; Fang, Y.; Hou, Y.; Wang, S. Assessing the impact of incentive coordination effect on the equilibrium of agricultural water usage by China’s South-to-North Water Diversion Middle Route Project. Environ. Sci. Pollut. Res. Int. 2024, 31, 17354–17371. [Google Scholar] [CrossRef]
- De Luca, D.L.; Ridolfi, E.; Russo, F.; Moccia, B.; Napolitano, F. Climate change effects on rainfall extreme value distribution: The role of skewness. J. Hydrol. 2024, 634, 130958. [Google Scholar] [CrossRef]
- Nabi, G.; Ali, M.; Khan, S.; Kumar, S. The crisis of water shortage and pollution in Pakistan: Risk to public health, biodiversity, and ecosystem. Environ. Sci. Pollut. Res. Int. 2019, 26, 10443–10445. [Google Scholar] [CrossRef] [PubMed]
- Pang, R.; Zhou, Y.; Chen, G.; Jing, M.; Yang, D. Stochastic Mainshock–Aftershock Simulation and Its Applications in Dynamic Reliability of Structural Systems via DPIM. J. Eng. Mech. 2023, 149, 04022096. [Google Scholar] [CrossRef]
- Qian, L.; Zhao, Y.; Wang, H.; Dang, S. Prediction of water shortage loss in situations with small samples based on an improved Gumbel copula. J. Earth Syst. Sci. 2021, 130, 3. [Google Scholar] [CrossRef]
- Qian, L.; Wang, H.; Bai, C.; Deng, C. A New Parameter Estimation Method for a Logistic Regression Model of Water Shortage Risk in the Case of Small Sample Numbers. Math. Geosci. 2019, 52, 929–944. [Google Scholar] [CrossRef]
- Qiao, C.; Ning, Z.; Wang, Y.; Sun, J.; Lin, Q.; Wang, G. Impact of Climate Change on Water Availability in Water Source Areas of the South-to-North Water Diversion Project in China. Front. Earth Sci. 2021, 9, 747429. [Google Scholar] [CrossRef]
- Song, Q.; Wang, Z.; Wu, T. Risk analysis and assessment of water resource carrying capacity based on weighted gray model with improved entropy weighting method in the central plains region of China. Ecol. Indic. 2024, 160, 111907. [Google Scholar] [CrossRef]
- Sun, S.; Tang, Q.; Konar, M.; Fang, C.; Liu, H.; Liu, X.; Fu, G. Water transfer infrastructure buffers water scarcity risks to supply chains. Water Res. 2023, 229, 119442. [Google Scholar] [CrossRef]
- Sun, T.; Cheng, W.; Bo, Q.; Meng, X.; Liang, D. Analysis on historical flood and countermeasures in prevention and control of flood in Daqing River Basin. Environ. Res. 2021, 1961, 10895. [Google Scholar]
- Thomas, T.; Ghosh, N.C.; Sudheer, K.P. Optimal reservoir operation–A climate change adaptation strategy for Narmada basin in central India. J. Hydrol. 2021, 598, 126238. [Google Scholar] [CrossRef]
- van der Velde, Y.; Vercauteren, N.; Jaramillo, F.; Dekker, S.C.; Destouni, G.; Lyon, S.W. Exploring hydroclimatic change disparity via the Budyko framework. Hydrol. Process. 2014, 28, 4110–4118. [Google Scholar] [CrossRef]
- Wang, J.; Wei, H.; Liang, Z.; Zhan, S.; Jia, H.; Guo, S.; Ge, P. Contamination, risk and quantitative identification of nutrients and potentially toxic elements in the surface sediments of Baiyangdian Lake, North China. Ecotoxicology 2022, 31, 289–298. [Google Scholar] [CrossRef]
- Wang, L.H.; Liu, X.M.; Liu, Y.; Li, H.R.; Liu, J.Q.; Yang, L.B.; Maqbool, A. Emergency entity relationship extraction for water diversion project based on pre-trained model and multi-featured graph convolutional network. PLoS ONE 2023, 18, e0292004. [Google Scholar] [CrossRef] [PubMed]
- Wang, X.H.; Liu, X.F.; Sun, G.P. Increasing probability of concurrent drought between the water intake and receiving regions of the Hanjiang to Weihe River Water Diversion Project, China. J. Geogr. Sci. 2022, 32, 1998–2012. [Google Scholar] [CrossRef]
- Wu, J.; Luo, J.; Du, X.; Zhang, H.; Qin, S. Optimizing water allocation in an inter-basin water diversion project with equity-efficiency tradeoff: A bi-level multiobjective programming model under uncertainty. J. Clean. Prod. 2022, 371, 133606. [Google Scholar] [CrossRef]
- Yuan, R.; Wang, S.; Wang, P.; Song, X.; Tang, C. Changes in flow and chemistry of groundwater heavily affected by human impacts in the Baiyangdian catchment of the North China Plain. Environ. Earth Sci. 2017, 76, 571. [Google Scholar] [CrossRef]
- Zha, X.; Sun, H.; Jiang, H.; Cao, L.; Xue, J.; Gui, D.; Yan, D.; Tuo, Y. Coupling Bayesian Network and copula theory for water shortage assessment: A case study in source area of the South-to-North Water Division Project (SNWDP). J. Hydrol. 2023, 620, 129434. [Google Scholar] [CrossRef]
- Zhang, Q.; Li, Y.; Huang, G.; Wang, H.; Li, Y.; Liu, Y.; Shen, Z. A novel statistical downscaling approach for analyzing daily precipitation and extremes under the impact of climate change: Application to an arid region. J. Hydrol. 2022, 615, 128730. [Google Scholar] [CrossRef]
- Zhao, Y.; Han, J.; Zhang, B.; Gong, J. Impact of transferred water on the hydrochemistry and water quality of surface water and groundwater in Baiyangdian Lake, North China. Geosci. Front. 2021, 12, 101086. [Google Scholar] [CrossRef]
- Zhu, C.; Li, W. Comparison of GRACE/GRACE-FO Spherical Harmonic Coefficient and Mascon Products in Explaining the Influence of South-to-North Water Transfer Project on Water Reserves in the North China Plain. Water 2023, 15, 2343. [Google Scholar] [CrossRef]
- Zhu, H.; Cao, K.; Chen, X.; Liu, X.; Zhang, X. Effects of suspended ecological beds on phytoplankton community structure in Baiyangdian Lake, China. J. Freshw. Ecol. 2022, 37, 189–202. [Google Scholar] [CrossRef]

| Joint Distribution | 1991–2003 | 2004–2020 | ||||
|---|---|---|---|---|---|---|
| Linking Function | AIC | OLS | Linking Function | AIC | OLS | |
| Frank | −62.3477 | 0.0842 | Frank | −92.8872 | 0.0614 | |
| Clayton * | −62.7878 | 0.0828 | Clayton * | −96.0057 | 0.0560 | |
| Gumbel | −61.3595 | 0.0874 | Gumbel | −92.3029 | 0.0624 | |
| Frank * | −67.1725 | 0.0699 | Frank * | −91.7412 | 0.0631 | |
| Clayton | −66.7342 | 0.0711 | Clayton | −91.0185 | 0.0648 | |
| Gumbel | −67.0654 | 0.0702 | Gumbel | −91.7367 | 0.0635 | |
| --- | --- | --- | Frank | −92.2354 | 0.0626 | |
| --- | --- | --- | Clayton * | −96.8439 | 0.0546 | |
| --- | --- | --- | Gumbel | −91.4554 | 0.0640 | |
| Joint Distribution | Period | Optimal Linking Function | θ |
|---|---|---|---|
| 1991–2003 | Clayton | 1.5455 | |
| 2004–2020 | Clayton | 0.8333 | |
| 1991–2003 | Frank | 5.0770 | |
| 2004–2020 | Frank | 3.3644 | |
| 2004–2020 | Clayton | 7.7135 |
| Frequency type | 37.5% | 62.5% |
| Pre-water transfer annual underlying surface water supply (mm) | 789.70 | 590.97 |
| Pre-water transfer annual (mm) | 602.40 | 488.40 |
| Post-water transfer annual underlying surface water supply (mm) | 872.40 | 700.90 |
| Post-water transfer annual (mm) | 667.80 | 593.50 |
| Synchronous Abundant and Dry Frequency | Asynchronous Abundant and Dry Frequency | |||||||||
|---|---|---|---|---|---|---|---|---|---|---|
| Total | A | A | N | N | D | D | Total | |||
| Same abundant | Same normal | Same dry | N | D | D | A | A | N | ||
| 22.84% | 10.45% | 18.49% | 51.78% | 16.42% | 3.46% | 9.42% | 4.15% | 5.90% | 8.87% | 48.22% |
| Synchronous Abundant and Dry Frequency | Asynchronous Abundant and Dry Frequency | |||||||||
|---|---|---|---|---|---|---|---|---|---|---|
| Total | A | A | N | N | D | D | Total | |||
| Same abundant | Same normal | Same dry | N | D | D | A | A | N | ||
| 28.45% | 16.30% | 30.95% | 75.70% | 9.14% | 0.33% | 4.81% | 5.83% | 0.38% | 3.81% | 24.30% |
Disclaimer/Publisher’s Note: The statements, opinions and data contained in all publications are solely those of the individual author(s) and contributor(s) and not of MDPI and/or the editor(s). MDPI and/or the editor(s) disclaim responsibility for any injury to people or property resulting from any ideas, methods, instructions or products referred to in the content. |
© 2025 by the authors. Licensee MDPI, Basel, Switzerland. This article is an open access article distributed under the terms and conditions of the Creative Commons Attribution (CC BY) license (https://creativecommons.org/licenses/by/4.0/).
Share and Cite
Shi, Y.; Zhang, L.; Zhang, J. Impact Analysis of Inter-Basin Water Transfer on Water Shortage Risk in the Baiyangdian Area. Water 2025, 17, 2311. https://doi.org/10.3390/w17152311
Shi Y, Zhang L, Zhang J. Impact Analysis of Inter-Basin Water Transfer on Water Shortage Risk in the Baiyangdian Area. Water. 2025; 17(15):2311. https://doi.org/10.3390/w17152311
Chicago/Turabian StyleShi, Yuhang, Lixin Zhang, and Jinping Zhang. 2025. "Impact Analysis of Inter-Basin Water Transfer on Water Shortage Risk in the Baiyangdian Area" Water 17, no. 15: 2311. https://doi.org/10.3390/w17152311
APA StyleShi, Y., Zhang, L., & Zhang, J. (2025). Impact Analysis of Inter-Basin Water Transfer on Water Shortage Risk in the Baiyangdian Area. Water, 17(15), 2311. https://doi.org/10.3390/w17152311