Article

Creating Micro-Habitat in a Pool-Weir Fish Pass with Flexible Hydraulic Elements: Insights from Field Experiments

by
Mehmet Salih Turker
1,2 and
Serhat Kucukali
1,*
1
Hydraulics Division, Civil Engineering Department, Hacettepe University, 06810 Ankara, Turkey
2
Hydraulics Division, Civil Engineering Department, Ankara Yıldırım Beyazit University, 06010 Ankara, Turkey
*
Author to whom correspondence should be addressed.
Water 2025, 17(15), 2294; https://doi.org/10.3390/w17152294 (registering DOI)
Submission received: 24 May 2025 / Revised: 28 July 2025 / Accepted: 28 July 2025 / Published: 1 August 2025
(This article belongs to the Section Hydraulics and Hydrodynamics)

Abstract

The placement of hydraulic elements in existing pool-type fishways to make them more suitable for Cyprinid fish is an issue of increasing interest in fishway research. Hydrodynamic characteristics and fish behavior at the representative pool of the fishway with bottom orifices and notches were assessed at the Dagdelen hydropower plant in the Ceyhan River Basin, Türkiye. Three-dimensional velocity measurements were taken in the pool of the fishway using an Acoustic Doppler velocimeter. The measurements were taken with and without a brush block at two different vertical distances from the bottom, which were below and above the level of bristles tips. A computational fluid dynamics (CFD) analysis was conducted for the studied fishway. The numerical model utilized Large Eddy Simulation (LES) combined with the Darcy–Forchheimer law, wherein brush blocks were represented as homogenous porous media. Our results revealed that the relative submergence of bristles in the brush block plays a very important role in velocity and Reynolds shear stress (RSS) distributions. After the placement of the submerged brush block, flow velocity and the lateral RSS component were reduced, and a resting area was created behind the brush block below the bristles’ tips. Fish movements in the pool were recorded by underwater cameras under real-time operation conditions. The heatmap analysis, which is a 2-dimensional fish spatial presence visualization technique for a specific time period, showed that Capoeta damascina avoided the areas with high turbulent fluctuations during the tests, and 61.5% of the fish presence intensity was found to be in the low Reynolds shear regions in the pool. This provides a clear case for the real-world ecological benefits of retrofitting existing pool-weir fishways with such flexible hydraulic elements.

1. Introduction

This paper focuses on the pool-weir fishway which is the most common fish pass structure around the world [1,2]. While fish pass through the orifice in the pool-weir fishway using their burst speed, they need resting areas to continue to pass through the next pool. Conventional pool-weir fish pass structures typically provide a hydraulic pattern downstream of orifices, and fish of all sizes and swimming abilities must adapt to these conditions and pass through the critical section, where the maximum local velocity occurs, although this may not always be possible. For instance, Santos et al. [3] noted that more than half of the fishways in Portugal are not suitable for Cyprinid fish species. It is difficult for small and weak-swimming fish to pass through fishways at steep slopes and high flow rates [4,5,6,7]. In this respect, creating an additional resting zone in the pool-weir fishway is critical for the fish to make their upstream migration more effective.
Many studies investigated hydraulic modifications in pool-weir fishways to enhance fish passage conditions [8,9,10]. Kim [11] studied the configuration of the notch-orifice combination for the upstream migration case in the pool-weir fishway. According to the results, a straight-type configuration was the best for fish to create resting zones in the pool [11]. In contrast, Silva et al. [12] found the highest passage efficiency of the pool-weir fishway with offset orifices. Fuentes-Pérez et al. [13] studied the bottom orifices and notches in pool-type fishways for uniform and non-uniform flow conditions, and a new formulation was proposed for the water level distribution. Brancoet et al. [14] investigated the fish behavior under plunging and streaming flow regimes.
From a behavioral perspective, turbulence—especially Reynolds shear stress (RSS)—has been demonstrated to dramatically affect fish locomotion. Silva et al. [12] and Silva et al. [15] identified lateral RSS as the principal turbulence parameter influencing the upstream movement of small-bodied fish, noting significant negative correlations between the placement of Iberian barbel and lateral stress values in steep-slope fishways. Contrary to the experimental observations of Smith et al. [16], this correlation was the highest among all tested hydraulic characteristics against fish transit time in their experimental study.
Placing different hydraulic elements in pools is one of the techniques used to reduce velocity and turbulence [7]. In previous studies, impermeable hydraulic elements were placed in pools to dissipate the flow energy and prevent turbulence [2,12,17]. However, this configuration has caused a new turbulence field (wake) behind the obstacle, and the created recirculation zone has not been particularly beneficial for the passage of small fish species [17]. This is because fish avoid recirculation zones. Tarrade et al. [17] and Aleyasin et al. [18] noted that there is a risk of small-bodied fish being trapped or disoriented in the large recirculation zone in the central part of the pool. Flexible hydraulic elements like bristles have gained interest for their capacity to absorb flow energy and establish advantageous microhabitats by generating low-velocity zones through their vibration-induced wake structures [9,19,20,21].
Pool-weir fishways have been studied in the laboratory [10,11,12,15,22,23], but there are limited studies that have taken measurements in real-time operation conditions [24,25]. Due to the variability of field boundary conditions, the difficulty of conducting measurements, and the inability to adjust hydraulic conditions, researchers investigated fish behaviors using scaled models in the laboratory. However, ideal boundary conditions in the laboratory may not always replicate field conditions. Also, most of those Froude similarity-based physical models were subject to the Reynolds number viscous scale effects [26,27].
Bristles provide the following multiple benefits: they maintain structural integrity in extreme turbulence, display constant oscillation patterns that aid in kinetic energy dissipation, and are easily installed in existing systems [20,28,29]. However, vegetation mimics may fail or become entangled under intense flow, hence restricting their efficacy in practical applications. Consequently, bristles were chosen in this study as a more resilient and versatile alternative for retrofitting pool-weir fishways. The work by Kucukali et al. [19] is about field experiments at a newly constructed diagonal brush fishway, which does not include pools. On the other hand, the present study is about the placement of a brush block into the existing pool-weir fishway. The hydraulic calculations and flow structures are different in brush (i.e., uniform flow) and pool-weir fishways [26,29]. In the literature, studies are categorized based on the type of fishway from the point of view of both hydrodynamics [30] and fish passage efficiency [1]. To the best of our knowledge, it is the first time that a brush block was installed in a pool-weir fishway to create a microhabitat and dampen macro turbulence in real-time operation conditions.
This study mainly differs from the existing studies by using bristles as flexible hydraulic elements in pool-weir fishways and carrying out in situ measurements for turbulence characteristics and fish behavior. The objective of this study is to provide hydrodynamically favorable conditions for fish, such as surpassing a large recirculation zone in the central part of the pool and creating a resting area by placing flexible hydraulic elements (bristles). The primary aim of this study is to examine whether the incorporation of a brush block in a conventional pool-weir fishway may reduce the RSS by at least 15% in the pool and facilitate beneficial fish behavioral responses during actual field conditions. We test whether Cyprinid fish species occupy positions with energetically favorable hydrodynamic conditions that are likely to minimize their swimming costs, which is related to the energy expenditure needed to generate movements in a turbulent flow [31]. We also investigate the relationship between the position of the fish and the distribution of the RSS in a representative pool. This work will provide new insights into how Cyprinid and Leuciscid fish species interact with the modified flow conditions in the pool-weir fishway, which will be beneficial for retrofitting studies.

2. Materials and Methods

2.1. Study Site

The Dagdelen Hydroelectric Power Plant is located on the upper part of the Ceyhan River near the village of Çalış. The Ceyhan River rises in the Nurhak Mountains of the Eastern Taurus range, northeast of Elbistan in Türkiye. It flows southeast past Elbistan, where it is fed by the Harman Deresi and numerous other small streams and it discharges into the Mediterranean Sea with a total length of about 509 km. The catchment area of the Ceyhan River basin is about 20,670 km2. The annual average discharge of the Ceyhan River is 180 m3/s, with maximum and minimum values of 2250 m3/s and 20 m3/s, respectively. The minimum daily discharge values are observed between August and October, and maximum values are observed in April [32]. Several dams and weirs have been built in the Ceyhan River basin to generate hydropower (Figure 1), which has resulted in a considerable reduction in the availability of spawning grounds. In the project area, native Cyprinid and Leuciscid fish species have been subjected to significant habitat alteration and fragmentation due to the construction of dams and weirs for hydropower generation, which have raised concerns about the long-term sustainability of fish populations in the Ceyan River basin [32,33]. Just downstream of the Dagdelen powerhouse, the river width is in the range of 30 to 50 m with a bed slope in the order of 0.5%.
The Dagdelen hydroelectric power plant is located at the confluence of the Ceyhan River coming from Elbistan District, the Göksun River coming from Göksun District, and the Esendere Stream coming from the Berit Mountains, upstream of the Kandil Dam reservoir, which is in the Barbus zone (Figure 1). Dagdelen Small Hydropower Plant (SHP) has a combined installed capacity of 8 MW, and it started operations in 2013. The power plant consists of two Kaplan turbines, each with a power output of 4 MW. The Dagdelen Small Hydropower Plant (SHP) has a net head of 23 m and generates an average of 19 GWh of electricity per year. The Dagdelen Hydroelectric Power Plant has been awarded the “Carbon Gold Certificate” by The Gold Standard Foundation. Field experiments have been conducted at the pool-weir fishway of the Dagdelen hydropower plant (Figure 2). At Dagdelen SHP, a pool-weir fishway was established, incorporating pools and orifices. An offset-type orifice configuration was applied in the fish pass (Figure 3). The pool-weir fishway at the Dagdelen SHP has a length of 156.6 m with a 10% slope and a total height of 15.8 m. It consists of a total of 71 pools, with each pool having dimensions of 2 × 1.5 × 1.15 m (Table 1).
Although there was a bottom substrate in the design phase of the fishway, it was observed that there was no bottom substrate in the prototype. The channel bed was kept consistent across all test conditions to ensure that the only variable structural element was the presence or absence of brush blocks. Although some substrate-like materials can be observed in the recorded videos and photographs, these were not part of the experimental design. Such materials were introduced sporadically due to upstream sediment transport and were not fixed in place across different trials. Therefore, due to the small amount of such entrained material in the pool, their effects on fish movement are considered negligible. However, the size of the scattered materials on the channel bed (i.e., boulders) may obstruct the orifices and generate complete clogging or alter the flow field through the assessed fishway configuration. Before starting the experiments, the bed floor was carefully checked to determine the flow field accurately.
In the study area, six fish species are known to occur. Garra turcica Karaman, 1971, distributed in the Seyhan and Ceyhan drainages and small rivers south to Arsuz, can reach a maximum total body length of 11.5 cm. Its common name is Cilician Garra [34]. Capoeta erhani Turan, Kottelat & Ekmekçi, 2008, commonly known as the Cilician scraper, is endemic to the Seyhan and Ceyhan drainages in Southern Türkiye, found in a wide range of moderately to rapidly flowing streams and rivers with sandy, gravelly or rocky bottoms and commonly in reservoirs and large rivers. Capoeta damascina Valenciennes, 1842 inhabits a wide range extending from Seyhan, southward to Litani in Lebanon, comprising the entire Levant and eastward to Mesopotamia (Persian Gulf Basin). They can be found in lakes, fast and slow-flowing streams, and both clear and muddy waters. Alburnus kotschyi Steindachner, 1863, an endemic fish species to Türkiye, inhabits a small, isolated coastal stream at Arsuz on the Eastern Mediterranean coast, as well as the Ceyhan and Seyhan River basins in Southern Anatolia. Alburnus kotschyi is a small-bodied fish with a total body length of less than 20 cm [35]. Squalius kottelati Turan, Yılmaz & Kaya, 2009, also known as the Cilician pike chub, is a ray-finned fish species belonging to the family Leuciscidae. It inhabits the Tahtalıköprü reservoir in the Asi River drainage, as well as the drainages of the Ceyhan and Seyhan rivers in Türkiye. Chondrostoma ceyhanense is presently observed only in the Ceyhan, Seyhan, and Berdan rivers (Tarsus) in Türkiye, and this species is commercially fished in the rivers [36]. All these species are potamodromous, and they are native to the study region [33]. According to the International Union for Conservation of Nature (IUCN), all fish species in the project area are in the Least Concern (LC) category. Bulbul et al. [37] used a trapping technique to study upstream fish migration at Dagdelen fishway, and they reported that between May 21 and July 29, 2017, the following numbers of fish species ascended the fishway: 911 Capoeta damascina, 878 Alburnus kotschyi, 125 Squalius kottelati, 144 Garra turcica, and 15 Capoeta erhani. In the present study, during the field experiments the following fish species were recorded in the pool-weir fishway: Capoeta damascina, Alburnus kotschyi, Garra turcica, and Chondrostoma ceyhanense. Capoeta damascina and Garra turcica remain in the Cyprinidae family, but Alburnus kotschyi and Chondrostoma ceyhanense are in Leuciscidae.
Sampling occurred during the May–July migration period, coinciding with the reproductive season for these species [33]. All recorded fish were confirmed as adults.

2.2. Flow and Turbulence Measurements

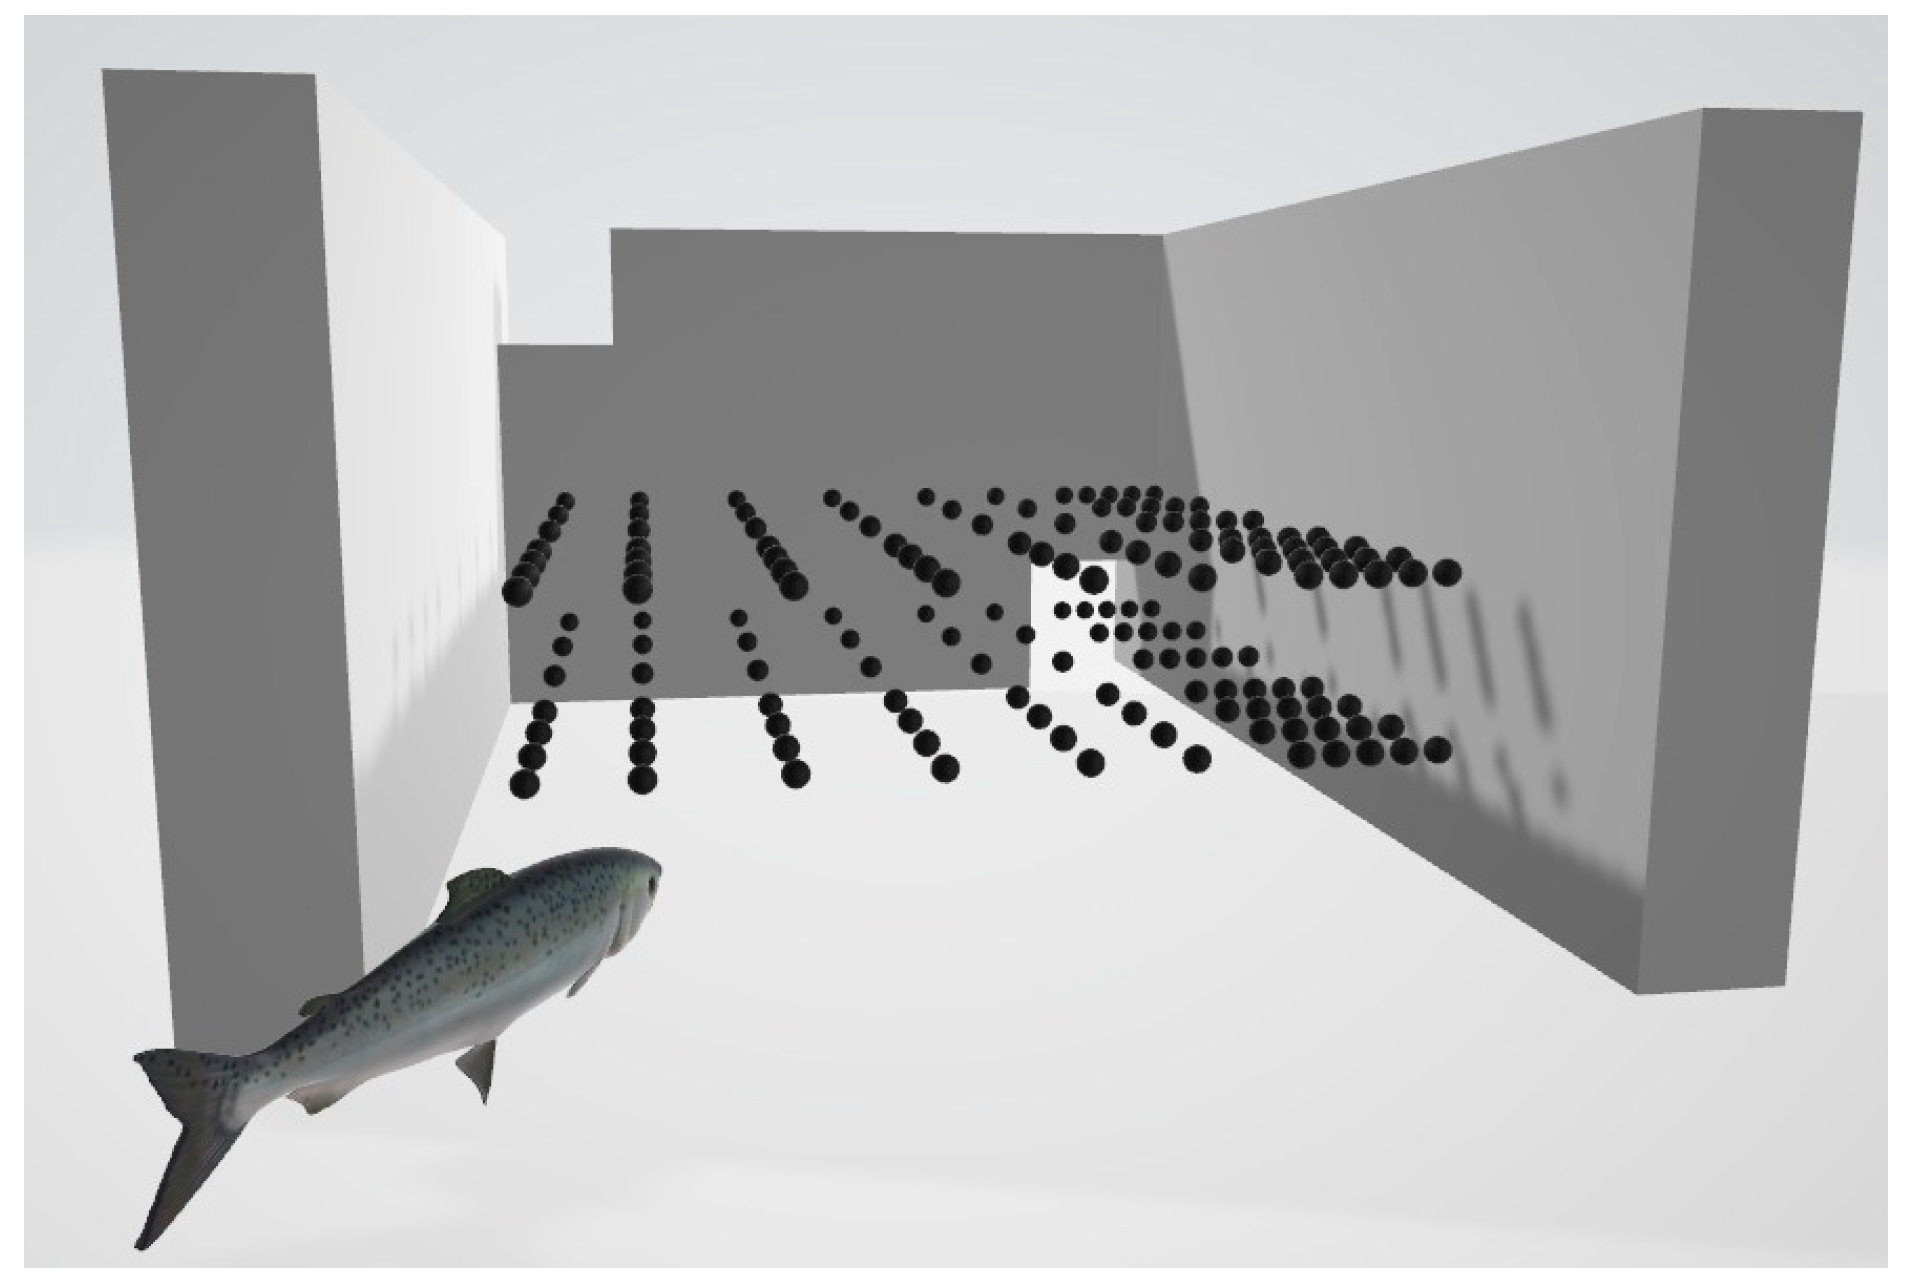
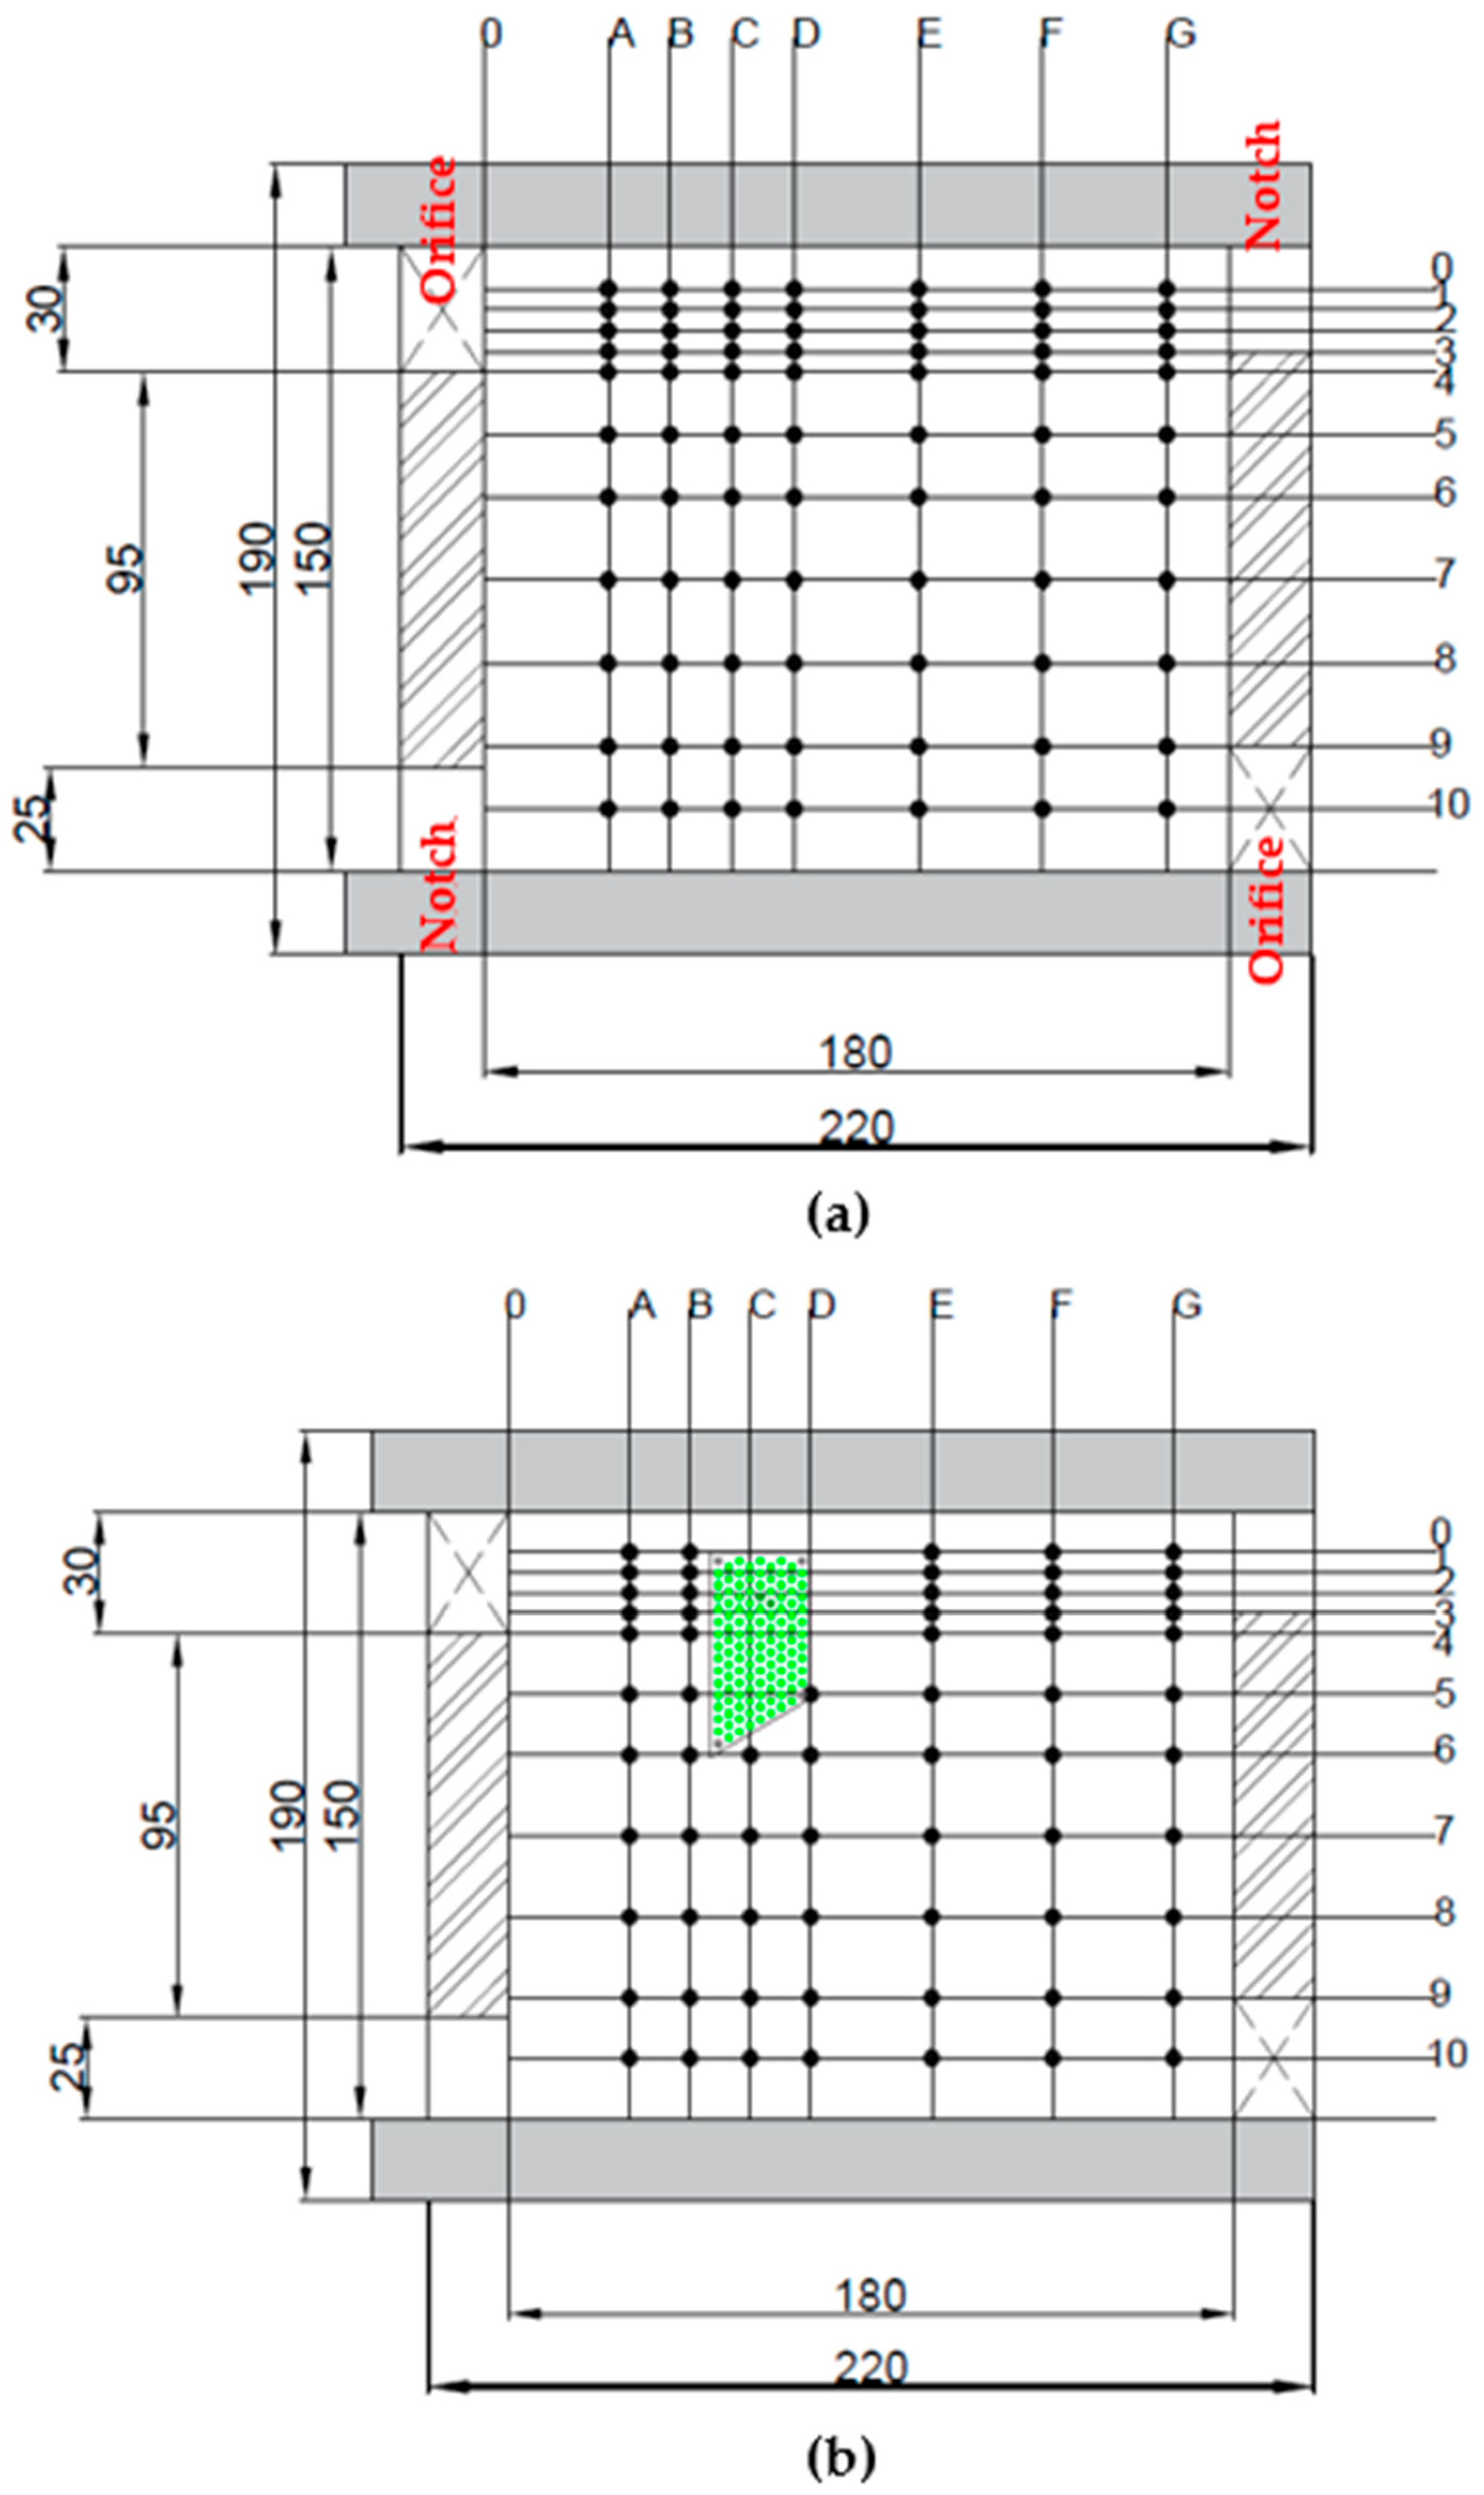
Along the fishway, flow structures tend to have repeating patterns in the pools. Accordingly, a representative pool, the fourth pool from the fishway entrance, was selected to carry out Acoustic Doppler Velocimeter, ADV (10-MHz Nortek Vectrino, Oslo, Norway)measurements due to field constraints. The upper pools were located adjacent to fenced areas, which limited access and instrument deployment. Moreover, the experimental setup required sufficient open space to install solar panels and a power supply system to operate the ADV and underwater video equipment. The fourth pool provided both physical accessibility and the necessary infrastructure capacity, while also being representative of the fishway’s central flow regime under the observed discharge conditions. A measurement grid was established from 154 measurement points at two different heights in the horizontal planes of z = 0.23 m and z = 0.48 m (Figure 4 and Figure 5). Thus, the measured flow conditions are considered representative of the hydraulic environment experienced by this target species. The average pool depth is 0.90 m. During the tests, there is only flow through the orifices, and there is no flow over the notches.
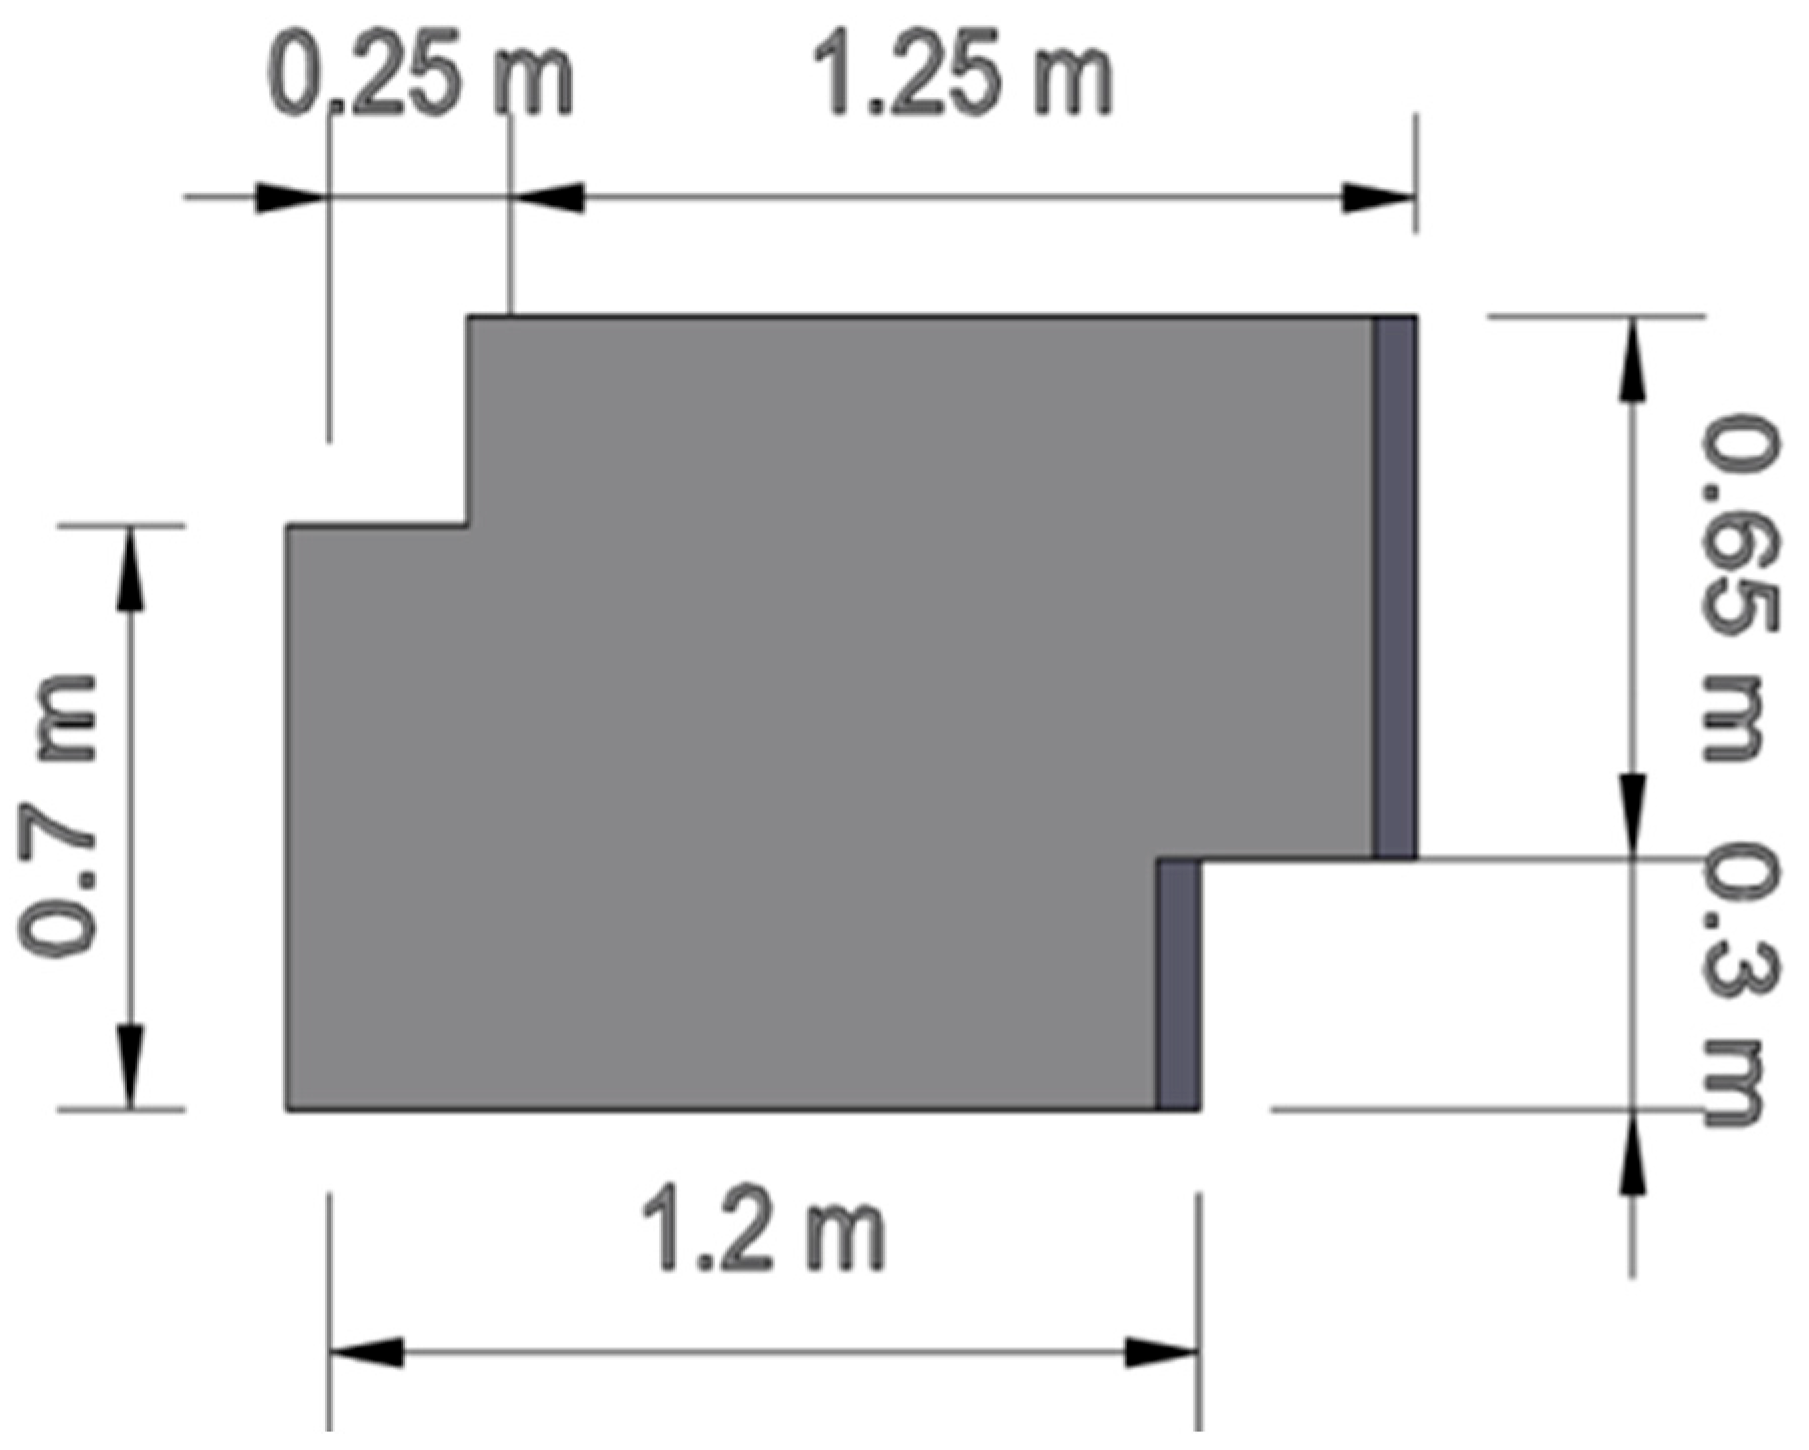
The ability of the ADV to move in all three axes on the pool was provided by a wheeled apparatus. The local velocity within the pool-weir fishway was collected under two different conditions: with and without a brush block. Only one brush block was installed in the fourth pool from the fishway entrance, and its location and dimensions are shown in Figure 6. The bristles are made of polypropylene and a service life of 15–20 years can be expected for the bristles. The bristle Young’s modulus of elasticity is 973 MPa and it has a density of 910 kg/m3 [19]. The bristles have a 0.37 m clear height, and each one has a 0.06 m diameter (Figure 6). The brush block has 124 bristle bundles. The relative submergence of bristles plays a very important role when taking into account the hydraulic conditions of the water flow through the fish pass. The velocity profile can be divided into two parts: a lower velocity profile below the brush level and a higher velocity profile above the bristles [38]. In the present study, the velocity data were collected below (z = 0.23 m) and above (z = 0.48 m) the bristles. The electrical energy needed for continuous velocity measurements was supplied from the solar panel and battery system. It should be noted that in Figure 6b, there is flow over the notches due to the tailwater effect. We did not conduct measurements when there was flow over the notches.
Although the maximum sampling capacity of the device is 200 Hz, it was reported that a high noise was observed at the very high sampling frequencies [39]. Accordingly, the data were collected with a sampling frequency of 100 Hz to achieve high signal-noise ratios. Primary tests for velocity measurements showed that a 30 s sampling duration was sufficient and gave consistent results for all measurement points. After acquiring the data, the data were filtered with signal-noise ratio (SNR) and correlation (COR) parameters using ExploreV 1.59 Pro software. During the ADV data processing, average correlation below 60% and signal-to-noise ratio (SNR) below 5 dB were removed.
The resultant local velocity Vm is calculated from
V m = u 2 + v 2 + w 2
where u, v, and w are the instantaneous velocities in the streamwise direction, lateral direction, and vertical direction, respectively. Vm is considered to be an important parameter in evaluating the migration corridors of different fish species [28]. The RSSs in the lateral, τxy, and vertical, τxz, directions are calculated from the following equations:
τ x y = ρ u v ¯
τ x z = ρ u w ¯
where ρ is the water density and u′, v′, and w′ are the fluctuating components of velocity in the x, y, and z directions, respectively. Fluctuating velocity components were extracted using Reynolds decomposition, where each velocity signal was separated into a mean and a fluctuating component.
u t = u ¯ + u ( t )
u t is the instantaneous velocity component, and u ¯ is the time-averaged velocity component. The RSSs are induced by velocity fluctuations and affect the momentum exchange and mixing processes. Given their physical importance, RSSs may also affect fish swimming performance and holding position [12,40]. In this study, the lateral component of the RSS was used, due to the high velocity gradients in the horizontal plane, as a reference parameter to evaluate the fish migration corridors and swimming energetic costs.

2.3. Underwater Video Recordings

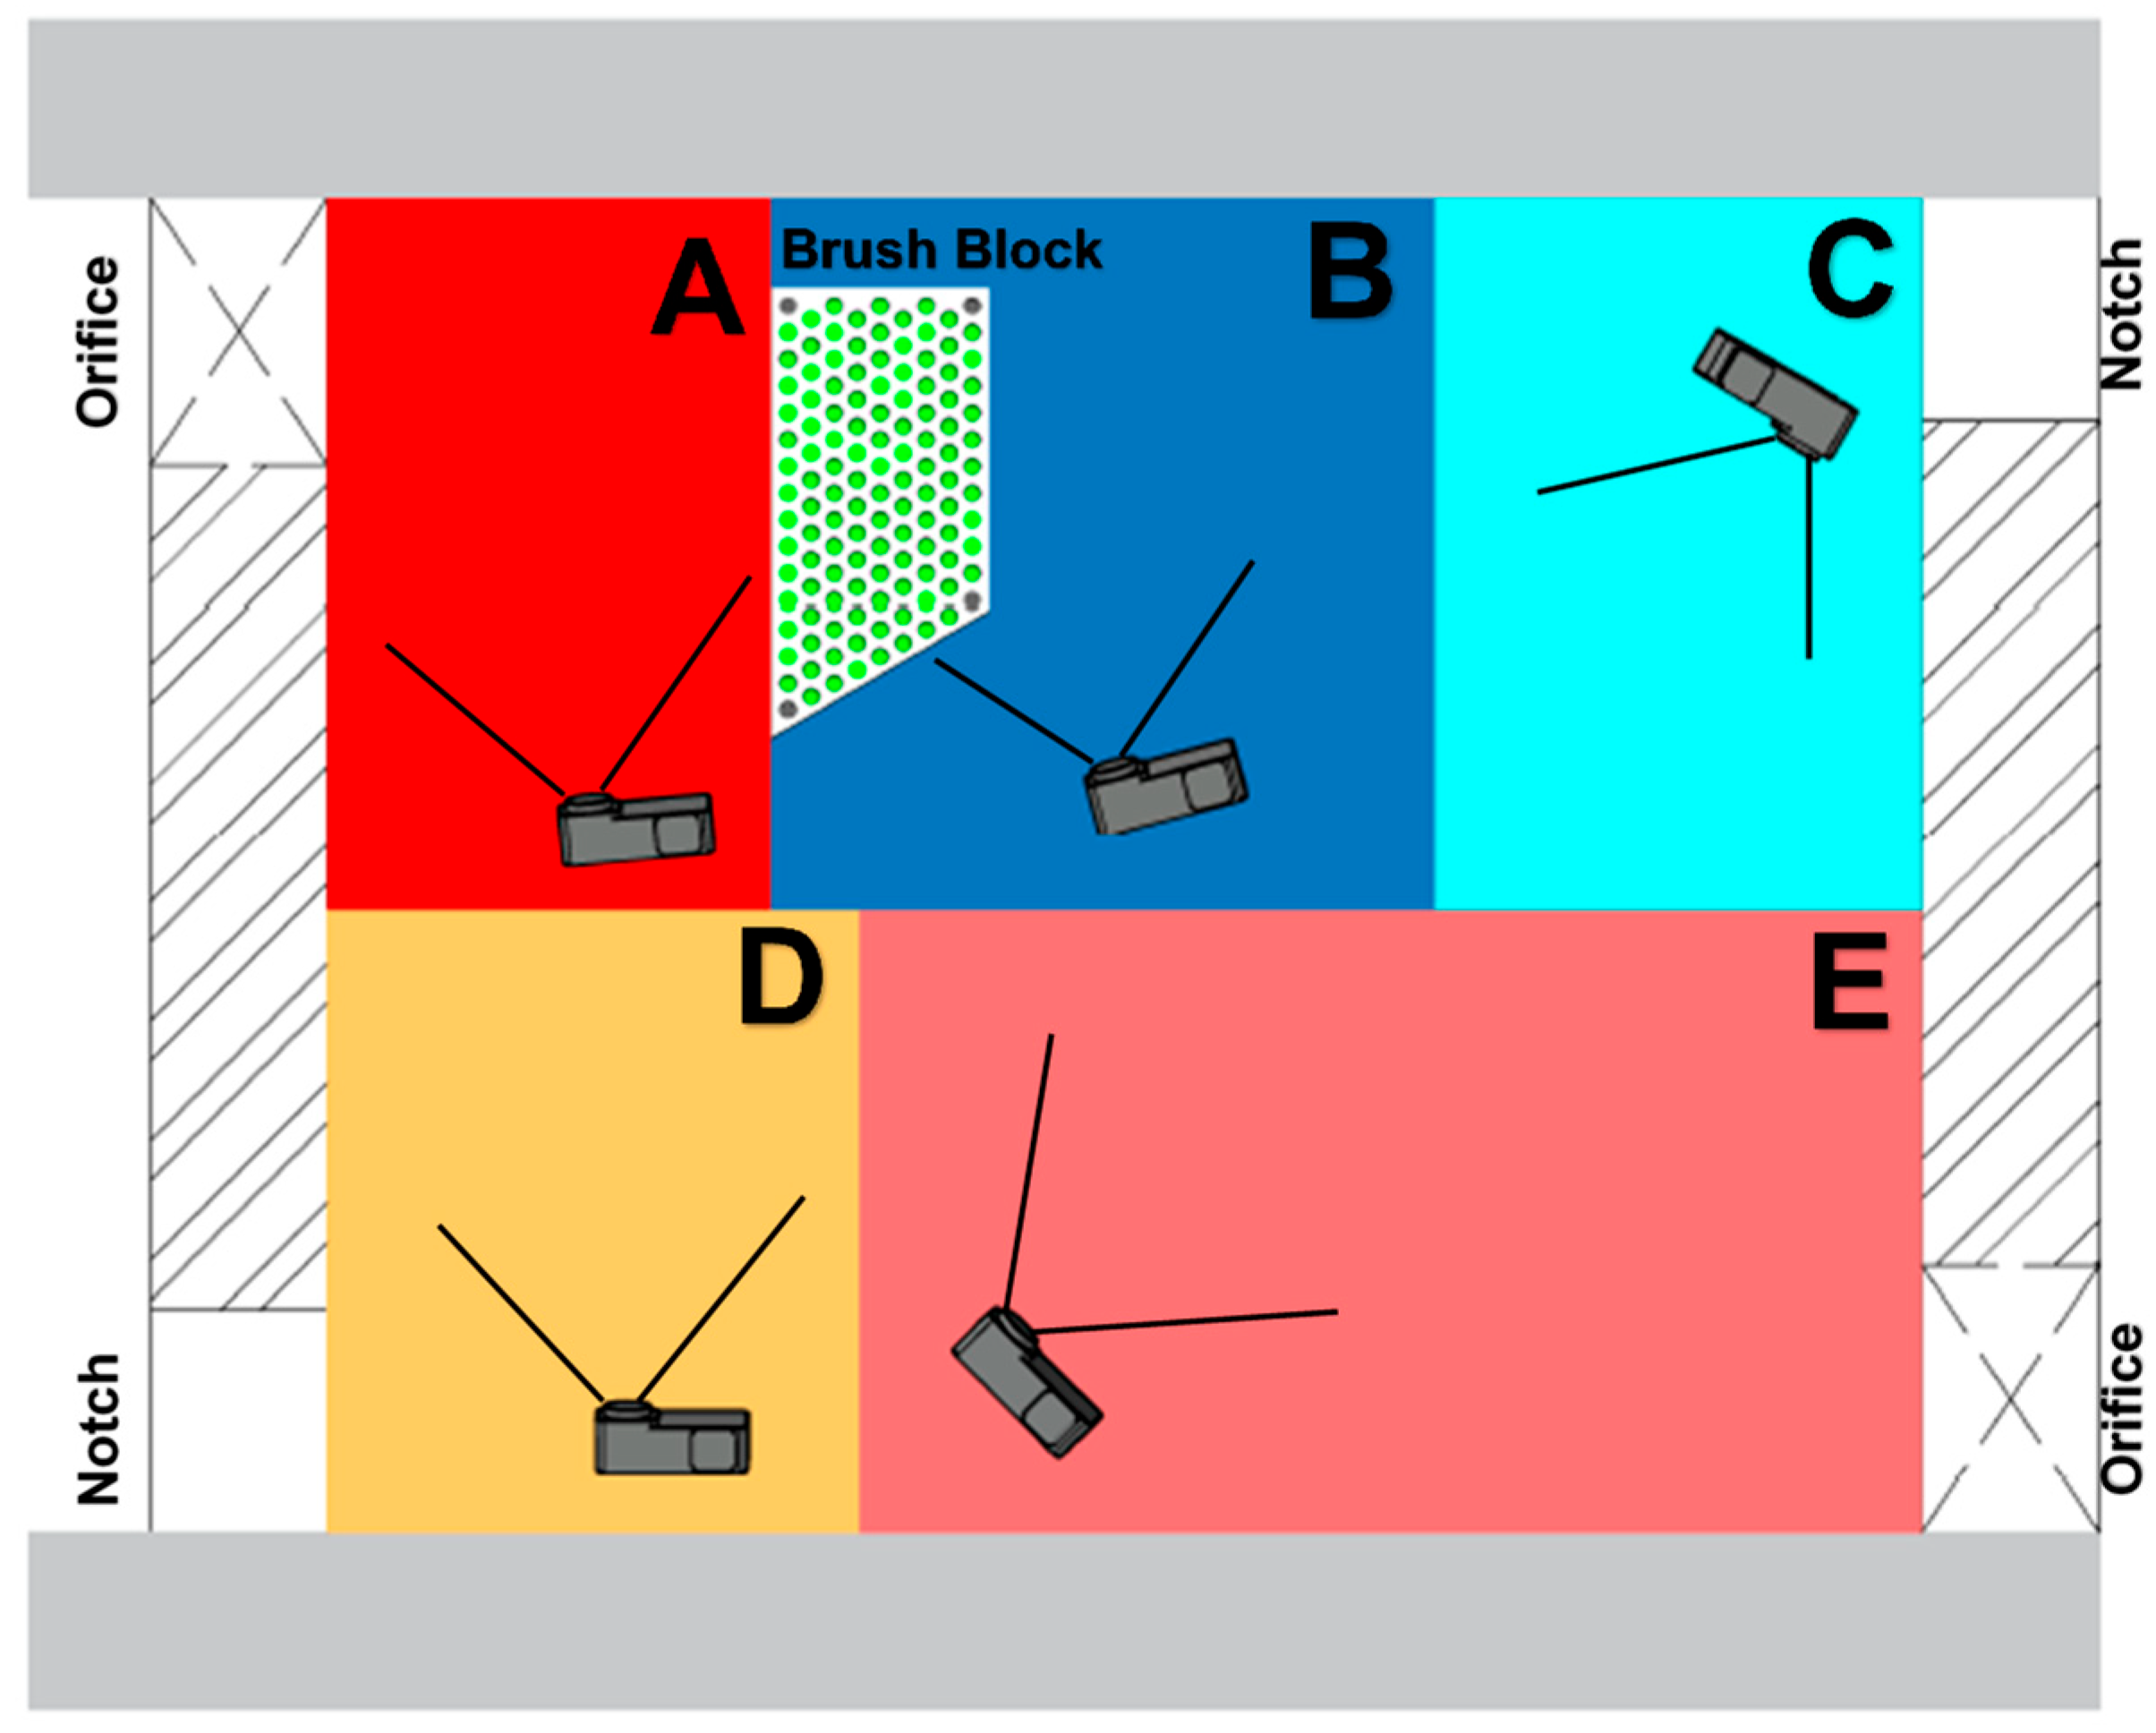
The quantification of fish movement is an important task for evaluating fish behavior. Accordingly, we placed an underwater video camera (GoPro Hero 5, GoPro, San Mateo, CA, USA) in the fish passage and made recordings for a duration of 60 min. The positions of the camera and the camera field of view are shown in Figure 7. The underwater video recordings were carried out on a single day in July 2022 during daylight conditions. A similar video recording technique was used by Kucukali [19] inside a brush fish passage. Fish positions and swimming mode as a function of time were derived from video recordings made using the GoPro Hero 5. The video recording frame rate was 60 frames per second with a spatial resolution of 1920 × 1080 pixels over a field of view of ~0.27 m. The video recordings were processed using the FFmpeg 4.3.1 software to extract individual frames at 60 frames per second. Fish tracking was performed manually by inspecting each frame to determine the location and swimming posture of individual fish. This manual frame-by-frame approach was selected over automated methods due to occasional motion blur, lighting variability, and the presence of overlapping fish in the frame.
Fish species were identified based on the visual inspection of the morphological features (e.g., body size, coloration, fin structure) visible in the recordings. Identification was cross-checked with regional fish identification guides and previous field studies in the same watershed. Based on these combined approaches, Capoeta damascina was identified as the dominant species observed during the study period.
Video recordings were divided into frames and these frames were studied individually to observe fish movement characteristics. By tracking a point on the fish’s body from frame to frame, it is possible to generate a trace of the fish’s position through time.
We conducted the fish presence heatmap analysis in order to characterize fish relative abundance in the representative pool during the test duration of 60 min. Detection of the fish in images is needed for generating a heatmap of fish movement patterns. The intensity map of the fish presence is measured in terms of the normalized fish-time seconds units. So, one fish belonging to some region for one second is considered to have an intensity of one fish-second. Only five regions shown in Figure 7, which are A, B, C, D, and E, are considered in the data collection process. For each region, Ri is computed from
R i = t = 0 T t N f i s h
where T is the total number of frames in the video recording and Nfish is the number of fish inside the area Ri at frame t. Then, each region Ri is normalized, and Fish Presence Intensity (FPI) is computed from
F P I = R i i = 0 5 R i
The zones were not meant to encompass the entire pool but were deliberately chosen based on observed flow patterns. Regions A and C corresponded to places exhibiting high RSS, often indicated by significant turbulence. Regions B and D were designated as low-velocity, low-turbulence areas with a potential resting zone. Region E was situated adjacent to the downstream slot, where fish were noted entering the pool. This region-based methodology aligns with prior research, including [41], which also divided observation zones to evaluate behavioral patterns under differing flow circumstances.

2.4. Numerical Model

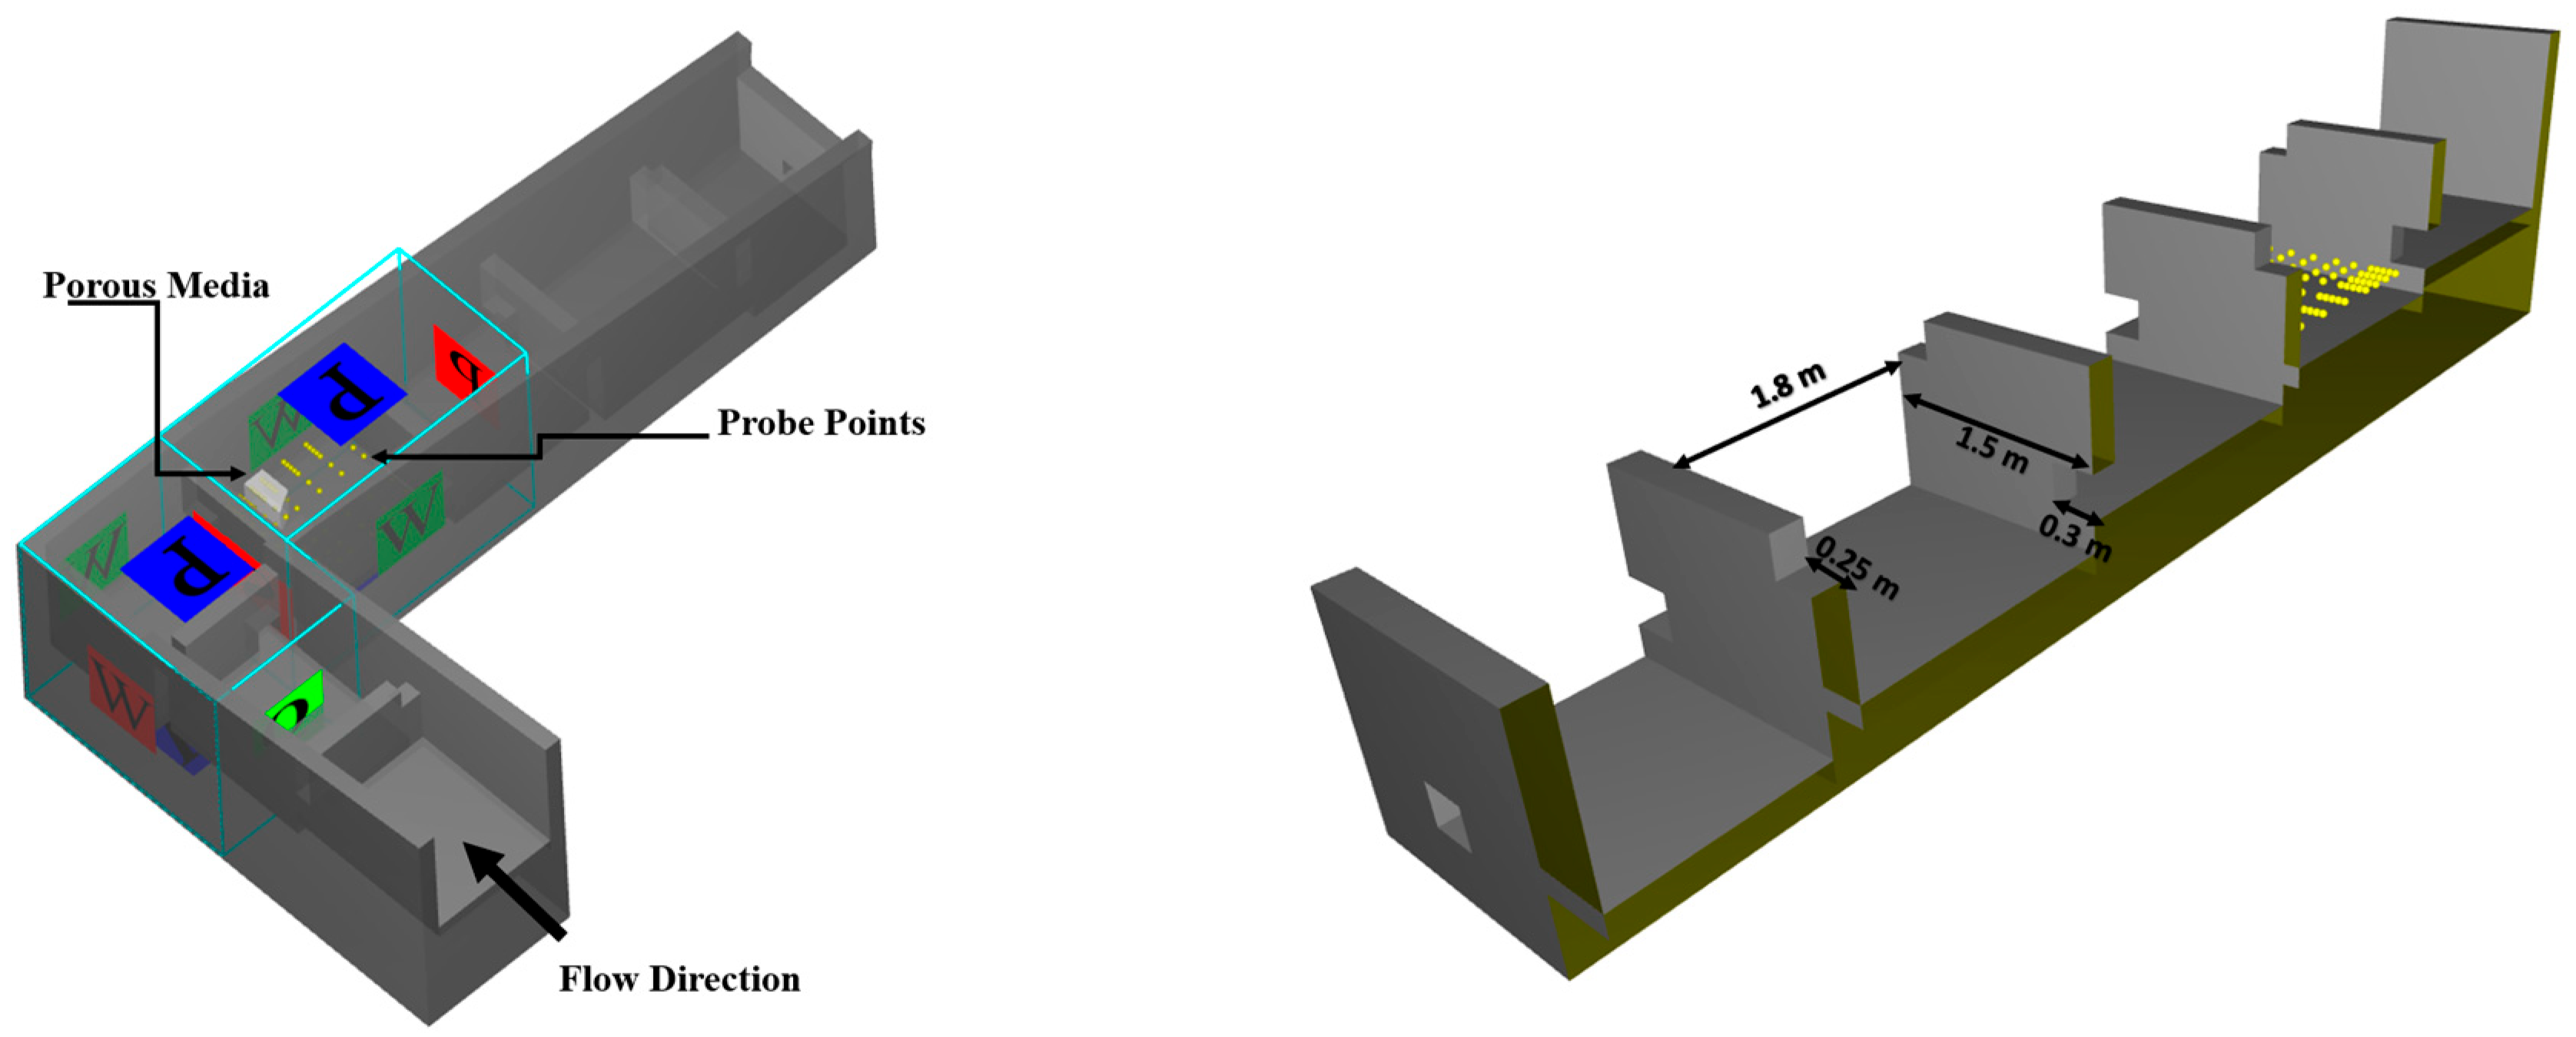
Numerical simulations offer considerable potential for enhancing the understanding of complex hydraulic phenomena, particularly in fish passage systems [30,42,43]. A crucial aspect of ensuring the reliability of such simulations lies in validating the numerical model against field measurements. In this context, the Large Eddy Simulation (LES) approach is employed, which directly resolves large-scale turbulent structures through the Navier–Stokes equations, while smaller-scale eddies are modeled using the Smagorinsky subgrid-scale model [44]. The recent literature highlights the effectiveness of the LES in capturing macro-scale vortical structures in three-dimensional flows, often yielding more accurate and consistent results than other turbulence models [13]. The LES model requires greater computer resources and a more refined mesh resolution than the Reynolds-Averaged Navier–Stokes (RANS) method. This study employed a mesh size of 0.02 m, resulting in roughly 3.3 × 10⁶ computational cells. This resolution, approximately 1/40th of the pool depth, is considered appropriate for effectively capturing the pertinent flow properties in LES-based simulations. In their 3D-LES investigation near groynes [45], a mesh size corresponding to 1/15th of the flow depth was employed. The computational model’s boundary conditions were established utilizing field-measured data. The simulation was conducted in 30 s intervals, corresponding to the period of the in situ velocity measurements. Velocity components were obtained at probe locations that correspond exactly to those utilized in the physical model. In the computational model, the virtual probes were situated at a vertical height of z = 0.23 m, facilitating direct comparison with the ADV data. The aim of the numerical model is first to verify the orifice flow regime obtained from the field and then to show the velocity and shear stress distribution under the orifice-notch flow regime (Figure 8).
Numerically, flexible hydraulic elements can be modeled as homogeneous porous media using the Darcy–Forchheimer approach, which allows for an efficient representation of their hydraulic resistance without explicitly resolving complex structures, as demonstrated in previous studies [46,47]. In this method, flow through a saturated porous medium is described by Forchheimer’s equation, which accounts for both linear and nonlinear pressure losses [48]. By combining the linear (Darcian) and quadratic (non-Darcian) flow resistance components, the total drag force Fd exerted by the porous medium, such as brush structures, on the flow can be expressed through a unified formulation. This expression is used to represent the influence of brush-induced resistance on the flow field within the numerical model (Figure 8).
F d = μ ρ 1 V f V f A 1 V f V f + B R e P d pore  
In the porous media formulation, Vf represents the porosity of the medium, while A and B denote the Forchheimer coefficients that quantify the resistive drag imposed by the porous structure. These coefficients are functions of the physical characteristics of the porous material and are influenced by the pore Reynolds number Rep, the pore diameter dp, the dynamic viscosity μ, and the fluid density ρ. The values of A and B in Equation (6) are determined by using Ergun equations, as implemented in FLOW-3D v11.04 software.
In the present study, the brush block used in the simulations comprises 120 bristle bundles, each containing five individual bristles. The diameters of the bristles and bundles are 6 mm and 17 mm, respectively. Additionally, the assembly includes four screws for fixation. Based on the geometric configuration of the brush block, the porosity Vf was calculated as 0.74. Consequently, the Forchheimer drag coefficients were determined as A = 346,341 m−2 and B = 34.35 m−1, which are employed in the CFD model to represent the flow resistance introduced by the brush structure.
The Mean Absolute Error (MAE) is used to evaluate the accuracy of the numerical model by comparing simulated results with experimental or field measurements. It provides a straightforward measure of the average magnitude of errors between predicted and observed values without considering their direction. In this study, MAE was particularly applied to assess flow velocity and shear stress data, helping to validate the reliability of the numerical simulations. A lower MAE value indicates better model performance and higher agreement with the reference data, which is essential for ensuring the credibility of fishway hydraulic analysis. The MAE can be calculated as follows:
M A E = 1 n M e a s u r e d S i m u l a t e d
where n stands for the total number of data points that are under comparison.

3. Results

3.1. In Situ Flow Measurement Results

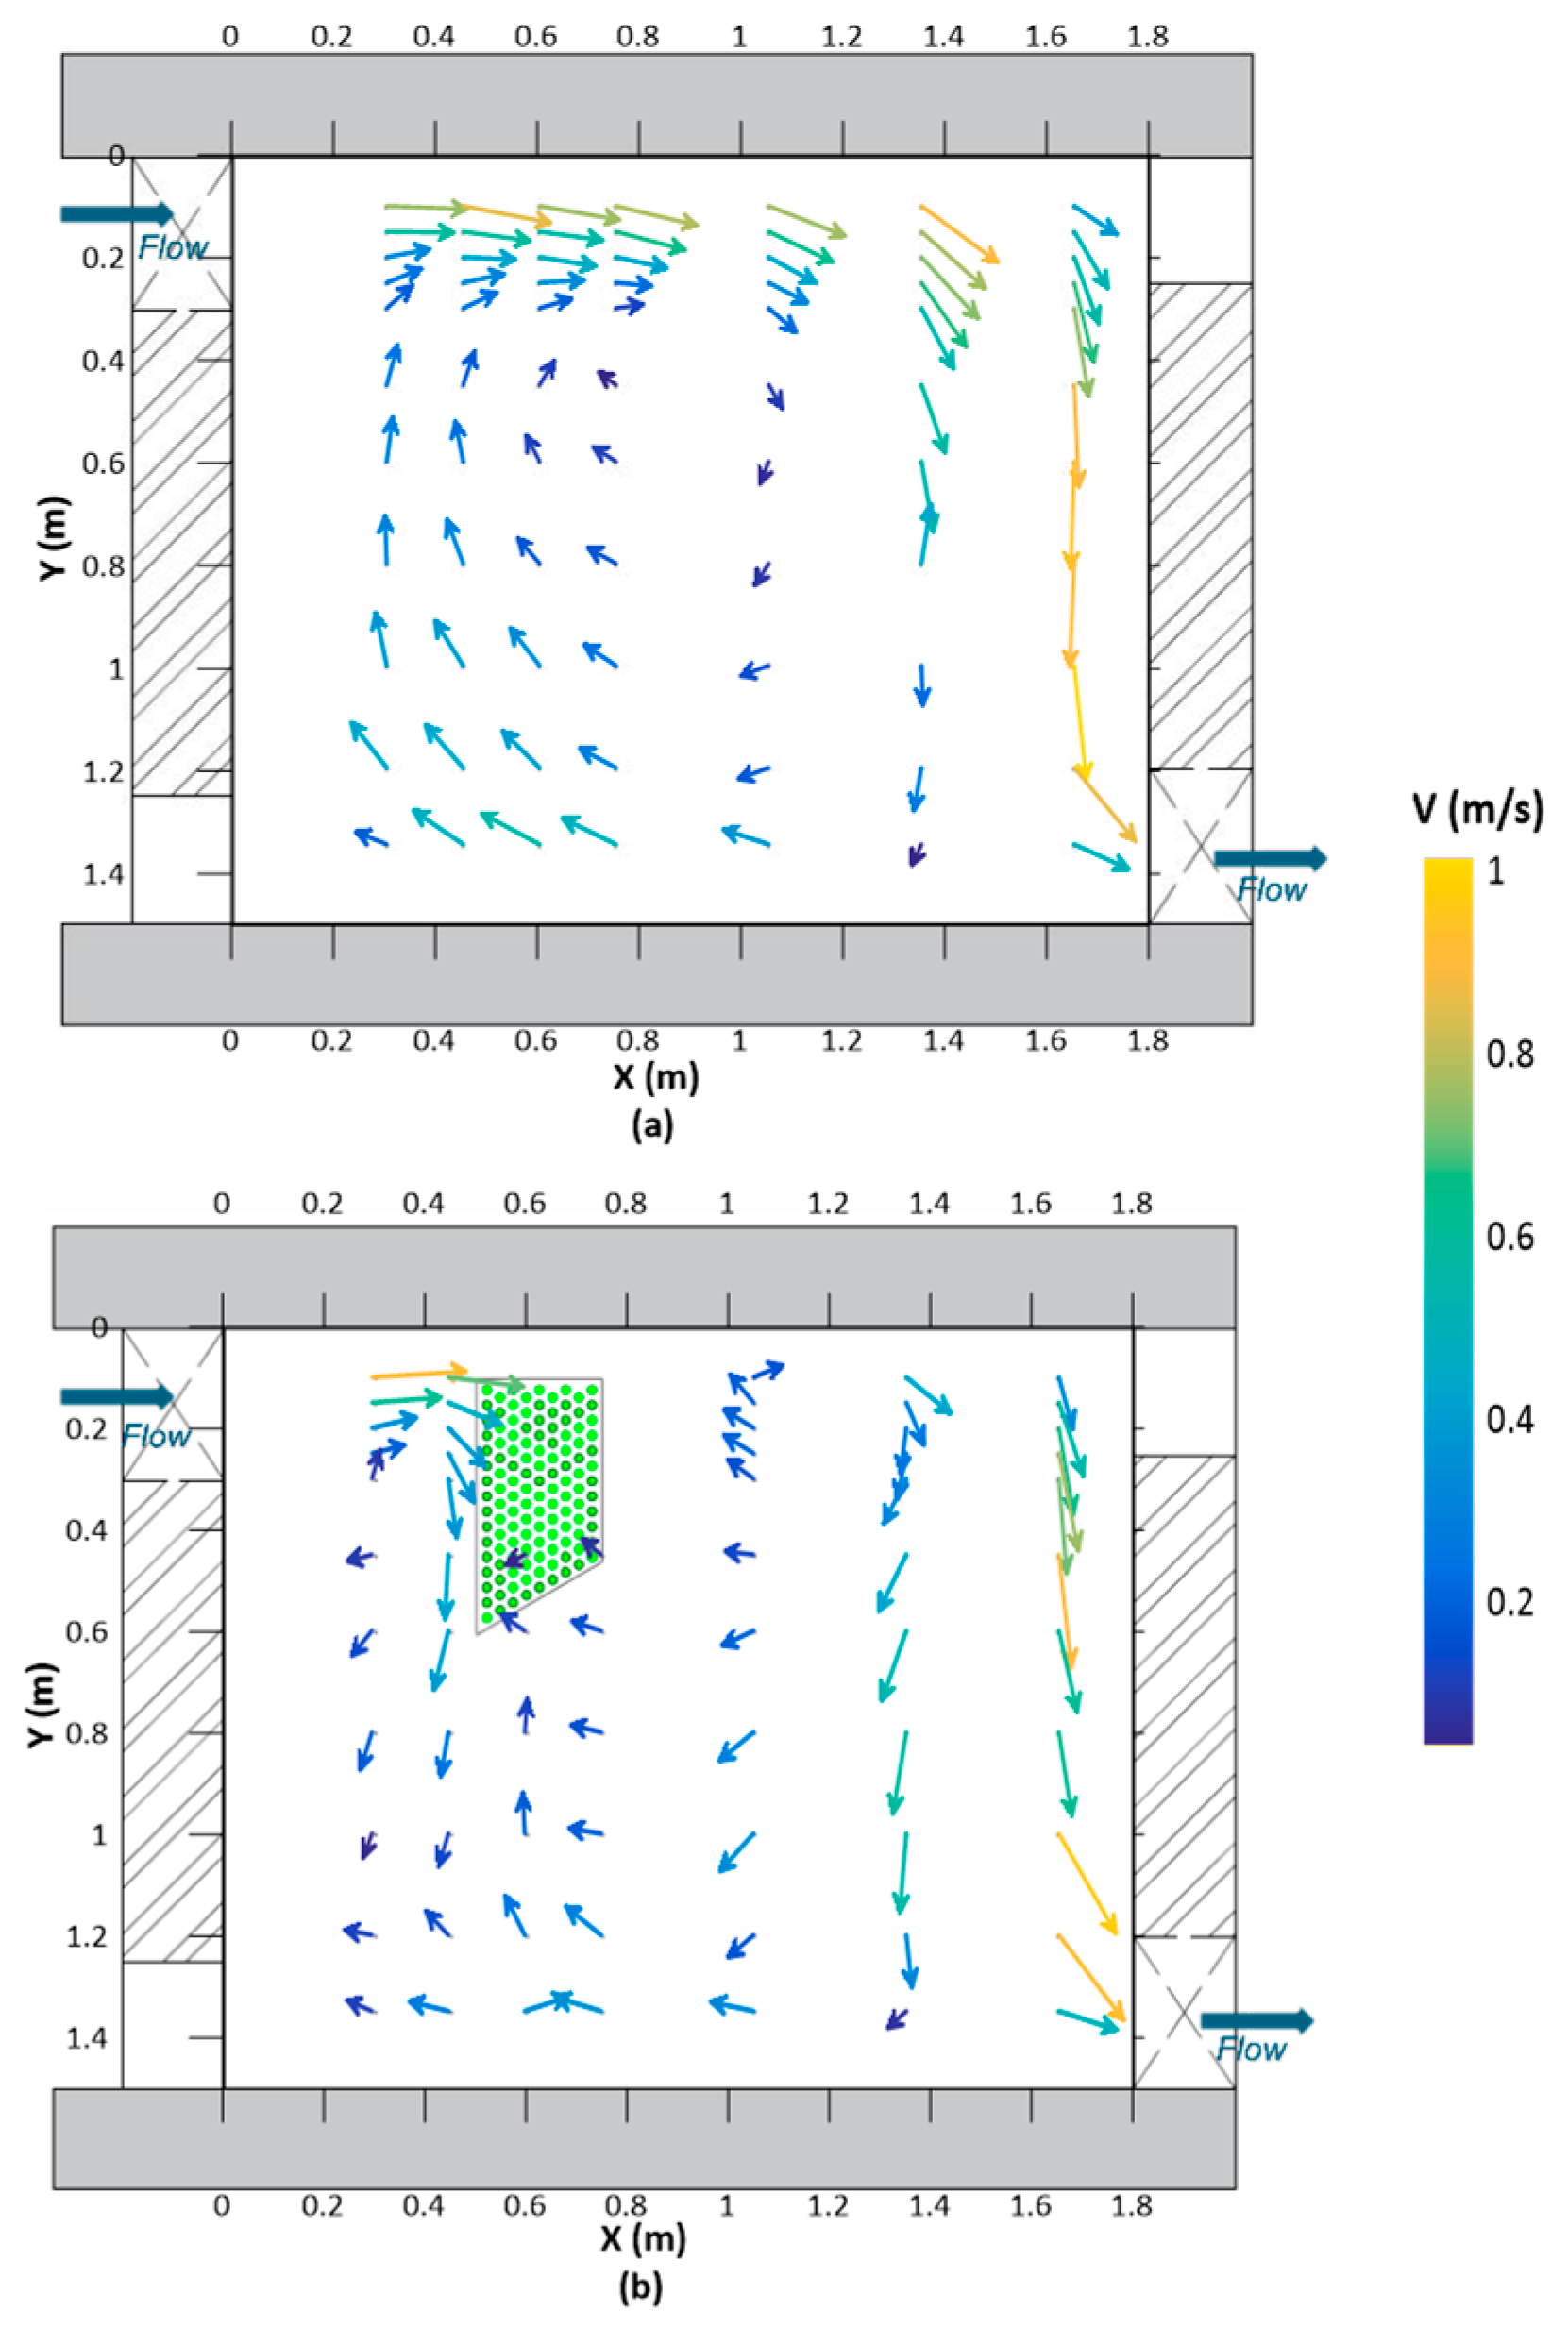
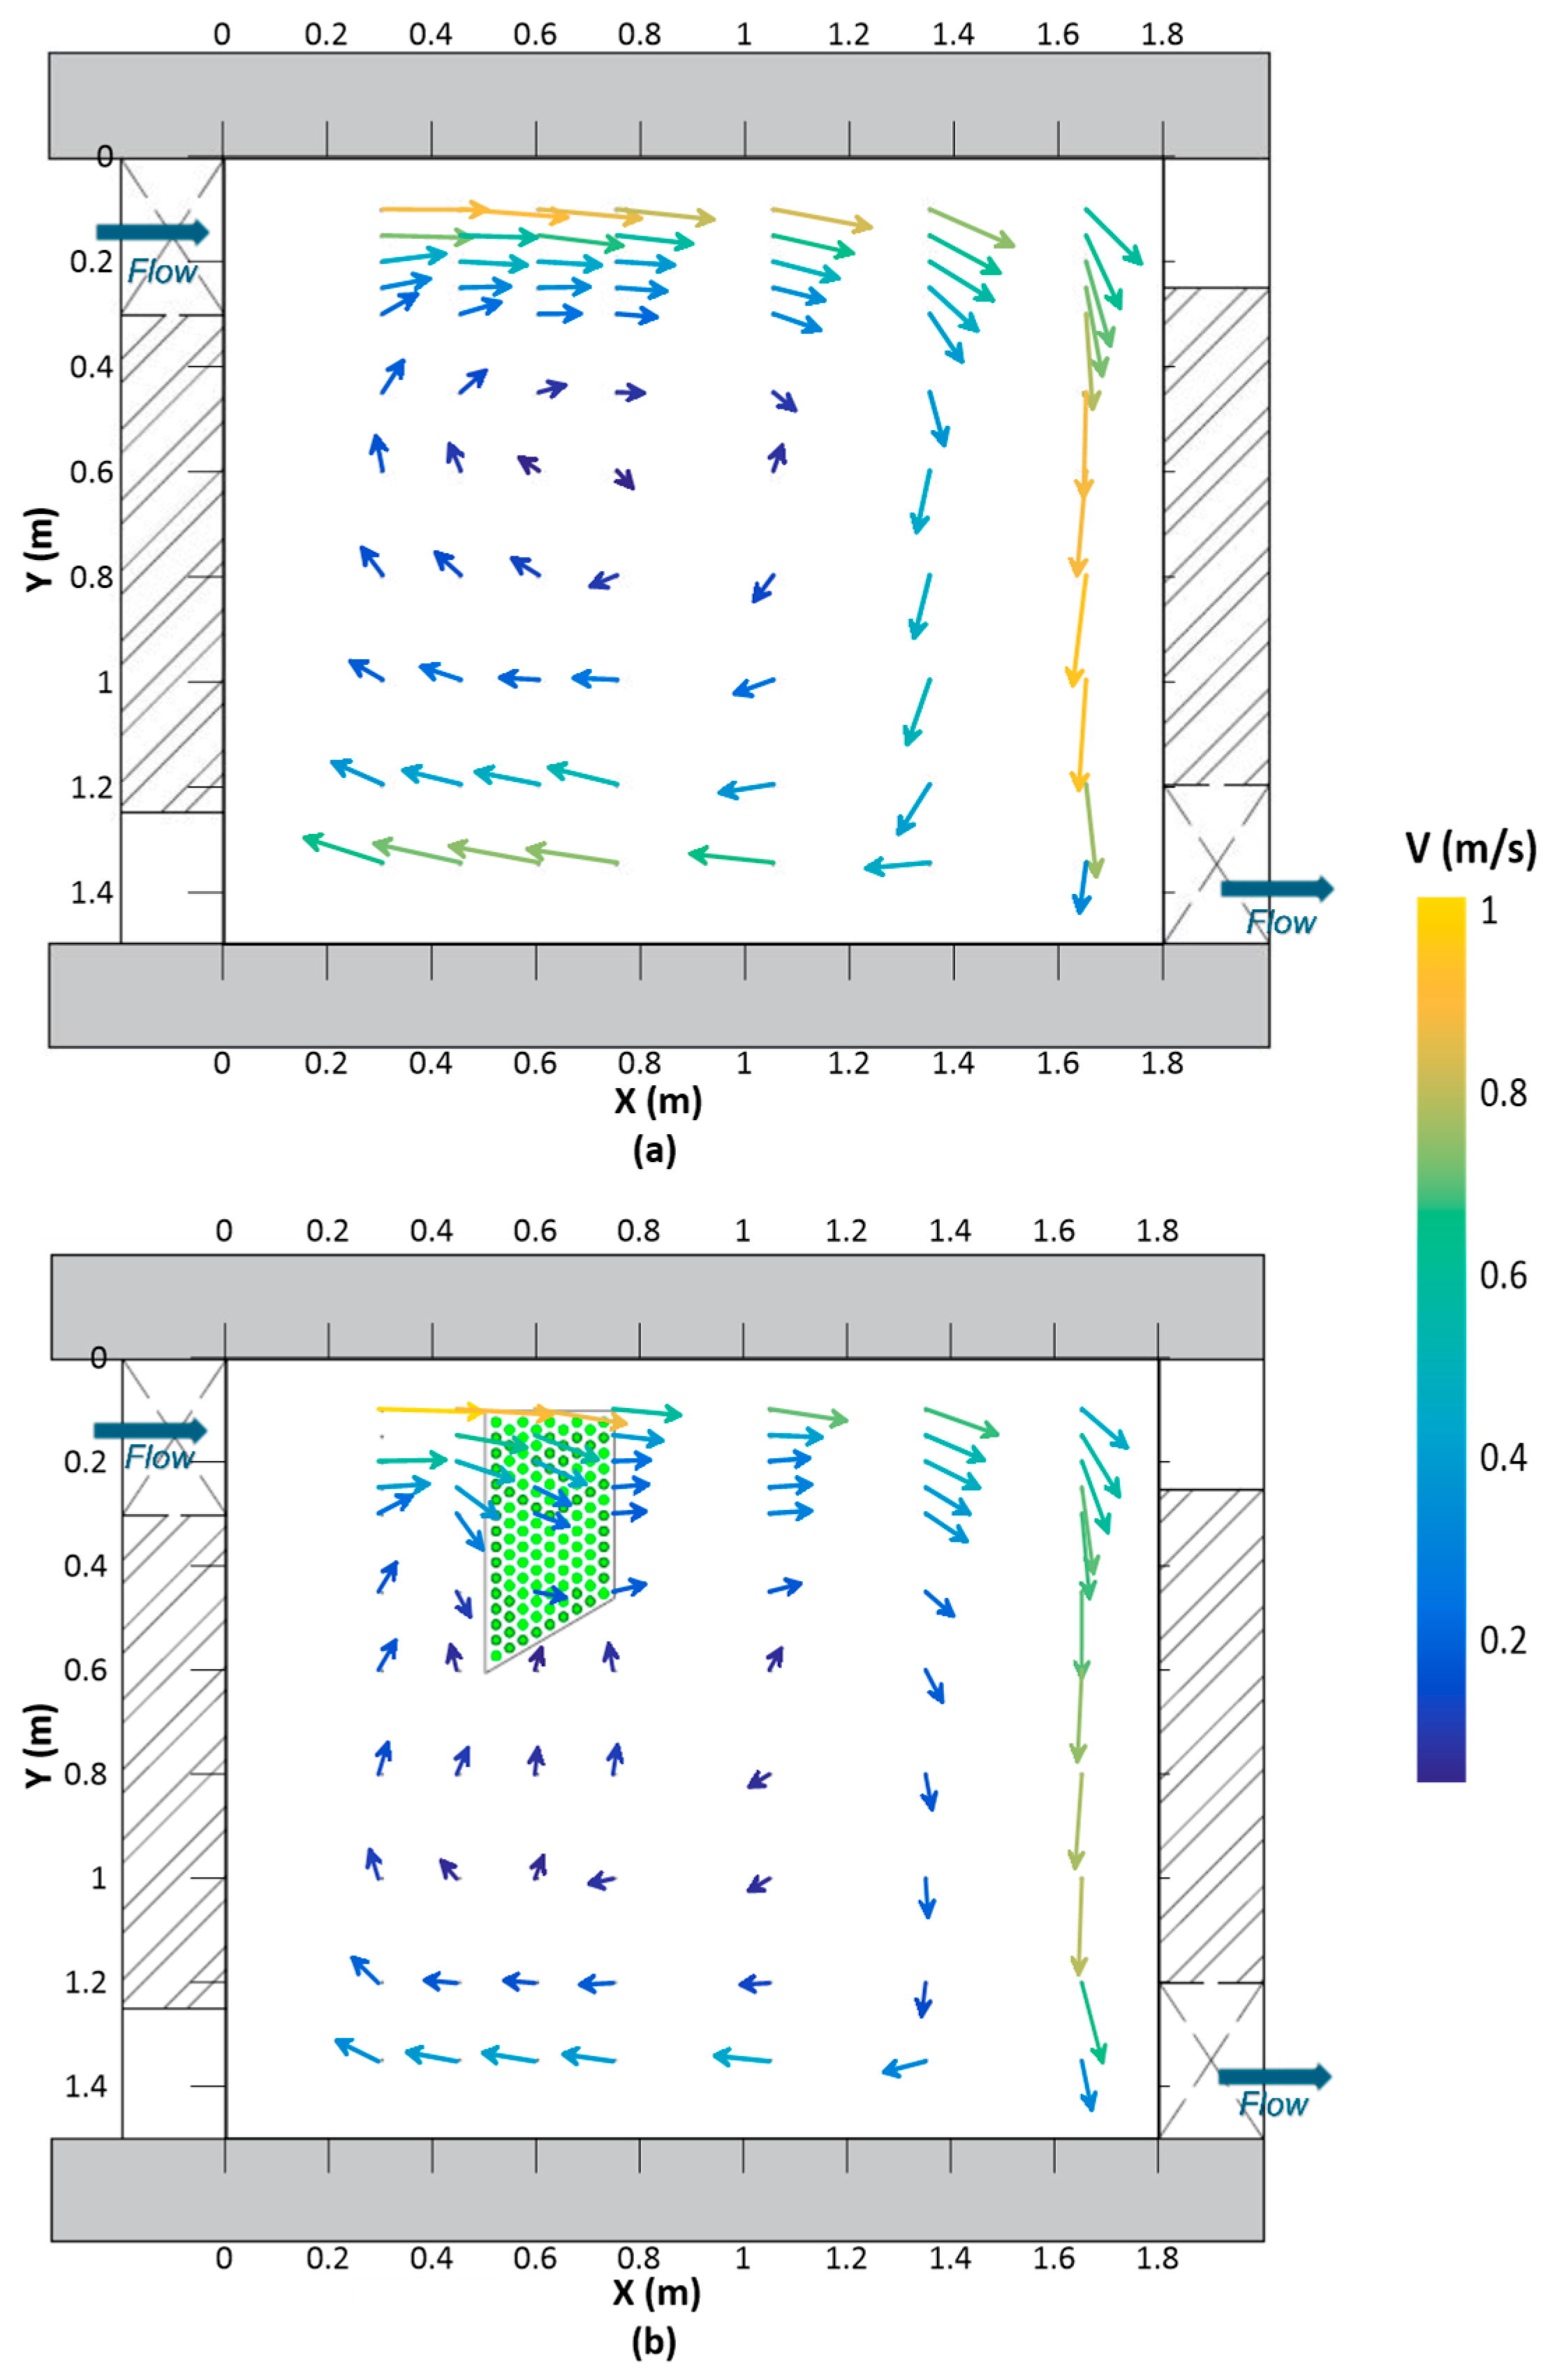
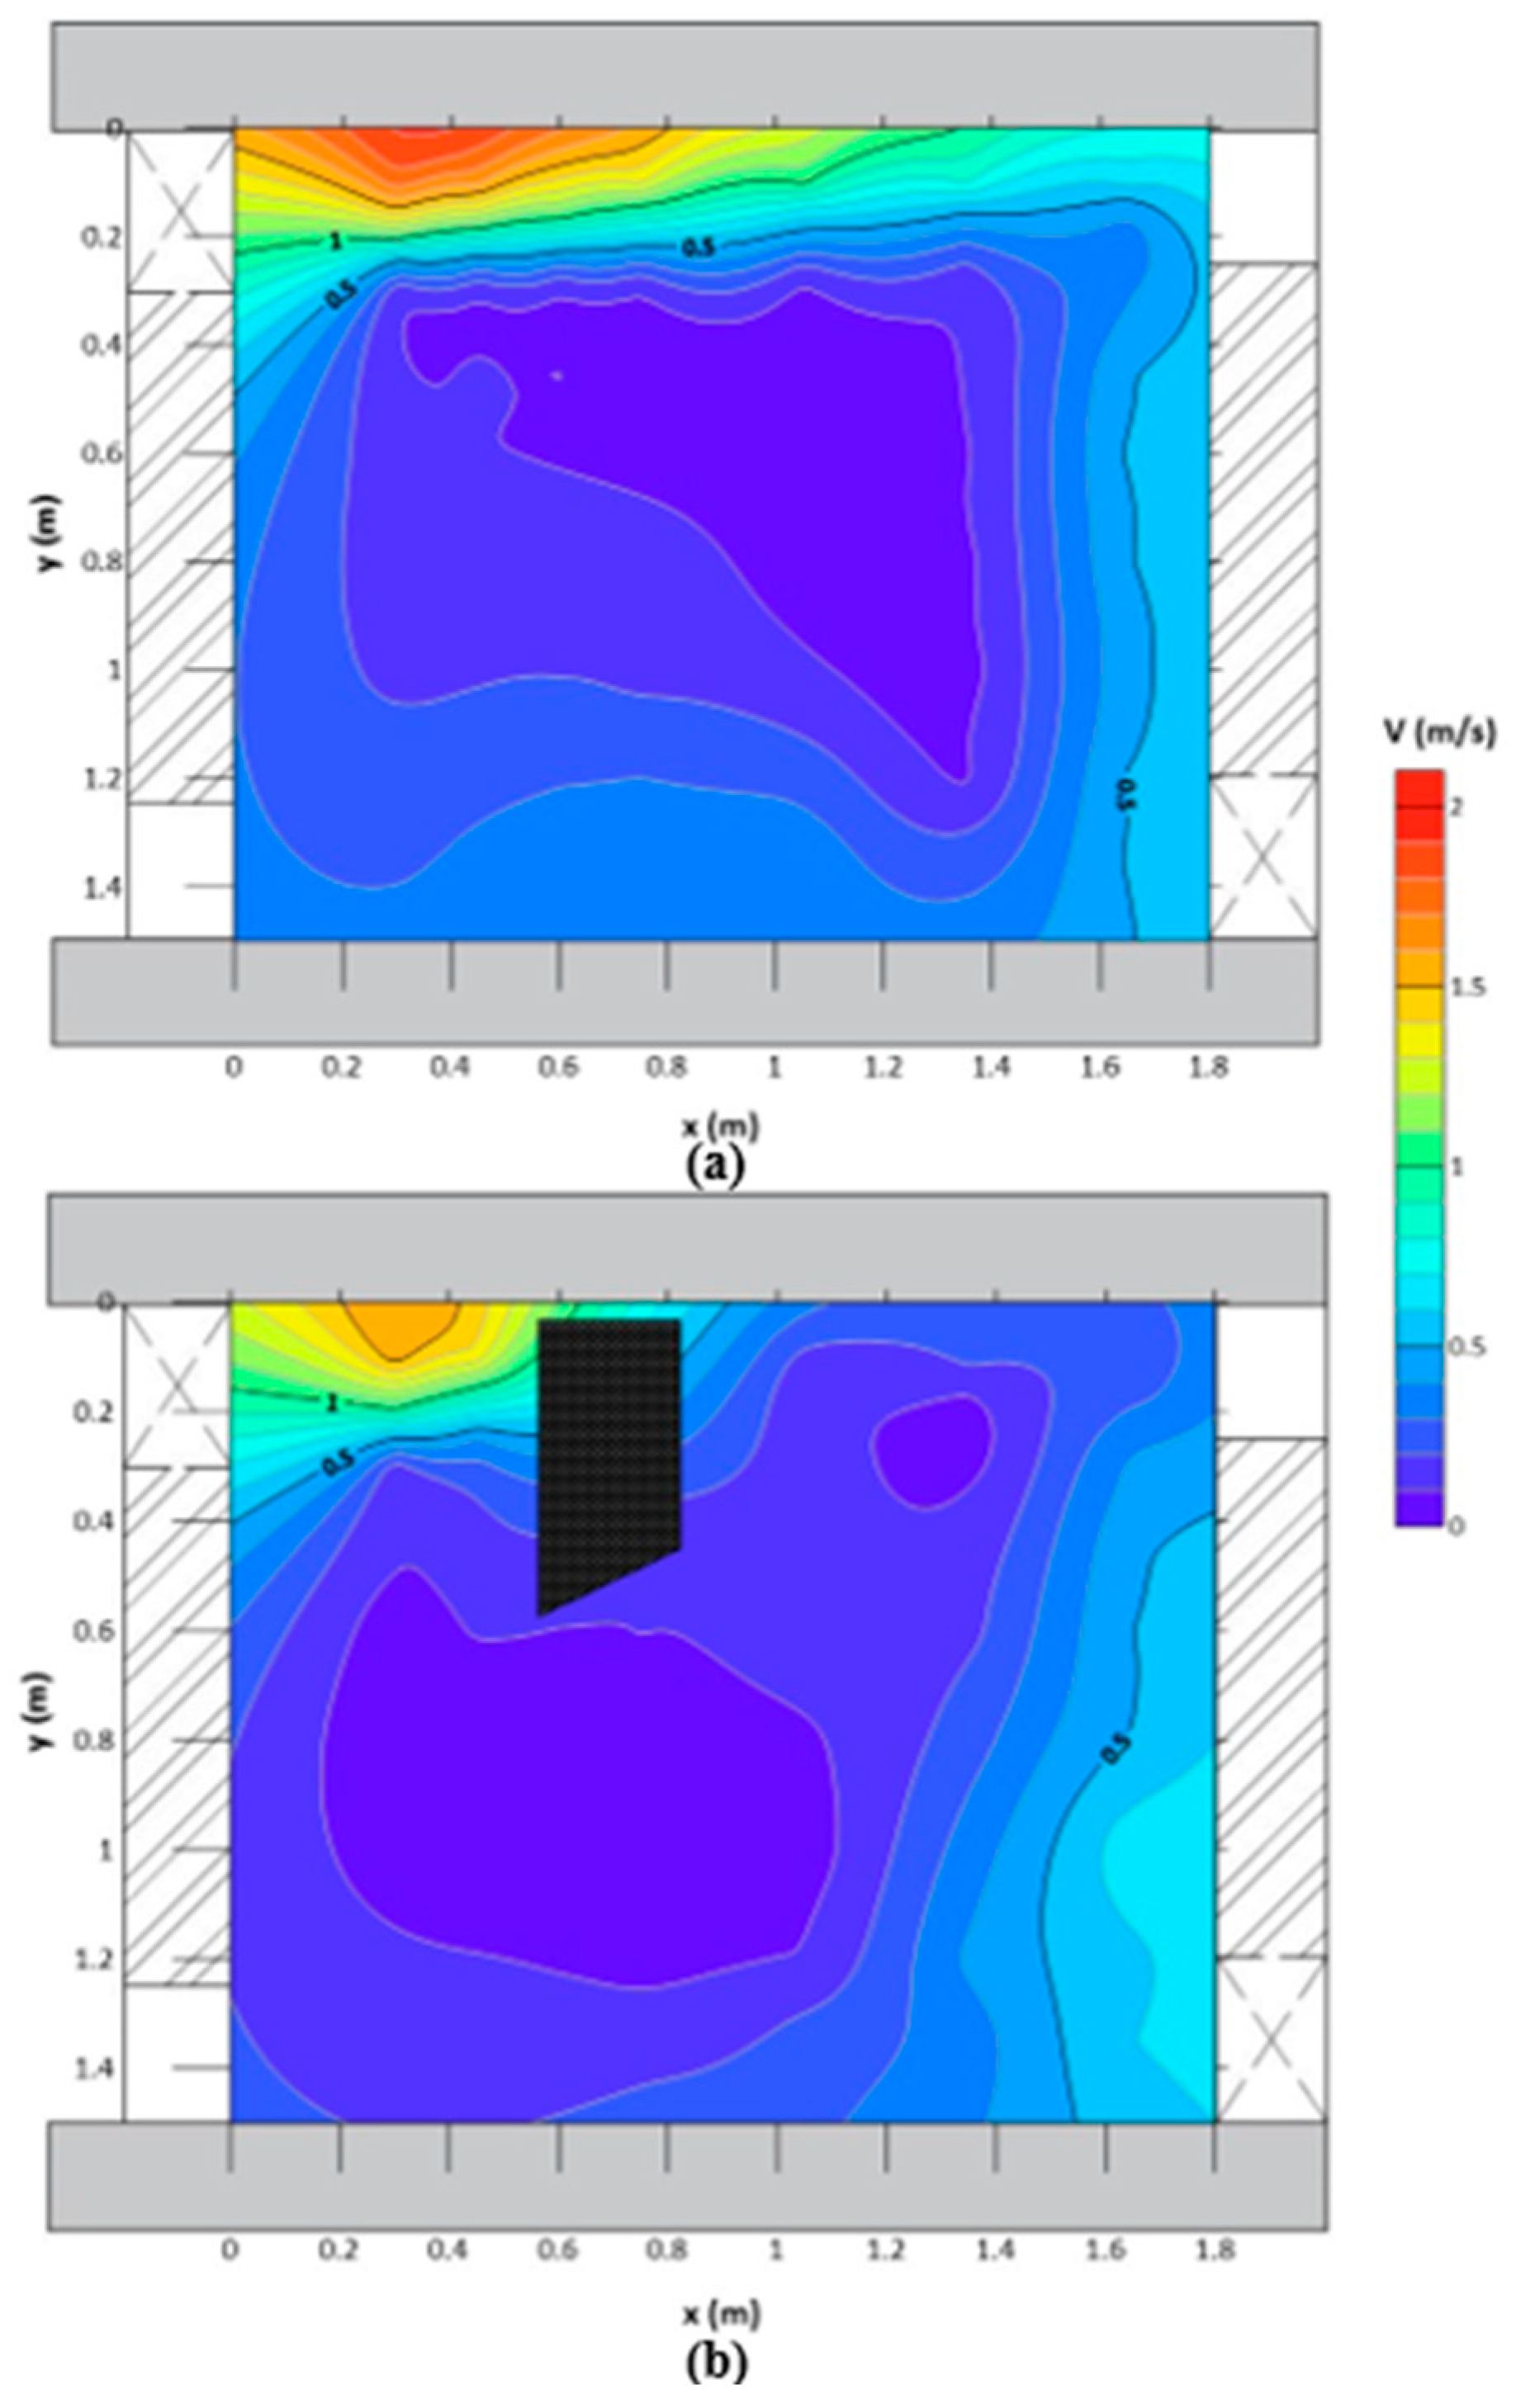
Figure 8 compares the distributions of time-averaged velocities in the horizontal plane below the bristle’s tip with and without brush block configurations. The flow from the orifice enters at the lower left corner, and a turbulent jet (main flow) is discharged from an orifice into the pool. With existing conditions, two distinct flow zones are observed, namely turbulent jet and the recirculation region. The maximum velocity occurred just downstream of the orifice near the side wall (Figure 9a) at x = 0.3 m and y = 0.1 m (point A0). The resulting jet dissipates as it progresses downstream into the pool. This behavior indicates a gradual reduction in velocity. In the recirculation region, besides the turbulent jet, steady flow recirculation occurred. The velocity fields with the brush block are compared in Figure 9. After the installation of the brush block, the main flow was directed into the pool center with reduced velocity values. In the brush block, the flow’s kinetic energy is absorbed due to the flow–bristle interaction. The disappearance of the recirculation region is apparent in the velocity vector distributions (Figure 9b). Moreover, the turbulent jet region is reduced by the presence of the brush block, and a low-velocity zone is created behind the brush block. It can be seen in Figure 10 that the bristles had less of an effect on the flow field and velocity reduction potential when the velocity measurements were taken above them at z = 0.48 m. Downstream of the brush block (points E0–E5 in Figure 9), the average flow velocity diminished by 63%, and the lateral RSS reduced by 64% due to the presence of brush blocks. Also, a 28% reduction in average flow velocity was achieved in front of the upstream weir (points A0–A10), with brush configuration.
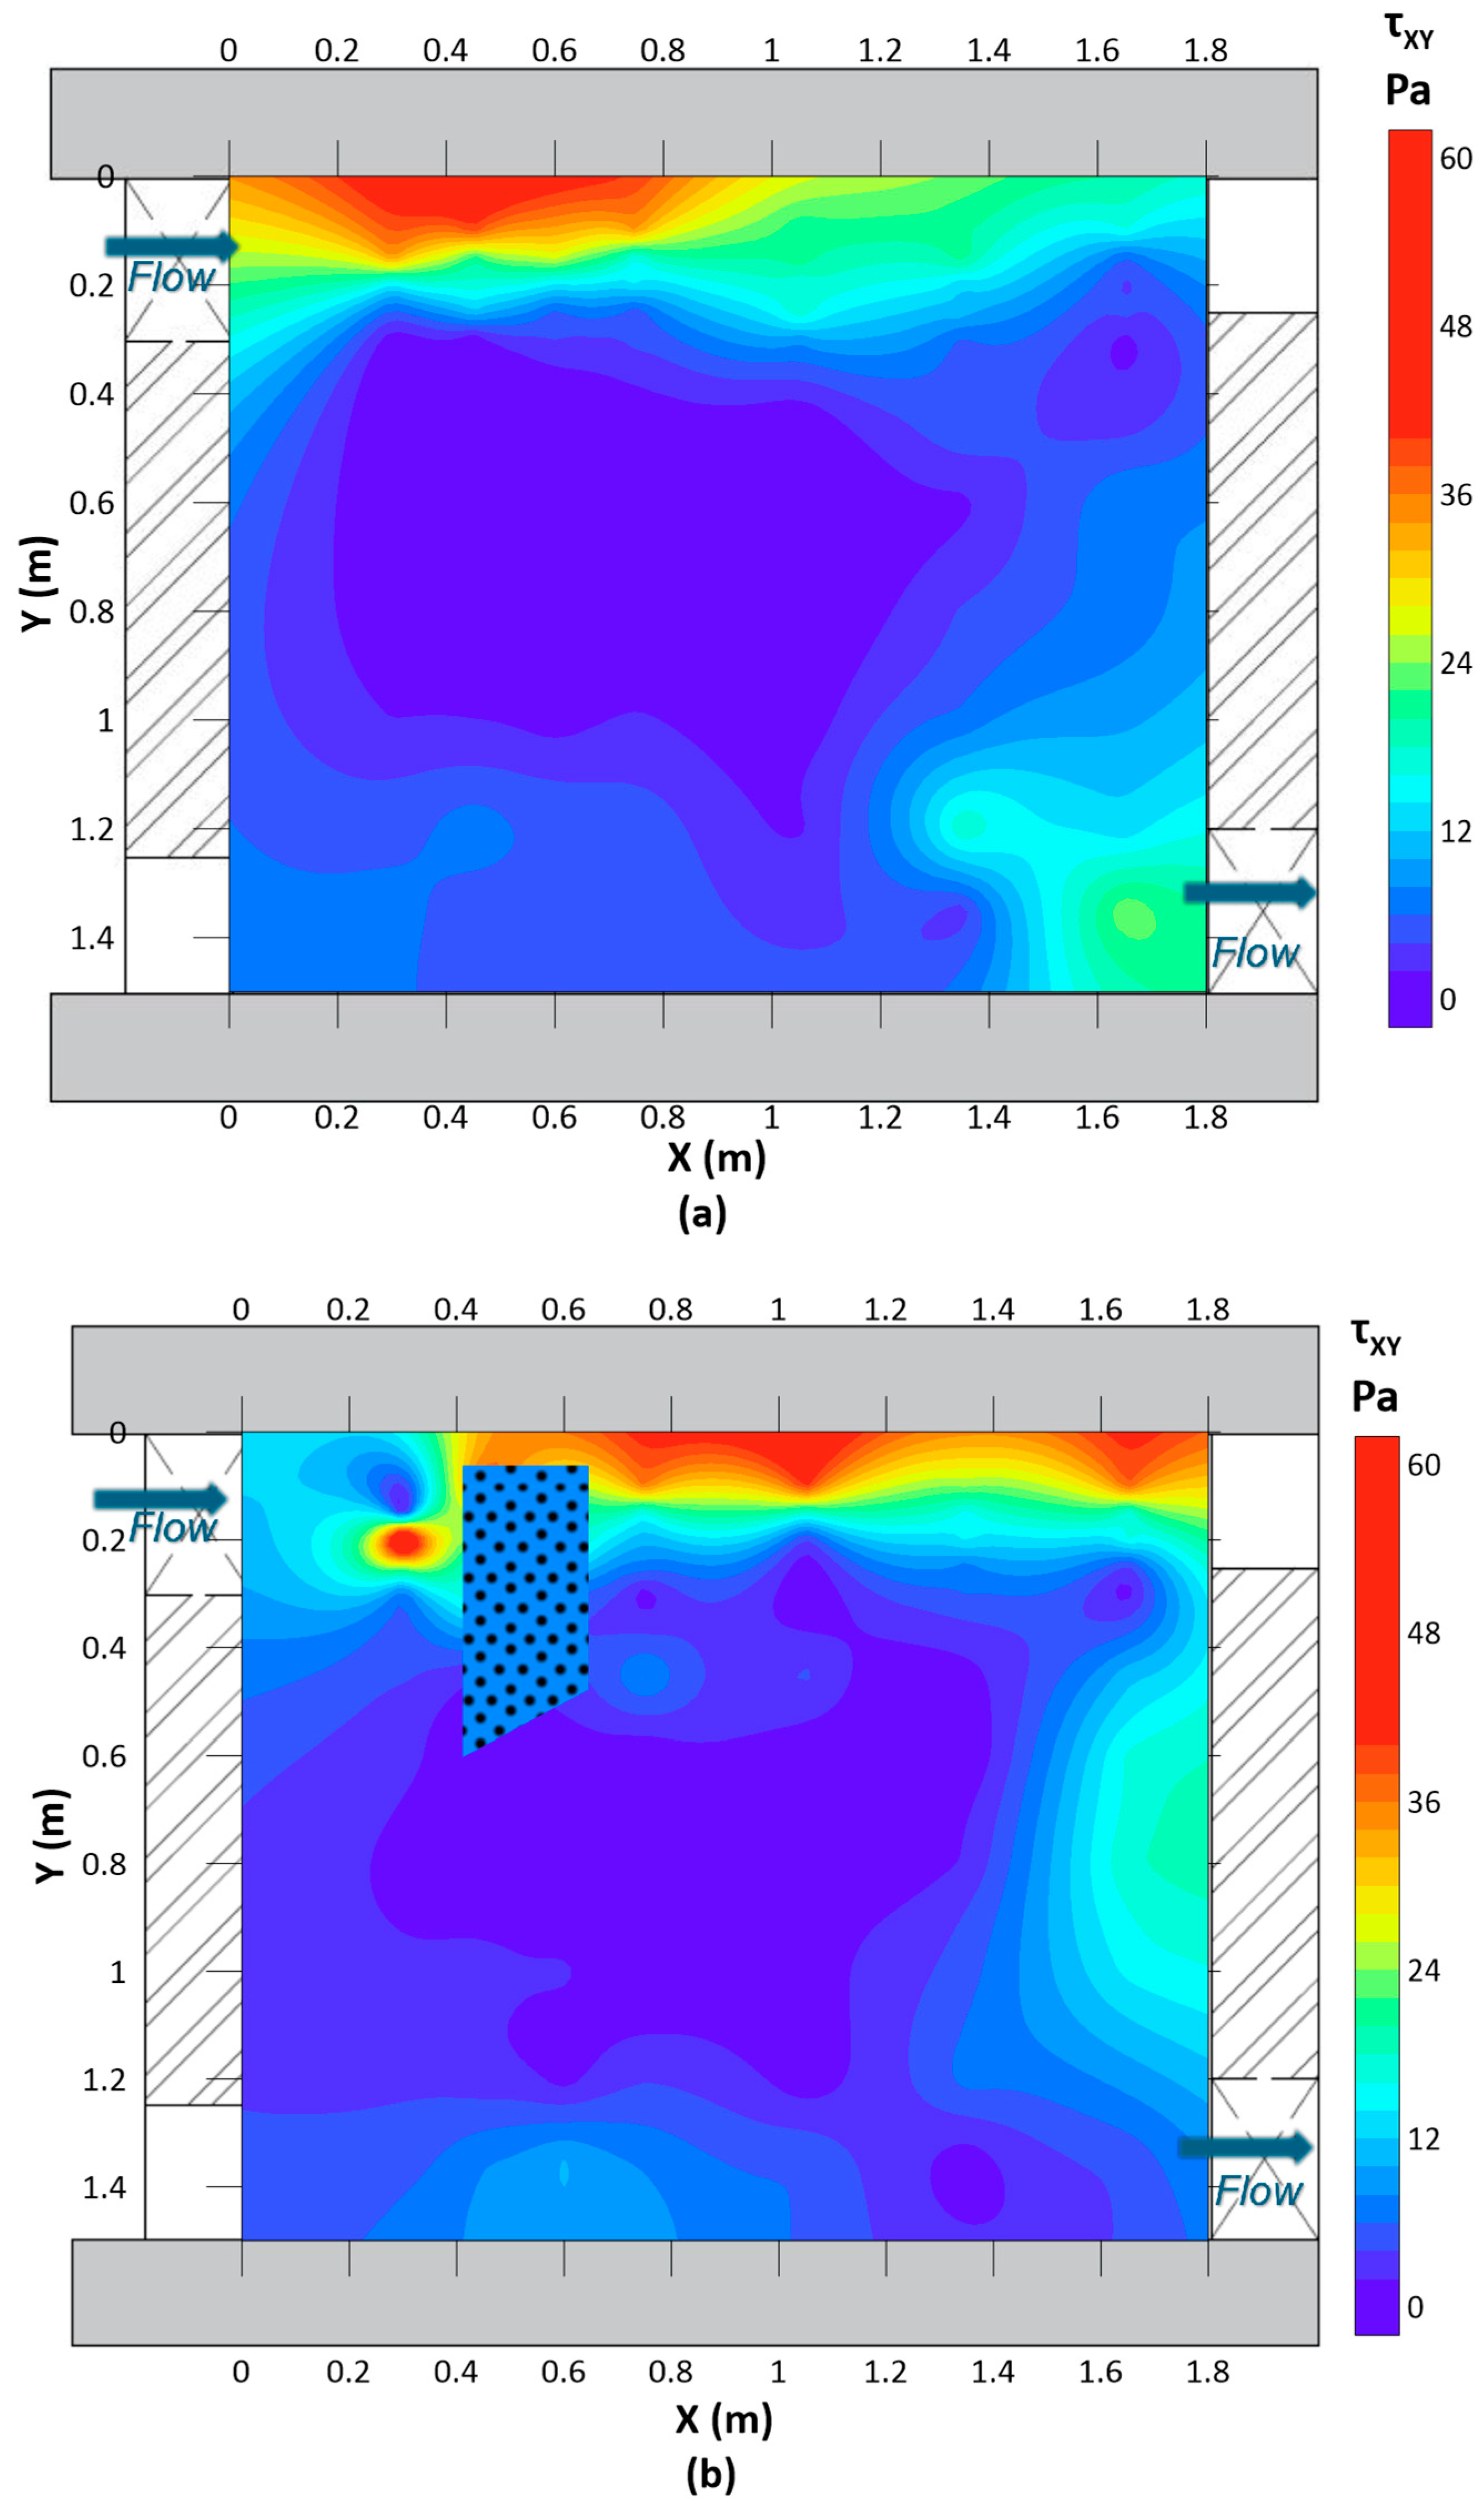
Figure 11 shows the distribution of the RSS in the lateral direction under both with-brush and without-brush conditions within the pool at z = 0.23 m. Notably, higher turbulent shear stresses are evident along the streamline between the submerged orifices. RSSs were greater in the vicinity of the flow inlet region in the vicinity of the orifice. In the absence of a brush block, the highest τxy value of 56.3 Pa was recorded immediately downstream of the orifice entrance at x = 0.3 m, where the turbulent jet enters into the pool (Figure 11a). After the installation of the brush block, the maximum shear stress (τxy) reduced to 22.4 Pa downstream of the orifice at x = 1.05 m (Figure 11b). Subsequently, a more uniform distribution of shear stress around 2 Pa was observed within the circulation region, featuring a low-velocity zone. Lower τxy values, approximately 1 Pa, were typically observed behind the brush block and on the pool’s right side, representing a potential refuge area for fish. Furthermore, the spatially averaged lateral component of the RSS was 3.7 times higher than the vertical component, which is attributed to the 2D flow structure and horizontal mixing within the pool. The maximum shear stress value on the xz plane (τxz) was measured as 23.3 for the case without the brush. This value corresponds approximately to half of the maximum shear stress value of the τxy. Since the height of the brush block is 0.37 m, at the second level of measurement (z = 0.48 m), wake regions were not formed, and bristle bundles’ influence on flow properties was weakened. Hence, at z = 0.48 m, the brush block did not considerably change the flow fields and RSS distributions, and a low-velocity zone was not formed behind the brush block in the jet region (Figure 12).
A paired t-test was performed to assess the statistical significance of the observed decrease in streamwise RSS under the with-brush condition. Table 2 shows the results of the t-test for each measurement level (z = 0.23 m and z = 0.48 m).
It was found that at the lower measurement level (z = 0.23 m), where the brush block immediately engages with the flow, the reduction in the RSS was statistically significant (p < 0.05). However, at the higher measurement level (z = 0.48 m), there was no statistically significant difference between the with-brush and without-brush situations (p > 0.05) for the variation in RSS. This outcome aligns with the observation that the bristle’s height was 0.37 m, hence exerting minimal impact on the flow dynamics at water levels exceeding the bristle’s tips.

3.2. Underwater Video Recording Results

A heatmap of the fish species’ relative presence during the test duration in the pool with a brush block is depicted in Figure 13. The contours represent the Fish Presence Intensity (FPI). As can be seen in Figure 13, Cyprinid fish species avoided the areas (regions A and C) with high turbulent fluctuations during the tests and occupied the energetically suitable low turbulence regions of B and D (Figure 7).
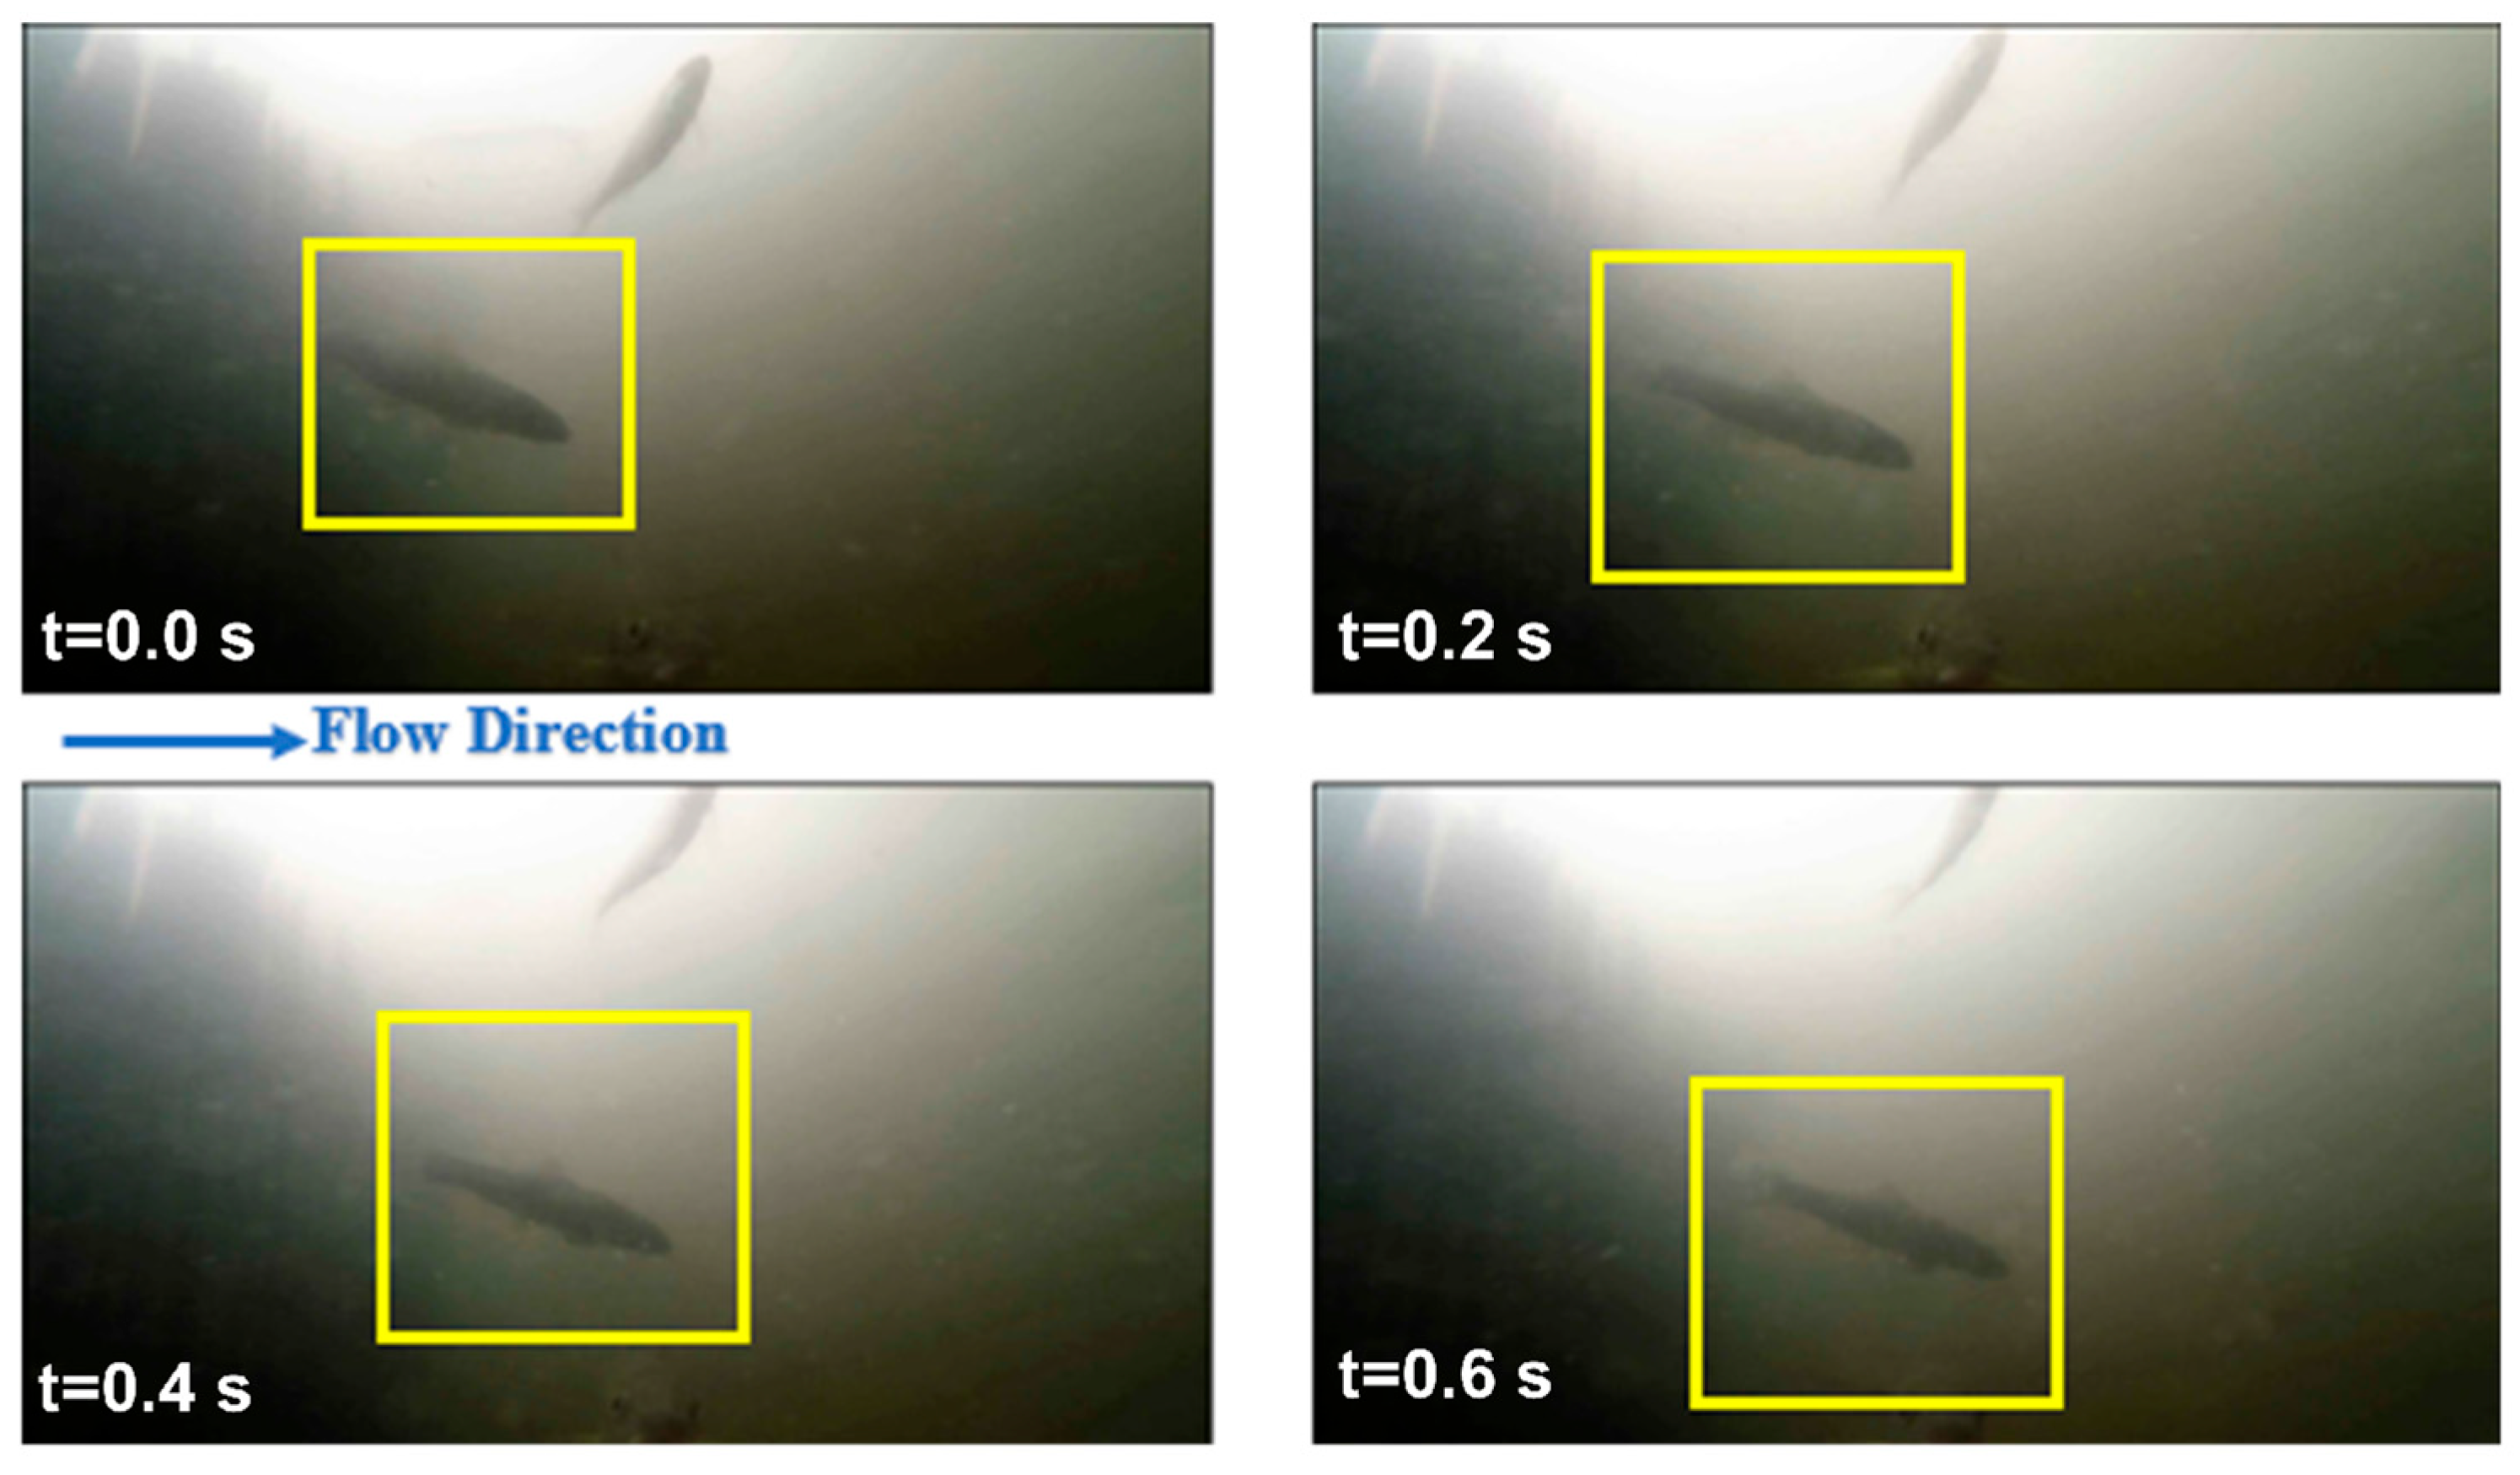
To enhance the behavioral assessment, a frame-by-frame examination of fish movements was performed in two typical areas of the fishway: Region C, noted for the lowest Fish Preference Index (FPI) values, and Region B, where the highest FPI values were recorded (Figure 13). Nonetheless, the video frames captured from Region C, characterized by elevated RSS, were determined to possess poor visual quality due to severe turbulence. Consequently, these frames were considered inappropriate for incorporation into this article. Nevertheless, qualitative observations indicated that fish in Region C experienced significant body deformation and bending and were unable to maintain stable positions, often being displaced by the flow. In contrast, the video frames from Region B, an area with low RSS, are presented in Figure 14. These images indicate that the fish maintained an undeformed body posture and were able to hold positions without rapid body rotation, reflecting the suitability of this area as a resting zone.
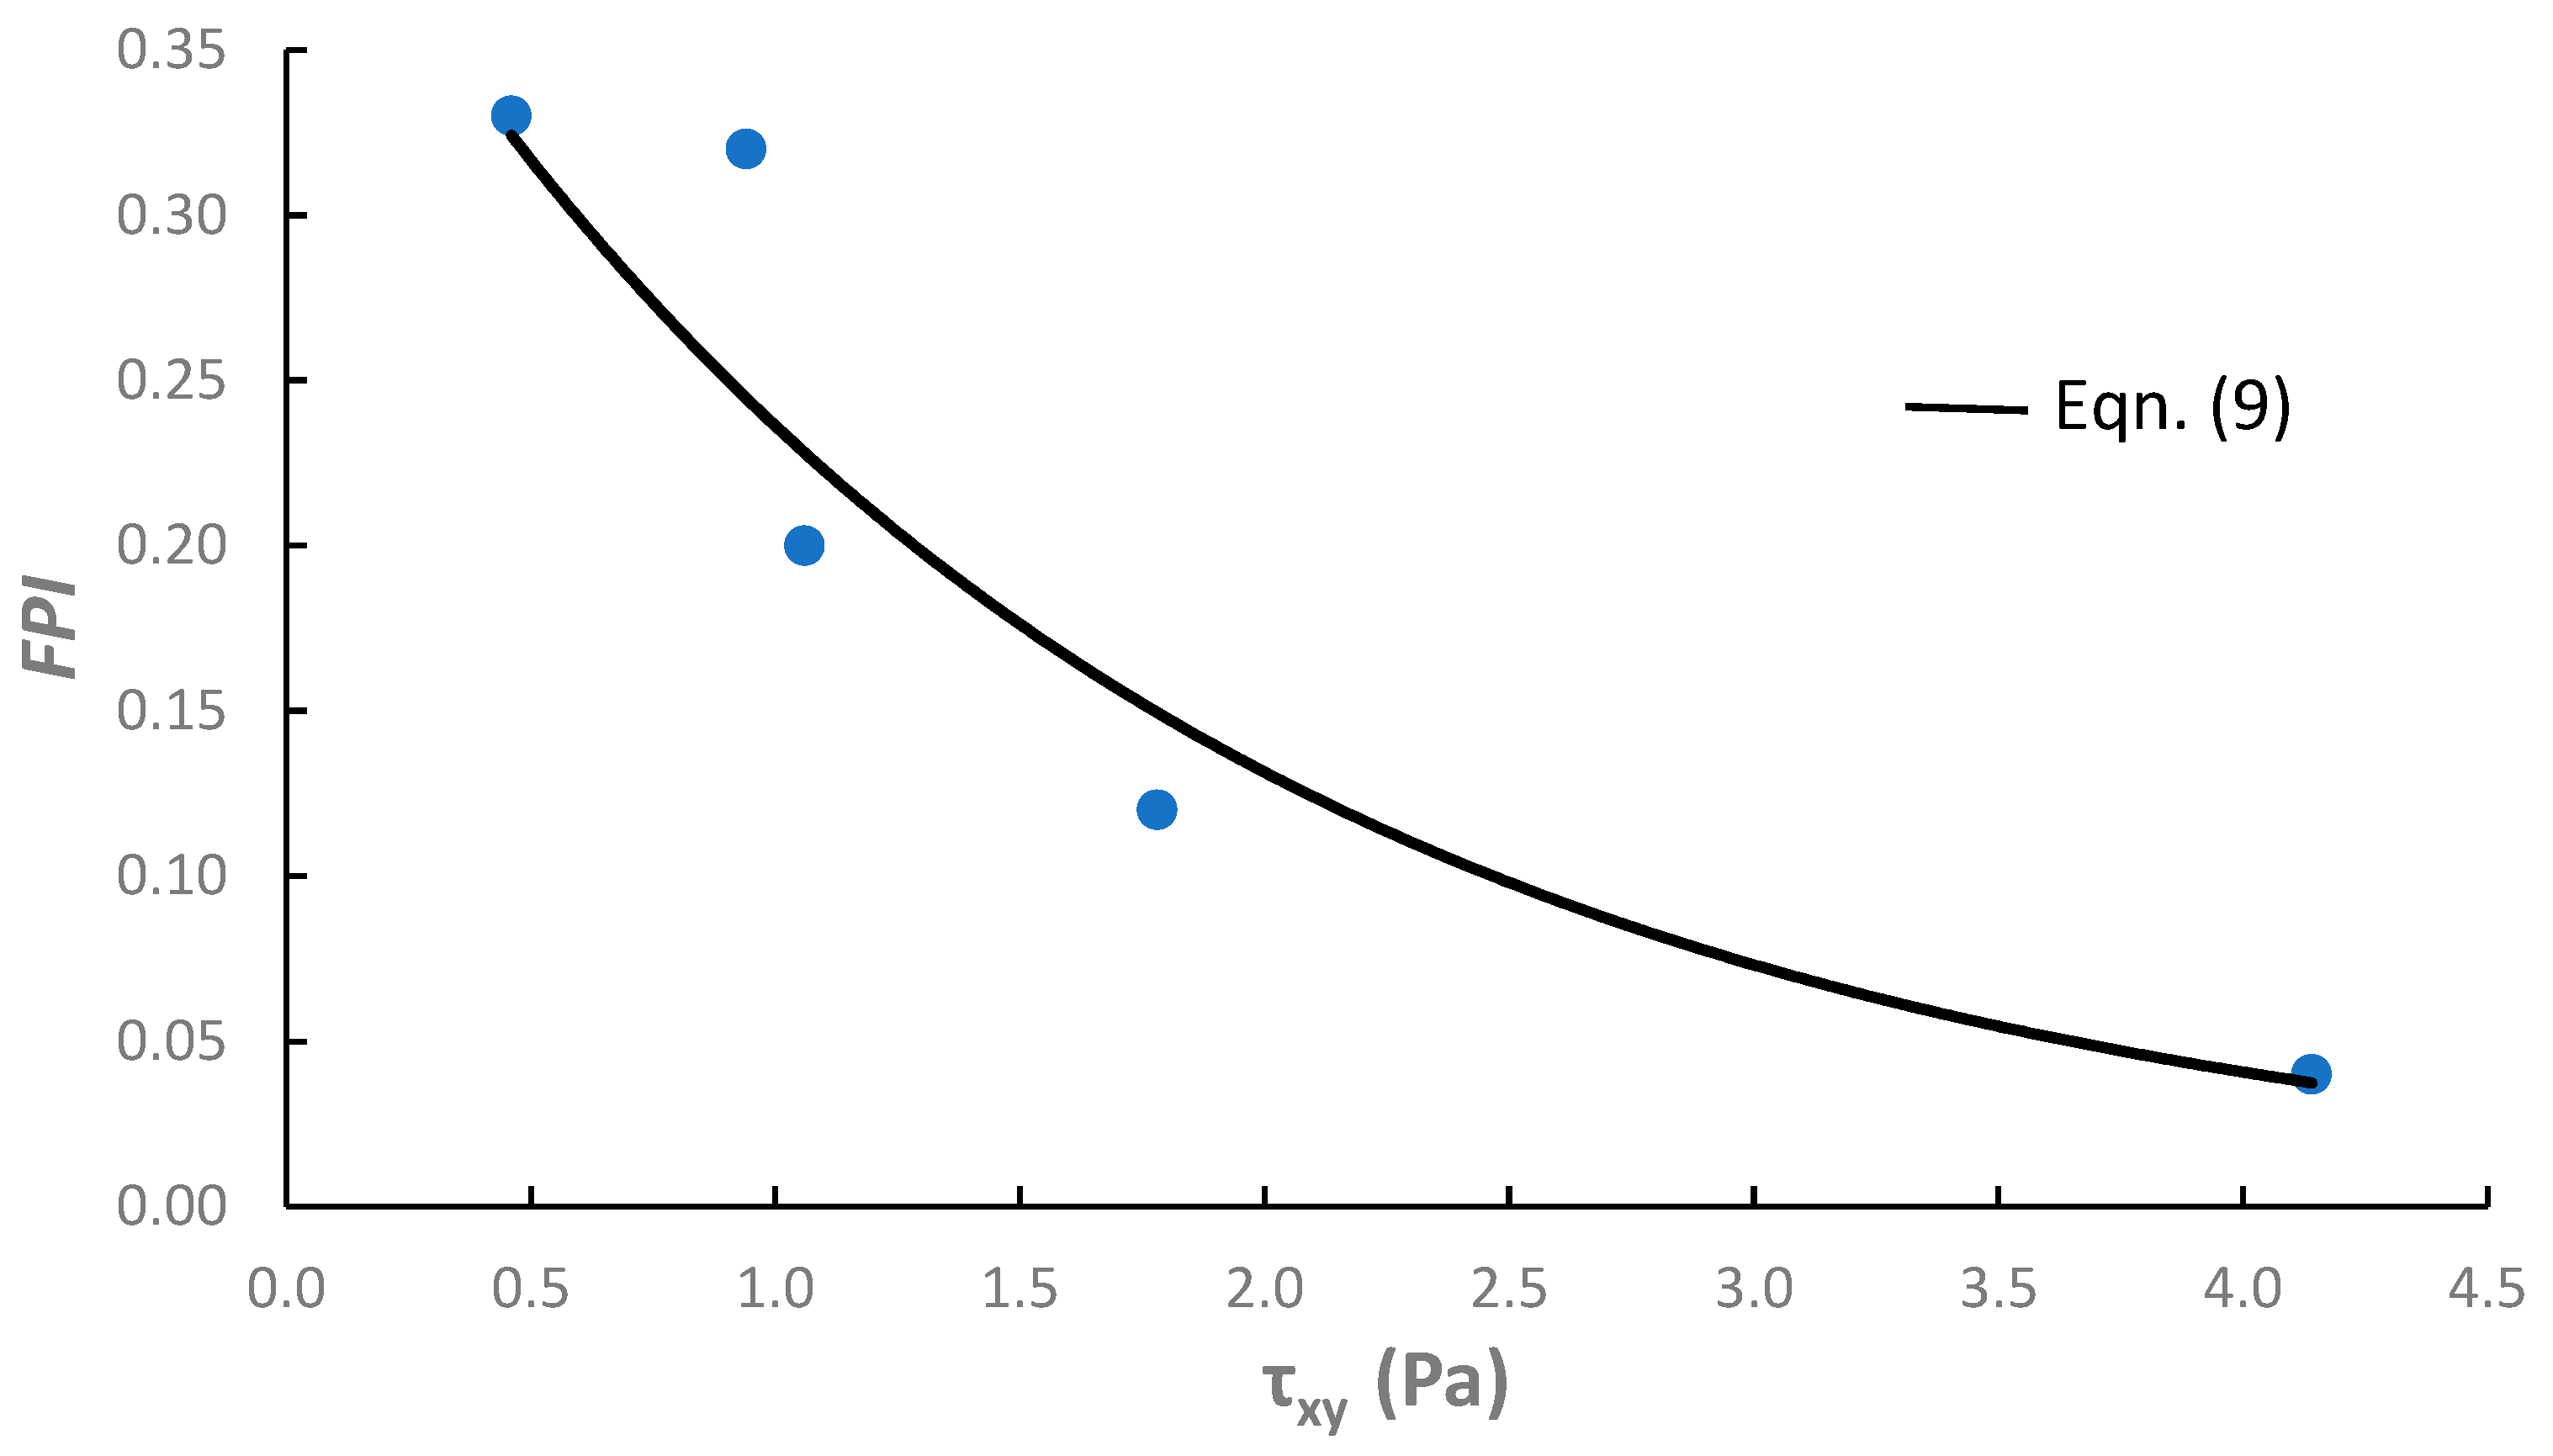
In Figure 15, Fish Presence Intensity (FPI) is plotted as a function of the spatially averaged RSS for each zone in the pool, indicating a negative correlation between the FPI and τxy. The best fit of the experimental data, with a correlation coefficient of 0.89, is
F P I = 0.42 × e 0.59 τ x y
This finding offers quantitative validation for the behavioral patterns deduced from the heatmap analysis and underscores the influence of local hydraulic circumstances on fish spatial distribution.

3.3. Numerical Model Results

The performance of the CFD model was evaluated by comparing simulated three-dimensional velocity fields with experimental measurements obtained at 77 points within the pool, under two different structural configurations. In the configuration without the brush block, the Mean Absolute Error (MAE) for resultant velocity was obtained as 0.24 m/s, while it was obtained as 0.15 m/s when the brush block was incorporated.
After validating the field velocity observations with the numerical model for the orifice flow regime, the orifice-notch flow regime was investigated numerically. Numerical simulations were also run for the design discharge of Qd = 0.167 m3/s for the orifice-notch flow regime. Figure 16 compares the flow fields for orifice-notch flow with and without the brush block condition. For the design discharge condition, the maximum resultant velocity at z = 0.23 m was observed at point A0 (x: 0.3 m, y: 0.1 m) under the without-brush condition, reaching 1.75 m/s. Under the with-brush condition, the velocity at the same location decreased to 1.55 m/s. Also, the RSS distribution with and without the brush block obtained from the numerical model is shown in Figure 17. The maximum shear stress in the without-brush case was recorded as 51 Pa at point A2 (x: 0.3 m, y: 0.2 m), whereas in the with-brush case, the maximum shear stress was found to be 42 Pa at point A0 (x: 0.3 m, y: 0.1 m). By placing the brush block in the pool, the flow energy is effectively dissipated by the vibrations and bending of the bristles. The maximum RSS was observed in the decelerating flow in front of the brush, and about a 60% reduction in τxy is observed behind the brush block region after the structural modification (Figure 17).
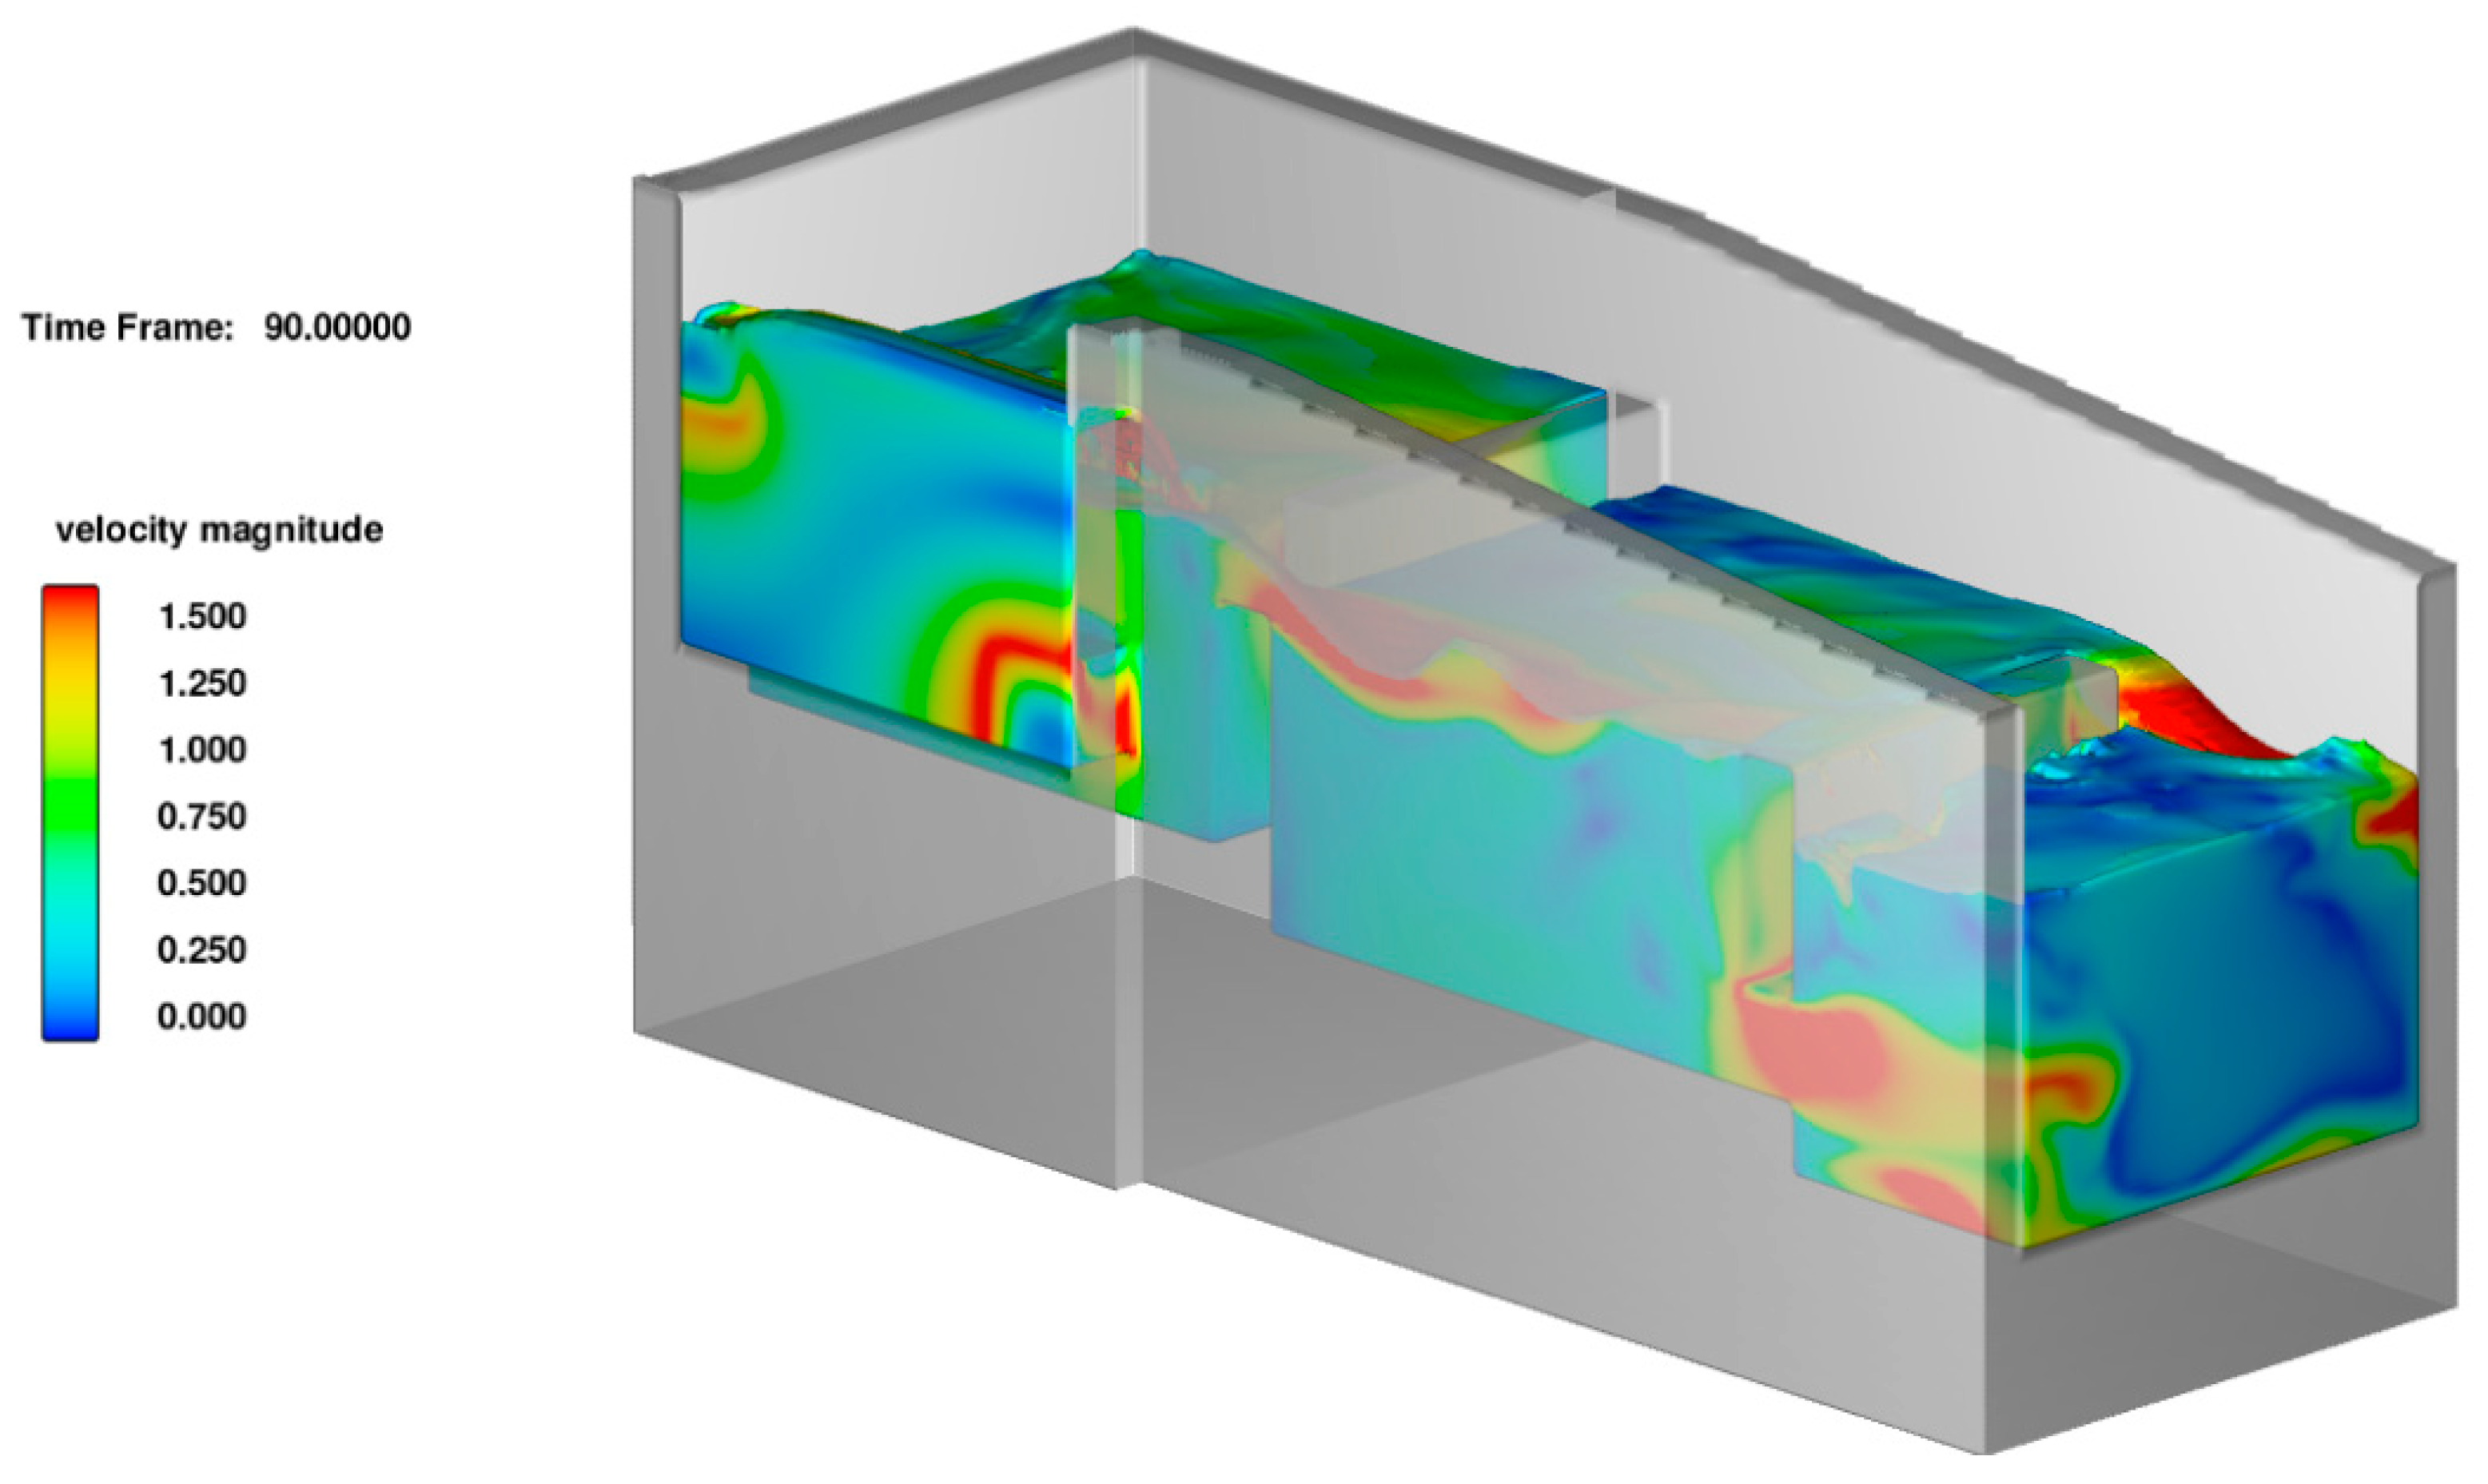
Figure 18 shows the 3D view of the instantaneous velocity distributions for the orifice-notch flow regime for the design discharge of Qd = 0.167 m3/s. As can be seen from the simulation results, the plunging jet of the notch flow regime is effective near the water surface. The notch and orifice jet flow did not interact because the notch is located on the upper left and the orifice is located on the lower right in the cross-section. The 3D view provides valuable outputs, including detailed representations of the velocity field, shear in the flow, free surface elevation conditions, and the structure of the flow regime (Figure 18).

4. Discussion

The maximum magnitude of the lateral RSS, with a value of 56.3 Pa observed in our field study is consistent with the full-scale pool-weir fishway experiments of [15] where they observed a maximum value of 60 Pa. The geometric and hydraulic variables are crucial for assessing fish responses and for comparing results across experiments. While both in the present study and Silva et al. [15] examined fish behavior under orifice-only flow circumstances in pool-type fishways, significant structural distinctions must be recognized. In our field study, the square orifices measured 0.3 × 0.3 m, yielding an orifice area of 0.09 m2, whereas Silva et al. [15] employed orifices with areas ranging from 0.03 to 0.06 m2. The higher bed slope (10%) of the Dagdelen fishway, compared to the 8.5% bed slope in Silva et al. [15], along with variations in pool dimensions (1.80 m × 1.50 m in our study), certainly affected the intensity and distribution of turbulence.
The back of the brush block with a low-velocity and low-τxy zone is considered to be a potential resting zone for fish. The reduced RSSs in the pool are thought to create favorable hydraulic conditions for fish. Higher RSS values can hinder fish passage and increase swimming costs, as noted by [31]. Also, we observed that Cyprinids and Leucisicids fish species avoid entering areas of high velocity fluctuations, which is in line with the findings of [3,49].
Our results demonstrated that maximum velocity values occurred immediately downstream of the orifice, which is in agreement with the findings of [42]. The jet velocity decayed along the streamwise direction, which is in agreement with the analytical solution of the turbulent jets [50]. After the structural modification, at x = 1.05 m and y = 0.3 m (Point E4), which represents the back of the brush block, the velocity was reduced by 41% from 0.22 m/s to 0.13 m/s. This result is consistent with the Kucukali et al. [8] findings for vertical slot fishways. The creation of low-velocity zones with the installation of a brush block is important to reduce fish swimming costs. For instance, Wanget al. [51] analytically demonstrated that fish energy expenditure is related to the cube of the local flow velocity.
Fish presence heatmap analysis can reveal how fish use flow information and visually characterize fish spatial distributions in the testing area (e.g., fishway pool). Several studies used the highest frequency or contour line area to represent a frequency [52,53]. This method approximates fish spatial distribution when the heatmap has numerous hotspots [54]. So, we used the Fish Presence Intensity Index to quantify the spatial distribution of fish with several hotspots (Figure 12) and obtained good results considering the RSS distribution in the pool. We found that 61.5% of the fish presence intensity was found to be in the low RSS regions (e.g., behind the brush block and in the upper left corner of the pool). Similarly, Yildirim [55] found that, on average, 72.2% of fish presence intensity was observed behind brush blocks in a diagonal brush fishway, where there is a diagonal jet flow between brush blocks, for the laboratory tests.
Despite the elevated RSS in Region C causing fish disorientation and instability, video records indicated that certain individuals deliberately entered this area. Such behavior can be attributed to exploratory activity, a prevalent tactic among fish to evaluate environmental circumstances. Moreover, turbulence may serve as an attractant, especially during migratory periods. Although extreme turbulence might disrupt swimming stability, sporadic or directional turbulence may nevertheless encourage fish to explore certain areas [31]. Under a species-specific approach, turbulent descriptors may be adjusted to target fish. In the study of Romão et al. [56], a configuration generating in the pools of RSS = 1151 Pa and PV = 222 W/m3 presented the highest efficiency for a barbel species.
With the aid of underwater video recordings and 3D velocity measurements in the pool, our results indicate that a microhabitat is created behind the brush block. Our field experiments revealed that fish occupied hydrodynamically favorable conditions (i.e., low RSS regions), which is consistent with the observations of Kucukaliet al. [57]. Moreover, our underwater video recordings suggest that fish can become disoriented and lose stability when exposed to high levels of RSS, which is in agreement with the findings of Silva et al. [12]. Also, in our tests, fish utilized low-velocity zones close to fast-flowing areas just beside the orifice, as they are thought to be energetically favorable positions, as supported by Montali-Ashworthet et al. [20], Fausch [58], Muraokaet et al. [59], and Przybillaet et al. [60].
While passage efficiency—defined as the number or proportion of fish successfully completing upstream movement—is a critical metric in fishway evaluations, it was not the primary focus of this study. Instead, the objective was to assess behavioral responses to the installation of the brush block, particularly in terms of the formation of localized resting zones that may facilitate stepwise fish movement. As such, total fish passage counts were not recorded. Future research may incorporate quantitative evaluations of passage efficiency in conjunction with the behavioral analyses presented here.
Moreover, in our in situ measurements, flow occurred only through the orifices and not over the notches. The decision to conduct field measurements only under orifice flow conditions was related to the flow rate given to the weir in the fishway site by the operation. During the May–July period, the upstream discharge was generally insufficient to activate the notched flow, and therefore, the fishway operated solely through the orifices during the fish migration period of 2022. Fish behavior may change under full operation when both orifices and notches are active. This fact is thought to be the limitation of this study. Future studies should investigate fish behavior with flow over the notches. Also, the effect of the bottom substrate, which has an important effect on the flow and energy dissipation structure [61], should be investigated. Underwater videos recordings were only conducted in one day. Future studies should extend this type of sampling for at least three days in future work to avoid randomness. Moreover, the underwater video recordings lacked without brush block conditions, and further studies should be conducted to reinforce the present findings.

5. Conclusions

The hydrodynamic characteristics of the pool-weir fishway, both in its original form and with the installation of a brush block, have been investigated in real-time operation conditions. The findings of the study show that the interaction between the flow and bristles led to a noticeable reduction in flow velocity magnitudes and turbulence quantities within the pool, which created resting areas for fish. Moreover, our results suggest that the modification of internal flow characteristics in the pool by the placement of a submerged brush block reduced the horizontal RSS component, and those areas were occupied by fish. The pool-weir fishway with a brush block provides more suitable conditions for fish by surpassing a large recirculation zone in the central part of the pool and providing a microhabitat behind the brush block. It is shown that the utilization of bristles as energy absorbers presents a modular, prefabricated, and easy-to-install solution in existing pool fish pass structures.
From an eco-hydraulics perspective, this substantial decrease in flow velocity and lateral RSS achieved with the installation of the brush block is expected to reduce the energetic costs for migrating fish. Given the number of hydropower plants and dams (shown in Figure 1), this is really important. This is likely because fishways were not designed for multiple fish species. It is crucial to conduct this type of assessment and, if necessary, implement practical retrofit solutions. This improvement is particularly significant for small-bodied species which, owing to their inherently higher metabolic rates relative to their body size and limited capacity for sustained swimming against resistance, are particularly vulnerable to the energetic demands of strong currents and turbulent flows.

Author Contributions

All authors contributed to writing and editing the manuscript. All authors listed have contributed substantially to the manuscript to be included as authors. Conceptualization, M.S.T., and S.K.; Methodology, M.S.T., and S.K.; Formal analysis, M.S.T., and S.K.; Investigation, M.S.T., and S.K.; Resources, M.S.T., and S.K.; Writing—original draft preparation, M.S.T., and S.K.; Writing—review and editing, M.S.T., and S.K.; Supervision, S.K.; Funding acquisition, S.K. All authors have read and agreed to the published version of the manuscript.

Funding

This research was funded by Scientific and Technical Research Council of Türkiye under the Scientific and Technological Research Projects Funding Program (1002 TUBITAK), grant number 221M128 and Hacettepe University Scientific Research Project Program (BAP), grant number FBA-2021-18953.

Data Availability Statement

Data will be provided on reasonable request.

Acknowledgments

The authors thank Orhan Bülbül for his help during the field measurements. The authors would like to thank Baran Yoğurtçuoğlu for his valuable and constructive review of the manuscript.

Conflicts of Interest

The authors declare no conflicts of interest.

Abbreviations

The following abbreviations are used in this manuscript:
SHPSmall Hydropower Plant
IUCNInternational Union for Conservation of Nature
LCLeast Concern
ADVAcoustic Doppler Velocimeter
SNRSignal-to-Noise Ratio
CORCorrelation
FPIFish Presence Intensity

References

  1. Noonan, M.J.; Grant, J.W.; Jackson, C.D. A quantitative assessment of fish passage efficiency. Fish Fish. 2012, 13, 450–464. [Google Scholar] [CrossRef]
  2. Santos, J.M.; Branco, P.; Katopodis, C.; Ferreira, T.; Pinheiro, A. Retrofitting pool-and-weir fishways to improve passage performance of benthic fishes: Effect of boulder density and fishway discharge. Ecol. Eng. 2014, 73, 335–344. [Google Scholar] [CrossRef]
  3. Santos, J.; Branco, P.; Quaresma, A.; Romao, F.; Amaral, S.; Santo, M. Fish passes in Portugal: Current status, main findings and future directions. In Proceedings of the 8th IAHR Europe Congress, Lisbon, Portugal, 4–7 June 2024. [Google Scholar]
  4. Ke, S.; Goerig, E.; Pang, K.; Ji, H.; Li, D.; Xu, J.; Tan, J.; Qi, H.; Shi, X. Evaluation of pool-and-weir fishway efficiency for the upstream spawning migration of Qinghai Lake’s naked carp. Ecol. Eng. 2024, 208, 107373. [Google Scholar] [CrossRef]
  5. Pedescoll, A.; Aguado, R.; Marcos, C.; González, G. Performance of a Pool and Weir Fishway for Iberian Cyprinids Migration: A Case Study. Fishes 2019, 4, 45. [Google Scholar] [CrossRef]
  6. Silva, A.T.; Bermúdez, M.; Santos, J.M.; Rabuñal, J.R.; Puertas, J. Pool-type fishway design for a potamodromous cyprinid in the Iberian Peninsula: The Iberian barbel—Synthesis and future directions. Sustainability 2020, 12, 3387. [Google Scholar] [CrossRef]
  7. Gough, P. International guidance for the restoration of fish migration highways. 2012: Regional Water Authority Hunze en Aa’s. In From Sea to Source; Summersdale: Chichester, UK, 2018. [Google Scholar]
  8. Kucukali, S.; Alp, A.; Albayrak, I. Retrofitting vertical slot fish pass with brush blocks: Hydraulics performance. Water 2023, 15, 1155. [Google Scholar] [CrossRef]
  9. Montali-Ashworth, D.; Vowles, A.S.; De Almeida, G.; Kemp, P.S. Use of Cylindrical Bristle Clusters as a novel multispecies fish pass to facilitate upstream movement at gauging weirs. Ecol. Eng. 2020, 143, 105634. [Google Scholar] [CrossRef]
  10. Zhong, Z.; Ruan, T.; Hu, Y.; Liu, J.; Liu, B.; Xu, W. Experimental and numerical assessment of hydraulic characteristic of a new semi-frustum weir in the pool-weir fishway. Ecol. Eng. 2021, 170, 106362. [Google Scholar] [CrossRef]
  11. Kim, J. Hydraulic characteristics by weir type in a pool-weir fishway. Ecol. Eng. 2001, 16, 425–433. [Google Scholar] [CrossRef]
  12. Silva, A.T.; Katopodis, C.; Santos, J.M.; Ferreira, M.T.; Pinheiro, A.N. Cyprinid swimming behaviour in response to turbulent flow. Ecol. Eng. 2012, 44, 314–328. [Google Scholar] [CrossRef]
  13. Fuentes-Pérez, J.F.; Sanz-Ronda, F.J.; de Azagra, A.M.; García-Vega, A. Non-uniform hydraulic behavior of pool-weir fishways: A tool to optimize its design and performance. Ecol. Eng. 2016, 86, 5–12. [Google Scholar] [CrossRef]
  14. Branco, P.; Santos, J.M.; Katopodis, C.; Pinheiro, A.; Ferreira, M.T. Pool-type fishways: Two different morpho-ecological cyprinid species facing plunging and streaming flows. PLoS ONE 2013, 8, e65089. [Google Scholar] [CrossRef] [PubMed]
  15. Silva, A.T.; Santos, J.M.; Ferreira, M.T.; Pinheiro, A.N.; Katopodis, C. Effects of water velocity and turbulence on the behaviour of Iberian barbel (Luciobarbus bocagei, Steindachner 1864) in an experimental pool-type fishway. River Res. Appl. 2011, 27, 360–373. [Google Scholar] [CrossRef]
  16. Smith, D.L.; Brannon, E.L.; Odeh, M. Response of juvenile rainbow trout to turbulence produced by prismatoidal shapes. Trans. Am. Fish. Soc. 2005, 134, 741–753. [Google Scholar] [CrossRef]
  17. Tarrade, L.; Texier, A.; David, L.; Larinier, M. Topologies and measurements of turbulent flow in vertical slot fishways. Hydrobiologia 2008, 609, 177–188. [Google Scholar] [CrossRef]
  18. Aleyasin, S.S.; Fang, X.; Tachie, M.F.; Katopodis, C.; Ghamry, H. Comprehensive study of the hydrodynamic effects of weirs installed in the bypass of bar rack systems to better guide downstream migrating fish. Ecol. Eng. 2024, 201, 107206. [Google Scholar] [CrossRef]
  19. Kucukali, S. An experimental investigation of flow resistance and turbulent flow in brush fish pass. In Proceedings of the Institution of Civil Engineers-Water Management, London, UK, 22 March 2019; Thomas Telford Ltd.: London, UK, 2019. [Google Scholar]
  20. Montali-Ashworth, D.; Vowles, A.S.; de Almeida, G.A.; Kemp, P.S. Understanding fish-hydrodynamic interactions within Cylindrical Bristle Cluster arrays to improve passage over sloped weirs. J. Ecohydraulics 2024, 9, 87–95. [Google Scholar] [CrossRef]
  21. Vowles, A.S.; Montali-Ashworth, D.; Karageorgopoulos, P.; Kemp, P.S. Hydraulic conditions created by a ‘large’diameter Cylindrical Bristle Cluster fish pass. Ecol. Eng. 2024, 207, 107337. [Google Scholar] [CrossRef]
  22. Dong, Z.; Tong, J.; Huang, Z. Turbulence characteristics in a weir-orifice-slot combined fishway with an identical layout. J. Turbul. 2022, 23, 327–351. [Google Scholar] [CrossRef]
  23. Yagci, O. Hydraulic aspects of pool-weir fishways as ecologically friendly water structure. Ecol. Eng. 2010, 36, 36–46. [Google Scholar] [CrossRef]
  24. Bombač, M.; Novak, G.; Mlačnik, J.; Četina, M. Extensive field measurements of flow in vertical slot fishway as data for validation of numerical simulations. Ecol. Eng. 2015, 84, 476–484. [Google Scholar] [CrossRef]
  25. Kucukali, S.; Verep, B.; Alp, A.; Turan, D.; Mutlu, T.; Kaya, C.; Yildirim, Y.; Toreyin, B.U.; Ozelçi, D. Flow structure and fish passage performance of a brush-type fish way: A field study in the Iyidere River, Turkey. Mar. Freshw. Res. 2019, 70, 1619–1632. [Google Scholar] [CrossRef]
  26. Kucukali, S.; Cokgor, S. Fuzzy logic model to predict hydraulic jump aeration efficiency. In Proceedings of the Institution of Civil Engineers-Water Management, London, UK, 1 March 2007; Thomas Telford Ltd.: London, UK, 2007. [Google Scholar]
  27. Kucukali, S.; Hassinger, R. Hydraulic model test results of baffle–brush fish pass. In Proceedings of the Institution of Civil Engineers-Water Management, London, UK, 20 March 2015; Thomas Telford Ltd.: London, UK, 2015. [Google Scholar]
  28. Kucukali, S.; Hassinger, R. Flow and turbulence structure in a baffle–brush fish pass. In Proceedings of the Institution of Civil Engineers-Water Management, London, UK, 17 July 2018; Thomas Telford Ltd.: London, UK, 2018. [Google Scholar]
  29. DWA. Fischaufstiegsanlagen und Fischpassierbare Bauwerke-Gestaltung, Bemessung, Qualitätssicherung; DWA: Hennef, Germany, 2016. [Google Scholar]
  30. Tarena, F.; Nyqvist, D.; Katopodis, C.; Comoglio, C. Computational fluid dynamics in fishway research-a systematic review on upstream fish passage solutions. J. Ecohydraulics 2025, 10, 107–126. [Google Scholar] [CrossRef]
  31. Enders, E.C.; Boisclair, D.; Roy, A.G. The effect of turbulence on the cost of swimming for juvenile Atlantic salmon (Salmo salar). Can. J. Fish. Aquat. Sci. 2003, 60, 1149–1160. [Google Scholar] [CrossRef]
  32. Kucukali, S.; Alp, A.; Akyüz, A. Movements of mesopotamian barb (Capoeta damascina) in a river stretch impacted by small hydropower operations in Ceyhan River Basin, Turkey. Hydrobiologia 2025, 1–17. [Google Scholar] [CrossRef]
  33. Freyhof, J.; Yoğurtçuoğlu, B.; Jouladeh-Roudbar, A.; Kaya, C. Handbook of freshwater fishes of West Asia. In Handbook of Freshwater Fishes of West Asia; De Gruyter: Berlin, Germany, 2025. [Google Scholar]
  34. Baycelebi, E.; Kaya, C.; Turan, D.; Ergüden, S.A.; Freyhof, J. Redescription of Garra turcica from southern Anatolia (Teleostei: Cyprinidae). Zootaxa 2018, 4524, 227–236. [Google Scholar] [CrossRef] [PubMed]
  35. FishBase. Available online: www.fishbase.org.au/v4 (accessed on 4 February 2025).
  36. Küçük, F.; Turan, D.; Güçlü, S.S.; Mutlu, A.G.; Çiftci, Y. Two new species of Chondrostoma Agassiz, 1832 (Teleostei: Cyprinidae) from the Ceyhan, Seyhan and Göksu rivers in the East Mediterranean region of Turkey. Turk. J. Fish. Aquat. Sci. 2017, 17, 795–803. [Google Scholar] [CrossRef]
  37. Bulbul, O.; Alp, A.; Kucukali, S. Evaluation of the two different type fish passages in River Ceyhan, Turkey in terms of biological and hydrological aspects. In Proceedings of the Fish Passage 2022 Conference, Richland, WA, USA, 13–16 June 2022. [Google Scholar]
  38. Bartnik, W.; Książek, L.; Wyrębek, M.; Strutyński, M. Bedload equilibrium measurements along Canoe-fishways. In Recent Trends in Environmental Hydraulics; Springer International Publishing: Cham, Switzerland, 2012. [Google Scholar]
  39. Köse, Ö. Turbulence characteristics of flow field around a cylindrical obstacle placed in a trapezoidal channel. Pol. J. Environ. Stud. 2018, 27, 1113–1121. [Google Scholar] [CrossRef]
  40. Zhang, D.; Bian, X.; Shi, X.; Deng, J.; Liu, Y. Design of a bilateral-symmetric multi-slot fishway and its comparison with vertical slot fishway in terms of hydraulic properties. River Res. Appl. 2023, 39, 954–969. [Google Scholar] [CrossRef]
  41. Gibouin, F.; Calluaud, D.; Pineau, G.; Cornu, V.; Baran, P.; Sagnes, P.; David, L. Global and local behaviour of brown trout (Salmo trutta, L.) and chub (Squalius cephalus, L.) inside a laboratory vertical slot fishway model. J. Ecohydraulics 2025, 10, 43–57. [Google Scholar] [CrossRef]
  42. Heimerl, S.; Hagmeyer, M.; Echteler, C. Numerical flow simulation of pool-type fishways: New ways with well-known tools. Hydrobiologia 2008, 609, 189–196. [Google Scholar] [CrossRef]
  43. Quaresma, A.L.; Romão, F.; Pinheiro, A.N. Comparative Assessment of Reynolds Averaged Navier–Stokes and Large-Eddy Simulation Models: Choosing the Best for Pool-Type Fishway Flow Simulations. Water 2025, 17, 686. [Google Scholar] [CrossRef]
  44. Rodi, W.; Constantinescu, G.; Stoesser, T. Large-Eddy Simulation in Hydraulics; CRC Press: Boca Raton, FL, USA, 2013. [Google Scholar]
  45. Hinterberger, C.; Fröhlich, J.; Rodi, W. Three-dimensional and depth-averaged large-eddy simulations of some shallow water flows. J. Hydraul. Eng. 2007, 133, 857–872. [Google Scholar] [CrossRef]
  46. Sonnenwald, F.; Stovin, V.; Guymer, I. Feasibility of the Porous Zone Approach to Modelling Vegetation in CFD, in Hydrodynamic and Mass Transport at Freshwater Aquatic Interfaces: 34th International School of Hydraulics; Springer: Berlin/Heidelberg, Germany, 2016; pp. 63–75. [Google Scholar]
  47. Jahangiri, N.; Ozbey, C.; Kucukali, S. Numerical simulation of vertical slot-brush fish pass: Porous media approach. Hydrobiologia 2024, 1–15. [Google Scholar] [CrossRef]
  48. Forchheimer, P. Wasserbewegung durch Boden, Zeitschrift des Vereines Deutscher Ingenieuer. World J. Mech. 1901, 45, 1782–1788. [Google Scholar]
  49. Gao, Z.; Andersson, H.I.; Dai, H.; Jiang, F.; Zhao, L. A new Eulerian–Lagrangian agent method to model fish paths in a vertical slot fishway. Ecol. Eng. 2016, 88, 217–225. [Google Scholar] [CrossRef]
  50. Piquet, J. Turbulent Flows: Models and Physics; Springer Science & Business Media: Berlin/Heidelberg, Germany, 2013. [Google Scholar]
  51. Wang, H.; Chanson, H.; Kern, P.; Franklin, C. Culvert hydrodynamics to enhance upstream fish passage: Fish response to turbulence. In Proceedings of the 20th Australasian Fluid Mechanics Conference, Perth, Australia, 5–8 December 2016; Australasian Fluid Mechanics Society: Canberra, NSW, Australia, 2016. [Google Scholar]
  52. Barreiros, M.d.O.; Barbosa, F.G.; Dantas, D.D.O.; Santos, D.D.M.L.D.; Ribeiro, S.; Santos, G.C.D.O.; Barros, A.K. Zebrafish automatic monitoring system for conditioning and behavioral analysis. Sci. Rep. 2021, 11, 9330. [Google Scholar] [CrossRef] [PubMed]
  53. Mattsson, K.; Ekvall, M.T.; Hansson, L.-A.; Linse, S. Altered behavior, physiology, and metabolism in fish exposed to polystyrene nanoparticles. Environ. Sci. Technol. 2015, 49, 553–561. [Google Scholar] [CrossRef]
  54. Chen, X.; Li, Y.; Qin, Z. Developing a novel quantitative parameter for characterizing spatial distribution of fish following exposure to chemicals and wastewater: Behavioral Gini coefficient. J. Environ. Sci. 2024, 141, 129–138. [Google Scholar] [CrossRef]
  55. Yildirim, Y. Video Analysis Based Fish Detecton and Tail Beat Frequency Est imation in Fishways. Master’s Thesis, Bilişim Enstitüsü, Istanbul Technical University, Istanbul, Turkey, 2018. [Google Scholar]
  56. Romão, F.; Quaresma, A.L.; Simão, J.; Bravo-Córdoba, F.J.; Viseu, T.; Santos, J.M.; Sanz-Ronda, F.J.; Pinheiro, A.N. Debating the rules: An experimental approach to assess cyprinid passage performance thresholds in vertical slot fishways. Water 2024, 16, 439. [Google Scholar] [CrossRef]
  57. Kucukali, S.; Yıldırım, Y.; Töreyin, B.U. Fish Movement Analysis in Diagonal Brush Fish Pass: Innovative Approaches, In International School of Hydraulics; Springer: Berlin/Heidelberg, Germany, 2023; pp. 243–253. [Google Scholar]
  58. Fausch, K.D. Profitable stream positions for salmonids: Relating specific growth rate to net energy gain. Can. J. Zool. 1984, 62, 441–451. [Google Scholar] [CrossRef]
  59. Muraoka, K.; Nakanishi, S.; Kayaba, Y. Boulder arrangement on a rocky ramp fishway based on the swimming behavior of fish. Limnologica 2017, 62, 188–193. [Google Scholar] [CrossRef]
  60. Przybilla, A.; Kunze, S.; Rudert, A.; Bleckmann, H.; Brücker, C. Entraining in trout: A behavioural and hydrodynamic analysis. J. Exp. Biol. 2010, 213, 2976–2986. [Google Scholar] [CrossRef]
  61. Gupta, S.K.; Dwivedi, V.K. Effect of surface roughness and channel slope on hydraulic jump characteristics: An experimental approach towards sustainable environment. Iran. J. Sci. Technol. Trans. Civ. Eng. 2024, 48, 1695–1713. [Google Scholar] [CrossRef]
Figure 1. Map of the Ceyhan River Basin and location of the Dagdelen SHP. Points denote the locations of the hydropower plants. The lower right map shows the location of the project site in Turkey.
Water 17 02294 g001
Figure 2. Photo of the Dagdelen fishway.
Water 17 02294 g002
Figure 3. Cross-section of the Dagdelen pool-weir fishway. The notch is located on the upper left and the orifice is located on the lower right.
Water 17 02294 g003
Figure 4. Three-dimensional view of the fishway showing ADV sampling points at two horizontal planes.
Water 17 02294 g004
Figure 5. Plan view of the ADV sampling points within the fishway pool (a) without a brush block, (b) with a brush block. All values are in centimeters. The inlet orifice is located on the upper left, and the outlet orifice is located on the lower right.
Water 17 02294 g005
Figure 6. Brush block used in the field experiments. (a) Plan view and its dimensions, (b) photo of the brush block. The bristle clear height is 0.37 m.
Water 17 02294 g006
Figure 7. Underwater video recording regions, denoted with capital letters, in the pool and the field of views of underwater cameras.
Water 17 02294 g007
Figure 8. Boundaries and components of the computational domain in the CFD model. In the specified boundary conditions, P denotes pressure, W denotes wall, and Q denotes discharge. The left figure shows the boundary conditions and probe points of the CFD model; the right figure shows the dimensions of the pool and the inlet of the fishway.
Water 17 02294 g008
Figure 9. Distributions of time-averaged velocities in the horizontal plane below the bristle’s tip (brush block if present) at z = 0.23 m: (a) without the brush block, (b) with the brush block.
Water 17 02294 g009
Figure 10. Distributions of time-averaged velocities in the horizontal plane above the bristle’s tip (brush block if present) at z = 0.48 m: (a) without the brush block, (b) with the brush block.
Water 17 02294 g010
Figure 11. The distribution of lateral RSS in the horizontal plane below bristles at z = 0.23 m. (a) Without the brush block, (b) with the brush block. The bristle clear height is 0.37 m, and the average pool depth is 0.90 m.
Water 17 02294 g011
Figure 12. The distribution of lateral RSS in the horizontal plane below bristles at z = 0.48 m. (a) Without the brush block, (b) with the brush block.
Water 17 02294 g012
Figure 13. Heatmap showing the relative abundance of Capoeta damascina in the representative pool during the test period. The contours represent the Fish Presence Intensity (FPI).
Water 17 02294 g013
Figure 14. Capoeta damascina movement video frames behind the brush block (B region) in the pool.
Water 17 02294 g014
Figure 15. Variation in the Fish Presence Intensity (FPI) versus the spatially averaged shear stress of each region in the pool.
Water 17 02294 g015
Figure 16. Numerical results of resultant velocity distribution within the representative pool of the fishway at z = 0.23 m orifice-notch flow for the design discharge of Qd = 0.167 m3/s: (a) without the brush block, (b) with the brush block.
Water 17 02294 g016
Figure 17. Numerical results of RSS distribution within the representative pool of the fishway at z = 0.23 m orifice-notch flow for the design discharge of Qd = 0.167 m3/s: (a) without the brush block, (b) with the brush block.
Water 17 02294 g017
Figure 18. Three-dimensional view of the instantaneous velocity distributions for the orifice-notch flow regime for the design discharge of Qd = 0.167 m3/s. The brush block was installed at the middle pool. The velocity values are in m/s.
Water 17 02294 g018
Table 1. Characteristics of the Dagdelen pool-weir fish pass.
Total Length (m)157
Total Height (m)15.8
Number of Pools71
Pool Length (m)2
Pool Width (m)1.5
Pool Height (m)1.15
Orifice dimensions (m)0.3 × 0.3
Notch dimensions (m)0.25 × 0.25
Bed slope10%
Qdesign (m3/s)0.167
Energy Dissipation per unit volume (W/m3)131
Table 2. Comparison of the without-with brush cases by the paired t-test.
Test GroupnMean DifferenceStd. Deviationt-Valuedfp-Value95% CI Lower95% CI UpperSignificance
z = 0.23 m20−7.8311.2593.11190.0058−13.099−2.56Significant (p < 0.05)
z = 0.48 m200.58618.07−0.145190.8863−7.8719.043Not significant
Disclaimer/Publisher’s Note: The statements, opinions and data contained in all publications are solely those of the individual author(s) and contributor(s) and not of MDPI and/or the editor(s). MDPI and/or the editor(s) disclaim responsibility for any injury to people or property resulting from any ideas, methods, instructions or products referred to in the content.