1. Introduction
An ancient Greek philosopher, Thales of Miletus (624 BC-546 BC), eloquently expressed the notion that “Water is the arche”, which is to say, “Water is the source of all life” [
1]. Water, the essence of life itself, is an indispensable resource without which existence is impossible.
The global discourse on water infrastructure planning and management emphasises the need for resilience to climate change, equitable access, and the integration of advanced technologies to optimise the water value chain [
2]. Access to potable water, dignified sanitation, and sustainable water use for ecosystems, industry, and agriculture are all dependent on effective water infrastructure planning and management [
3].
The water sector is going through fundamental changes across the world, and water infrastructure planning and management present difficulties for unstructured settings [
4]. Water supply institutional models or frameworks at a global level differ from one country to another. Publicly owned utilities are the most common organisational structures for delivering water services in the majority of countries, including South Africa [
5].
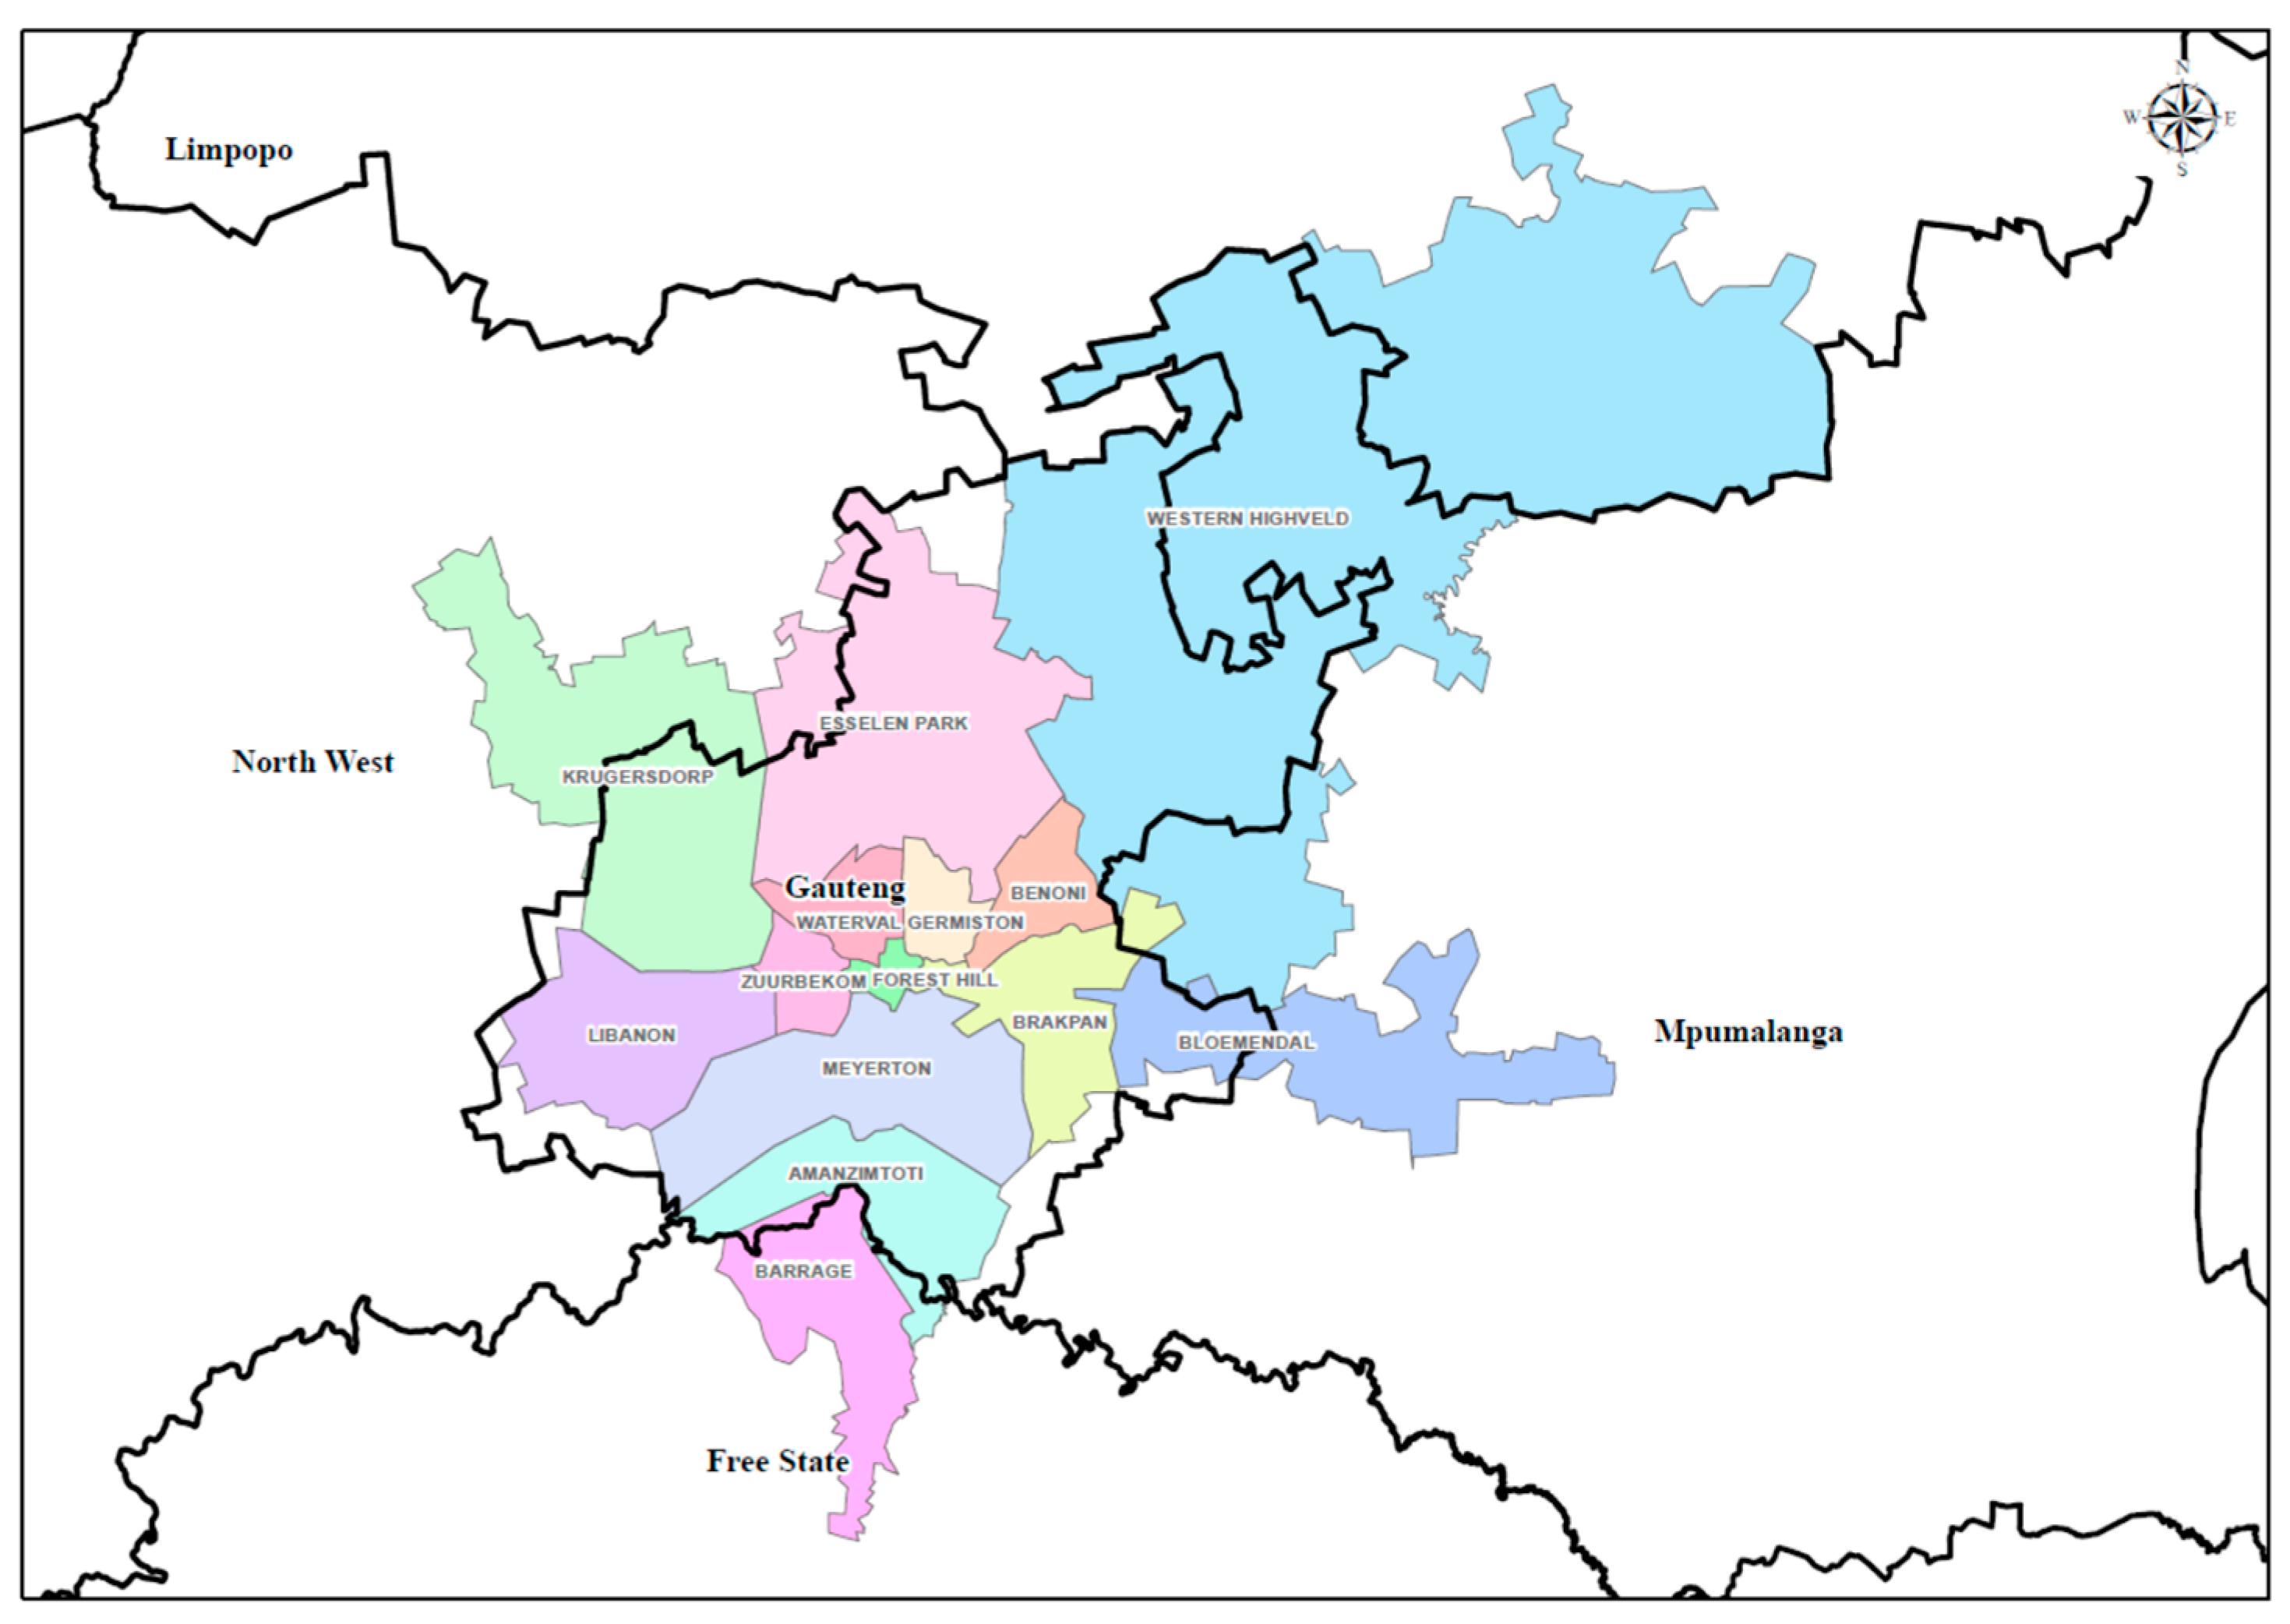
South Africa, a water-scarce country, has experienced rapid population growth and urbanisation, which is driven by cultural, economic, political, and environmental factors, particularly in economic hubs such as Gauteng province [
6]. This puts a strain on the region’s water and sanitation infrastructure and creates significant challenges for the planning and management of infrastructure [
3]. Water governance in Gauteng province is comparable to that of some urban states in India in that it consists of complex district and municipal players who play different roles politically and administratively [
7]. A comparative study of water governance in Germany, the Netherlands, Australia, China, and South Africa shows that whilst there is a greater need for sustainable and integrated water governance to mitigate the challenges of climate change, diversity in governance models is essential for dealing with complex water management challenges [
8].
Despite these insights, water utilities generally utilise internally designed infrastructure planning frameworks or processes; as such, these tools lack the adaptability, transferability, or usability in other infrastructure planning scenarios outside their organisations [
9]. The existing literature shows that past attempts to develop water infrastructure frameworks have focused exclusively on either the planning aspect [
5] or the asset management aspect that focuses on operations and maintenance [
10], thus leaving a gap in that effective planning should be informed by feedback from asset performance and maintenance. Furthermore, in previous scenarios where infrastructure planning or management frameworks were developed, they represent water systems that are generally managed by one utility [
5], whereas in this case, the water value chain entails intertwined infrastructure owned and operated by multiple institutions.
Existing research on infrastructure life cycle asset management often looks at either planning or management of water infrastructure in isolation [
11]. This research focuses on assessing the effectiveness of both planning and management of water infrastructure across the water value chain. The proposed water infrastructure planning and management framework therefore provides novelty in that firstly, it integrates water infrastructure planning and management of multiple institutions in one value chain, and secondly, it further proposes independent, centralised monitoring and evaluation functions, which are fundamental to the sustainability of water supply. Central to the proposed framework is the inclusion and adaptability of climate-resilient strategies and fourth industrial revolution (4IR) technologies, i.e., it is a forward-thinking design. The proposed framework is scalable and adaptable in different scenarios irrespective of the number of institutions involved in the value chain.
The layout of this article is organised as follows:
Section 2 provides the background of the water value chain in Gauteng province, followed by the fundamental aspects of Infrastructure Asset Management Life Cycle and, finally, the development of the drivers. The material and methods in
Section 3 address the five key steps of the research methodology as well as the analysis of reliability and validity of the data.
Section 4 covers the results and data analysis of the collected data, whilst
Section 5 discusses the outcomes of the research, and it mainly focuses on highlighting the gaps from the prevailing frameworks identified through data analysis as well as the formulation of recommendations for a proposed integrated water infrastructure planning and management framework. The proposed framework was validated by industry experts using qualitative methods. Finally,
Section 6 covers the conclusion of this research project.
3. Materials and Methods
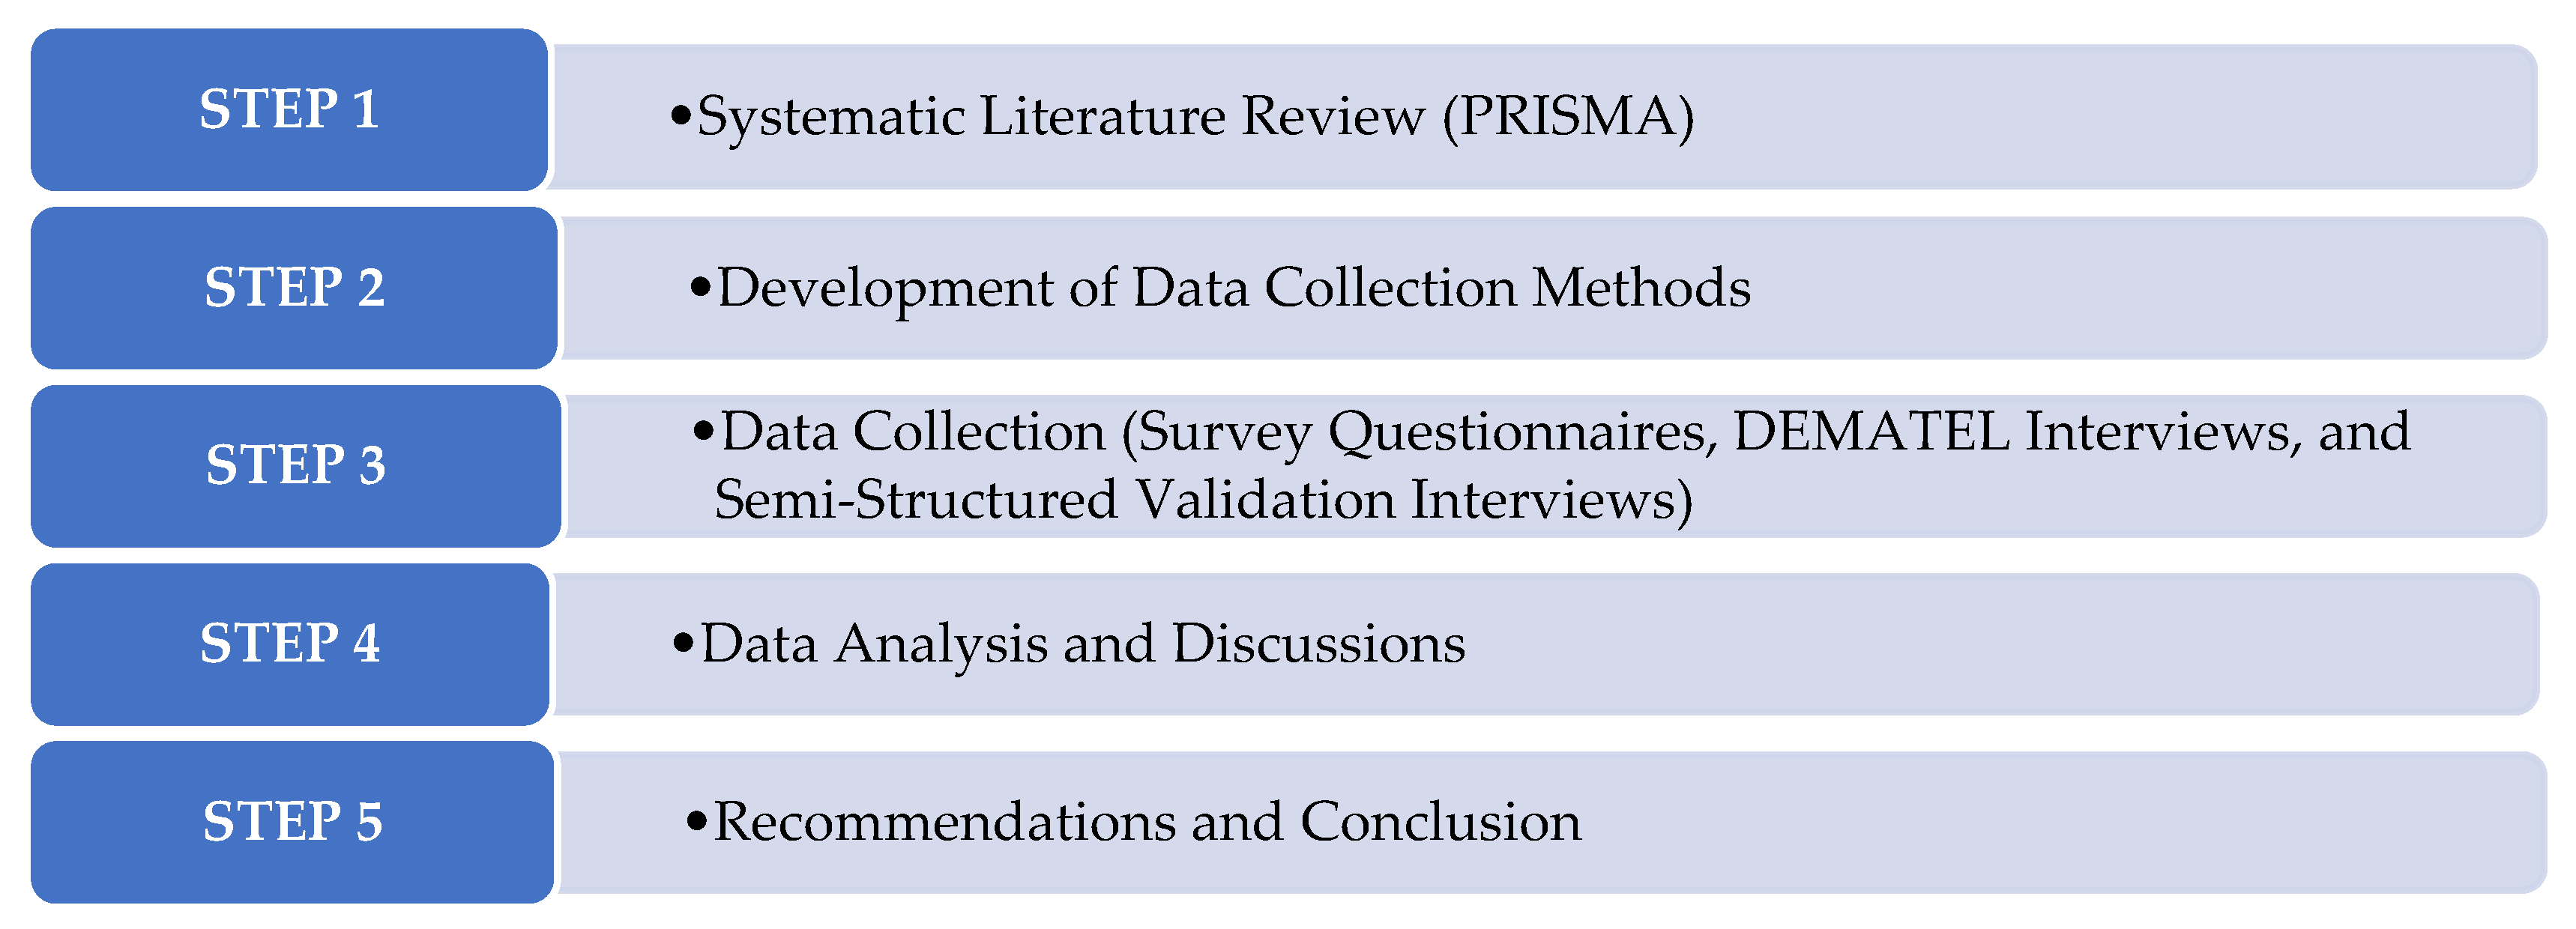
It is key to detail the step-by-step method that was followed to arrive at the findings of this research, and therefore,
Figure 3 depicts a diagrammatical representation of the steps that were followed to collect the data.
STEP 1: A systematic literature review was conducted in order to identify gaps and drivers of a sustainable water infrastructure planning and management framework.
Preferred Reporting Items for Systematic Reviews and Meta-Analyses (PRISMA) was used for the data analysis [
34]. PRISMA is an evidence-based minimum set of items for reporting in systematic reviews and meta-analyses [
35]. Secondary data were collected by going through peer-reviewed articles published in Scopus. The title for the search was (“water infrastructure planning framework OR model”) AND (climate AND resilient AND water AND infrastructure AND framework) OR (4IR AND water AND planning).
Seven drivers were identified, namely Climate Resilience, Effective Stakeholder Engagement, Inclusion of Industry 4.0 Technologies, Enabling Legislation/Policy Direction, Funding, Integration, and Political Support. The seven drivers were further narrowed down to the three most influential factors using the Pareto analysis, namely Climate Resilience, Effective Stakeholder Management, and Adaptation and Inclusion of 4IR Technologies. Pareto analysis is a quality control method that lists data classifications from the highest to lowest frequency of occurrence in descending order. The “80/20” rule of the Pareto principle is a pragmatic tool based on the Pareto principle’s hypotheses that for many occurrences, roughly 80% of the effects derive from 20% of the causes [
36].
Climate change has a considerable detrimental impact on water supplies. It is expected that droughts and floods in Southern Africa will become more frequent and intense as a result of climate change [
3]. The effects of climate change are felt either directly or indirectly in a number of industries, including agriculture, water, energy, and health [
37]. Gauteng’s climate is extremely unpredictable and has a history of unusually protracted droughts [
3]. In 2015, Gauteng province suffered the effects of El Niño climatic conditions, which led to insufficient rainfall and drought, leading to critically low dam levels, and this triggered widespread water shortages despite the water restrictions measures that were enforced at the time. To increase resilience to the impact of climate change, an integrated framework for planning and management of water infrastructure is therefore required [
13].
Industry 4.0 or the Fourth Industrial Revolution (4IR), according to the World Economic Forum (WEF), refers to emerging technology domains such as nanotechnology, biotechnology, novel materials, and advanced digital production technologies distinguished by their convergence and complementarity [
9]. The Internet of Things, robotics, 3-D printing, nanotechnology, biotechnology, materials science, energy storage, and quantum computing are just a few of the fields where emerging technological advancements will multiply the possibilities presented by 4IR [
38]. In the water industry, 4IR technologies that are gaining traction are machine learning, circular economy, digitalisation, digital twins of infrastructure focusing on operations and maintenance, Internet of Things, artificial intelligence, and blockchain technology [
38]. Digitalisation, water reuse, and resource recovery were determined to underpin the circular economy in the water sector [
36]. Exploration of long-term urban water infrastructure planning through machine learning is also gaining advancement [
9]. While the integration of 4IR technologies is crucial for improving efficiency and sustainability in water infrastructure, its successful adoption depends on effective stakeholder management.
Stakeholder management is the ongoing methodical process by which a company builds constructive connections with its stakeholders in order to incorporate their expectations into its operations. Over the years, it was believed that stakeholders and companies have competing objectives; however, there is more recognition that both company and stakeholder objectives are mutually beneficial [
39]. Companies are adopting managerial strategies in order to build strong, long-lasting relationships with their stakeholders to achieve balance instead of depending on the organic development of stakeholder relationships [
40].
The contextual analysis of stakeholders entails a comprehensive method or process for comprehending a system by identifying the main players or stakeholders and evaluating their individual stakes in the system [
41]. Three steps are included in a typology of research methodologies for stakeholder identification and analysis, namely identifying stakeholders, differentiating and categorising stakeholders, and analysing relationships among stakeholders [
42]. Technocratic and scientific water management styles dominate water infrastructure planning and management, and often, short-term practical goals are prioritised over longer-term strategic planning, which requires effective stakeholder management [
43].
STEP 2: The three drivers of WIPM, which were identified during the systematic literature review, were later used to inform the design of survey questions. The survey questionnaire consisted of 3 sections, whereby the first section covered the consent letter, the second section was the demographic information of the participants, and the third section consisted of the actual questions that the respondents were asked to respond to.
A Likert-type scale was used to rate the questions, whereby 1 = strongly disagree; 2 = disagree; 3 = neutral; 4 = agree; and 5 = strongly agree. Furthermore, stakeholder management influence questions were measured using the scale, whereby 1 = no influence; 2 = low influence; 3 = medium influence; 4 = high influence; and 5 = very high influence, whilst impact questions were measured using the scales whereby 1 = no impact; 2 = low impact; 3 = medium impact; 4 = high impact; and 5 = very high impact [
44]. The analysis of the research data was conducted using Excel spreadsheets.
STEP 3: This research was carried out using mixed methods. Survey questions were sent by the researcher to the respondents electronically by email. Non-probability sampling was used to select respondents, whereby the selection of the sample is based on the researcher’s judgment and knowledge of the industry experts [
43]. Purposive sampling in particular, also known as judgmental or selective sampling, is a non-probability sampling technique where the researcher deliberately chooses specific individuals or units from the population based on predefined criteria and their knowledge of the population [
45].
STEP 4: Furthermore, quantitative analysis through a Decision-Making Trial Evaluation Laboratory (DEMATEL) was conducted to quantify and visualise cause-and-effect relationships among the critical success factors that define a good asset management plan according to ISO 55000 and 55001. DEMATEL typically has five key steps:
Determining the opinion of experts using a Likert type scale on a set of factors, which, in this case, will be the critical success factors of WIPMF. The average influence of CSF-j on CSF-i, is calculated based on individual opinions
, of all
h experts, with n individual
of their expert opinion, based on the equation
Determining the Normalised Direct Influence Matrix (
D), and this refers to the scaled version of the initial direct relation matrix, obtained by dividing all elements by the maximum row or column sum, to ensure all influence values fall within a convergent range for further analysis [
46].
Construction of the Total Influence Matrix (T), which represents the combined direct and indirect influences that each factor exerts on others within the system [
46].
Calculating the Vectors Ri and Ci, and this is achieved by summing up the rows and columns of matrix (T), respectively. The key relationships are determined based on the threshold α value to highlight key factor relationships.
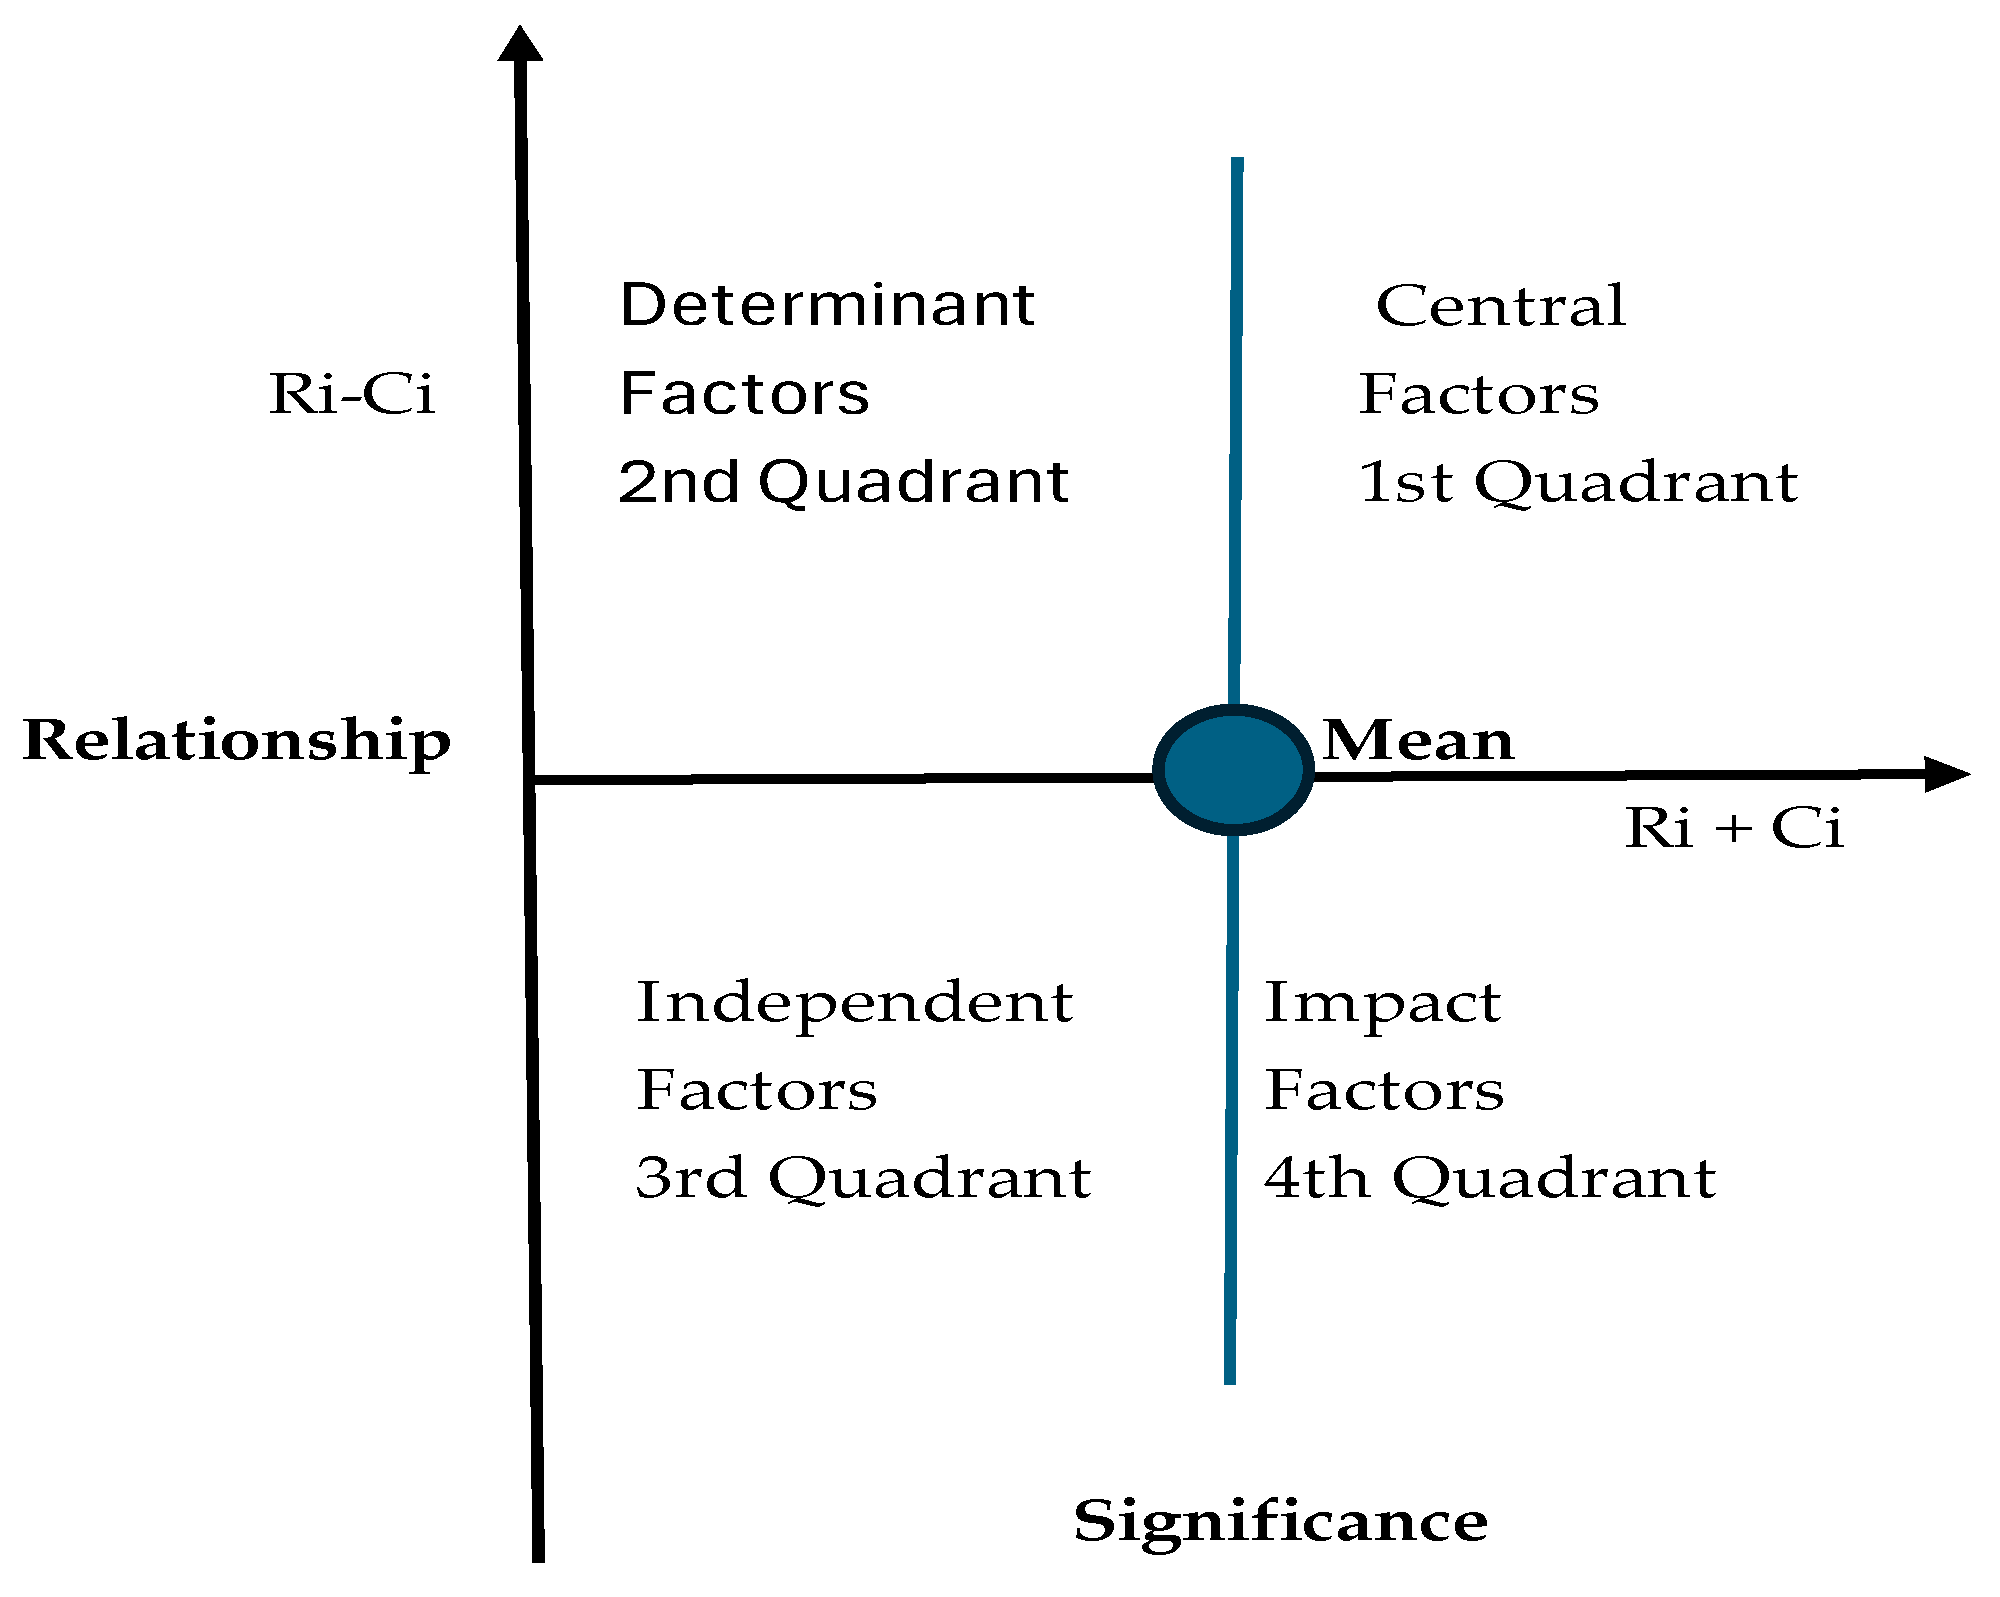
The final step is to produce the Influence Relation Map (IRM) by plotting each factor using its values of (R + C) and (R − C), which helps group the factors into four quadrants based on their overall importance and role as causes or effects.
DEMATEL data were collected through group interviews representing three organisations of the water value chain. Participants were asked to rate the causal relationships among the critical success factors and also justify why they rated them as such. Group interviews lasted two hours on average.
Qualitative data were collected to validate the proposed water infrastructure planning and management framework through semi-structured interviews. Respondents were asked to comment and propose revisions to the proposed framework. The qualitative data collected were analysed using the Thematic Analysis method. Thematic Analysis is the art of determining the underlying meaning of qualitative data sets by analysing their patterns and themes, and this process is guided by the research questions and objectives [
44,
47]. Qualitative data analysis entails five steps, namely Step 1: data preparation and familiarisation, Step 2: code generation from collected qualitative data, Step 3: theme identification, Step 4: theme review and definition, and Step 5: analysis and interpretation of findings [
48].
STEP 5: This step entails validation of the quantitative data that were collected. Validity can be defined as the extent to which a concept is accurately measured in a research study, and reliability refers to the consistency of a measure as to whether the results can be reproduced under the same conditions [
49]. A measure can be reliable but invalid if it is measuring something very consistently but does so measuring the wrong construct. Similarly, a measure can be valid but unreliable if it is measuring the right construct but not doing so in a consistent manner [
45].
The reliability and consistency of constructs measuring water infrastructure planning and management effectiveness were validated using Cronbach’s alpha. A sample size of 33, aligned with the literature that provide guidance for researchers in choosing the right sample size [
50]. Cronbach’s alpha evaluates internal consistency, with values closer to 1.0 indicating stronger reliability. Scores above 0.9 indicate excellent reliability, while those below 0.5 are considered unacceptable [
51].
STEP 6: This is the final step of the research, and it details the recommendations and conclusion. A novel integrated water infrastructure planning and management framework was developed for Gauteng province and circulated to water industry experts for validation. The inputs received during the validation process were later incorporated into the final framework, which is discussed in
Section 4.
4. Results
The research survey, which contained quantitative research questions, was sent out to 52 respondents representing the 3 main role players of the water sector, namely raw water resources, Bulk Water Utility, and Metropolitan Municipalities. Of the total number of questionnaires sent out, 33 were received back. This constitutes a 63% response rate, and considering that this research was targeted at respondents who work in the planning, operations, and maintenance departments of the water sector, a 63% response rate is regarded as representative and acceptable [
50].
4.1. Demographics of Participants
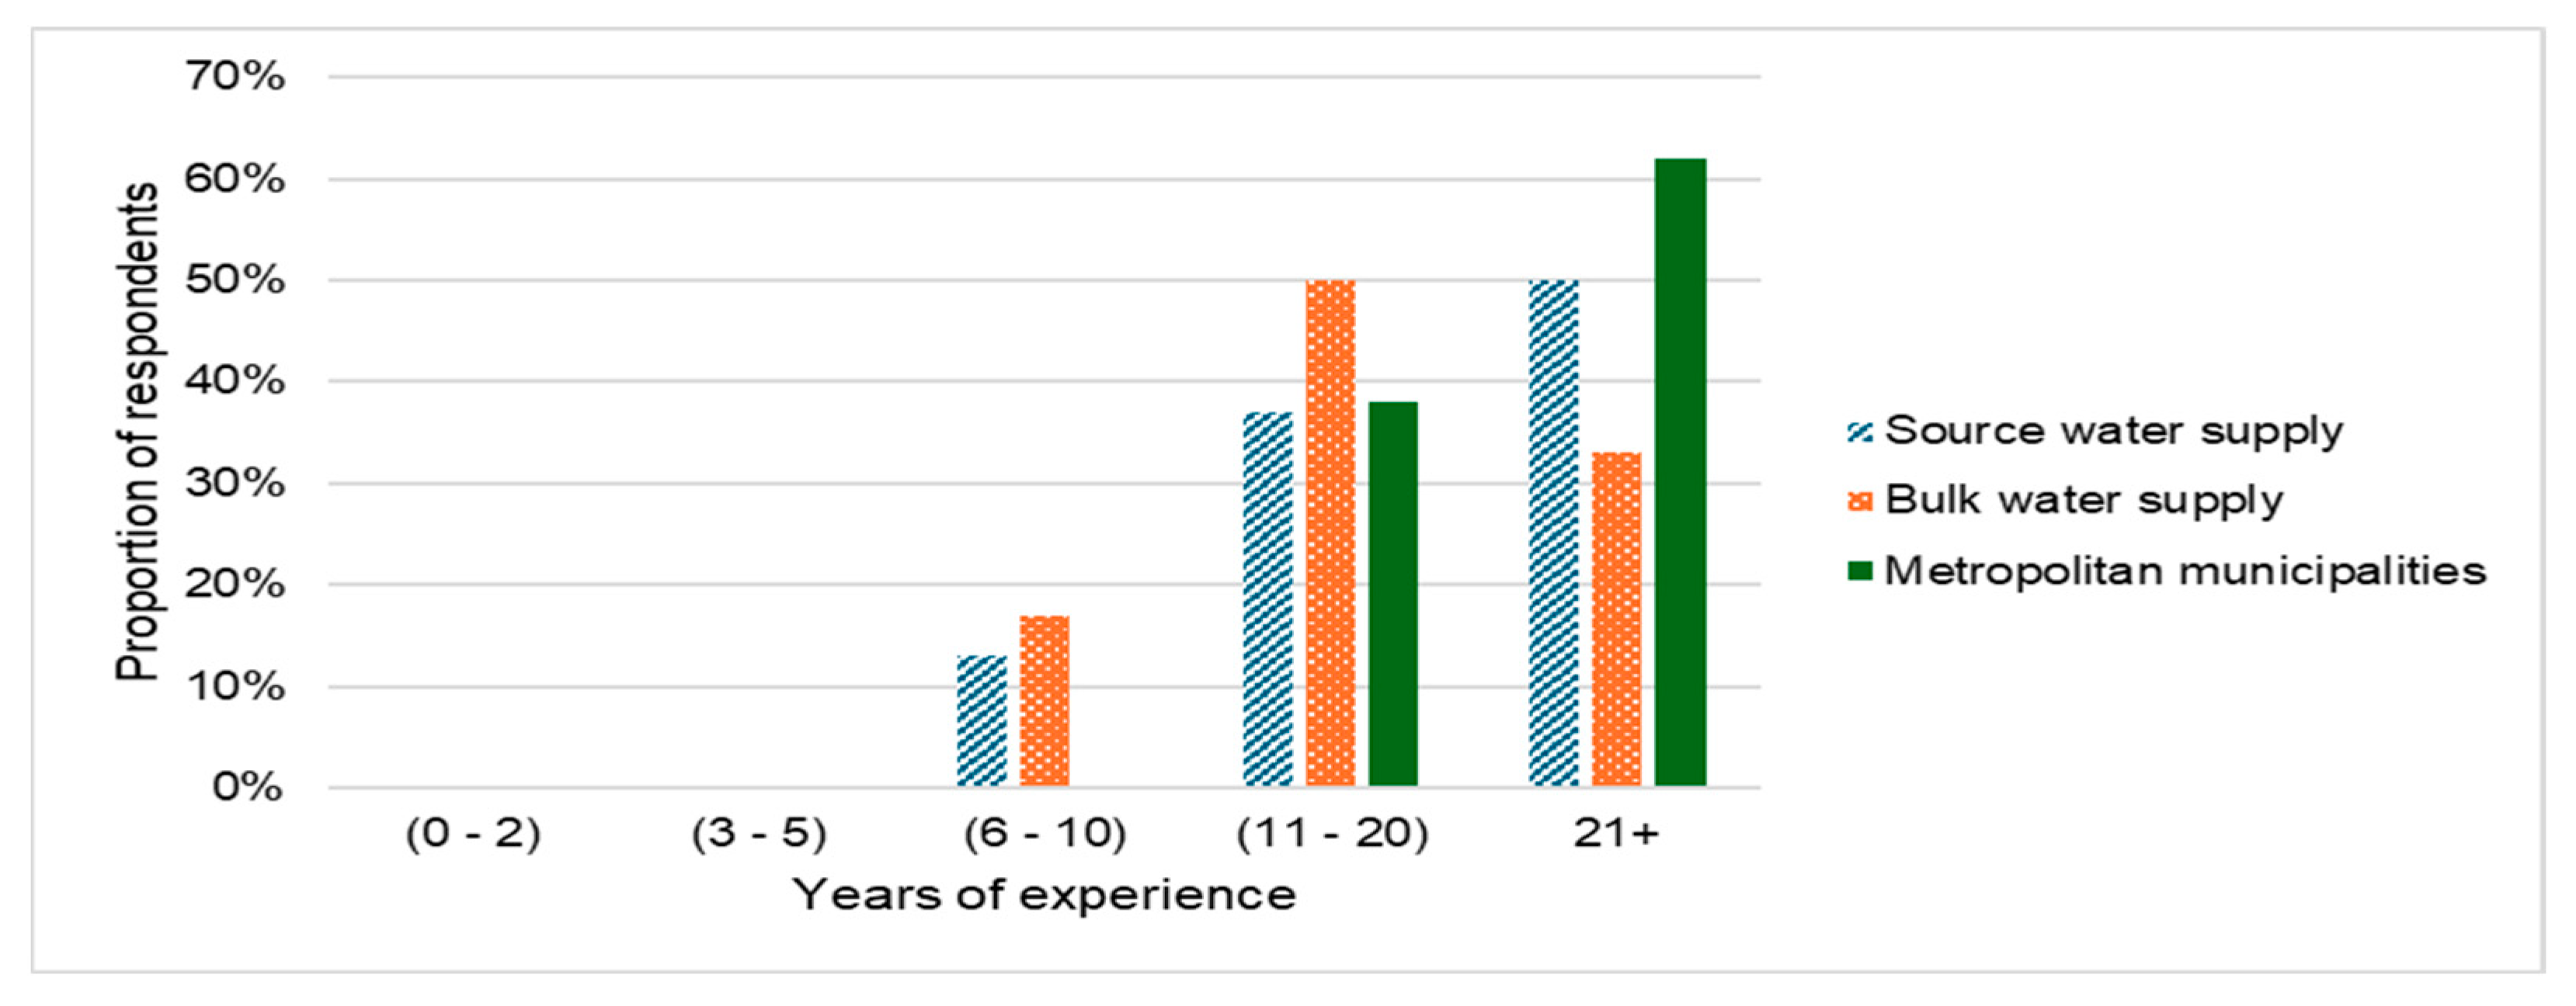
The demographics of participants were divided into three groups, namely academic qualifications, years of service in the water sector, and the current positions held by the respondents. There were 7 respondents from the source water supply, 18 from the Bulk Water Utility, and 8 from the Metropolitan Municipalities.
An analysis of the respondents’ years of experience was conducted. The data in
Figure 4 revealed that none of the participants had less than 5 years of experience across all three sectors. Respondents from the Metropolitan Municipalities have the highest number of years of service as compared to the other two institutions, and this can be attributed to the fact that the Metropolitan Municipalities that were sampled are amongst the biggest in South Africa; therefore, they tend to provide better employment packages to warrant low staff turnover. The results further show that at least 80% of respondents have over 10 years of experience across the board.
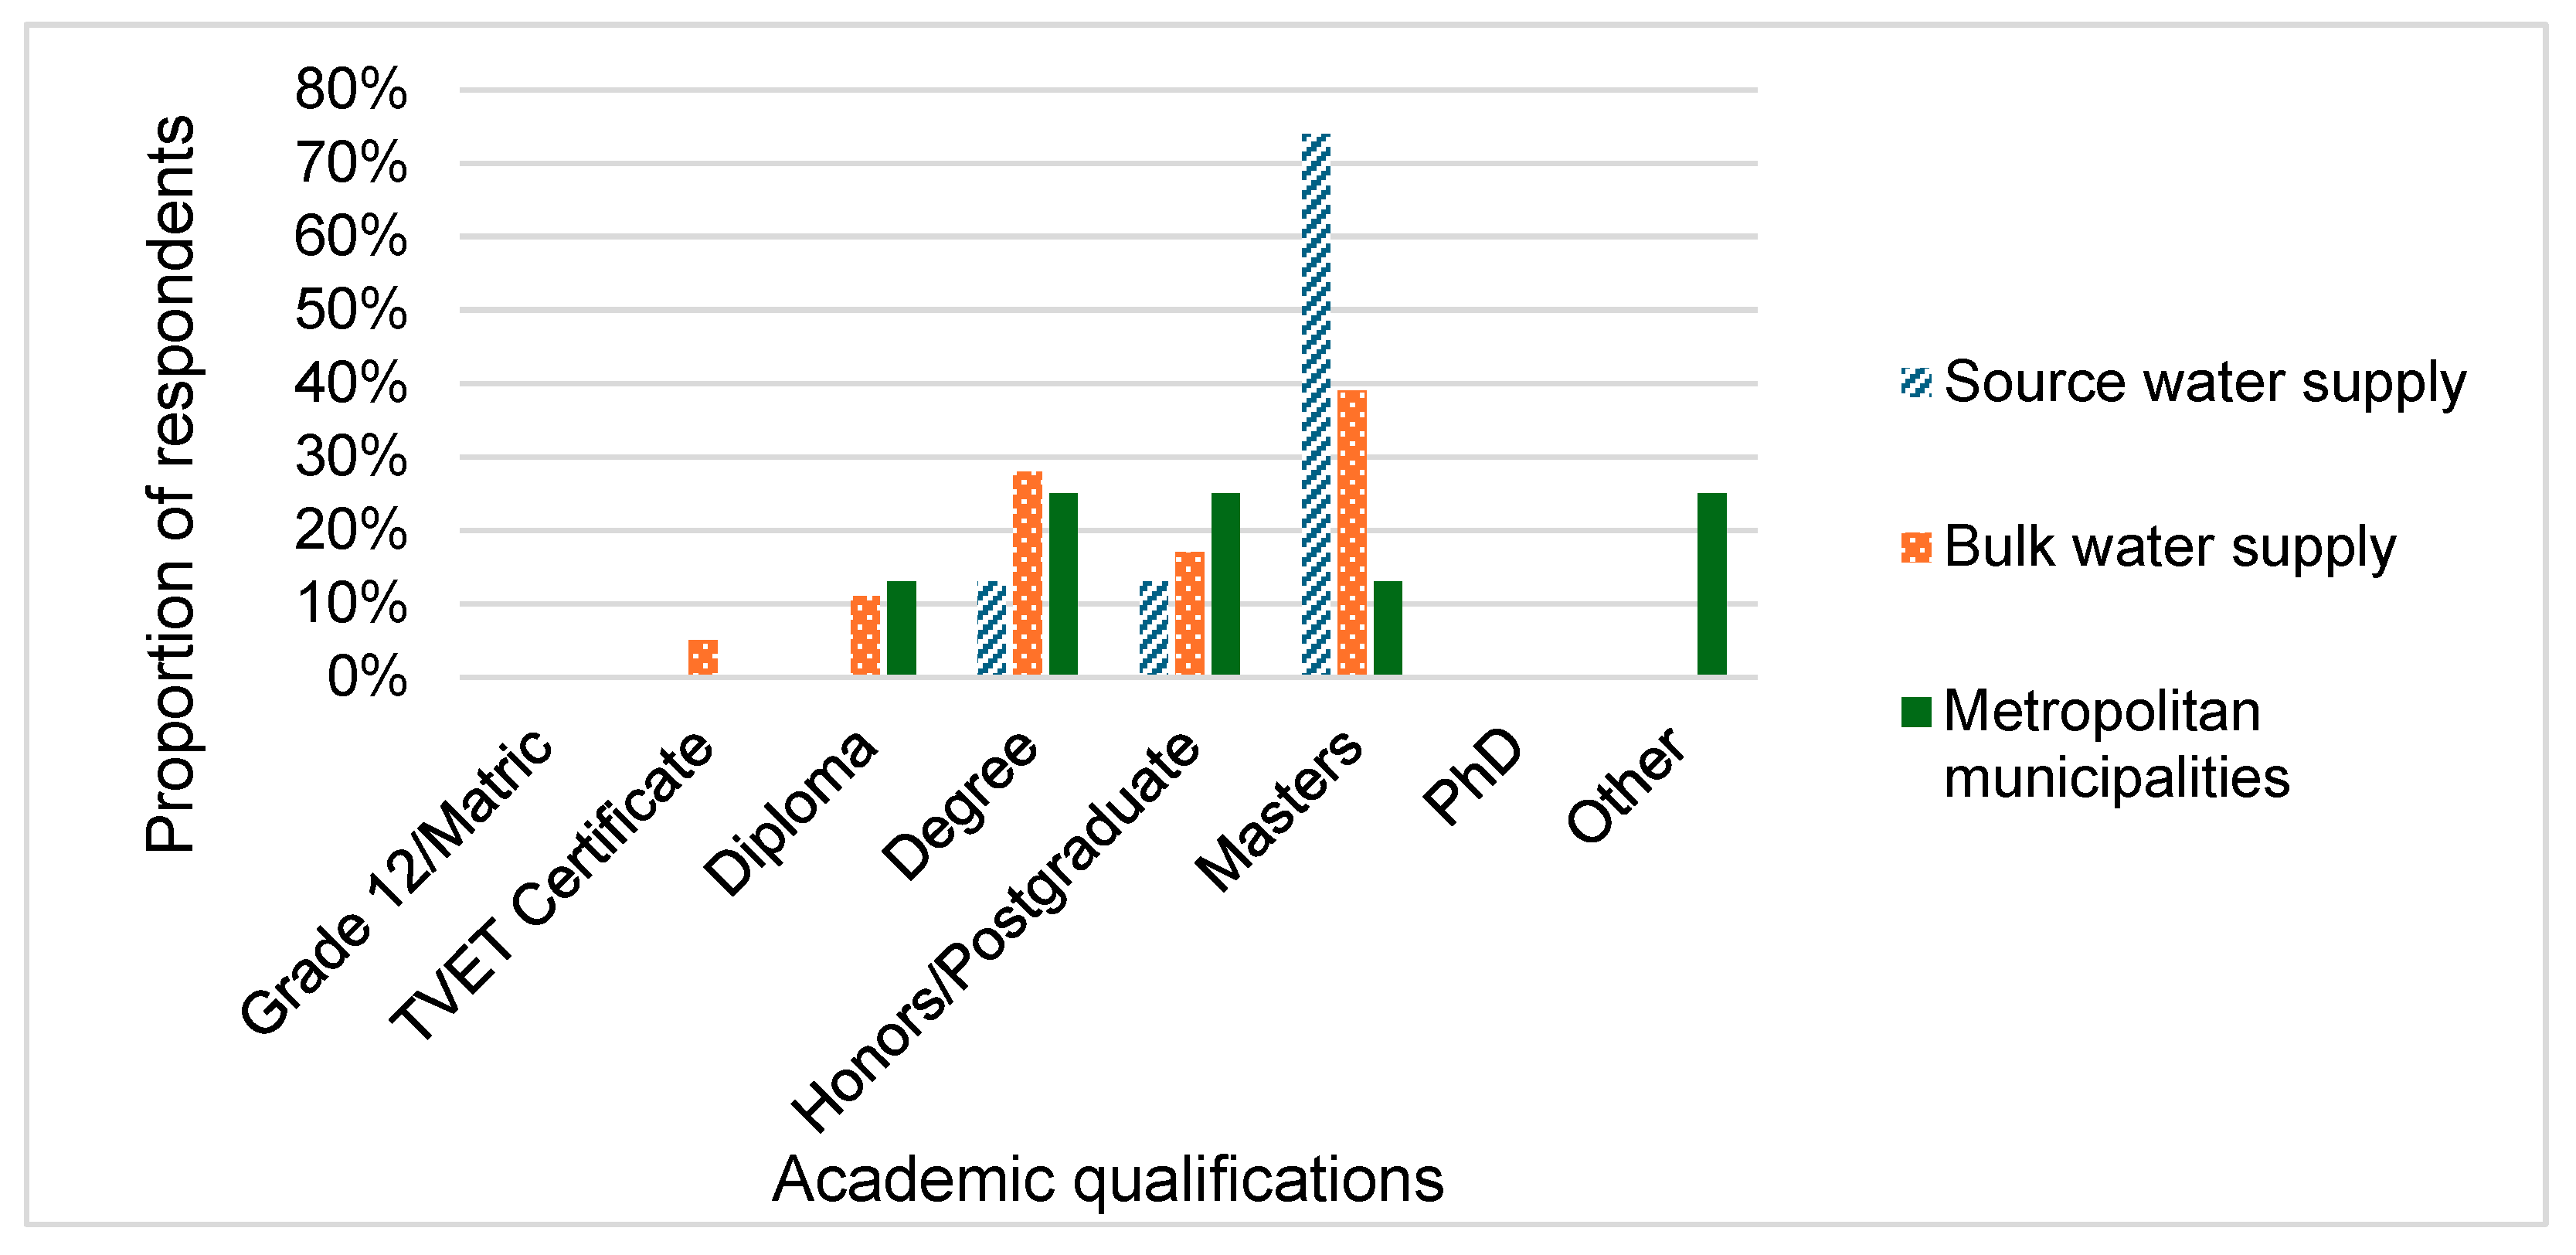
According to the data collected and depicted in
Figure 5, all respondents possess a tertiary qualification. More than 80% of the respondents across all three sectors hold at least an undergraduate degree in Engineering. There were respondents who hold post-graduate diplomas in project management, and these were classified as “other” according to the questionnaire.
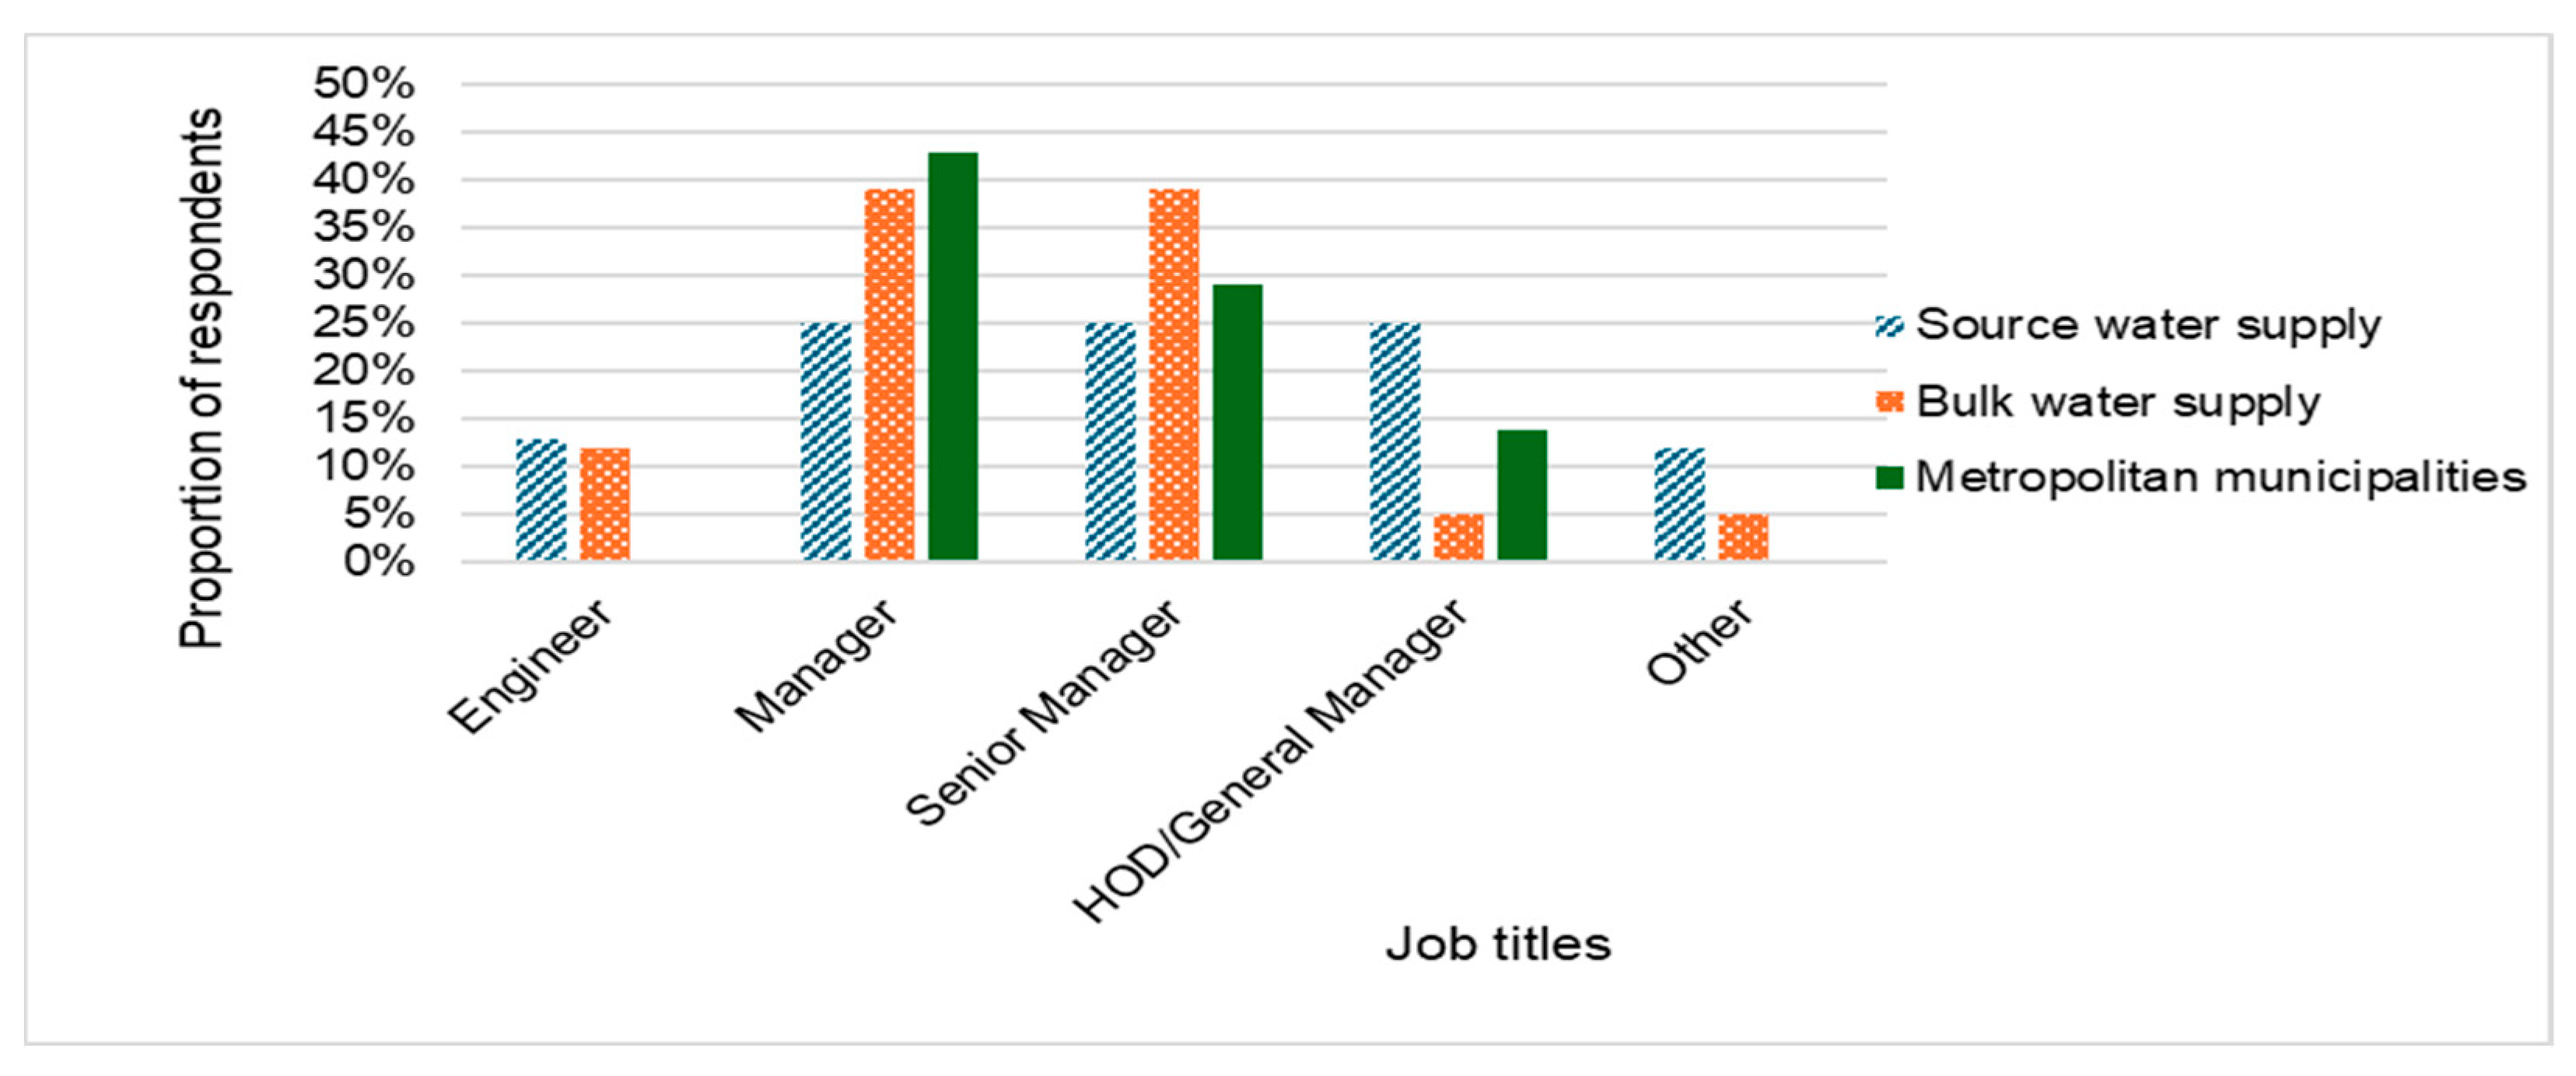
Lastly, the respondents’ demographics were analysed in terms of the positions that they hold in their respective institutions. Key departments where the respondents work are infrastructure planning, project management, operations, and maintenance.
Figure 6 shows that engineers, managers, and senior managers constitute over 80% of the respondents. There were respondents who previously held senior positions in their institutions and are now serving in executive positions such as managing directors or as board members, and these were classified as “other” according to the questionnaire’s demographics section. It can also be confirmed by analysing the data the respondents’ years of experience coupled with the positions they hold that they are not only managing key water infrastructure planning and management departments but they have hands-on experience in these areas. The demographic data that were collected and analysed confirm that the respondents’ sample selection can be deemed adequate, valid, and reliable [
52].
4.2. Effectiveness of Infrastructure Planning and Management Processes
This section assesses stakeholder perceptions of water infrastructure planning and management effectiveness using four of the six CSFs as analytical lenses: Strategic Alignment (CSF1), Lifecycle-Based Approach (CSF2), Evidence-Based Planning (CSF5), and Continuous Improvement (CSF6).
4.2.1. Strategic Alignment and Lifecycle-Based Approaches as Analytical Lenses for Infrastructure Planning
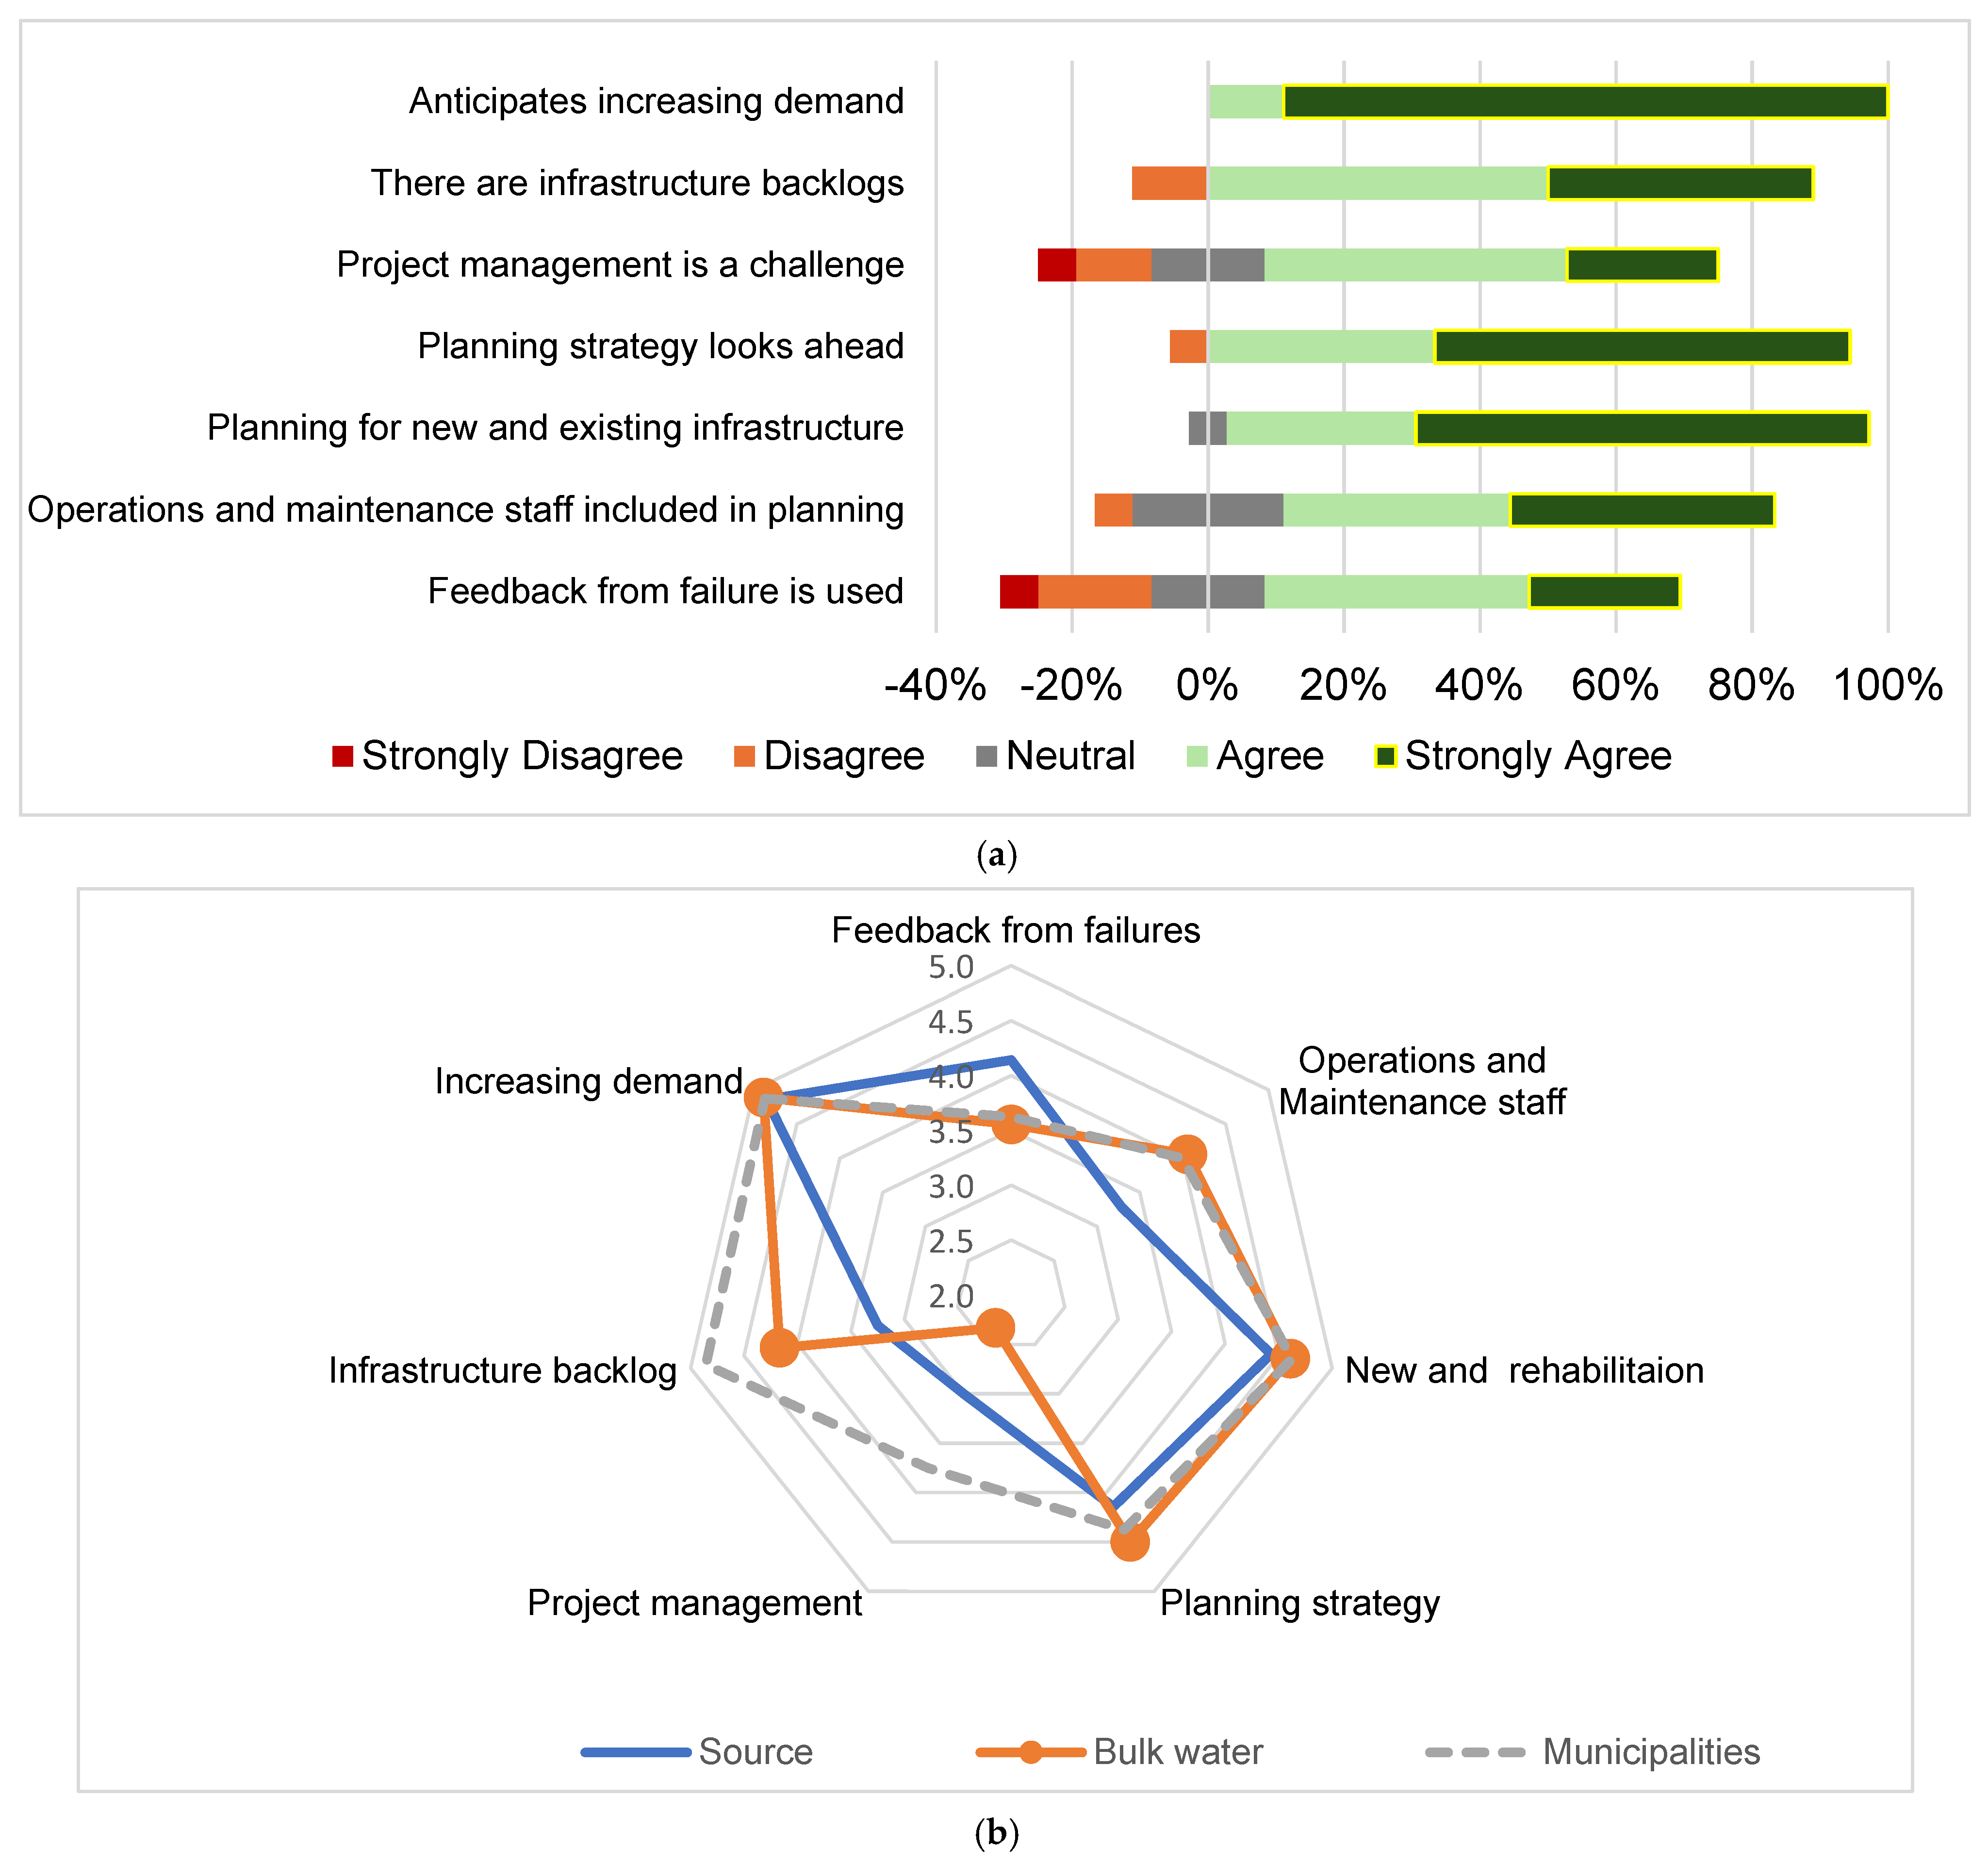
To evaluate the effectiveness of infrastructure planning and management, participants were asked to assess the level of Strategic Alignment (CSF1) and the application of a systematic infrastructure Lifecycle-Based Approach (CSF2). Participants were asked about key planning factors, including expected increases in water demand, the presence of infrastructure backlogs, feedback loops between operations and planning, and the scope and focus of existing planning strategies (
Figure 7a,b) [
5].
All three institutions’ respondents strongly agreed that there is an increase in water demand and that infrastructure backlogs are a persistent problem, as shown in
Figure 7a. They specifically attributed these backlogs to poor project management, which is one of the response options in the survey instrument. This attribution is key because it shows that respondents themselves identified weak execution rather than budget constraints or regulatory delays as the main cause of infrastructure delivery gaps. This points to a challenge in aligning planning intentions with operational execution, which is part of Strategic Alignment (CSF1).
However,
Figure 7a shows relatively high agreement that infrastructure planning is not a challenge, indicating that planning frameworks exist even though persistent backlogs linked to project management failures suggest that these frameworks may not be translated into implementation. Therefore, the evidence from
Figure 7a supports a partial weakness in CSF1, where planning exists but execution capacity or its alignment with implementation teams is lacking.
Moreover,
Figure 7b elaborates on planning priorities by showing that all three institutions’ respondents agreed that planning should include both rehabilitation of existing infrastructure and augmentation projects. This means they understand the need to manage both current and future infrastructure needs in response to increasing water demand.
Notably,
Figure 7a asks if feedback from infrastructure failures is used to inform better planning and design. While most participants agreed that feedback exists, the recurring infrastructure backlogs and implementation challenges in
Figure 8a,b show that these lessons may not be consistently translated into structured, predictive maintenance, or renewal strategies. This means a partial weakness in CSF2, where planning captures lessons learned but lifecycle-based asset management is reactive rather than proactive.
Thus, based on the survey data, Strategic Alignment (CSF1) is partially strong because planning exists and partially weak because of implementation misalignment as inferred from backlogs and poor project execution. Lifecycle-Based Approach (CSF2) is undetermined because there is no direct evidence of lifecycle criteria informing current plans. This means stakeholders are aware of planning imperatives and the need for expansion and rehabilitation but struggle with a planning process that aligns with the asset’s lifecycle and implementation.
4.2.2. Effectiveness of Infrastructure Management Through the Lens of CSFs
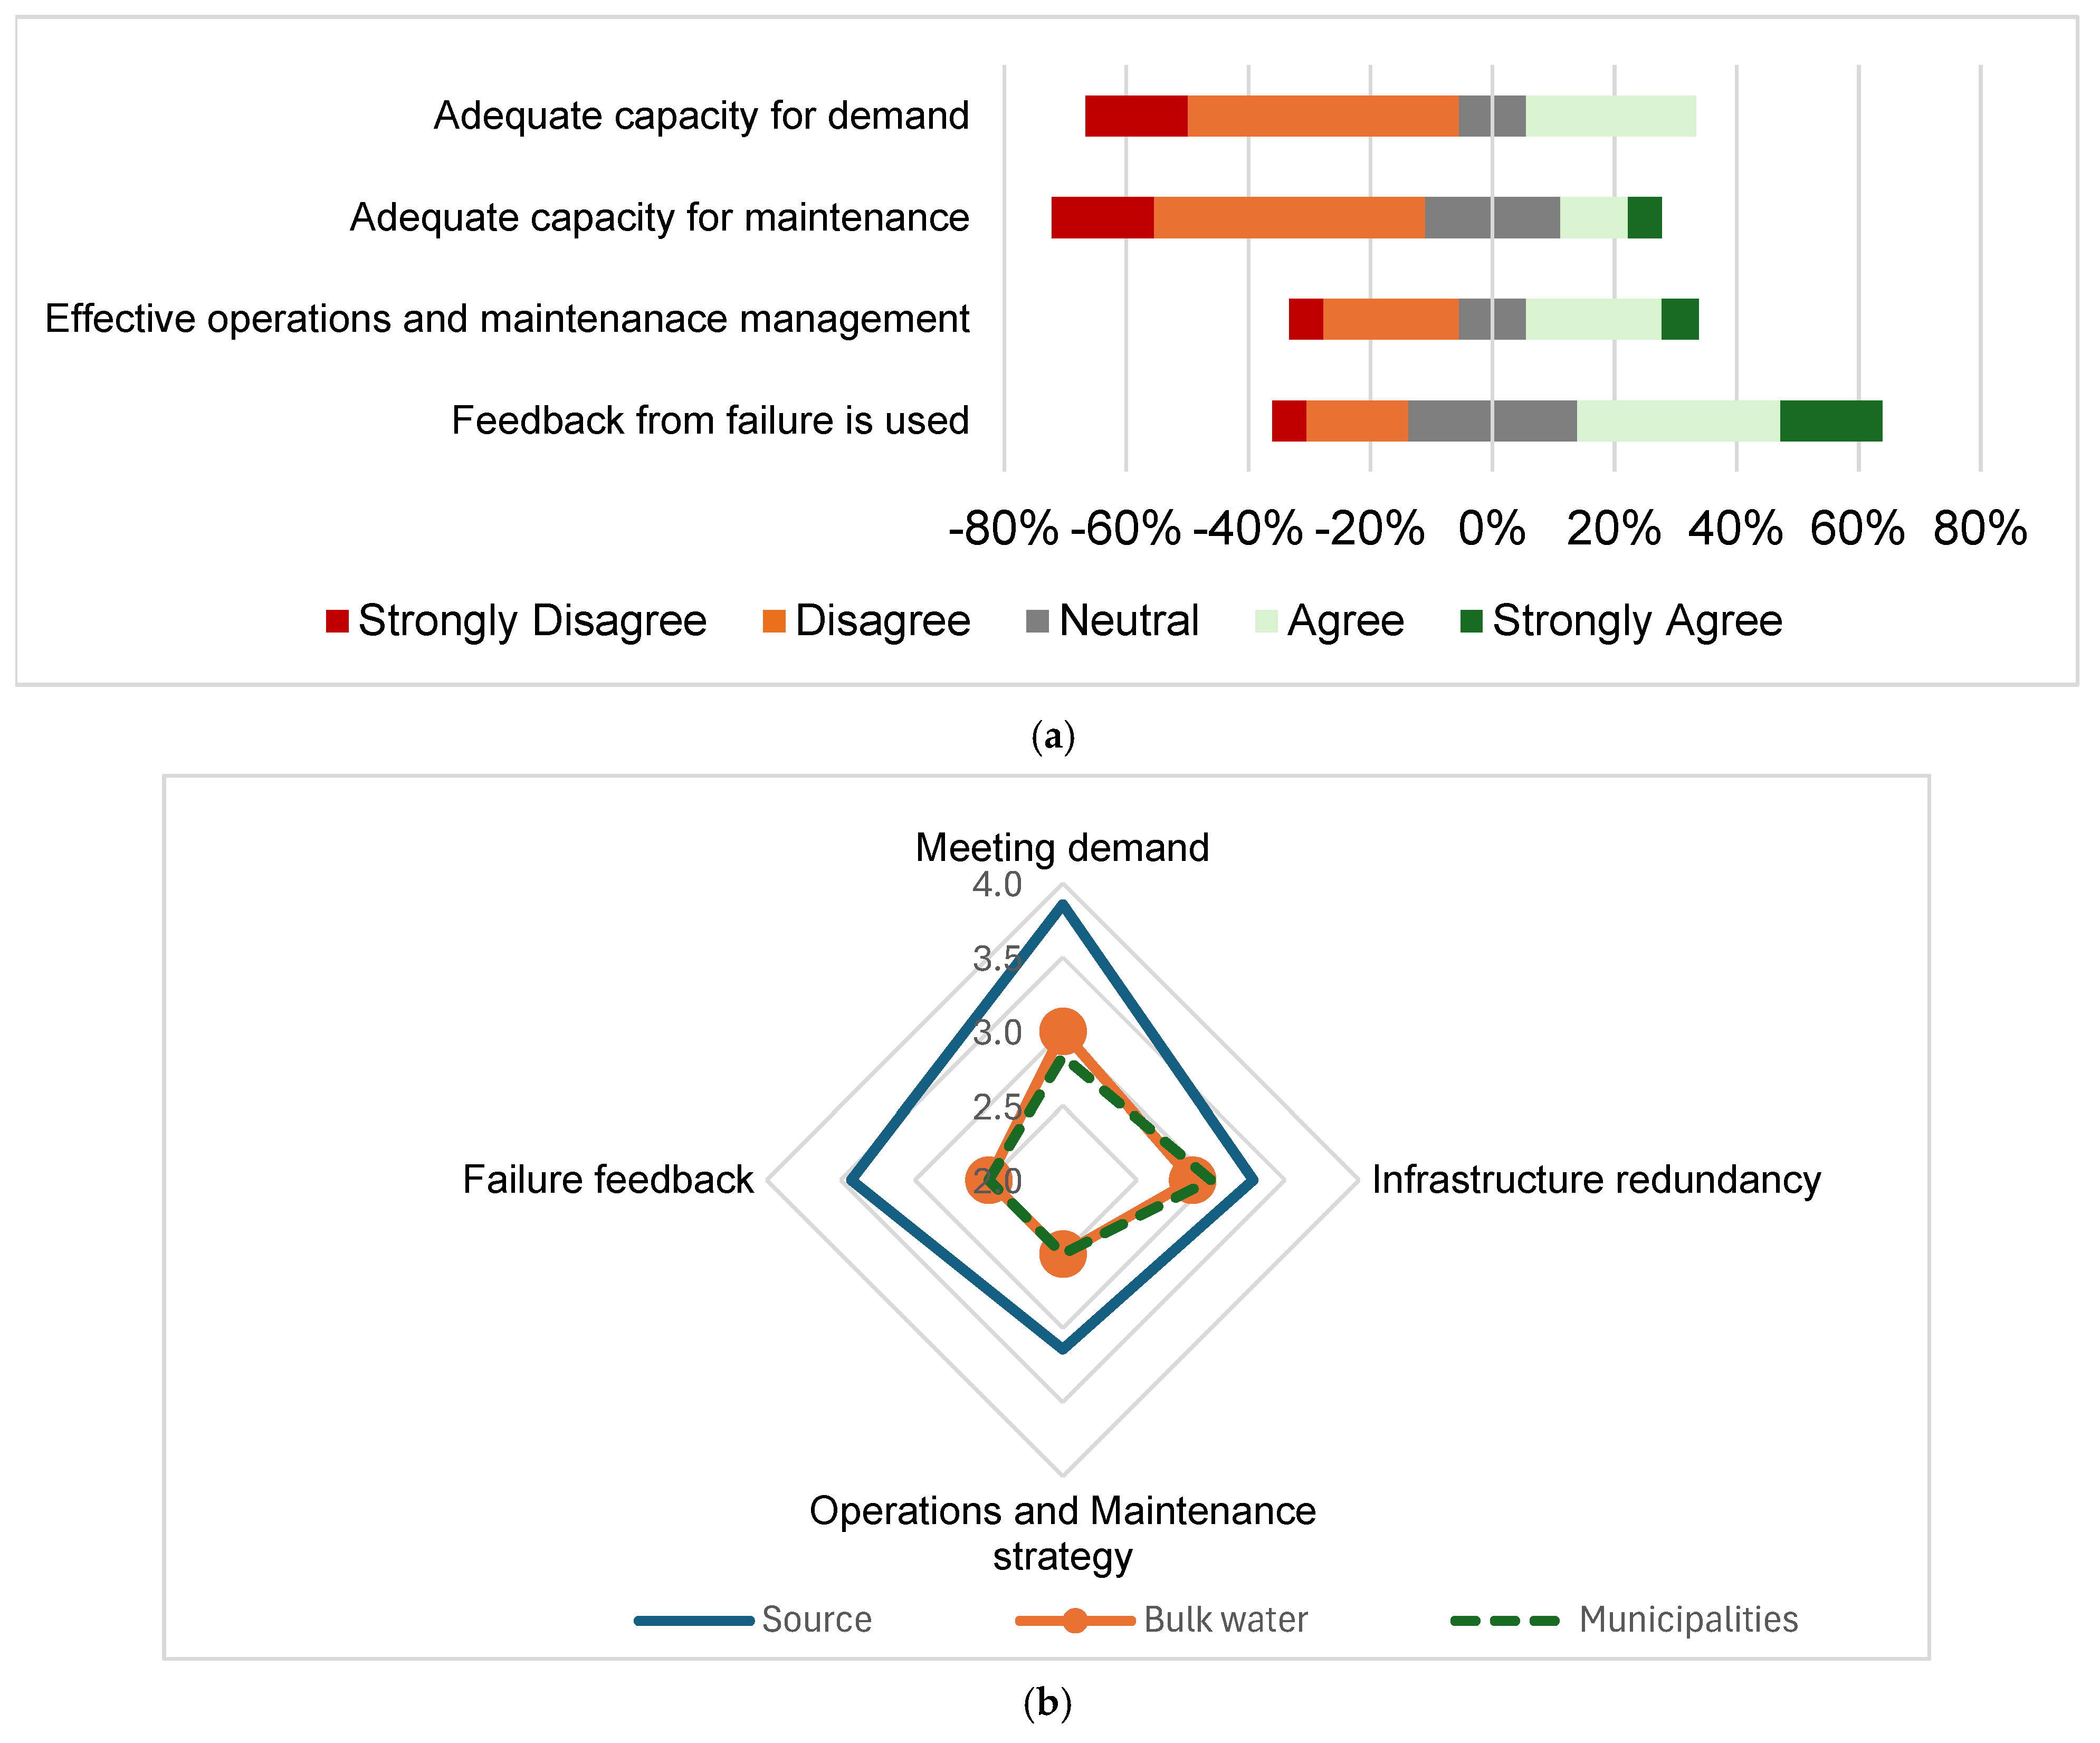
Infrastructure management was measured using answers to asset condition, maintenance capacity, system redundancy, and operational constraints [
9], as shown in
Figure 8a,b. These are stakeholder experiences of day-to-day infrastructure operation and maintenance. The analysis is guided by three critical success factors (CSFs): CSF2 (Lifecycle-Based Approach), CSF5 (Evidence-Based Planning), and CSF6 (Continuous Improvement).
Figure 8a shows broad agreement across institutions in that infrastructure backlogs, limited redundancy, and inability to decommission assets for planned maintenance hinder effective operation. Respondents said ageing infrastructure and capacity constraints make it difficult to maintain service reliability and do proactive asset management. These challenges reflect a weak application of CSF2 where maintenance is reactive and constrained rather than guided by predictive renewal and long-term asset strategies.
Some respondents said lessons from failures inform management decisions, so CSF5 is present, but the persistence of operational issues shows ineffective feedback loops. The gap between planning and implementation also indicates lack of coordination between functions, reducing the strategic value of collected data.
Furthermore,
Figure 8b, which compares perceptions across stakeholder groups, reinforces the gap between planning and implementation. Operations and maintenance personnel have lower confidence in current practices than planning staff. This difference shows that those closest to infrastructure systems see more acute limitations, so operational insights are not fully integrated into institutional decision making, further weakening CSF5.
The same infrastructure challenges appear in both figures, so there is no institutional learning, a key element of CSF6. Despite awareness of these constraints, there is no evidence of change in practices, structures, or resource allocation, indicating that adaptive responses are limited.
Ultimately,
Figure 8a,b show that infrastructure management across institutions is not effective, as CSF2 is weakened by the fact that reactive maintenance prevails over structured lifecycle approaches. And that CSF5 is only partially realised due to data being collected yet not used systematically. Furthermore, CSF6 could be said to be underdeveloped, as repeated challenges are not met with meaningful adaptation. So, despite some planning capacity, infrastructure management is fragmented, constrained, and not positioned to support long-term asset performance [
53].
4.3. Impact of External Factors on Water Infrastructure Planning and Management
The effectiveness of water infrastructure planning and management is influenced not only by internal systems and strategies but also by external pressures such as climate change and technological advancements [
8,
54]. This section looks at institutional readiness and responsiveness to these external factors by looking at the survey results in
Figure 9a,b and
Figure 10a,b. The analysis focuses on three CSFs particularly relevant to external responsiveness: CSF3 (Risk-Based Decision Making), CSF4 (Value-Driven Approach), and CSF6 (Continuous Improvement).
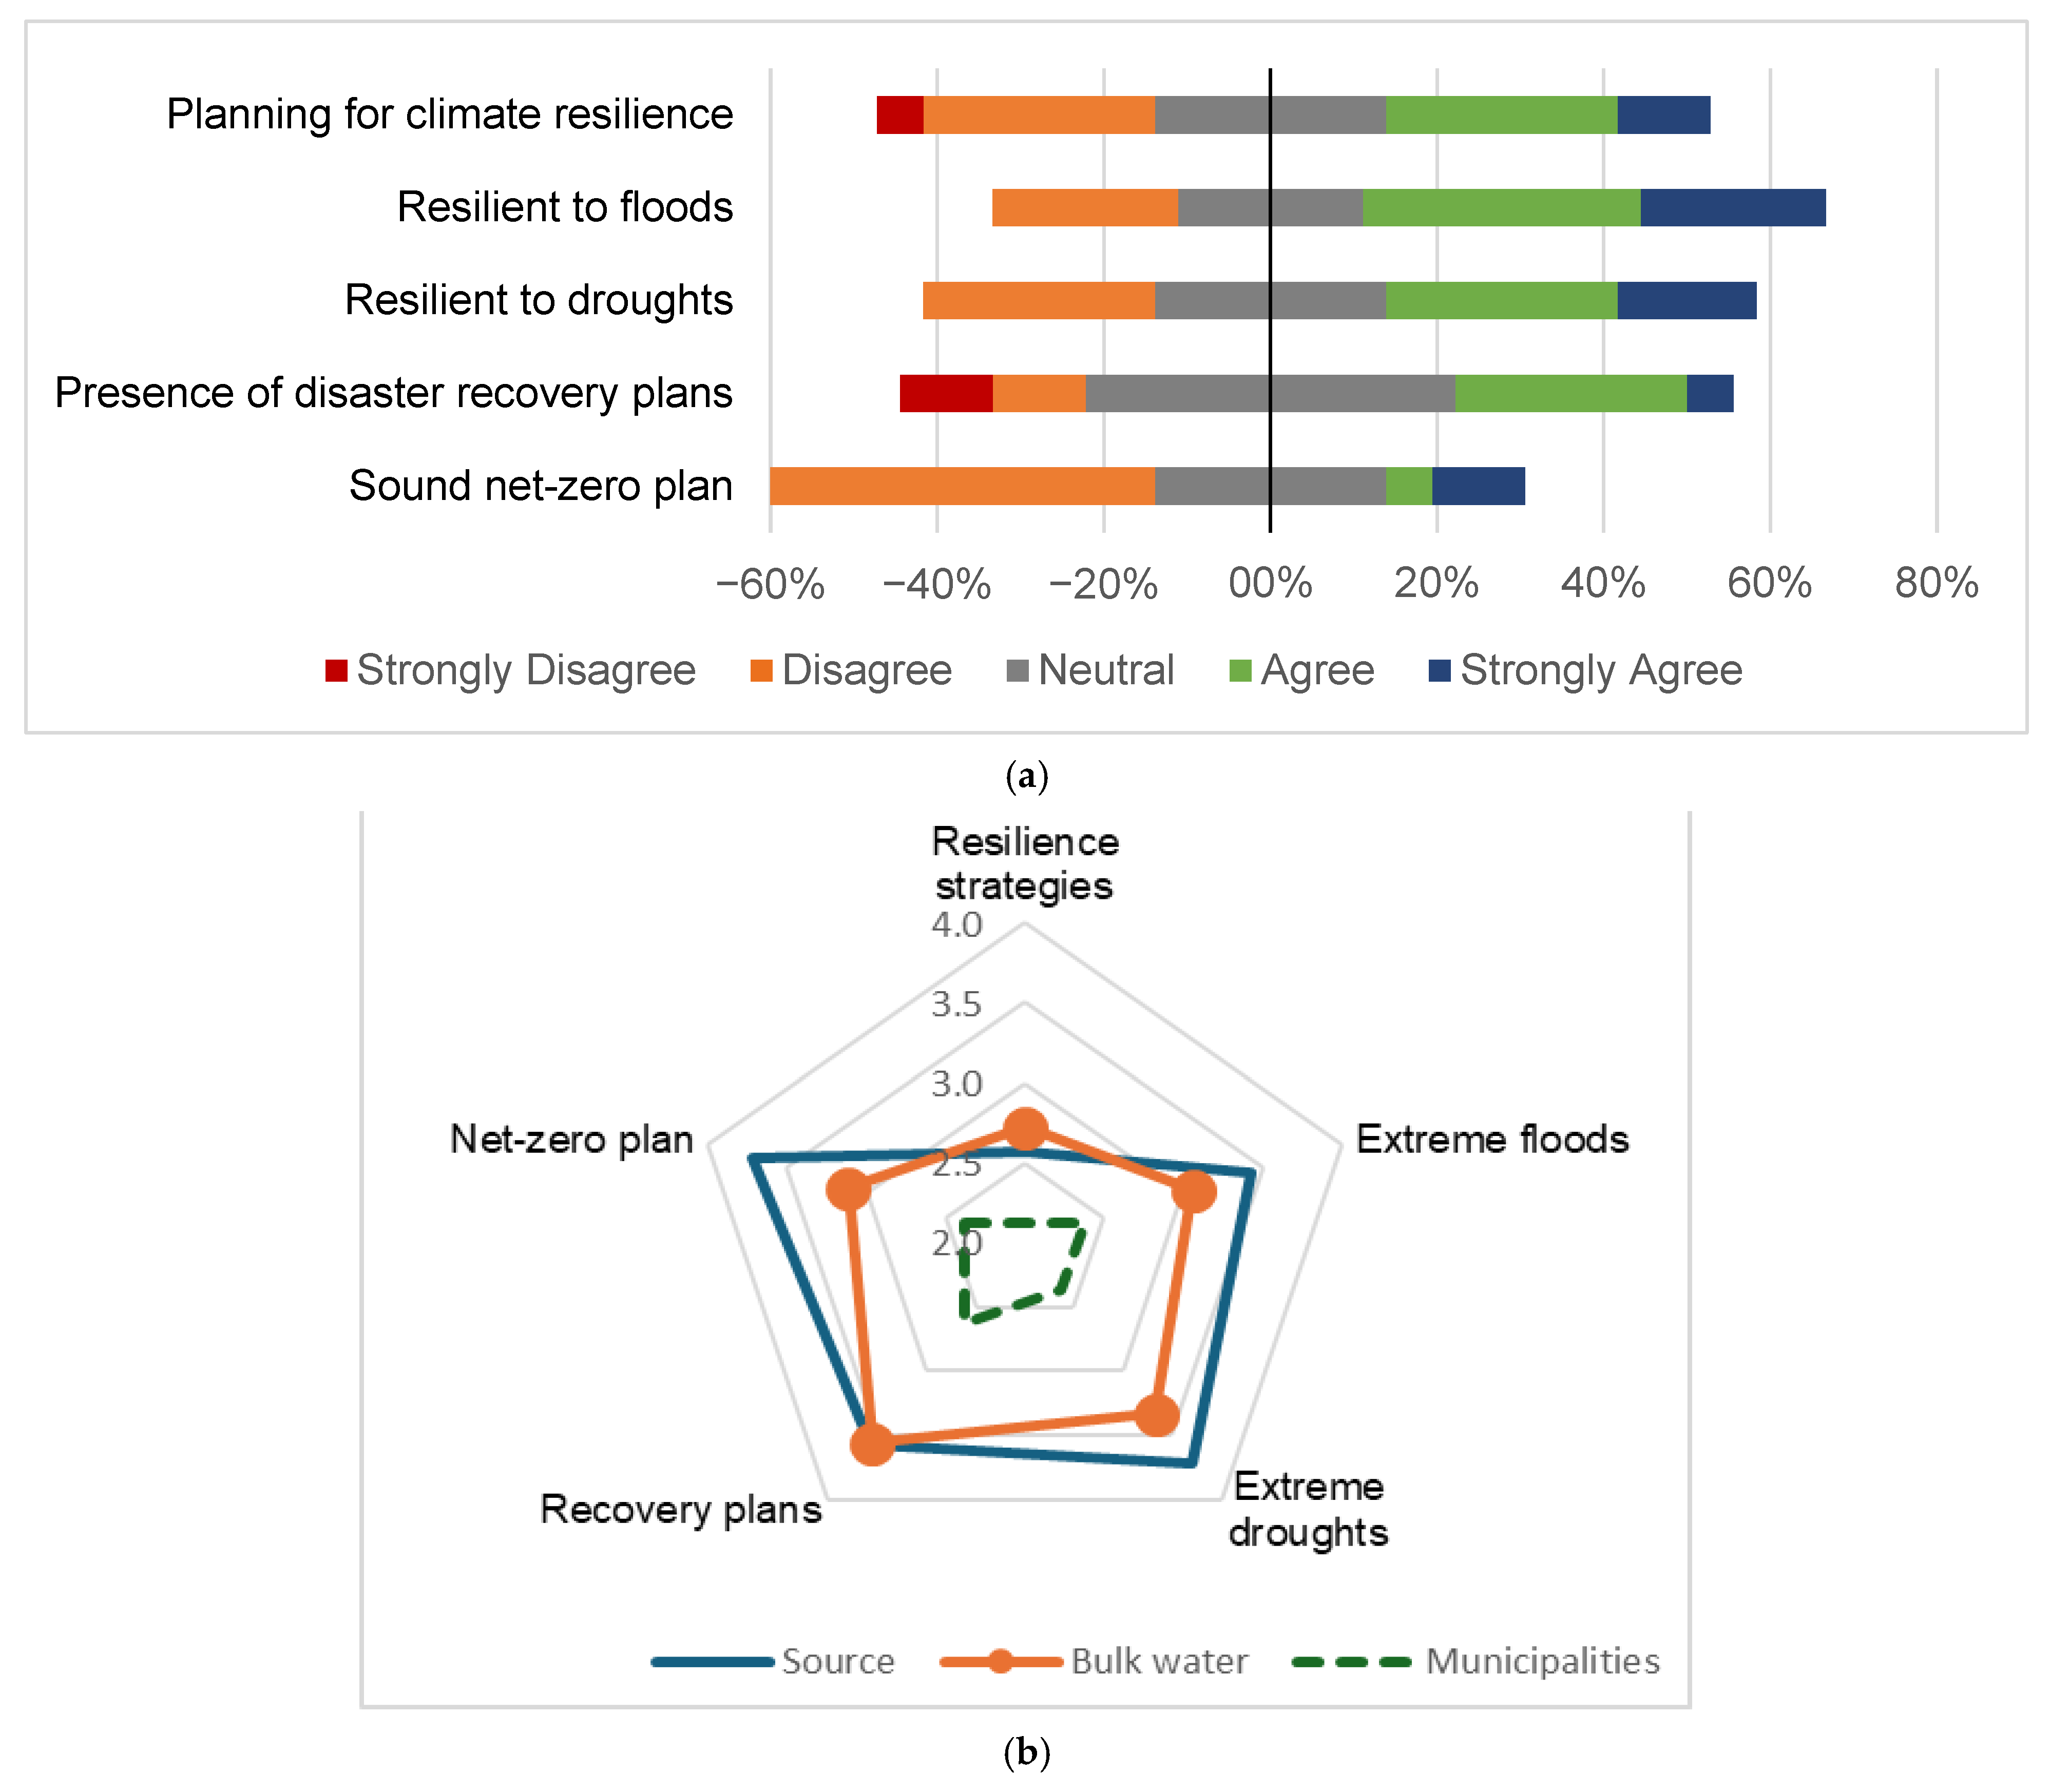
4.3.1. Climate Change Resilience
Climate change brings increasing uncertainty to the water sector, accompanied by heightened risks of droughts, floods, and infrastructure stress [
54]. Survey participants were asked if their institutions had strategies to anticipate and manage these events.
Figure 9a shows that most respondents disagreed that their institutions are prepared for climate extremes. This was particularly true for municipal respondents who are closest to end users and most affected by service level impacts.
It can be seen from
Figure 9b that disaster recovery plans are more common among raw water and bulk water suppliers but are largely lacking at the municipal level. This gap highlights a systemic weakness in Risk-Based Decision Making (CSF3). While some planning for climate impacts does exist, it is inconsistent and limited to specific parts of the water value chain [
13]. Risk assessments are not being integrated into decision-making processes, and institutions are not collectively aligning infrastructure plans with climate resilience objectives.
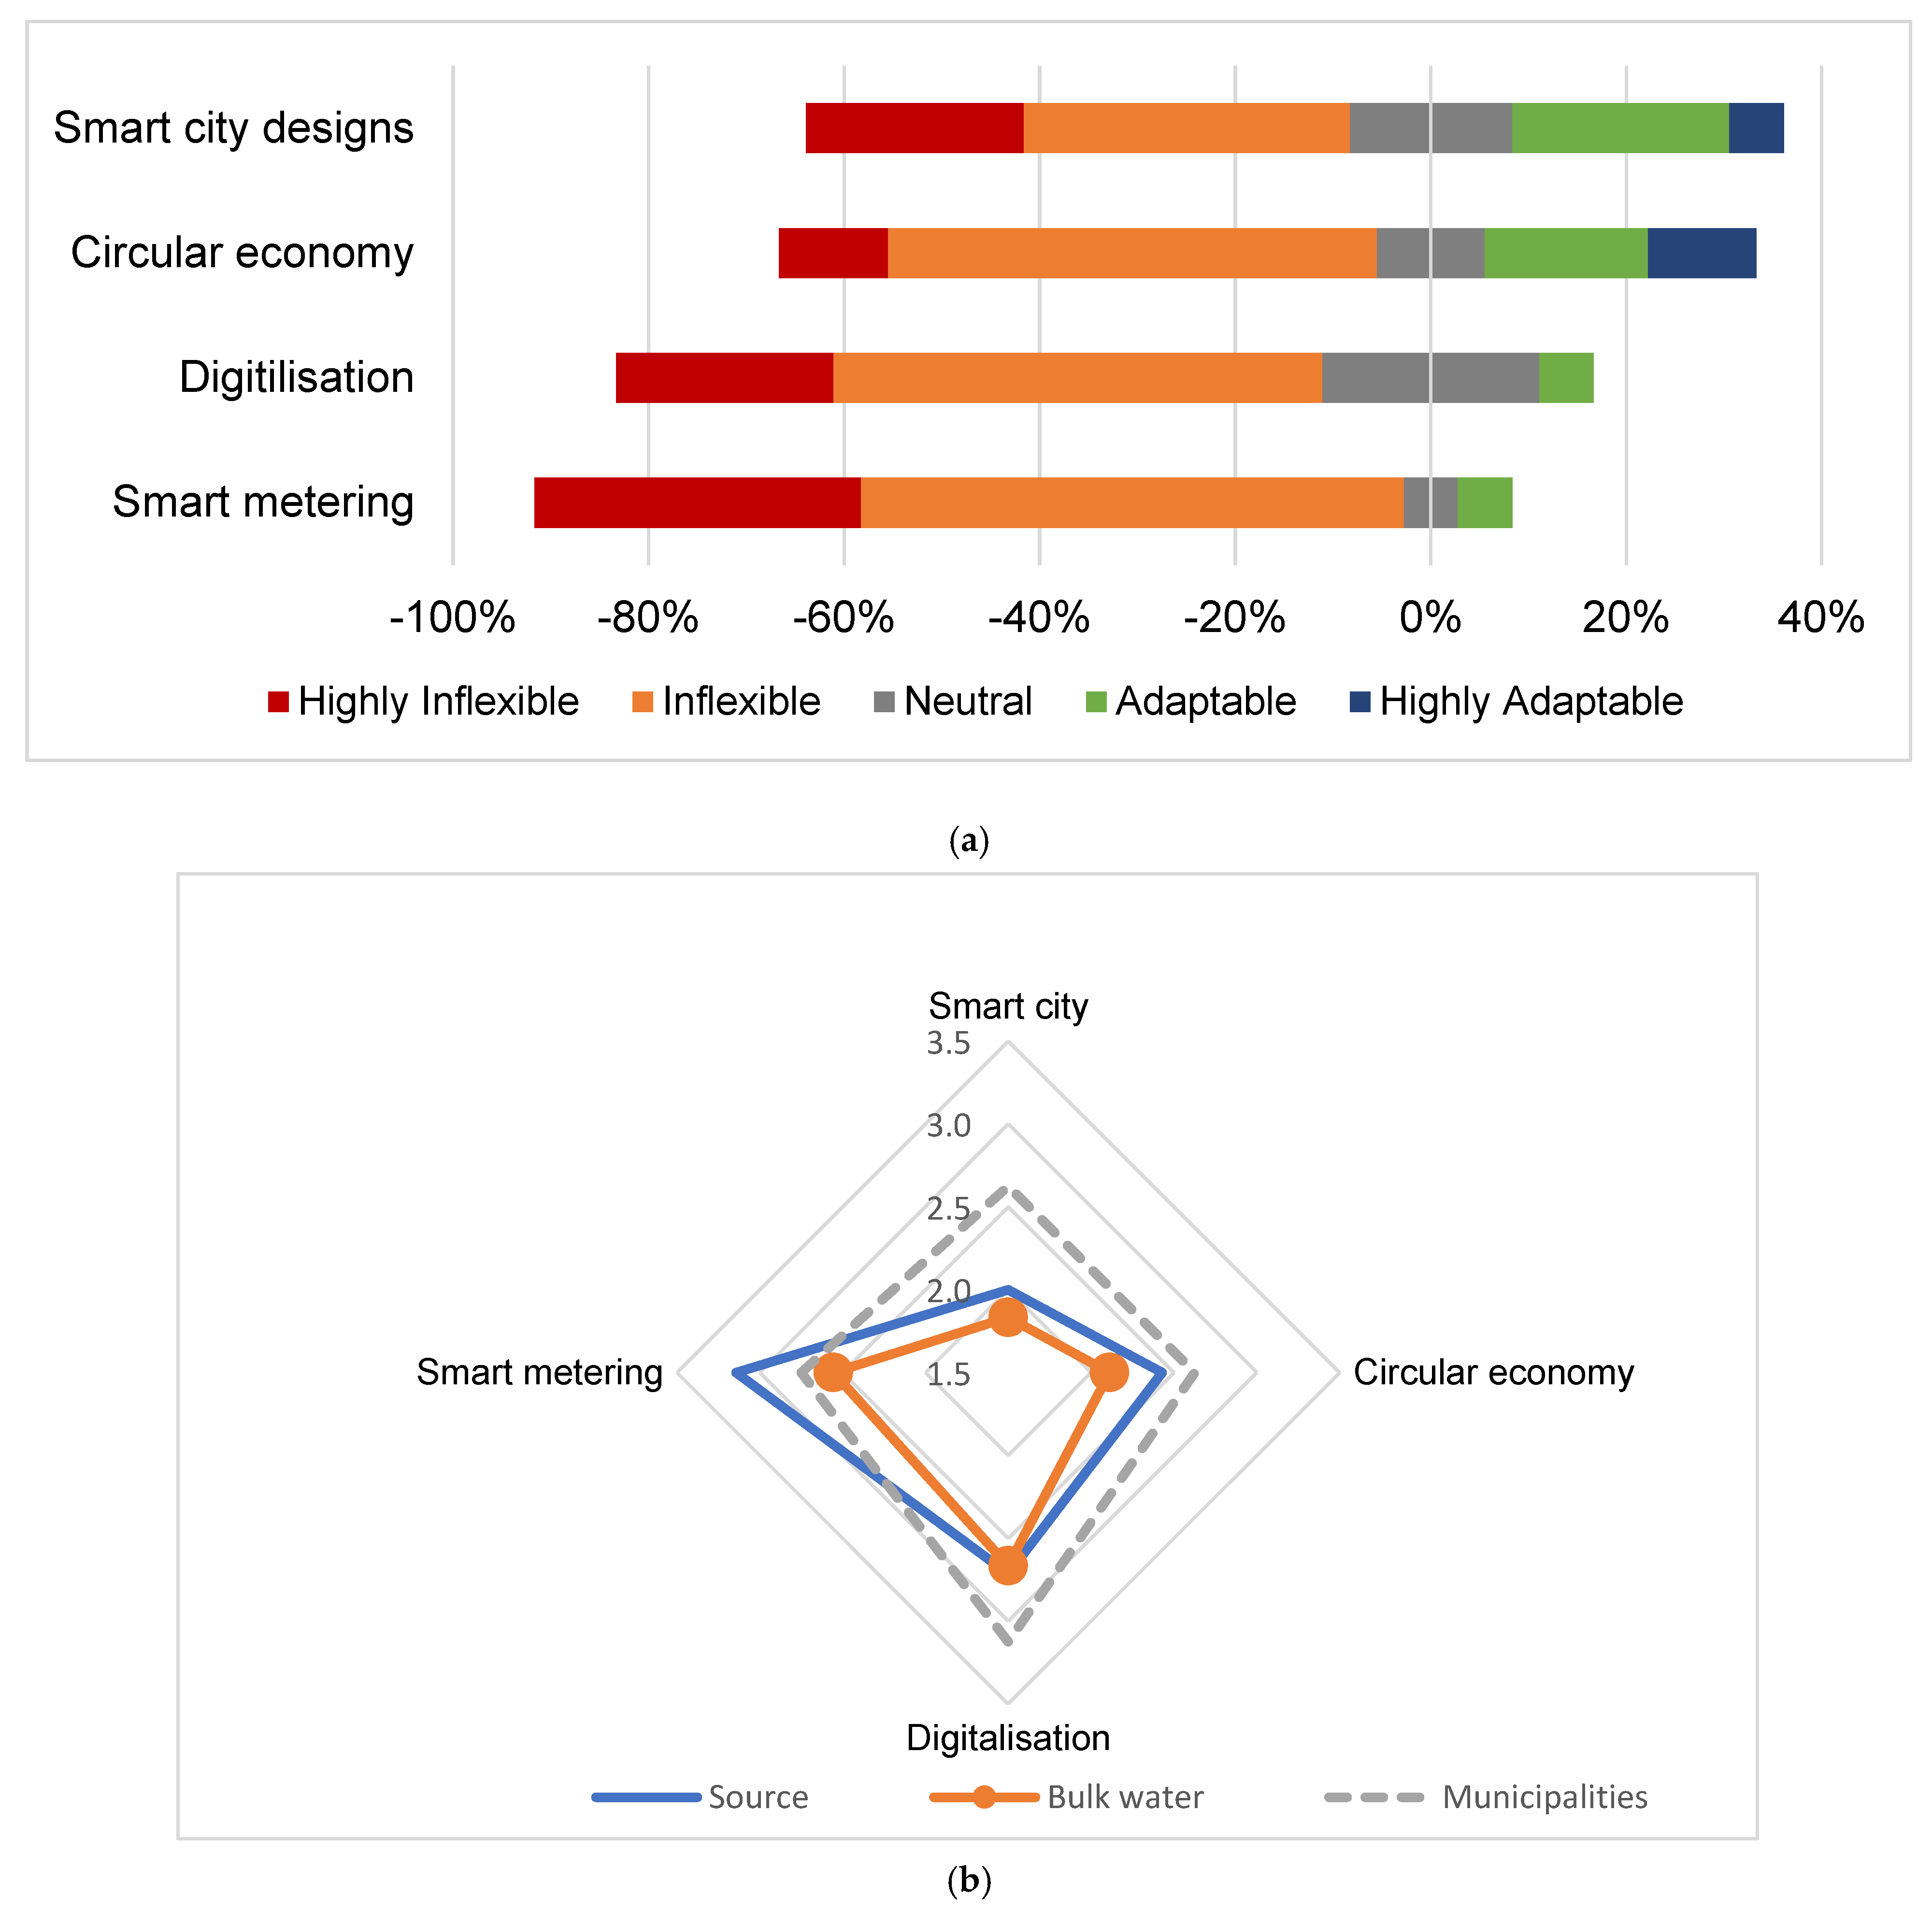
4.3.2. Industry 4.0 Technologies
Institutions were asked about their readiness to incorporate Fourth Industrial Revolution (4IR) technologies such as smart metering, digitalisation, and circular economy principles into their infrastructure planning and management [
55]. These technologies are well known for their potential to improve operational efficiency, reduce costs, and increase long-term value of infrastructure [
56]. However, as shown in
Figure 10a, there is a general sense of disagreement about the ability of existing systems to accommodate these changes. Municipal respondents had the lowest confidence levels, while bulk and raw water institutions had slightly higher levels of readiness.
Figure 10b reinforces this finding, showing that digital and circular economy practices are least developed at the municipal level, where these innovations could yield the most immediate benefits. These results highlight a weakness in the Value-Driven Approach (CSF4). Institutions are not actively pursuing or integrating technologies that could optimise infrastructure performance and sustainability, there is a gap between long term value creation and current priorities.
The incorporation of circular economy and smart city designs are more relevant at the end part of the value chain in Metropolitan Municipalities [
36]. This can also be seen by the responses in
Figure 10b. These questions were, however, included in order to also assess the involvement of the water utility’s influence on its customers regarding the reduction in water usage, and the respondents indicated that they do not agree that enough is being done in this area.
4.4. Decision-Making Trial Evaluation Laboratory (DEMATEL) Analysis
The survey gave insights into stakeholder views and highlighted weaknesses in current planning and management strategies, but it did not show how the underlying critical success factors interact with each other. The analysis showed that some critical success factors like Strategic Alignment, Value-Driven Approach, and Lifecycle-Based Approach are important on their own, but their interdependencies were not visible from perception-based data. So, a more structured analytical method was needed to evaluate the causal relationships among these CSFs to identify the drivers and the reactive ones. To address this gap, DEMATEL was used, as it captures institutional sentiment and reports on effectiveness in a way the survey could not.
DEMATEL is a structured method used to analyse and visualise cause-and-effect relationships among complex factors in a system. DEMATEL helps in understanding how different elements influence each other, which is especially useful in decision making, problem solving, and strategic planning [
56]. Over and above the quantitative data that were collected using the survey questions, we analysed the CSFs that characterise a good asset management plan according to ISO 55000, discussed under the literature review.
Three group interviews representing the water value chain stakeholders were conducted to collect the data, with each interview taking two hours on average.
Table 2 shows the demographics of the participants, and it shows that they have sufficient qualifications and relevant experience.
Figure 11 depicts the influential relation map, which is used to interpret the results. Q.I., for instance, implies greater prominence and stronger correlations.
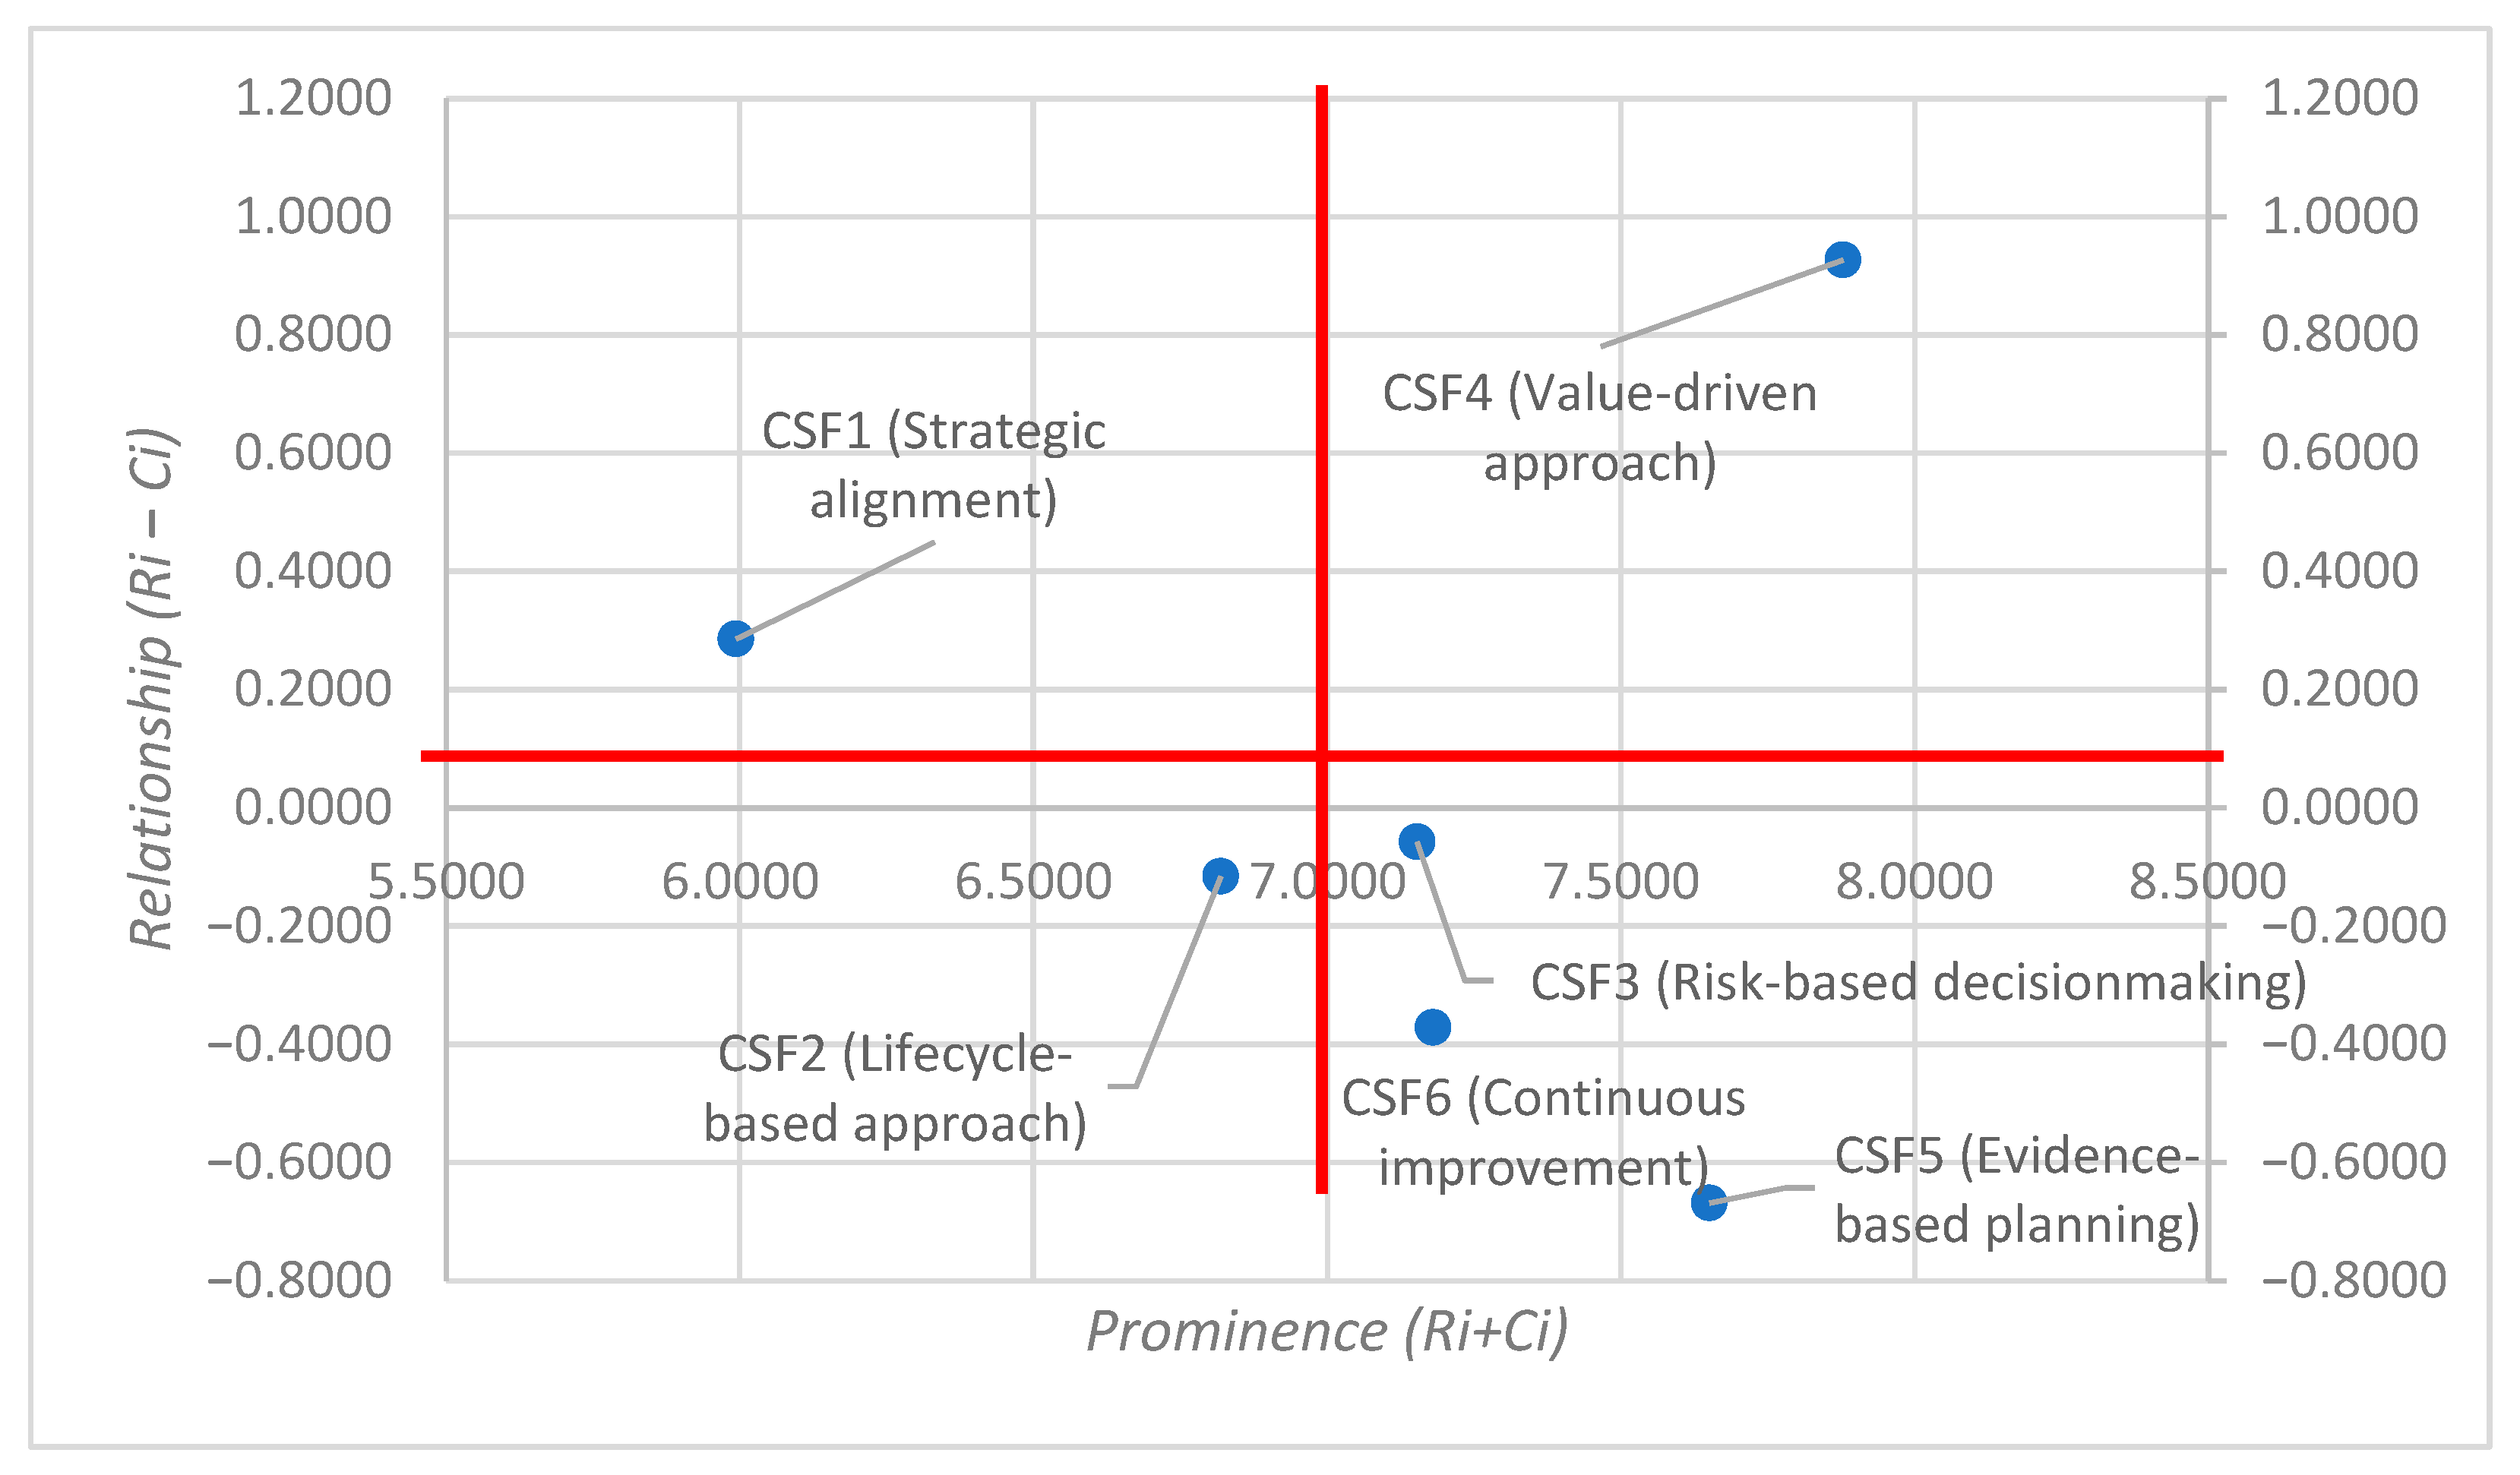
Figure 12 depicts the graphical representation of the six critical success factors and how they relate to each other from a CAUSE–EFFECT viewpoint. It categorises the factors into four quadrants based on average prominence (Ri + Ci = 7.0) and net influence (Ri − Ci = 0.0) (
Figure 12). The analysis looks at the interactions between the factors in each quadrant in the overall system, supported by the total relation matrix.
4.4.1. Central Drivers
Value-Driven Approach (CSF4) is the biggest driver and sits in the top right quadrant with the highest prominence (Ri + Ci ≈ 7.8) and a strong positive relationship (Ri − Ci ≈ +1.0) (
Figure 12). The total relation matrix shows this (
Table 3): C4 has a big impact on all other factors, especially CSF5 (0.8903), CSF6 (0.8124), and CSF3 (0.7683). This widespread impact shows that the Value-Driven Approach is the foundation of how water infrastructure management decisions are framed, prioritised, and measured. CSF4’s impact on CSF5 and CSF6 means that a clear Value-Driven Approach enables data-driven plans and continuous improvement. CSF4 also impacts CSF3, meaning that risk assessment and management reflects the organisation’s value logic. Notice that CSF4 is highly connected to other factors but not influenced by them, as shown by its high net influence score.
Value-Driven Approach’s (CSF4) big impact across the system, especially on planning (CSF5), improvement (CSF6), and risk management (CSF3), explains why respondents who report better project execution, effective integration of new and existing infrastructure, and structured responses to failures tend to operate in value-led environments. While climate resilience and adaptability are mentioned throughout the responses, their consistent integration seems more likely to happen where value framing shapes subsequent planning and risk management practices.
4.4.2. Determinant Factors
Strategic Alignment (CSF1) is in the second quadrant; thus, it is a driver with below-average prominence (Ri + Ci ≈ 6.0) and a small positive net influence (Ri − Ci ≈ +0.28). According to
Figure 12, CSF1 has a consistent influence across multiple factors, but is not the most dominant. It has a significant impact on CSF5 (0.6443), CSF2 (0.5467), and CSF6 (0.5478), but these are substantially lower those of CSF4, as shown in
Table 3. Strategic Alignment shapes the framework for other factors to work in, but it is not dynamic in that while it influences CSF5, CSF2, and CSF6, the relationships are rather weak by comparison to the stronger impact of CSF4.
Strategic Alignment is associated with practices such as long-term planning, the integration of new and existing infrastructure, and internal stakeholders such as operations and maintenance teams being involved in the planning process. But the weak dynamic impact of CSF1 explains why these practices tend to exist at a policy level rather than being fully institutionalised. This also explains why respondents said that while planning frameworks are adaptable in theory, they do not drive innovation or integration with modern technology in practice. So, there is some alignment that sets broad objectives but no robust feedback mechanisms for adaptation.
4.4.3. Independent Factors
Lifecycle-Based Approach (CSF2) is in the third quadrant, has low prominence, and negative net influence. This means it is reactive and under-integrated into the system, as shown in
Figure 12. Although it gets strong influence from CSF4, CSF3, CSF5, and CSF6, its influence is limited. For example, CSF2 gets strong influence from CSF4 (0.7426) but has limited impact on other factors beyond CSF5 (0,6608), as seen in
Table 3. Even though CSF2 is not a major strategic driver on its own, it is a critical enabler of Evidence-Based Planning (CSF5). This is why lifecycle practices (CSF2) such as integrating rehabilitation with new projects, consulting O&M teams, and using failure analysis to inform planning and maintenance are reported as present but not central to strategic initiatives. Respondents may do these practices reactively or in isolation rather than having them drive overall organisational strategies.
4.4.4. Impact Factors
Risk-Based Decision Making (CSF3), Evidence-Based Planning (CSF5), and Continuous Improvement (SFC6) are in the fourth quadrant, with high prominence but negative or neutral net influence (see
Figure 12). While these are key mechanisms for execution, their strategic importance is largely driven by upstream factors rather than their own internal logic. The matrix shows CSF3 is heavily influenced by CSF4 (0.7683), CSF5 (0.6932), and CSF6 (0.6895), effectively connecting value and risk (see
Table 3). CSF3 also impacts CSF2 (0.6277), so it is a mediator in lifecycle decisions. On the other hand, CSF5 is the most influenced factor, driven by CSF4 (0.8903), CSF3 (0.6932), and CSF6 (0.7191). It takes in from strategy, risk, and improvement and feeds back into C6, so it is the link between planning and continuous improvement.
Overall, the dynamics between CSF3 and CSF5 show that effective operations need clear direction from higher levels of the organisation. This is why respondents indicated that investigations into infrastructure failures, risk resilience, and structured planning processes are carried out even though these do not seem to drive autonomous change. Risk and Evidence-Based Planning are indeed happening, but their effectiveness depends on the clarity and strength of the upstream inputs such as Value-Driven Approach (CSF4) and Strategy Alignment (CSF1). This matches the feedback that planning and risk practices are reactive and data informed rather than proactive and directive. Similarly, feedback on O&M strategies’ effectiveness and adaptability to modernisation shows that while Continuous Improvement (CSF6) is present, it is not systemically embedded and therefore underperforms in driving change.
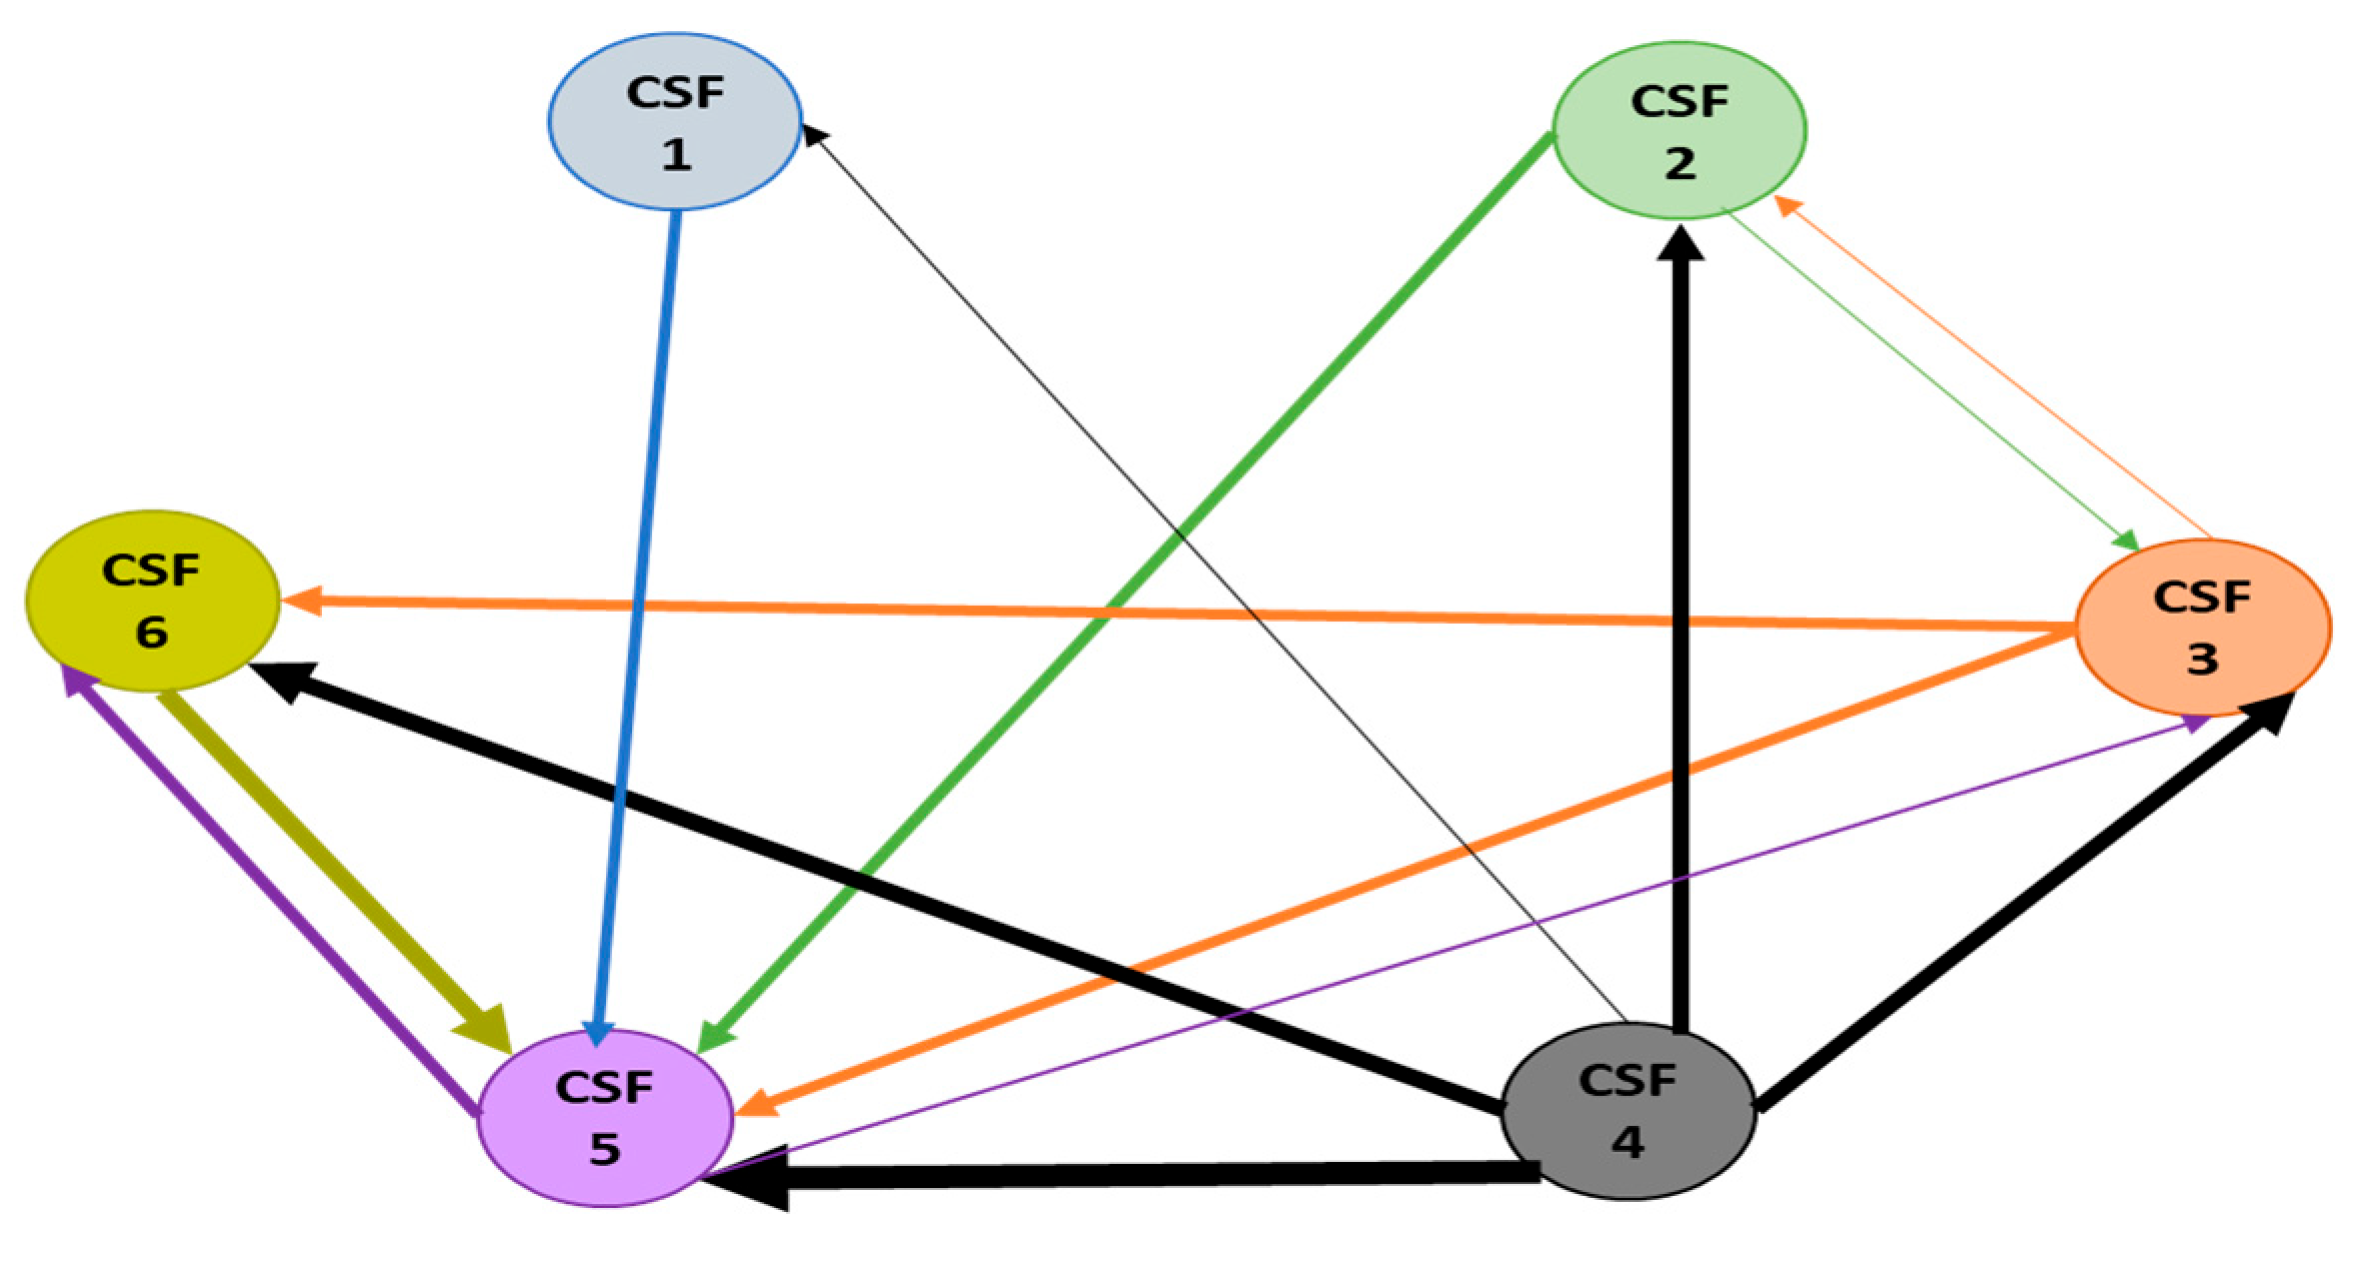
The threshold α value (0.5927) ensures the validity and meaningful results in DEMATEL by normalising the influence values and thus determines the key causal relationships among the CSFs. As shown in
Table 3, the figures highlighted in bold illustrate the meaningful influence of the CSFs on each other, and this is further visualised by the Influence Relation Map (IRM) in
Figure 13. The varying thickness of the arrows in
Figure 13 reflects the strength of influence between factors, with thicker arrows indicating stronger interactions.
Based on survey response patterns, threshold-based DEMATEL relationships (
Figure 13) and system dynamics, the current framework is limited by over-reliance on upstream drivers, weak operational integration, and disjointed risk and planning execution. While some planning elements are in place, they are not reinforced by operational practices, nor are they sufficiently adaptable to emerging needs such as climate resilience and digital innovation. The lack of systemic integration, feedback mechanisms, and alignment between strategy and execution makes it difficult for the framework to support consistent performance across organisations.
4.5. Stakeholder Management
Stakeholder management was looked at through the lens of the Bulk Water Utility, according to the water value chain. This is because the Bulk Water Utility bears the responsibility of abstracting raw water from the dams, bulk water treatment, and supply of potable water to the Metropolitan Municipalities, mines, and industrial customers. The Bulk Water Utility happens to be in the middle and forms a critical link in the water value chain. The Bulk Water Utility further provides an inbound and outbound stakeholder perspective by virtue of being in the middle of the water value chain [
57]. Stakeholder management was identified as one of the key critical success factors in the planning and management of water infrastructure during the Pareto analysis of the systematic literature review.
Data were collected, focusing first on identifying key stakeholders and their interests. Furthermore, respondents were asked to rank the stakeholders’ influence and impact on the water infrastructure planning and management. The data collected were then analysed to map out the social network relationships among the stakeholders.
Table 4 shows a list of all the identified stakeholders according to the internal or external relationship as well as their presumed interests. Five internal stakeholders and four external ones were identified by the respondents as well as their presumed interest in water infrastructure planning and management. It is key to assess stakeholders in terms of their interests, influence, and how they are impacted by water infrastructure planning and management. Presumed interests refer to client, economic, policy, environmental planning, and management aspects [
58]. Influence refers to the extent to which stakeholders’ actions, interests, or power dynamics can shape organisational decisions, tactics, or results and, in this case, the level at which the planning and management process is influenced. Impact describes how an organisation’s actions affect the expectations, interests, and well-being of its stakeholders; in this case, it refers to the level at which the stakeholder is impacted by the infrastructure planning and management activities [
58].
Internal stakeholders’ interests are mainly to enable the day-to-day operations of the business as well as its infrastructure planning aspect. The Engineering division is responsible for infrastructure planning and consults internal stakeholders such as operations for inputs and status of current infrastructure. The Finance division is consulted for financial planning and project financing, whilst the Legal division is responsible for making sure that all laws and legal statutes of the country are adhered to regarding project execution, as well as compliance during daily operations of the business.
It is key to note that the external stakeholders are comprised of government-owned establishments, such as the Metropolitan Municipalities and the Department of Water and Sanitation (DWS), as well as the privately owned establishments such as the mines and industries. Any potential bias from the responses of government institutions versus private institutions is mitigated by the fact the fact that all these institutions, with the exception of the DWS, are customers of the water utility and therefore have the same interests, namely client and economic interests, as shown in
Table 4. The interests of the DWS are multiple-fold, namely the supply of raw water to the Bulk Water Utility, sole shareholdership of the Bulk Water Utility, development of policy as well as regulation and enforcement of legislation.
The Metropolitan Municipalities, mines, and industries are the main customers and are therefore key external stakeholders of the Bulk Water Utility for its financial sustainability and their interests are purely economic. Service providers and suppliers were identified as the last key stakeholders, and their interests are also economic.
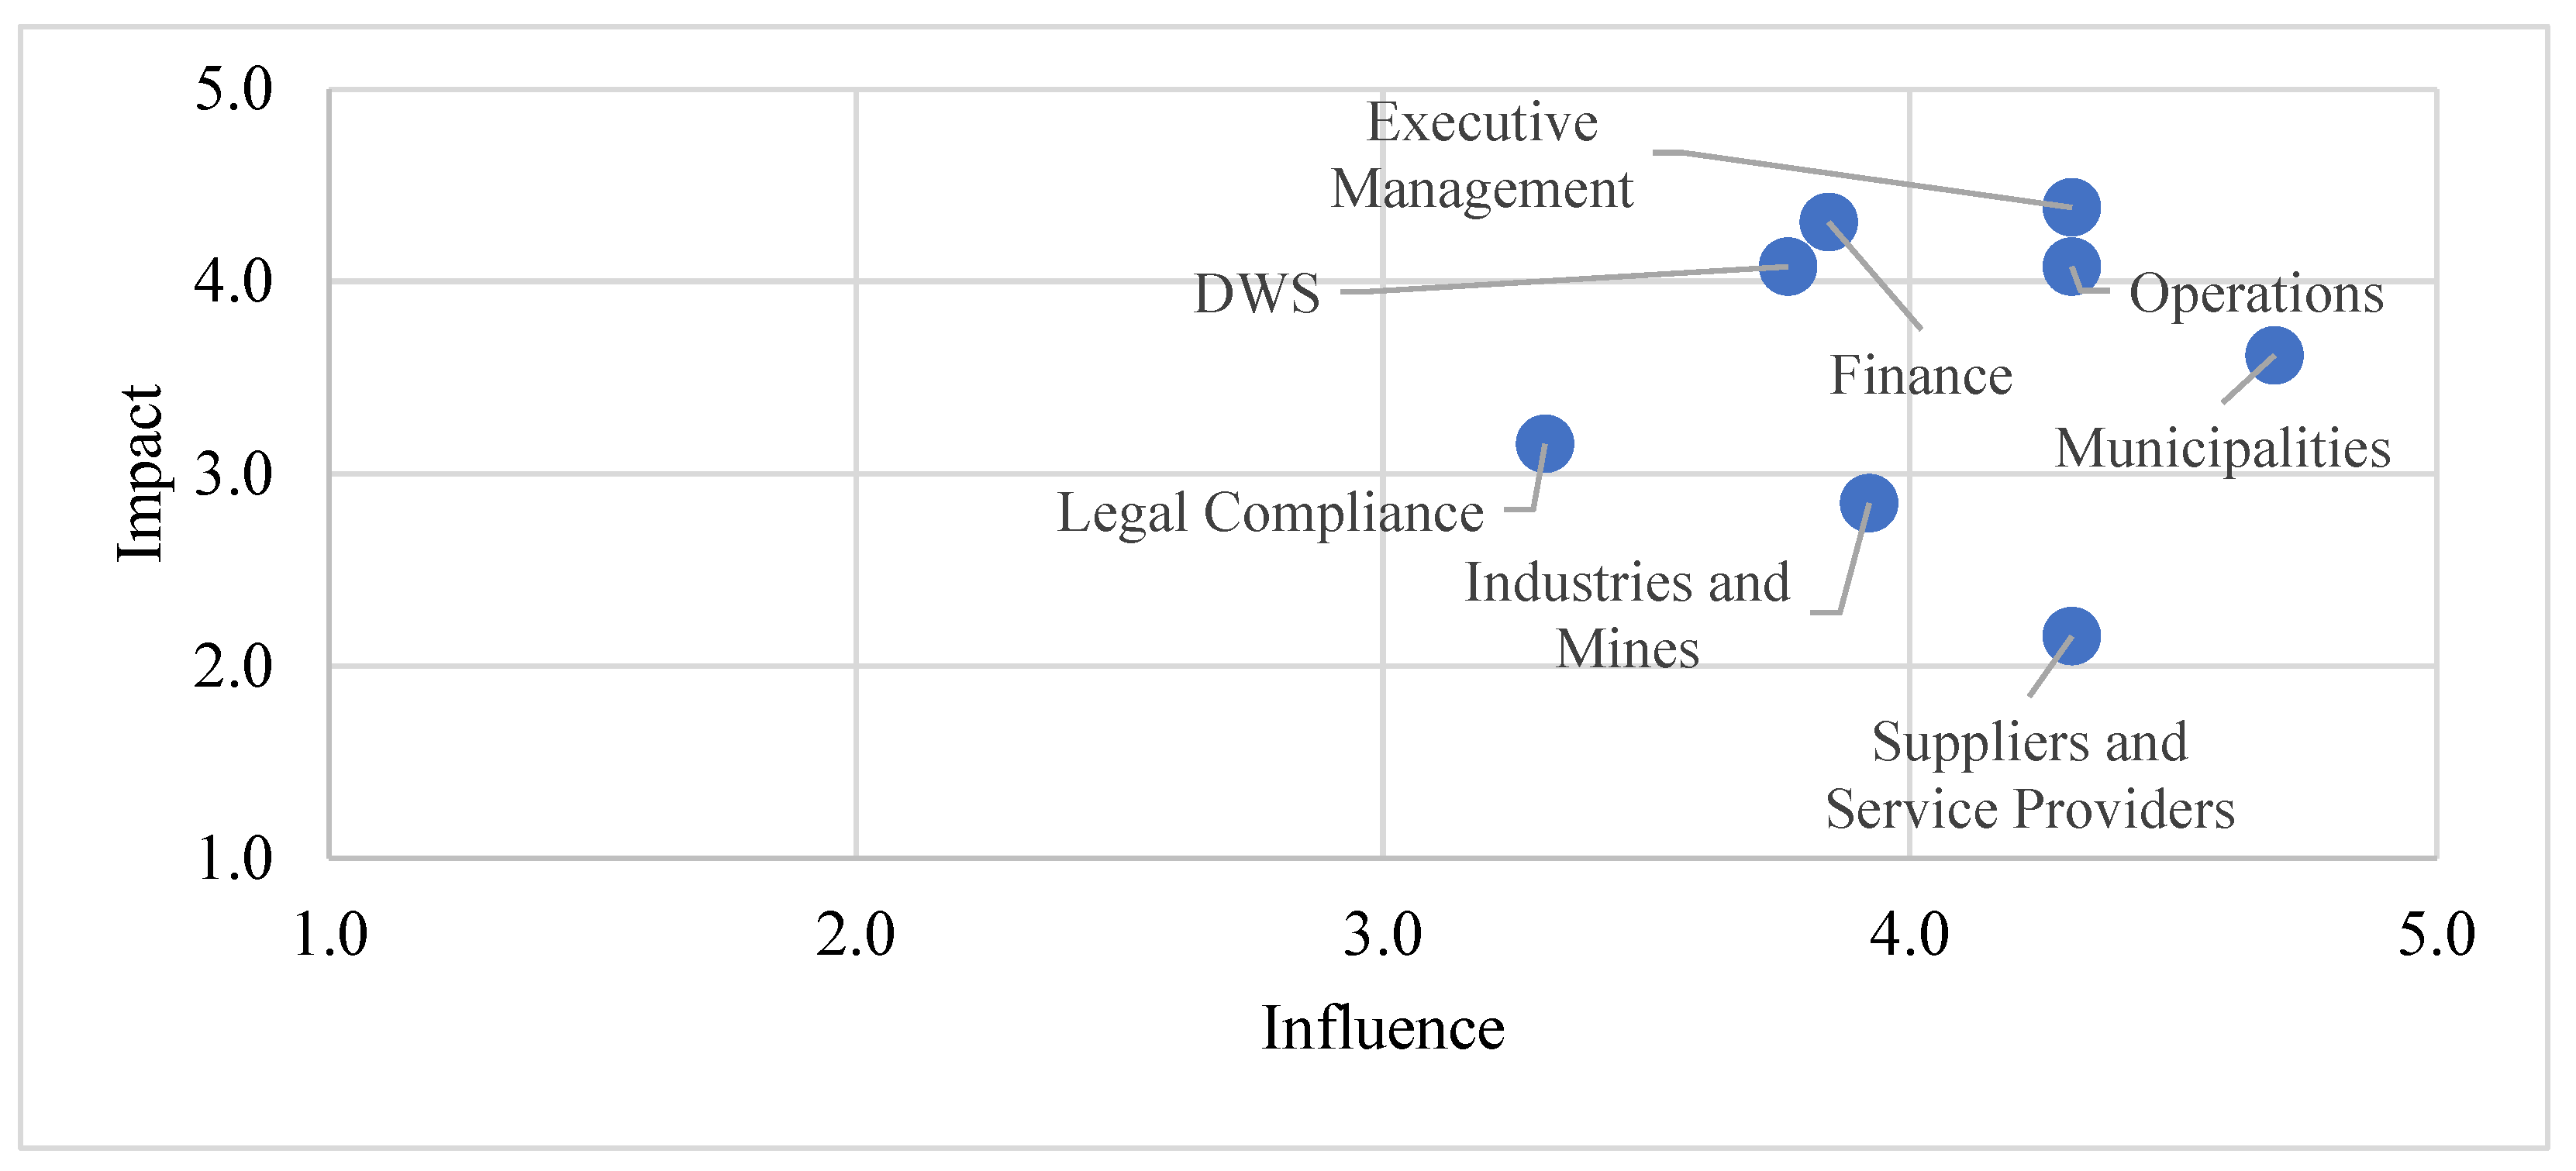
Figure 14 depicts the stakeholder relationships that the bulk water supplier has with its internal and external stakeholders.
Looking at the internal stakeholders, the Executive Manager is the one that has the most influence on the infrastructure planning, and they are also the most impacted in that they provide company direction and any poor performance is a reflection of their ability to lead. The second highest internal stakeholder in terms of influence and impact is operations. Their high influence is because they provide direct input to infrastructure planning in terms of existing infrastructure’s health and performance. Operations are also highly impacted by infrastructure planning in that they are responsible for day-to-day water supply.
Looking further at
Figure 14, it can be seen that the DWS is the external stakeholder that has the most influence as well as is most impacted by infrastructure planning. The DWS’s high influence emanates from the fact that they are the sole shareholder of the Bulk Water Utility and that they would be highly impacted if the infrastructure planning is ineffective because they are ultimately accountable to the government regarding all water-related matters. The second-highest influential stakeholders are the Metropolitan Municipalities who represent the largest customer base of the utility, and they are also highly impacted by the infrastructure planning of the bulk water supplier.
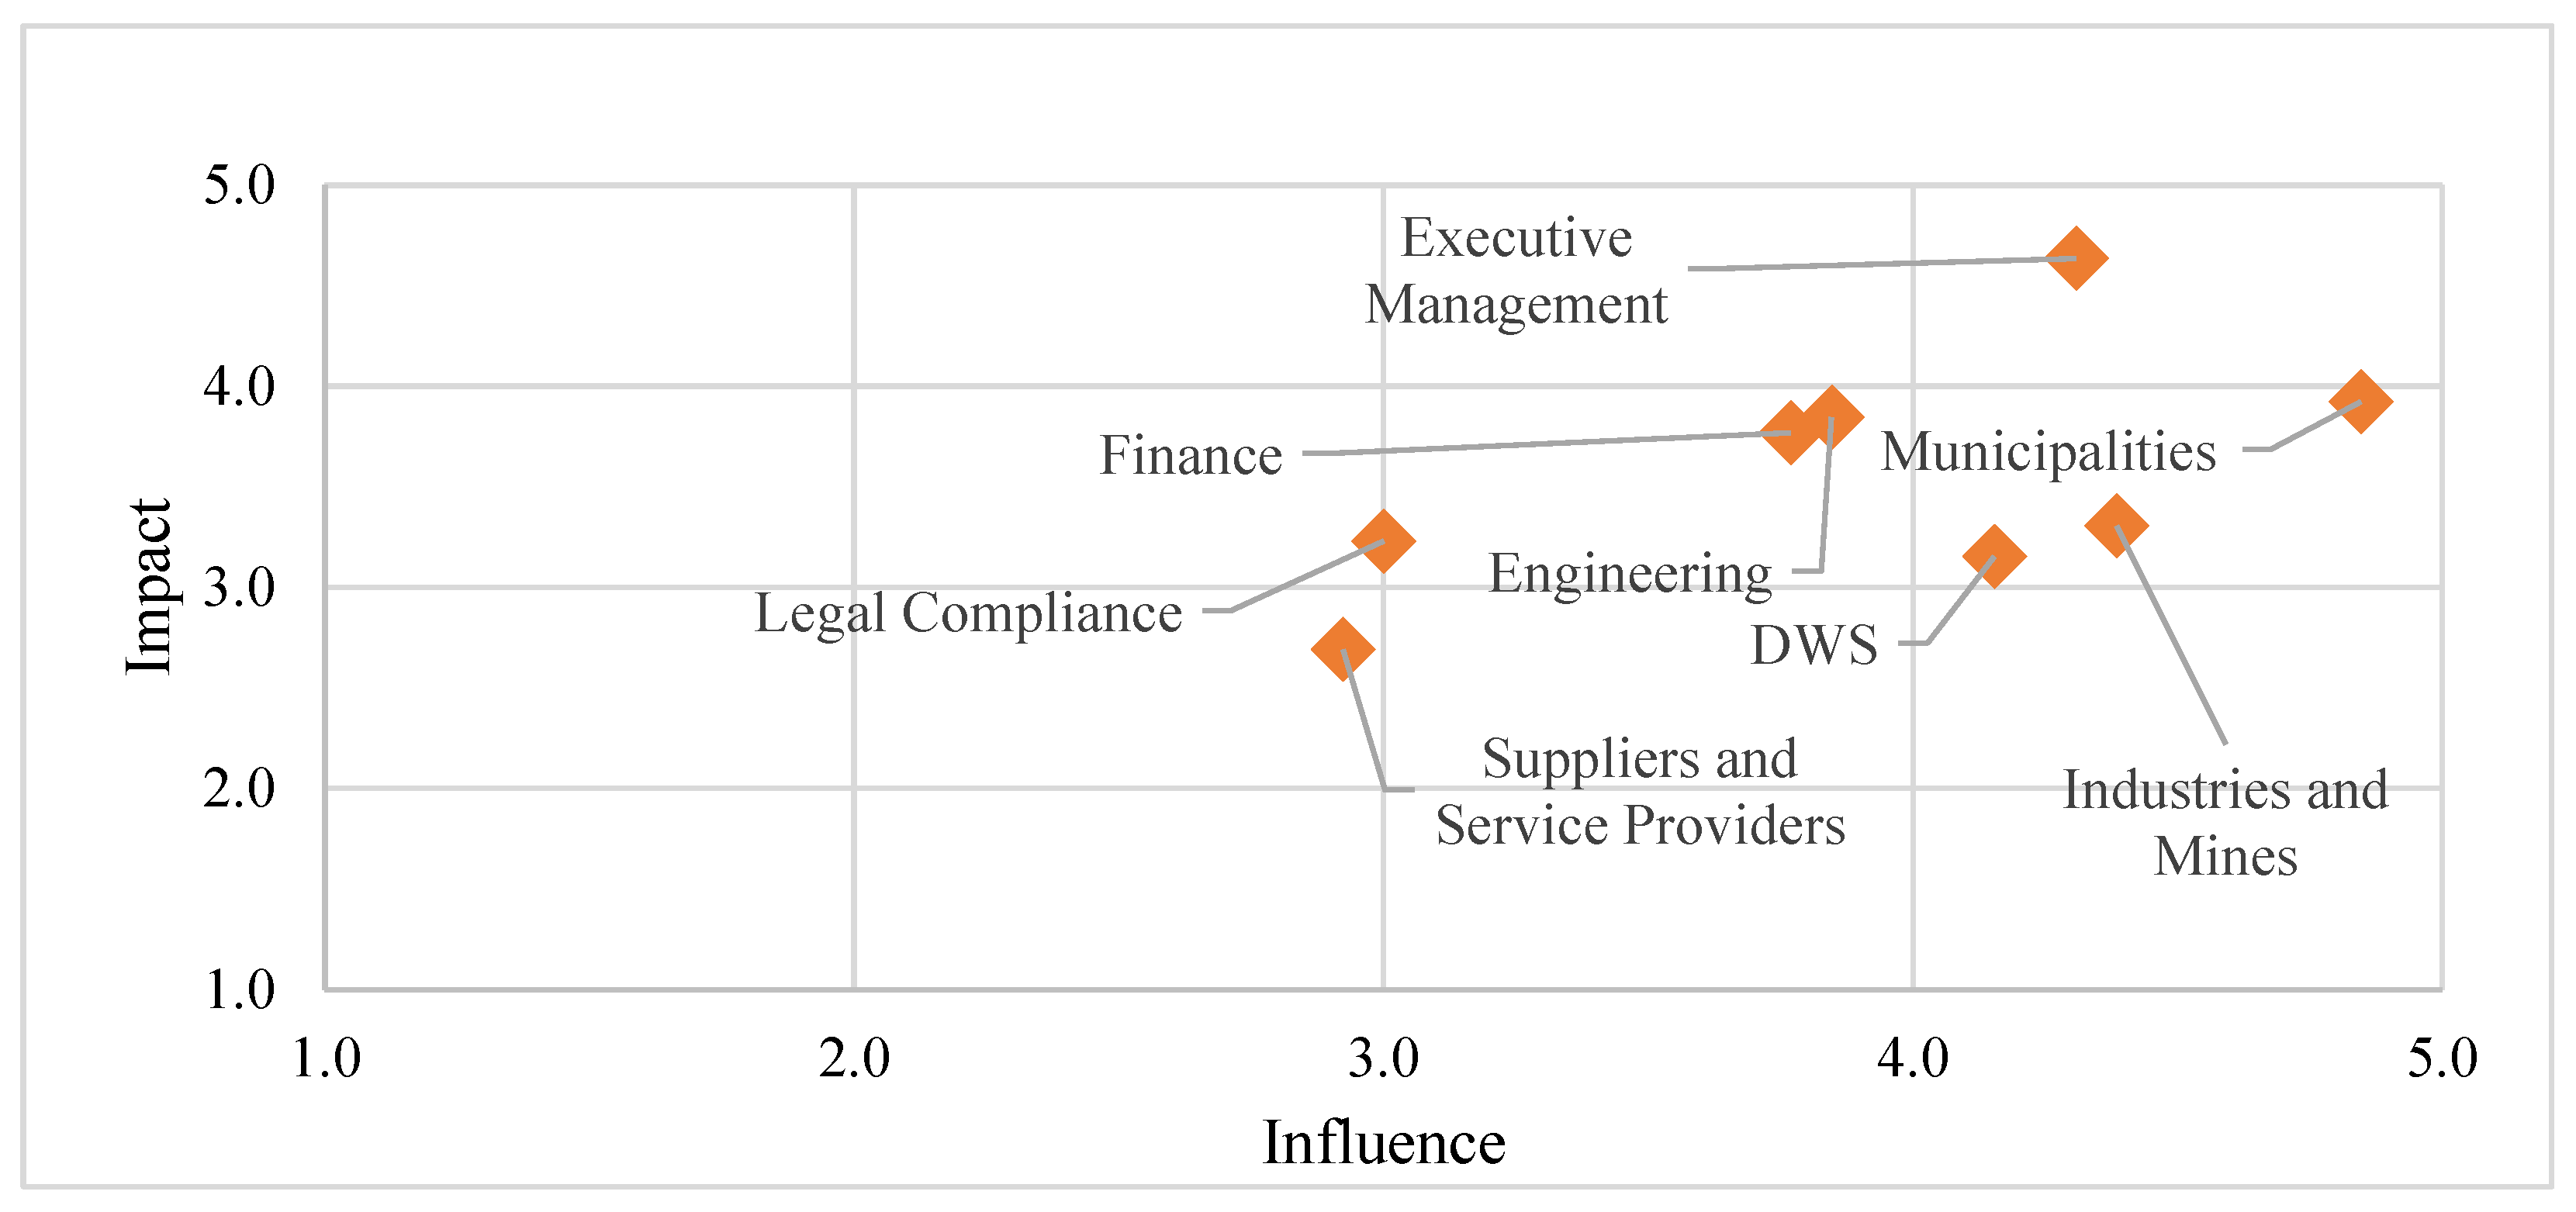
Figure 15 shows the stakeholder relationships of the bulk water supplier in relation to infrastructure management, also referred to as operations and maintenance. Looking at internal stakeholders, it can be seen that executive management once again has the highest influence and is also highly impacted by the operations and maintenance activities of the bulk water supplier. Finance and Engineering have the second-highest influence and are also highly impacted internally.
Looking at external stakeholders, Metropolitan Municipalities have the highest influence on the day-to-day operations of the Bulk Water Utility, and this is because the infrastructures of the two institutions are intertwined. Furthermore, Metropolitan Municipalities are highly impacted by the operations and maintenance activities of the bulk water supply because ineffective management of the bulk water supplier’s infrastructure management can lead to water supply interruptions. Industries and mines have the second highest influence and are the second-highest impacted external stakeholders because just like the Metropolitan Municipalities, they are customers of the bulk water supplier, albeit much smaller in size.
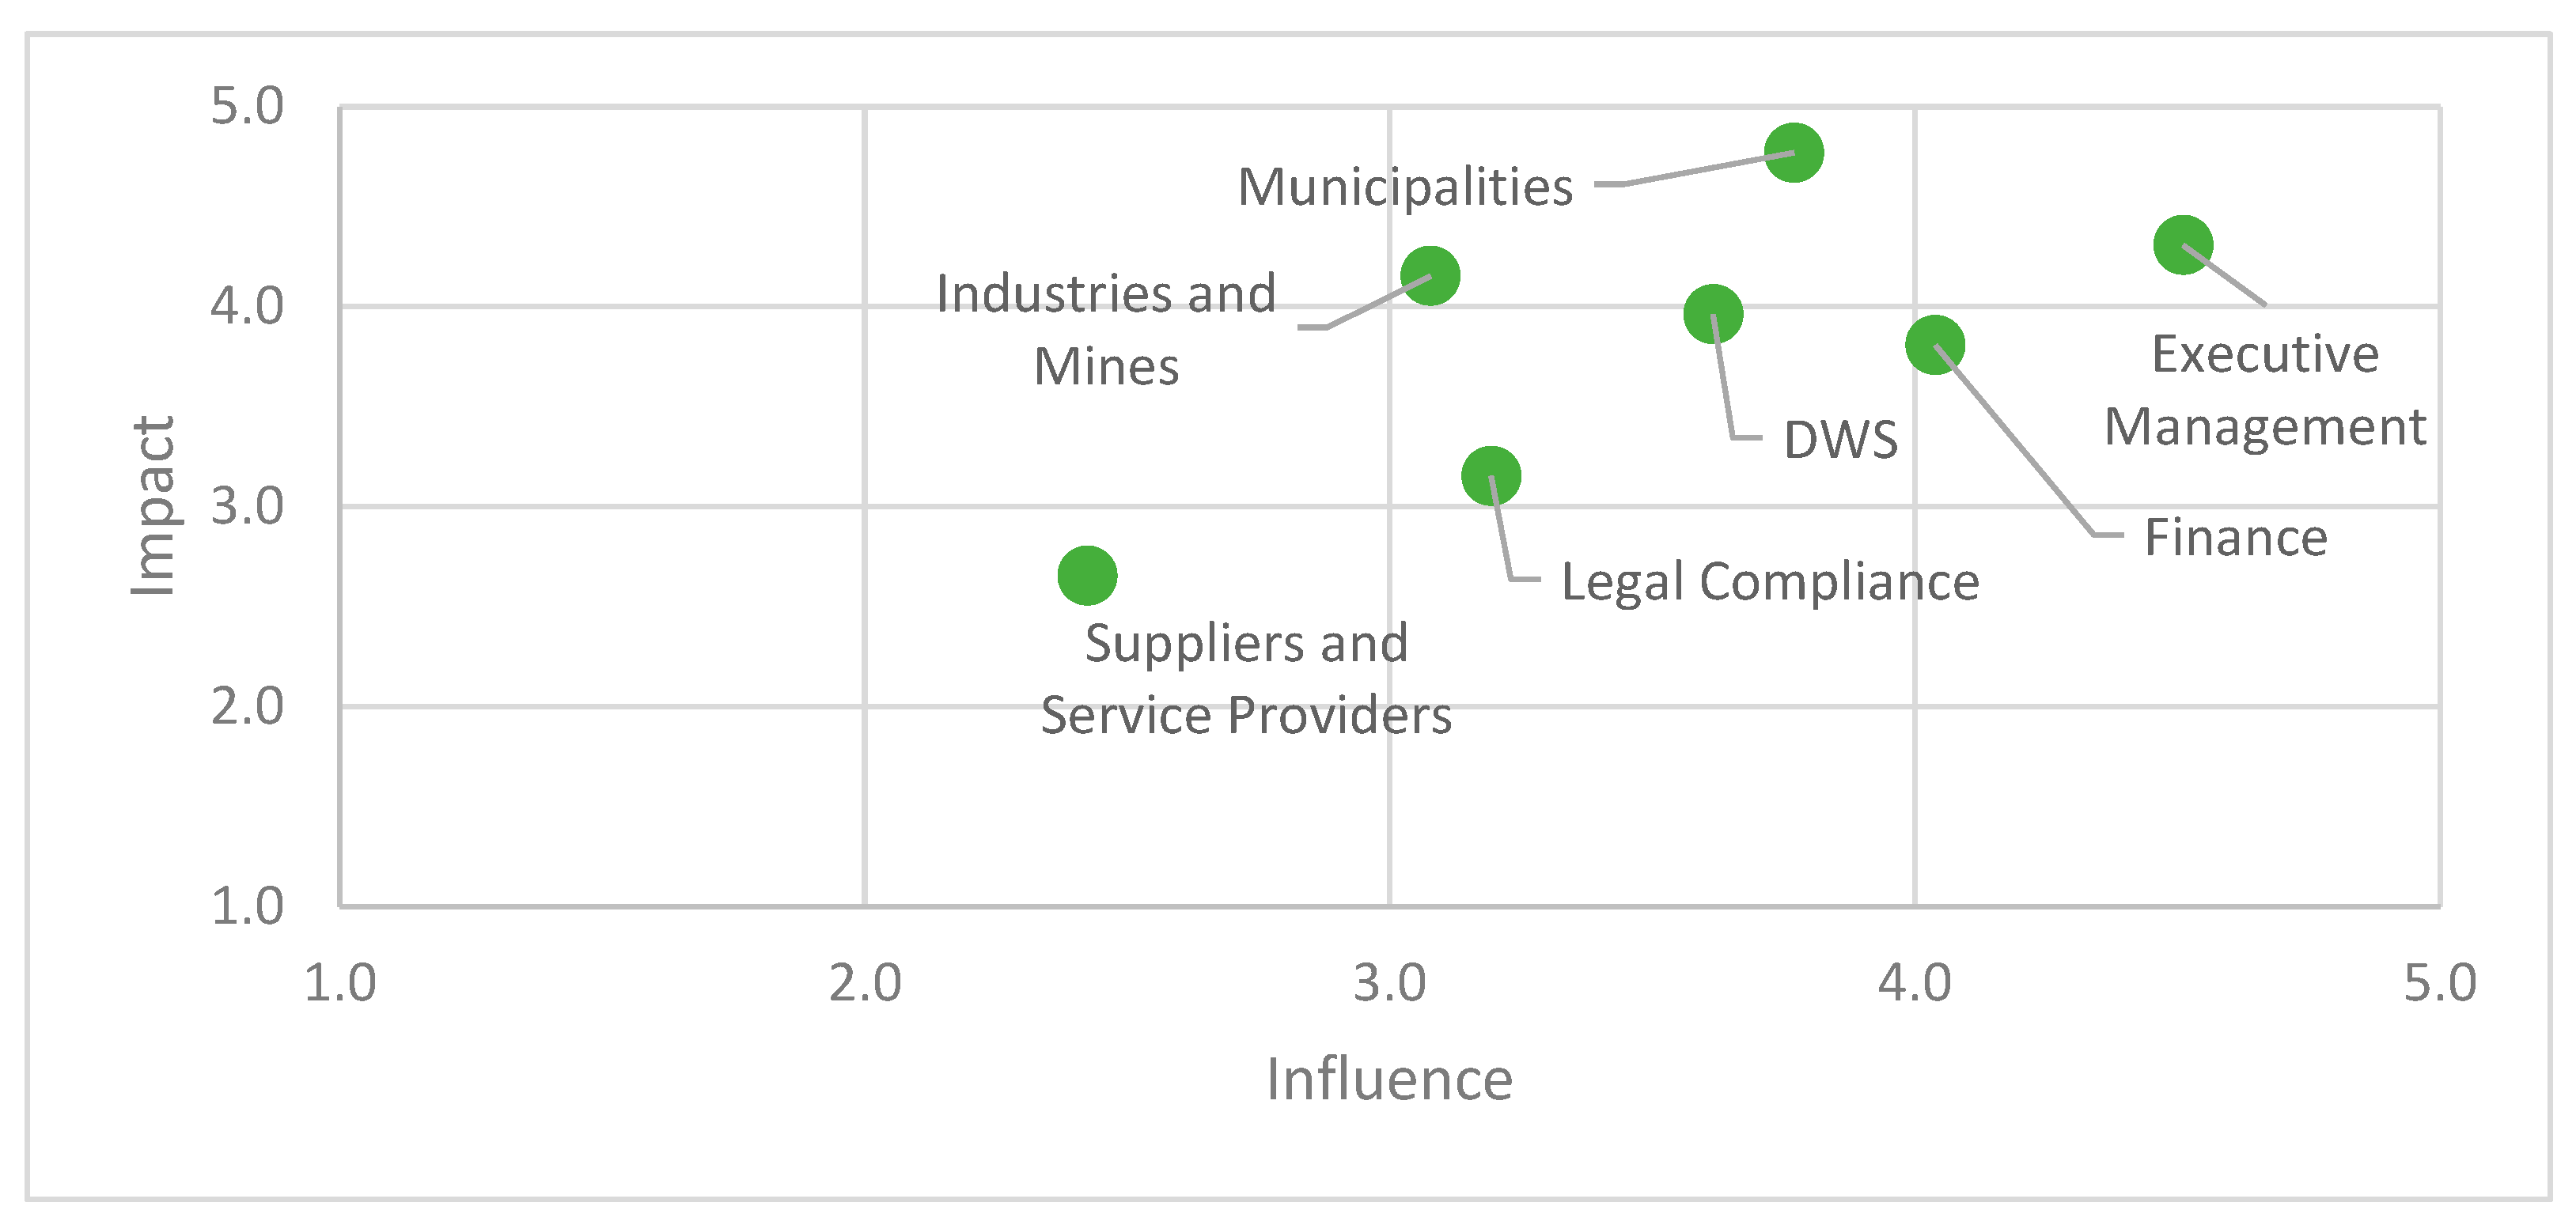
Figure 16 depicts the combined picture of both infrastructure planning and management, looking at internal and external stakeholders. It is worth noting that looking at the combined picture, the Metropolitan Municipalities (external stakeholders) are the ones who are highly impacted by the infrastructure planning and management actions of the bulk water supplier. Furthermore, they also have the highest influence on the bulk water supplier’s infrastructure planning and management functions. The Metropolitan Municipalities are only followed by the executive management (internal stakeholders) when it comes to influence and impact.
4.6. Research Reliability
The validity and reliability of the survey data collected was tested by calculating Cronbach’s alpha coefficient using the Excel spreadsheet. Cronbach’s alpha assesses the internal consistency or how closely related a set of items are to one another, and in most cases, the internal consistency of the scale’s items is inversely connected with how close the Cronbach’s alpha reliability coefficient is to 1.0, despite the fact that the coefficient truly has no lower limit [
51].
Table 5 shows the reliability of the data collected regarding water infrastructure planning and management by measuring the Cronbach’s alpha for the four main categories of the research. The results for all areas measured have acceptable reliability and consistency because they show Cronbach’s alpha coefficients between 0.69 and 0.82. This confirms that the survey questions were understood without ambiguity and that the selection of the respondents was consistent with their field of expertise and in line with the research methodology.
The respondents who participated in both the DEMATEL and validation interviews were carefully selected to make sure that they posses the relevant experience and qualifications in Engineering so that the results from the interviews can be credible. Overall, the reliability and validity of qualitative data were supported through triangulation with the literature [
3,
6,
11], diverse stakeholder interviews, and practical validation of responses through example-based reasoning during DEMATEL sessions.
5. Discussion
This study assesses the water infrastructure planning and management within key institutions in the supply chain in Gauteng. The findings show that while some aspects are structured and coherent, many systemic weaknesses undermine overall performance. This section looks at the strengths and limitations, followed by practical recommendations to improve integration, climate resilience, stakeholder engagement, and 4IR technologies.
5.1. Effectiveness of Current Practices
The research shows that infrastructure planning and management within institutions are generally well structured. A key strength is the horizontal integration within organisations, where lessons learned from operational and maintenance challenges, including those from infrastructure failures, are systematically fed back into future planning. This iterative approach enables internal learning and adaptive management.
But these strategies are constrained by project management weaknesses, particularly in the execution of new infrastructure development and rehabilitation projects. Institutions struggle to deliver projects within time, budget, and quality. This is further exacerbated by lack of cross-institutional coordination and insufficient Strategic Alignment across the water infrastructure value chain. Despite having structured frameworks within institutions, there are several gaps.
5.1.1. Poor Vertical Integration
The study reveals a big gap in planning among the different entities responsible for source water supply, bulk distribution, and municipal delivery. Institutions operate in isolation, and there are misalignments in planning and infrastructure duplication or deficiencies. As a result, these institutions are unable to meet the current water demand.
5.1.2. Inadequate Climate Resilience
The planning and management processes do not address climate change. Given Gauteng’s history of unpredictable weather patterns including extended droughts and intense rainfall, there is an urgent need for climate resilient infrastructure. But disaster preparedness and adaptation strategies are underdeveloped within current practices.
5.1.3. Limited 4IR Technologies Adoption
While some institutions have started with digital transformation, such as infrastructure mapping and non-revenue water reduction, there is a general lack of comprehensive strategy to integrate 4IR technologies into new and existing infrastructure systems.
5.1.4. Stakeholder Engagement Gaps
Stakeholders have been identified, but engagement is not uniform across the water value chain. Municipalities as bulk water customers are the most influential stakeholders, but current practices often do not require continuous engagement with them during infrastructure planning. Upstream institutions are not legally required to do formal stakeholder engagement like municipalities do, which limits transparency and inclusivity. This analysis shows the need to improve practices to enhance overall water infrastructure management in Gauteng, focusing on systemic integration, climate resilience, and technological advancement.
5.2. Recommendations
Based on the above findings, the following recommendations are made to address the weaknesses:
5.2.1. Integration Across the Water Value Chain
To address the fragmentation across institutions, a coordinated water infrastructure planning and management framework should be adopted. This integrated framework should cover the entire water value chain from source abstraction to municipal distribution and be overseen by a central coordinating body. This framework should require collaborative planning among all relevant parties and align infrastructure investments so that there is redundancy, demand forecasting, and long-term resilience.
5.2.2. Mainstreaming Climate Resilience
Given Gauteng’s climate variability and increasing exposure to extreme weather events, climate resilience must be mainstreamed into all infrastructure planning and operations. Institutions should review and update their disaster recovery plans and climate adaptation strategies. These updates should be incorporated into the planning framework and operations and maintenance protocols. No single solution can eliminate the risks of climate change, but deliberate planning can reduce vulnerability.
5.2.3. Stakeholder Engagement
The findings confirm the role of executive management in shaping infrastructure outcomes as per the DEMATEL analysis. To improve stakeholder integration especially with municipalities and communities, a formalised and inclusive engagement process should be embedded in the integrated framework. This should go beyond the Integrated Development Programme (IDP) processes of municipalities to include upstream institutions like bulk water providers and source suppliers.
5.2.4. 4IR Technology Integration
The study highlighted that Industry 4.0 technology implementation is not sufficient. Institutions should prioritise investment in smart metering, real-time monitoring systems, predictive maintenance, and digital asset management platforms. These can improve planning accuracy, operational efficiency, and responsiveness. Redeveloping/enhancing existing infrastructure with digital capabilities should also be emphasised to get the most out of the entire asset portfolio.
5.3. Development of an Integrated Framework
The results of this study revealed that the absence of a coordinated water infrastructure planning and management framework across the full water value chain from raw water abstraction through bulk supply to municipal distribution is a key contributor to project delays, misaligned infrastructure priorities, and operational inefficiencies. Currently, planning frameworks focus either on isolated stages (planning or operations) or on individual utilities responsible for an entire value chain. In Gauteng, where multiple institutions share responsibility for water supply, this fragmented approach results in poor coordination, limited visibility across institutions, and inconsistent incorporation of climate resilience and advanced technologies. The proposed integrated framework, addresses these gaps by aligning infrastructure plans, ensuring cohesive stakeholder engagement across institutions, embedding climate-resilient strategies, and creating a structured mechanism for incorporating 4IR technologies into all stages of infrastructure development and management. Frameworks have always been used by scholars and practitioners to analyse the complex, nonlinear interdependencies and to navigate the new epistemological, ontological, analytical, and practical horizons of integrating knowledge for sustainability solutions.
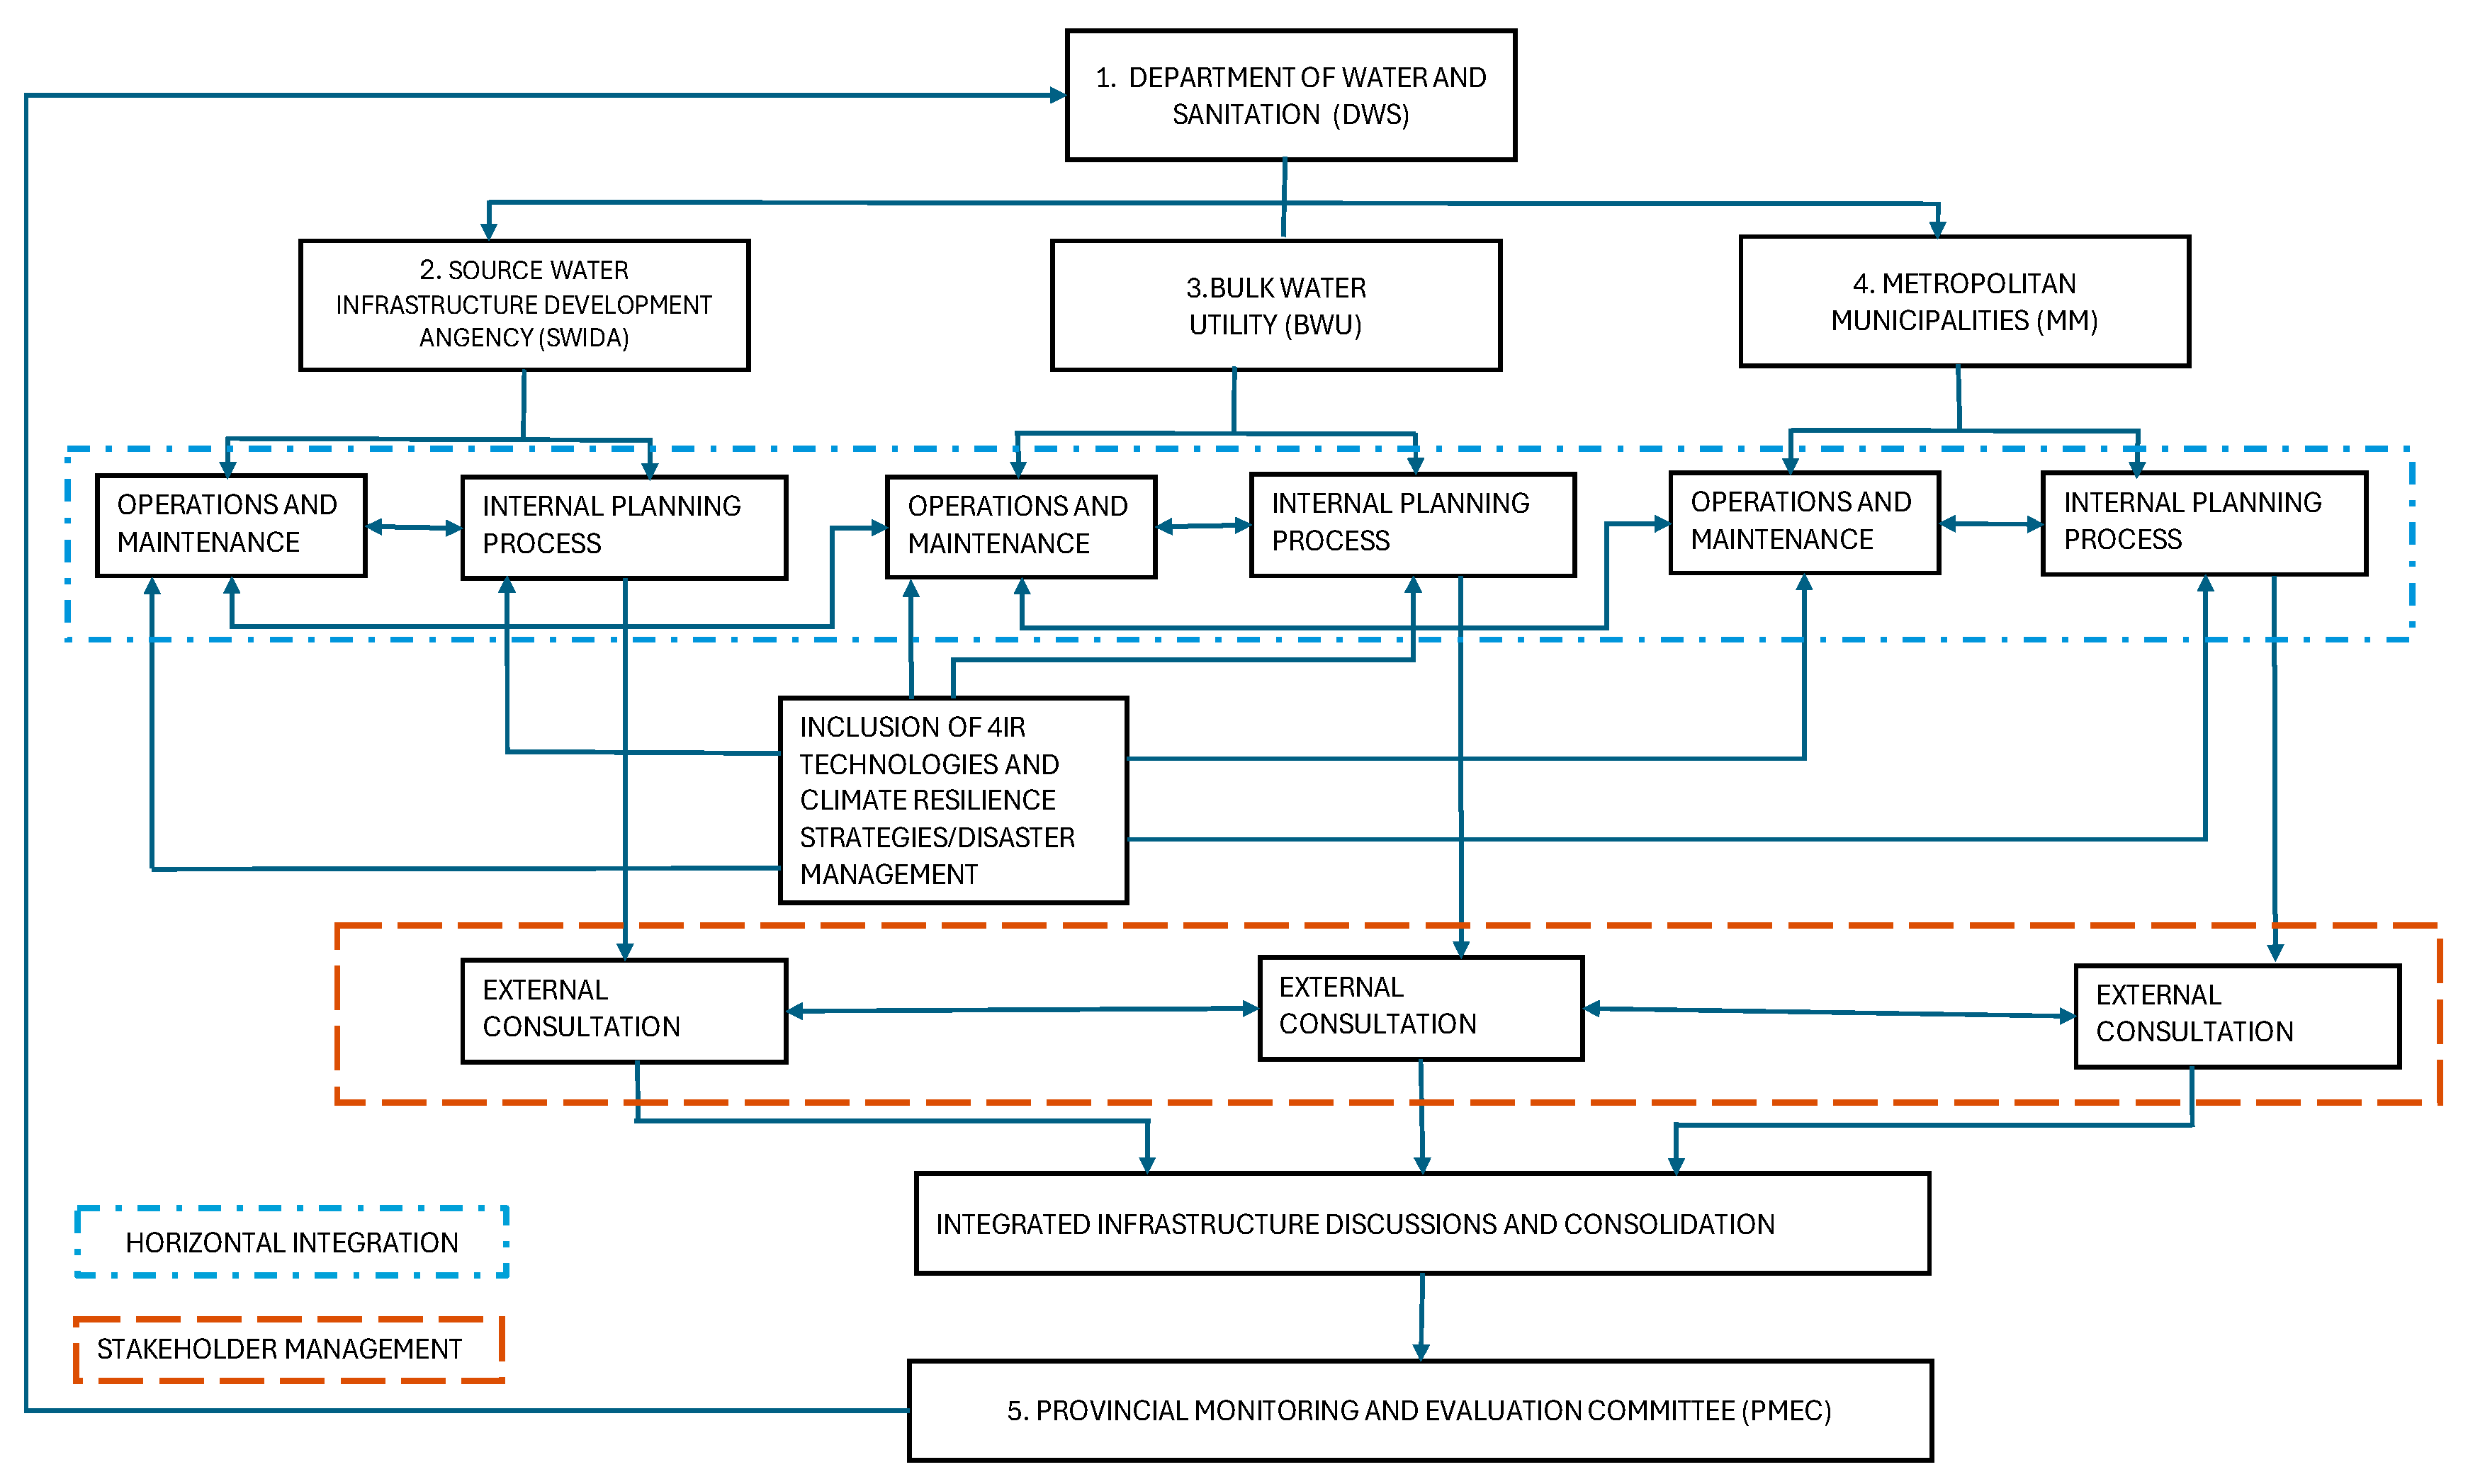
The water infrastructure planning and management framework shown in
Figure 17 shows five institutions, three currently existing, namely the Department of Water and Sanitation, the Bulk Water Utility, and the Metropolitan Municipalities. Two new institutions that are proposed to the framework are the Source Water Infrastructure Development Agency (SWIDA) and Provincial Monitoring and Evaluation Committee (PMEC). The recommendation to establish SWIDA is to split the responsibilities of the DWS, which often times have been conflicted in its interest, to focus strictly on Source Water Infrastructure Development, whilst the DWS focuses on policy development and regulation. The PMEC is recommended to be established as a sub-committee of the provincial legislature with its main functions being consolidation of all infrastructure development plans and progress reporting.
The proposed roles and responsibilities of the institutions are explained in
Table 6.
Table 6 shows that Source Water Infrastructure Development Agency, Bulk Water Utility, and Metropolitan Municipalities have the same responsibilities, namely infrastructure planning, operations, and maintenance. The national Department of Water and Sanitation is proposed to focus on policy development and regulation as well as shareholding, since all institutions are state owned. It is recommended to establish a Provincial Monitoring and Evaluation Committee whose function is an integration role, performance monitoring, and reporting, as well as providing advisory services on policy matters. Proposed DWS roles and responsibilities exclude the existing planning and management of source water infrastructure so as to focus exclusively on policy development, governance, and regulation. SWIDA is recommended to be formed to take up the source water planning and management responsibilities. Infrastructure planning roles follow internally developed processes across the value chain: the DWS follows the IDP process to develop the national water and sanitation master plan, Bulk Water Utility follows the internal developed IDP, whereas the Municipalities follows the Municipal IDP, as directed by Municipal Systems Act 32 of 2000. Infrastructure operations and maintenance roles are internally designed per institution and informed by the original equipment manufacturers’ guidelines and the reliability-centred maintenance strategies.
5.4. Framework Validation
The proposed integrated framework was discussed with 10 industry experts for validation purposes. The interviews outlined the explanation of the proposed framework for industry experts to make their input and comments. The participants were given unique code names according to the sector that they work in as follows: “SW” represents source water participants, “BS” represents bulk water supplier participants, and “MM” represents Metropolitan Municipalities’ participants. These codes also provide for anonymity of the participants, who were selected from the initial respondents who participated in the survey data collection.
Codes generation and theme identification were conducted, and the themes are summarised as follows:
Water security and institutional realignment;
Co-ordination and integration of multiple institutions’ infrastructure planning and management;
Roles and responsibilities of institutions.
Further analysis of the inputs was conducted, and there is a general view that the proposed integrated water infrastructure planning and management framework will improve and consolidate the critical work that is carried out by multiple institutions.
A comment from PARTICIPANT SW1 captures the inputs as follows: “Fosters creation of relevant/strategic/inclusive governance structure with clear roles, responsibilities, mandates, and delegations for water infrastructure strategy development, planning, execution, monitoring and evaluation.
Furthermore, participants made additional recommendations to the proposed framework. A comment from PARTICIPANT BS3 captures the recommendation as follows: “Proposal enhances the processes, caution to be taken regarding where PMEC reports, DWS or CogTA”.
Another participant added that in order for effective separation of the Metropolitan Municipalities’ water departments to report to the DWS, they ought to be ringfenced. This came from PARTICIPANT MM1 as follows: “My other view is for Metros to focus solely on WSA duties and have separate leg to carry out WSP duties (An entity like Johannesburg Water) which will manage and operate all CoT’s WTP’s”.
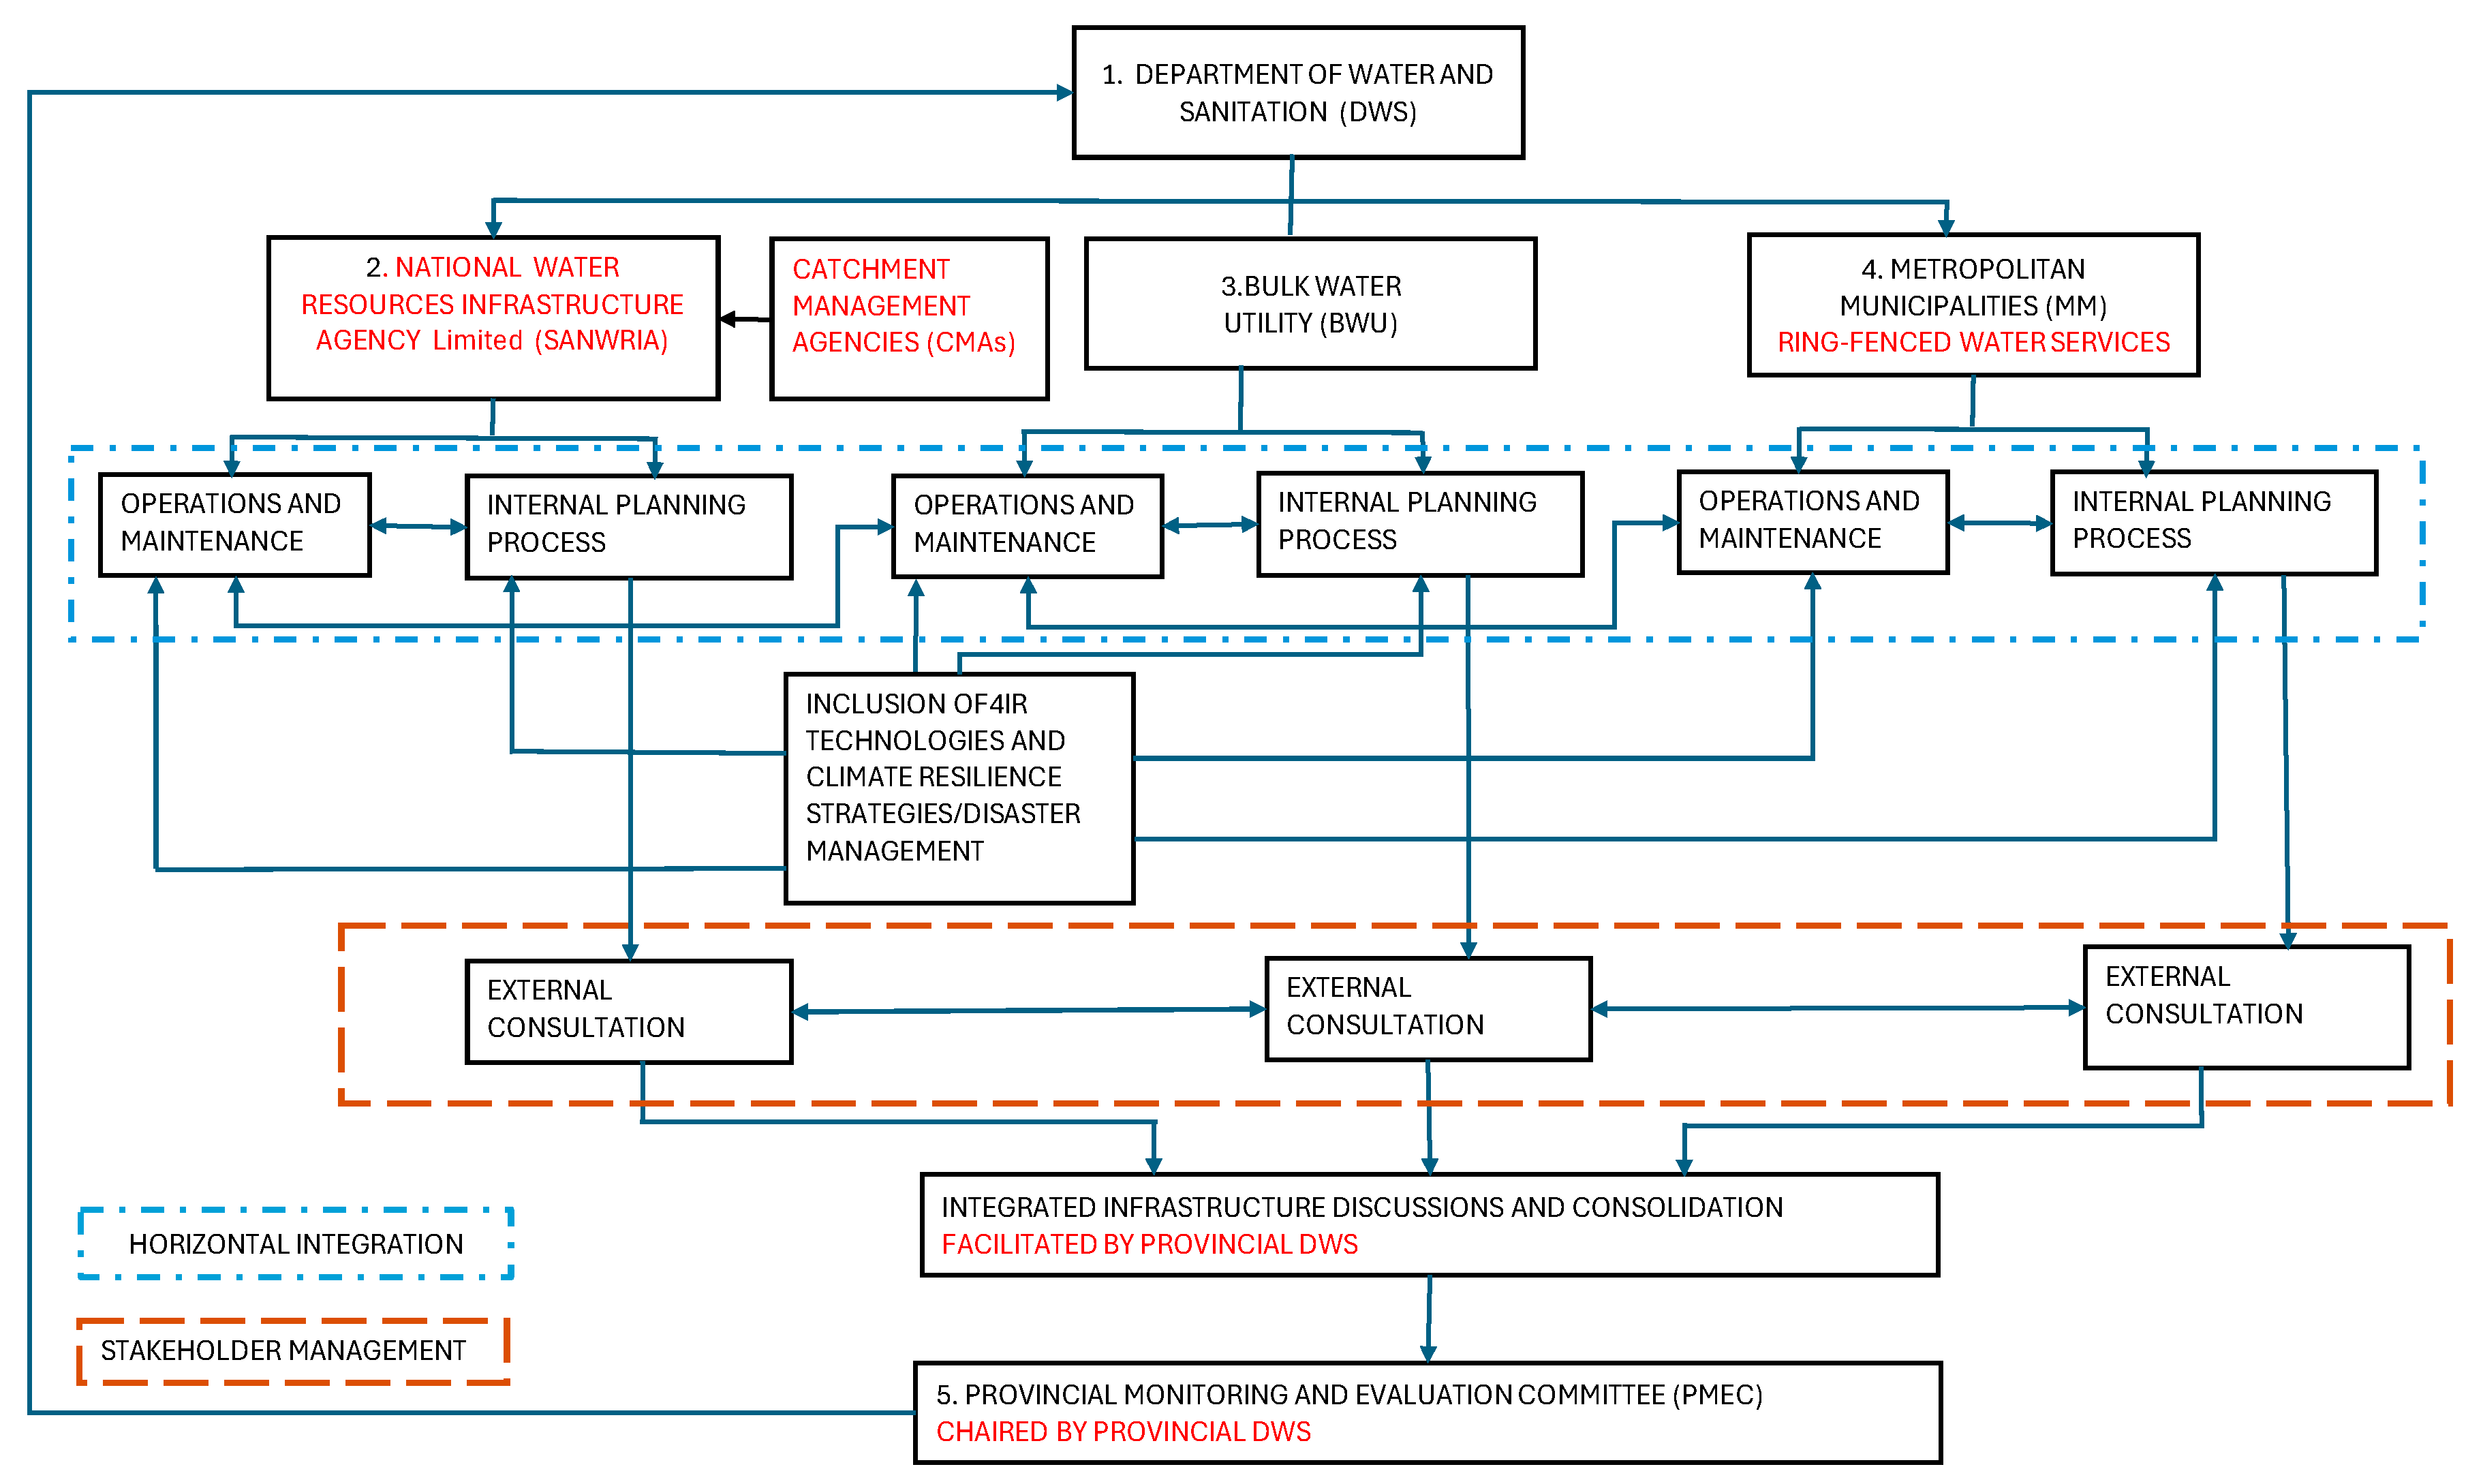
The proposed integrated water infrastructure planning and management framework was revised, as shown in
Figure 18, to incorporate the inputs received from industry experts during the validation exercise. The key additional inputs are highlighted in red, in the revised framework and are summarised as follows:
The Source Water Infrastructure Development Agency has been replaced by the South African National Water Resources Infrastructure Agency (SANWRIA) SOC Limited, which is a newly established institution through the enactment of Act 34 of 2024. It is envisaged that once it is functional, there will be provincial offices that will be established in order to perform and coordinate its source water management responsibilities at a regional as well as national level.
The role of Catchment Management Agencies is noted to be key in informing the activities of SANWRIA, and therefore, this has been incorporated into the revised framework.
The role of Metropolitan Municipalities as water services authorities according to the Water Services Act (108 0f 1997) is proposed to be strengthened by ring fencing the water services function away from the rest of the other municipal services, and an example of Johannesburg Water was cited. This key input has therefore found expression in the revised framework.
Lastly, it was proposed that the roles of the PMEC be undertaken by the provincial DWS, which is already in existence, and it is also envisaged that the establishment of SANWRIA will naturally resolve the conflicted roles of the DWS as matters stand. This proposal was further incorporated into the revised framework.


