Article

Assessing Climate Change Impacts on Groundwater Recharge and Storage Using MODFLOW in the Akhangaran River Alluvial Aquifer, Eastern Uzbekistan

by
Azam Kadirkhodjaev
1,
Dmitriy Andreev
1,
Botir Akramov
1,
Botirjon Abdullaev
1,
Zilola Abdujalilova
1,
Zulkhumar Umarova
1,
Dilfuza Nazipova
1,
Izzatullo Ruzimov
1,
Shakhriyor Toshev
1,
Erkin Anorboev
1,
Nodirjon Rakhimov
1,
Farrukh Mamirov
1,
Inessa Gracheva
2 and
Samrit Luoma
3,*
1
State Establishment “Institute of Hydrogeology and Engineering Geology”, Olimlar Street 64, Mirzo-Ulugbek District, Tashkent 100164, Uzbekistan
2
State Establishment “Uzbekhydrogeology”, Olimlar Street 64, Mirzo-Ulugbek District, Tashkent 100164, Uzbekistan
3
Water and Mining Environment Solutions, Geological Survey of Finland, FI-02151 Espoo, Finland
*
Author to whom correspondence should be addressed.
Water 2025, 17(15), 2291; https://doi.org/10.3390/w17152291 (registering DOI)
Submission received: 2 July 2025 / Revised: 29 July 2025 / Accepted: 29 July 2025 / Published: 1 August 2025
(This article belongs to the Special Issue Climate Change Uncertainties in Integrated Water Resources Management)

Abstract

A shallow quaternary sedimentary aquifer within the river alluvial deposits of eastern Uzbekistan is increasingly vulnerable to the impacts of climate change and anthropogenic activities. Despite its essential role in supplying water for domestic, agricultural, and industrial purposes, the aquifer system remains poorly understood. This study employed a three-dimensional MODFLOW-based groundwater flow model to assess climate change impacts on water budget components under the SSP5-8.5 scenario for 2020–2099. Model calibration yielded RMSE values between 0.25 and 0.51 m, indicating satisfactory performance. Simulations revealed that lateral inflows from upstream and side-valley alluvial deposits contribute over 84% of total inflow, while direct recharge from precipitation (averaging 120 mm/year, 24.7% of annual rainfall) and riverbed leakage together account for only 11.4%. Recharge occurs predominantly from November to April, with no recharge from June to August. Under future scenarios, winter recharge may increase by up to 22.7%, while summer recharge could decline by up to 100%. Groundwater storage is projected to decrease by 7.3% to 58.3% compared to 2010–2020, indicating the aquifer’s vulnerability to prolonged dry periods. These findings emphasize the urgent need for adaptive water management strategies and long-term monitoring to ensure sustainable groundwater use under changing climate conditions.

1. Introduction

Central Asia lies within semi-arid to arid climate zones and is characterized by significant variability in climate parameters [1]. Since the 1980s, the region has experienced a notable rise in temperature, accompanied by the northward expansion of desert climates and the intensification of warmer and wetter boreal conditions in mountainous areas [2]. These climatic shifts have contributed to reduced snow depth and an increase in extreme weather events and droughts [3]. Projections based on future climate scenarios indicate that regional temperatures may rise by 2.0–6.0 °C by the end of the 21st century [4]. This warming is expected to increase evapotranspiration, and when coupled with potential declines in precipitation, it will significantly affect the regional hydrological cycle [4].
In Uzbekistan, climate change has already manifested through observable changes in temperature and precipitation patterns. Monitoring data show that between 1950 and 2013, the mean minimum temperature increased by 2.0 °C and the mean maximum temperature by 1.6 °C [5]. Climate projections indicate that, under the high-emissions RCP8.5 scenario, mean annual temperatures could increase by up to 5.6 °C by the end of the century relative to the 1986–2005 baseline. However, substantial seasonal and regional variability is expected, with the most pronounced warming projected during the summer months (June–September), potentially reaching 6.0 °C. Temperatures exceeding 35.0 °C are anticipated across much of the country, with the Fergana Valley and the Akhangaran River Valley expected to experience the greatest increases, averaging 5.7 °C under RCP8.5.
Precipitation trends are more variable, with projections ranging from a 30.0% decrease to a 20.0% increase by the end of the century [5]. In the Chirchik-Akhangaran River Basin, Gafforov et al. [6] forecast an increase in mean annual precipitation of 11.8% by 2030 and 16.3% by 2070 relative to the 1990–2016 period under RCP8.5. These changes are expected to significantly affect seasonal precipitation and evapotranspiration patterns, particularly in areas already experiencing summer rainfall deficits. In Uzbekistan, droughts occurred approximately every five years during the 1980s and 1990s, increasing to every four years between 2000 and 2012. The most severe drought in recent decades occurred in 2000–2001, with substantial economic and social consequences [5].
Climate change poses a critical threat to water security in Uzbekistan, both in terms of quantity and quality. Rising temperatures and accelerated glacier and snowmelt may lead to severe water shortages in rivers dependent on meltwater by the 2040s and 2050s. Punkari et al. [7] projected a 22.0–28.0% reduction in downstream inflow for the Syr Darya River and a 26.0–35.0% reduction for the Amu Darya River by the 2050s. These reductions could severely impact the Akhangaran River alluvial aquifer in eastern Uzbekistan, the focus of this study. This aquifer, a vital source of freshwater for domestic, agricultural, industrial, and mining uses, is shallow, permeable, and hydraulically connected to surface water, making it highly sensitive to climatic and anthropogenic influences [8].
Increasing temperatures, precipitation variability, and growing water demand [9] pose significant risks to groundwater recharge and availability. Over-extraction may disrupt the sustainable balance of groundwater resources, exacerbated by climate-induced increases in evapotranspiration and reduced recharge during summer droughts. Effective water resource management must address competing demands, ensure equitable distribution, mitigate contamination risks, and adapt to climate change. A comprehensive understanding of groundwater systems and their interactions with surface water is essential. However, critical knowledge gaps remain regarding recharge sources and variability, lateral inflows from side-valley deposits, groundwater and surface water interactions, and aquifer storage capacity.
The study area experiences a seasonal climate, with the majority of precipitation occurring in winter and early spring, coinciding with lower temperatures and increased groundwater recharge [10]. In contrast, rising summer temperatures lead to higher evapotranspiration rates and reduced recharge. To ensure the sustainability of water resources, groundwater recharge and storage must exceed abstraction rates.
Groundwater flow models are valuable tools for evaluating aquifer responses to changes in hydrogeological conditions, including climate variability, groundwater abstraction, and land use changes [11,12,13,14]. In data-scarce regions, the models provide quantitative insights into aquifer conditions and help identify areas requiring further investigation [15]. Although numerous studies have examined the impacts of climate change on drought and water resources in Uzbekistan [16,17,18,19,20,21], none have applied groundwater flow modeling to quantitatively assess future climate change impacts on groundwater resources.
This study addresses this gap by developing a transient groundwater flow model to evaluate the sensitivity of the aquifer system to climate variability and to support sustainable groundwater management under future climate scenarios. The objective is to assess the impacts of temperature and precipitation variability on groundwater recharge, lateral inflow from side-valley alluvial deposits, riverbed infiltration, stream discharge, and water storage in the river alluvial aquifer of eastern Uzbekistan. The study is based on the hypothesis that climate change will significantly alter groundwater recharge and storage in the Akhangaran River alluvial aquifer due to shifts in temperature, precipitation patterns, and evapotranspiration rates. The novelty of this research lies in the application of a transient MODFLOW model to assess climate change impacts on groundwater resources in this region. To the best of our knowledge, this is the first study to apply such a modeling framework in the Akhangaran River Valley, offering a quantitative basis for evaluating future groundwater dynamics under climate change scenarios.

2. Study Area

2.1. General Setting

The study area is situated in the Nurabad settlement within the Akhangaran River Valley in eastern Uzbekistan, approximately at 40°54′22″ N, 69°38′40″ E (Figure 1). It lies between the cities of Almalyk, Akhangaran, and Angren, with a population of approximately 435,702 as of 2017 [22]. The region supports diverse land uses, including agriculture (grain, cotton, vegetables, and fruit cultivation), livestock grazing, poultry and fish farming, and various industrial activities, such as ferrous and non-ferrous metallurgy, coal mining, cement production, and construction.
The Akhangaran River Valley is the second largest river basin in the Tashkent region. It is geographically bounded by the Chatkal-Kuramin ridges to the north–northeast and south, the Syr Darya River to the west, and the Chirchik River Valley to the northwest. The topography is highly variable, ranging from mountainous and foothill zones with alluvial fans to broad river valley plains.
Climatically, the area transitions from a temperate Mediterranean climate (Köppen classification Csa) in the Akhangaran City area to a continental climate (Dsa) in the Angren City area, characterized by hot, dry summers and cold winters [1]. According to data from the Angren weather station from years 2010–2020, the mean annual precipitation is 507.0 mm, and the mean annual temperature is +19.9 °C [10]. The coldest months are January and February (average daily minimum of −5.0 °C), while the hottest months are July and August (average daily maximum of +35.2 °C). Precipitation is lowest in July and August (average 2.7 mm) and peaks in February and March (average 83.1 mm).

2.2. Hydrogeological Background

The shallow groundwater system in the Akhangaran River alluvial aquifer is accumulated within quaternary deposits, underlain by pre-quaternary formations ranging from tertiary sedimentary rocks to Paleozoic bedrock [8,23]. The Akhangaran River and its tributaries have incised these older formations, depositing sediments along foothill slopes as side-valley alluvial fans and along valley floors as river alluvium. These deposits consist of clay, silt, sand, and gravel, transported and deposited in the floodplain. The extent of the quaternary deposits is constrained by valley morphology and the underlying bedrock surface.
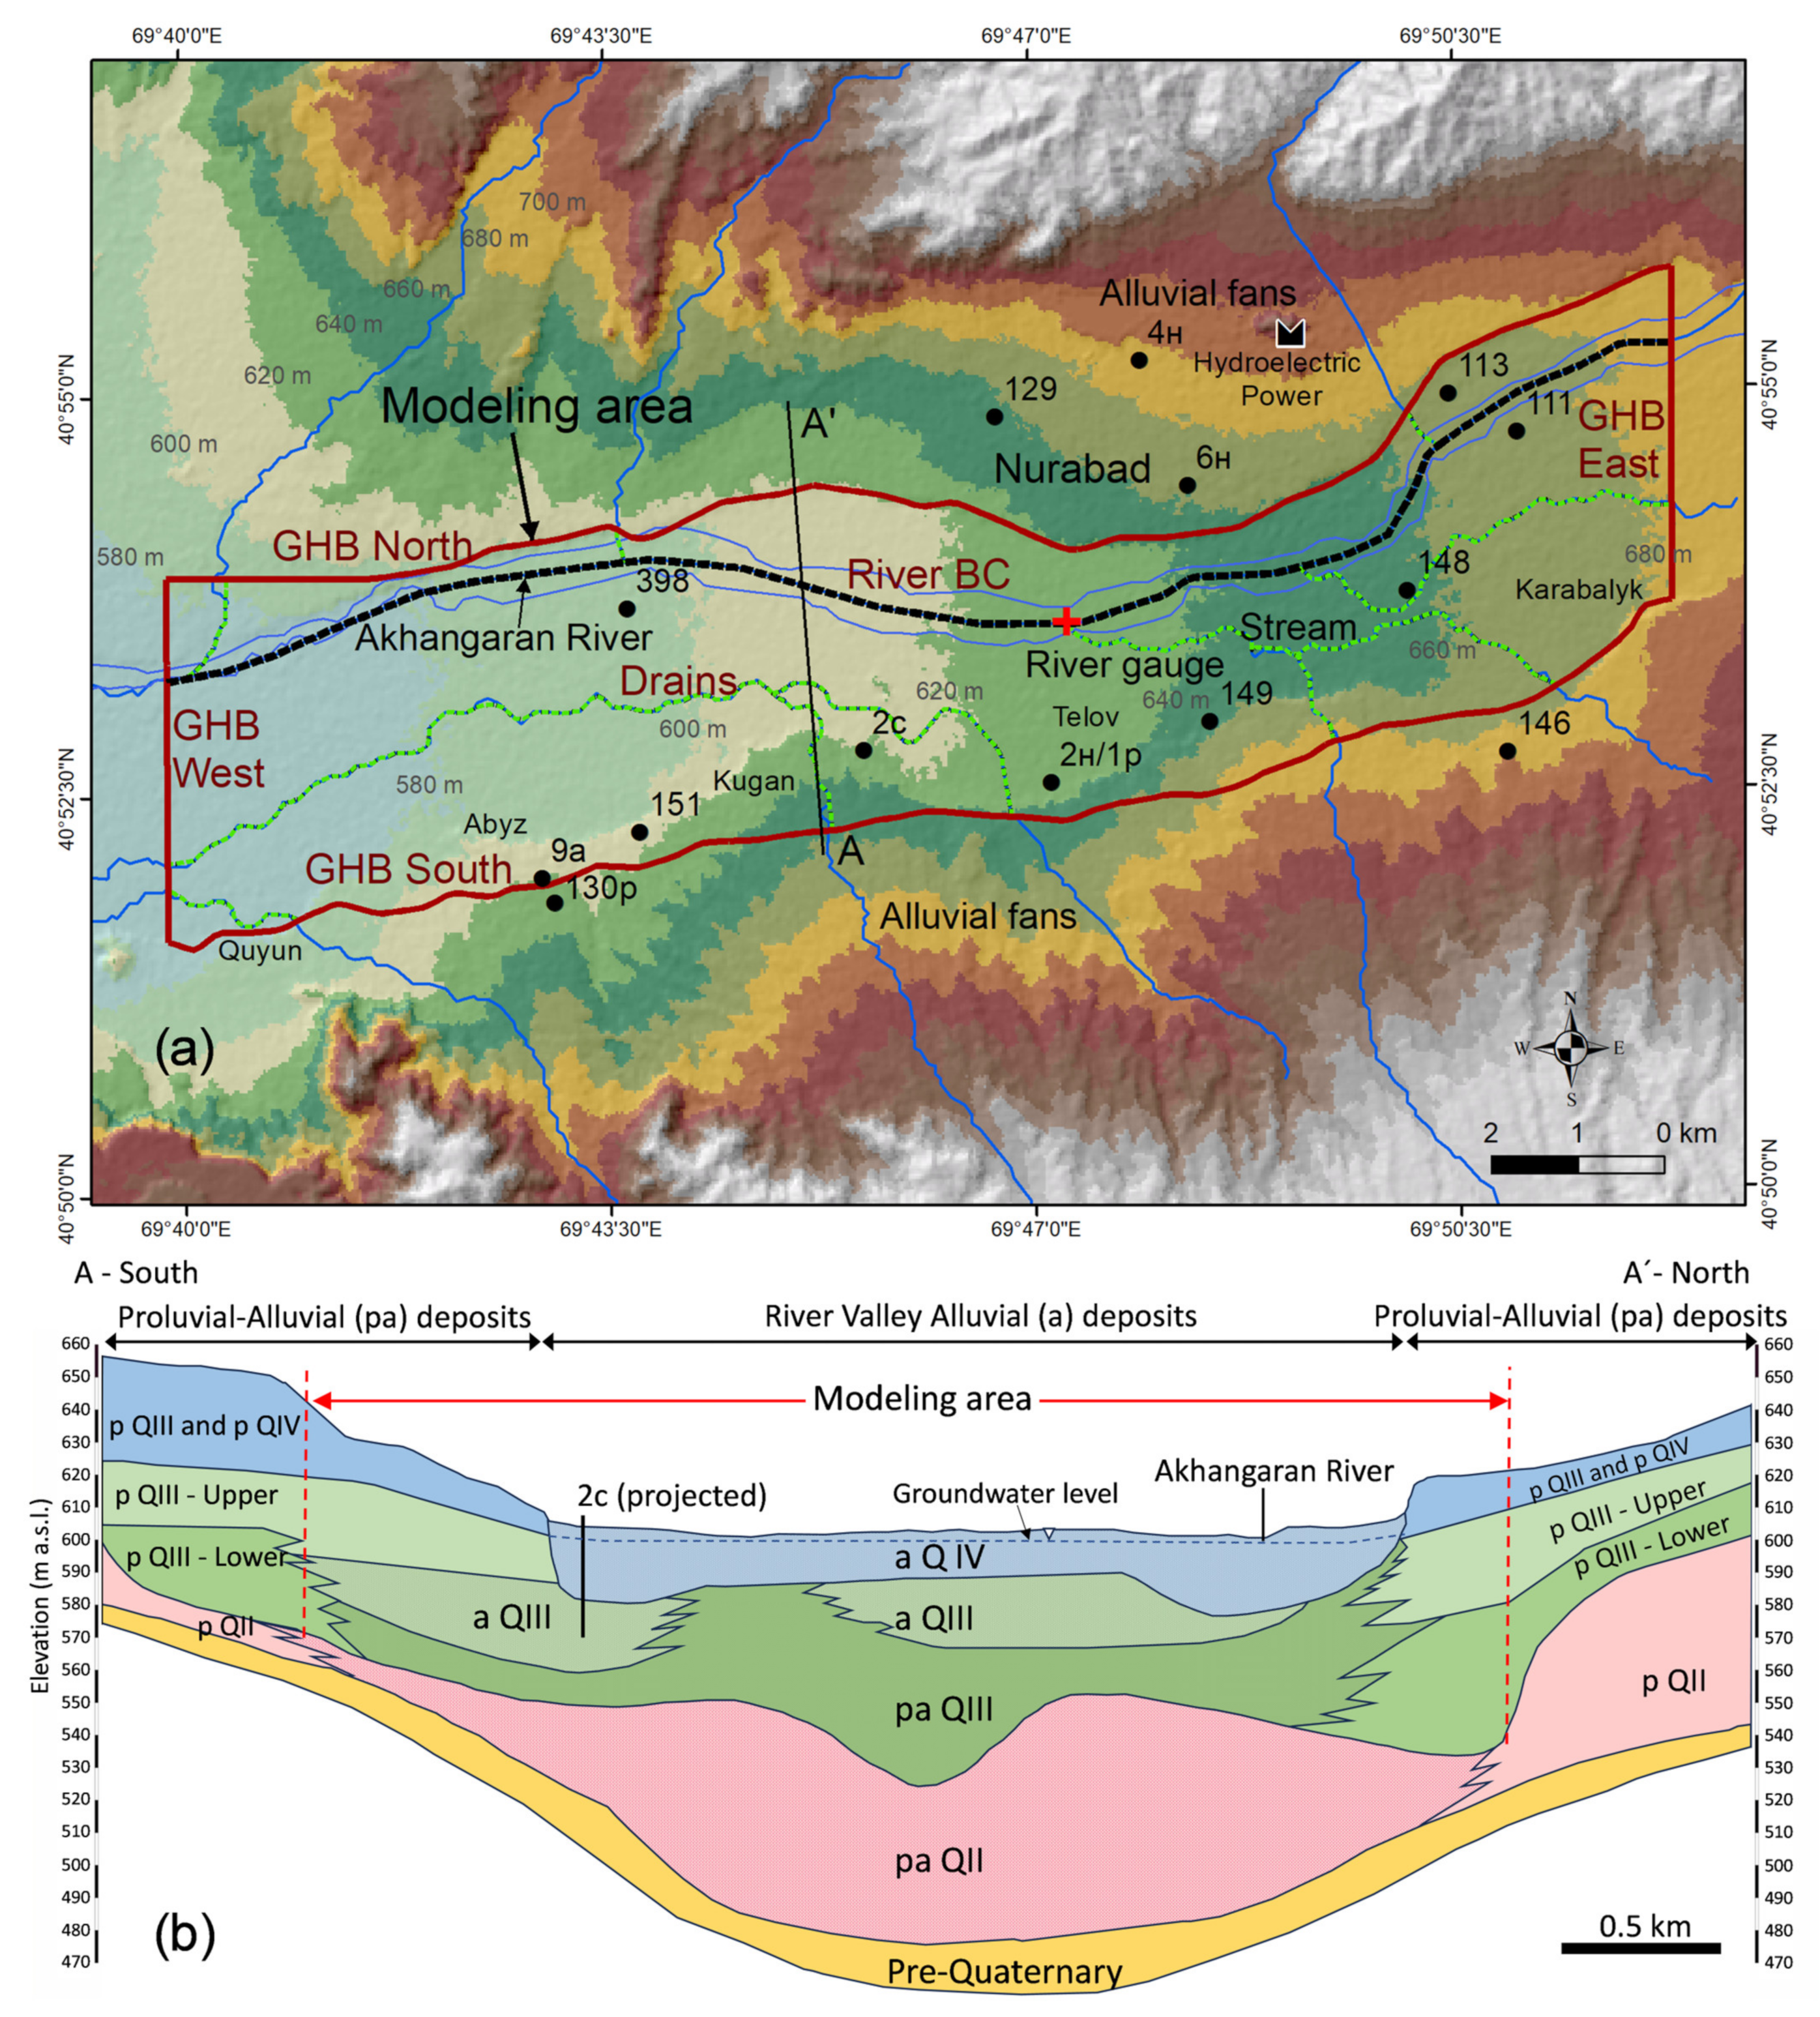
Recent river alluvial sediments are primarily found in valley floors and floodplains, bordered by terrace cliffs composed of proluvial and alluvial materials (Figure 2). The width of the valley floor ranges from 2.5 to 3.8 km, while the quaternary sedimentary zone spans 6.0 to 8.0 km. The thickness of the alluvial deposits varies from less than 10.0 m in the eastern headwaters and valley margins to approximately 200.0 m in the lower plains near the Syr Darya River Basin in the west.
The Akhangaran River alluvial aquifer comprises four main hydrogeological units (QI–QIV), of which three (QII–QIV) are present in the study area (Figure 2b):
-
Upper quaternary and recent river alluvial deposits (aQIV): These deposits form the uppermost aquifer layer in the Akhangaran River Valley and floodplain terraces. In the Akhangaran–Nurabad area, the aquifer thickness ranges from 10.0 to 15.0 m. The sediments consist of sandy gravel and pebbles with occasional boulders. Hydraulic conductivity (K) ranges from 40.0–50.0 m/d to 100.0–200.0 m/d in recent alluvium, decreasing to 10.0 m/d in deeper layers dominated by sand and loam. Groundwater is fresh, with total dissolved solids (TDSs) up to 0.5 g/L.
-
Upper quaternary proluvial–alluvial deposits (paQIII): These deposits occur on floodplain terraces and side-valley alluvial fans. The sediments include sandy gravel and pebbles, interbedded with loam. Groundwater levels in side-valley fans range from 15.0 to 35.0 m below the ground surface. K values are heterogeneous, ranging from 0.2 m/d in loam to 10.0–30.0 m/d in pebbles. In loamy sand and pebbles, K values range from 0.4 to 4.8 m/d. Water is fresh (TDSs ≤ 0.5 g/L), and this unit serves as the primary source for groundwater abstraction.
-
Middle quaternary proluvial–alluvial deposits (paQII): This semi-confined to confined aquifer underlies the paQIII unit and consists of gravel interbedded with loess and loam. K values range from 0.2 to 1.2 m/d in loess and loam to 9.5–30.9 m/d in gravel. TDSs ranges from 1.6 to 6.0 g/L, indicating slightly to moderately saline water, with hardness levels between 510.0 and 2300.0 mg/L.
-
Lower quaternary proluvial–alluvial deposits (paQI): Although not well-documented in the Akhangaran River Valley, these deposits are known to occur in the Chirchik River Basin to the northwest. Their thickness ranges from 12.0 to 56.0 m up to 200.0 m. The sediments primarily consist of sandy gravel and pebbles, with K values between 5.0 and 17.0 m/d. The groundwater is fresh (TDSs ≤ 1.0 g/L) but exhibits high hardness, ranging from 150.0 to 300.0 mg/L.
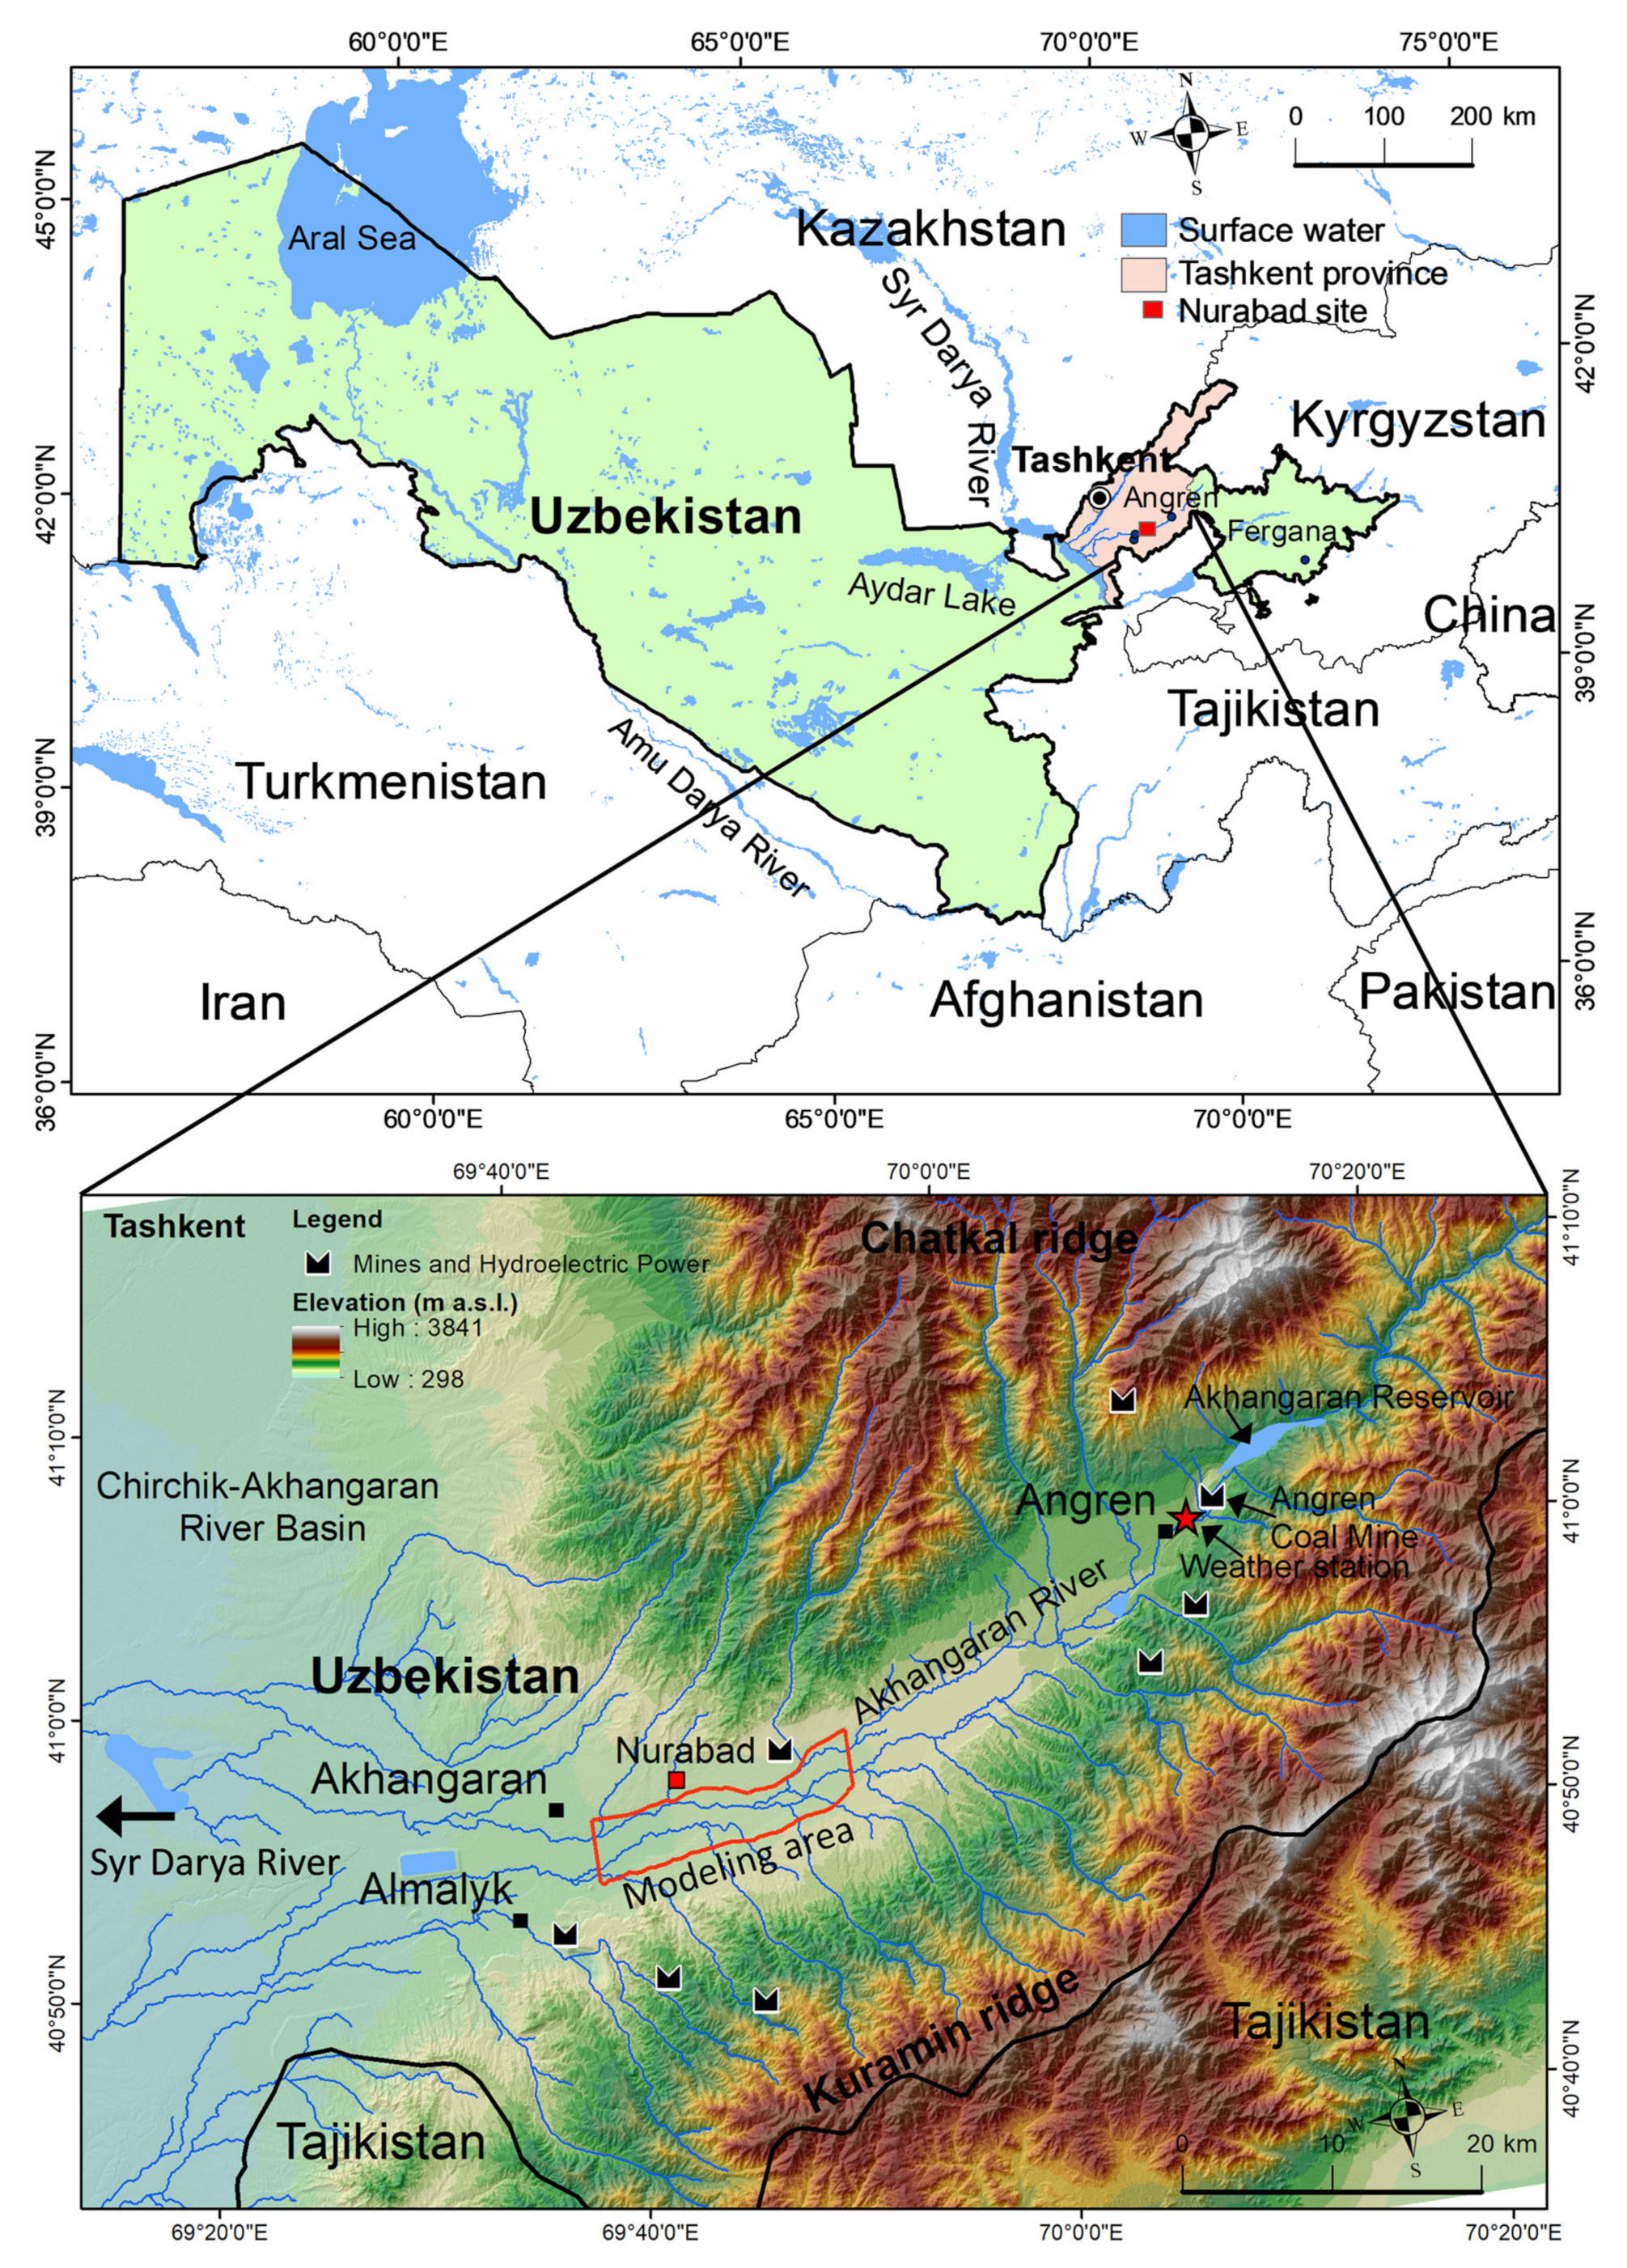
Groundwater recharge in the region occurs through multiple pathways, including precipitation infiltration, riverbed leakage, and irrigation return flow. Recharge is most active during spring (March–April) due to snowmelt and in late autumn (November–December) due to rainfall. During summer (June–August), recharge is minimal or absent due to low precipitation and high evapotranspiration rates. The Akhangaran Reservoir, located upstream of the Angren opencast coal mine, plays a critical role in regulating water availability for the river and irrigation systems. The reservoir provides an average discharge of 23.0 m3/s (2.0 Mm3/d), with a maximum outlet capacity of 400.0 m3/s (34.6 Mm3/d) [24], ensuring a consistent water supply and supporting riverbed infiltration.
Figure 1. Location and topographic relief map of the Akhangaran River Valley and the Nurabad site in the Tashkent region, eastern Uzbekistan. The base map is adapted from [25], and the topographic relief is derived from Shuttle Radar Topography Mission (SRTM) digital elevation model (DEM) data [26].
Water 17 02291 g001
Figure 2. (a) Location of the model domain and MODFLOW model boundaries, including general head boundaries (GHBs; brown solid lines), river boundary (black dashed line), drains (green dashed line), observation boreholes (black dots), river gauge station (red cross), the Akhangaran River and associated streams (blue lines), cross-section line A-A’, and the topographic relief of the Nurabad site. Base map adapted from [25] and topographic relief derived from SRTM DEM data [26]. (b) The geological cross-section along line A-A’ shows the quaternary deposits (QII–QIV) within the model area. The prefixes p and a denote proluvial and alluvial deposits, respectively.
Water 17 02291 g002

3. Materials and Methods

3.1. Hydrogeological Data

The groundwater flow model was developed using hydrogeological data obtained from the monitoring and archival databases of the State Establishments “Institute of Hydrogeology and Engineering Geology (HYDROINGEO)” and “Uzbekhydrogeology”. These data include information from drill boreholes and wells, groundwater level measurements, aquifer hydraulic properties derived from pumping tests and soil analyses, river stage elevations, and quaternary deposit maps. Groundwater level data were categorized into two datasets:
  • Mean monthly groundwater levels from eight observation boreholes (2010–2020), used for steady-state model calibration.
  • Monthly groundwater levels from five observation boreholes over the same period, used for transient model calibration.
Base map data were obtained from the DIVA-GIS database [25], and topographic data were derived from the Shuttle Radar Topography Mission (SRTM) digital elevation model (DEM) [26].

3.2. Climate Data and Climate Scenarios

Daily precipitation and temperature data for the period 2010–2020 were obtained from the Angren weather station, located approximately 20 km east of the Nurabad settlement [10]. Future climate projections were obtained from the Coupled Model Intercomparison Project Phase 6 (CMIP6) under the high-emission scenario Shared Socioeconomic Pathway 5—Representative Concentration Pathway 8.5 (SSP5-8.5) [27,28], as provided by the World Bank Climate Change Knowledge Portal [29]. Given that 2024 was reported as the warmest year on record, with global average temperatures exceeding 1.5 °C above pre-industrial levels [30], this study focused on the SSP5-8.5 scenario. The climate dataset includes mean monthly precipitation and temperature from:
-
Simulated historical data for the period 1995–2014.
-
Scenario projections for 2020–2039, 2040–2059, 2060–2079, and 2080–2099.
Due to the limited availability of long-term daily measured data, the simulated historical monthly data (1995–2014) were compared with observed monthly data (2010–2020) to validate the model. The Delta method [11,13] was applied to transfer changes in temperature and precipitation from scenario data to the observed daily dataset. These adjusted daily datasets were subsequently used to estimate potential evapotranspiration (PET) and to conduct groundwater flow simulations.

3.3. Groundwater Flow Model

The groundwater flow modeling was conducted in three sequential steps:
Step 1. Steady-state simulation: A steady-state model was developed using mean daily climate data (precipitation and PET) from 2010 to 2020. Calibration was performed by adjusting horizontal hydraulic conductivity (Kh), recharge rates, and the conductance of general head boundaries (GHBs), stream, and riverbeds to match observed mean groundwater levels.
Step 2. Transient-state simulation of current climate condition: The transient model was initialized using the calibrated steady-state groundwater heads. The simulation covered a daily time step over 4018 days (1 January 2010 to 31 December 2020). Time-variable parameters were assigned based on observed climate data. Calibration was conducted against monthly groundwater level observations.
Step 3. Transient-state simulation of future climate scenarios: The calibrated transient model was then used to simulate groundwater responses under future climate scenarios for the periods 2020–2039, 2040–2059, 2060–2079, and 2080–2099. No further calibration was applied. The impacts of climate change on groundwater resources were assessed by comparing the mean monthly simulation results from each scenario period with the current condition (2010–2020).

3.3.1. Model Discretization

The groundwater flow model was developed using the finite-difference code MODFLOW-2005 [31], implemented through the Visual MODFLOW Flex (version 8) graphical interface. MODFLOW is a widely validated and extensively applied tool for simulating groundwater flow in heterogeneous aquifer systems. Due to the limited availability of data across the broader watershed, and the concentration of existing data mainly in the Nurabad area, the model domain was restricted to the Nurabad settlement (Figure 2). The model domain encompasses an area of approximately 64.0 km2 and is discretized into a uniform grid with a cell size of 100 m × 100 m, comprising 84 rows, 180 columns, and 3 vertical layers. The model layers represent the hydrostratigraphy of the shallow aquifer system: Layer 1 corresponds to the upper quaternary and recent river alluvial deposits (aQIII–IV), while Layers 2 and 3 represent the upper quaternary proluvial–alluvial deposits (paQIII). The middle quaternary proluvial–alluvial deposits (paQII) were excluded from the model due to their low hydraulic conductivity and poor water quality, characterized by excessive hardness and elevated TDSs, rendering them non-productive for groundwater abstraction.

3.3.2. Model Boundary Conditions and Hydraulic Parameters

Boundary conditions were defined using MODFLOW’s standard packages, including the general head boundary (GHB), river, drains, recharge, and well packages (Figure 2a). The locations of pumping wells are not disclosed and are, therefore, omitted from the figure. The boundary conditions are described as follows:
The general head boundary (GHB) was applied to all outer boundaries of the model domain to simulate lateral inflows and outflows. These include GHB East (upstream inflow), GHB West (downstream outflow), and GHB North and South (lateral inflows from side-valley alluvial fans and streams). The GHB requires specification of head stage and conductance values. Mean groundwater levels from 2010 to 2020 were used as head stage inputs. Conductance values were spatially variable and dependent on the aquifer material types at each boundary cell. Final conductance values were determined through model calibration.
The river boundary was assigned to the Akhangaran River in Layer 1. The Akhan-garan River is a braided river with some ephemeral sections. Only perennial sections of the braided river system were included in the model. River cells were simplified with a uniform width and length of 100.0 m and a depth of 2.0 m. River stage data were collected monthly and bi-monthly from 8 September 2022 to 8 November 2023 at a gauging station (Figure 2), with stage elevations ranging from 0.25 to 0.75 m (mean: 0.48 m; Figure 3). This mean value was applied in the steady-state model, while monthly averages were used in the transient simulations for both historical and future scenarios.
The drain boundary was assigned to streams in Layer 1, identified using watershed delineation in ArcMap’s Hydrology module. Drains allow groundwater to discharge only when the simulated groundwater level exceeds a threshold elevation, set at 1.0 m below the ground surface. Due to the absence of stream discharge data, drain fluxes were estimated using the hydraulic head difference between the groundwater and drain elevations, and the conductance of the soil at each drain cell, without applying any calibration.
The recharge boundary was applied to the top layer (Layer 1), representing direct infiltration from precipitation. As the aquifer is unconfined, recharge was modeled as net recharge, the portion of precipitation that reaches the water table after accounting for evapotranspiration and surface runoff. The initial recharge rates were estimated using a water balance approach, incorporating precipitation, potential evapotranspiration (PET), and soil-specific infiltration coefficients:
Recharge = (P − PET) × infiltration coefficient,
where P represents precipitation and PET denotes potential evapotranspiration. Daily weather parameters, including surface temperature and precipitation, were recorded at the Angren weather station. Daily PET (mm/d) was calculated using the temperature-based Hamon method [32] as follows:
PET = 29.8 × D × (ea/(T+ 273.2)),
where D denotes the day length (hours), T represents the mean daily temperature (°C), and ea refers to the saturation vapor pressure (kPa) corresponding to the mean daily temperature:
ea = 0.6108 exp (17.27 T/(T + 237.3)).
Initial infiltration coefficients were assigned based on soil texture, depth to the water table, and land use. For instance, a coefficient of 0.4 was applied to areas with porous sand and gravel, while a coefficient of 0.1 was used for fine-grained sediment zones. These coefficients were refined during model calibration in conjunction with the K values to derive final recharge estimates. The calibrated infiltration coefficients were subsequently used in the climate scenario simulations.
The well package was implemented to simulate groundwater abstraction from two pumping station networks. The first station, located southeast of observation borehole (Obs.) 111 (Figure 2a), consists of seven wells, each extracting approximately 4767.0 m3/d. The second station, situated northwest of Obs. 2c, comprises 16 wells, each with a pumping rate of approximately 4888.0 m3/d. All wells abstract water from Layer 2. Due to the unavailability of actual daily pumping records, a constant total abstraction rate of 111,577.0 m3/d, distributed across these 23 pumping wells, was applied uniformly in all simulations.
Hydraulic parameters were initially assigned based on sediment distribution and subsequently refined during model calibration. These parameters included horizontal saturated hydraulic conductivity (Kh), which ranged from 1.0 to 10.0 m/d in loamy sand and fine sand, and from 50.0 to 200.0 m/d in sand and gravel. Anisotropy (Kh/Kv) was set at 5.0 for coarse-grained sediments and 10.0 for fine-grained sediments. Effective porosity values ranged between 0.1 and 0.3, while specific storage (Ss) was set at 0.00001/m. Specific yield (Sy) values ranged from 0.1 to 0.28. These parameter values are consistent with typical ranges reported for unconfined aquifers [33].

3.3.3. Model Calibration

For the steady-state flow model, calibration was performed using both the Parameter ESTimation (PEST) software (version 18) [34] and manual trial-and-error methods. The calibration process involved adjusting parameters such as Kh values, recharge rates, and the conductance values of the GHB, stream, and riverbed boundaries. Calibration targets consisted of mean monthly groundwater levels from eight observation boreholes (111, 113, 148, 149, 2H/1p, 2c, 151, and 398; Figure 2). Calibration was considered satisfactory when the water balance discrepancy was less than 1.0% and the residual differences between measured and simulated heads were within 0.5 m. Model performance was evaluated using the root mean square error (RMSE):
R M S E = 1 n i = 1 n h o b s h s i m 2
where n, hobs, and hsim are the number of the observation, the measured head, and the simulated head, respectively. Lower RMSE values indicate a closer agreement between measured and simulated data, implying higher accuracy in model performance.
For the transient model representing current conditions from 2010 to 2020, calibration was conducted manually by adjusting recharge values in response to precipitation variability. Kh and GHB conductance values derived from the steady-state calibration were slightly modified to improve model performance. Effective porosity, specific yield, and specific storage values were held constant throughout the process. Monthly groundwater levels from five observation boreholes (111, 113, 149, 2H/1p, and 2c) served as calibration targets.
For future climate scenarios (2020–2039, 2040–2059, 2060–2079, and 2080–2099), the transient model was run without further calibration. The impacts of climate change were assessed by comparing the mean monthly values of key water balance components, e.g., recharge, riverbed leakage, stream discharge, GHB flow, and water storage, between the current (2010–2020) and the scenario periods.

4. Results

4.1. Climate Variables and Potential Evapotranspiration (PET)

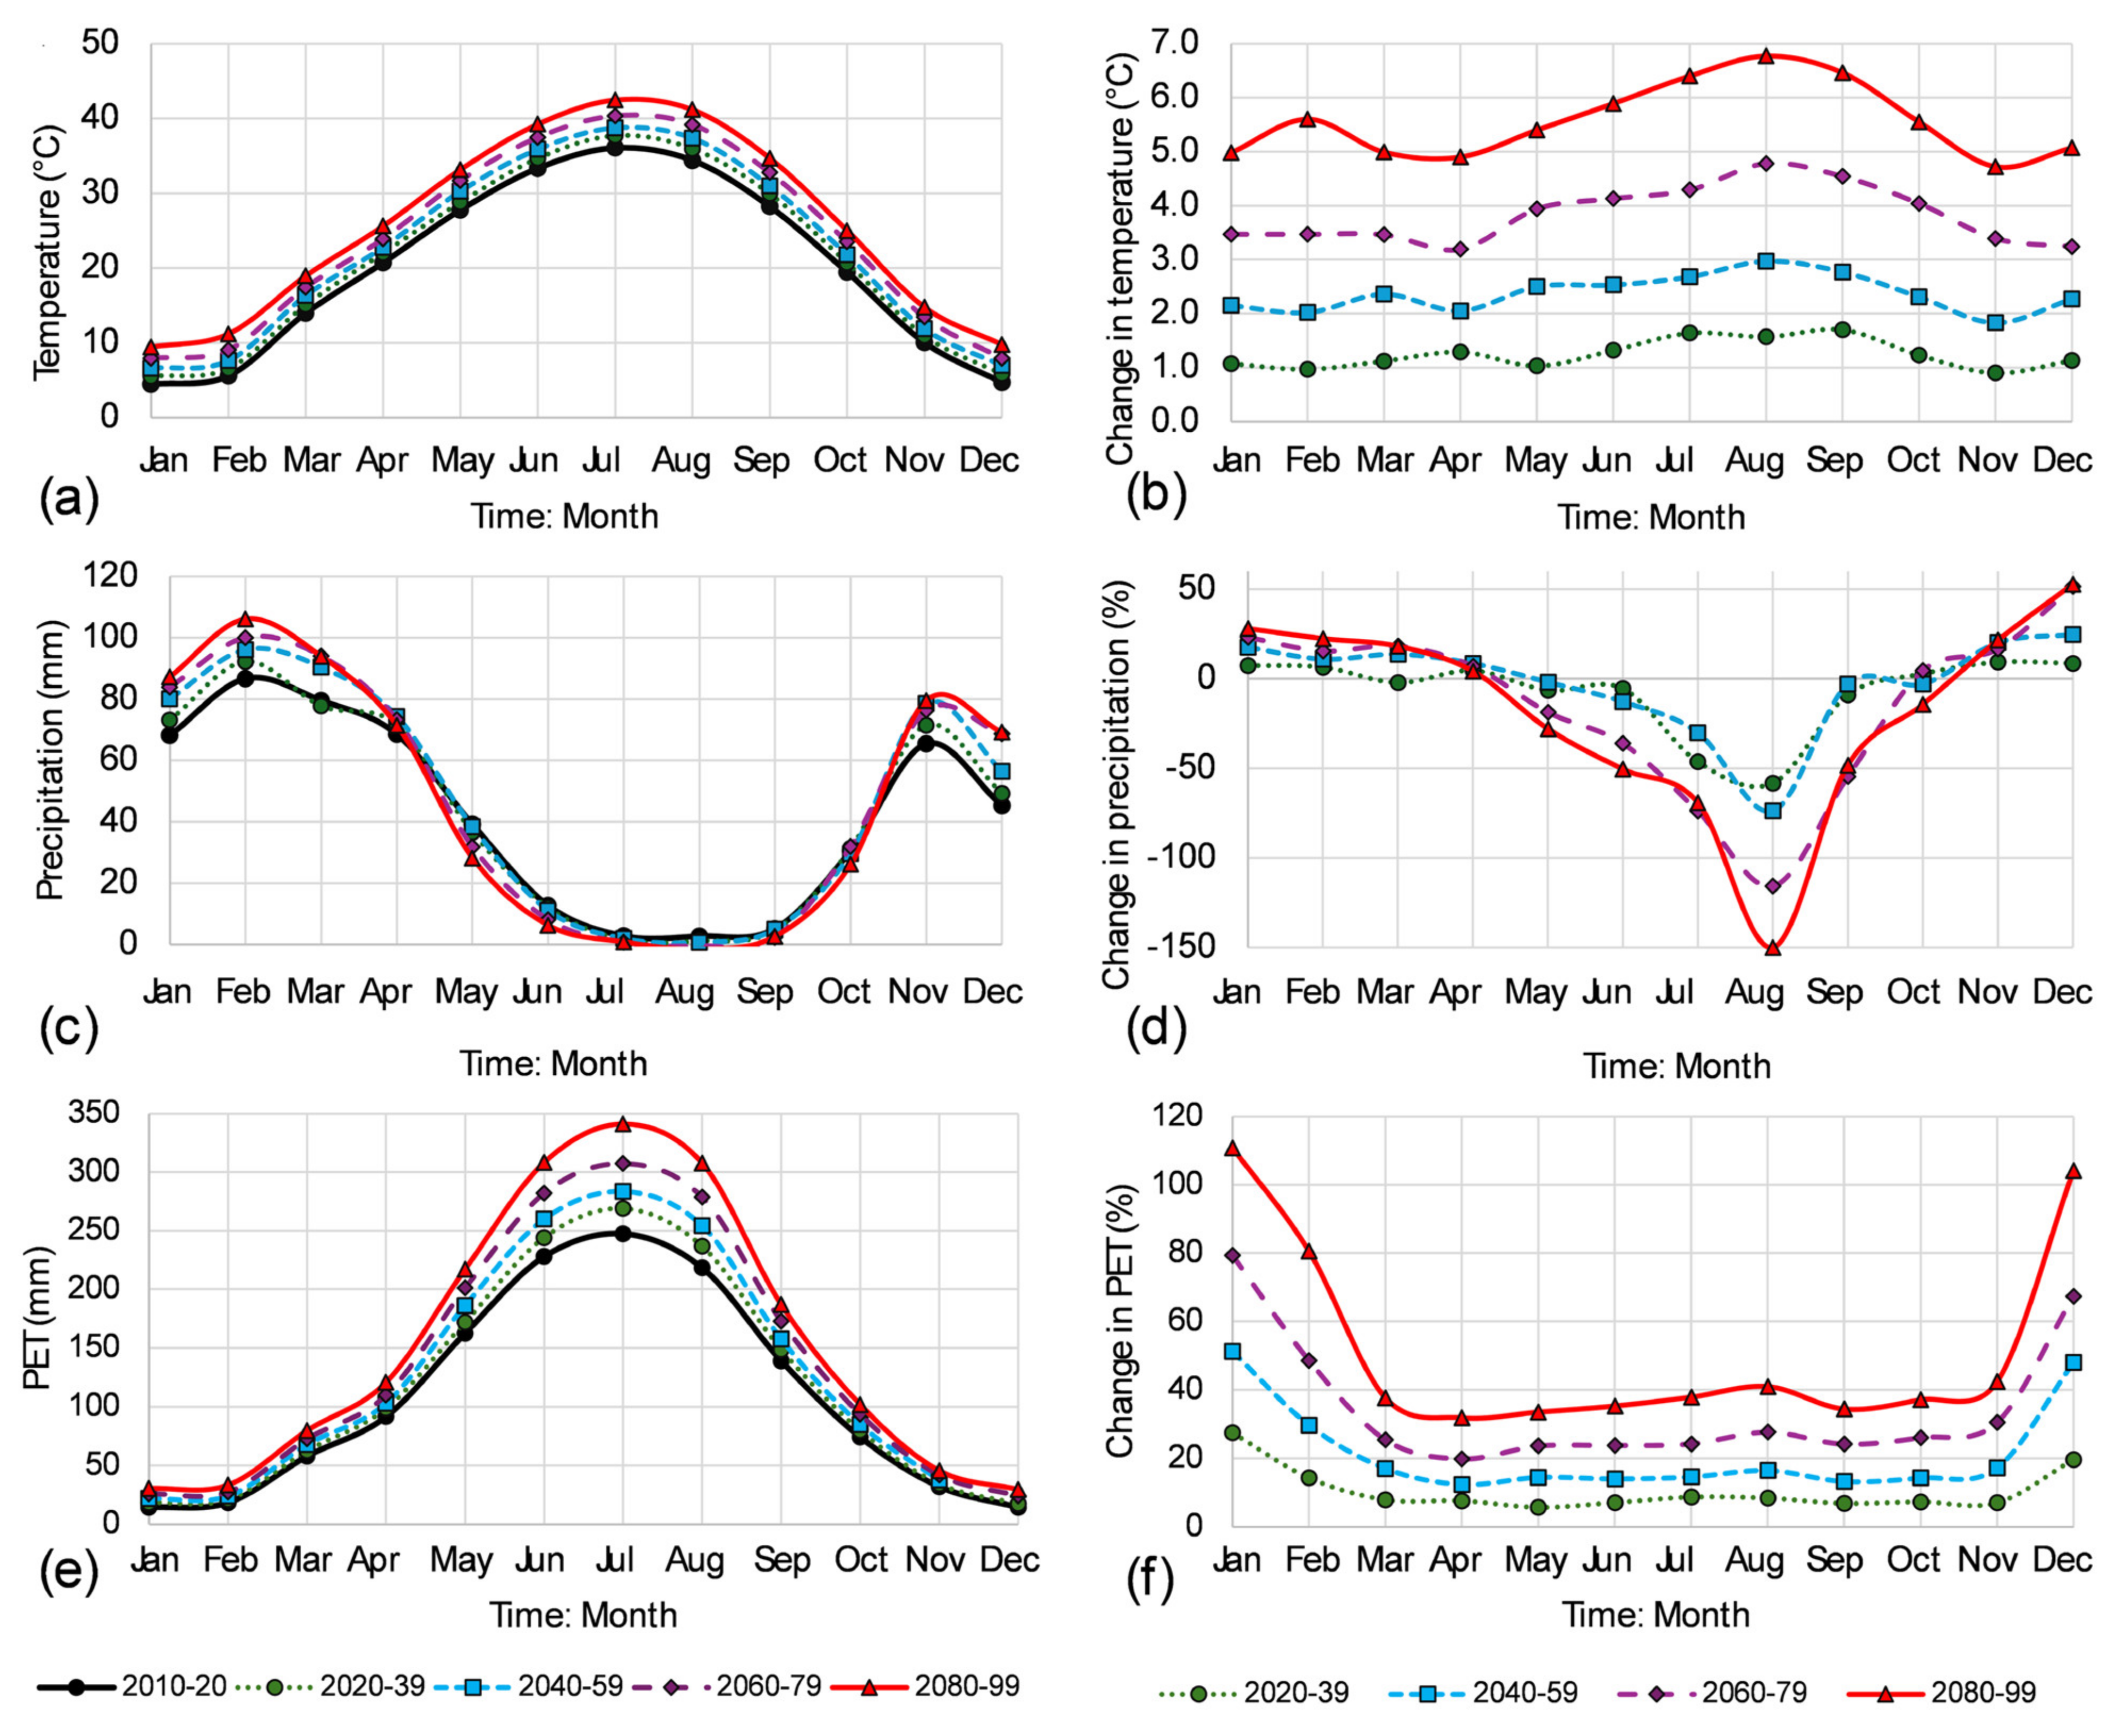
Under the high-emission scenario SSP5-8.5, projected changes in climate variables indicate a significant warming trend and seasonal shifts in precipitation and PET patterns for the period 2020–2099 compared with 2010–2020 (Figure 4a–f).
Mean temperatures are projected to increase by 0.9–6.8 °C across the scenario periods. The most pronounced warming is expected during the summer months (July to September), with the highest increase occurring in the 2080–2099 period, where mean temperatures rise by 4.7–6.8 °C compared with 2010–2020.
Precipitation projections exhibit strong seasonal variability. From May to October, mean precipitation is expected to decline by 1.9–153.8%, while from November to April, it is projected to increase by 7.2–52.8%. August consistently shows the greatest reduction in precipitation across all future periods, with decreases ranging from 58.3% to 153.8%.
PET is projected to increase steadily from March to November, with mean increases ranging from 10.0% in 2020–2039 to 35.0% in 2080–2099. The most substantial increases in PET are expected during the winter months (December to February), with projected increases ranging from 20.0% in the near term to 110.0% by the end of the century.
These changes suggest a future climate characterized by hotter and drier summers, wetter winters, and significantly higher evaporative demand, all of which have critical implications for groundwater recharge and availability.

4.2. Model Calibrations

4.2.1. Steady-State Flow

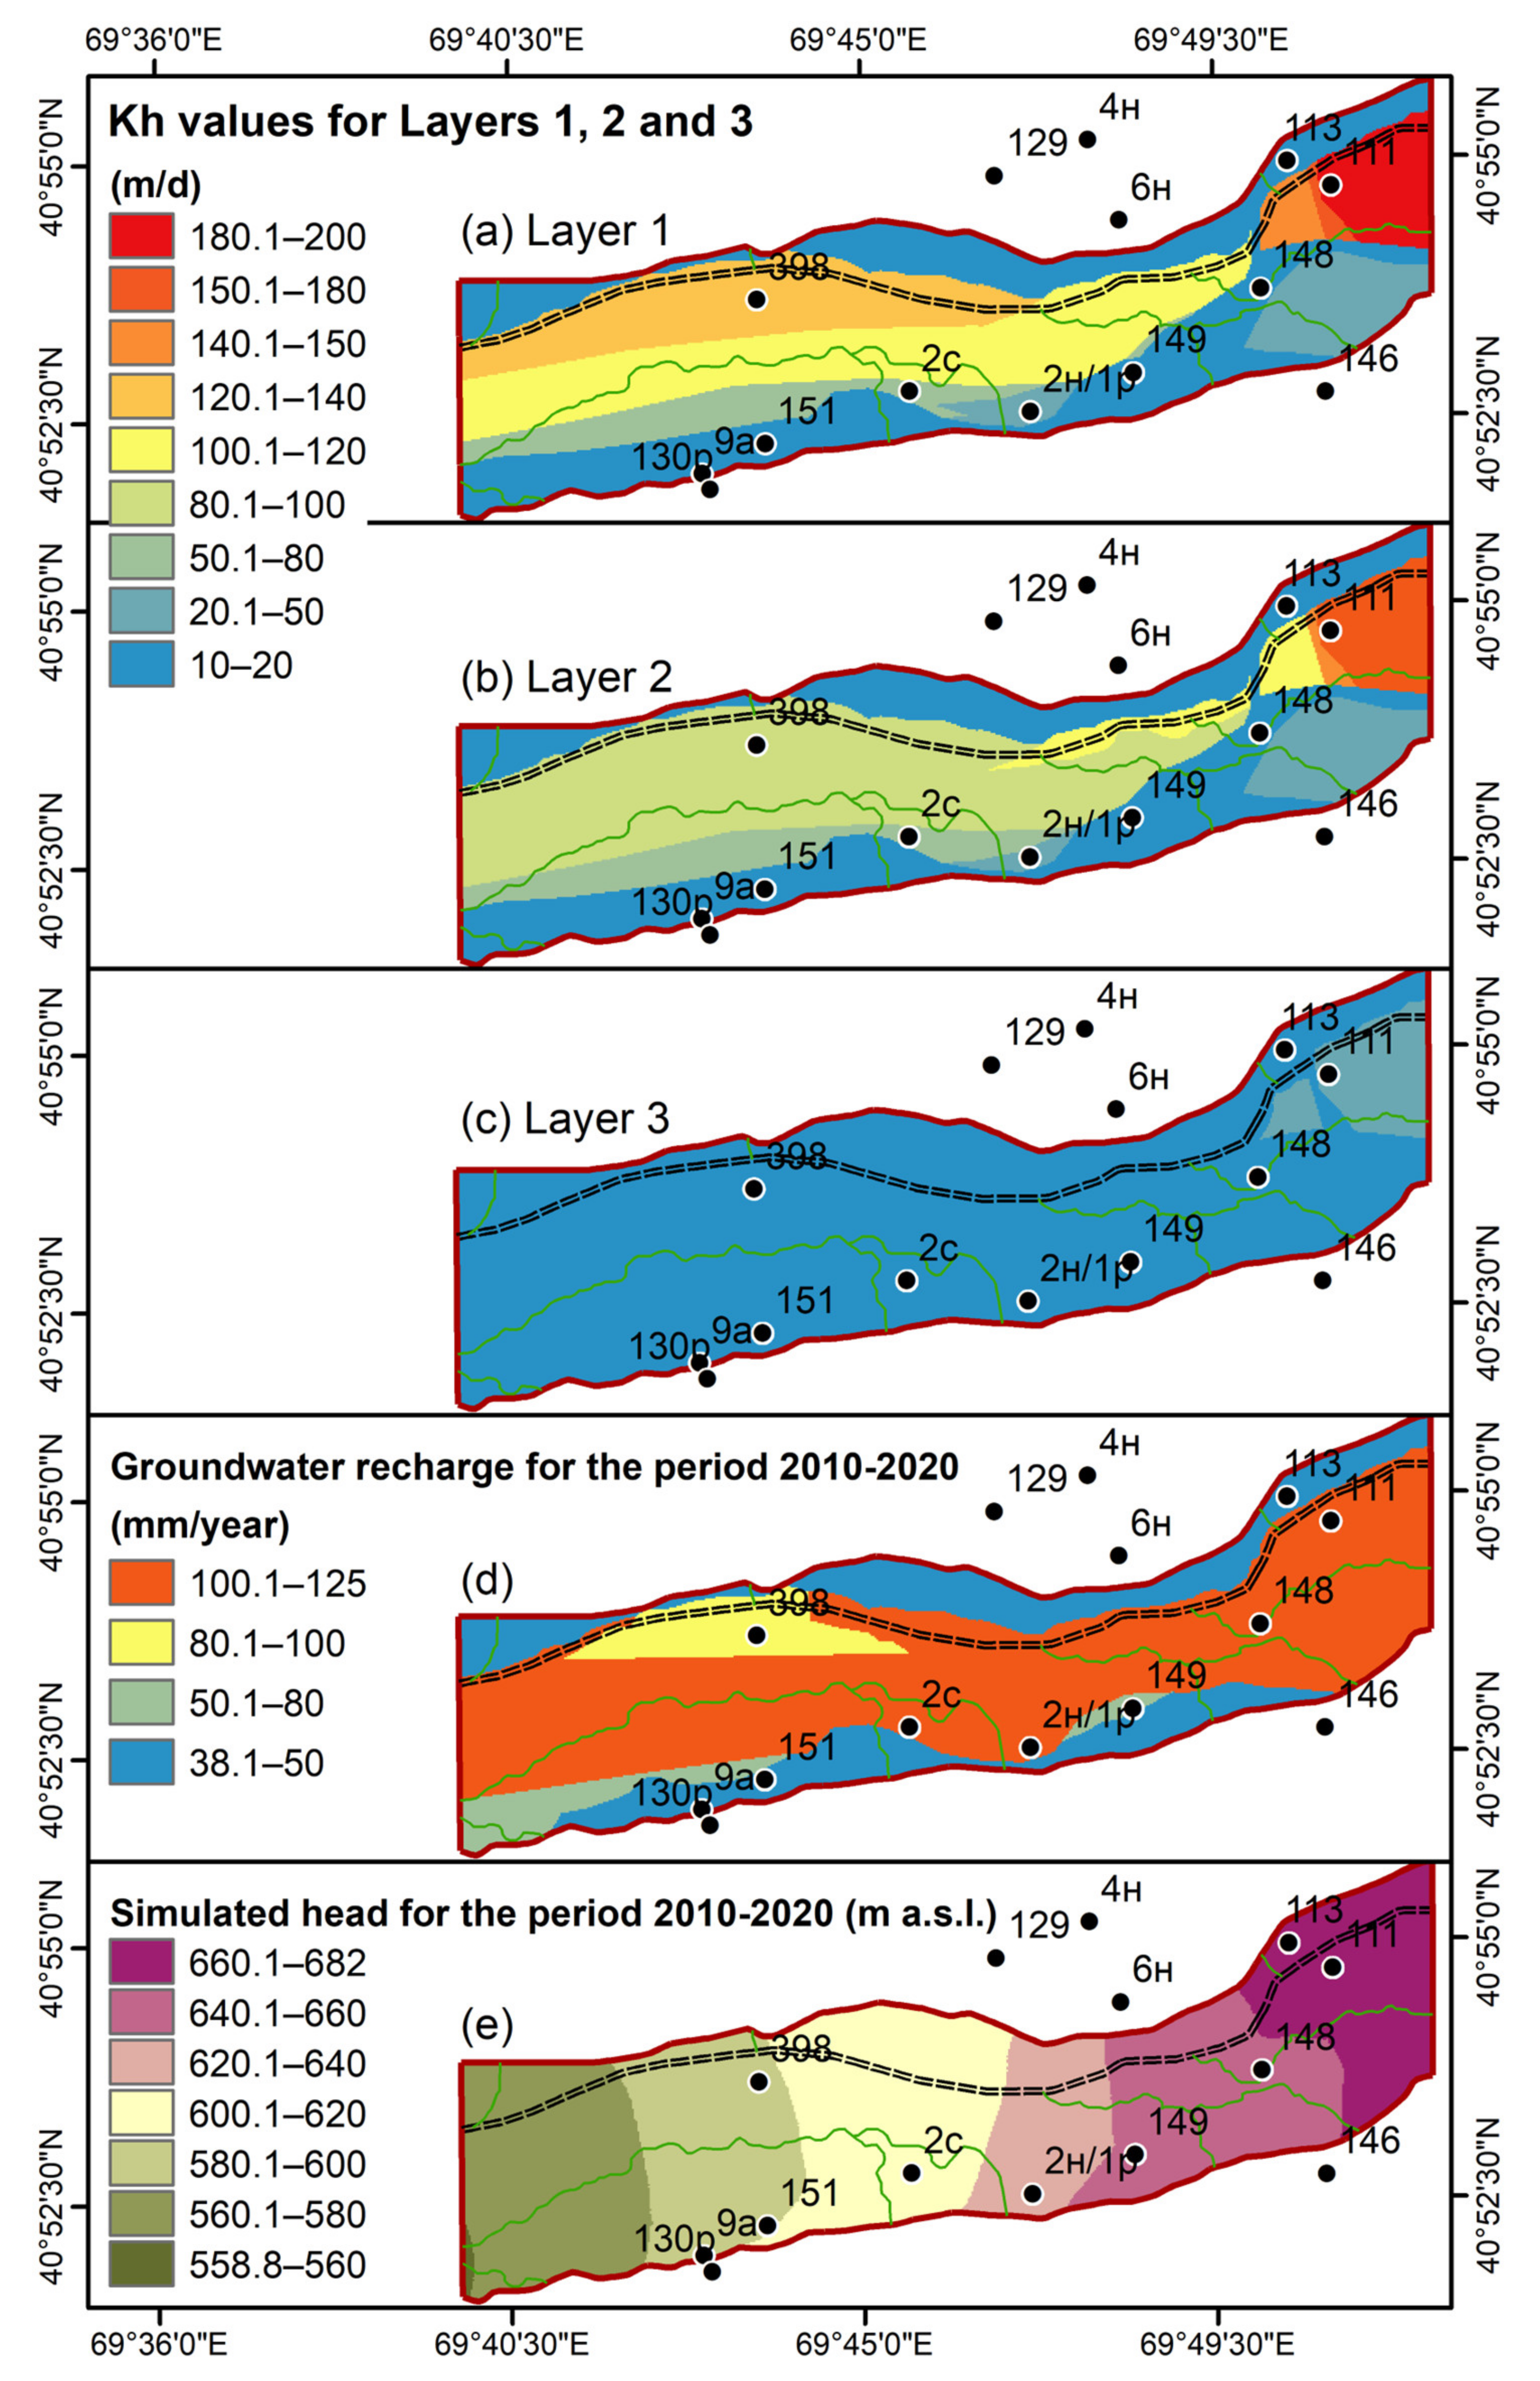
Figure 5 presents the comparison between measured and simulated heads, along with the residuals. The water balance error, defined as the difference between total inflow and outflow, is 0.0001%, and the RMSE is 0.07 m, which is considered acceptable under the steady-state condition. Table 1 summarizes the components of the water balance within the model domain for the period 2010–2020. Figure 6a–c illustrate the spatial distribution of calibrated Kh values for Layers 1 to 3, respectively. Figure 6d,e present the simulated groundwater recharge and hydraulic head, respectively, based on calibration using observational data from 2010 to 2020. The simulated mean annual recharge from precipitation varies spatially between 38.0 and 125.0 mm (Figure 6d), and the simulated mean groundwater level ranges from 558.8 to 682.0 m a.s.l. (Figure 6e), corresponding to the topographic features shown in Figure 2a.

4.2.2. Transient Flow During 2010–2020

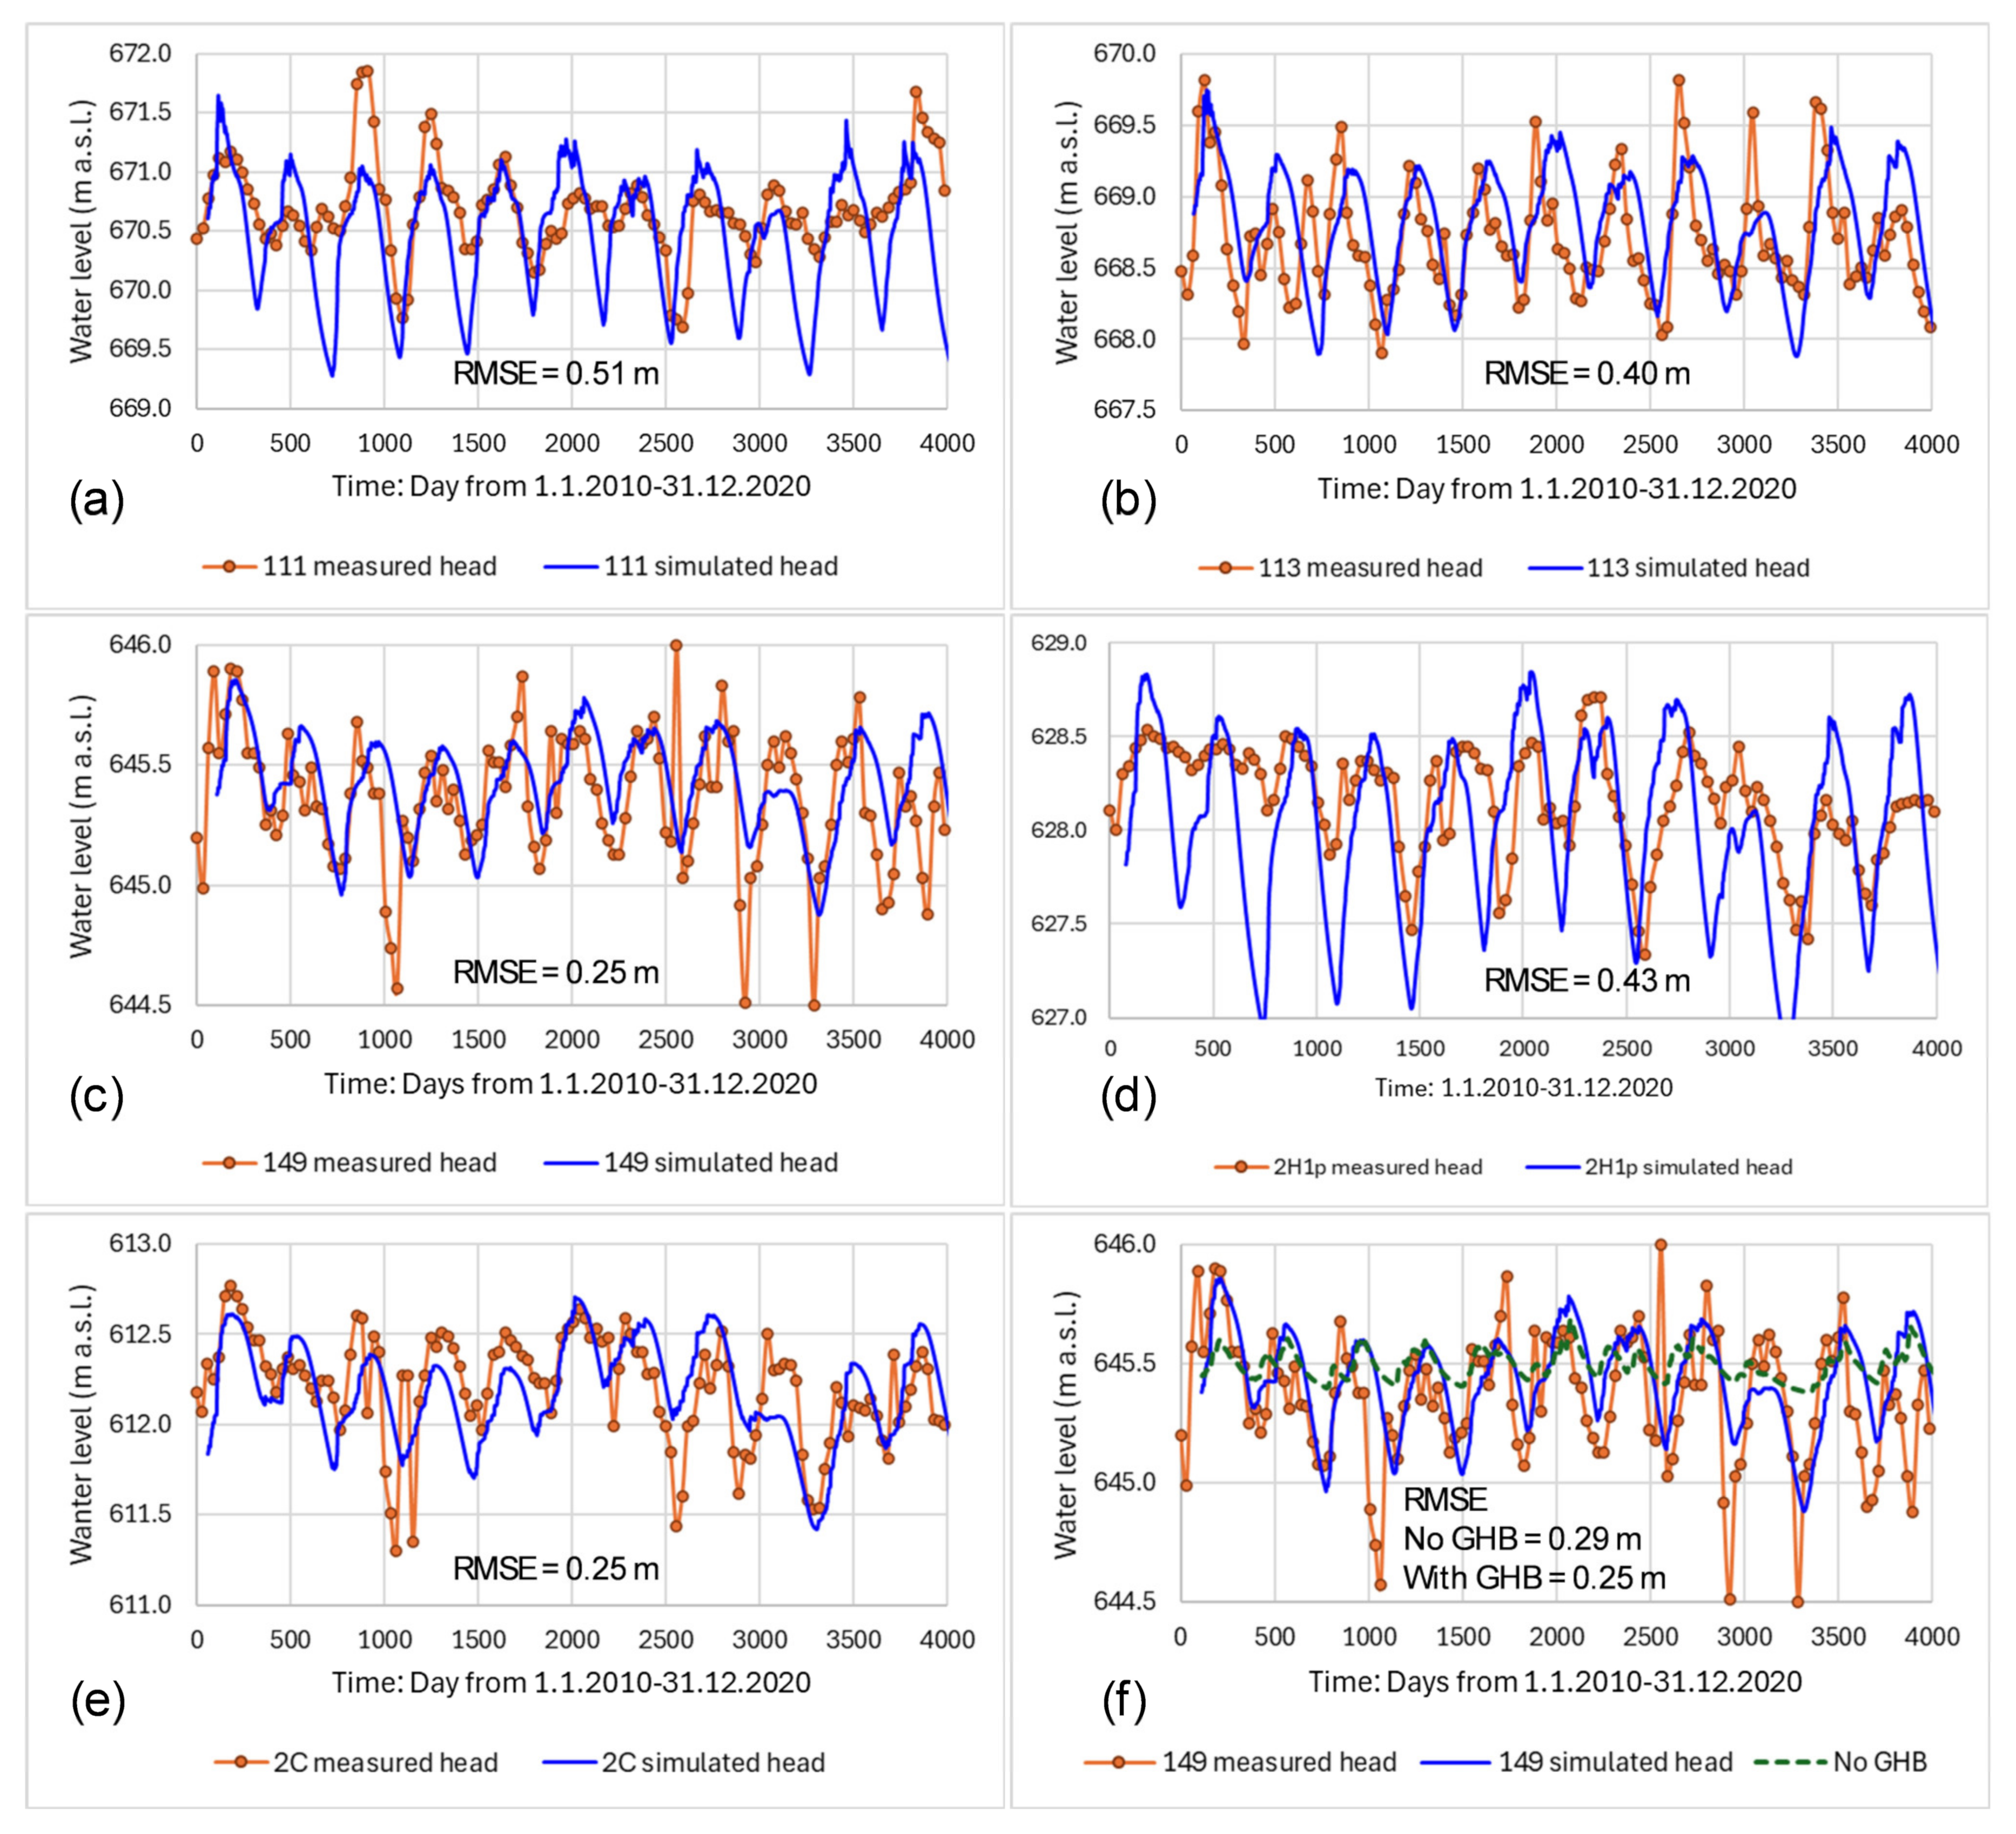
The performance of the transient groundwater flow model for the period 2010–2020 was evaluated by comparing simulated daily groundwater heads with observed monthly measurements (Figure 7). The model exhibited a high level of accuracy, with water balance errors ranging from –0.0001% to 0.0001%, and RMSE values between 0.25 m and 0.51 m. Although some discrepancies between simulated and measured heads were identified, likely attributable to model simplifications, such as the use of constant pumping rates and the complex geological heterogeneity of the aquifer, the overall model performance was acceptable for application in future climate scenario simulations. Figure 7f illustrates the influence of lateral boundary conditions by comparing simulated heads at Obs. 149 with and without the inclusion of the GHB at the northern and southern boundaries of the model domain. The exclusion of these boundaries resulted in reduced seasonal variability and a poorer fit with measured data. This highlights the importance of accounting for lateral inflows from side-valley alluvial deposits and ephemeral creeks in the model configuration.

4.3. Simulations of Climate Scenarios

4.3.1. Groundwater Recharge

The simulated mean annual groundwater recharge for the period 2010–2020 was approximately 120.0 mm, representing 24.7% of the total annual precipitation (507.0 mm; Figure 8a). Recharge exhibited strong seasonal variability, with the highest values occurring from November to April (11.8–24.5 mm) and minimal recharge from June to September (0.0–0.4 mm).
Under the SSP5-8.5 scenario, mean annual recharge increased across all future periods, reaching 132.8 mm (2020–2039), 151.3 mm (2040–2059), 157.2 mm (2060–2079), and 155.2 mm (2080–2099). These represent increases of approximately 7.8%, 19.1%, 22.7%, and 21.5%, respectively, compared with 2010–2020. Although the seasonal recharge pattern remained similar, the dry period extended from May to October, with no recharge occurring from June to August in the future scenarios (Figure 8b).

4.3.2. Riverbed Infiltration

Simulated riverbed infiltration during 2010–2020 ranged from 2020.0 to 4100.0 m3/d (Figure 9a). Infiltration rates were inversely related to groundwater levels: lower infiltration occurred during spring (February–April) when recharge and groundwater levels were high, while higher infiltration occurred during summer (July–November) when recharge was minimal.
Under the SSP5-8.5 scenario, riverbed infiltration rates declined across all future periods. The lowest rates were observed in 2080–2099, during which no infiltration occurred. This decline is attributed to increased temperatures and PET (Figure 4), which likely reduced river water levels. Despite higher recharge from November to March, elevated groundwater levels during this period may have reversed the hydraulic gradient, resulting in groundwater discharge to the river.

4.3.3. Drains

Under current conditions (2010–2020), the simulated groundwater discharge to streams averaged approximately 1304.2 m3/d, accounting for 0.6% of the total water budget (Table 1). The mean monthly groundwater discharge to streams ranged from 1179.9 m3/d in October to 1954.2 m3/d in May (Figure 10a). The highest discharge rates were observed during the spring months (March–May), reflecting seasonal recharge patterns. In contrast, the lowest discharge rates occurred in late summer and early autumn (September–October).
The simulation results under the SSP5-8.5 scenario indicate a progressive decline in groundwater discharge to streams over the 21st century, particularly during late summer and autumn. In the early decades (2020–2059), seasonal variations were modest, with slight increases in spring and moderate reductions in autumn. From 2060 onward, the decline became more consistent and pronounced. The most substantial reductions occurred during 2080–2099, with decreases observed across all months, especially in the summer period, where discharge declined by 23.0% to 28.3% from July to October (Figure 10b), reflecting intensified summer drought conditions and reduced recharge.

4.3.4. General Head Boundary (GHB) Fluxes

Simulated lateral fluxes through the GHB are presented in Figure 11. Inflows occurred through the GHB East, South, and North, while outflows occurred via the GHB West. The GHB East contributed the largest share of inflow (51.8%), primarily sustained by releases from the Akhangaran Reservoir (Table 1 and Figure 11a). The GHB South accounted for 32.4% of inflow, representing lateral contributions from side-valley alluvial deposits (Figure 11c). The GHB North contributed the least, likely due to urban and industrial development limiting infiltration (Figure 11f). Seasonal variability was observed in the GHB East and South, with higher fluxes from October to May and lower fluxes from June to September. In contrast, the GHB North and West exhibited minimal seasonal variation. Under the SSP5-8.5 scenario, inflows through the GHB East and South declined in all future periods (except January and November), with reductions ranging from 0.2% to 7.3% (East) and 0.1% to 14.4% (South) compared with 2010–2020 (Figure 11b,d).

4.3.5. Change in Water Storage

Simulated changes in water storage (In–Out) under current conditions (2010–2020) showed clear seasonal trends. Positive storage occurred from May to September, following recharge events, while negative storage was observed from October to April (Figure 12a). The annual net water storage was estimated at 0.18 Mm3/year (Figure 12c). Under the SSP5-8.5 scenario, water storage increased substantially in May, with gains ranging from 31.7% to 91.6% compared with 2010–2020 (Figure 12b). However, storage declined from November to March by 6.4% to 54.1%. On an annual basis, net water storage decreased by 7.3%, 58.3%, 52.6%, and 33.5% for the periods 2020–2039, 2040–2059, 2060–2079, and 2080–2099, respectively, compared with 2010–2020 (Figure 12d).

4.4. Model Limitations

The model was developed using limited and spatially sparse data, which introduced several uncertainties and limitations, as outlined below:
-
Several input parameters were held constant across all simulations, including groundwater pumping rates, mean monthly river stage elevations, and land use patterns. These parameters are subject to change over time and may significantly influence groundwater recharge and storage estimates.
-
Although the model was successfully calibrated against available groundwater level measurements, key boundary conditions remain uncertain. For example, the side-valley alluvial deposits represented by the GHB in the southern part of the domain currently show a disproportionately high contribution to the water budget. Similarly, the river boundary conditions are uncertain due to the lack of concurrent measurements of river stage and groundwater levels, making it difficult to accurately characterize river and aquifer interactions.
-
The groundwater level data used for calibration were collected on a monthly basis, and no river stage or stream discharge data were available for the corresponding period.
-
Due to the absence of stream discharge measurements, streamflow-related outputs were derived solely from model simulations based on assumptions, thereby increasing the uncertainty of the results.
Given these limitations, the simulation results should be interpreted with caution. Additional data collection, such as long-term monitoring of groundwater levels, river stage elevations, stream discharge rates, and relevant climate variables, is essential to improve model reliability and validate the simulated outputs, particularly in boundary areas.

5. Discussion

5.1. Components of Water Budget

The simulation results indicate that the total groundwater inflow within the model domain under the current condition (2010–2020) was 217,450.6 m3/d (2.52 m3/s). This value exceeds previous estimates of aquifer capacity, such as 152,000.0 m3/d (1.76 m3/s) reported by Gracheva [35], and the approved reserve for the Akhangaran water intake wells, which is 112,320.0 m3/d (1.30 m3/s) [9]. The discrepancy of approximately 65,200 m3/d (0.75 m3/s) highlights the need for further investigation and validation. The water budget components (Table 1) indicated that the primary sources of inflow are lateral contributions from the GHB in the east and the side-valley alluvial deposits in the GHB South. Minor inflows include recharge from precipitation and riverbed leakage. Groundwater recharge from precipitation was estimated at 14,937.7 m3/day (0.17 m3/s), based on constraints from climate data, borehole analysis, and observed groundwater levels, suggesting a relatively robust estimation. However, this recharge alone is insufficient to meet the current pumping rate of 111,577.0 m3/d (1.29 m3/s).
The GHB East inflow, primarily driven by upstream lateral flows and leakage from the Akhangaran River, fed by releases from the Akhangaran Reservoir, was estimated at 112,745.8 m3/d (1.3 m3/s), representing approximately 5.7% of the reservoir’s average daily release of 2.0 Mm3/d (23.0 m3/s) [24]. The influence of lateral inflows from side-valley alluvial deposits was clearly demonstrated in the simulation results (Figure 7f), confirming their critical role in sustaining the aquifer. This finding is consistent with previous studies that have identified side-valley alluvial fans as important contributors to river valley aquifers [36,37,38,39,40]. However, the magnitude of these inflows is highly dependent on the sedimentary complexity of the alluvial fan systems. For example, in arid regions of the southwestern United States, seasonal discharge from ephemeral or intermittent streams in alluvial watersheds can range from 17,280.0 m3/d during dry seasons to 6.9 Mm3/d during wet seasons [41], with a portion of this water infiltrating into the underlying aquifers.
Despite these insights, the model is constrained by a lack of critical observational data, particularly river stage elevations and stream discharge fluxes. Long-term monitoring of groundwater levels, river stages, and climate variables is essential for improving model reliability and validating the simulated water budget under both current and future conditions.

5.2. Impacts of Climate Change Scenarios on Groundwater Resources

Simulations under future climate scenario SSP5-8.5 indicated reductions in groundwater storage ranging from 7.3% to 58.3% relative to current conditions. While changes below 5% fall within the model’s uncertainty range [11], larger reductions suggest significant climate-induced impacts on groundwater availability. Projected increases in temperature and decreases in precipitation across Central Asia are expected to reduce snow accumulation in mountainous regions [4,5], thereby diminishing inflows to surface water systems and aquifers. The Akhangaran Reservoir, a key source of recharge via riverbed leakage, is also vulnerable to climate change. Rising temperatures will increase evaporation from the reservoir surface, reducing water levels and storage volumes [42]. Additionally, sedimentation is projected to reduce the reservoir’s storage capacity by 39.45% by 2072 [43], further limiting water availability for downstream users and aquifer recharge.
Groundwater systems in semi-arid regions are particularly vulnerable to climate change due to their dependence on episodic recharge events and limited surface water availability [44]. Deshmukh et al. [44] emphasized that increased evapotranspiration and altered precipitation timing can significantly reduce infiltration and percolation, leading to long-term declines in groundwater storage. This aligns with the findings of this study, where recharge ceased entirely during the summer months under future climate scenarios.
The simulations also showed that groundwater discharge to streams will decline progressively over the century, particularly during the summer months, reflecting intensified drought conditions and reduced recharge. These seasonal declines could exacerbate water shortages during peak demand periods. Given the projected reductions in recharge and inflow, the current pumping rates and land use patterns may not be sustainable. Water supply strategies must incorporate seasonal variability in the water budget, potentially by limiting summer abstraction or increasing reservoir releases.
Davamani et al. [45] reviewed the role of numerical models in assessing groundwater vulnerability and highlighted the importance of incorporating spatial heterogeneity, land use dynamics, and adaptive capacity. While this study included spatially variable recharge and hydraulic conductivity, future work could benefit from integrating land use change scenarios and socioeconomic drivers to enhance predictive accuracy.
The simulations highlight the importance of maintaining continuous inflows from the Akhangaran Reservoir, not only for irrigation but also for sustaining aquifer recharge via river and drainage canal infiltration. The use of porous materials in canal design could enhance this recharge function.
Global simulations have documented the non-linear relationship between precipitation and recharge, where even modest reductions in rainfall can lead to disproportionately large declines in recharge due to threshold effects in soil moisture and runoff generation [46]. This may explain the sharp seasonal contrasts observed in this study, where winter recharge increased slightly, but summer recharge dropped to zero.
The projected reduction in groundwater storage of up to 58.3% under SSP5-8.5 is consistent with findings from other regional and international studies. For instance, Luoma and Okkonen [11] used a similar MODFLOW-based approach to assess climate change impacts on a coastal aquifer in southern Finland and reported significant seasonal shifts in recharge and groundwater levels. Scibek and Allen [13] demonstrated that climate-induced changes in recharge can lead to substantial groundwater declines, particularly in unconfined aquifers in semi-arid regions. Okkonen and Kløve [12] emphasized the role of snowmelt and seasonal variability in groundwater–surface water interactions, which is relevant to the recharge dynamics observed in the Akhangaran River Valley.
A recent review by Davamani et al. [45] noted that climate change impacts on groundwater are often underestimated due to uncertainties in recharge estimation, land use changes, and model assumptions. They advocate for the use of transient, high-resolution models, such as the one developed in this study, to better capture the temporal dynamics of groundwater systems under stress. Similarly, Deshmukh et al. [44] observed that in semi-arid regions, increased evapotranspiration and reduced infiltration during prolonged dry seasons can significantly reduce groundwater availability, even when annual precipitation remains relatively stable. This is consistent with the finding that no recharge occurred from June to August under future scenarios.
Overall, the findings underscore the importance of integrated water resource management, including enhanced data collection, improved coordination among water users and stakeholders, and adaptive planning. These findings reinforce the need for adaptive groundwater management strategies that account for seasonal variability, climate extremes, and long-term trends. This study contributes to the growing body of knowledge by providing the first site-scale, transient MODFLOW simulation of climate change impacts on groundwater in the Akhangaran River Valley.
The groundwater flow model developed in this study provides a valuable framework for evaluating future climate scenarios and identifying areas requiring detailed site-specific investigations. Expanding the application of such models to other regions in Uzbekistan and Central Asia will be essential for supporting sustainable groundwater management under changing climatic conditions.

6. Conclusions

This study developed a three-dimensional transient groundwater flow model using MODFLOW to assess the sensitivity of the Akhangaran River alluvial aquifer to boundary conditions and to evaluate the potential impacts of climate change on groundwater recharge and availability. Climate projections from CMIP6 global models under the high-emission SSP5-8.5 scenario (2020–2099) were used to estimate potential evapotranspiration and simulate water budget components, which were compared with observed conditions from 2010 to 2020. The simulation results indicated that the main sources of groundwater inflow were lateral contributions from the upstream general head boundary (GHB) East and the side-valley alluvial deposits in the GHB South, together accounting for 84.2% of total inflow. In contrast, direct recharge from precipitation and riverbed infiltration contributed only 11.4% of the total water budget. Groundwater outflows were primarily composed of abstraction, downstream discharge via the GHB West, stream discharge, and evapotranspiration losses.
The model simulations under future climate scenarios indicated significant seasonal shifts in groundwater recharge. Recharge was projected to increase during the winter and early spring months (November–April) by 0.4% to 68.3%, while it declined markedly during the extended summer period (May–October), with reductions ranging from 0.4% to 100.0%. Notably, no recharge occurred from June to August under future scenarios, revealing the aquifer’s vulnerability to prolonged dry periods. Under the current groundwater abstraction rates and land use configuration, the simulations projected a decline in water storage, suggesting that the Akhangaran River alluvial aquifer may face a future water shortage crisis. These findings highlight the urgent need to address challenges related to water supply reliability and long-term aquifer sustainability.
To enhance the accuracy and reliability of future assessments, further site-specific investigations are recommended, particularly in the GHB South region, to validate lateral inflows from side-valley alluvial deposits. Long-term monitoring of groundwater levels, river and stream stage elevations and fluxes, as well as key climate variables, is essential for improving the understanding of surface–groundwater interactions and the aquifer’s response to climate variability. This study highlights the importance of integrated water resource management and the development of adaptive strategies to ensure the sustainable use of groundwater under changing climatic conditions. The modeling framework presented here provides a valuable tool for assessing groundwater systems and supporting water management decisions in other regions of Uzbekistan and Central Asia.

Author Contributions

Conceptualization, all; data curation, D.A., B.A. (Botirjon Abdullaev) and I.G.; formal analysis, D.A. and S.L.; funding acquisition, S.L.; investigation, all; methodology, all; project administration, A.K., S.L. and B.A. (Botir Akramov); resources, all; software, all.; supervision, S.L.; validation, D.A., I.G. and S.L.; visualization, D.A. and S.L.; writing—original draft, D.A. and S.L.; writing—review and editing, S.L. All authors have read and agreed to the published version of the manuscript.

Funding

This research received no external funding.

Data Availability Statement

The data that support the findings of this study are available from the corresponding author upon reasonable request.

Acknowledgments

This work resulted from the “Strengthening the mastering of natural resources for national welfare in Uzbekistan (ICI-UM-Uzbekistan)” project during 2022–2024, a cooperation project among the Geological Survey of Finland (GTK), State Establishment “Institute of Hydrogeology and Engineering Geology (HYDROINGEO)”, and State Establishment “Uzbekhydrogeology”, the Ministry of Mining Industry and Geology of the Republic of Uzbekistan. The project is financed by the Institutional Cooperation Instrument (ICI) of the Ministry for Foreign Affairs of Finland (MFA). The authors thank the editor and the reviewers for their constructive comments.

Conflicts of Interest

The authors declare no conflicts of interest.

References

  1. Beck, H.E.; Zimmermann, N.E.; McVicar, T.R.; Vergopolan, N.; Berg, A.; Wood, E.F. Present and future Köppen-Geiger climate classification maps at 1-km resolution. Sci. Data 2020, 7, 274. [Google Scholar] [CrossRef]
  2. Hu, Q.; Han, Z. Northward expansion of desert climate in Central Asia in recent decades. Geophys. Res. Lett. 2022, 49, e2022GL098895. [Google Scholar] [CrossRef]
  3. Hoegh-Guldberg, O.; Jacob, D.; Taylor, M.; Bindi, M.; Brown, S.; Camilloni, I.; Diedhiou, A.; Djalante, R.; Ebi, K.L.; Engelbrecht, F.; et al. Impacts of 1.5 °C Global Warming on Natural and Human Systems. In Global Warming of 1.5 °C. An IPCC Special Report on the Impacts of Global Warming of 1.5 °C Above Pre-Industrial Levels and Related Global Greenhouse Gas Emission Pathways, in the Context of Strengthening the Global Response to the Threat of Climate Change, Sustainable Development, and Efforts to Eradicate Poverty; Masson-Delmotte, V., Zhai, P., Pörtner, H.-O., Roberts, D., Skea, J., Shukla, P.R., Pirani, A., Moufouma-Okia, W., Péan, C., Pidcock, R., et al., Eds.; Cambridge University Press: Cambridge, UK; New York, NY, USA, 2018; pp. 175–312. [Google Scholar] [CrossRef]
  4. Fallah, B.; Didovets, I.; Rostami, M.; Hamidi, M. Climate change impacts on Central Asia: Trends, extremes and future projections. Int. J. Climatol. 2024, 44, 3191–3213. [Google Scholar] [CrossRef]
  5. The World Bank Group and the Asian Development Bank. Climate Risk Country Profile: Uzbekistan. 2021. Available online: https://www.adb.org/sites/default/files/publication/736686/climate-risk-country-profile-uzbekistan.pdf (accessed on 11 June 2023).
  6. Gafforov, K.S.; Bao, A.; Rakhimov, S.; Liu, T.; Abdullaev, F.; Jiang, L.; Durdiev, K.; Duulatov, E.; Rakhimova, M.; Mukanov, Y. The Assessment of Climate Change on Rainfall-Runoff Erosivity in the Chirchik–Akhangaran Basin, Uzbekistan. Sustainability 2020, 12, 3369. [Google Scholar] [CrossRef]
  7. Punkari, M.; Droogers, P.; Immerzeel, W.; Korhonen, N.; Lutz, A.; Venäläinen, A. Climate Change and Sustainable Water Management in Central Asia; Asian Development Bank. 2014. Available online: https://www.adb.org/sites/default/files/publication/42416/cwa-wp-005.pdf (accessed on 11 June 2023).
  8. Abdullaev, B.D.; Andreev, D.N. To the Question of the Device of Water deposits of the Gallery Type on the Wells of the Sartamgala Plot (in Russia with English summary). Sci. New Technol. Innov. Kyrg. J. 2019, 4, 201–204. Available online: http://www.science-journal.kg/media/Papers/nntiik/2019/4/201-204.pdf (accessed on 27 March 2023).
  9. Sobirovich, F.A.; Turdikulovich, K.S. The use of water resources in the Akhangaran Basin in the Almalyk-Akhangaran Industrial Region. Nat. Sci. 2022, 20, 44–51. [Google Scholar]
  10. Weather and Climate. The Global Historical Weather and Climate Data: Historical Weather Data from January 2010–December 2020. Available online: https://weatherandclimate.com/uzbekistan/tashkent/angren (accessed on 20 October 2024).
  11. Luoma, S.; Okkonen, J. Impacts of Future Climate Change and Baltic Sea Level Rise on Groundwater Recharge, Groundwater Levels, and Surface Leakage in the Hanko Aquifer in Southern Finland. Water 2014, 6, 3671–3700. [Google Scholar] [CrossRef]
  12. Okkonen, J.; Kløve, B. A sequential modeling approach to assess groundwater-surface water resources in a snow dominated region of Finland. J. Hydrol. 2011, 411, 91–107. [Google Scholar] [CrossRef]
  13. Scibek, J.; Allen, D.M. Modeled Impacts of Predicted Climate Change on Recharge and Groundwater Levels. Water Resour. Res. 2006, 42, 1–18. [Google Scholar] [CrossRef]
  14. Jyrkama, M.I.; Sykes, J.F.; Normani, S.D. Recharge estimation for transient ground water modelling. Ground Water 2002, 40, 639–649. [Google Scholar] [CrossRef]
  15. Luoma, S.; Majaniemi, J.; Pullinen, A.; Mursu, J.; Virtasalo, J.J. Geological and groundwater flow model of a submarine groundwater discharge site at Hanko (Finland), northern Baltic Sea. Hydrogeol. J. 2021, 29, 1279–1297. [Google Scholar] [CrossRef]
  16. Rakhmatova, N.; Nishonov, B.E.; Kholmatjanov, B.M.; Rakhmatova, V.; Toderich, K.N.; Khasankhanova, G.M.; Shardakova, L.; Khujanazarov, T.; Ungalov, A.N.; Belikov, D.A. Assessing the Potential Impacts of Climate Change on Drought in Uzbekistan: Findings from RCP and SSP Scenarios. Atmosphere 2024, 15, 866. [Google Scholar] [CrossRef]
  17. Hamidov, A.; Khamidov, M.; Ishchanov, J. Impact of Climate Change on Groundwater Management in the Northwestern Part of Uzbekistan. Agronomy 2020, 10, 1173. [Google Scholar] [CrossRef]
  18. Kulmatov, R.; Groll, M.; Rasulov, A.; Soliev, I.; Romic, M. Status quo and present challenges of the sustainable use and management of water and land resources in Central Asian irrigation zones—The example of the Navoi region (Uzbekistan). Quat. Int. 2018, 464, 396–410. [Google Scholar] [CrossRef]
  19. Rakhmatullaev, S.; Huneau, F.; Kazbekov, J.; Celle-Jeanton, H.; Motelica-Heino, M.; Coustumer, P.L.; Jumanov, J. Groundwater resources of Uzbekistan: An environmental and operational overview. Cent. Eur. J. Geosci. 2012, 4, 67–80. [Google Scholar] [CrossRef]
  20. Ibrakhimov, M.; Martius, C.; Lamers, J.P.A.; Tischbein, B. The dynamics of groundwater table and salinity over 17 years in Khorezm, Uzbekistan. Agric. Water Manag. 2011, 101, 52–61. [Google Scholar] [CrossRef]
  21. Rysbekov, Y. Analysis of water management organizations in Chirchik-Akhangaran river basin (Central Asia): 1. Chirchik-Akhangaran basin water resources (CHAB). In A Regional Model for Integrated Water Management in Twinned River Basins “RIVERTWIN”, Tashkent; Dukhovny, V.A., Ed.; Publications in open sources; SIC ICWC: Tashkent, Uzbekistan, 2008; p. 188. Available online: http://www.cawater-info.net/rivertwin/documents/monograph.htm (accessed on 20 October 2024).
  22. Asian Development Bank. Uzbekistan: Second Tashkent Province Water Supply Development Project. Initial Environmental Examination (June 2018). Available online: https://www.adb.org/sites/default/files/project-documents/51240/51240-001-iee-en.pdf (accessed on 28 July 2023).
  23. Golovanov, I.M.; Seltmann, R.; Kremenetsky, A.A. The Porphyry Cu-Au/Mo Deposits of Central Eurasia: 2 The Almalyk (Kal’makry-Dalnee) and Saukbulak Cu-Au Porphyry Systems, Uzbekistan. In Super Porphyry Copper & Gold Deposits: A Global Perspective; Porter, T.M., Ed.; PGC Publishing: Adelaide, Australia, 2005; Volume 2, pp. 513–523. [Google Scholar]
  24. GIBB and SMEC. Aral Sea Basin Program Water and Environmental Management Project, Component C: Dam Safety and Reservoir Management, Akhangaran Dam Safety Assessment Report; LAWGIBB Group Member and SMEC: Tashkent, Uzbekistan, 2000; p. 39. Available online: http://www.cawater-info.net/bk/dam-safety/files/akhangaran-dam-en.pdf (accessed on 11 June 2023).
  25. DIVA-GIS. Free, Simple and Effective Spatial Data. Available online: https://diva-gis.org/data.html (accessed on 28 July 2023).
  26. USGS Earth Explorer. The Shuttle Radar Topography Mission (SRTM) Digital Elevation Model Data, US Geological Survey. Available online: https://earthexplorer.usgs.gov (accessed on 11 June 2023).
  27. Eyring, V.; Bony, S.; Meehl, G.A.; Senior, C.A.; Stevens, B.; Stouffer, R.J.; Taylor, K.E. Overview of the Coupled Model Intercomparison Project Phase 6 (CMIP6) experimental design and organization. Geosci. Model Dev. 2016, 9, 1937–1958. [Google Scholar] [CrossRef]
  28. IPCC. Summary for Policymakers. In Climate Change 2021: The Physical Science Basis. Contribution of Working Group I to the Sixth Assessment Report of the Intergovernmental Panel on Climate Change; Masson-Delmotte, V., Zhai, P., Pirani, A., Connors, S.L., Péan, C., Berger, S., Caud, N., Chen, Y., Goldfarb, L., Gomis, M.I., et al., Eds.; Cambridge University Press: Cambridge, UK; New York, NY, USA, 2021. [Google Scholar] [CrossRef]
  29. World Bank, Climate Change Knowledge Portal. Country: Uzbekistan, Current and Projections Climate Data. Available online: https://climateknowledgeportal.worldbank.org/country/uzbekistan (accessed on 20 October 2024).
  30. Copernicus Climate Change Service. The 2024 Annual Climate Summary: Global Climate Highlights on 17th January 2025. Available online: https://climate.copernicus.eu/global-climate-highlights-2024 (accessed on 20 January 2025).
  31. Harbaugh, A.W.; Langevin, C.D.; Hughes, J.D.; Niswonger, R.N.; Konikow, L.F. MODFLOW-2005, the U.S. Geological Survey Modular Groundwater Model, Version 1.12.00; U.S. Geological Survey Software Release, 3 February 2017; U.S. Geological Survey: Reston, VA, USA, 2017. [Google Scholar] [CrossRef]
  32. Hamon, R.W. Computational of Direct Runoff Amounts from Storm Rainfall; International Association of Scientific Hydrology Publication: Wallingford, Oxon, UK, 1963; Volume 63, pp. 52–62. [Google Scholar]
  33. Freeze, R.A.; Cherry, J.A. Groundwater; Prentice-Hall Inc.: Englewood Cliffs, NJ, USA, 1979; Volume 7632, p. 604. [Google Scholar]
  34. Doherty, J. PEST–Model-Independent Parameter Estimation–User’s Manual, 5th ed.; Watermark Numerical Computing: Brisbane, Australia, 2010; p. 336. [Google Scholar]
  35. Gracheva, I.N.; (Uzbekhydrogeology, Tashkent, Uzbekistan). Personal communication, 2024.
  36. Bristow, E.L.; Davis, K.W. Groundwater Flow Model for the Des Moines River Alluvial Aquifer Near Des Moines, Iowa, U.S. Geological Survey Scientific Investigations Report 2024–5059; U.S. Geological Survey: Reston, VA, USA, 2024; p. 47. [Google Scholar] [CrossRef]
  37. Okanagan Water Stewardship Council. Okanagan Alluvial Fan Hydrology: A Primer; Okanagan Basin Water Board: Kelowna, BC, Canada, 2023; p. 59. Available online: https://www.obwb.ca/alluvial (accessed on 9 February 2025).
  38. Mather, A.E.; Stokes, M.; Whitfield, E. River terraces and alluvial fans: The case for an integrated Quaternary fluvial archive. Quat. Sci. Rev. 2017, 166, 74–90. [Google Scholar] [CrossRef]
  39. Abesser, C.; Shand, P.; Gooddy, D.; Peach, D. The role of alluvial valley deposits in groundwater–surface water exchange in a Chalk river. In Groundwater–Surface Water Interaction: Process Understanding, Conceptualization and Modelling, Proceedings of the Symposium HS1002 at IUGG 2007, Perugia, Italy, 2–13 July 2007; IAHS Publication No 321; IAHS: Wallingford, UK, 2008; Available online: https://nora.nerc.ac.uk/id/eprint/5561/1/06_11-20_9_Abesser.pdf (accessed on 10 February 2025).
  40. Florsheim, J.L. Side-valley tributary fans in high-energy river floodplain environments: Sediment sources and depositional processes, Navarro River basin, California. GSA Bull. 2004, 116, 923–937. [Google Scholar] [CrossRef]
  41. Manning, A.; Julian, J.P.; Doyle, M.W. Riparian vegetation as an indicator of stream channel presence and connectivity in arid environments. J. Arid. Environ. 2020, 178, 104167. [Google Scholar] [CrossRef]
  42. Brkic, Z. Increasing water temperature of the largest freshwater lake on the Mediterranean islands as an indicator of global warming. Heliyon 2023, 9, e19248. [Google Scholar] [CrossRef]
  43. Khasanov, K. A comprehensive analysis of reservoir capacity loss: A case study of the Akhangaran Reservoir, Uzbekistan. Water Cycle 2024, 6, 105–117. [Google Scholar] [CrossRef]
  44. Deshmukh, M.M.; Elbeltagi, A.; Kouadri, S. Climate Change Impact on Groundwater Resources in Semi-arid Regions. In Climate Change Impact on Groundwater Resources; Panneerselvam, B., Pande, C.B., Muniraj, K., Balasubramanian, A., Ravichandran, N., Eds.; Springer: Cham, Switzerland, 2022; pp. 9–23. [Google Scholar] [CrossRef]
  45. Davamani, V.; John, J.E.; Poornachandhra, C.; Gopalakrishnan, B.; Arulmani, S.; Parameswari, E.; Santhosh, A.; Srinivasulu, A.; Lal, A.; Naidu, R. A Critical Review of Climate Change Impacts on Groundwater Resources: A Focus on the Current Status, Future Possibilities, and Role of Simulation Models. Atmosphere 2024, 15, 122. [Google Scholar] [CrossRef]
  46. Turkeltaub, T.; Bel, G. Changes in mean evapotranspiration dominate groundwater recharge in semi-arid regions. Hydrol. Earth Syst. Sci. 2024, 28, 4263–4274. [Google Scholar] [CrossRef]
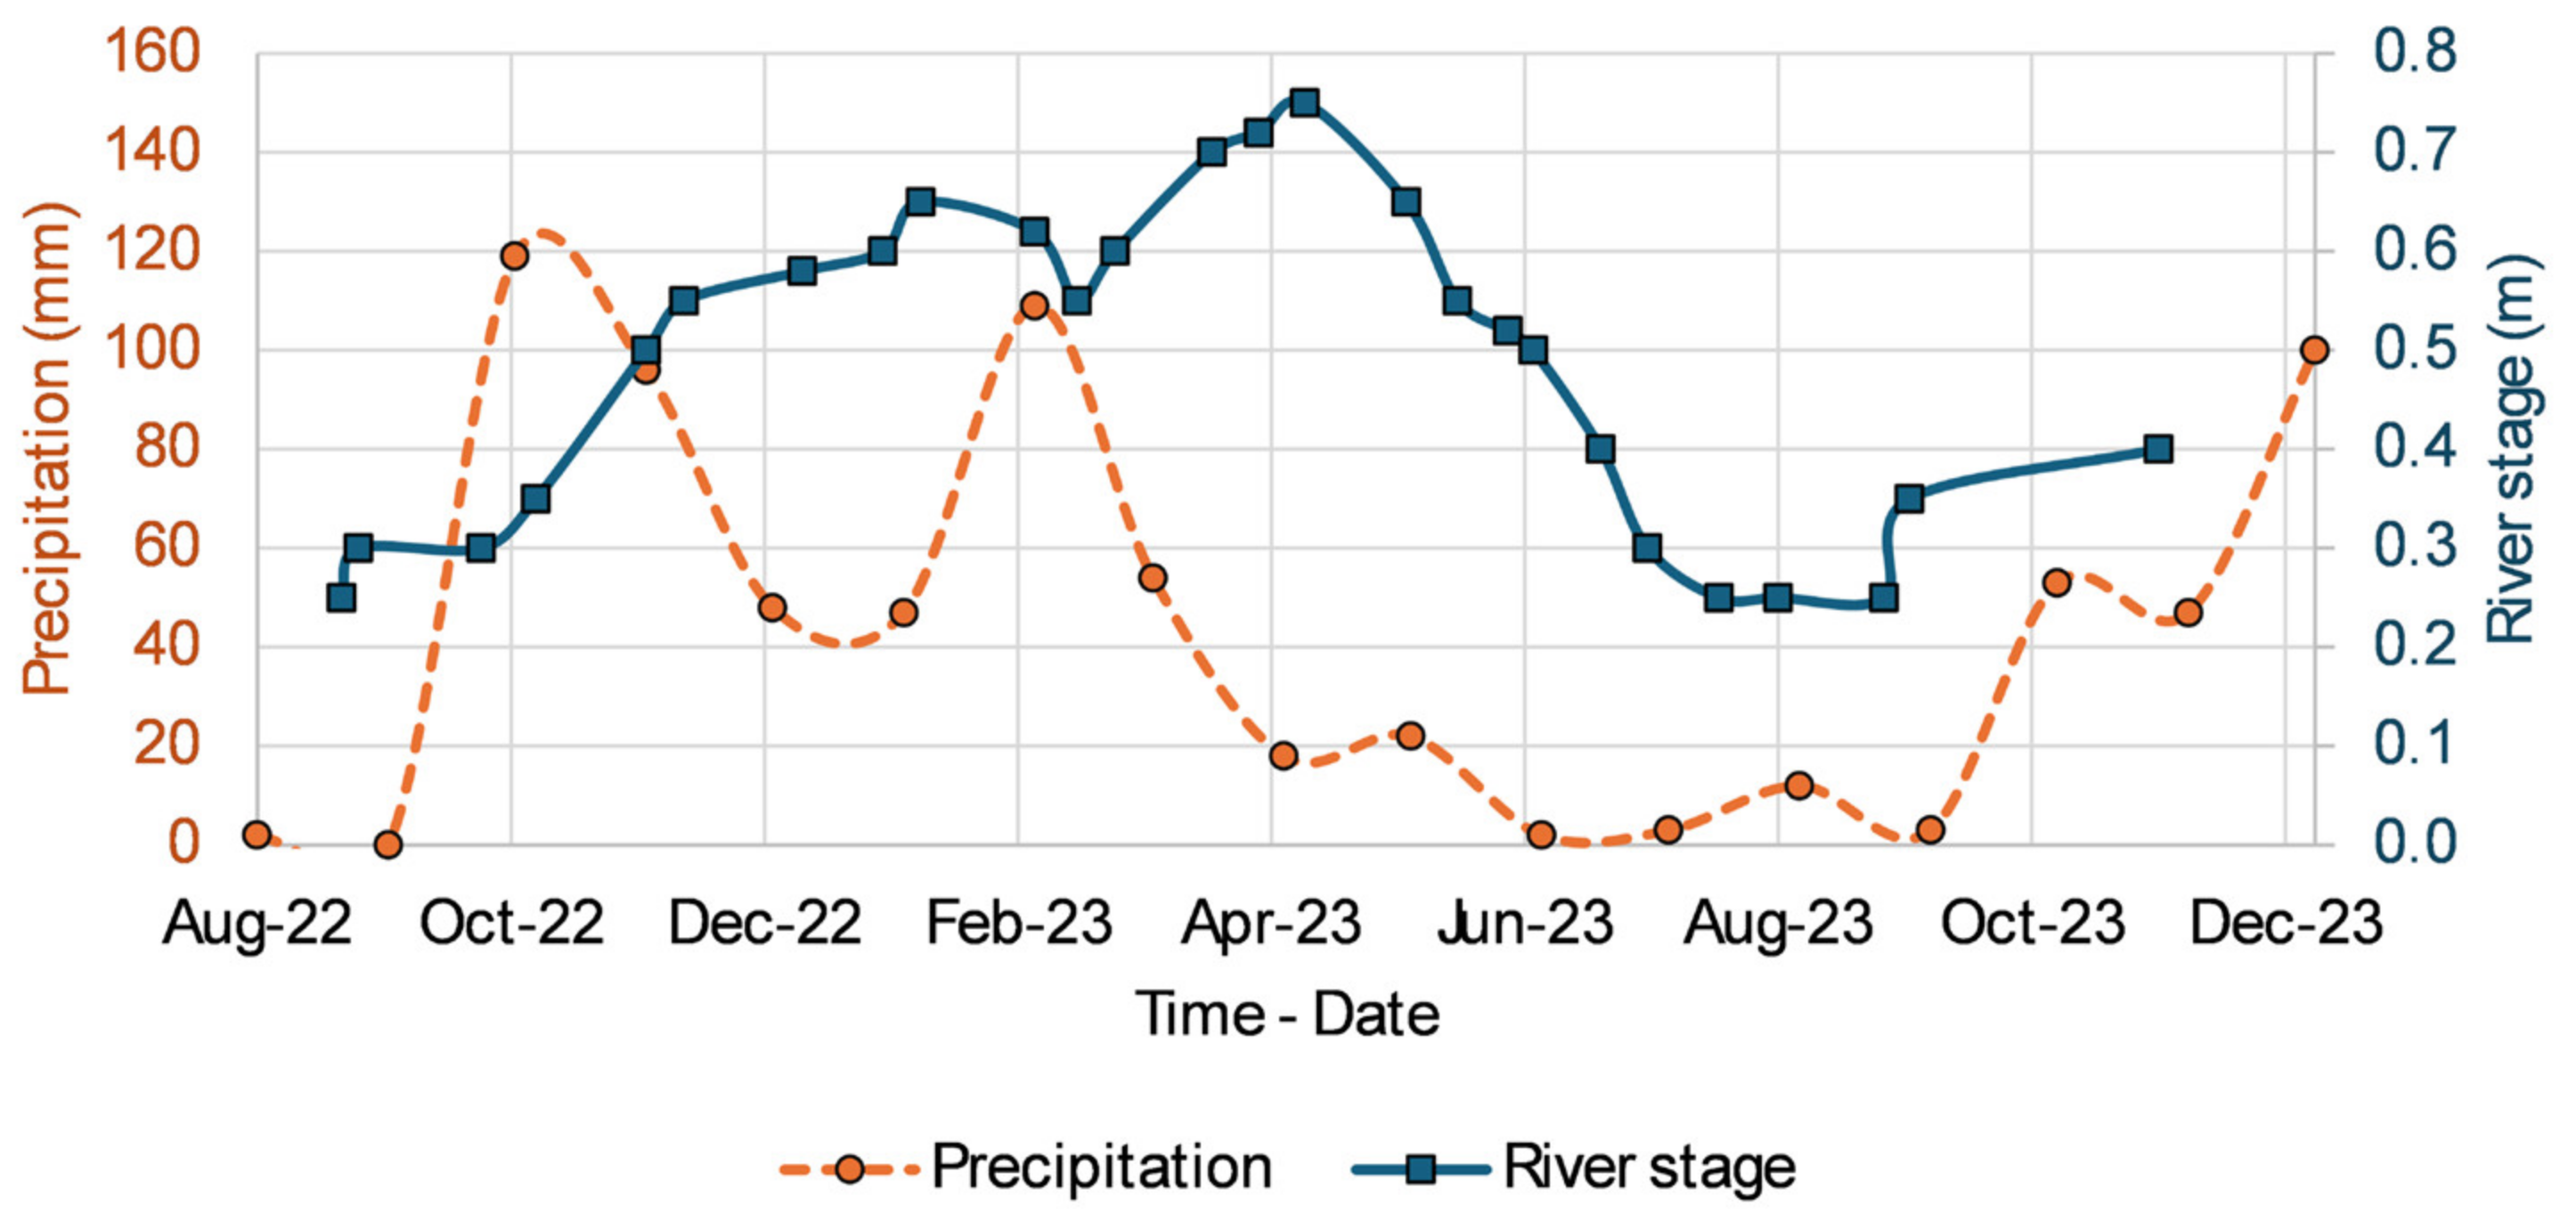
Figure 3. The river stage measurements of the Akhangaran River recorded from 8 September 2022 to 8 November 2023, alongside monthly precipitation data from the Angren weather station for the period August 2022 to December 2023.
Water 17 02291 g003
Figure 4. (a,c,e) Mean monthly temperature, precipitation, and potential evapotranspiration (PET), respectively, and (b,d,f) changes in these variables under the SSP5-8.5 scenario for the period 2020–2099 compared with 2010–2020.
Water 17 02291 g004
Figure 5. (a) Calibrations and (b) residuals (head differences) between simulated and measured heads of the steady-state condition for the period 2010–2020.
Water 17 02291 g005
Figure 6. Results from the steady-state flow simulation for the period 2010–2020: (ac) calibrated horizontal hydraulic conductivity (Kh) values for Layers 1, 2, and 3, (d) groundwater recharge distribution, and (e) simulated groundwater levels.
Water 17 02291 g006
Figure 7. (ae) Comparison of transient simulated and measured groundwater heads at selected observation boreholes for the period 2010–2020. (f) Comparison of transient simulated heads at Obs. 149 with (solid blue line) and without (dashed green line) the inclusion of the GHB North and South boundaries, alongside measured groundwater heads. The locations of the observation boreholes are shown in Figure 2.
Water 17 02291 g007
Figure 8. (a) Mean monthly groundwater recharge (mm) and (b) percentage change in recharge rates under the SSP5-8.5 scenario for the period 2020–2099 compared with 2010–2020.
Water 17 02291 g008
Figure 9. (a) Mean monthly river infiltration (m3/d) and (b) percentage change in river infiltration rates under the SSP5-8.5 scenario for the period 2020–2099 compared with 2010–2020. Positive values indicate river water infiltrating into the aquifer, while negative values indicate groundwater discharging into the river.
Water 17 02291 g009
Figure 10. (a) Mean monthly groundwater discharge to streams (drains, in m3/d) and (b) percentage change in drain discharge under the SSP5-8.5 climate scenario for the period 2020–2099 compared with 2010–2020.
Water 17 02291 g010
Figure 11. (a,c,e,f) Mean monthly flux rates (m3/d) at the general head boundary (GHB) East, South, West, and North boundaries, respectively. (b,d) Percentage changes in flux rates at the GHB East and South boundaries, respectively, under the SSP5-8.5 scenario for the period 2020–2099 compared with 2010–2020. Positive values indicate inflow to the model domain, while negative values indicate outflow.
Water 17 02291 g011
Figure 12. (a) Mean monthly net water storage (In–Out; Mm3). (b) Percentage change in monthly net water storage under the SSP5-8.5 scenario for the period 2020–2099 compared with 2010–2020. (c) Mean annual net water storage (In–Out; Mm3/year). (d) Percentage change in annual net water storage under the SSP5-8.5 scenario compared with 2010–2020.
Water 17 02291 g012
Table 1. Components of the water balance from the steady-state flow simulation for the period 2010–2020.
BoundaryInflow (m3/d)Outflow (m3/d)Inflow (%)Outflow (%)
Pumping (Well)0111,577.0051.3
Recharge14,937.706.90
River9784.615,100.64.56.9
Drains01304.2 0.6
GHB North945304.30
GHB South70,529.5032.40
GHB East112,745.8051.80
GHB West089,468.6041.1
Total217,450.6217,450.4100100
In–Out (m3/d)0.2
Difference (%)0.0001
Disclaimer/Publisher’s Note: The statements, opinions and data contained in all publications are solely those of the individual author(s) and contributor(s) and not of MDPI and/or the editor(s). MDPI and/or the editor(s) disclaim responsibility for any injury to people or property resulting from any ideas, methods, instructions or products referred to in the content.