
Drought Analysis Methods: A Multidisciplinary Review with Insights on Key Decision-Making Factors in Method Selection


Abstract

1. Introduction
Drought Types
2. Review of Drought Analysis Methods
2.1. Index-Based Method
2.1.1. Definition and Introduction
2.1.2. Classification of Drought Indices
- Standardized Precipitation Evaporation Index (SPEI) [38];
- Standardized Streamflow Index (SSFI) [39];
- Standardized Runoff Index (SRI) [40];
- Standardized Soil Moisture Index (SSMI) [41];
- Standardized Groundwater level Index (SGI) [42];
- Standardized Snow Melt and Rain Index (SMRI) [43];
- Standardized Relative Humidity Index (SRHI) [44];
- Standardized Terrestrial Water Storage Index (STI) [45];
- Standardized Water Supply and Demand Index (SWSDI) [46];
- Multivariate Standardized Drought Index (MSDI) [29].
- Although model-based drought indices, such as the Palmer Drought Severity Index (PDSI) [47], can also be considered as standardized indices, their derivation is based on a different modeling approach [16]. Remote sensing indices utilize satellite data as indicators and will be discussed in detail under Remote sensing (Section 2.2).

2.1.3. Application Selection Criteria of Indices
2.1.4. Limitations, Challenges and Future Directions
2.2. Remote Sensing Method
2.2.1. Definition and Introduction
2.2.2. Remote Sensing’s Contribution to Drought Monitoring
- Direct contribution
- Indirect contribution
2.2.3. Limitations, Challenges and Future Directions
2.3. Threshold-Level Method (TLM)
2.3.1. Definition and Introduction
2.3.2. Application Selection Criteria
2.3.3. Advantages, Limitations and Future Directions
- Developing standardized methods for threshold selection across different hydroclimatic regions.
- Leveraging machine learning techniques for adaptive, dynamic threshold setting based on real-time hydrological data.
- Incorporating probabilistic and non-stationary approaches to ensure that threshold levels remain relevant under climate change.
- Enhancing data assimilation techniques by combining ground observations, satellite data, and reanalysis datasets to improve TLM’s applicability in data-scarce regions.
2.4. Impact-Based Method
2.4.1. Conceptual Foundation and Introduction
2.4.2. Global Drought Impact Databases
2.4.3. Methodological Workflow and Data Sources
2.4.4. Advantages, Limitations and Future Directions
- Data granularity: Sources range from structured databases to narrative reports, leading to inconsistencies in impact quantification;
- Impact categorization: Sector-specific versus multi-sectoral classifications limit cross-regional comparisons;
- Standardization: Expand or adapt existing systems (e.g., EDII, DIR) and develop new protocols tailored to under-represented regions like Africa and South Asia.
- AI Integration: Utilize advanced AI tools—such as (BERT) [179] for automated text mining of drought impacts from news and reports—to enhance impact detection and forecasting. Notably, recent studies have demonstrated the potential of AI and machine learning in impact-based drought analysis. For example, Zhang et al. applied an explainable machine learning framework (XGBoost with SHAP) to predict complex drought impacts across the U.S., improving both the accuracy and interpretability of multidimensional impact forecasts [180]. Similarly, Sodoge et al. developed an automated approach combining natural language processing and machine learning to detect and map drought impacts from 40,000 newspaper articles in Germany, achieving classification accuracy exceeding 90% [166].
- Global Collaboration: Promote data sharing, expand global drought impact databases, and implement unified metadata standards to achieve comprehensive, equitable impact representation.
2.5. Storyline Approach
2.5.1. Conceptual Framework and Introduction
- Scenario-Based (SB)—focusing on long-term developments and drivers;
- Discourse-Analytical Approach (DAA)—examining how risks are framed and communicated;
- Physical Climate Storylines (PCSs)—focusing on physical processes behind extreme events.
2.5.2. Integration of GCMs, SSPs, and RCPs with the Storyline Approach
2.5.3. Methodological Workflow and Applications
2.5.4. Limitations, Challenges and Future Directions
3. Spatiotemporal Trends in Drought Method Studies
3.1. Data Source and Search Strategy
3.2. Temporal Trends
3.3. Spatial Distribution
4. Significant Decision-Making Factors in Method Selection
4.1. Drought Type
4.2. Data Type and Availability
4.3. Scale of the Study
4.4. Management Stages
5. Conclusions
- The index-based method provides a standardized framework for drought analysis, transforming hydroclimatic variables into statistical indices. Its flexibility across drought types and spatial–temporal scales makes it suitable for monitoring, assessment, and forecasting of drought, especially when integrating diverse data sources (e.g., in situ, satellite datasets, GCMs). However, its reliance on stationarity assumptions and data quality limitations (e.g., sparse ground observations) can reduce accuracy. Future advancements should prioritize hybrid frameworks (e.g., integrating AI and machine learning) and multi-source data fusion (e.g., satellite-derived precipitation with ground measurements) [232].
- Remote sensing supports drought analysis across drought types, particularly agricultural drought through vegetation (e.g., NDVI) and soil moisture monitoring. It offers consistent, continuous data, bridging gaps in areas lacking in situ measurements. With broad spatial and temporal coverage, it supports all drought management stages: real-time monitoring, historical assessment (e.g., SMAP trends), and forecasting (e.g., integration into DEWS). However, limitations include sensor issues (e.g., cloud cover, coarse resolution) and challenges in data integration. Future improvements should focus on multi-sensor fusion, AI-based downscaling, and dynamic baselines to boost accuracy.
- TLM is fundamental to hydrological drought analysis, using site-specific thresholds to quantify absolute water deficits, critical for operational water management (e.g., reservoir alerts, low-flow measures). It supports both fixed and variable thresholds, allowing flexible use across climates. TLM excels in drought assessment (e.g., duration, intensity, severity) and contributes to forecasting when coupled with hydrological models. Limitations include potential misclassification of natural low-flow periods and dependence on stationary climate assumptions. Future improvements should emphasize dynamic threshold calibration and integration with remote sensing data (e.g., GRACE) to improve accuracy and resilience.
- Impact-based methods transform drought analysis by focusing on socioeconomic impacts, incorporating hazard, exposure, and vulnerability to assess risks across sectors. They connect drought indices (e.g., SPI) to real-world impacts (e.g., crop loss, water shortages), through IbF contributing to drought impact forecasting. It primarily focuses on regional applications and can support large-scale analysis when data is available. Future advancements should prioritize AI-driven tools to mine unstructured data (e.g., social media) and global standardization efforts to enhance equity and relevance.
- Storyline approaches combine quantitative climate projections (e.g., GCM-derived temperature anomalies, SSP-RCP scenarios) with qualitative, stakeholder-centric narratives to explore high-impact drought scenarios. It is adaptable across drought types and scalable from local to global study scales. Storyline approaches are particularly effective in assessment (e.g., evaluation of vulnerabilities in past droughts) and forecasting (e.g., projecting and stress-testing megadrought risks under SSP5-RCP8.5). Despite their advantages, limitations remain due to regional data gaps and uncertainties in GCMs, highlighting the need for better integration of remote sensing and local observations.
- The integration of AI/ML with drought analysis methods offers transformative potential for improving drought monitoring, assessment, and forecasting. AI/ML enhances the ability to capture complex, non-linear relationships across diverse data sources—including indices, in situ and remote sensing observations, and impact records—while enabling automation and improved accuracy. However, future research should focus on specialized AI architectures for drought features, better integration of multi-source datasets, and standardized protocols to ensure transparency, consistency, and fairness [233].
Author Contributions
Funding
Acknowledgments
Conflicts of Interest
Abbreviations
| AD-EWS | ANYWHERE Drought Early Warning System |
| AI | Artificial Intelligence |
| ALOS PALSAR | Advanced Land Observing Satellite Phased Array type L-band Synthetic Aperture Radar |
| CHIRPS | Climate Hazards Center InfraRed Precipitation with Station |
| DAAs | Discourse-Analytical Approaches |
| DEWSs | Drought Early Warning Systems |
| DIR | Drought Impact Reporter |
| EDO | European Drought Observatory |
| EDII | European Drought Impact Report Inventory |
| Eta | Actual Evapotranspiration |
| GCMs | Global Climate Models/General Circulation Models |
| GLDAS | Global Land Data Assimilation System |
| GRACE | Gravity Recovery And Climate Experiment |
| HBV | Hydrologiska Byråns Vattenbalansavdelning |
| IbF | Impact-based Forecasting |
| JPSS | Joint Polar Satellite System |
| LC | Land Cover |
| LiDAR | Light Detection and Ranging |
| LST | Land Surface Temperature |
| MODIS | Moderate Resolution Imaging Spectroradiometer |
| NOAA | National Oceanic and Atmospheric Administration |
| PCSs | Physical Climate Storylines |
| PET | Potential Evapotranspiration |
| RCPs | Representative Concentration Pathways |
| SHAP | SHapley Additive exPlanation |
| SMAP | Soil Moisture Active Passive |
| SSPs | Shared Socioeconomic Pathways |
| SWAT | Soil Water Assessment Tool |
| SWIR | Shortwave Infrared |
| TRMM | Tropical Rainfall Measuring Mission |
| TWS | Terrestrial Water Storage |
| UAVs | Unmanned Aerial Vehicles |
| VIs | Vegetation Indices |
| VIC | Variable Infiltration Capacity |
| VIIRS | Visible Infrared Imaging Radiometer Suite |
| WMO | World Meteorological Organization |
| List of abbreviations of drought indices: | |
| AAI | Aridity Anomaly Index |
| ACDI | Autoencoder-based Composite Drought Index |
| ADI | Aggregate Drought Index |
| ARID | Agricultural Reference Index for Drought |
| CDI | Combined Drought Index |
| CDI* | Composite Drought Index |
| CMI | Crop Moisture Index |
| CSDI | Crop-Specific Drought Index |
| CWSI | Crop Water Stress Index |
| CZI | China Z Index |
| DAI | Drought Area Index |
| EDDI | Evaporative Demand Drought Index |
| EDI | Effective Drought Index |
| ESI | Evaporative Stress Index |
| ETDI | Evapotranspiration Deficit Index |
| EVI | Enhanced Vegetation Index |
| GDI | Generalized Drought Index |
| GIDMaPS | Global Integrated Drought Monitoring and Prediction System |
| GGDI | GRACE Groundwater Drought Index |
| HDI | Hybrid Drought Index |
| IRDI | Integrated Reservoir Drought Index |
| JDI | Joint Drought Index |
| KBDI | Keetch–Byram Drought Index |
| MDI | Multivariable Drought Index |
| mRAI | Modified Rainfall Anomaly Index |
| MSDI | Multivariate Standardized Drought Index |
| NDII | Normalized Difference Infrared Index |
| NDI | NOAA Drought Index |
| NDVI | Normalized Difference Vegetation Index |
| NIDI | Non-stationary Integrated Drought Index |
| NDWI | Normalized Difference Water Index |
| NMDI | Non-linear Multivariate Drought Index |
| PCI | Precipitation Condition Index |
| PDSI | Palmer Drought Severity Index |
| PHDI | Palmer Hydrological Drought Index |
| PNP | Percent of Normal Precipitation |
| RAI | Rainfall Anomaly Index |
| RDI | Reclamation Drought Index |
| RDI* | Reconnaissance Drought Index |
| RDIe | Modified Reconnaissance Drought Index |
| SAI | Standardized Anomaly Index |
| SAVI | Soil Adjusted Vegetation Index |
| scPDSI | Self-Calibrated Palmer Drought Severity Index |
| SCDI | Standardized Comprehensive Drought Index |
| SDI | Streamflow Drought Index |
| SEDI | Standardized Evapotranspiration Deficit Index |
| SeDI | Socioeconomic Drought Index |
| SGI | Standardized Groundwater Index |
| SMDI | Soil Moisture Deficit Index |
| SMRI | Standardized Snowmelt and Rain Index |
| SoVI | Social Vulnerability Index |
| SPEI | Standardized Precipitation Evapotranspiration Index |
| SPI | Standardized Precipitation Index |
| SPESMI | Standardized Precipitation, Potential Evapotranspiration, and Root-Zone Soil Moisture Index |
| SRI | Standardized Runoff Index |
| SRSI | Standardized Reservoir Supply Index |
| SRSI* | Standardized River Stage Index |
| SSFI | Standardized Streamflow Index |
| SSI | Standardized Soil Moisture Index |
| SWI | Standardized Water-Level Index |
| SWI* | Standardized Wetness Index |
| SWSDI | Standardized Water Supply and Demand Index |
| SWSI | Surface Water Supply Index |
| TCI | Temperature Condition Index |
| TRADI | Type Response-Aided Drought Index |
| USDM | United States Drought Monitor |
| VCI | Vegetation Condition Index |
| VegDRI | Vegetation Drought Response Index |
| VHI | Vegetation Health Index |
| WASP | Weighted Anomaly Standardized Precipitation |
| WEI | Water Exploitation Index |
| WEI+ | Water Exploitation Index (Revised) |
| WSI | Water Scarcity Indicator |
| WSIr | Revised Water Scarcity Indicator |
Appendix A

| Product | Spatial Resolution | Temporal Resolution | Period | Spatial Coverage | Reference | Used for Drought Analysis |
|---|---|---|---|---|---|---|
| CHIRPS (Climate Hazards Center InfraRed Precipitation with Station) | 0.05° | Daily etc. | Long term | 50° S/N | [234] | [235,236,237,238,239,240,241,242,243] |
| CMAP: (Climate Prediction Center (CPC) Merged Analysis of Precipitation) | 2.5° | Monthly/Pentad | Long term | Global | [244] | [128,236,245,246] |
| CMORPH: (Climate Prediction Center (CPC) morphing method) | 0.25° | Half-hourly | TRMM/GPM | 60° S/N | [247] | [128,236,240,243,248,249,250,251,252,253,254] |
| GPCP monthly Global Precipitation Climatology Project | 0.5° | Monthly/Daily | Long term | Global | [255] | [128,256,257,258] |
| GSMaP: Global Satellite Mapping of Precipitation | 0.1° | Hourly | TRMM/GPM | 60° S/N | [259] | [240,242,248] |
| IMERG: Integrated Multi-satellitE Retrievals for the Global Precipitation Measurement (GPM) mission | 0.1° | Hourly | TRMM/GPM | Global | [260] | [236,240,242,254,261,262] |
| MSWEP: Multi-Source Weighted-Ensemble Precipitation | 0.1° | Half-hourly | Long term | Global | [263] | [236,237,258,264] |
| PERSIANN: Precipitation Estimation from Remotely Sensed Information using Artificial Neural Networks | 0.25° | Hourly | TRMM/GPM | 60° S/N | [265] | [242,251,266] |
| PERSIANN-CCS Cloud Classification System (CCS) | 0.04° | Hourly | TRMM/GPM | 60° S/N | [267] | [242,266,268] |
| PERSIANN-CDR Climate Data Record (CDR) | 0.25° | Daily | Long term | 60° S/N | [269] | [128,237,240,242,243,268] |
| TMPA 3B42; TRMM Multi-satellite Precipitation Analysis (TMPA) 3B42 with Gauge-adjusted V7 | 0.25° | 3 h | TRMM/GPM | 50° N/S | [270] | [240,250,251] |
Appendix B
| Product | Spatial Resolution | Temporal Resolution | Period | Spatial Coverage | Reference | Used for Drought Assessment |
|---|---|---|---|---|---|---|
| ERA-5; The fifth generation ECMWF reanalysis for the global climate | 0.25° | Hourly | Long term | Global | [271] | [240,248,258,268] |
| ERA-Interim ECMWF Re Analysis Interim | 0.75° | 3 h | Long term | Global | [123] | [240,258,272,273] |
| MERRA2; Modern-Era Retrospective Analysis for Research and Applications V2 | 0.5° | Hourly | Long term | Global | [274] | [128,240,258,272] |
| JRA-55; The Japanese 55-year Reanalysis by Japan Meteorological Agency (JMA) | 1.25° | 3 h | Long term | Global | [275] | [272,276,277] |
| CFRC Climate Forecast System Reanalysis | 0.5° | Hourly | 1979–2010 (current as CFSv2) | Global | [278,279] | [272,280,281] |
| CRA-40; By China Meteorological Analysis (CMA) Global Atmospheric Interim Reanalysis (CRAI) | 0.28° | 6 h | Long term | Global | [282] | Not been used for drought assessment so far |
Appendix C

Appendix D
| Study | Region/ Country | Sectors Analyzed | Impact Data Sources | Index Used | Analytical Methods | Key Findings | Limitations |
|---|---|---|---|---|---|---|---|
| [170] | Europe | Agriculture, Energy, Water Supply and Water Quality | EDII, Historical Yield Statistics | SPEI | Logistic Regression | Highest risk for “Water Quality” in Maritime Europe | Limited data for North/Southeastern Europe |
| [167] | Southwestern Germany | Agriculture, Public Health | Media Reports, Historical Documents, EDII | SPI, SPEI | Discourse Analysis | Vulnerability reduced over time due to societal changes | Relies on subjective historical narratives |
| [169] | Europe | Multi-sector (Agriculture, Energy, Forestry) | EDII Database (~5000 reports) | SPI, SSFI | Statistical Correlation | Agriculture impacts dominate; regional variability | Media bias in impact reporting |
| [159] | Central Europe | Energy, Agriculture, Water Supply | EDII, Media Reports | SPI, SPEI, SSMI | Fuzzy Categorization, Correlation | Strong sectoral interconnectedness | Region-specific thresholds |
| [173] | Germany, UK | Multi-sector | EDII | SPI, SPEI, Streamflow | Ensemble Regression Trees | SPI ≤ −1 as impact threshold in UK | Predictability gaps in data-poor regions |
| [176] | Texas, USA | Multi-sector (Agriculture, Socioeconomic) | DIR | Precipitation, PET, Soil Moisture | Random Forest (RF) Models | Outperforms SPI/SPEI; automated forecasting | Region-specific calibration |
| [175] | Germany | Multi-sector | EDII, Text-Based Impact Reports | SPI, SPEI, Streamflow, Groundwater Levels | Correlation Analysis, Data Visualization | SPEI slightly outperforms SPI; impacts occur within indicator ranges; regional variability in thresholds | Data dependency; thresholds vary regionally/event-specifically |
| [284] | Southeast England | Water Supply, Freshwater Ecosystems | EDII (Text-Based Reports) | SPI, SPEI | Logistic Regression, Hurdle Model, Random Forest | Random Forest outperforms for count data; past impact data improves predictions | Relies on text-based impact data; limited by impact report availability |
| [177] | Europe (NUTS-1 Regions) | Multi-sector | EDII | SPI, SPEI, SRI | Random Forest Machine Learning | Forecasts impacts 3–4 months ahead; skill depends on impact data volume | Requires >50 months of impact data; focuses on meteorological indices |
Appendix E
| Study | Region | Drought Event | Climate Scenarios | Key Variables Analyzed | Methodology | Key Findings | Limitations |
|---|---|---|---|---|---|---|---|
| [18] | Western Europe (Rhine Basin) | 2018 Meteorological Drought | 2 °C and 3 °C global warming | Precipitation, PET, soil moisture, circulation | Large ensemble climate model simulations | Increased severity, spatial extent, and spring-summer drought coupling | Regional focus; reliance on model assumptions |
| [187] | West-Central Europe | 2018 Drought | 1.5 °C, 2 °C, 3 °C global warming | Soil moisture, temperature, precipitation | Pseudo-Global Warming (PGW) experiments | Drought severity increases 20–39% under 2 °C; increases frequency of 2003-like droughts | Ignores dynamical responses to climate change |
| [192] | Rhine Basin (Europe) | 1976, 2003, 2018 Droughts | RCP8.5 (near and far future) | Streamflow, glacier melt, low-flow duration | Stress-test storyline scenarios | Summer streamflow decreases by 5–25% downstream, decreases by 30–70% upstream; low-flow duration doubles | Focuses on cryosphere; excludes other low-flow drivers |
| [194] | Global | Future Hydrologic Drought | SSP1–2.6, SSP2–4.5, SSP3–7.0, SSP5–8.5 | Runoff, drought duration, seasonal timing | CMIP6 model consensus analysis | Multi-year droughts increase under SSP5–8.5; seasonal shifts in northern latitudes | Simplifies co-occurring changes; model-dependent |
| [198] | Global | Historical/Future Drought | CMIP6 (SSPs) | SPI, SPEI, SRI, soil moisture | Multi-model comparison with observational data | Evapotranspiration is key driver; exceptional droughts worsen under SSPs | Model accuracy varies; limited regional detail |
| [199] | Southeastern South America | 2008/2009 Drought | (Interdisciplinary focus) | Sociopolitical narratives, local impacts | Qualitative analysis (climatology + anthropology) | Disparate stakeholder storylines affect policy | Subjectivity in narratives; lacks quantitative modeling |
| [191] | Southeastern South America | 2011/2012 Summer Drought | Pre-industrial vs. +2 °C world | Precipitation, temperature, water budget | Spectrally nudged ECHAM6 model simulations | Climate change increases drought risk despite wetter trends; no large-scale water budget shifts | Focuses on thermodynamics; limited socioeconomic integration |
| [188] | United Kingdom | 2010–2012 Hydrological Drought | UKCP18 climate projections | Meteorological preconditions, river flow, groundwater | Physical climate storylines, UKCP18 projections | Drought intensity influenced by preconditions; vulnerability to “third dry winter” scenarios | Regional focus; reliance on model assumptions |
| [183] | Western Europe, North America | Hypothetical Extreme Droughts | Iterative ensemble resampling (CESM1) | Precipitation, soil moisture, atmospheric circulation | Iterative ensemble resampling (CESM1 model) | Extreme droughts reduce precipitation by 80% (Europe) and 77% (NA); multi-year recovery times | Idealized experiments; lacks socioeconomic context |
| [197] | United Kingdom (Anglian) | 2022 Summer Drought | Seasonal hindcasts (SEAS5 dataset) | Rainfall, river flow, groundwater, NAO/EA indices | ECMWF SEAS5 hindcasts, cluster analysis | Dry winters (NAO-/EA-) prolong drought; groundwater-dominated catchments vulnerable | Relies on hindcast accuracy; regional specificity |
Appendix F
| Drought Methods | No. of Papers | No. of Related Papers | Code for Scopus |
|---|---|---|---|
| General number of scientific papers in drought | 3145 | 3145 | TITLE-ABS-KEY (“drought monitoring” OR “drought assessment”) AND (LIMIT-TO (LANGUAGE, “English”)) |
| Index-based drought monitoring | 1993 | 1993 | TITLE-ABS-KEY (“Index” OR “indices” AND “drought monitoring”) AND (LIMIT-TO (LANGUAGE, “English”)) |
| Remote sensing-based drought monitoring | 1516 | 1516 | TITLE-ABS-KEY (“remote sensing” OR “satellite” AND “drought monitoring”) AND (LIMIT-TO (LANGUAGE, “English”)) |
| Impact-based forecasting | 18 | 15 | TITLE-ABS-KEY ((“impact-based forecasting” OR “IbF”) OR (“European Drought Impact report Inventory” OR “EDII”) AND (“drought monitoring” OR “drought forecasting” OR “drought”)) AND (LIMIT-TO (LANGUAGE, “English”)) |
| Threshold-level method (TLM) | 71 | 71 | TITLE-ABS-KEY ((“Threshold Level Method” OR “TLM”) AND “drought”) AND (LIMIT-TO (LANGUAGE, “English”)) |
| Storyline approach | 31 | 19 | TITLE-ABS-KEY (“storyline” OR “storyline approach” AND “drought” OR “droughts”) AND (LIMIT-TO (LANGUAGE, “English”)) |
References
- Vatter, J.; Wagnitz, P. Drought Risk: The Global Thirst for Water in the Era of Climate Crisis (WWF Germany); WWF Germany: Berlin, Germany, 2019. [Google Scholar]
- Singh, C.; Jain, G.; Sukhwani, V.; Shaw, R. Losses and Damages Associated with Slow-Onset Events: Urban Drought and Water Insecurity in Asia. Curr. Opin. Environ. Sustain. 2021, 50, 72–86. [Google Scholar] [CrossRef]
- Dai, A. Drought under Global Warming: A Review. WIREs Clim. Change 2011, 2, 45–65. [Google Scholar] [CrossRef]
- Cammalleri, C.; Naumann, G.; Mentaschi, L.; Formetta, G.; Forzieri, G.; Gosling, S.N.; Bisselink, B.; De Roo, A.; Feyen, L. Global Warming and Drought Impacts in the EU; Publications Office of the European Union: Luxembourg, 2020. [Google Scholar]
- Smith, A.B. U.S. Billion-Dollar Weather and Climate Disasters, 1980–Present; NCEI Accession 0209268; National Centers for Environmental Information (NCEI): Asheville, NC, USA, 2020. [Google Scholar]
- Al-Qubati, A.; Zhang, L.; Pyarali, K. Climatic Drought Impacts on Key Ecosystem Services of a Low Mountain Region in Germany. Environ. Monit. Assess. 2023, 195, 800. [Google Scholar] [CrossRef]
- Strouboulis, A.; Tesfaye, B.; Edwards, A.; Yayboke, E. Climate and Crisis in the Horn of Africa; Rethinking Humanitarian Assistance; Center for Strategic and International Studies (CSIS): Washington, DC, USA, 2023; pp. 3–9. [Google Scholar]
- Carrão, H.; Naumann, G.; Barbosa, P. Mapping Global Patterns of Drought Risk: An Empirical Framework Based on Sub-National Estimates of Hazard, Exposure and Vulnerability. Glob. Environ. Change 2016, 39, 108–124. [Google Scholar] [CrossRef]
- Wilhite, D.A. Drought as a Natural Hazard: Concepts and Definitions; Drought Mitigation Center Faculty Publication: Lincoln, NE, USA, 2000. [Google Scholar]
- Mishra, A.K.; Singh, V.P. A Review of Drought Concepts. J. Hydrol. 2010, 391, 202–216. [Google Scholar] [CrossRef]
- Yihdego, Y.; Vaheddoost, B.; Al-Weshah, R.A. Drought Indices and Indicators Revisited. Arab. J. Geosci. 2019, 12, 69. [Google Scholar] [CrossRef]
- AghaKouchak, A.; Farahmand, A.; Melton, F.S.; Teixeira, J.; Anderson, M.C.; Wardlow, B.D.; Hain, C.R. Remote Sensing of Drought: Progress, Challenges and Opportunities. Rev. Geophys. 2015, 53, 452–480. [Google Scholar] [CrossRef]
- Kumar, V.; Sharma, K.V.; Pham, Q.B.; Srivastava, A.K.; Bogireddy, C.; Yadav, S.M. Advancements in Drought Using Remote Sensing: Assessing Progress, Overcoming Challenges, and Exploring Future Opportunities. Theor. Appl. Clim. 2024, 155, 4251–4288. [Google Scholar] [CrossRef]
- Boult, V.L.; Black, E.; Abdillahi, H.S.; Bailey, M.; Harris, C.; Kilavi, M.; Kniveton, D.; MacLeod, D.; Mwangi, E.; Otieno, G. Towards Drought Impact-Based Forecasting in a Multi-Hazard Context. Clim. Risk Manag. 2022, 35, 100402. [Google Scholar] [CrossRef]
- Shyrokaya, A.; Pappenberger, F.; Pechlivanidis, I.; Messori, G.; Khatami, S.; Mazzoleni, M.; Di Baldassarre, G. Advances and Gaps in the Science and Practice of Impact-based Forecasting of Droughts. WIREs Water 2024, 11, e1698. [Google Scholar] [CrossRef]
- Hisdal, H.; Tallaksen, L.M.; Gauster, T.; Bloomfield, J.P.; Parry, S.; Prudhomme, C.; Wanders, N. Hydrological Drought Characteristics. In Hydrological Drought; Elsevier: Amsterdam, The Netherlands, 2024; pp. 157–231. [Google Scholar]
- Yevjevich, V.M. An Objective Approach to Definitions and Investigations of Continental Hydrologic Droughts; Colorado State University Fort Collins: Fort Collins, CO, USA, 1967; Volume 23. [Google Scholar]
- van der Wiel, K.; Lenderink, G.; de Vries, H. Physical Storylines of Future European Drought Events like 2018 Based on Ensemble Climate Modelling. Weather. Clim. Extrem. 2021, 33, 100350. [Google Scholar] [CrossRef]
- Dracup, J.A.; Lee, K.S.; Paulson, E.G., Jr. On the Definition of Droughts. Water Resour. Res. 1980, 16, 297–302. [Google Scholar] [CrossRef]
- Hoque, M.A.-A.; Pradhan, B.; Ahmed, N. Assessing Drought Vulnerability Using Geospatial Techniques in Northwestern Part of Bangladesh. Sci. Total Environ. 2020, 705, 135957. [Google Scholar] [CrossRef]
- Saha, A.; Pal, S.C.; Chowdhuri, I.; Roy, P.; Chakrabortty, R.; Shit, M. Vulnerability Assessment of Drought in India: Insights from Meteorological, Hydrological, Agricultural and Socio-Economic Perspectives. Gondwana Res. 2023, 123, 68–88. [Google Scholar] [CrossRef]
- Christian, J.I.; Hobbins, M.; Hoell, A.; Otkin, J.A.; Ford, T.W.; Cravens, A.E.; Powlen, K.A.; Wang, H.; Mishra, V. Flash Drought: A State of the Science Review. WIREs Water 2024, 11, e1714. [Google Scholar] [CrossRef]
- Otkin, J.A.; Svoboda, M.; Hunt, E.D.; Ford, T.W.; Anderson, M.C.; Hain, C.; Basara, J.B. Flash Droughts: A Review and Assessment of the Challenges Imposed by Rapid-Onset Droughts in the United States. Bull. Am. Meteorol. Soc. 2018, 99, 911–919. [Google Scholar] [CrossRef]
- NDMC Drought Impact Reporter 2005. Available online: https://drought.unl.edu/Education/DroughtIn-depth/TypesofDrought.aspx (accessed on 21 May 2025).
- Zhang, K.; Zhao, F.; Zhang, B. Soil Water Content at Planting Affects Determining Agricultural Drought for Rainfed Spring Wheat. Atmosphere 2023, 14, 665. [Google Scholar] [CrossRef]
- Zhong, F.; Cheng, Q.; Wang, P. Meteorological Drought, Hydrological Drought, and NDVI in the Heihe River Basin, Northwest China: Evolution and Propagation. Adv. Meteorol. 2020, 2020, 2409068. [Google Scholar] [CrossRef]
- Svoboda, M.D.; Fuchs, B.A. Handbook of Drought Indicators and Indices*. In Drought and Water Crises; CRC Press: Boca Raton, FL, USA, 2017; ISBN 978-1-315-26555-1. [Google Scholar]
- Zeng, J.; Zhou, T.; Qu, Y.; Bento, V.A.; Qi, J.; Xu, Y.; Li, Y.; Wang, Q. An Improved Global Vegetation Health Index Dataset in Detecting Vegetation Drought. Sci. Data 2023, 10, 338. [Google Scholar] [CrossRef] [PubMed]
- Hao, Z.; AghaKouchak, A. Multivariate Standardized Drought Index: A Parametric Multi-Index Model. Adv. Water Resour. 2013, 57, 12–18. [Google Scholar] [CrossRef]
- Hao, Z.; Singh, V.P. Drought Characterization from a Multivariate Perspective: A Review. J. Hydrol. 2015, 527, 668–678. [Google Scholar] [CrossRef]
- Kchouk, S.; Melsen, L.A.; Walker, D.W.; Oel, P.R.V. A Geography of Drought Indices: Mismatch between Indicators of Drought and Its Impacts on Water and Food Securities. Nat. Hazards Earth Syst. Sci. 2022, 22, 323–344. [Google Scholar] [CrossRef]
- Mukherjee, S.; Mishra, A.; Trenberth, K.E. Climate Change and Drought: A Perspective on Drought Indices. Curr. Clim. Change Rep. 2018, 4, 145–163. [Google Scholar] [CrossRef]
- Chen, S.; Muhammad, W.; Lee, J.-H.; Kim, T.-W. Assessment of Probabilistic Multi-Index Drought Using a Dynamic Naive Bayesian Classifier. Water Resour. Manag. 2018, 32, 4359–4374. [Google Scholar] [CrossRef]
- Blauhut, V.; Stahl, K.; Stagge, J.H.; Tallaksen, L.M.; De Stefano, L.; Vogt, J. Estimating Drought Risk across Europe from Reported Drought Impacts, Drought Indices, and Vulnerability Factors. Hydrol. Earth Syst. Sci. 2016, 20, 2779–2800. [Google Scholar] [CrossRef]
- Yuan, S.; Quiring, S.M.; Patil, S. Spatial and Temporal Variations in the Accuracy of Meteorological Drought Maps [Variaciones Espaciales y Temporales En La Precisión de Los Mapas de Sequías Meteorológicas]. Cuad. Investig. Geogr. 2016, 42, 167–183. [Google Scholar] [CrossRef]
- McKee, T.B.; Doesken, N.J.; Kleist, J. The Relationship of Drought Frequency and Duration to Time Scales. In Proceedings of the 8th Conference on Applied Climatology, Anaheim, CA, USA, 17–22 January 1993; Volume 17, pp. 179–183. [Google Scholar]
- Lloyd-Hughes, B.; Saunders, M.A. A Drought Climatology for Europe. Int. J. Climatol. A J. R. Meteorol. Soc. 2002, 22, 1571–1592. [Google Scholar] [CrossRef]
- Vicente-Serrano, S.M.; Beguería, S.; López-Moreno, J.I. A Multiscalar Drought Index Sensitive to Global Warming: The Standardized Precipitation Evapotranspiration Index. J. Clim. 2010, 23, 1696–1718. [Google Scholar] [CrossRef]
- Modarres, R. Streamflow Drought Time Series Forecasting. Stoch. Env. Res. Ris. Assess. 2007, 21, 223–233. [Google Scholar] [CrossRef]
- Shukla, S.; Wood, A.W. Use of a Standardized Runoff Index for Characterizing Hydrologic Drought. Geophys. Res. Lett. 2008, 35, e2007GL032487. [Google Scholar] [CrossRef]
- Hao, Z.; Aghakouchak, A. A Nonparametric Multivariate Multi-Index Drought Monitoring Framework. J. Hydrometeorol. 2014, 15, 89–101. [Google Scholar] [CrossRef]
- Bloomfield, J.P.; Marchant, B.P. Analysis of Groundwater Drought Building on the Standardised Precipitation Index Approach. Hydrol. Earth Syst. Sci. 2013, 17, 4769–4787. [Google Scholar] [CrossRef]
- Staudinger, M.; Stahl, K.; Seibert, J. A Drought Index Accounting for Snow. Water Resour. Res. 2014, 50, 7861–7872. [Google Scholar] [CrossRef]
- Farahmand, A.; AghaKouchak, A.; Teixeira, J. A Vantage from Space Can Detect Earlier Drought Onset: An Approach Using Relative Humidity. Sci. Rep. 2015, 5, 8553. [Google Scholar] [CrossRef]
- Cui, A.; Li, J.; Zhou, Q.; Zhu, R.; Liu, H.; Wu, G.; Li, Q. Use of a Multiscalar GRACE-Based Standardized Terrestrial Water Storage Index for Assessing Global Hydrological Droughts. J. Hydrol. 2021, 603, 126871. [Google Scholar] [CrossRef]
- Wang, T.; Tu, X.; Singh, V.P.; Chen, X.; Lin, K.; Lai, R.; Zhou, Z. Socioeconomic Drought Analysis by Standardized Water Supply and Demand Index under Changing Environment. J. Clean. Prod. 2022, 347, 131248. [Google Scholar] [CrossRef]
- Palmer, W.C. Meteorological Drought; U.S. Department of Commerce, Weather Bureau: Silver Spring, MD, USA, 1965. [Google Scholar]
- Keyantash, J.A.; Dracup, J.A. An Aggregate Drought Index: Assessing Drought Severity Based on Fluctuations in the Hydrologic Cycle and Surface Water Storage. Water Resour. Res. 2004, 40, e2003WR002610. [Google Scholar] [CrossRef]
- Kao, S.-C.; Govindaraju, R.S. A Copula-Based Joint Deficit Index for Droughts. J. Hydrol. 2010, 380, 121–134. [Google Scholar] [CrossRef]
- Masud, M.B.; Qian, B.; Faramarzi, M. Performance of Multivariate and Multiscalar Drought Indices in Identifying Impacts on Crop Production. Int. J. Climatol. 2020, 40, 292–307. [Google Scholar] [CrossRef]
- Xu, Y.; Zhu, X.; Cheng, X.; Gun, Z.; Lin, J.; Zhao, J.; Yao, L.; Zhou, C. Drought Assessment of China in 2002–2017 Based on a Comprehensive Drought Index. Agric. For. Meteorol. 2022, 319, 108922. [Google Scholar] [CrossRef]
- Sepulcre-Canto, G.; Horion, S.; Singleton, A.; Carrao, H.; Vogt, J. Development of a Combined Drought Indicator to Detect Agricultural Drought in Europe. Nat. Hazards Earth Syst. Sci. 2012, 12, 3519–3531. [Google Scholar] [CrossRef]
- Labudová, L.; Labuda, M.; Takáč, J. Comparison of SPI and SPEI Applicability for Drought Impact Assessment on Crop Production in the Danubian Lowland and the East Slovakian Lowland. Theor. Appl. Climatol. 2017, 128, 491–506. [Google Scholar] [CrossRef]
- Mersin, D.; Gulmez, A.; Safari, M.J.S.; Vaheddoost, B.; Tayfur, G. Drought Assessment in the Aegean Region of Turkey. Pure Appl. Geophys. 2022, 179, 3035–3053. [Google Scholar] [CrossRef]
- Mohammed, S.; Alsafadi, K.; Enaruvbe, G.O.; Bashir, B.; Elbeltagi, A.; Széles, A.; Alsalman, A.; Harsanyi, E. Assessing the Impacts of Agricultural Drought (SPI/SPEI) on Maize and Wheat Yields across Hungary. Sci. Rep. 2022, 12, 8838. [Google Scholar] [CrossRef]
- Samantaray, A.K.; Ramadas, M.; Panda, R.K. Changes in Drought Characteristics Based on Rainfall Pattern Drought Index and the CMIP6 Multi-Model Ensemble. Agric. Water Manag. 2022, 266, 107568. [Google Scholar] [CrossRef]
- Sutanto, S.J.; Syaehuddin, W.A.; de Graaf, I. Hydrological Drought Forecasts Using Precipitation Data Depend on Catchment Properties and Human Activities. Commun. Earth Environ. 2024, 5, 118. [Google Scholar] [CrossRef]
- Wang, Y.; Zhao, W.; Zhang, Q.; Yao, Y. Characteristics of Drought Vulnerability for Maize in the Eastern Part of Northwest China. Sci. Rep. 2019, 9, 964. [Google Scholar] [CrossRef]
- Gong, R.; Chen, J.; Liang, Z.; Wu, C.; Tian, D.; Wu, J.; Li, S.; Zeng, G. Characterization and Propagation from Meteorological to Groundwater Drought in Different Aquifers with Multiple Timescales. J. Hydrol. Reg. Stud. 2023, 45, 101317. [Google Scholar] [CrossRef]
- Kamali, S.; Asghari, K. The Effect of Meteorological and Hydrological Drought on Groundwater Storage Under Climate Change Scenarios. Water Resour. Manag. 2023, 37, 2925–2943. [Google Scholar] [CrossRef]
- Karunakalage, A.; Lee, J.-Y.; Daqiq, M.T.; Cha, J.; Jang, J.; Kannaujiya, S. Characterization of Groundwater Drought and Understanding of Climatic Impact on Groundwater Resources in Korea. J. Hydrol. 2024, 634, 131014. [Google Scholar] [CrossRef]
- Thomas, B.F.; Famiglietti, J.S.; Landerer, F.W.; Wiese, D.N.; Molotch, N.P.; Argus, D.F. GRACE Groundwater Drought Index: Evaluation of California Central Valley Groundwater Drought. Remote Sens. Environ. 2017, 198, 384–392. [Google Scholar] [CrossRef]
- Wei, X.; Wu, X.; Zhang, H.; Lan, T.; Cheng, C.; Wu, Y.; Aggidis, G. A Framework for Drought Monitoring and Assessment from a Drought Propagation Perspective under Non-Stationary Environments. Sci. Total Environ. 2024, 953, 175981. [Google Scholar] [CrossRef]
- Wang, Y.; Li, J.; Feng, P.; Hu, R. A Time-Dependent Drought Index for Non-Stationary Precipitation Series. Water Resour. Manag. 2015, 29, 5631–5647. [Google Scholar] [CrossRef]
- Wang, Y.; Duan, L.; Liu, T.; Li, J.; Feng, P. A Non-Stationary Standardized Streamflow Index for Hydrological Drought Using Climate and Human-Induced Indices as Covariates. Sci. Total Environ. 2020, 699, 134278. [Google Scholar] [CrossRef]
- Zhang, T.; Su, X.; Feng, K. The Development of a Novel Nonstationary Meteorological and Hydrological Drought Index Using the Climatic and Anthropogenic Indices as Covariates. Sci. Total Environ. 2021, 786, 147385. [Google Scholar] [CrossRef]
- Guttman, N.B. On the Sensitivity of Sample L Moments to Sample Size. J. Clim. 1994, 7, 1026–1029. [Google Scholar] [CrossRef]
- Martins Careto, J.A.; Cardoso, R.M.; Russo, A.; André Lima, D.C.; Matos Soares, P.M. Generalised Drought Index: A Novel Multi-Scale Daily Approach for Drought Assessment. Geosci. Model. Dev. 2024, 17, 8115–8139. [Google Scholar] [CrossRef]
- Behfar, N.; Sharghi, E.; Nourani, V.; Booij, M.J. Drought Index Downscaling Using AI-Based Ensemble Technique and Satellite Data. Theor. Appl. Clim. 2024, 155, 2379–2397. [Google Scholar] [CrossRef]
- Tao, H.; Abba, S.I.; Al-Areeq, A.M.; Tangang, F.; Samantaray, S.; Sahoo, A.; Siqueira, H.V.; Maroufpoor, S.; Demir, V.; Dhanraj Bokde, N.; et al. Hybridized Artificial Intelligence Models with Nature-Inspired Algorithms for River Flow Modeling: A Comprehensive Review, Assessment, and Possible Future Research Directions. Eng. Appl. Artif. Intell. 2024, 129, 107559. [Google Scholar] [CrossRef]
- ANYWHERE. Available online: https://gebrada.upc.es/anywhere/the-project/ (accessed on 21 May 2025).
- Sutanto, S.J.; Lanen, H.A.J.V.; Wetterhall, F.; Llort, X. Potential of Pan-European Seasonal Hydrometeorological Drought Forecasts Obtained from a Multihazard Early Warning System. Bull. Am. Meteorol. Soc. 2020, 101, E368–E393. [Google Scholar] [CrossRef]
- Azimi, S.M.E.; Sadatinejad, S.J.; Malekian, A.; Jahangir, M.H. Application of Artificial Intelligence Hybrid Models for Meteorological Drought Prediction. Nat. Hazards 2023, 116, 2565–2589. [Google Scholar] [CrossRef]
- Oyounalsoud, M.S.; Yilmaz, A.G.; Abdallah, M.; Abdeljaber, A. Drought Prediction Using Artificial Intelligence Models Based on Climate Data and Soil Moisture. Sci. Rep. 2024, 14, 19700. [Google Scholar] [CrossRef]
- Alkaraki, K.F.; Hazaymeh, K. A Comprehensive Remote Sensing-Based Agriculture Drought Condition Indicator (CADCI) Using Machine Learning. Environ. Chall. 2023, 11, 100699. [Google Scholar] [CrossRef]
- Balsamo, G.; Agusti-Panareda, A.; Albergel, C.; Arduini, G.; Beljaars, A.; Bidlot, J.; Blyth, E.; Bousserez, N.; Boussetta, S.; Brown, A.; et al. Satellite and In Situ Observations for Advancing Global Earth Surface Modelling: A Review. Remote Sens. 2018, 10, 2038. [Google Scholar] [CrossRef]
- Hydrologic Remote Sensing: Capacity Building for Sustainability and Resilience; Hong, Y., Zhang, Y., Khan, S., Eds.; CRC Press: Boca Raton, FL, USA, 2016; ISBN 978-1-315-37039-2. [Google Scholar]
- Alahacoon, N.; Edirisinghe, M. A Comprehensive Assessment of Remote Sensing and Traditional Based Drought Monitoring Indices at Global and Regional Scale. Geomat. Nat. Hazards Risk 2022, 13, 762–799. [Google Scholar] [CrossRef]
- Schumacher, J.; Christiansen, J.R. LiDAR Applications to Forest-Water Interactions. In Forest-Water Interactions; Levia, D.F., Carlyle-Moses, D.E., Iida, S., Michalzik, B., Nanko, K., Tischer, A., Eds.; Springer International Publishing: Cham, Switzerland, 2020; pp. 87–112. ISBN 978-3-030-26086-6. [Google Scholar]
- Fahey, T.; Pham, H.; Gardi, A.; Sabatini, R.; Stefanelli, D.; Goodwin, I.; Lamb, D.W. Active and Passive Electro-Optical Sensors for Health Assessment in Food Crops. Sensors 2021, 21, 171. [Google Scholar] [CrossRef] [PubMed]
- Rouse, J.W.; Haas, R.H.; Schell, J.A.; Deering, D.W. Monitoring vegetation systems in the Great Plains with ERTS. In Third Earth Resources Technology Satellite-1 Symposium; NASA: Washington, DC, USA, 1974; Volume 1, pp. 309–317. [Google Scholar]
- Liu, H.Q.; Huete, A. A Feedback Based Modification of the NDVI to Minimize Canopy Background and Atmospheric Noise. IEEE Trans. Geosci. Remote Sens. 1995, 33, 457–465. [Google Scholar] [CrossRef]
- Gao, X.; Huete, A.R.; Ni, W.; Miura, T. Optical–Biophysical Relationships of Vegetation Spectra without Background Contamination. Remote Sens. Environ. 2000, 74, 609–620. [Google Scholar] [CrossRef]
- Tucker, C.J.; Pinzon, J.E.; Brown, M.E.; Slayback, D.A.; Pak, E.W.; Mahoney, R.; Vermote, E.F.; El Saleous, N. An Extended AVHRR 8-km NDVI Dataset Compatible with MODIS and SPOT Vegetation NDVI Data. Int. J. Remote Sens. 2005, 26, 4485–4498. [Google Scholar] [CrossRef]
- Kogan, F.N. Remote Sensing of Weather Impacts on Vegetation in Non-Homogeneous Areas. Int. J. Remote Sens. 1990, 11, 1405–1419. [Google Scholar] [CrossRef]
- Senhorelo, A.P.; Sousa, E.F.d.; Santos, A.R.d.; Ferrari, J.L.; Peluzio, J.B.E.; Zanetti, S.S.; Carvalho, R.d.C.F.; Camargo Filho, C.B.; Souza, K.B.d.; Moreira, T.R.; et al. Application of the Vegetation Condition Index in the Diagnosis of Spatiotemporal Distribution of Agricultural Droughts: A Case Study Concerning the State of Espírito Santo, Southeastern Brazil. Diversity 2023, 15, 460. [Google Scholar] [CrossRef]
- Xie, F.; Fan, H. Deriving Drought Indices from MODIS Vegetation Indices (NDVI/EVI) and Land Surface Temperature (LST): Is Data Reconstruction Necessary? Int. J. Appl. Earth Obs. Geoinf. 2021, 101, 102352. [Google Scholar] [CrossRef]
- Gao, B. NDWI—A Normalized Difference Water Index for Remote Sensing of Vegetation Liquid Water from Space. Remote Sens. Environ. 1996, 58, 257–266. [Google Scholar] [CrossRef]
- Gu, Y.; Brown, J.F.; Verdin, J.P.; Wardlow, B. A Five-Year Analysis of MODIS NDVI and NDWI for Grassland Drought Assessment over the Central Great Plains of the United States. Geophys. Res. Lett. 2007, 34, e2006GL029127. [Google Scholar] [CrossRef]
- Patel, N.R.; Parida, B.R.; Venus, V.; Saha, S.K.; Dadhwal, V.K. Analysis of Agricultural Drought Using Vegetation Temperature Condition Index (VTCI) from Terra/MODIS Satellite Data. Environ. Monit. Assess. 2012, 184, 7153–7163. [Google Scholar] [CrossRef] [PubMed]
- Kogan, F.N. Application of Vegetation Index and Brightness Temperature for Drought Detection. Adv. Space Res. 1995, 15, 91–100. [Google Scholar] [CrossRef]
- Damour, G.; Simonneau, T.; Cochard, H.; Urban, L. An Overview of Models of Stomatal Conductance at the Leaf Level. Plant Cell Environ. 2010, 33, 1419–1438. [Google Scholar] [CrossRef]
- Goetz, S.J. Multi-Sensor Analysis of NDVI, Surface Temperature and Biophysical Variables at a Mixed Grassland Site. Int. J. Remote Sens. 1997, 18, 71–94. [Google Scholar] [CrossRef]
- Jackson, R.D.; Idso, S.B.; Reginato, R.J.; Pinter, P.J., Jr. Canopy Temperature as a Crop Water Stress Indicator. Water Resour. Res. 1981, 17, 1133–1138. [Google Scholar] [CrossRef]
- McVicar, T.R.; Jupp, D.L.B. Using Covariates to Spatially Interpolate Moisture Availability in the Murray–Darling Basin: A Novel Use of Remotely Sensed Data. Remote Sens. Environ. 2002, 79, 199–212. [Google Scholar] [CrossRef]
- Rhee, J.; Im, J.; Carbone, G.J. Monitoring Agricultural Drought for Arid and Humid Regions Using Multi-Sensor Remote Sensing Data. Remote Sens. Environ. 2010, 114, 2875–2887. [Google Scholar] [CrossRef]
- Monteleone, B.; Bonaccorso, B.; Martina, M. A Joint Probabilistic Index for Objective Drought Identification: The Case Study of Haiti. Nat. Hazards Earth Syst. Sci. 2020, 20, 471–487. [Google Scholar] [CrossRef]
- Yin, G.; Zhang, H. A New Integrated Index for Drought Stress Monitoring Based on Decomposed Vegetation Response Factors. J. Hydrol. 2023, 618, 129252. [Google Scholar] [CrossRef]
- Le Page, M.; Zribi, M. Analysis and Predictability of Drought in Northwest Africa Using Optical and Microwave Satellite Remote Sensing Products. Sci. Rep. 2019, 9, 1466. [Google Scholar] [CrossRef] [PubMed]
- Ramat, G.; Santi, E.; Paloscia, S.; Fontanelli, G.; Pettinato, S.; Santurri, L.; Souissi, N.; Da Ponte, E.; Abdel Wahab, M.M.; Khalil, A.A.; et al. Remote Sensing Techniques for Water Management and Climate Change Monitoring in Drought Areas: Case Studies in Egypt and Tunisia. Eur. J. Remote Sens. 2023, 56, 2157335. [Google Scholar] [CrossRef]
- Moesinger, L.; Zotta, R.-M.; van der Schalie, R.; Scanlon, T.; de Jeu, R.; Dorigo, W. Monitoring Vegetation Condition Using Microwave Remote Sensing: The Standardized Vegetation Optical Depth Index (SVODI). Biogeosciences 2022, 19, 5107–5123. [Google Scholar] [CrossRef]
- Zhang, A.; Jia, G. Monitoring Meteorological Drought in Semiarid Regions Using Multi-Sensor Microwave Remote Sensing Data. Remote Sens. Environ. 2013, 134, 12–23. [Google Scholar] [CrossRef]
- Wardlow, B.D.; Anderson, M.C.; Hain, C.; Crow, W.T.; Otkin, J.; Tadesse, T.; AghaKouchak, A. Advancements in Satellite Remote Sensing for Drought Monitoring. In Drought and Water Crises; CRC Press: Boca Raton, FL, USA, 2017; ISBN 978-1-315-26555-1. [Google Scholar]
- Wu, X.; Feng, X.; Wang, Z.; Chen, Y.; Deng, Z. Multi-Source Precipitation Products Assessment on Drought Monitoring across Global Major River Basins. Atmos. Res. 2023, 295, 106982. [Google Scholar] [CrossRef]
- Alexopoulos, M.J.; Müller-Thomy, H.; Nistahl, P.; Šraj, M.; Bezak, N. Validation of Precipitation Reanalysis Products for Rainfall-Runoff Modelling in Slovenia. Hydrol. Earth Syst. Sci. 2023, 27, 2559–2578. [Google Scholar] [CrossRef]
- Beck, H.E.; Pan, M.; Roy, T.; Weedon, G.P.; Pappenberger, F.; van Dijk, A.I.J.M.; Huffman, G.J.; Adler, R.F.; Wood, E.F. Daily Evaluation of 26 Precipitation Datasets Using Stage-IV Gauge-Radar Data for the CONUS. Hydrol. Earth Syst. Sci. 2019, 23, 207–224. [Google Scholar] [CrossRef]
- Zhang, Y.; He, B.; Guo, L.; Liu, D. Differences in Response of Terrestrial Water Storage Components to Precipitation over 168 Global River Basins. J. Hydrometeorol. 2019, 20, 1981–1999. [Google Scholar] [CrossRef]
- Tapley, B.D.; Bettadpur, S.; Ries, J.C.; Thompson, P.F.; Watkins, M.M. GRACE Measurements of Mass Variability in the Earth System. Science 2004, 305, 503–505. [Google Scholar] [CrossRef]
- Long, D.; Shen, Y.; Sun, A.; Hong, Y.; Longuevergne, L.; Yang, Y.; Li, B.; Chen, L. Drought and Flood Monitoring for a Large Karst Plateau in Southwest China Using Extended GRACE Data. Remote Sens. Environ. 2014, 155, 145–160. [Google Scholar] [CrossRef]
- Wang, F.; Wang, Z.; Yang, H.; Di, D.; Zhao, Y.; Liang, Q. Utilizing GRACE-Based Groundwater Drought Index for Drought Characterization and Teleconnection Factors Analysis in the North China Plain. J. Hydrol. 2020, 585, 124849. [Google Scholar] [CrossRef]
- Mo, S.; Zhong, Y.; Forootan, E.; Shi, X.; Feng, W.; Yin, X.; Wu, J. Hydrological Droughts of 2017–2018 Explained by the Bayesian Reconstruction of GRACE(-FO) Fields. Water Resour. Res. 2022, 58, e2022WR031997. [Google Scholar] [CrossRef]
- Becker, M.; Meyssignac, B.; Xavier, L.; Cazenave, A.; Alkama, R.; Decharme, B. Past Terrestrial Water Storage (1980–2008) in the Amazon Basin Reconstructed from GRACE and in Situ River Gauging Data. Hydrol. Earth Syst. Sci. 2011, 15, 533–546. [Google Scholar] [CrossRef]
- Daqiq, M.T.; Sharma, R.; Karunakalage, A.; Kannaujiya, S. Determination of Groundwater Storage Variation, Deficit, and Abstraction in Afghanistan and the Assessment of the Evolution of Vadose Zone in Kabul City. IEEE Trans. Geosci. Remote Sens. 2023, 61, 5219618. [Google Scholar] [CrossRef]
- Do, S.K.; Akhtar, F.; Goffin, B.; Aryal, A.; Tran, T.-N.-D.; Lipscomb, M.; Lakshmi, V. Assessing Terrestrial Water Storage Variations in Afghanistan Using GRACE and FLDAS-Central Asia Data. J. Hydrol. Reg. Stud. 2024, 55, 101906. [Google Scholar] [CrossRef]
- Sediqi, M.N.; Shiru, M.S.; Nashwan, M.S.; Ali, R.; Abubaker, S.; Wang, X.; Ahmed, K.; Shahid, S.; Asaduzzaman, M.; Manawi, S.M.A. Spatio-Temporal Pattern in the Changes in Availability and Sustainability of Water Resources in Afghanistan. Sustainability 2019, 11, 5836. [Google Scholar] [CrossRef]
- Abrar Faiz, M.; Zhang, Y.; Tian, X.; Tian, J.; Zhang, X.; Ma, N.; Aryal, S. Drought Index Revisited to Assess Its Response to Vegetation in Different Agro-Climatic Zones. J. Hydrol. 2022, 614, 128543. [Google Scholar] [CrossRef]
- Ji, L.; Peters, A.J. Assessing Vegetation Response to Drought in the Northern Great Plains Using Vegetation and Drought Indices. Remote Sens. Environ. 2003, 87, 85–98. [Google Scholar] [CrossRef]
- Li, Y.; van Dijk, A.I.J.M.; Tian, S.; Renzullo, L.J. Skill and Lead Time of Vegetation Drought Impact Forecasts Based on Soil Moisture Observations. J. Hydrol. 2023, 620, 129420. [Google Scholar] [CrossRef]
- Njoku, E.G.; Jackson, T.J.; Lakshmi, V.; Chan, T.K.; Nghiem, S.V. Soil Moisture Retrieval from AMSR-E. IEEE Trans. Geosci. Remote Sens. 2003, 41, 215–229. [Google Scholar] [CrossRef]
- Kerr, Y.H.; Waldteufel, P.; Richaume, P.; Wigneron, J.P.; Ferrazzoli, P.; Mahmoodi, A.; Al Bitar, A.; Cabot, F.; Gruhier, C.; Juglea, S.E.; et al. The SMOS Soil Moisture Retrieval Algorithm. IEEE Trans. Geosci. Remote Sens. 2012, 50, 1384–1403. [Google Scholar] [CrossRef]
- Reichle, R.H.; Koster, R.D.; Liu, P.; Mahanama, S.P.P.; Njoku, E.G.; Owe, M. Comparison and Assimilation of Global Soil Moisture Retrievals from the Advanced Microwave Scanning Radiometer for the Earth Observing System (AMSR-E) and the Scanning Multichannel Microwave Radiometer (SMMR). J. Geophys. Res. Atmos. 2007, 112, e2006JD008033. [Google Scholar] [CrossRef]
- Rodell, M.; Houser, P.R.; Jambor, U.; Gottschalck, J.; Mitchell, K.; Meng, C.-J.; Arsenault, K.; Cosgrove, B.; Radakovich, J.; Bosilovich, M.; et al. The Global Land Data Assimilation System. Bull. Am. Meteorol. Soc. 2004, 85, 381–394. [Google Scholar] [CrossRef]
- Dee, D.P.; Uppala, S.M.; Simmons, A.J.; Berrisford, P.; Poli, P.; Kobayashi, S.; Andrae, U.; Balmaseda, M.A.; Balsamo, G.; Bauer, P.; et al. The ERA-Interim Reanalysis: Configuration and Performance of the Data Assimilation System. Q. J. R. Meteorol. Soc. 2011, 137, 553–597. [Google Scholar] [CrossRef]
- Rienecker, M.M.; Suarez, M.J.; Gelaro, R.; Todling, R.; Bacmeister, J.; Liu, E.; Bosilovich, M.G.; Schubert, S.D.; Takacs, L.; Kim, G.-K.; et al. MERRA: NASA’s Modern-Era Retrospective Analysis for Research and Applications. J. Clim. 2011, 24, 3624–3648. [Google Scholar] [CrossRef]
- Petropoulos, G.P.; Ireland, G.; Barrett, B. Surface Soil Moisture Retrievals from Remote Sensing: Current Status, Products & Future Trends. Phys. Chem. Earth Parts A/B/C 2015, 83–84, 36–56. [Google Scholar] [CrossRef]
- Li, W.; Wang, Y.; Yang, J. Cloudy Region Drought Index (CRDI) Based on Long-Time-Series Cloud Optical Thickness (COT) and Vegetation Conditions Index (VCI): A Case Study in Guangdong, South Eastern China. Remote Sens. 2020, 12, 3641. [Google Scholar] [CrossRef]
- Lv, A.; Yang, X.; Zhang, W.; Han, Y. Integrated Soil Moisture Fusion for Enhanced Agricultural Drought Monitoring in China. Agric. Water Manag. 2025, 311, 109401. [Google Scholar] [CrossRef]
- Alizadeh, M.R.; Nikoo, M.R. A Fusion-Based Methodology for Meteorological Drought Estimation Using Remote Sensing Data. Remote Sens. Environ. 2018, 211, 229–247. [Google Scholar] [CrossRef]
- Ali, S.; Ran, J.; Khorrami, B.; Wu, H.; Tariq, A.; Jehanzaib, M.; Khan, M.M.; Faisal, M. Downscaled GRACE/GRACE-FO Observations for Spatial and Temporal Monitoring of Groundwater Storage Variations at the Local Scale Using Machine Learning. Groundw. Sustain. Dev. 2024, 25, 101100. [Google Scholar] [CrossRef]
- Tapley, B.D.; Bettadpur, S.; Watkins, M.; Reigber, C. The Gravity Recovery and Climate Experiment: Mission Overview and Early Results. Geophys. Res. Lett. 2004, 31, e2004GL019920. [Google Scholar] [CrossRef]
- Babaeian, E.; Sadeghi, M.; Jones, S.B.; Montzka, C.; Vereecken, H.; Tuller, M. Ground, Proximal, and Satellite Remote Sensing of Soil Moisture. Rev. Geophys. 2019, 57, 530–616. [Google Scholar] [CrossRef]
- Kafy, A.-A.; Bakshi, A.; Saha, M.; Faisal, A.A.; Almulhim, A.I.; Rahaman, Z.A.; Mohammad, P. Assessment and Prediction of Index Based Agricultural Drought Vulnerability Using Machine Learning Algorithms. Sci. Total Environ. 2023, 867, 161394. [Google Scholar] [CrossRef] [PubMed]
- Akcapınar, M.C.; Çakmak, B. Yield Prediction Models for Some Wheat Varieties with Satellite-Based Drought Indices and Machine Learning Algorithms. Irrig. Drain. 2025, 74, 237–250. [Google Scholar] [CrossRef]
- van Huijgevoort, M.H.J.; Hazenberg, P.; van Lanen, H.A.J.; Uijlenhoet, R. A Generic Method for Hydrological Drought Identification across Different Climate Regions. Hydrol. Earth Syst. Sci. 2012, 16, 2437–2451. [Google Scholar] [CrossRef]
- Chen, F.; Li, J. Quantifying Drought and Water Scarcity: A Case Study in the Luanhe River Basin. Nat. Hazards 2016, 81, 1913–1927. [Google Scholar] [CrossRef]
- Melsen, L.A.; Guse, B. Hydrological Drought Simulations: How Climate and Model Structure Control Parameter Sensitivity. Water Resour. Res. 2019, 55, 10527–10547. [Google Scholar] [CrossRef]
- Heudorfer, B.; Stahl, K. Comparison of Different Threshold Level Methods for Drought Propagation Analysis in Germany. Hydrol. Res. 2016, 48, 1311–1326. [Google Scholar] [CrossRef]
- Laaha, G.; Gauster, T.; Tallaksen, L.M.; Vidal, J.-P.; Stahl, K.; Prudhomme, C.; Heudorfer, B.; Vlnas, R.; Ionita, M.; Van Lanen, H.A.J.; et al. The European 2015 Drought from a Hydrological Perspective. Hydrol. Earth Syst. Sci. 2017, 21, 3001–3024. [Google Scholar] [CrossRef]
- Sarailidis, G.; Vasiliades, L.; Loukas, A. Analysis of Streamflow Droughts Using Fixed and Variable Thresholds. Hydrol. Process. 2019, 33, 414–431. [Google Scholar] [CrossRef]
- Sung, J.H.; Chung, E.-S.; Lee, K.S. Development of Streamflow Drought Severity-and Magnitude-Duration-Frequency Curves Using the Threshold Level Method. Hydrol. Earth Syst. Sci. Discuss. 2013, 10, 14675–14704. [Google Scholar]
- Peters, E.; Torfs, P.J.J.F.; van Lanen, H.A.J.; Bier, G. Propagation of Drought through Groundwater—A New Approach Using Linear Reservoir Theory. Hydrol. Process. 2003, 17, 3023–3040. [Google Scholar] [CrossRef]
- Zelenhasić, E.; Salvai, A. A Method of Streamflow Drought Analysis. Water Resour. Res. 1987, 23, 156–168. [Google Scholar] [CrossRef]
- Santos, J.F.; Portela, M.M.; Naghettini, M.; Matos, J.P.; Silva, A.T. Precipitation Thresholds for Drought Recognition: A Further Use of the Standardized Precipitation Index, SPI. WIT Trans. Ecol. Environ. 2013, 172, 3–14. [Google Scholar] [CrossRef]
- Portela, M.M.; Dos Santos, J.F.; Silva, A.T.; Benitez, J.B.; Frank, C.; Reichert, J.M. Drought Analysis in Southern Paraguay, Brazil and Northern Argentina: Regionalization, Occurrence Rate and Rainfall Thresholds. Hydrol. Res. 2015, 46, 792–810. [Google Scholar] [CrossRef]
- Li, J.; Guo, Y.; Wang, Y.; Lu, S.; Chen, X. Drought Propagation Patterns under Naturalized Condition Using Daily Hydrometeorological Data. Adv. Meteorol. 2018, 2018, e2469156. [Google Scholar] [CrossRef]
- Rudd, A.C.; Bell, V.A.; Kay, A.L. National-Scale Analysis of Simulated Hydrological Droughts (1891–2015). J. Hydrol. 2017, 550, 368–385. [Google Scholar] [CrossRef]
- Vrochidou, A.-E.K.; Tsanis, I.K.; Grillakis, M.G.; Koutroulis, A.G. The Impact of Climate Change on Hydrometeorological Droughts at a Basin Scale. J. Hydrol. 2013, 476, 290–301. [Google Scholar] [CrossRef]
- Wong, W.K.; Beldring, S.; Engen-Skaugen, T.; Haddeland, I.; Hisdal, H. Climate Change Effects on Spatiotemporal Patterns of Hydroclimatological Summer Droughts in Norway. J. Hydrometeorol. 2011, 12, 1205–1220. [Google Scholar] [CrossRef]
- Rivera, J.A.; Araneo, D.C.; Penalba, O.C. Threshold Level Approach for Streamflow Drought Analysis in the Central Andes of Argentina: A Climatological Assessment. Hydrol. Sci. J. 2017, 62, 1949–1964. [Google Scholar] [CrossRef]
- Rangecroft, S.; Birkinshaw, S.; Rohse, M.; Day, R.; McEwen, L.; Makaya, E.; Van Loon, A. Hydrological Modelling as a Tool for Interdisciplinary Workshops on Future Drought. Prog. Phys. Geogr. Earth Environ. 2018, 42, 237–256. [Google Scholar] [CrossRef]
- Cammalleri, C.; Naumann, G.; Mentaschi, L.; Bisselink, B.; Gelati, E.; De Roo, A.; Feyen, L. Diverging Hydrological Drought Traits over Europe with Global Warming. Hydrol. Earth Syst. Sci. 2020, 24, 5919–5935. [Google Scholar] [CrossRef]
- Tallaksen, L.M.; Madsen, H.; Clausen, B. On the Definition and Modelling of Streamflow Drought Duration and Deficit Volume. Hydrol. Sci. J. 1997, 42, 15–33. [Google Scholar] [CrossRef]
- Van Loon, A.F. Hydrological Drought Explained. WIREs Water 2015, 2, 359–392. [Google Scholar] [CrossRef]
- Link, R.; Wild, T.B.; Snyder, A.C.; Hejazi, M.I.; Vernon, C.R. 100 Years of Data Is Not Enough to Establish Reliable Drought Thresholds. J. Hydrol. X 2020, 7, 100052. [Google Scholar] [CrossRef]
- Hannah, D.M.; Garner, G. River Water Temperature in the United Kingdom: Changes over the 20th Century and Possible Changes over the 21st Century. Prog. Phys. Geogr. 2015, 39, 68–92. [Google Scholar] [CrossRef]
- IPCC. Climate Change 2014—Impacts, Adaptation and Vulnerability: Regional Aspects; Cambridge University Press: Cambridge, UK, 2014; ISBN 978-1-107-05816-3. [Google Scholar]
- Cardona, O.D.; Aalst, M.K.V.; Birkmann, J.; Fordham, M.; Gregor, G.M.; Rosa, P.; Pulwarty, R.S.; Schipper, E.L.F.; Sinh, B.T.; Décamps, H.; et al. Determinants of Risk: Exposure and Vulnerability. In Managing the Risks of Extreme Events and Disasters to Advance Climate Change Adaptation: Special Report of the Intergovernmental Panel on Climate Change; Cambridge University Press: Cambridge, UK, 2012; pp. 65–108. [Google Scholar]
- AghaKouchak, A.; Huning, L.S.; Sadegh, M.; Qin, Y.; Markonis, Y.; Vahedifard, F.; Love, C.A.; Mishra, A.; Mehran, A.; Obringer, R.; et al. Toward Impact-Based Monitoring of Drought and Its Cascading Hazards. Nat. Rev. Earth Env. 2023, 4, 582–595. [Google Scholar] [CrossRef]
- Shyrokaya, A.; Messori, G.; Pechlivanidis, I.; Pappenberger, F.; Cloke, H.L.; Baldassarre, G.D. Significant Relationships between Drought Indicators and Impacts for the 2018–2019 Drought in Germany. Environ. Res. Lett. 2023, 19, 014037. [Google Scholar] [CrossRef]
- Lam, M.R.; Matanó, A.; Van Loon, A.F.; Odongo, R.A.; Teklesadik, A.D.; Wamucii, C.N.; van den Homberg, M.J.C.; Waruru, S.; Teuling, A.J. Linking Reported Drought Impacts with Drought Indices, Water Scarcity and Aridity: The Case of Kenya. Nat. Hazards Earth Syst. Sci. 2023, 23, 2915–2936. [Google Scholar] [CrossRef]
- Antwi, S.H.; Rolston, A.; Linnane, S.; Getty, D. Communicating Water Availability to Improve Awareness and Implementation of Water Conservation: A Study of the 2018 and 2020 Drought Events in the Republic of Ireland. Sci. Total Environ. 2022, 807, 150865. [Google Scholar] [CrossRef] [PubMed]
- de Brito, M.M.; Kuhlicke, C.; Marx, A. Near-Real-Time Drought Impact Assessment: A Text Mining Approach on the 2018/19 Drought in Germany. Environ. Res. Lett. 2020, 15, 1040a9. [Google Scholar] [CrossRef]
- Chen, X.; Tian, F.; Su, Y. How Did the Late 1920s Drought Affect Northern Chinese Society? Weather. Clim. Extrem. 2022, 36, 100451. [Google Scholar] [CrossRef]
- Chen, X.-D.; Su, Y.; Fang, X.-Q. Social Impacts of Extreme Drought Event in Guanzhong Area, Shaanxi Province, during 1928–1931. Clim. Change 2021, 164, 27. [Google Scholar] [CrossRef]
- O’Connor, P.; Murphy, C.; Matthews, T.; Wilby, R.L. Relating Drought Indices to Impacts Reported in Newspaper Articles. Int. J. Climatol. 2023, 43, 1796–1816. [Google Scholar] [CrossRef]
- Sodoge, J.; Kuhlicke, C.; de Brito, M.M. Automatized Spatio-Temporal Detection of Drought Impacts from Newspaper Articles Using Natural Language Processing and Machine Learning. Weather. Clim. Extrem. 2023, 41, 100574. [Google Scholar] [CrossRef]
- Erfurt, M.; Glaser, R.; Blauhut, V. Changing Impacts and Societal Responses to Drought in Southwestern Germany since 1800. Reg. Environ. Change 2019, 19, 2311–2323. [Google Scholar] [CrossRef]
- Stahl, K.; Blauhut, V.; Kohn, I.; Acácio, V.; Assimacopoulos, D.; Bifulco, C.; De Stefano, L.; Dias, S.; Eilertz, D.; Frielingsdorf, B.; et al. A European Drought Impact Report Inventory (EDII): Design and Testfor Selected Recent Droughts in Europe. 2012. Available online: https://d1wqtxts1xzle7.cloudfront.net/77559569/A_EUROPEAN_DROUGHT_IMPACT_REPORT_INVENTO20211229-22794-bxky3g.pdf?1738461626=&response-content-disposition=inline%3B+filename%3DA_European_drought_impact_report_invento.pdf&Expires=1753611225&Signature=c3N1eiiGIlxXmLicX~c53NtffkMKMQimw4qzCuRQCbSvJReAQpPBcrqdfn3ArK-xWSace7VymrGjWyAK918HXg8uF-7NMt~ZCZYdz7fgF4TJC4lF5KyAW-NYOs1akXfkATxiY9lbqK4XkA1Gqh1CObfzQMvge4bQqbjoWY44tpivG~RpH9o2Cm0Gv9N2cN0AZf4hfY0hyJV0HTyjkRNEx19guFEu2FuPyXPr26ncvnIayT0QwUY4c7iLEGmMKSB9rvLiL6R50kLJy8LApk57JkJt1ha3F~Do8r67gl0XbILgNx~M4BqK-e2nhFNXejcUUfuGnNjExGqPQVmwfrxZtg__&Key-Pair-Id=APKAJLOHF5GGSLRBV4ZA (accessed on 21 May 2025).
- Stahl, K.; Kohn, I.; Blauhut, V.; Urquijo, J.; De Stefano, L.; Acácio, V.; Dias, S.; Stagge, J.H.; Tallaksen, L.M.; Kampragou, E.; et al. Impacts of European Drought Events: Insights from an International Database of Text-Based Reports. Nat. Hazards Earth Syst. Sci. 2016, 16, 801–819. [Google Scholar] [CrossRef]
- Blauhut, V.; Gudmundsson, L.; Stahl, K. Towards Pan-European Drought Risk Maps: Quantifying the Link between Drought Indices and Reported Drought Impacts. Environ. Res. Lett. 2015, 10, 014008. [Google Scholar] [CrossRef]
- Stagge, J.H.; Kohn, I.; Tallaksen, L.M.; Stahl, K. Modeling Drought Impact Occurrence Based on Meteorological Drought Indices in Europe. J. Hydrol. 2015, 530, 37–50. [Google Scholar] [CrossRef]
- Torelló-Sentelles, H.; Franzke, C.L.E. Drought Impact Links to Meteorological Drought Indicators and Predictability in Spain. Hydrol. Earth Syst. Sci. 2022, 26, 1821–1844. [Google Scholar] [CrossRef]
- Bachmair, S.; Svensson, C.; Hannaford, J.; Barker, L.J.; Stahl, K. A Quantitative Analysis to Objectively Appraise Drought Indicators and Model Drought Impacts. Hydrol. Earth Syst. Sci. 2016, 20, 2589–2609. [Google Scholar] [CrossRef]
- Stephan, R.; Erfurt, M.; Terzi, S.; Žun, M.; Kristan, B.; Haslinger, K.; Stahl, K. An Inventory of Alpine Drought Impact Reports to Explore Past Droughts in a Mountain Region. Nat. Hazards Earth Syst. Sci. 2021, 21, 2485–2501. [Google Scholar] [CrossRef]
- Bachmair, S.; Kohn, I.; Stahl, K. Exploring the Link between Drought Indicators and Impacts. Nat. Hazards Earth Syst. Sci. 2015, 15, 1381–1397. [Google Scholar] [CrossRef]
- Hobeichi, S.; Abramowitz, G.; Evans, J.P.; Ukkola, A. Toward a Robust, Impact-Based, Predictive Drought Metric. Water Resour. Res. 2022, 58, e2021WR031829. [Google Scholar] [CrossRef]
- Sutanto, S.J.; van der Weert, M.; Wanders, N.; Blauhut, V.; Van Lanen, H.A.J. Moving from Drought Hazard to Impact Forecasts. Nat. Commun. 2019, 10, 4945. [Google Scholar] [CrossRef]
- Moshir Panahi, D.; Blauhut, V.; Raziei, T.; Zahabiyoun, B. Drought Vulnerability Range Assessment: A Dynamic and Impact-Driven Method for Multiple Vulnerable Systems. Int. J. Disaster Risk Reduct. 2023, 91, 103701. [Google Scholar] [CrossRef]
- Lin, S.-Y.; Kung, Y.-C.; Leu, F.-Y. Predictive Intelligence in Harmful News Identification by BERT-Based Ensemble Learning Model with Text Sentiment Analysis. Inf. Process. Manag. 2022, 59, 102872. [Google Scholar] [CrossRef]
- Zhang, B.; Abu Salem, F.K.; Hayes, M.J.; Smith, K.H.; Tadesse, T.; Wardlow, B.D. Explainable Machine Learning for the Prediction and Assessment of Complex Drought Impacts. Sci. Total Environ. 2023, 898, 165509. [Google Scholar] [CrossRef] [PubMed]
- Sillmann, J.; Shepherd, T.; van den Hurk, B.; Hazeleger, W.; Martius, O.; Zscheischler, J. Physical Modeling Supporting a Storyline Approach; CICERO Senter for klimaforskning: Oslo, Norway, 2019; Volume 2019:01. [Google Scholar]
- van den Hurk, B.J.J.M.; Baldissera Pacchetti, M.; Boere, E.; Ciullo, A.; Coulter, L.; Dessai, S.; Ercin, E.; Goulart, H.M.D.; Hamed, R.; Hochrainer-Stigler, S.; et al. Climate Impact Storylines for Assessing Socio-Economic Responses to Remote Events. Clim. Risk Manag. 2023, 40, 100500. [Google Scholar] [CrossRef]
- Gessner, C.; Fischer, E.M.; Beyerle, U.; Knutti, R. Multi-Year Drought Storylines for Europe and North America from an Iteratively Perturbed Global Climate Model. Weather. Clim. Extrem. 2022, 38, 100512. [Google Scholar] [CrossRef]
- Shepherd, T.G.; Boyd, E.; Calel, R.A.; Chapman, S.C.; Dessai, S.; Dima-West, I.M.; Fowler, H.J.; James, R.; Maraun, D.; Martius, O.; et al. Storylines: An Alternative Approach to Representing Uncertainty in Physical Aspects of Climate Change. Clim. Change 2018, 151, 555–571. [Google Scholar] [CrossRef]
- Baulenas, E.; Versteeg, G.; Terrado, M.; Mindlin, J.; Bojovic, D. Assembling the Climate Story: Use of Storyline Approaches in Climate-Related Science. Glob. Chall. 2023, 7, 2200183. [Google Scholar] [CrossRef]
- Hazeleger, W.; van den Hurk, B.J.J.M.; Min, E.; van Oldenborgh, G.J.; Petersen, A.C.; Stainforth, D.A.; Vasileiadou, E.; Smith, L.A. Tales of Future Weather. Nat. Clim. Change 2015, 5, 107–113. [Google Scholar] [CrossRef]
- Aalbers, E.E.; van Meijgaard, E.; Lenderink, G.; de Vries, H.; van den Hurk, B.J.J.M. The 2018 West-Central European Drought Projected in a Warmer Climate: How Much Drier Can It Get? Nat. Hazards Earth Syst. Sci. 2023, 23, 1921–1946. [Google Scholar] [CrossRef]
- Chan, W.C.H.; Shepherd, T.G.; Facer-Childs, K.; Darch, G.; Arnell, N.W. Storylines of UK Drought Based on the 2010–2012 Event. Hydrol. Earth Syst. Sci. 2022, 26, 1755–1777. [Google Scholar] [CrossRef]
- Chan, W.C.H.; Arnell, N.W.; Darch, G.; Facer-Childs, K.; Shepherd, T.G.; Tanguy, M.; van der Wiel, K. Current and Future Risk of Unprecedented Hydrological Droughts in Great Britain. J. Hydrol. 2023, 625, 130074. [Google Scholar] [CrossRef]
- Benítez, A.S.; Ionita, M.; Athanase, M.; Jung, T.; Ma, Q.; Goessling, H. Storyline Simulations Suggest a Northward Expansion of European Droughts in Warmer Climates; In Proceedings of the European Geosciences Union General Assembly 2024, Vienna, Austria, 14–19 April 2024.
- Sillmann, J.; Shepherd, T.G.; van den Hurk, B.; Hazeleger, W.; Martius, O.; Slingo, J.; Zscheischler, J. Event-Based Storylines to Address Climate Risk. Earth’s Future 2021, 9, e2020EF001783. [Google Scholar] [CrossRef]
- van Tiel, M.; Weiler, M.; Freudiger, D.; Moretti, G.; Kohn, I.; Gerlinger, K.; Stahl, K. Melting Alpine Water Towers Aggravate Downstream Low Flows: A Stress-Test Storyline Approach. Earth’s Future 2023, 11, e2022EF003408. [Google Scholar] [CrossRef]
- Zhou, Z.; Zhang, L.; Chen, J.; She, D.; Wang, G.; Zhang, Q.; Xia, J.; Zhang, Y. Projecting Global Drought Risk Under Various SSP-RCP Scenarios. Earth’s Future 2023, 11, e2022EF003420. [Google Scholar] [CrossRef]
- Bjarke, N.; Livneh, B.; Barsugli, J. Storylines for Global Hydrologic Drought Within CMIP6. Earth’s Future 2024, 12, e2023EF004117. [Google Scholar] [CrossRef]
- Van Vuuren, D.P.; Edmonds, J.A.; Kainuma, M.; Riahi, K.; Weyant, J. Representative Concentration Pathways (RCPs). Clim. Change 2011, 109, 1. [Google Scholar] [CrossRef]
- Wehrli, K.; Hauser, M.; Seneviratne, S.I. Storylines of the 2018 Northern Hemisphere Heatwave at Pre-Industrial and Higher Global Warming Levels. Earth Syst. Dyn. 2020, 11, 855–873. [Google Scholar] [CrossRef]
- Chan, W.C.H.; Arnell, N.W.; Darch, G.; Facer-Childs, K.; Shepherd, T.G.; Tanguy, M. Added Value of Seasonal Hindcasts to Create UK Hydrological Drought Storylines. Nat. Hazards Earth Syst. Sci. 2024, 24, 1065–1078. [Google Scholar] [CrossRef]
- Wang, T.; Tu, X.; Singh, V.P.; Chen, X.; Lin, K. Global Data Assessment and Analysis of Drought Characteristics Based on CMIP6. J. Hydrol. 2021, 596, 126091. [Google Scholar] [CrossRef]
- Fossa Riglos, M.F.; Díaz, L.B.; Hernández, V.; Sörensson, A.A.; Osman, M.; Rivera, J.; Robledo, F.; Prudente, C. Climate Storylines as a Tool for Interdisciplinary Dialogue on Risk Decision-Making: Analyzing a Severe Drought in Southeastern South America. Environ. Sci. Policy 2024, 160, 103848. [Google Scholar] [CrossRef]
- Tosic, M.; Djurdjevic, V.; Tosic, I.; Lazic, I. Storyline Approach for the Analysis of the 2012 Drought in Serbia and Possible Future Similar Events. In EGU General Assembly Conference Abstracts; European Geosciences Union: Munich, Germany, 2024. [Google Scholar]
- Stapleton, J.; Carter, C.; Bredahl, L. Developing Systematic Search Methods for the Library Literature: Methods and Analysis. J. Acad. Librariansh. 2020, 46, 102190. [Google Scholar] [CrossRef]
- Elsevier B.V. Elsevier B.V. Scopus. Available online: https://www.scopus.com (accessed on 14 July 2024).
- Demuzere, M.; Bechtel, B.; Middel, A.; Mills, G. Mapping Europe into Local Climate Zones. PLoS ONE 2019, 14, e0214474. [Google Scholar] [CrossRef] [PubMed]
- Tucker, C.J.; Choudhury, B.J. Satellite Remote Sensing of Drought Conditions. Remote Sens. Environ. 1987, 23, 243–251. [Google Scholar] [CrossRef]
- Shi, P.; Tang, H.; Qu, S.; Zhao, L.; Li, Q. Drought Propagation in Karst and Non-Karst Regions in Southwest China Compared on a Daily Scale. J. Hydrol. Reg. Stud. 2024, 51, 101628. [Google Scholar] [CrossRef]
- Sogno, P.; Klein, I.; Kuenzer, C. Remote Sensing of Surface Water Dynamics in the Context of Global Change—A Review. Remote Sens. 2022, 14, 2475. [Google Scholar] [CrossRef]
- Weiss, M.; Jacob, F.; Duveiller, G. Remote Sensing for Agricultural Applications: A Meta-Review. Remote Sens. Environ. 2020, 236, 111402. [Google Scholar] [CrossRef]
- Kogan, F. Vegetation Health for Insuring Drought-Related Yield Losses and Food Security Enhancement. In Remote Sensing for Food Security; Kogan, F., Ed.; Springer International Publishing: Cham, Switzerland, 2019; pp. 163–173. ISBN 978-3-319-96256-6. [Google Scholar]
- Kogan, F.; Guo, W.; Yang, W. Drought and Food Security Prediction from NOAA New Generation of Operational Satellites. Geomat. Nat. Hazards Risk 2019, 10, 651–666. [Google Scholar] [CrossRef]
- He, X.; Estes, L.; Konar, M.; Tian, D.; Anghileri, D.; Baylis, K.; Evans, T.P.; Sheffield, J. Integrated Approaches to Understanding and Reducing Drought Impact on Food Security across Scales. Curr. Opin. Environ. Sustain. 2019, 40, 43–54. [Google Scholar] [CrossRef]
- Fung, K.F.; Huang, Y.F.; Koo, C.H.; Soh, Y.W. Drought Forecasting: A Review of Modelling Approaches 2007–2017. J. Water Clim. Change 2019, 11, 771–799. [Google Scholar] [CrossRef]
- Mishra, A.K.; Singh, V.P. Drought Modeling—A Review. J. Hydrol. 2011, 403, 157–175. [Google Scholar] [CrossRef]
- Doulgeris, K.-M.; Komppula, M.; Romakkaniemi, S.; Hyvärinen, A.-P.; Kerminen, V.-M.; Brus, D. In Situ Cloud Ground-Based Measurements in the Finnish Sub-Arctic: Intercomparison of Three Cloud Spectrometer Setups. Atmos. Meas. Tech. 2020, 13, 5129–5147. [Google Scholar] [CrossRef]
- Sheffield, J.; Wood, E.F.; Pan, M.; Beck, H.; Coccia, G.; Serrat-Capdevila, A.; Verbist, K. Satellite Remote Sensing for Water Resources Management: Potential for Supporting Sustainable Development in Data-Poor Regions. Water Resour. Res. 2018, 54, 9724–9758. [Google Scholar] [CrossRef]
- Eicken, H.; Danielsen, F.; Sam, J.-M.; Fidel, M.; Johnson, N.; Poulsen, M.K.; Lee, O.A.; Spellman, K.V.; Iversen, L.; Pulsifer, P.; et al. Connecting Top-Down and Bottom-Up Approaches in Environmental Observing. BioScience 2021, 71, 467–483. [Google Scholar] [CrossRef] [PubMed]
- Bhave, A.G.; Mishra, A.; Raghuwanshi, N.S. A Combined Bottom-up and Top-down Approach for Assessment of Climate Change Adaptation Options. J. Hydrol. 2014, 518, 150–161. [Google Scholar] [CrossRef]
- Kim, Y.H.; Sting, F.J.; Loch, C.H. Top-down, Bottom-up, or Both? Toward an Integrative Perspective on Operations Strategy Formation. J. Oper. Manag. 2014, 32, 462–474. [Google Scholar] [CrossRef]
- Pausas, J.G.; Millán, M.M. Greening and Browning in a Climate Change Hotspot: The Mediterranean Basin. BioScience 2019, 69, 143–151. [Google Scholar] [CrossRef]
- Guo, Y.; Huang, S.; Huang, Q.; Wang, H.; Fang, W.; Yang, Y.; Wang, L. Assessing Socioeconomic Drought Based on an Improved Multivariate Standardized Reliability and Resilience Index. J. Hydrol. 2019, 568, 904–918. [Google Scholar] [CrossRef]
- Huang, S.; Huang, Q.; Leng, G.; Liu, S. A Nonparametric Multivariate Standardized Drought Index for Characterizing Socioeconomic Drought: A Case Study in the Heihe River Basin. J. Hydrol. 2016, 542, 875–883. [Google Scholar] [CrossRef]
- Liu, S.; Shi, H.; Sivakumar, B. Socioeconomic Drought Under Growing Population and Changing Climate: A New Index Considering the Resilience of a Regional Water Resources System. J. Geophys. Res. Atmos. 2020, 125, e2020JD033005. [Google Scholar] [CrossRef]
- Wang, Y.; Liu, S.; Huang, S.; Zhou, Z.; Shi, H. Bivariate Assessment of Socioeconomic Drought Events Based on an Improved Socioeconomic Drought Index. J. Hydrol. 2023, 623, 129878. [Google Scholar] [CrossRef]
- Rouault, P.; Courault, D.; Flamain, F.; Pouget, G.; Doussan, C.; Lopez-Lozano, R.; McCabe, M.; Debolini, M. High-Resolution Satellite Imagery to Assess Orchard Characteristics Impacting Water Use. Agric. Water Manag. 2024, 295, 108763. [Google Scholar] [CrossRef]
- Garg, V.; Eslamian, S. Monitoring, Assessment, and Forecasting of Drought Using Remote Sensing and the Geographical Information System. In Handbook of Drought and Water Scarcity; CRC Press: Boca Raton, FL, USA, 2017; ISBN 978-1-315-40421-9. [Google Scholar]
- Kikon, A.; Deka, P.C. Artificial Intelligence Application in Drought Assessment, Monitoring and Forecasting: A Review. Stoch. Env. Res. Risk Assess. 2022, 36, 1197–1214. [Google Scholar] [CrossRef]
- Essamlali, I.; Nhaila, H.; El Khaili, M. Advances in Machine Learning and IoT for Water Quality Monitoring: A Comprehensive Review. Heliyon 2024, 10, e27920. [Google Scholar] [CrossRef] [PubMed]
- Rad, A.M.; AghaKouchak, A.; Navari, M.; Sadegh, M. Progress, Challenges, and Opportunities in Remote Sensing of Drought. In Global Drought and Flood; American Geophysical Union (AGU): Washington, DC, USA, 2021; pp. 1–28. ISBN 978-1-119-42733-9. [Google Scholar]
- Wilhite, D.A.; Hayes, M.J.; Svoboda, M.D. Drought Monitoring and Assessment: Status and Trends in the United States. In Drought and Drought Mitigation in Europe; Vogt, J.V., Somma, F., Eds.; Springer: Dordrecht, The Netherlands, 2000; pp. 149–160. ISBN 978-94-015-9472-1. [Google Scholar]
- Nicolai-Shaw, N.; Zscheischler, J.; Hirschi, M.; Gudmundsson, L.; Seneviratne, S.I. A Drought Event Composite Analysis Using Satellite Remote-Sensing Based Soil Moisture. Remote Sens. Environ. 2017, 203, 216–225. [Google Scholar] [CrossRef]
- Barua, S.; Ng, A.W.M.; Perera, B.J.C. Drought Assessment and Forecasting: A Case Study on the Yarra River Catchment in Victoria, Australia. Australas. J. Water Resour. 2012, 15, 95–108. [Google Scholar] [CrossRef]
- Hao, Z.; Singh, V.P.; Xia, Y. Seasonal Drought Prediction: Advances, Challenges, and Future Prospects. Rev. Geophys. 2018, 56, 108–141. [Google Scholar] [CrossRef]
- Zellou, B.; El Moçayd, N.; Bergou, E.H. Review Article: Towards Improved Drought Prediction in the Mediterranean Region—Modeling Approaches and Future Directions. Nat. Hazards Earth Syst. Sci. 2023, 23, 3543–3583. [Google Scholar] [CrossRef]
- Albahri, A.S.; Khaleel, Y.L.; Habeeb, M.A.; Ismael, R.D.; Hameed, Q.A.; Deveci, M.; Homod, R.Z.; Albahri, O.S.; Alamoodi, A.H.; Alzubaidi, L. A Systematic Review of Trustworthy Artificial Intelligence Applications in Natural Disasters. Comput. Electr. Eng. 2024, 118, 109409. [Google Scholar] [CrossRef]
- Funk, C.; Peterson, P.; Landsfeld, M.; Pedreros, D.; Verdin, J.; Shukla, S.; Husak, G.; Rowland, J.; Harrison, L.; Hoell, A.; et al. The Climate Hazards Infrared Precipitation with Stations—A New Environmental Record for Monitoring Extremes. Sci. Data 2015, 2, 150066. [Google Scholar] [CrossRef]
- Guo, H.; Bao, A.; Liu, T.; Ndayisaba, F.; He, D.; Kurban, A.; De Maeyer, P. Meteorological Drought Analysis in the Lower Mekong Basin Using Satellite-Based Long-Term CHIRPS Product. Sustainability 2017, 9, 901. [Google Scholar] [CrossRef]
- Gupta, A.; Jain, M.K.; Pandey, R.P.; Gupta, V.; Saha, A. Evaluation of Global Precipitation Products for Meteorological Drought Assessment with Respect to IMD Station Datasets over India. Atmos. Res. 2024, 297, 107104. [Google Scholar] [CrossRef]
- Li, Y.; Yan, H.; Chen, L.; Huang, M.; Shou, W.; Zhu, L.; Zhao, L.; Xing, Y. Performance and Uncertainties of Five Popular Satellite-Based Precipitation Products in Drought Monitoring for Different Climate Regions. J. Hydrol. 2024, 628, 130562. [Google Scholar] [CrossRef]
- Sa’adi, Z.; Yusop, Z.; Alias, N.E.; Shiru, M.S.; Muhammad, M.K.I.; Ramli, M.W.A. Application of CHIRPS Dataset in the Selection of Rain-Based Indices for Drought Assessments in Johor River Basin, Malaysia. Sci. Total Environ. 2023, 892, 164471. [Google Scholar] [CrossRef]
- Sandeep, P.; Obi Reddy, G.P.; Jegankumar, R.; Arun Kumar, K.C. Monitoring of Agricultural Drought in Semi-Arid Ecosystem of Peninsular India through Indices Derived from Time-Series CHIRPS and MODIS Datasets. Ecol. Indic. 2021, 121, 107033. [Google Scholar] [CrossRef]
- Wei, L.; Jiang, S.; Ren, L.; Wang, M.; Zhang, L.; Liu, Y.; Yuan, F.; Yang, X. Evaluation of Seventeen Satellite-, Reanalysis-, and Gauge-Based Precipitation Products for Drought Monitoring across Mainland China. Atmos. Res. 2021, 263, 105813. [Google Scholar] [CrossRef]
- Wu, W.; Li, Y.; Luo, X.; Zhang, Y.; Ji, X.; Li, X. Performance Evaluation of the CHIRPS Precipitation Dataset and Its Utility in Drought Monitoring over Yunnan Province, China. Geomat. Nat. Hazards Risk 2019, 10, 2145–2162. [Google Scholar] [CrossRef]
- Zhang, H.; Loaiciga, H.A.; Du, Q.; Sauter, T. Comprehensive Evaluation of Global Precipitation Products and Their Accuracy in Drought Detection in Mainland China. J. Hydrometeorol. 2023, 24, 1907–1937. [Google Scholar] [CrossRef]
- Zhao, H.; Ma, Y. Evaluating the Drought-Monitoring Utility of Four Satellite-Based Quantitative Precipitation Estimation Products at Global Scale. Remote Sens. 2019, 11, 2010. [Google Scholar] [CrossRef]
- Xie, P.; Arkin, P.A. Global Precipitation: A 17-Year Monthly Analysis Based on Gauge Observations, Satellite Estimates, and Numerical Model Outputs. Bull. Am. Meteorol. Soc. 1997, 78, 2539–2558. [Google Scholar] [CrossRef]
- Almazroui, M. Assessment of Meteorological Droughts over Saudi Arabia Using Surface Rainfall Observations during the Period 1978–2017. Arab. J. Geosci. 2019, 12, 694. [Google Scholar] [CrossRef]
- Zhou, J.; Lau, K.-M. Principal Modes of Interannual and Decadal Variability of Summer Rainfall over South America. Int. J. Climatol. 2001, 21, 1623–1644. [Google Scholar] [CrossRef]
- Xie, P.; Joyce, R.; Wu, S.; Yoo, S.-H.; Yarosh, Y.; Sun, F.; Lin, R. Reprocessed, Bias-Corrected CMORPH Global High-Resolution Precipitation Estimates from 1998. J. Hydrometeorol. 2017, 18, 1617–1641. [Google Scholar] [CrossRef]
- Chua, Z.-W.; Kuleshov, Y.; Watkins, A.B. Drought Detection over Papua New Guinea Using Satellite-Derived Products. Remote Sens. 2020, 12, 3859. [Google Scholar] [CrossRef]
- Lessel, J.; Sweeney, A.; Ceccato, P. An Agricultural Drought Severity Index Using Quasi-Climatological Anomalies of Remotely Sensed Data. Int. J. Remote Sens. 2016, 37, 913–925. [Google Scholar] [CrossRef]
- Lu, J.; Jia, L.; Menenti, M.; Yan, Y.; Zheng, C.; Zhou, J. Performance of the Standardized Precipitation Index Based on the TMPA and CMORPH Precipitation Products for Drought Monitoring in China. IEEE J. Sel. Top. Appl. Earth Obs. Remote Sens. 2018, 11, 1387–1396. [Google Scholar] [CrossRef]
- Vernimmen, R.R.E.; Hooijer, A.; Mamenun; Aldrian, E.; van Dijk, A.I.J.M. Evaluation and Bias Correction of Satellite Rainfall Data for Drought Monitoring in Indonesia. Hydrol. Earth Syst. Sci. 2012, 16, 133–146. [Google Scholar] [CrossRef]
- Wang, F.; Yang, H.; Wang, Z.; Zhang, Z.; Li, Z. Drought Evaluation with CMORPH Satellite Precipitation Data in the Yellow River Basin by Using Gridded Standardized Precipitation Evapotranspiration Index. Remote Sens. 2019, 11, 485. [Google Scholar] [CrossRef]
- Wang, H.; Vicente-serrano, S.M.; Tao, F.; Zhang, X.; Wang, P.; Zhang, C.; Chen, Y.; Zhu, D.; Kenawy, A.E. Monitoring Winter Wheat Drought Threat in Northern China Using Multiple Climate-Based Drought Indices and Soil Moisture during 2000–2013. Agric. For. Meteorol. 2016, 228–229, 1–12. [Google Scholar] [CrossRef]
- Zhu, Q.; Luo, Y.; Zhou, D.; Xu, Y.-P.; Wang, G.; Tian, Y. Drought Prediction Using in Situ and Remote Sensing Products with SVM over the Xiang River Basin, China. Nat. Hazards 2021, 105, 2161–2185. [Google Scholar] [CrossRef]
- Huffman, G.J.; Adler, R.F.; Bolvin, D.T.; Hsu, K.; Kidd, C.; Nelkin, E.J.; Tan, J.; Xie, P. Algorithm Theoretical Basis Document (ATBD) for Global Precipitation Climatology Project Version 3.0 Precipitation Data; MEaSUREs Project: Greenbelt, MD, USA, 2019. Available online: https://docserver.gesdisc.eosdis.nasa.gov/public/project/MEaSUREs/GPCP/GPCP_ATBD_V3.1.pdf (accessed on 21 May 2025).
- Andrade-Gómez, L.; Cavazos, T. Historical Meteorological Droughts over the CORDEX-CAM (Central America, Caribbean and Mexico) Domain: Evaluating the Simulation of Dry Hot Spots with RegCM4. Int. J. Climatol. 2024, 44, 1110–1134. [Google Scholar] [CrossRef]
- Dai, A.; Zhao, T. Uncertainties in Historical Changes and Future Projections of Drought. Part I: Estimates of Historical Drought Changes. Clim. Change 2017, 144, 519–533. [Google Scholar] [CrossRef]
- Golian, S.; Javadian, M.; Behrangi, A. On the Use of Satellite, Gauge, and Reanalysis Precipitation Products for Drought Studies. Environ. Res. Lett. 2019, 14, 075005. [Google Scholar] [CrossRef]
- Kubota, T.; Aonashi, K.; Ushio, T.; Shige, S.; Takayabu, Y.N.; Kachi, M.; Arai, Y.; Tashima, T.; Masaki, T.; Kawamoto, N.; et al. Global Satellite Mapping of Precipitation (GSMaP) Products in the GPM Era. In Satellite Precipitation Measurement: Volume 1; Levizzani, V., Kidd, C., Kirschbaum, D.B., Kummerow, C.D., Nakamura, K., Turk, F.J., Eds.; Springer International Publishing: Cham, Switzerland, 2020; pp. 355–373. ISBN 978-3-030-24568-9. [Google Scholar]
- Huffman, G.J.; Bolvin, D.T.; Braithwaite, D.; Hsu, K.-L.; Joyce, R.J.; Kidd, C.; Nelkin, E.J.; Sorooshian, S.; Stocker, E.F.; Tan, J.; et al. Integrated Multi-Satellite Retrievals for the Global Precipitation Measurement (GPM) Mission (IMERG). In Satellite Precipitation Measurement: Volume 1; Levizzani, V., Kidd, C., Kirschbaum, D.B., Kummerow, C.D., Nakamura, K., Turk, F.J., Eds.; Springer International Publishing: Cham, Switzerland, 2020; pp. 343–353. ISBN 978-3-030-24568-9. [Google Scholar]
- Caloiero, T.; Caroletti, G.N.; Coscarelli, R. IMERG-Based Meteorological Drought Analysis over Italy. Climate 2021, 9, 65. [Google Scholar] [CrossRef]
- Yu, L.; Leng, G.; Python, A. A Comprehensive Validation for GPM IMERG Precipitation Products to Detect Extremes and Drought over Mainland China. Weather. Clim. Extrem. 2022, 36, 100458. [Google Scholar] [CrossRef]
- Beck, H.E.; Wood, E.F.; Pan, M.; Fisher, C.K.; Miralles, D.G.; van Dijk, A.I.J.M.; McVicar, T.R.; Adler, R.F. MSWEP V2 Global 3-Hourly 0.1° Precipitation: Methodology and Quantitative Assessment. Bull. Am. Meteorol. Soc. 2019, 100, 473–500. [Google Scholar] [CrossRef]
- Xu, Z.; Wu, Z.; He, H.; Wu, X.; Zhou, J.; Zhang, Y.; Guo, X. Evaluating the Accuracy of MSWEP V2.1 and Its Performance for Drought Monitoring over Mainland China. Atmos. Res. 2019, 226, 17–31. [Google Scholar] [CrossRef]
- Hsu, K.; Gao, X.; Sorooshian, S.; Gupta, H.V. Precipitation Estimation from Remotely Sensed Information Using Artificial Neural Networks. J. Appl. Meteorol. Climatol. 1997, 36, 1176–1190. [Google Scholar] [CrossRef]
- Dejene, I.N.; Wedajo, G.K.; Bayissa, Y.A.; Abraham, A.M.; Cherinet, K.G. Satellite Rainfall Performance Evaluation and Application to Monitor Meteorological Drought: A Case of Omo-Gibe Basin, Ethiopia. Nat. Hazards 2023, 119, 167–201. [Google Scholar] [CrossRef]
- Hong, Y.; Hsu, K.-L.; Sorooshian, S.; Gao, X. Precipitation Estimation from Remotely Sensed Imagery Using an Artificial Neural Network Cloud Classification System. J. Appl. Meteorol. Climatol. 2004, 43, 1834–1853. [Google Scholar] [CrossRef]
- Najmi, A.; Igmoullan, B.; Namous, M.; El Bouazzaoui, I.; Brahim, Y.A.; El Khalki, E.M.; Saidi, M.E.M. Evaluation of PERSIANN-CCS-CDR, ERA5, and SM2RAIN-ASCAT Rainfall Products for Rainfall and Drought Assessment in a Semi-Arid Watershed, Morocco. J. Water Clim. Change 2023, 14, 1569–1584. [Google Scholar] [CrossRef]
- Ashouri, H.; Hsu, K.-L.; Sorooshian, S.; Braithwaite, D.K.; Knapp, K.R.; Cecil, L.D.; Nelson, B.R.; Prat, O.P. PERSIANN-CDR: Daily Precipitation Climate Data Record from Multisatellite Observations for Hydrological and Climate Studies. Bull. Am. Meteorol. Soc. 2015, 96, 69–83. [Google Scholar] [CrossRef]
- Huffman, G.J.; Bolvin, D.T.; Nelkin, E.J.; Wolff, D.B.; Adler, R.F.; Gu, G.; Hong, Y.; Bowman, K.P.; Stocker, E.F. The TRMM Multisatellite Precipitation Analysis (TMPA): Quasi-Global, Multiyear, Combined-Sensor Precipitation Estimates at Fine Scales. J. Hydrometeorol. 2007, 8, 38–55. [Google Scholar] [CrossRef]
- Copernicus Climate Change, C.C.C. ERA5: Fifth Generation of ECMWF Atmospheric Reanalyses of the Global Climate. Copernic. Clim. Change Serv. Clim. Data Store (CDS) 2017, 15, 2020. [Google Scholar]
- Chen, S.; Gan, T.Y.; Tan, X.; Shao, D.; Zhu, J. Assessment of CFSR, ERA-Interim, JRA-55, MERRA-2, NCEP-2 Reanalysis Data for Drought Analysis over China. Clim. Dyn. 2019, 53, 737–757. [Google Scholar] [CrossRef]
- Vicente-Serrano, S.M.; Domínguez-Castro, F.; Reig, F.; Tomas-Burguera, M.; Peña-Angulo, D.; Latorre, B.; Beguería, S.; Rabanaque, I.; Noguera, I.; Lorenzo-Lacruz, J.; et al. A Global Drought Monitoring System and Dataset Based on ERA5 Reanalysis: A Focus on Crop-Growing Regions. Geosci. Data J. 2023, 10, 505–518. [Google Scholar] [CrossRef]
- Gelaro, R.; McCarty, W.; Suárez, M.J.; Todling, R.; Molod, A.; Takacs, L.; Randles, C.A.; Darmenov, A.; Bosilovich, M.G.; Reichle, R.; et al. The Modern-Era Retrospective Analysis for Research and Applications, Version 2 (MERRA-2). J. Clim. 2017, 30, 5419–5454. [Google Scholar] [CrossRef]
- Kobayashi, S.; Ota, Y.; Harada, Y.; Ebita, A.; Moriya, M.; Onoda, H.; Onogi, K.; Kamahori, H.; Kobayashi, C.; Endo, H.; et al. The JRA-55 Reanalysis: General Specifications and Basic Characteristics. J. Meteorol. Soc. Japan. Ser. II 2015, 93, 5–48. [Google Scholar] [CrossRef]
- Jiang, J.; Zhou, T. Human-Induced Rainfall Reduction in Drought-Prone Northern Central Asia. Geophys. Res. Lett. 2021, 48, e2020GL092156. [Google Scholar] [CrossRef]
- Jong, B.-T.; Newman, M.; Hoell, A. Subseasonal Meteorological Drought Development over the Central United States during Spring. J. Clim. 2022, 35, 2525–2547. [Google Scholar] [CrossRef]
- Saha, S.; Moorthi, S.; Pan, H.-L.; Wu, X.; Wang, J.; Nadiga, S.; Tripp, P.; Kistler, R.; Woollen, J.; Behringer, D.; et al. The NCEP Climate Forecast System Reanalysis. Bull. Am. Meteorol. Soc. 2010, 91, 1015–1058. [Google Scholar] [CrossRef]
- Saha, S.; Moorthi, S.; Wu, X.; Wang, J.; Nadiga, S.; Tripp, P.; Behringer, D.; Hou, Y.-T.; Chuang, H.; Iredell, M.; et al. The NCEP Climate Forecast System Version 2. J. Clim. 2014, 27, 2185–2208. [Google Scholar] [CrossRef]
- Martinez-Cruz, D.A.; Gutiérrez, M.; Alarcón-Herrera, M.T. Spatial and Temporal Analysis of Precipitation and Drought Trends Using the Climate Forecast System Reanalysis (CFSR). In Stewardship of Future Drylands and Climate Change in the Global South: Challenges and Opportunities for the Agenda 2030; Lucatello, S., Huber-Sannwald, E., Espejel, I., Martínez-Tagüeña, N., Eds.; Springer International Publishing: Cham, Switzerland, 2020; pp. 129–146. ISBN 978-3-030-22464-6. [Google Scholar]
- Tan, M.L.; Chua, V.P.; Tan, K.C.; Brindha, K. Evaluation of TMPA 3B43 and NCEP-CFSR Precipitation Products in Drought Monitoring over Singapore. Int. J. Remote Sens. 2018, 39, 2089–2104. [Google Scholar] [CrossRef]
- Li, C.; Zhao, T.; Shi, C.; Liu, Z. Evaluation of Daily Precipitation Product in China from the CMA Global Atmospheric Interim Reanalysis. J. Meteorol. Res. 2020, 34, 117–136. [Google Scholar] [CrossRef]
- van Eck, N.J.; Waltman, L. Software Survey: VOSviewer, a Computer Program for Bibliometric Mapping. Scientometrics 2010, 84, 523–538. [Google Scholar] [CrossRef] [PubMed]
- Bachmair, S.; Svensson, C.; Prosdocimi, I.; Hannaford, J.; Stahl, K. Developing Drought Impact Functions for Drought Risk Management. Nat. Hazards Earth Syst. Sci. 2017, 17, 1947–1960. [Google Scholar] [CrossRef]
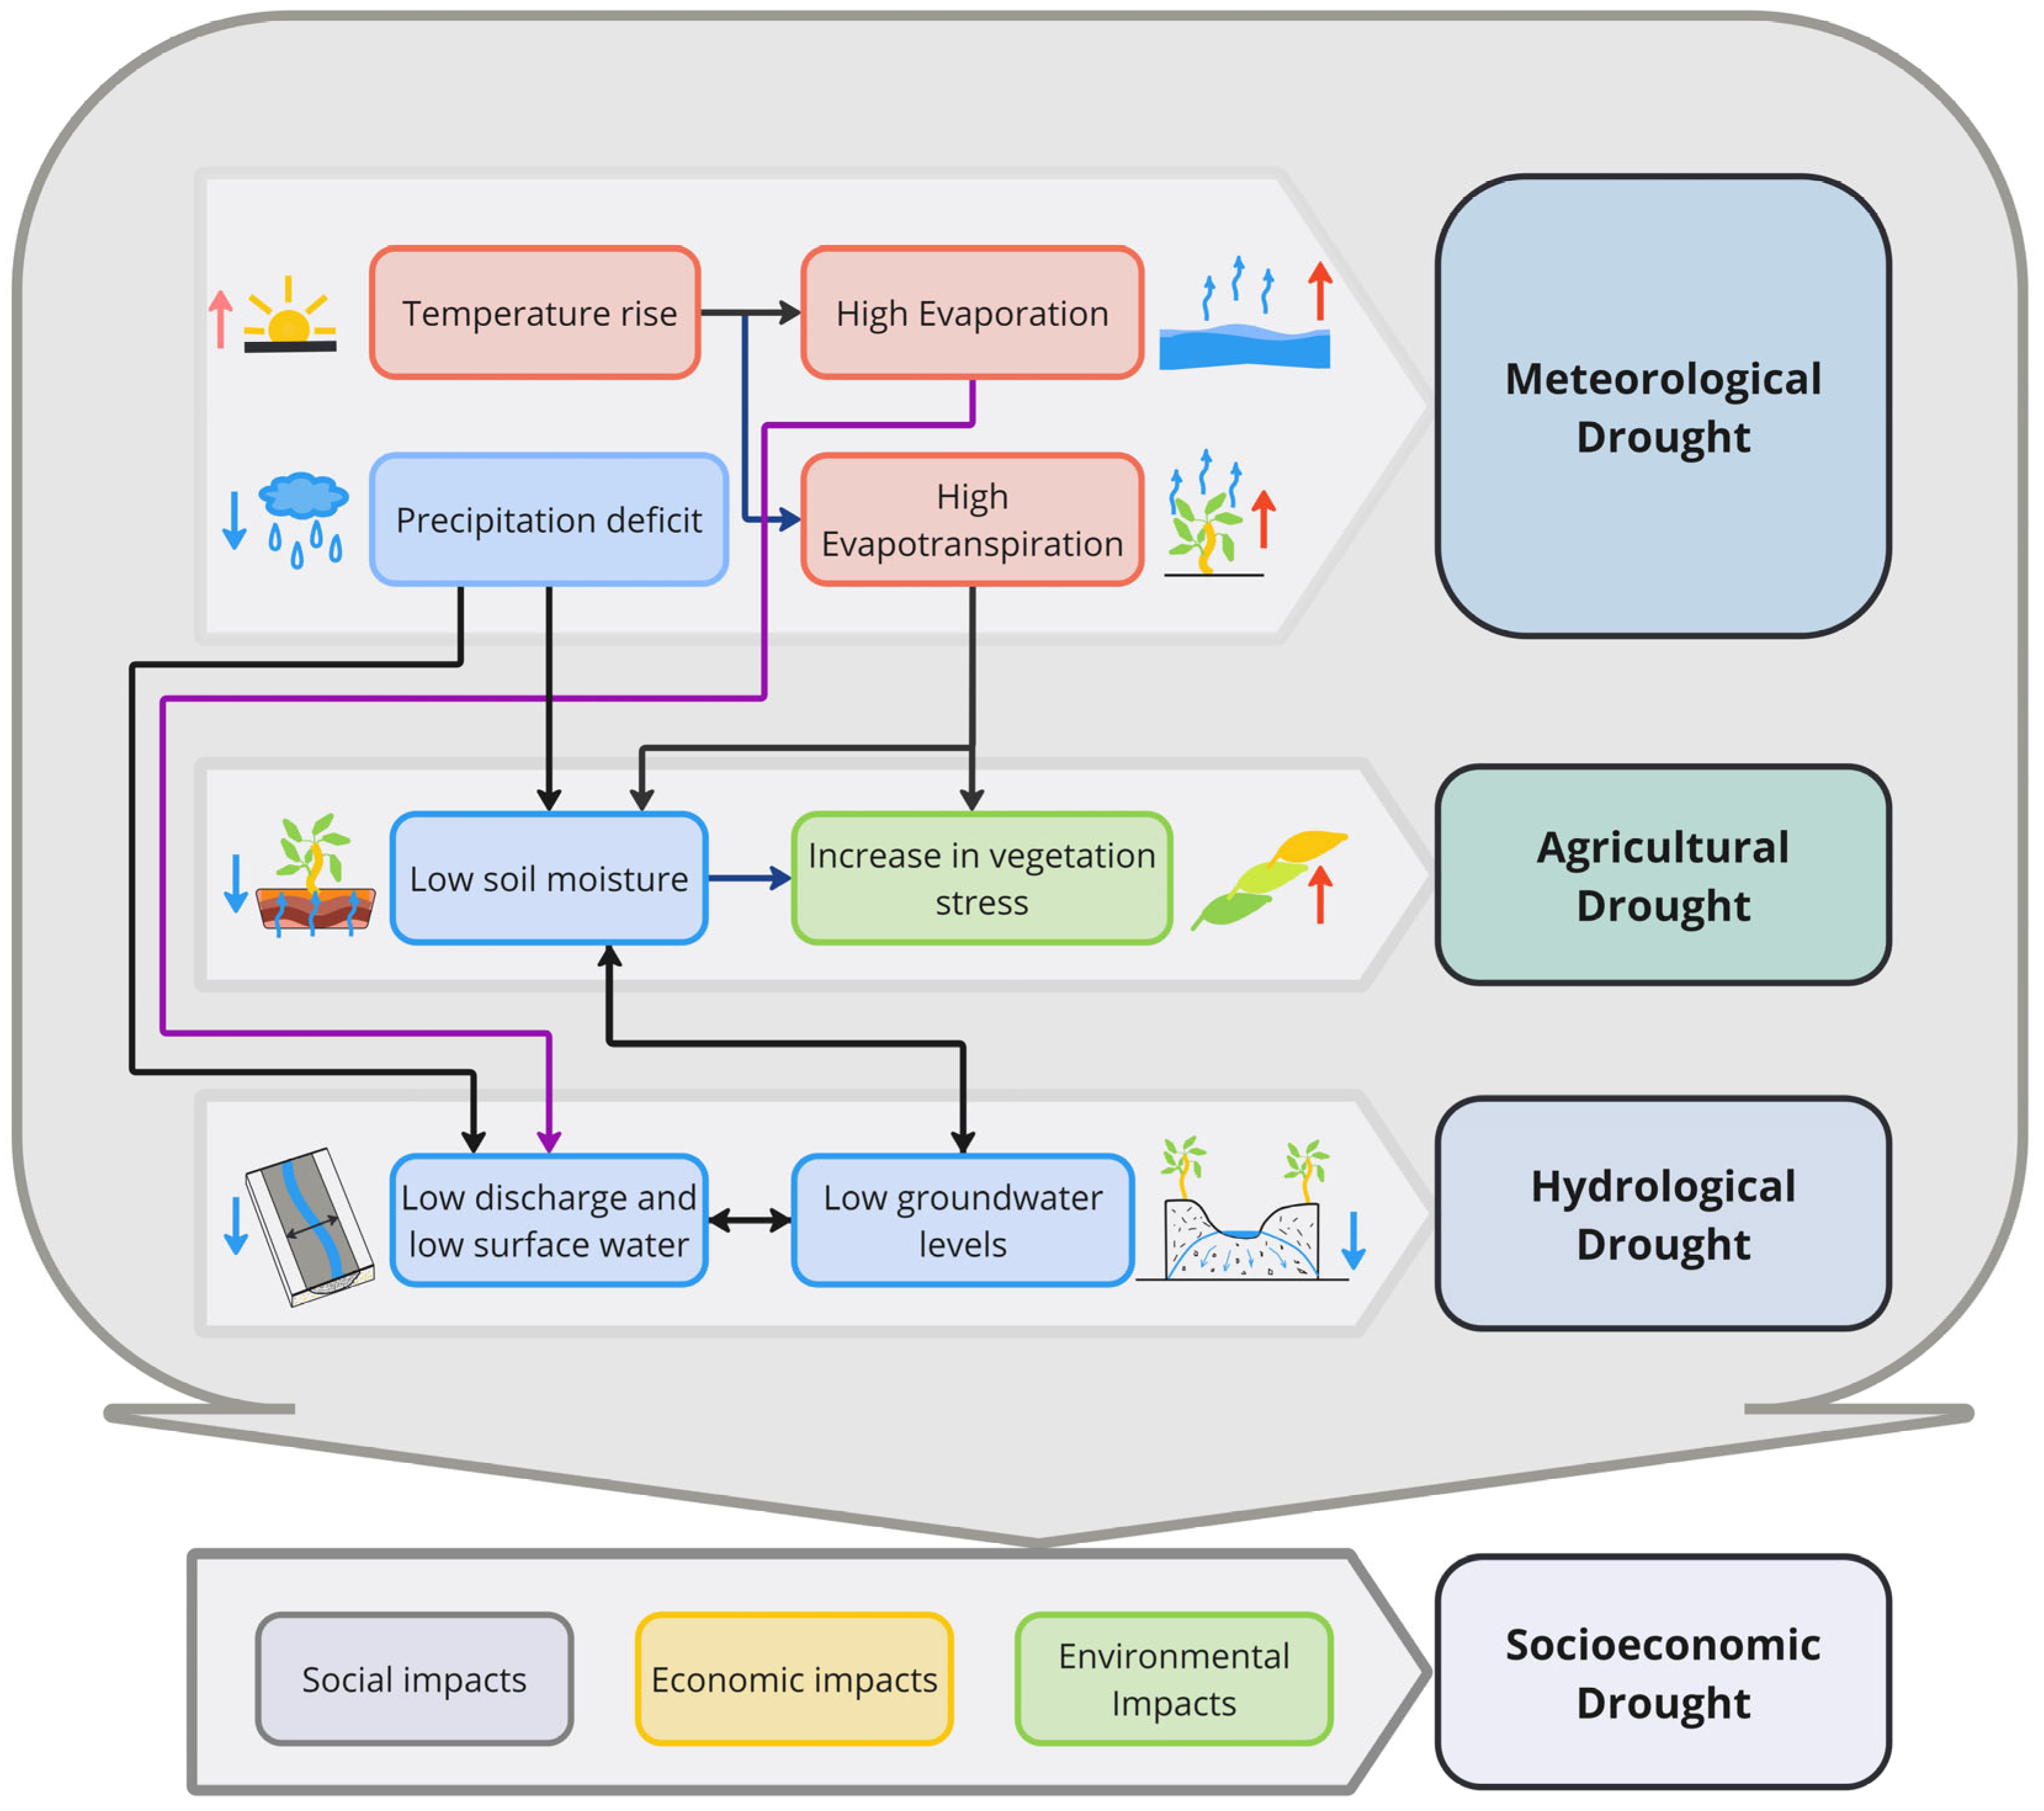


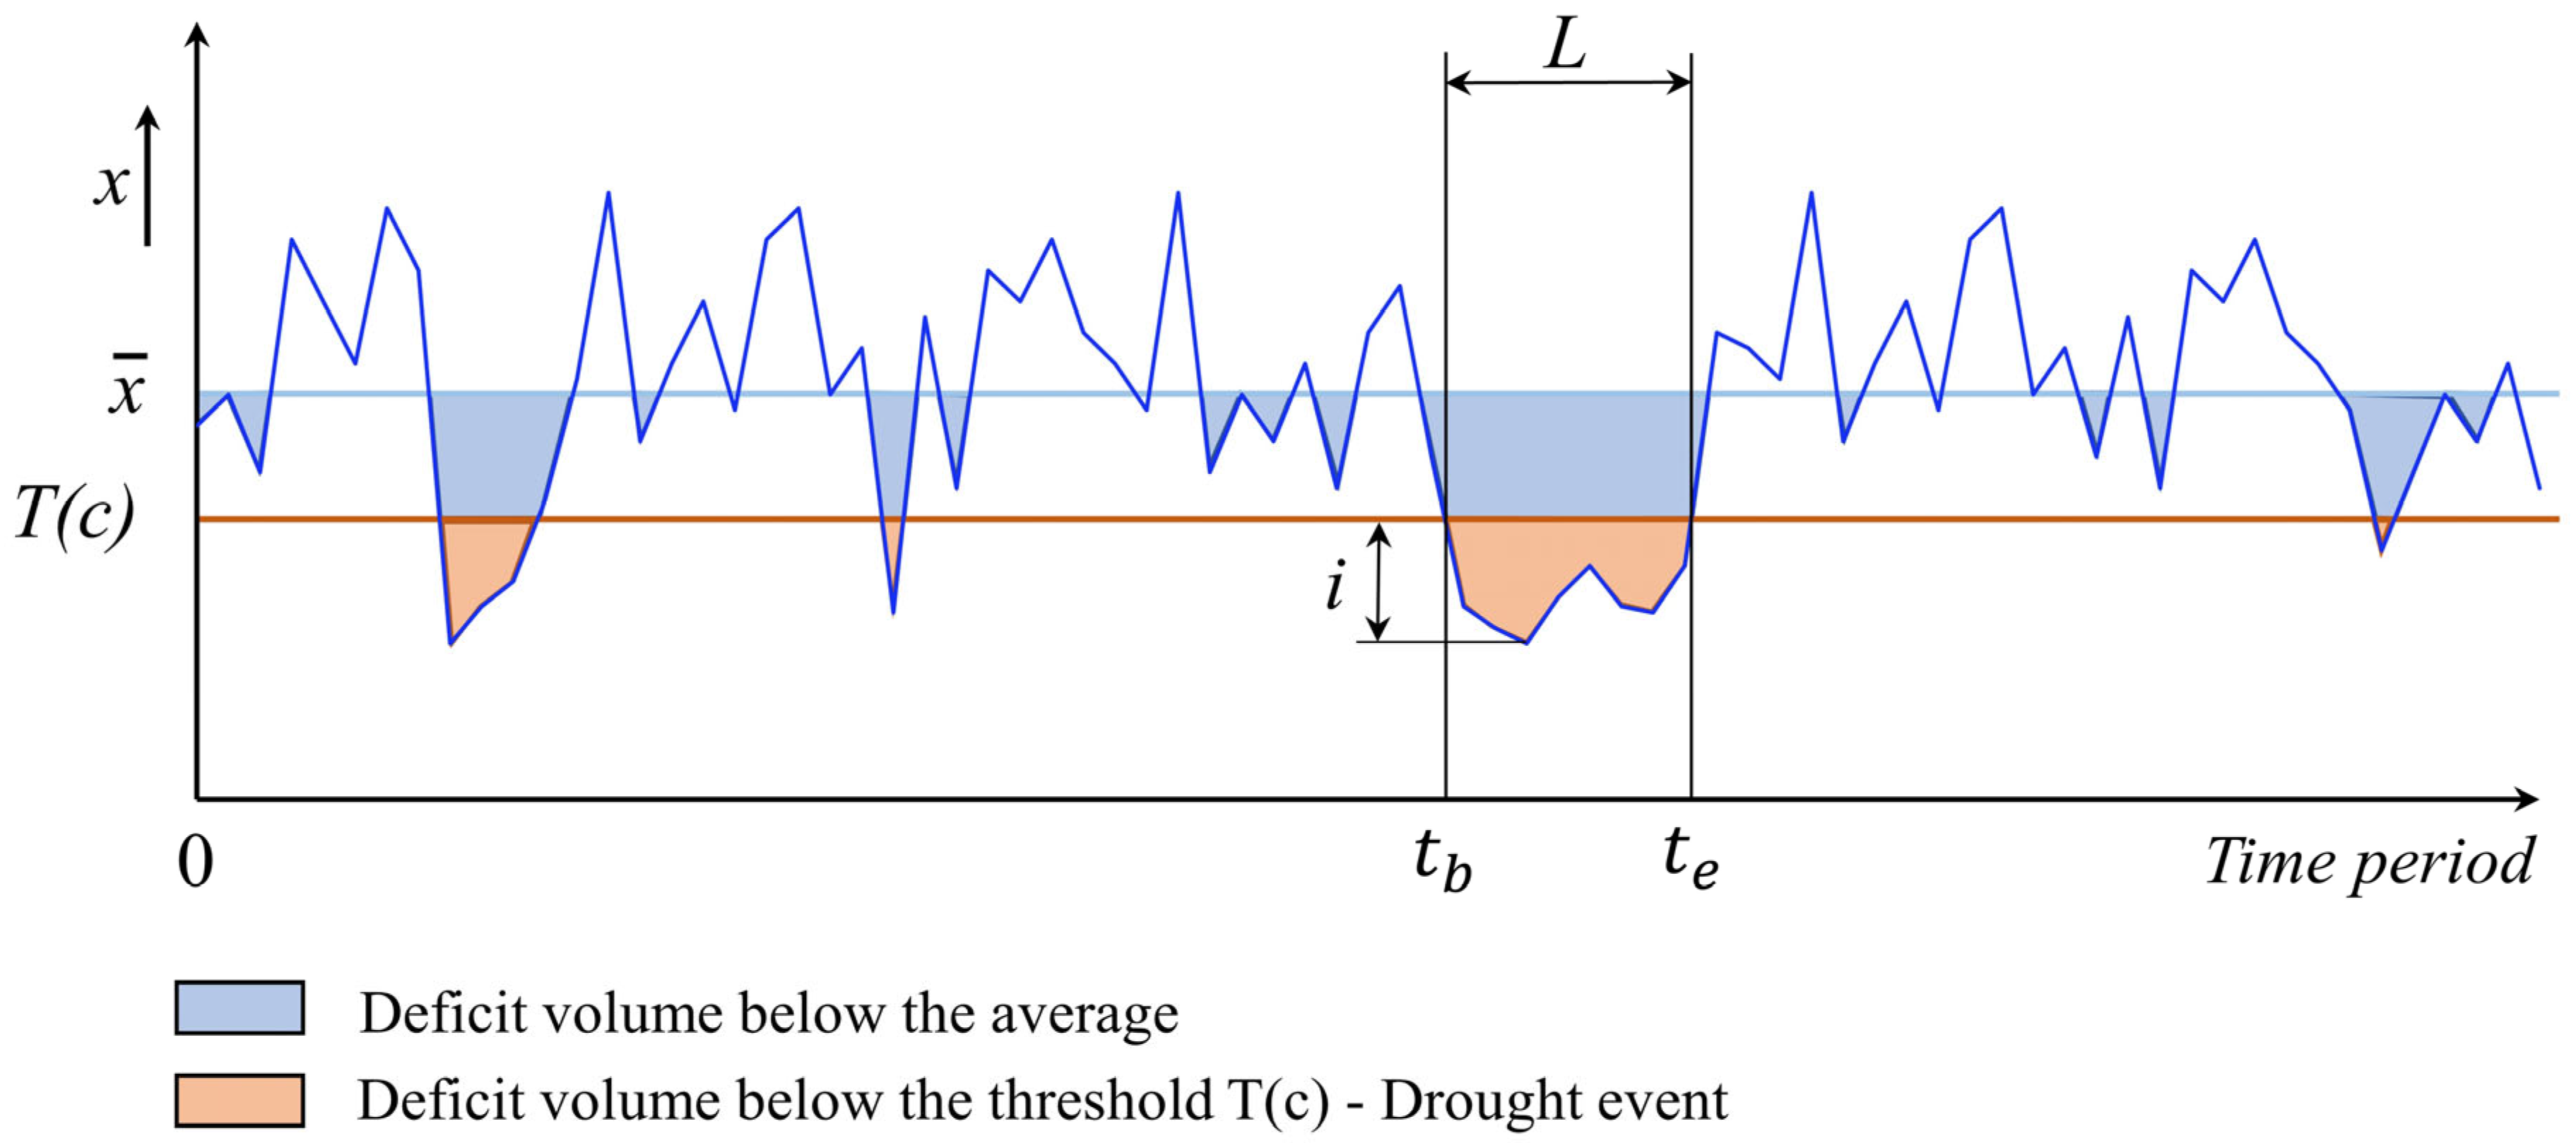
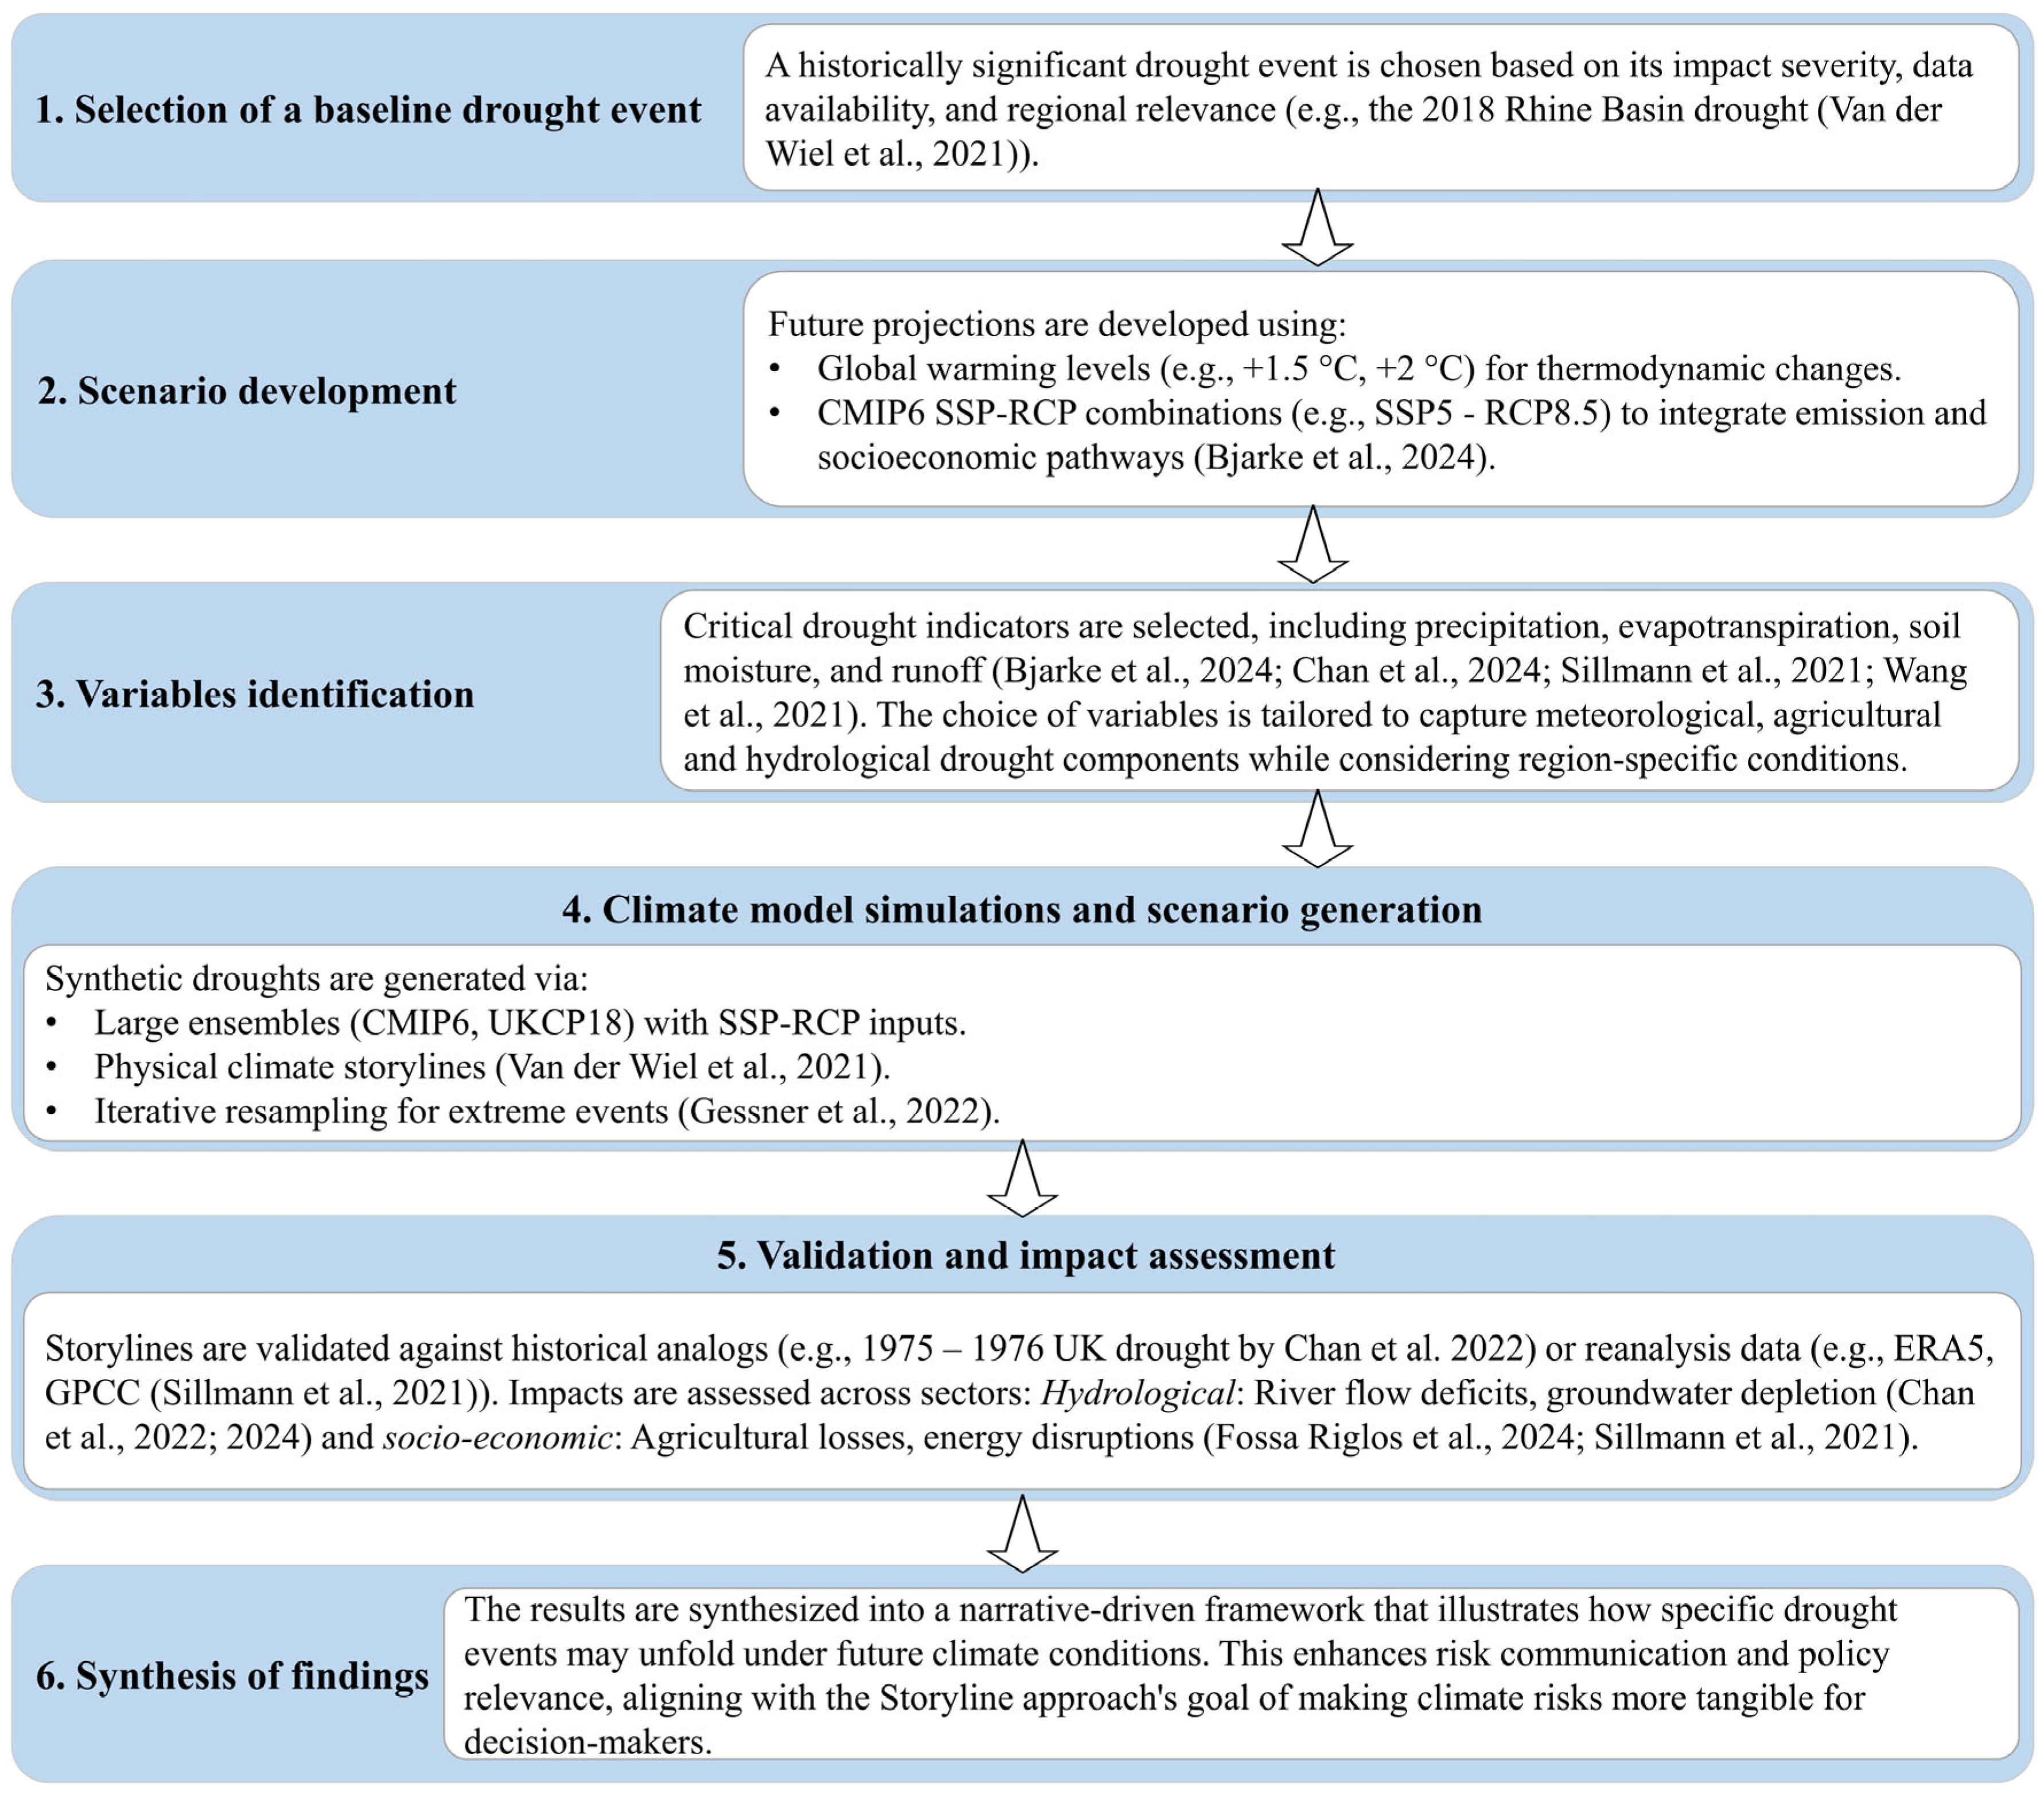
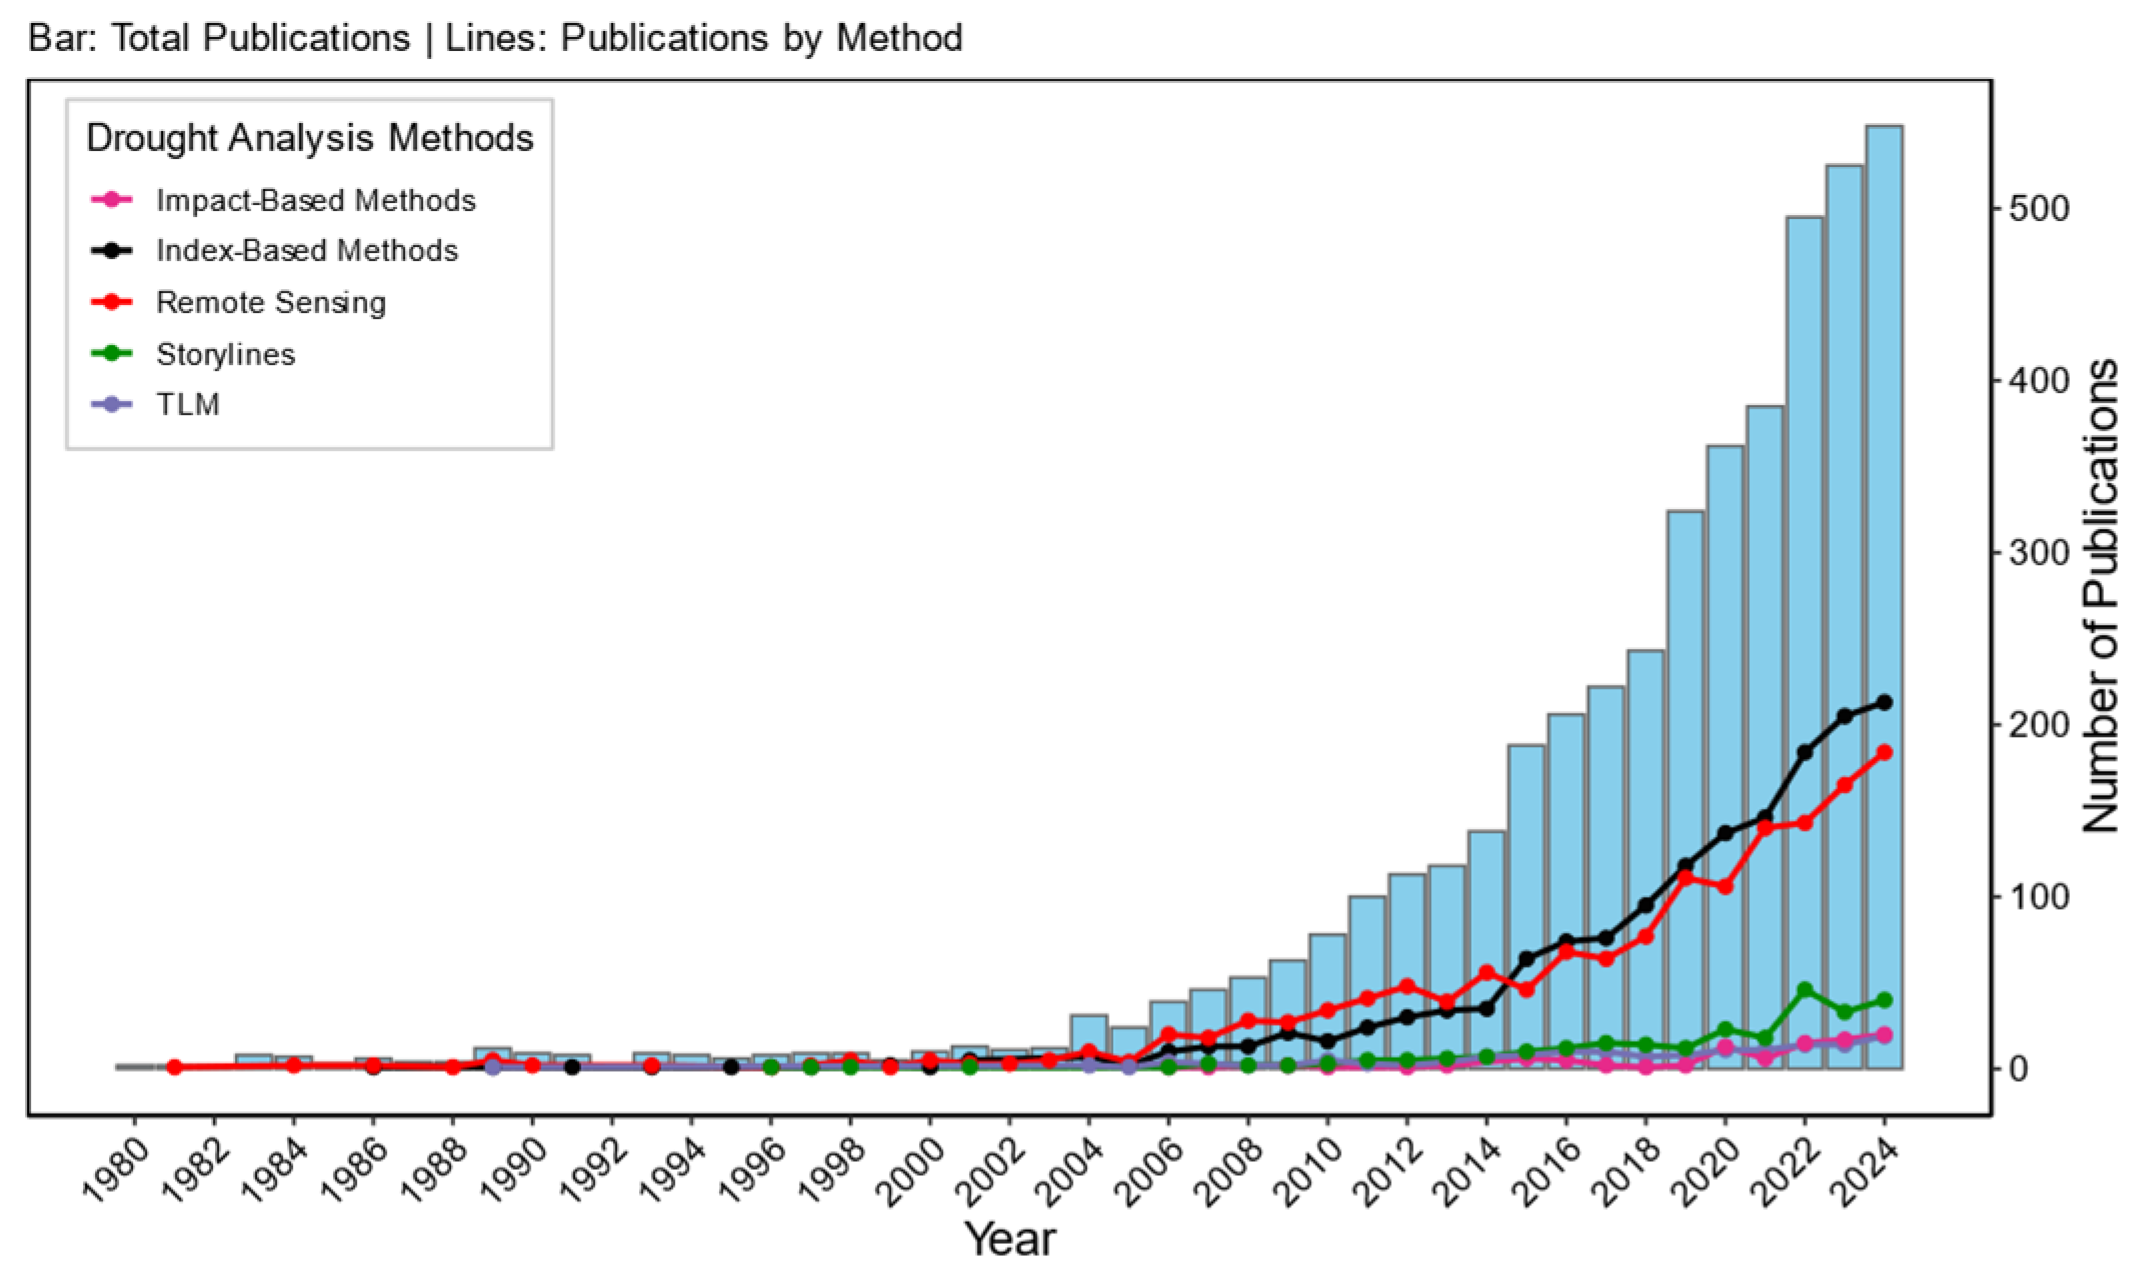


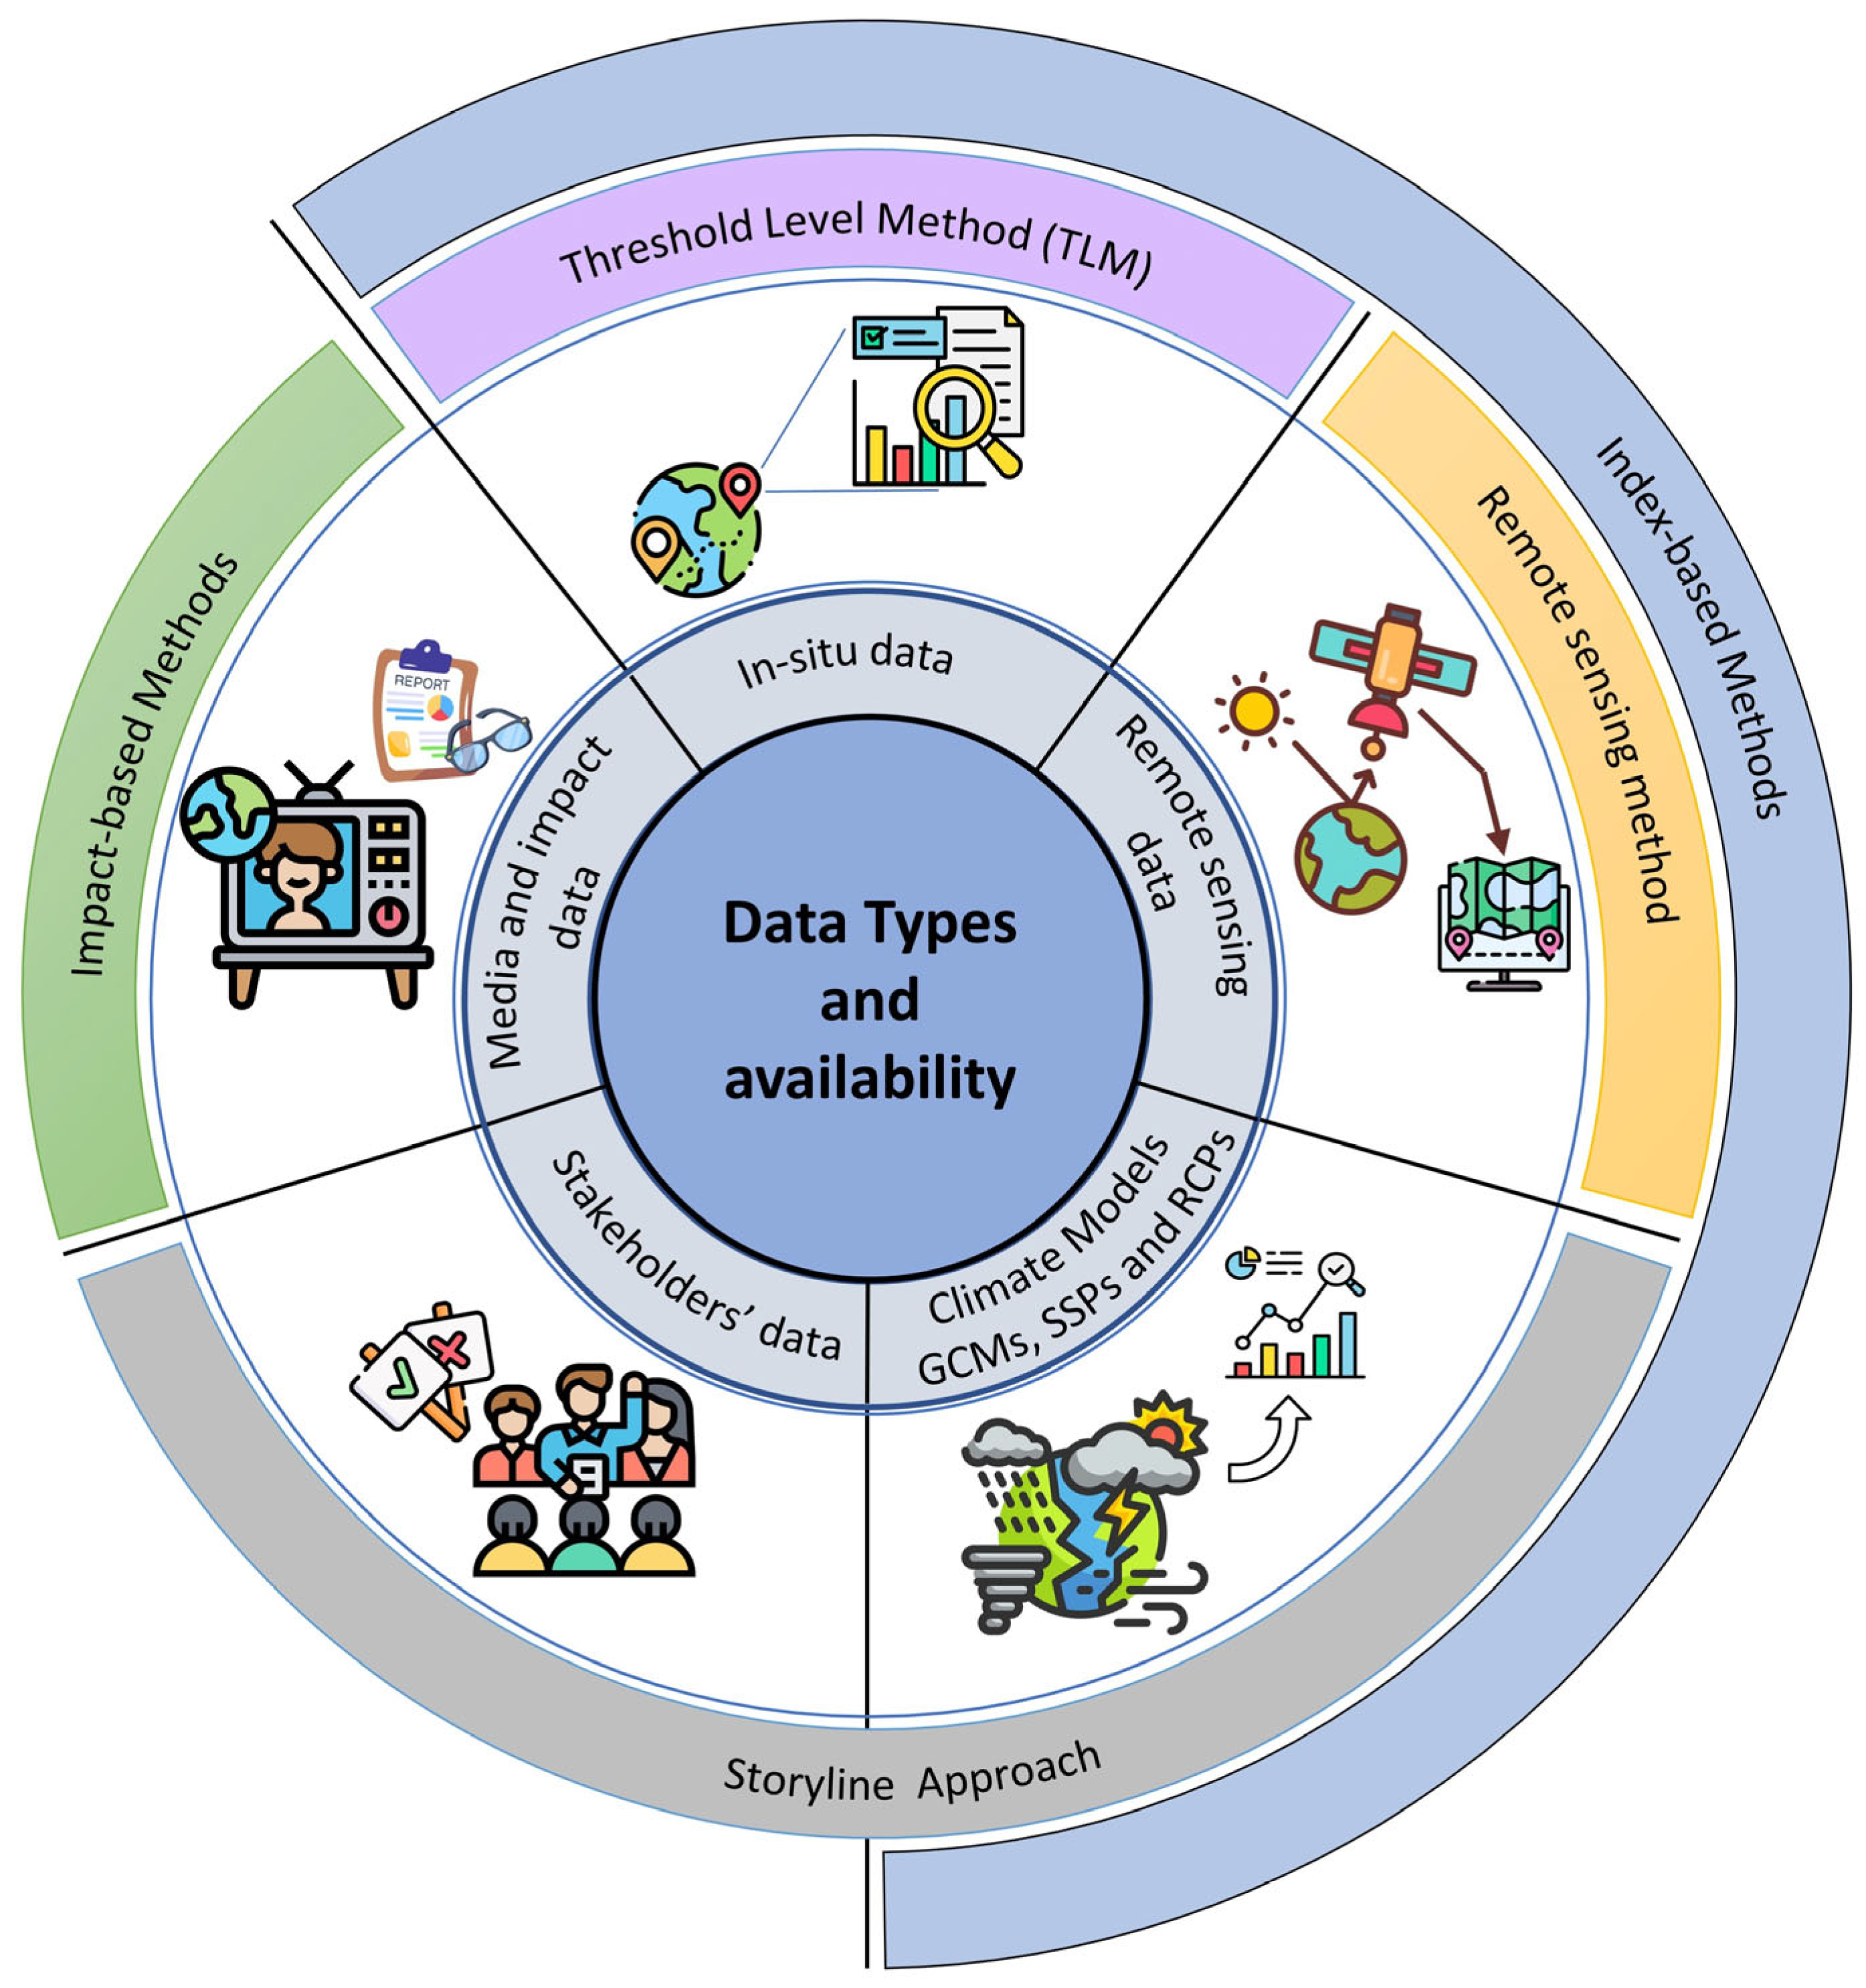


Disclaimer/Publisher’s Note: The statements, opinions and data contained in all publications are solely those of the individual author(s) and contributor(s) and not of MDPI and/or the editor(s). MDPI and/or the editor(s) disclaim responsibility for any injury to people or property resulting from any ideas, methods, instructions or products referred to in the content. |
© 2025 by the authors. Licensee MDPI, Basel, Switzerland. This article is an open access article distributed under the terms and conditions of the Creative Commons Attribution (CC BY) license (https://creativecommons.org/licenses/by/4.0/).
Share and Cite
Ahady, A.B.; Klopries, E.-M.; Schüttrumpf, H.; Wolf, S. Drought Analysis Methods: A Multidisciplinary Review with Insights on Key Decision-Making Factors in Method Selection. Water 2025, 17, 2248. https://doi.org/10.3390/w17152248
Ahady AB, Klopries E-M, Schüttrumpf H, Wolf S. Drought Analysis Methods: A Multidisciplinary Review with Insights on Key Decision-Making Factors in Method Selection. Water. 2025; 17(15):2248. https://doi.org/10.3390/w17152248
Chicago/Turabian StyleAhady, Abdul Baqi, Elena-Maria Klopries, Holger Schüttrumpf, and Stefanie Wolf. 2025. "Drought Analysis Methods: A Multidisciplinary Review with Insights on Key Decision-Making Factors in Method Selection" Water 17, no. 15: 2248. https://doi.org/10.3390/w17152248
APA StyleAhady, A. B., Klopries, E.-M., Schüttrumpf, H., & Wolf, S. (2025). Drought Analysis Methods: A Multidisciplinary Review with Insights on Key Decision-Making Factors in Method Selection. Water, 17(15), 2248. https://doi.org/10.3390/w17152248