

Zoning Method for Groundwater Pollution Risk Control in Typical Industrial–Urban Integration Areas in the Middle Reaches of the Yangtze River


 ,
, 
Abstract
1. Introduction
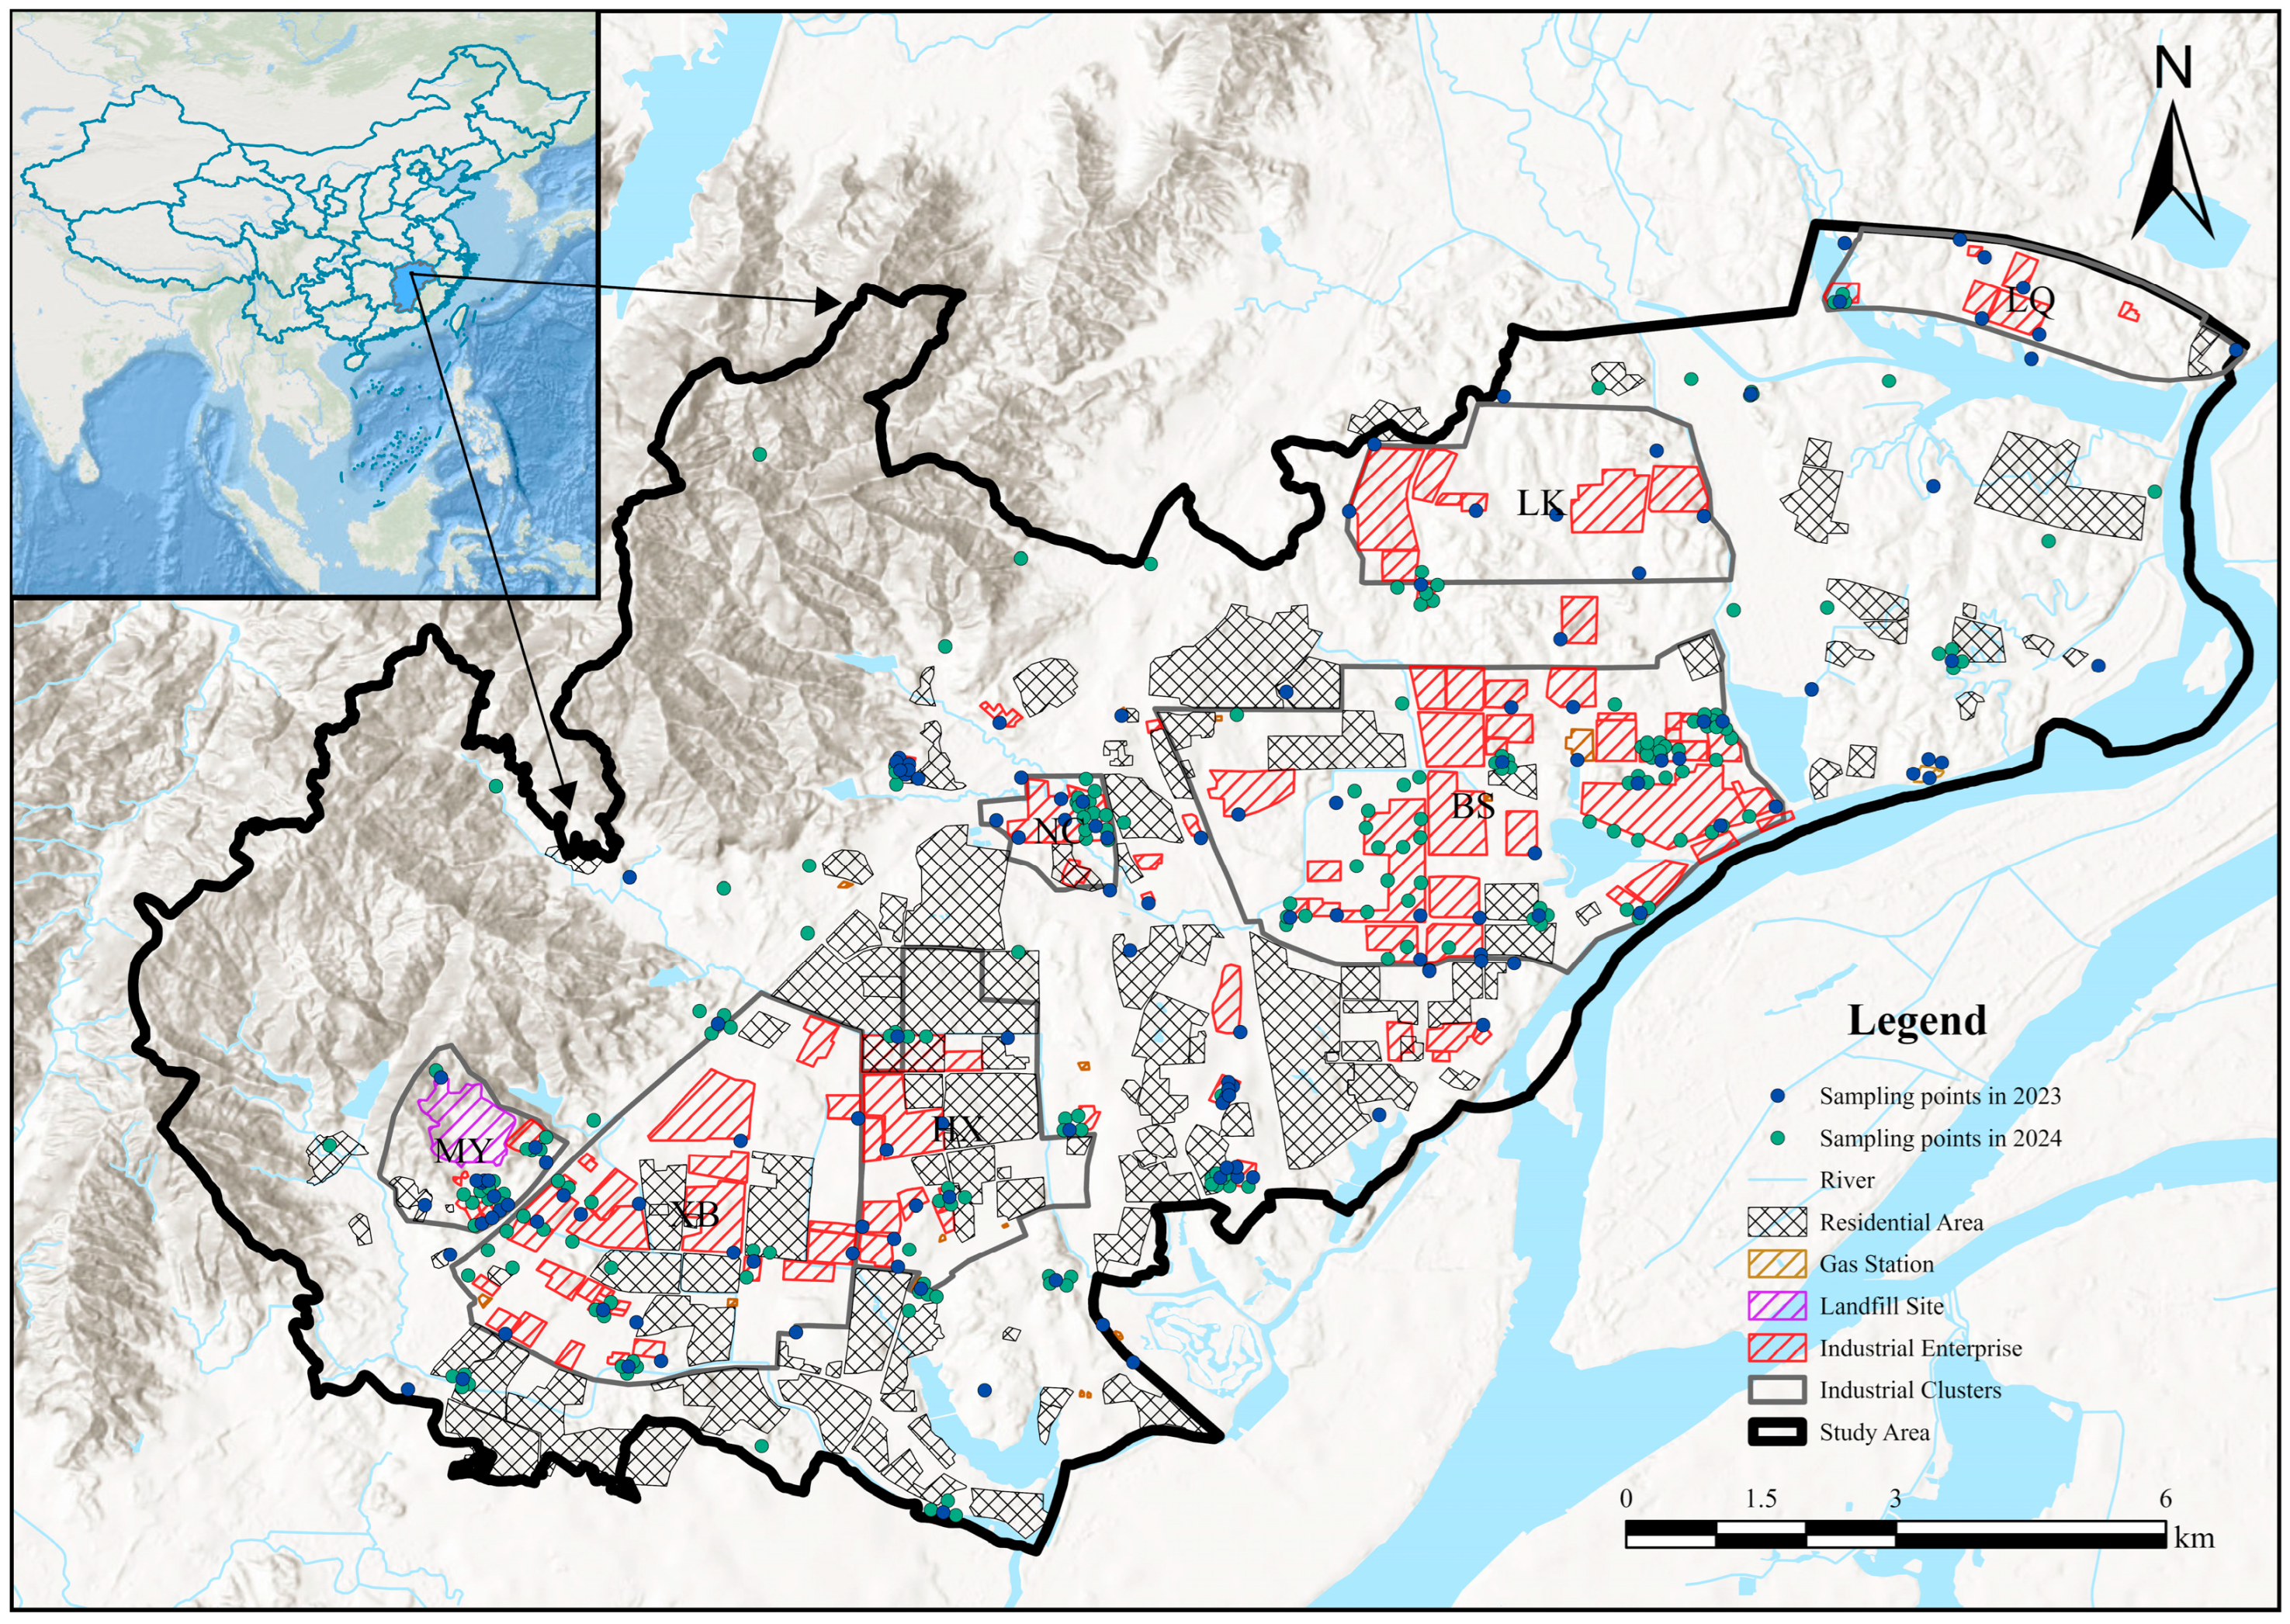
2. Study Area
3. Materials and Methods
3.1. Data Sources
3.2. Analytical Methods
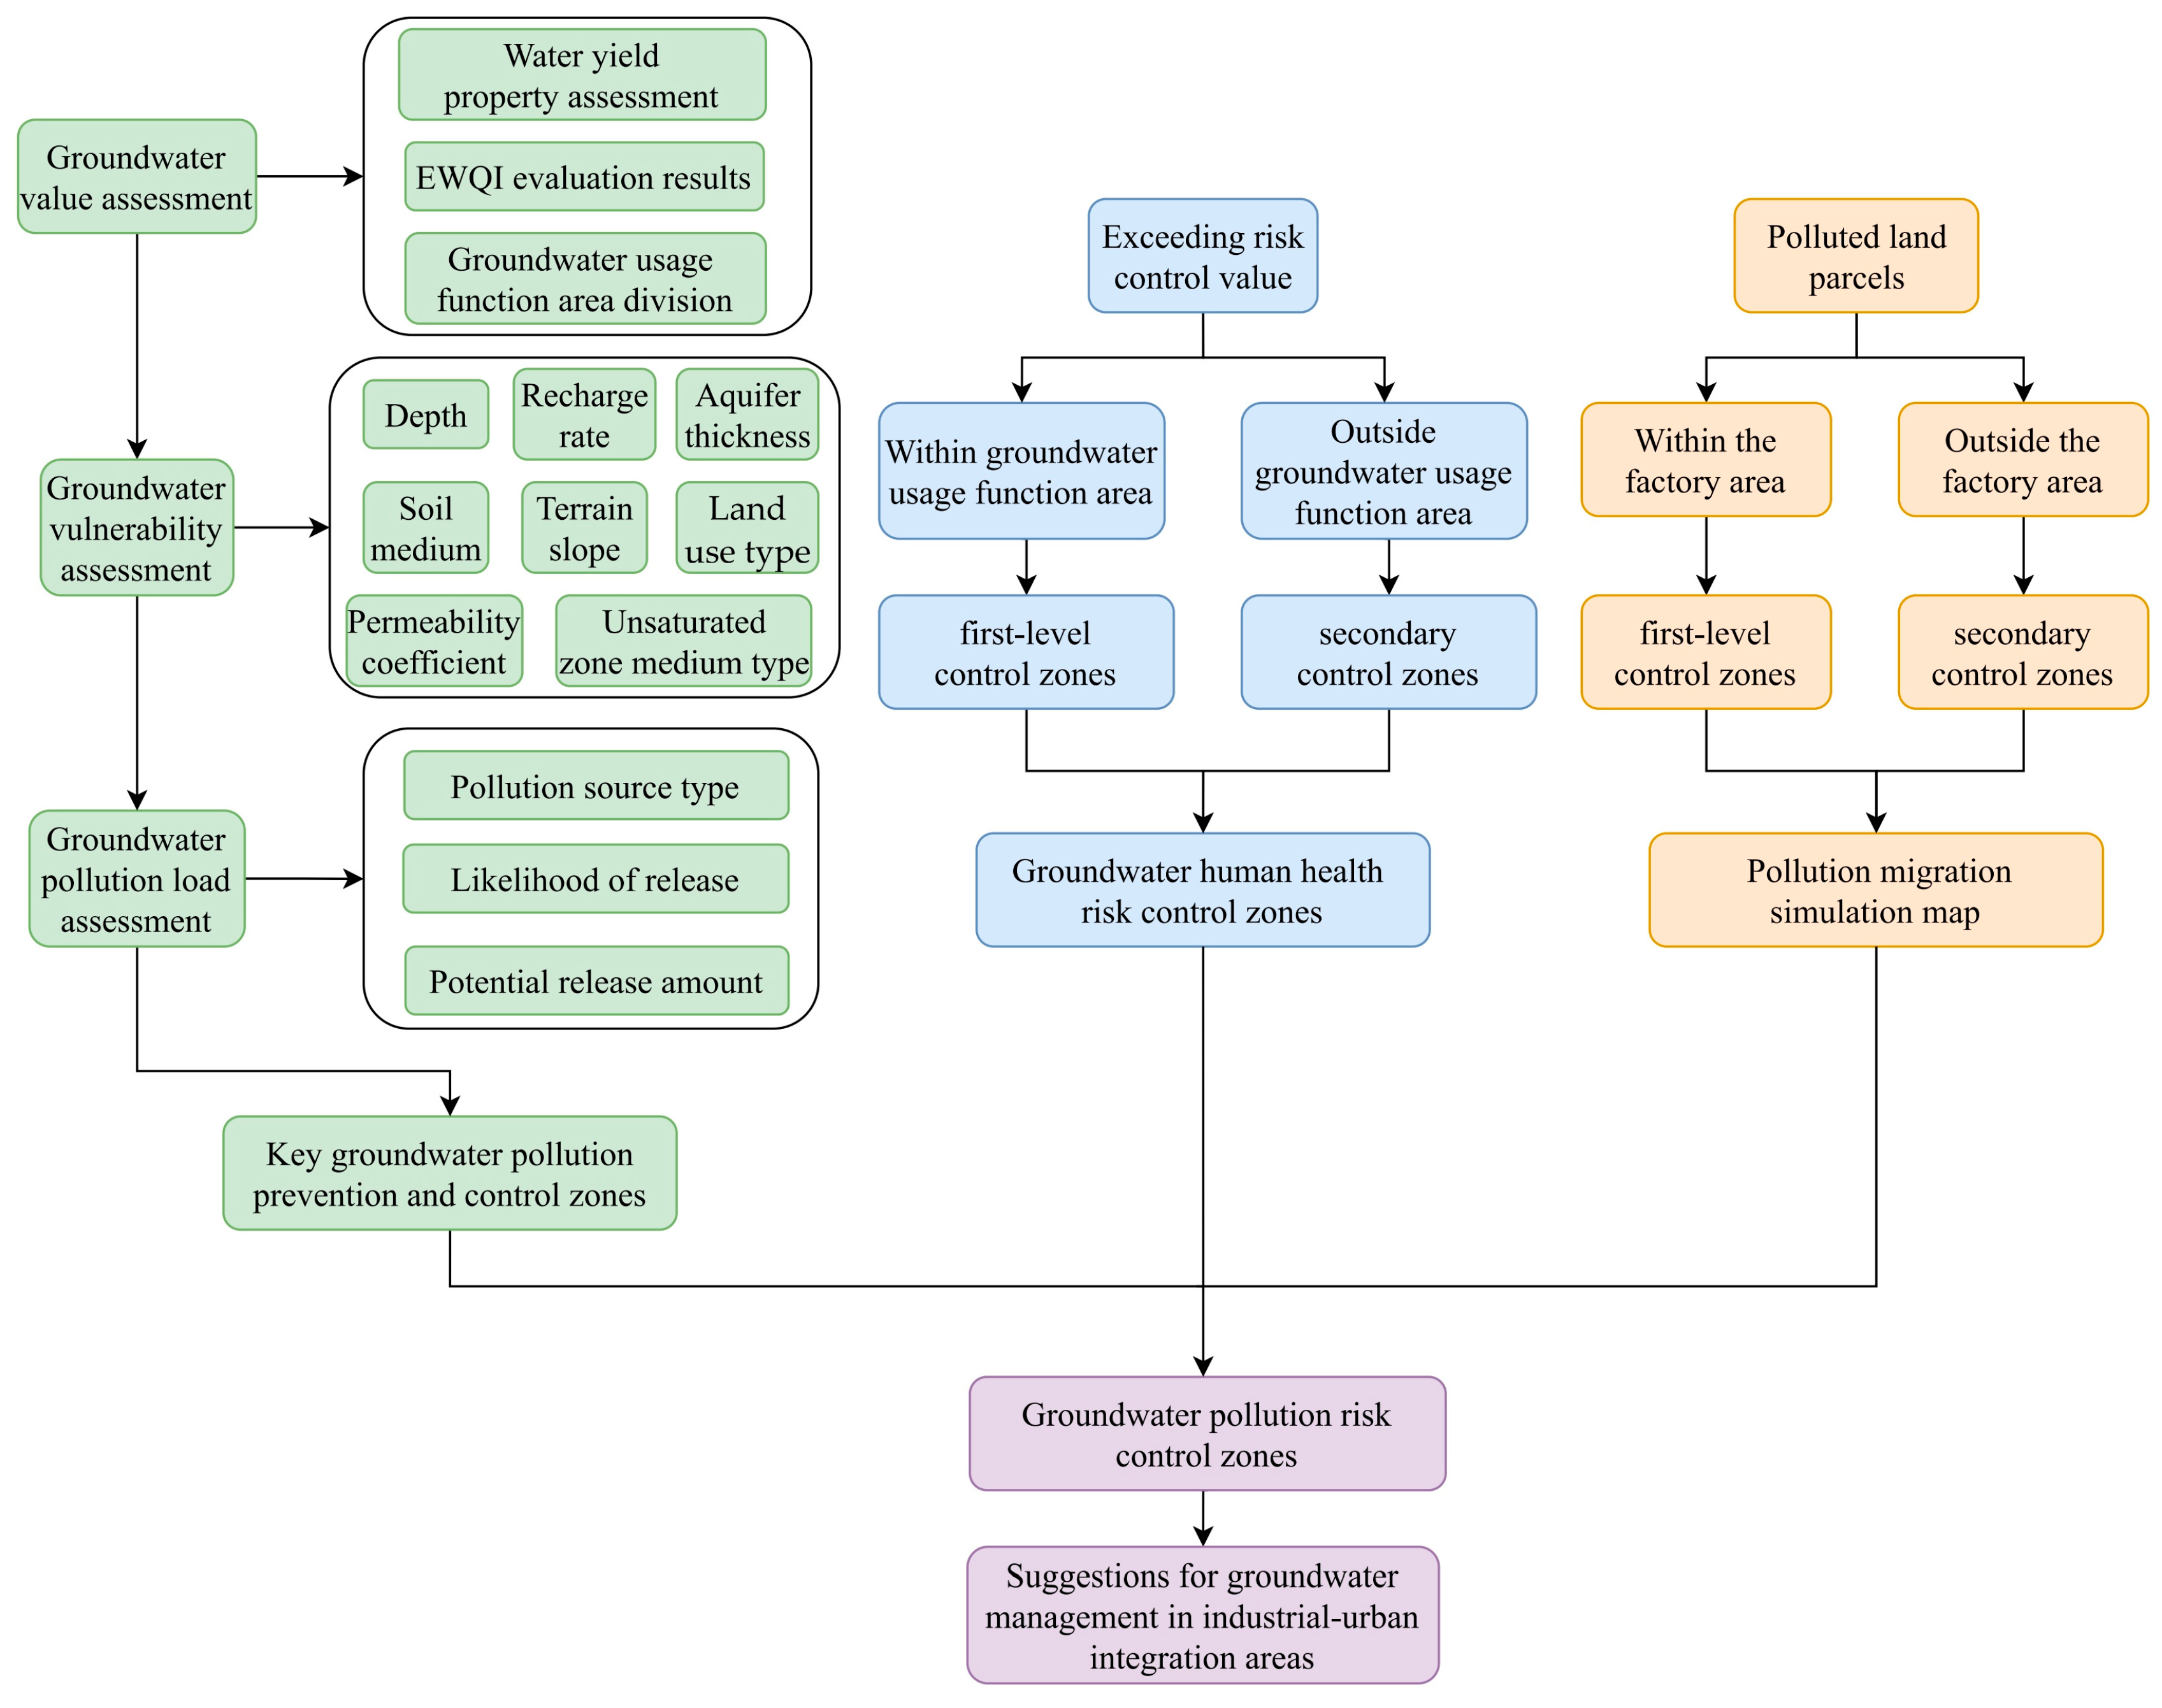
3.2.1. Key Groundwater Pollution Prevention Zones
Groundwater Value Assessment
Groundwater Vulnerability Assessment
Groundwater Pollution Load Assessment
- (1)
- Pollution source types
- (2)
- Likelihood of pollutant release
- (3)
- Pollutant release quantity
3.2.2. Human Health Risk Assessment of Groundwater
3.2.3. Groundwater Pollution Prediction and Simulation
4. Key Groundwater Pollution Prevention Zones
4.1. Groundwater Value Assessment
4.1.1. Water Yield Property
4.1.2. Groundwater Quality Assessment
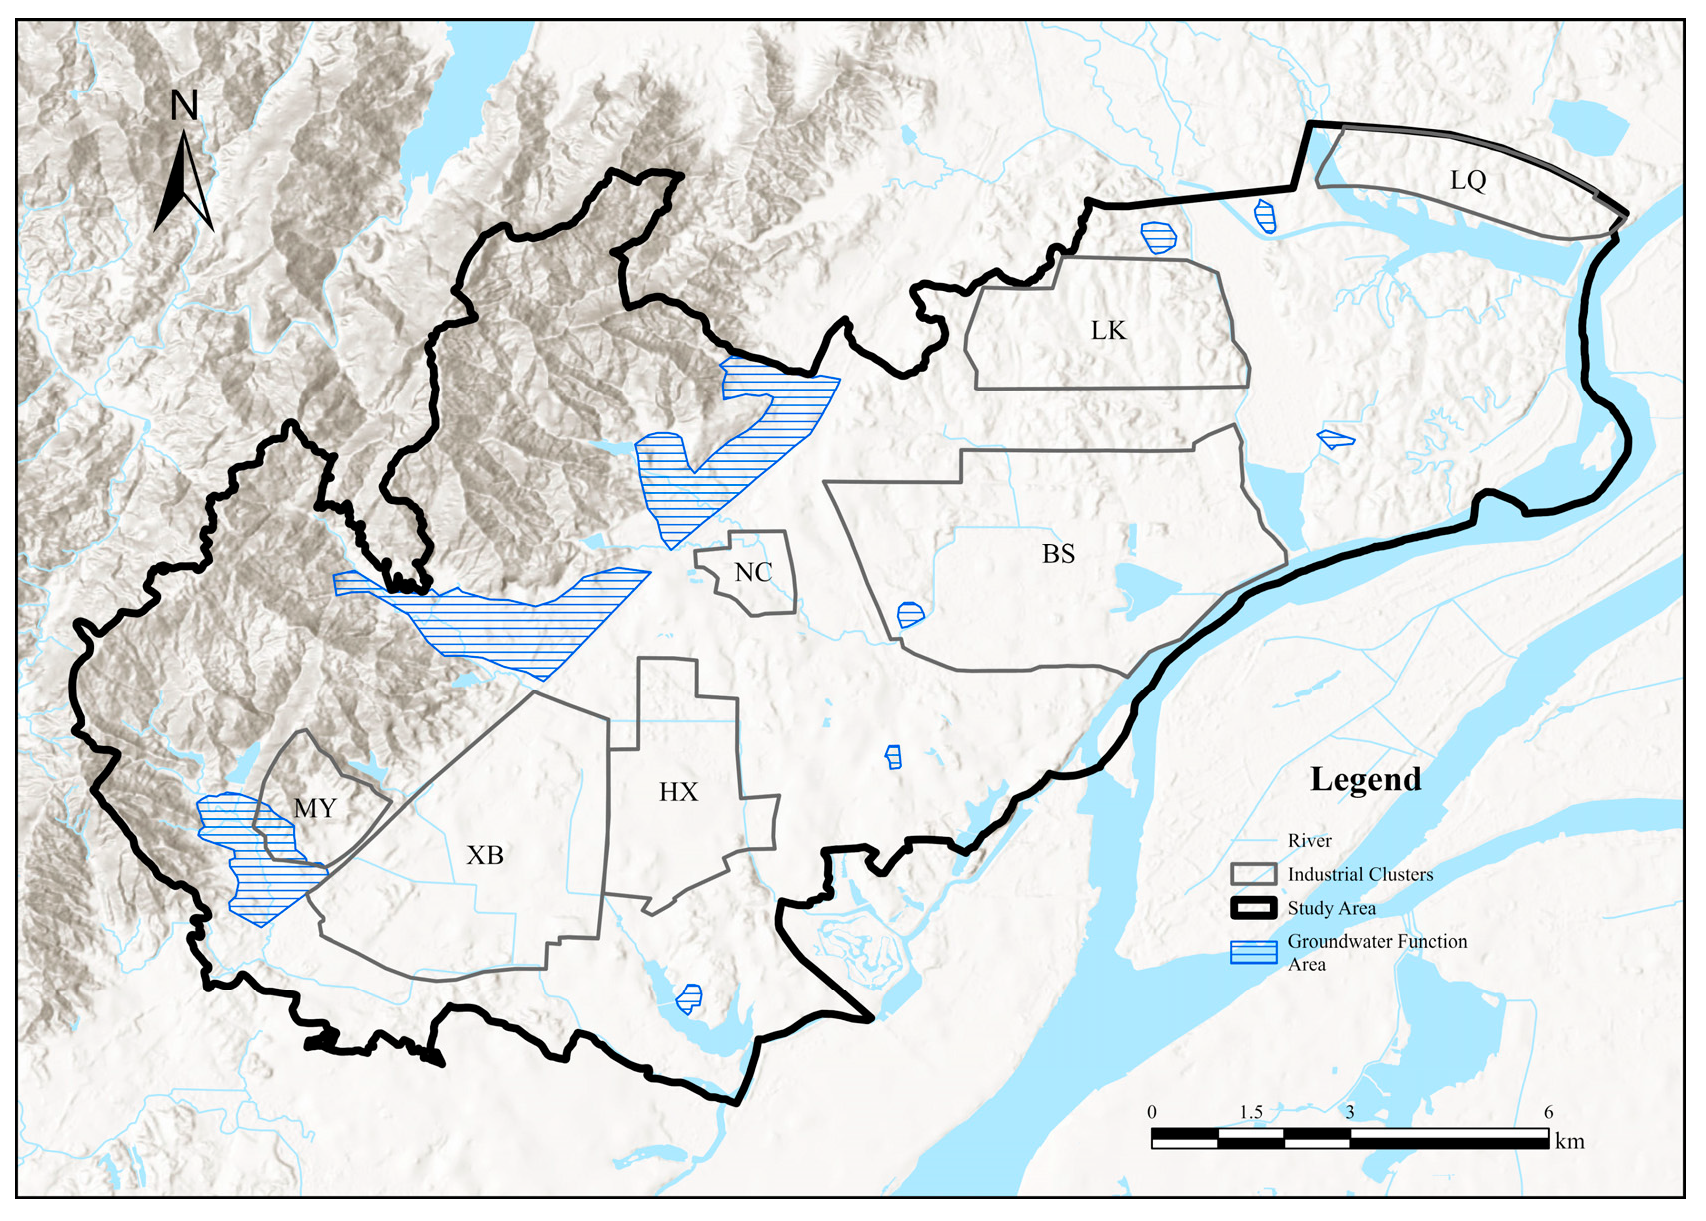
4.1.3. Groundwater Use Zones
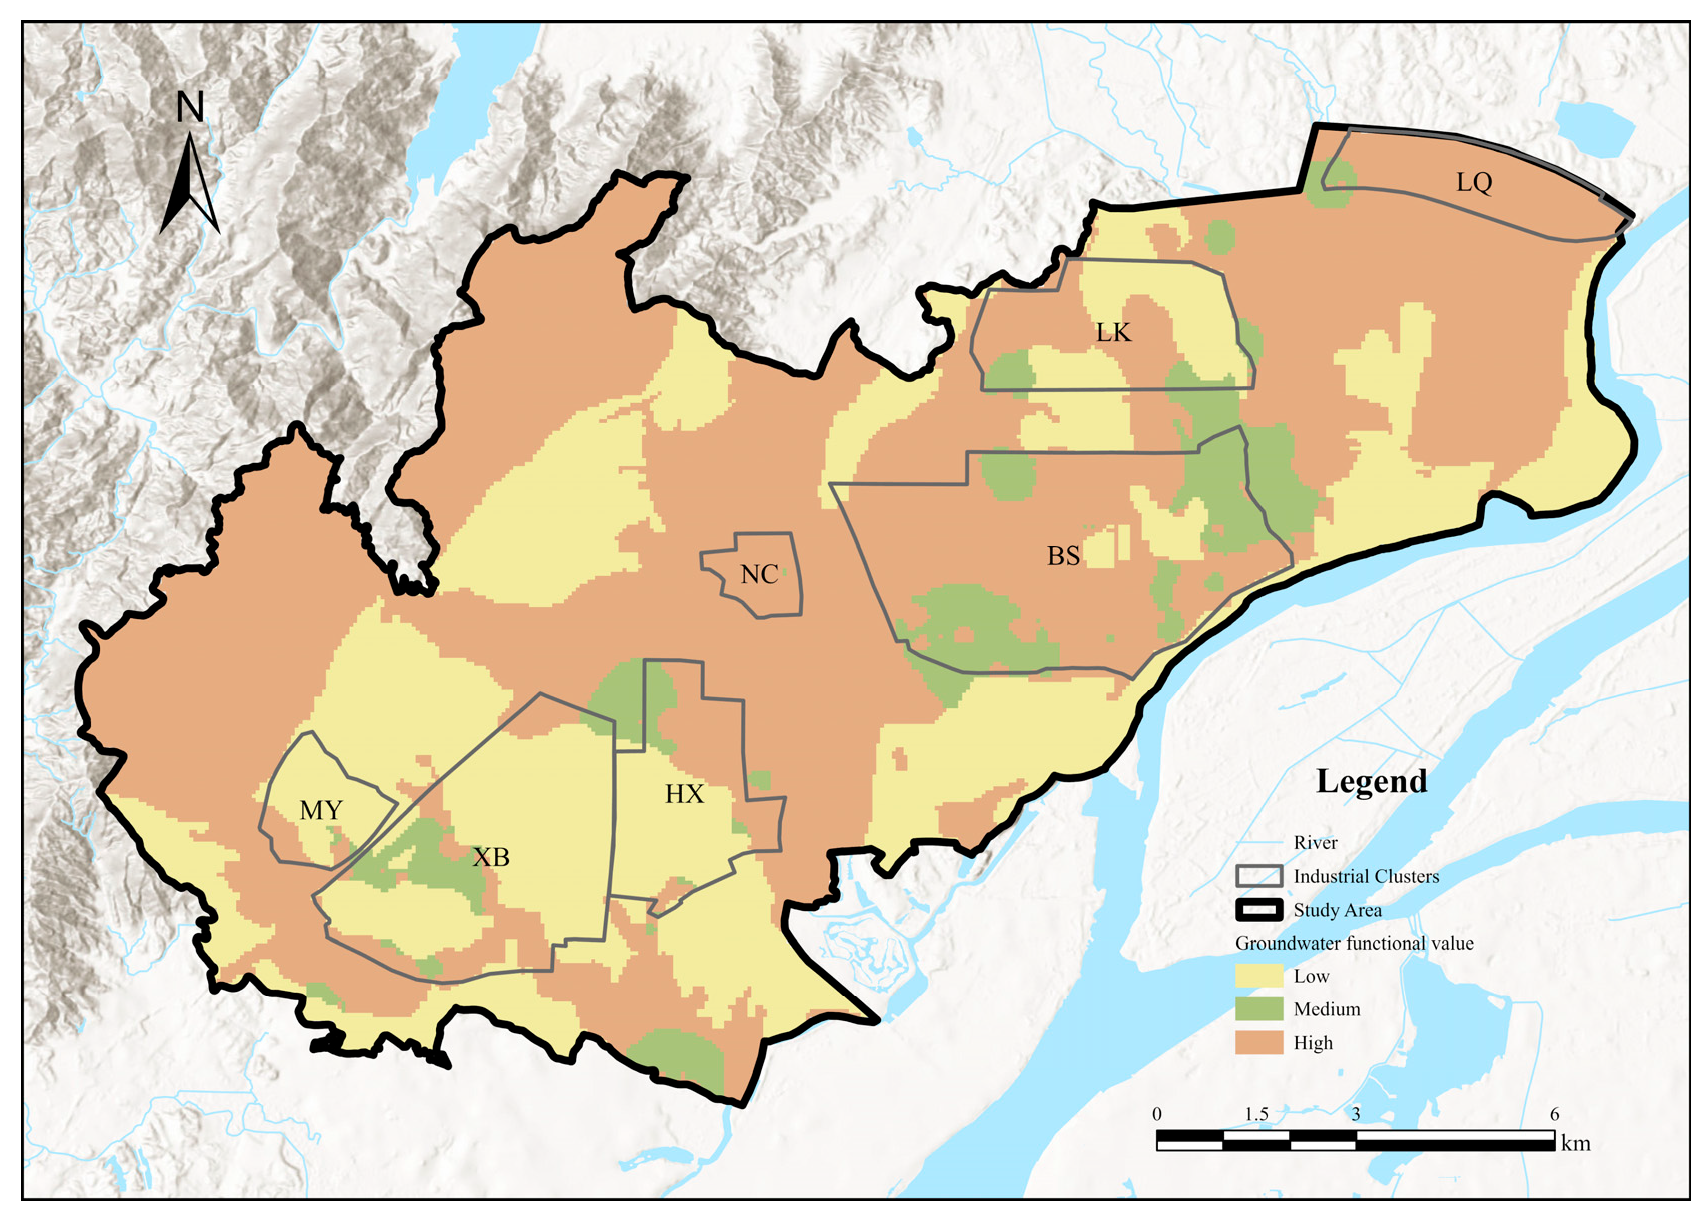
4.1.4. Groundwater Function Value Evaluation Results
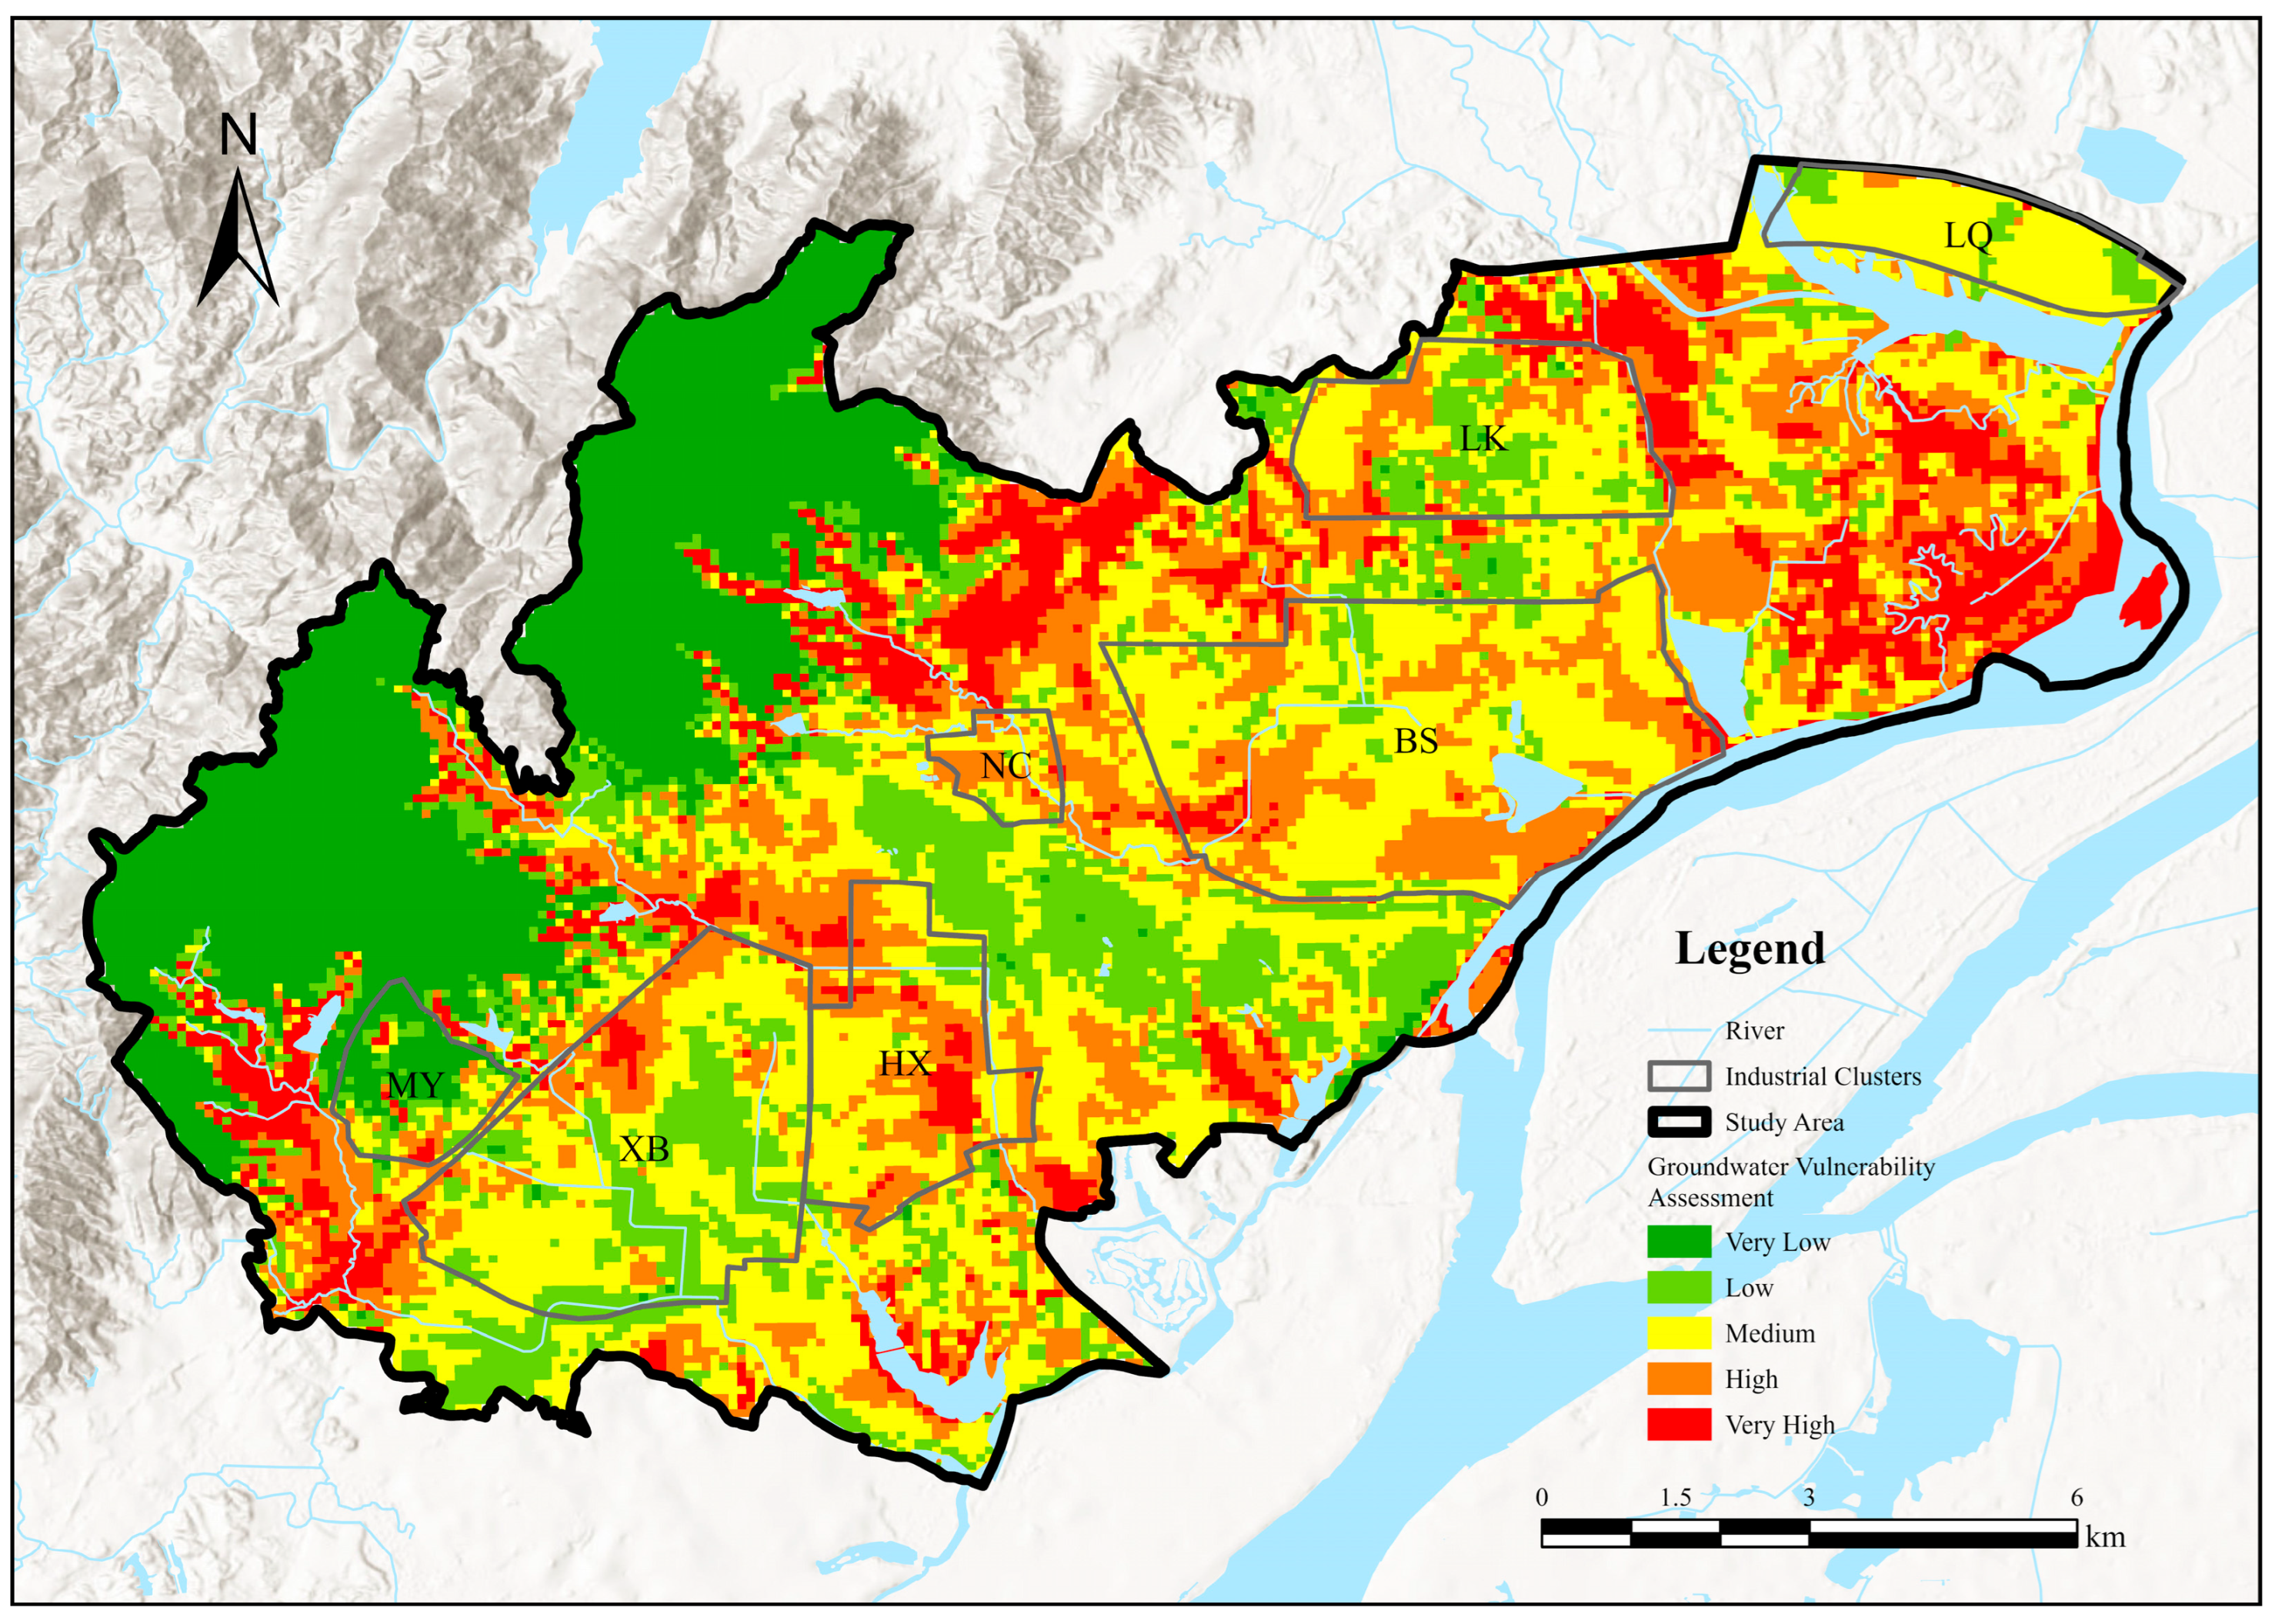
4.2. Groundwater Vulnerability Assessment
4.3. Groundwater Pollution Load Assessment
4.4. Assessment Results
5. Groundwater Human Health Risk Assessment
6. Groundwater Pollution Prediction and Simulation
6.1. Model Development
6.2. Evaluation Results
7. Groundwater Pollution Risk Control Zone Assessment Results
8. Conclusions and Recommendations
- (1)
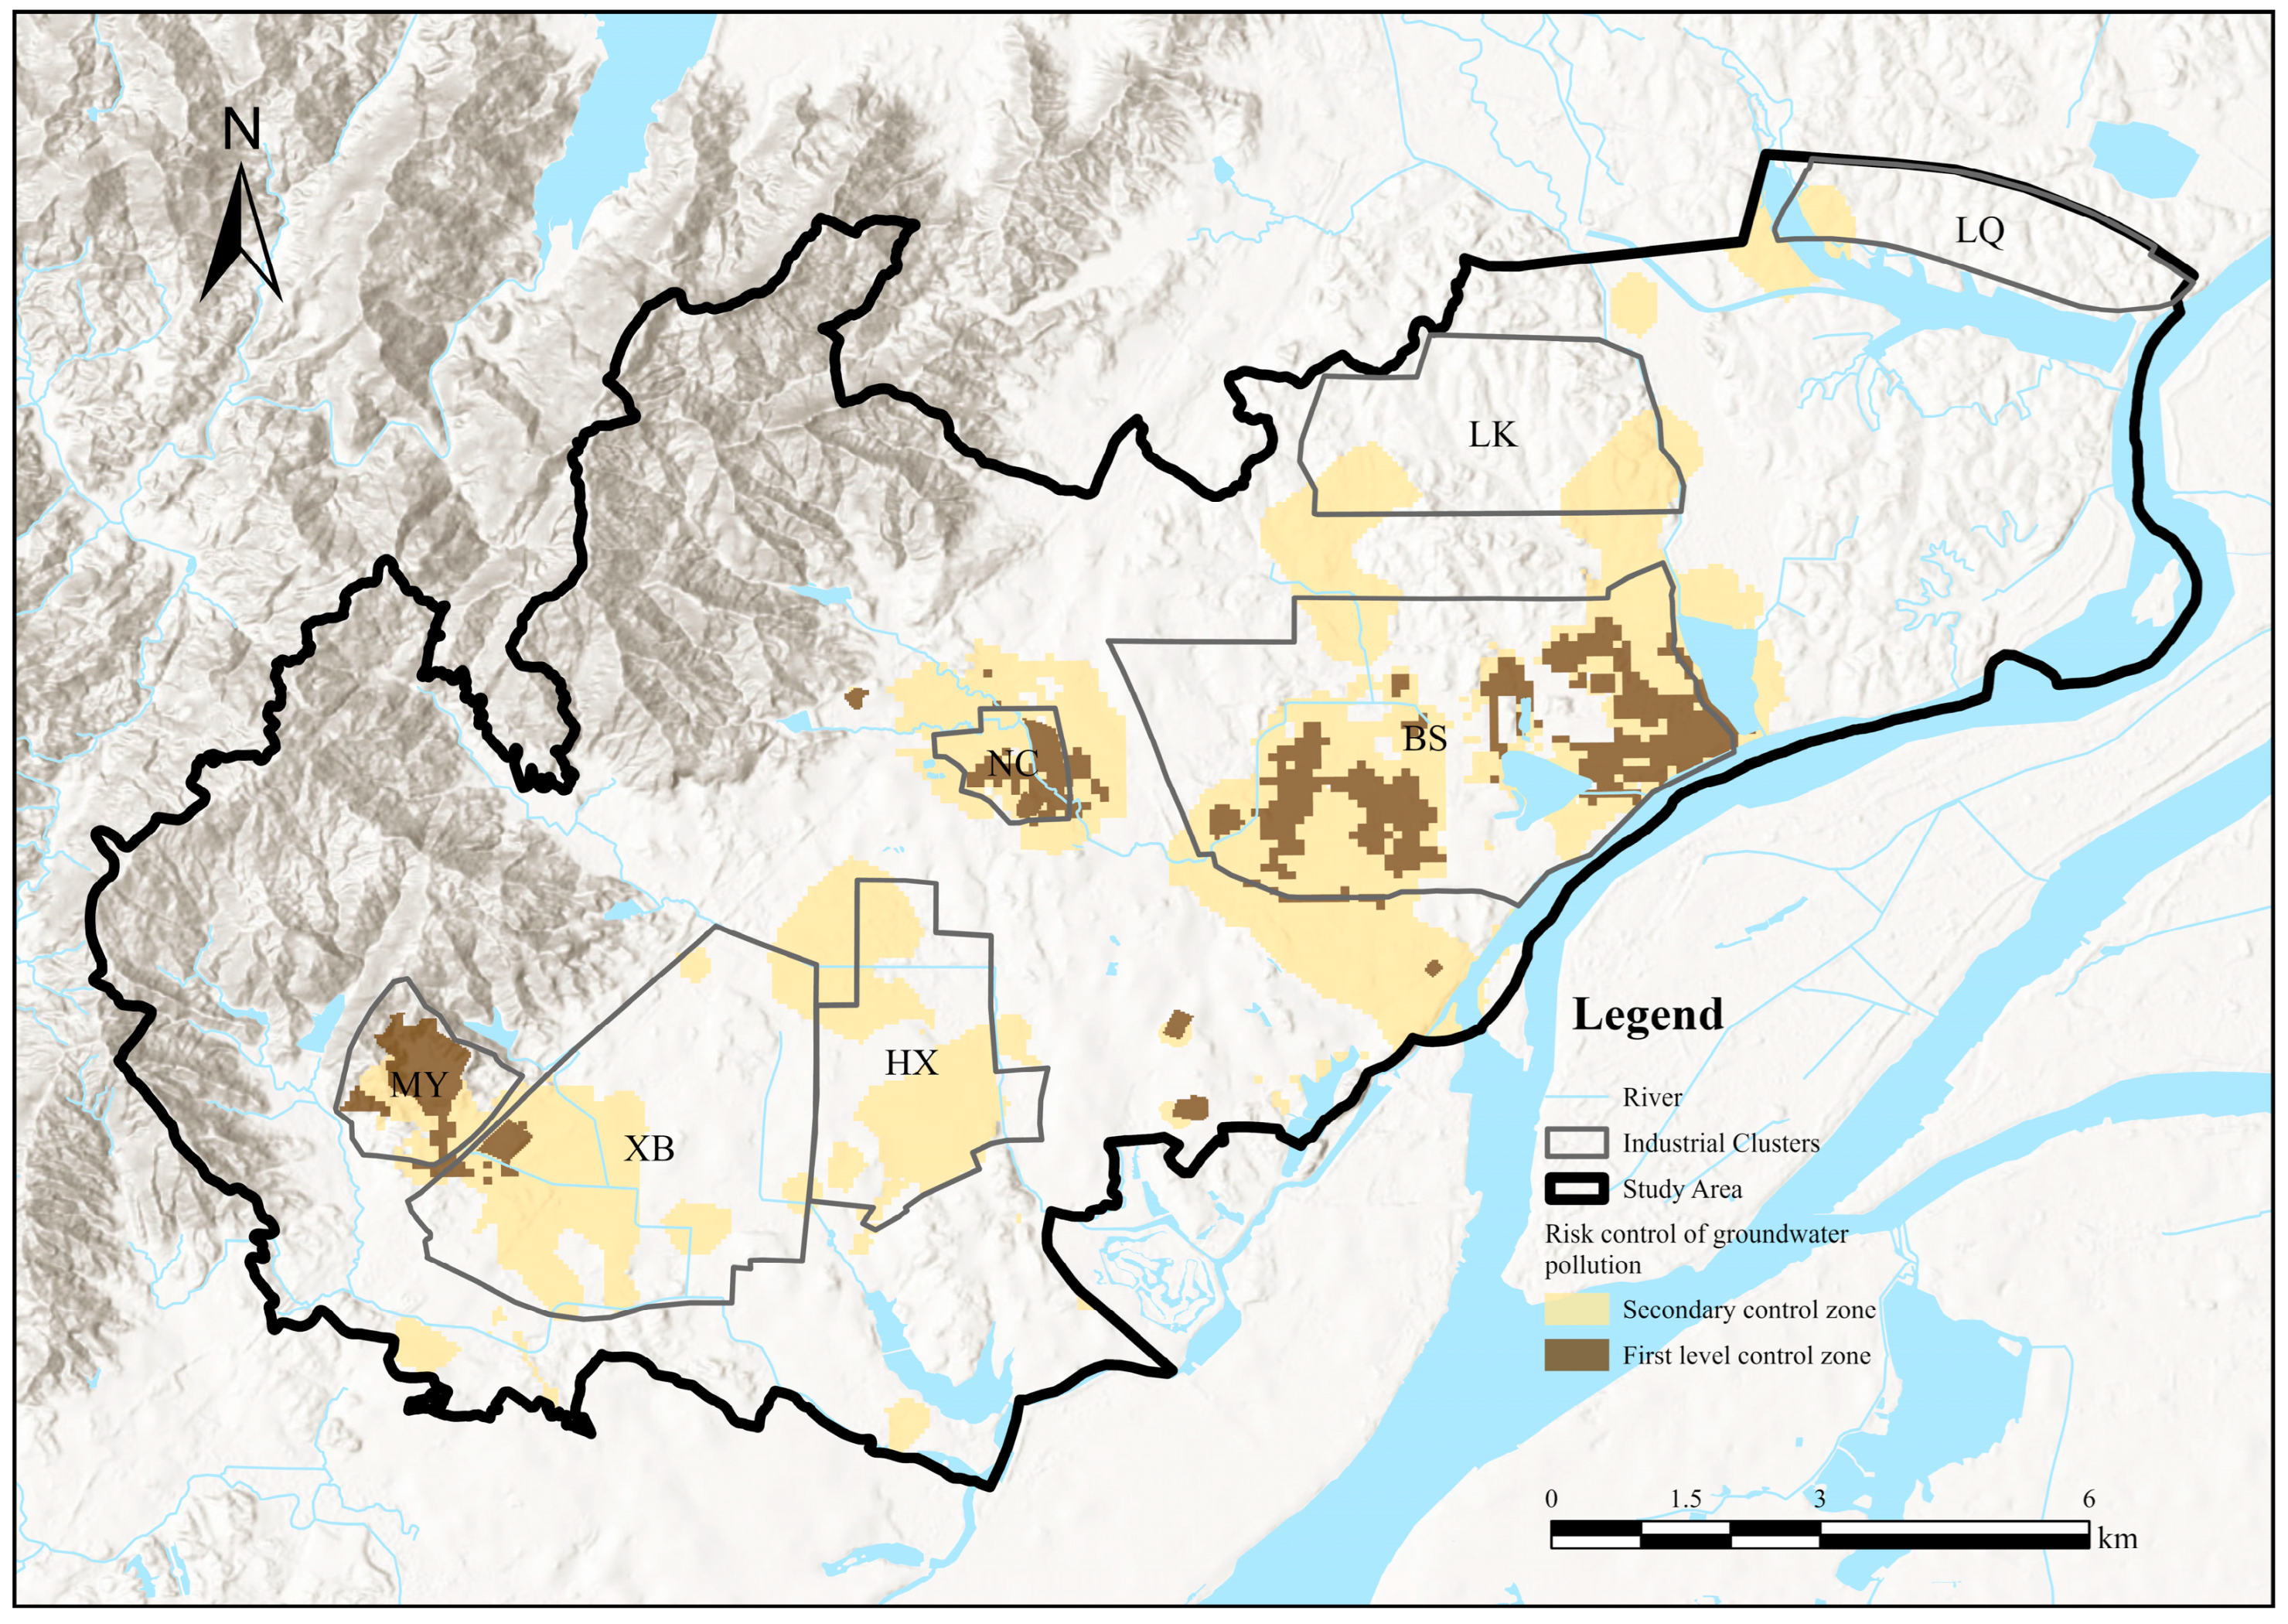
- Through groundwater pollution risk control, it is found that the first-level control zone in the study area covers 5.38 km2, accounting for 3.37% of the total area, while the secondary control zone covers 24.99 km2, or 15.68%, of the total area. The combined control zone area totals 30.37 km2, comprising 19.06% of the study area. The first-level control zone is mainly concentrated in industrial clusters, with the secondary control zone distributed broadly across the region.
- (2)
- In comparison to traditional methods for defining groundwater pollution prevention priority areas, the groundwater pollution risk control strategy identifies more extensive control zones. The first-level control zone area increased by 0.94 km2, and the secondary control zone area expanded by 16.15 km2. This method provides more suitable outcomes for industry–city integration zones, enabling environmental management agencies to more effectively monitor and protect groundwater environments.
- (3)
- For active enterprises within the first-level control zones, it is recommended to conduct quarterly groundwater environmental monitoring and perform soil and groundwater pollution risk investigations. For inactive enterprises, risk-based control measures should be implemented, and effective measures should be promptly taken to prevent pollution spread in already contaminated sites.
- (4)
- The secondary control zones should strengthen regional environmental monitoring and risk investigations. It is recommended that areas with potential human health impacts conduct environmental monitoring twice annually, based on the region’s monitoring network, to track pollution trends. Additionally, since some wells remain in certain control areas, residents should be guided by the government to seal groundwater wells, with unauthorized groundwater extraction being strictly prohibited.
Supplementary Materials
Author Contributions
Funding
Data Availability Statement
Conflicts of Interest
References
- Wang, Y.; Yuan, S.; Shi, J.; Ma, T.; Xie, X.; Deng, Y.; Du, Y.; Gan, Y.; Guo, Z.; Dong, Y.; et al. Groundwater Quality and Health: Making the Invisible Visible. Environ. Sci. Technol. 2023, 57, 5125–5136. [Google Scholar] [CrossRef] [PubMed]
- Zhang, Z.; Wang, H.; Shi, Z.; Sun, N. Temporal and Spatial Evolution of Groundwater Natural Background Levels in a Rapid Urbanization Area, Northeast of Beijing, China. Expo Health 2024, 16, 341–355. [Google Scholar] [CrossRef]
- Cao, H.; Xie, X.; Shi, J.; Jiang, G.; Wang, Y. Siamese Network-Based Transfer Learning Model to Predict Geogenic Contaminated Groundwaters. Environ. Sci. Technol. 2022, 56, 11071–11079. [Google Scholar] [CrossRef] [PubMed]
- Haggerty, R.; Sun, J.; Yu, H.; Li, Y. Application of Machine Learning in Groundwater Quality Modeling—A Comprehensive Review. Water Res. 2023, 233, 119745. [Google Scholar] [CrossRef]
- Shi, H.; Zeng, M.; Peng, H.; Huang, C.; Sun, H.; Hou, Q.; Pi, P. Health Risk Assessment of Heavy Metals in Groundwater of Hainan Island Using the Monte Carlo Simulation Coupled with the APCS/MLR Model. Int. J. Environ. Res. Public Health 2022, 19, 7827. [Google Scholar] [CrossRef]
- Shrestha, S.; Semkuyu, D.J.; Pandey, V.P. Assessment of Groundwater Vulnerability and Risk to Pollution in Kathmandu Valley, Nepal. Sci. Total Environ. 2016, 556, 23–35. [Google Scholar] [CrossRef]
- Xiang, Z.; Wu, S.; Zhu, L.; Yang, K.; Lin, D. Pollution Characteristics and Source Apportionment of Heavy Metal(Loid)s in Soil and Groundwater of a Retired Industrial Park. J. Environ. Sci. 2024, 143, 23–34. [Google Scholar] [CrossRef]
- Bera, A.; Mukhopadhyay, B.P.; Das, S. Groundwater Vulnerability and Contamination Risk Mapping of Semi-Arid Totko River Basin, India Using GIS-Based DRASTIC Model and AHP Techniques. Chemosphere 2022, 307, 135831. [Google Scholar] [CrossRef]
- Ozegin, K.O.; Ilugbo, S.O.; Adebo, B. Spatial Evaluation of Groundwater Vulnerability Using the DRASTIC-L Model with the Analytic Hierarchy Process (AHP) and GIS Approaches in Edo State, Nigeria. Phys. Chem. Earth 2024, 134, 103562. [Google Scholar] [CrossRef]
- Babiker, I.S.; Mohamed, M.a.A.; Hiyama, T.; Kato, K. A GIS-Based DRASTIC Model for Assessing Aquifer Vulnerability in Kakamigahara Heights, Gifu Prefecture, Central Japan. Sci. Total Environ. 2005, 345, 127–140. [Google Scholar] [CrossRef]
- Vias, J.M.; Andreo, B.; Perles, M.J.; Carrasco, F.; Vadillo, I.; Jimenez, P. Proposed Method for Groundwater Vulnerability Mapping in Carbonate (Karstic) Aquifers: The COP Method. Hydrogeol. J. 2006, 14, 912–925. [Google Scholar] [CrossRef]
- Rahman, A. A GIS Based DRASTIC Model for Assessing Groundwater Vulnerability in Shallow Aquifer in Aligarh, India. Appl. Geogr. 2008, 28, 32–53. [Google Scholar] [CrossRef]
- Huan, H.; Wang, J.; Teng, Y. Assessment and Validation of Groundwater Vulnerability to Nitrate Based on a Modified DRASTIC Model: A Case Study in Jilin City of Northeast China. Sci. Total Environ. 2012, 440, 14–23. [Google Scholar] [CrossRef] [PubMed]
- Sajedi-Hosseini, F.; Malekian, A.; Choubin, B.; Rahmati, O.; Cipullo, S.; Coulon, F.; Pradhan, B. A Novel Machine Learning-Based Approach for the Risk Assessment of Nitrate Groundwater Contamination. Sci. Total Environ. 2018, 644, 954–962. [Google Scholar] [CrossRef]
- El Osta, M.; Hussein, H.; Tomas, K. Numerical Simulation of Groundwater Flow and Vulnerability in Wadi El-Natrun Depression and Vicinities, West Nile Delta, Egypt. J. Geol. Soc. India 2018, 92, 235–247. [Google Scholar] [CrossRef]
- Barbulescu, A. Assessing Groundwater Vulnerability: DRASTIC and DRASTIC-Like Methods: A Review. Water 2020, 12, 1356. [Google Scholar] [CrossRef]
- Goyal, D.; Haritash, A.K.; Singh, S.K. A Comprehensive Review of Groundwater Vulnerability Assessment Using Index-Based, Modelling, and Coupling Methods. J. Environ. Manag. 2021, 296, 113161. [Google Scholar] [CrossRef]
- Wang, J.; He, J.; Chen, H. Assessment of Groundwater Contamination Risk Using Hazard Quantification, a Modified DRASTIC Model and Groundwater Value, Beijing Plain, China. Sci. Total Environ. 2012, 432, 216–226. [Google Scholar] [CrossRef] [PubMed]
- Aller, L.; Bennett, T.; Lehr, J.; Petty, R.; Hackett, G. DRASTIC: Standardized System for Evaluating Groundwater Pollution Potencial Using Hydrogeologic Settings. J. Geol. Soc. India 1987, 29, 23–37. [Google Scholar] [CrossRef]
- Taghavi, N.; Niven, R.K.; Paull, D.J.; Kramer, M. Groundwater Vulnerability Assessment: A Review Including New Statistical and Hybrid Methods. Sci. Total Environ. 2022, 822, 153486. [Google Scholar] [CrossRef]
- Yu, H.; Wu, Q.; Zeng, Y.; Zheng, L.; Xu, L.; Liu, S.; Wang, D. Integrated Variable Weight Model and Improved DRASTIC Model for Groundwater Vulnerability Assessment in a Shallow Porous Aquifer. J. Hydrol. 2022, 608, 127538. [Google Scholar] [CrossRef]
- Thirumalaivasan, D.; Karmegam, M.; Venugopal, K. AHP-DRASTIC: Software for Specific Aquifer Vulnerability Assessment Using DRASTIC Model and GIS. Environ. Modell. Softw. 2003, 18, 645–656. [Google Scholar] [CrossRef]
- Sener, E.; Davraz, A. Assessment of Groundwater Vulnerability Based on a Modified DRASTIC Model, GIS and an Analytic Hierarchy Process (AHP) Method: The Case of Egirdir Lake Basin (Isparta, Turkey). Hydrogeol. J. 2013, 21, 701–714. [Google Scholar] [CrossRef]
- Bera, A.; Mukhopadhyay, B.P.; Chowdhury, P.; Ghosh, A.; Biswas, S. Groundwater Vulnerability Assessment Using GIS-Based DRASTIC Model in Nangasai River Basin, India with Special Emphasis on Agricultural Contamination. Ecotox. Environ. Saf. 2021, 214, 112085. [Google Scholar] [CrossRef] [PubMed]
- Anane, M.; Abidi, B.; Lachaal, F.; Limam, A.; Jellali, S. GIS-Based DRASTIC, Pesticide DRASTIC and the Susceptibility Index (SI): Comparative Study for Evaluation of Pollution Potential in the Nabeul-Hammamet Shallow Aquifer, Tunisia. Hydrogeol. J. 2013, 21, 715–731. [Google Scholar] [CrossRef]
- Allafta, H.; Opp, C.; Patra, S. Identification of Groundwater Potential Zones Using Remote Sensing and GIS Techniques: A Case Study of the Shatt Al-Arab Basin. Remote Sens. 2021, 13, 112. [Google Scholar] [CrossRef]
- Torkashvand, M.; Neshat, A.; Javadi, S.; Pradhan, B. New Hybrid Evolutionary Algorithm for Optimizing Index-Based Groundwater Vulnerability Assessment Method. J. Hydrol. 2021, 598, 126446. [Google Scholar] [CrossRef]
- Alizadeh, M.R.; Adamowski, J.; Inam, A. Integrated Assessment of Localized SSP-RCP Narratives for Climate Change Adaptation in Coupled Human-Water Systems. Sci. Total Environ. 2022, 823, 153660. [Google Scholar] [CrossRef]
- Sivakumar, V.; Kumar, M.C.S.; Natarajan, L.; Roy, P.D.; Chokkalingam, L. Vulnerability Assessment of Groundwater in Industrialized Tiruppur Area of South India Using GIS-Based DRASTIC Model. J. Geol. Soc. India 2022, 98, 696–702. [Google Scholar] [CrossRef]
- Zhang, Q.; Li, P.; Lyu, Q.; Ren, X.; He, S. Groundwater Contamination Risk Assessment Using a Modified DRATICL Model and Pollution Loading: A Case Study in the Guanzhong Basin of China. Chemosphere 2022, 291, 132695. [Google Scholar] [CrossRef]
- Zhao, X.; Wang, D.; Xu, H.; Ding, Z.; Shi, Y.; Lu, Z.; Cheng, Z. Groundwater Pollution Risk Assessment Based on Groundwater Vulnerability and Pollution Load on an Isolated Island. Chemosphere 2022, 289, 133134. [Google Scholar] [CrossRef] [PubMed]
- Kumar, S.; Rahman, M.A.; Islam, M.R.; Abul Hashem, M.; Rahman, M.M. Lead and Other Elements-Based Pollution in Soil, Crops and Water near a Lead-Acid Battery Recycling Factory in Bangladesh. Chemosphere 2022, 290, 133288. [Google Scholar] [CrossRef]
- Ullah, Z.; Rashid, A.; Ghani, J.; Nawab, J.; Zeng, X.-C.; Shah, M.; Alrefaei, A.F.; Kamel, M.; Aleya, L.; Abdel-Daim, M.M.; et al. Groundwater Contamination through Potentially Harmful Metals and Its Implications in Groundwater Management. Front. Environ. Sci. 2022, 10, 1021596. [Google Scholar] [CrossRef]
- Wan, Y.; Chen, X.; Liu, Q.; Hu, H.; Wu, C.; Xue, Q. Informal Landfill Contributes to the Pollution of Microplastics in the Surrounding Environment. Environ. Pollut. 2022, 293, 118586. [Google Scholar] [CrossRef] [PubMed]
- Xu, H.; Yang, X.; Wang, D.; Hu, Y.; Cheng, Z.; Shi, Y.; Zheng, P.; Shi, L. Multivariate and Spatio-Temporal Groundwater Pollution Risk Assessment: A New Long-Time Serial Groundwater Environmental Impact Assessment System. Environ. Pollut. 2023, 317, 120621. [Google Scholar] [CrossRef] [PubMed]
- Guo, Y.; Li, P.; He, X.; Wang, L. Groundwater Quality in and Around a Landfill in Northwest China: Characteristic Pollutant Identification, Health Risk Assessment, and Controlling Factor Analysis. Expo. Health 2022, 14, 885–901. [Google Scholar] [CrossRef]
- Sundar, M.L.; Ragunath, S.; Hemalatha, J.; Vivek, S.; Mohanraj, M.; Sampathkumar, V.; Ansari, A.M.S.; Parthiban, V.; Manoj, S. Simulation of Ground Water Quality for Noyyal River Basin of Coimbatore City, Tamilnadu Using MODFLOW. Chemosphere 2022, 306, 135649. [Google Scholar] [CrossRef]
- Ministry of Ecology and Environment. Guidelines for the Division of Groundwater Pollution Prevention and Control Zones (Trial); Ministry of Ecology and Environment: Beijing, China, 2014.
- Ministry of Ecology and Environment. Guidelines for Zoning of Groundwater Pollution Prevention and Control Zones; Ministry of Ecology and Environment: Beijing, China, 2019.
- Ministry of Ecology and Environment. Technical Guidelines for Defining Key Areas for Groundwater Pollution Prevention and Control (Trial); Ministry of Ecology and Environment: Beijing, China, 2023.
- Holding, S.; Allen, D.M.; Foster, S.; Hsieh, A.; Larocque, I.; Klassen, J.; Van Pelt, S.C. Groundwater Vulnerability on Small Islands. Nat. Clim. Chang. 2016, 6, 1100–1103. [Google Scholar] [CrossRef]
- He, S.; Li, P.; Wu, J.; Elumalai, V.; Adimalla, N. Groundwater Quality under Land Use/Land Cover Changes: A Temporal Study from 2005 to 2015 in Xi’an, Northwest China. Hum. Ecol. Risk Assess. Int. J. 2020, 26, 2771–2797. [Google Scholar] [CrossRef]
- Kazakis, N.; Voudouris, K.S. Groundwater Vulnerability and Pollution Risk Assessment of Porous Aquifers to Nitrate: Modifying the DRASTIC Method Using Quantitative Parameters. J. Hydrol. 2015, 525, 13–25. [Google Scholar] [CrossRef]
- Xiong, Y.; Liu, J.; Yuan, W.; Liu, W.; Ma, S.; Wang, Z.; Li, T.; Wang, Y.; Wu, J. Groundwater Contamination Risk Assessment Based on Groundwater Vulnerability and Pollution Loading: A Case Study of Typical Karst Areas in China. Sustainability 2022, 14, 9898. [Google Scholar] [CrossRef]
- Hou, Y.; Dou, X.; Bao, S.; Gao, H.; Yang, Y.; Wen, Y.; Wang, M. Assessment of groundwater contamination risk based on improved DRASTIC model. Acta Sci. Circumstantiae 2024, 44, 227–236. [Google Scholar] [CrossRef]
- Siddiqua, A.; Hahladakis, J.N.; Al-Attiya, W.A.K.A. An Overview of the Environmental Pollution and Health Effects Associated with Waste Landfilling and Open Dumping. Environ. Sci. Pollut. Res. 2022, 29, 58514–58536. [Google Scholar] [CrossRef] [PubMed]
- Wang, Y.; Liu, J.; Yu, X.; Yan, Y.; Chen, Q.; Chen, S. Evaluation of Groundwater Quality and Health Risk Assessment in Southeastern Tibet, China. Environ. Earth Sci. 2023, 82, 455. [Google Scholar] [CrossRef]
- Wang, Y.; Li, P. Appraisal of Shallow Groundwater Quality with Human Health Risk Assessment in Different Seasons in Rural Areas of the Guanzhong Plain (China). Environ. Res. 2022, 207, 112210. [Google Scholar] [CrossRef]
- US EPA. Risk Assessment Guidance for Superfund Volume: Human Health Evaluation Manual. Supplemental Guidance: “Standard Default Exposure Factors” Final Interim Report (Directive); US EPA: Washington, DC, USA, 1991.
- US EPA. Guidance for Exposure Assessment; US EPA: Washington, DC, USA, 1992.
- Liu, H.; Xie, H.; Lin, Y.; Xin, B.; Yang, G.; Li, J.; Zhou, S. Source Analysis and Health Risk Assessment of Metal Elements in Karst Groundwater of Qingjiang River Basin. Environ. Sci. Technol. 2024, 47, 138–148. [Google Scholar] [CrossRef]
- Xiao, Y.; Hao, Q.; Zhang, Y.; Zhu, Y.; Yin, S.; Qin, L.; Li, X. Investigating Sources, Driving Forces and Potential Health Risks of Nitrate and Fluoride in Groundwater of a Typical Alluvial Fan Plain. Sci. Total Environ. 2022, 802, 149909. [Google Scholar] [CrossRef]
- Ministry of Ecology and Environment. Guidelines for Health Risk Assessment of Groundwater Pollution; Ministry of Ecology and Environment: Beijing, China, 2019.
- GB/T 14848–2017; Bureau of Quality and Technical Supervision of China Standard of Groundwater Quality. China Standard Press: Beijing, China, 2017.
- GB/T 14848-2017; General Administration of Quality Supervision, Inspection and Quarantine of China. Standardization Administration of China Groundwater Quality Standards. Standards Press of China: Beijing, China, 2017.
- Ma, Q.; Ge, W.; Tian, F. Geochemical Characteristics and Controlling Factors of Chemical Composition of Groundwater in a Part of the Nanchang Section of Ganfu Plain. Sustainability 2022, 14, 7976. [Google Scholar] [CrossRef]
- Ma, Q.; Jia, J.; Tian, F.; Chen, C. Groundwater Vulnerability Assessment Using Gis Based Modified Drastic Model in Nanchang City, China. Fresenius Environ. Bull. 2021, 30, 997–1009. [Google Scholar]
- He, J.; Mao, H.; Xue, Y.; Liao, F.; Gao, B.; Rao, Z.; Yang, Y.; Liu, Y.; Wang, G. Variability in Spatiotemporal Groundwater Nitrate Concentrations in the Northeast Ganfu Plain. Earth Sci. Front. 2024, 31, 360–370. [Google Scholar] [CrossRef]
- Chu, X.; Ma, Z.; Wu, D.; Wang, H.; He, J.; Chen, T.; Zheng, Z.; Li, H.; Wei, P. High Fe and Mn Groundwater in the Nanchang, Poyang Lake Basin of China: Hydrochemical Characteristics and Genesis Mechanisms. Environ. Monit. Assess. 2023, 195, 124. [Google Scholar] [CrossRef] [PubMed]
- Ministry of Ecology and Environment. Technical Guidelines for Environmental Impact Assessment-Groundwater Environment; Ministry of Ecology and Environment: Beijing, China, 2016.


| Value | Meaning |
|---|---|
| 1 | Equally important |
| 3 | Slightly important |
| 5 | Moderately important |
| 7 | Very important |
| 9 | Extremely important |
| 2/4/6/8 | Intermediate values between the above cases |
| Reciprocal | Inverse importance level |
| D | R | A | S | T | I | C | L | Score |
|---|---|---|---|---|---|---|---|---|
| Groundwater Depth | Aquifer Recharge Rate | Aquifer Thickness | Soil Medium | Slope | Unsaturated Zone Medium | Permeability | Land Use Type | |
| m | mm/a | m | / | / | / | m/d | / | |
| >30 | 0 | >11.74 | Rock | >10 | Clay | 0–4 | 1 | |
| 25–30 | 0–51 | 11.74–9.641 | Clay Loam | 9–10 | Silty Clay | 4–12 | Grassland | 2 |
| 20–25 | 51–71 | 8.241–9.641 | Sandy Loam | 8–9 | Sandy Clay | 12–20 | Shrub Land | 3 |
| 15–20 | 71–92 | 7.133–8.241 | Loam | 7–8 | Silt Sand | 20–30 | Forest | 4 |
| 10–15 | 92–117 | 6.142–7.133 | Sandy Loam | 6–7 | Silt Sand–Fine Sand | 30–35 | Water Bodies | 5 |
| 8–10 | 117–147 | 5.267–6.142 | Cohesive Clay | 5–6 | Fine Sand | 35–40 | Agricultural Land | 6 |
| 6–8 | 147–178 | 4.451–5.267 | Silt | 4–5 | Medium | 40–60 | 7 | |
| 4–8 | 178–216 | 3.693–4.451 | Gravel | 3–4 | Coarse Sand | 60–80 | 8 | |
| 2–4 | 216–235 | 2.935–4.451 | Gravel–Cobble Mixture | 2–3 | Sandstone | 80–100 | Built-up Land | 9 |
| 0–2 | >235 | <2.935 | Thin or Missing | <2 | Gravel–Cobble Mixture | <100 | 10 |
| Pollution Source Type | Toxicity Category | Ti Score |
|---|---|---|
| Industrial Pollution Sources | Petroleum processing, coking, and nuclear fuel processing | 2.5 |
| Non-ferrous metal smelting and rolling | 3 | |
| Ferrous metal smelting and rolling | 2 | |
| Chemical raw material and product manufacturing | 2.5 | |
| Textile industry | 1 | |
| Leather, fur, and feather products | 1 | |
| Metal product industry | 1.5 | |
| Other industries | 0.2 | |
| Landfills | Primarily household waste | 1.5 |
| Gas Stations | Petroleum hydrocarbons and polycyclic aromatic hydrocarbons | 2.5 |
| Pollution Source Type | Release Likelihood | Li Score |
|---|---|---|
| Industrial Pollution | Commissioned after 2011 | 0.2 |
| Commissioned between 1998 and 2011 | 0.6 | |
| Commissioned before 1998 or lacking protection | 1 | |
| Landfills | ≤5 years, AAA grade for harmless treatment | 0.1 |
| >5 years, AAA grade for harmless treatment | 0.2 | |
| ≤5 years, AA grade for harmless treatment | 0.2 | |
| >5 years, AA grade for harmless treatment | 0.4 | |
| ≤5 years, A grade for harmless treatment | 0.4 | |
| >5 years, A grade for harmless treatment | 0.5 | |
| Basic protection, B grade for harmless treatment | 0.6 | |
| No protection, B grade for harmless treatment | 1 | |
| Gas Stations | ≤5 years, double-walled tank or anti-seepage pool | 0.1 |
| (5, 15] years, double-walled tank or anti-seepage pool | 0.2 | |
| >15 years, double-walled tank or anti-seepage pool | 0.5 | |
| ≤5 years, single-walled tank without anti-seepage pool | 0.2 | |
| (5, 15] years, single-walled tank without anti-seepage pool | 0.6 | |
| >15 years, single-walled tank without anti-seepage pool | 1 |
| Pollution Source Type | Type | Qi Score |
|---|---|---|
| Industrial Pollution (wastewater discharge, units: ×103 t/a) | ≤1 | 1 |
| (1, 5] | 2 | |
| (5, 10] | 4 | |
| (10, 50] | 6 | |
| (50, 100] | 8 | |
| (100, 500] | 9 | |
| (500, 1000] | 10 | |
| >1000 | 12 | |
| Landfills (landfill volume, units: ×103 m3) | ≤1000 | 4 |
| (1000, 5000] | 7 | |
| >5000 | 9 | |
| Gas Stations (number of 30 m3 tanks) | 1 | 1 |
| Parameter | Meaning | Unit | Value |
|---|---|---|---|
| RT | Total carcinogenic risk | 1/a | Calculated |
| Rc | Carcinogenic risk | 1/a | Calculated |
| Rn | Non-carcinogenic risk | 1/a | Calculated |
| L | Average lifespan | a | 76 a |
| ADDi | Average daily exposure by ingestion | mg/(kg·d) | Calculated |
| SF | Carcinogenic slope factor | (kg·d)/mg | Table 7 |
| RfD | Reference dose | mg/(kg·d) | Table 7 |
| ADDd | Average daily exposure by dermal contact | mg/(kg·d) | Calculated |
| c | Concentration | mg/L | Measured value |
| IR | Ingestion rate | L/d | Children: 0.7 L/d, Adults: 1.8 L/d |
| ED | Exposure duration | a | Children: 6 a, Adults: 24 a |
| EF | Exposure frequency | d/a | Both children and adults: 350 d/a |
| BW | Body weight | kg | Children: 19.2 kg, Adults: 61.8 kg |
| AT | Average exposure time | d | Carcinogenic: 27,740 d, Non-carcinogenic: 2196 d |
| SA | Skin contact surface area | cm2 | Children: 6000, Adults: 18,000 |
| ET | Daily exposure time | h/d | Children: 0.42, Adults: 0.63 |
| CF | Volume conversion factor | ml/cm2 | 0.001 |
| PC | Permeability coefficient | cm/h | Table 7 |
| No | Pollutant Indicator | PC | SFo | RFDi | ||
|---|---|---|---|---|---|---|
| Oral | Dermal | Oral | Dermal | |||
| 1 | Fe | 0.001 | - | - | 0.7 | 0.7 |
| 2 | Mn | 0.001 | - | - | 0.14 | 0.14 |
| 3 | Cd | 0.001 | - | - | 0.001 | 0.000025 |
| 4 | Co | 0.0004 | - | - | 0.0003 | 0.0003 |
| 5 | NH4+ | 0.001 | - | - | 0.97 | 0.97 |
| 6 | NO3− | - | - | - | 1.6 | 1.6 |
| 7 | As | 0.001 | 1.5 | 1.5 | 0.0003 | 0.0003 |
| 8 | F | 0.001 | - | - | 0.04 | 0.04 |
| 9 | CCl4 | 0.016 | 0.07 | 0.07 | 0.004 | 0.004 |
| 10 | Petroleum hydrocarbons (C10-C40) | 0.001 | - | - | 0.04 | 0.04 |
| Quality | Good | Moderate | Poor | |
|---|---|---|---|---|
| Abundance | ||||
| Strong | High | High | Moderate | |
| Moderate | High | Moderate | Low | |
| Weak | Low | Low | Low | |
| Indicator | D | R | A | S | T | I | C | L | Subjective Weight |
|---|---|---|---|---|---|---|---|---|---|
| D | 1 | 3 | 5 | 7 | 9 | 1 | 5 | 5 | 0.298 |
| R | 1/3 | 1 | 2 | 6 | 7 | 1/3 | 3 | 3 | 0.162 |
| A | 1/5 | 1/3 | 1 | 3 | 5 | 1/5 | 1 | 1 | 0.066 |
| S | 1/7 | 1/6 | 1/3 | 1 | 5 | 1/7 | 1/5 | 1/3 | 0.031 |
| T | 1/9 | 1/7 | 1/5 | 1/5 | 1 | 1/9 | 1/6 | 1/6 | 0.015 |
| I | 1 | 3 | 5 | 7 | 9 | 1 | 5 | 5 | 0.298 |
| C | 1/5 | 1/3 | 1 | 3 | 5 | 1/5 | 1 | 1 | 0.066 |
| L | 1/5 | 1/3 | 1 | 3 | 5 | 1/5 | 1 | 1 | 0.066 |
| No. | Pollutant | Carcinogenic Risk Control Value | Non-Carcinogenic Risk Control Value | Risk Control Value | Groundwater Class III Standard | Control Value for Groundwater Usage Zones | Groundwater Class IV Standard | Control Value for Groundwater Non-Usage Zones |
|---|---|---|---|---|---|---|---|---|
| 1 2 | Fe | - - | 10 2 | 10 2 | 0.3 0.10 | 10 2.00 | 2.0 1.50 | 10 2 |
| 3 | Mn | - | 0.0143 | 0.0143 | 0.005 | 0.0143 | 0.010 | 0.0143 |
| 4 | Cd | - | 0.00429 | 0.00429 | 0.05 | 0.05 | 0.10 | 0.1 |
| 5 | Co | - | 13.9 | 13.9 | 0.50 | 13.9 | 1.50 | 13.9 |
| 6 | NH4+ | 8.7 × 10⁻⁵ | 0.00429 | 8.7 × 10⁻⁵ | 0.01 | 0.01 | 0.05 | 0.05 |
| 7 | NO3− | - | 22.9 | 22.9 | 20.0 | 22.9 | 30.0 | 30 |
| 8 | As | - | 0.572 | 0.572 | 1.0 | 1.0 | 2.0 | 2 |
| 9 | F | 0.00185 | 0.0376 | 0.00185 | 0.0020 | 0.0020 | 0.0500 | 0.05 |
| 10 | CCl4 | - | 0.572 | 0.572 | 0.6 | 0.6 | 1.2 | 1.2 |
Disclaimer/Publisher’s Note: The statements, opinions and data contained in all publications are solely those of the individual author(s) and contributor(s) and not of MDPI and/or the editor(s). MDPI and/or the editor(s) disclaim responsibility for any injury to people or property resulting from any ideas, methods, instructions or products referred to in the content. |
© 2025 by the authors. Licensee MDPI, Basel, Switzerland. This article is an open access article distributed under the terms and conditions of the Creative Commons Attribution (CC BY) license (https://creativecommons.org/licenses/by/4.0/).
Share and Cite
Qiao, X.; Cheng, T.; Zhang, L.; Sun, N.; Ding, Z.; Shi, Z.; Wang, G.; Zhang, Z. Zoning Method for Groundwater Pollution Risk Control in Typical Industrial–Urban Integration Areas in the Middle Reaches of the Yangtze River. Water 2025, 17, 2249. https://doi.org/10.3390/w17152249
Qiao X, Cheng T, Zhang L, Sun N, Ding Z, Shi Z, Wang G, Zhang Z. Zoning Method for Groundwater Pollution Risk Control in Typical Industrial–Urban Integration Areas in the Middle Reaches of the Yangtze River. Water. 2025; 17(15):2249. https://doi.org/10.3390/w17152249
Chicago/Turabian StyleQiao, Xiongbiao, Tianwei Cheng, Liming Zhang, Ning Sun, Zhenyu Ding, Zheming Shi, Guangcai Wang, and Zongwen Zhang. 2025. "Zoning Method for Groundwater Pollution Risk Control in Typical Industrial–Urban Integration Areas in the Middle Reaches of the Yangtze River" Water 17, no. 15: 2249. https://doi.org/10.3390/w17152249
APA StyleQiao, X., Cheng, T., Zhang, L., Sun, N., Ding, Z., Shi, Z., Wang, G., & Zhang, Z. (2025). Zoning Method for Groundwater Pollution Risk Control in Typical Industrial–Urban Integration Areas in the Middle Reaches of the Yangtze River. Water, 17(15), 2249. https://doi.org/10.3390/w17152249