Review

Distribution and Ecological Risk Assessment of Perfluoroalkyl and Polyfluoroalkyl Substances in Chinese Soils: A Review

1
State Key Laboratory of Hydraulics and Mountain River Engineering, College of Water Resource & Hydropower, Sichuan University, Chengdu 610065, China
2
School of Civil, Mining, Environmental and Architectural Engineering, Faculty of Engineering and Information Sciences, University of Wollongong, Wollongong, NSW 2522, Australia
3
School of Architecture and Civil Engineering, Xihua Universtiy, Chengdu 610039, China
*
Authors to whom correspondence should be addressed.
Water 2025, 17(15), 2246; https://doi.org/10.3390/w17152246
Submission received: 27 May 2025 / Revised: 11 July 2025 / Accepted: 24 July 2025 / Published: 28 July 2025
(This article belongs to the Section Soil and Water)

Abstract

Per- and polyfluoroalkyl substances (PFASs) are emerging pollutants of global concern due to their high environmental persistence and bioaccumulative characteristics. This study investigates PFAS concentrations in soils from China through an extensive literature review, covering soil samples from seventeen provinces and the years from 2009 to 2024. It was found that the total concentration of PFAS in soil ranged from 0.25 to 6240 ng/g, with the highest contamination levels observed in coastal provinces, particularly Fujian (620 ng/g) and Guangdong (1090 ng/g). Moreover, Fujian Province ranked the highest among multiple regions with a median PFAS concentration of 15.7 ng/g for individual compounds. Ecological risk assessment, focusing on areas where perfluorooctanoic acid (PFOA) or perfluorooctane sulfonate (PFOS) were identified as the primary soil PFAS compounds, showed moderate ecological risk from PFOA in Shanghai (0.24), while PFOS posed a high ecological risk in Fujian and Guangdong, with risk values of 43.3 and 1.4, respectively. Source analysis revealed that anthropogenic activities, including PFAS production, firefighting foam usage, and landfills, were the primary contributors to soil contamination. Moreover, soil PFASs tend to migrate into groundwater via adsorption and seepage, ultimately entering the human body through bioaccumulation or drinking water, posing health risks. These findings enhance our understanding of PFAS distribution and associated risks in Chinese soils, providing crucial insights for pollution management, source identification, and regulation strategies in diverse areas.

1. Introduction

Per- and polyfluoroalkyl substances (PFASs) are a group of synthetic chemicals classified as new emerging pollutants on account of their high environmental persistence [1]. They typically comprise a carbon backbone with fluorine that saturates most of the carbon and at least one functional group [2], which is displayed in Table S1. These substances have complex chemical compositions and strong covalent bonds, the carbon–fluorine (C-F) bonds, making them widely used in various industrial as well as commercial applications such as firefighting foams, waterproof clothing, non-stick cookware, and food packaging materials [3,4]. With the widespread application of PFASs in industrial and commercial processes, increasing amounts of anthropogenic PFASs are being released into the environment, including water bodies, air, and soil. This contamination poses ecological risks and threats to human health through the food chain, as PFASs can accumulate in contaminated food [5]. Additionally, the occurrence of short-chain PFASs (C4-C6) in groundwater in some areas also threatens the groundwater quality. PFASs associated with airborne particle matter (PM) can be easily inhaled by organisms, while PFASs in soil can accumulate in plants, ultimately increasing health risks for local residents [6,7,8]. Initially, PFASs primarily originated from dedicated PFAS manufacturing plants [9,10]. However, extensive indirect sources, such as electroplating, semiconductor production, and other industries, as well as the manufacturing of consumer products like outdoor sports apparel, now contribute significantly to PFAS emissions into the environment [11].
Soil serves as an important reservoir for PFASs, playing a significant role in their storage and transportation within the environment [12]. Additionally, soil is crucial for supporting agricultural operations, whose fertility, health, and environmental stress directly influence crop growth [13]. As the upper layer of groundwater systems, soil can accumulate and transport various pollutants, potentially leading to their percolation into groundwater and negatively affecting its quality [14]. Moreover, as a vast ecosystem, soil provides growth and habitat environments for numerous organisms and also provides abundant natural resources for human beings [15].
Recent studies have highlighted the growing severity of PFAS pollution worldwide. In the United States, municipal water supply systems in Vermont and New York have suffered from PFAS contamination, with PFOA detected in soil and groundwater within the Green Mountain National Forest, reaching concentrations of up to 100 ng/kg due to percolation from residential areas into protected forest land [16]. Similarly, agricultural soils in the states of North Rhine-Westphalia and Baden-Wurttemberg, Germany, have been found to be contaminated, with long-term leaching of 10 PFASs into the soil and groundwater [17,18,19]. Röhler et al. (2021) found that concentrations of short-chain PFASs in soil showed seasonal fluctuations, with a peak concentration of 348 ng/g [19]. In Lyon, France, 28 PFASs were detected in the topsoil near the polyvinylidene difluoride (PVDF) and fluororubber plant, with high concentrations of long-chain PFASs (C ≥ 9), including PFUnDA in the range of 12.4 to 245 ng/g [20]. Studies from the Maltese Islands indicate that precipitation is a major source of seven PFASs, with PFOS as the major pollutant, reaching an average concentration of 0.94 ng/g [21].
Global research on PFASs began in the 1970s, whereas studies in China only started gaining momentum around 2000. As shown in Figure 1, compared with PFAS research worldwide, China started relatively late, and the number of PFAS research papers in China only contributes a small fraction of the global literature. Therefore, it is urgent to expand the understanding of soil PFAS contamination in China. The number of publications has increased significantly since 2018, with China showing a rapid rise, particularly in 2022. Currently, research on soil PFAS pollution in Chinese soils is concentrated in coastal regions, with contamination reported in Shanghai, Zhejiang, Jiangsu, Fujian, and Guangdong, ranging from 0.00365 to 294 ng/g [22,23,24,25]. Inland PFAS pollution of soils has been observed in Sichuan and Chongqing (southwest China), and Tianjin (northern China), but at lower levels, ranging from 0.187 to 142.31 ng/g [6,26,27].
This study aims to summarize and explain the primary sources of PFAS pollution in China, investigate the relationship between the key PFAS contamination areas in China and associated activities, and evaluate the current risk of PFAS pollution in China’s soil environment. Understanding the sources, fate, and behavior of PFAS compounds in the environment is essential for effective soil contamination management and the development of appropriate remediation strategies. Moreover, assessing PFAS contamination levels in soils can provide valuable insights into the overall environmental burden, helping to prioritize remediation efforts in the most affected areas.

2. Materials and Methods

2.1. Literature Search

This paper conducted a literature search to identify published works that report PFAS concentrations in soil. The literature search utilized important tools, such as Web of Science, Google Scholar, and the X-mol website, which were accessed on December 21, 2023. The keywords “soil”, “PFAS”, “PFC”, and “China” were primarily used in the search process. For this paper, preference was given to published literature within the last five years, focusing on PFASs detected in the studied areas (if the literature specifies the soil depth, we adopted contamination data from soils at 0–20 cm below the surface or from topsoil). Studies examining groundwater and sediments in relation to soil PFASs will also be included in this review, while research focusing on precursor compounds will be excluded. All PFAS data presented in both the main text and Supplementary Information were considered valid for analysis.
Information on the study area, number of sampling points, and PFAS types and concentrations was obtained from the figures in the literature and/or the appendix. Most studies on soil PFASs focus on topsoil. However, variations in measurement methods, statistical approaches, sampling point selection, and data presentation exist across studies. As a result, PFAS concentration data for the same studied area may differ significantly among different literature sources, with certain pollutants exhibiting notably high concentrations.

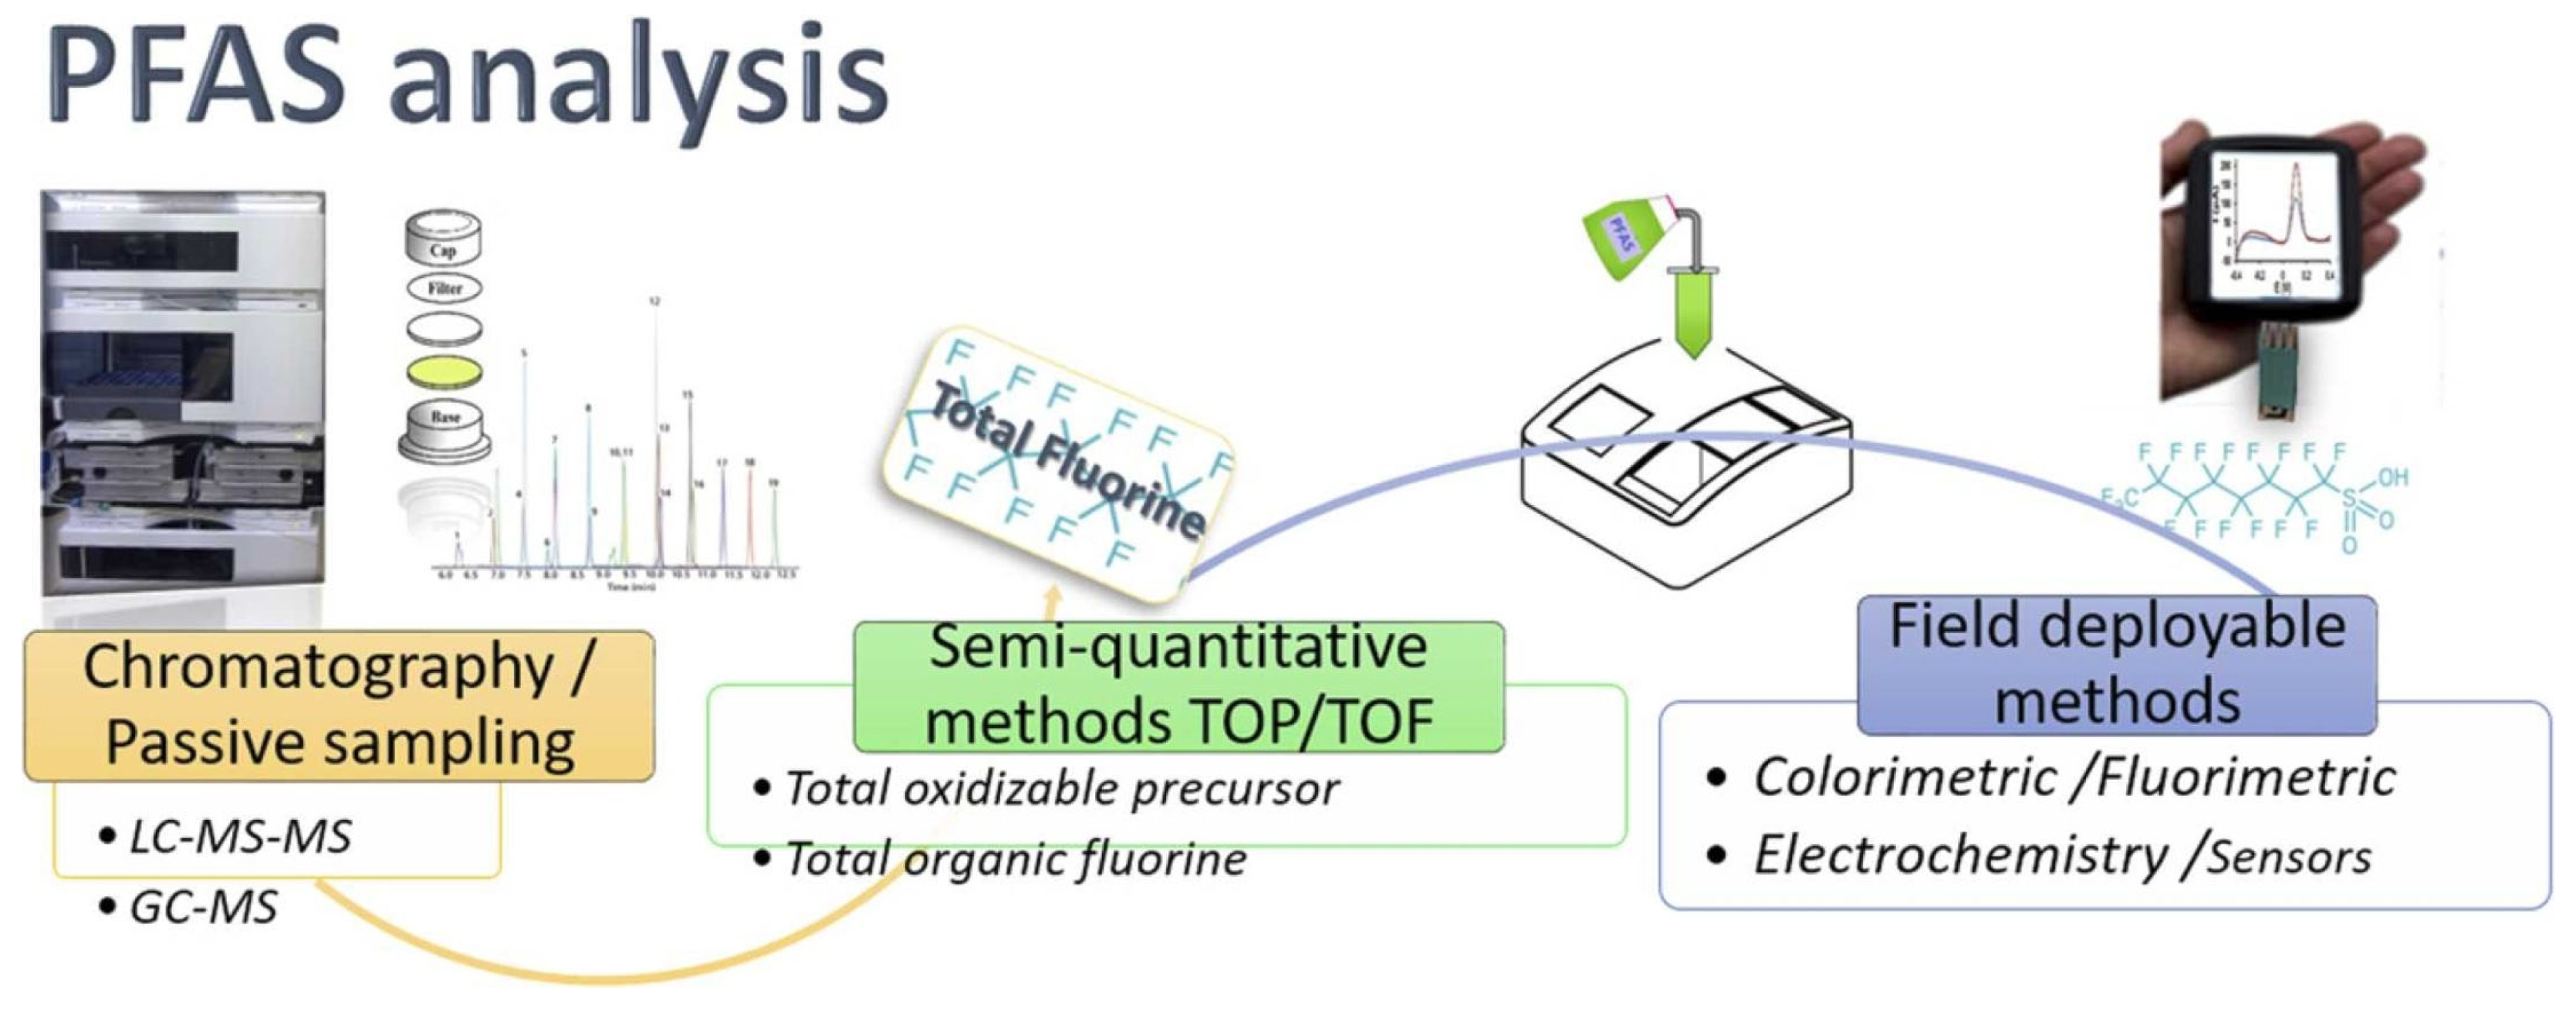
2.2. Study Areas, Sampling Sites, and PFAS Detection Methods

This study covers 17 provincial administrative units in China, including 4 municipalities directly under the central government. The research area primarily consists of nine coastal provinces, i.e., Liaoning, Hebei, Tianjin, Shandong, Jiangsu, Zhejiang, Shanghai, Fujian, and Guangdong, as well as eight inland provinces, i.e., Jilin, Heilongjiang, Anhui, Beijing, Chongqing, Guizhou, Yunnan, and Sichuan. The selection of PFAS sampling and measurement sites varied depending on the study area, with the number of sampling points generally ranging from 1 to 102.
At present, the main method for extracting PFASs from soil is dispersed solid phase extraction. The main analytical methods are liquid chromatography–tandem mass spectrometry (LC-MS/MS), optical and sensor analysis, and semi-quantitative methods based on total oxidizable precursors (TOPs) and total organic fluorine [4,28]. Of interest, new or improved methods for soil PFAS extraction and analysis have also been proposed. Examples include the use of 0.5% acetated methanol (v/v) during extraction and the use of the contrAA 800 HR-CS-GFMAS system (Analytik Jena AG, Jena, Germany) and the software ASpect CS 2.2.2.0 (Analytik Jena AG, Jena, Germany) to conduct PFAS analysis, which can obtain more quantifiable results and ensure that the test is simple and fast and free of interference. More importantly, the step deviation in the solid phase extraction process can be ignored [29].
This study found that soil samples were generally surface soil, and the extraction of PFAS from soil generally required three steps. First, PFASs were separated from solid substrates by ultrasonic solvent extraction. PFASs are then concentrated, usually by solid phase extraction (SPE) with an Oasis WAX cartridge. Finally, compounds, such as some eluents used in the SPE process, that may interfere with the determination of PFASs need to be adsorbed with suitable adsorbents (such as dispersed carbon) [24,26,30]. In the above process, the ink cartridges used were Oasis WAX cartridges (500 mg, 6 cc, Waters, Milford, MA, USA, or 150 mg, 6 cc, Waters, USA). In the quantitative study of PFASs, high-performance liquid chromatography has been widely used, and the mobile phase requires water and acetonitrile. And the Agilent 1260LC-6460 MS/MS (Agilent Technologies, Santa Clara, CA, USA) is a popular and recognized instrument on the market [31]. It is summarized in Table S6 that LC-MS/MS demonstrated a detection limit of 0.16–4.0 ng/g for PFASs in soil. This method is applicable to various matrices, including water, soil, and biological samples, primarily utilizing a binary pump, C18 column, and a multiple reaction monitoring (MRM) mode. Although highly sensitive, it involves complex sample pretreatment [32]. Alternatively, high-resolution mass spectrometry (HRMS) can be employed for non-targeted analysis, with a detection limit of 0.3–2.54 ng/g. This approach is suitable for complex environmental mixtures and relies on quadrupole time-of-flight (Q-TOF) instrumentation, enabling spectral screening with satisfactory precision. However, data-independent acquisition (DIA) and retrospective analysis present certain challenges [33]. And the analysis method can be illustrated by Figure 2.

2.3. Data Analysis and Ecological Risk Assessment for PFAS Contamination

Based on the literature, research areas and corresponding sampling points were identified and documented with their respective city or location. Municipalities directly under the central government were not assessed individually, except when research areas overlap, in which case sampling locations were marked for differentiation. The total PFAS concentration in each study area is determined as the mean sum of concentrations across all sampling points.
If the pollutant concentration is denoted as “n.d.” (not detected) or “<MDL” (method detection limit, whose concentration is below 0.001 ng/g), concentrations are considered as 0. In cases where the total PFAS concentration was calculated from the Supplementary Materials of the literature, the provided range values were utilized. Once the total PFAS concentration was determined, the two dominant PFAS compounds were identified, compared, and listed using the same methodology. If PFOA or PFOS (or both) were the predominant pollutants, the study areas were included in the ecological risk assessment. Ideally, the median values of PFOA and PFOS were used for calculations. If unavailable, the upper limit of the reported range is selected for calculation.
R Q = M E C P N E C
where MEC is the measured environmental concentration, and PNEC is the predicted non-effected concentration. The risk classification is as follows: RQ < 0.01, negligible risk; 0.01 < RQ < 0.1, low risk; 0.1 < RQ < 1, moderate risk; and RQ > 1, high risk. For soil, the PNEC values for PFOA and PFOS are 160 ng/g (dw) and 100 ng/g (dw), respectively [34].

2.4. Mobility Assessment for PFAS Contamination

The partition coefficient model (Kd model) was employed to preliminarily assess the distribution tendency of PFASs between soil and water. Due to the current lack of porewater data, a local equilibrium was assumed, and representative porewater values from the literature were used as typical values. A lower Kd (a Kd value < 10 mL/g may be considered relatively low, indicating higher mobility potential for PFAS compounds in soil–water systems) value indicates greater mobility potential for PFAS [35].
K d = C s C w
where Cs represents the PFAS concentration in soil (ng/g), while Cw denotes the PFAS concentration in pore water (ng/mL). Cs utilized the maximum PFAS contamination levels across provinces, while Cw adopted the highest reported PFAS concentration in pore water (11.2 ng/mL) [36].

3. Distribution and Ecological Risk of PFAS in Chinese Soils

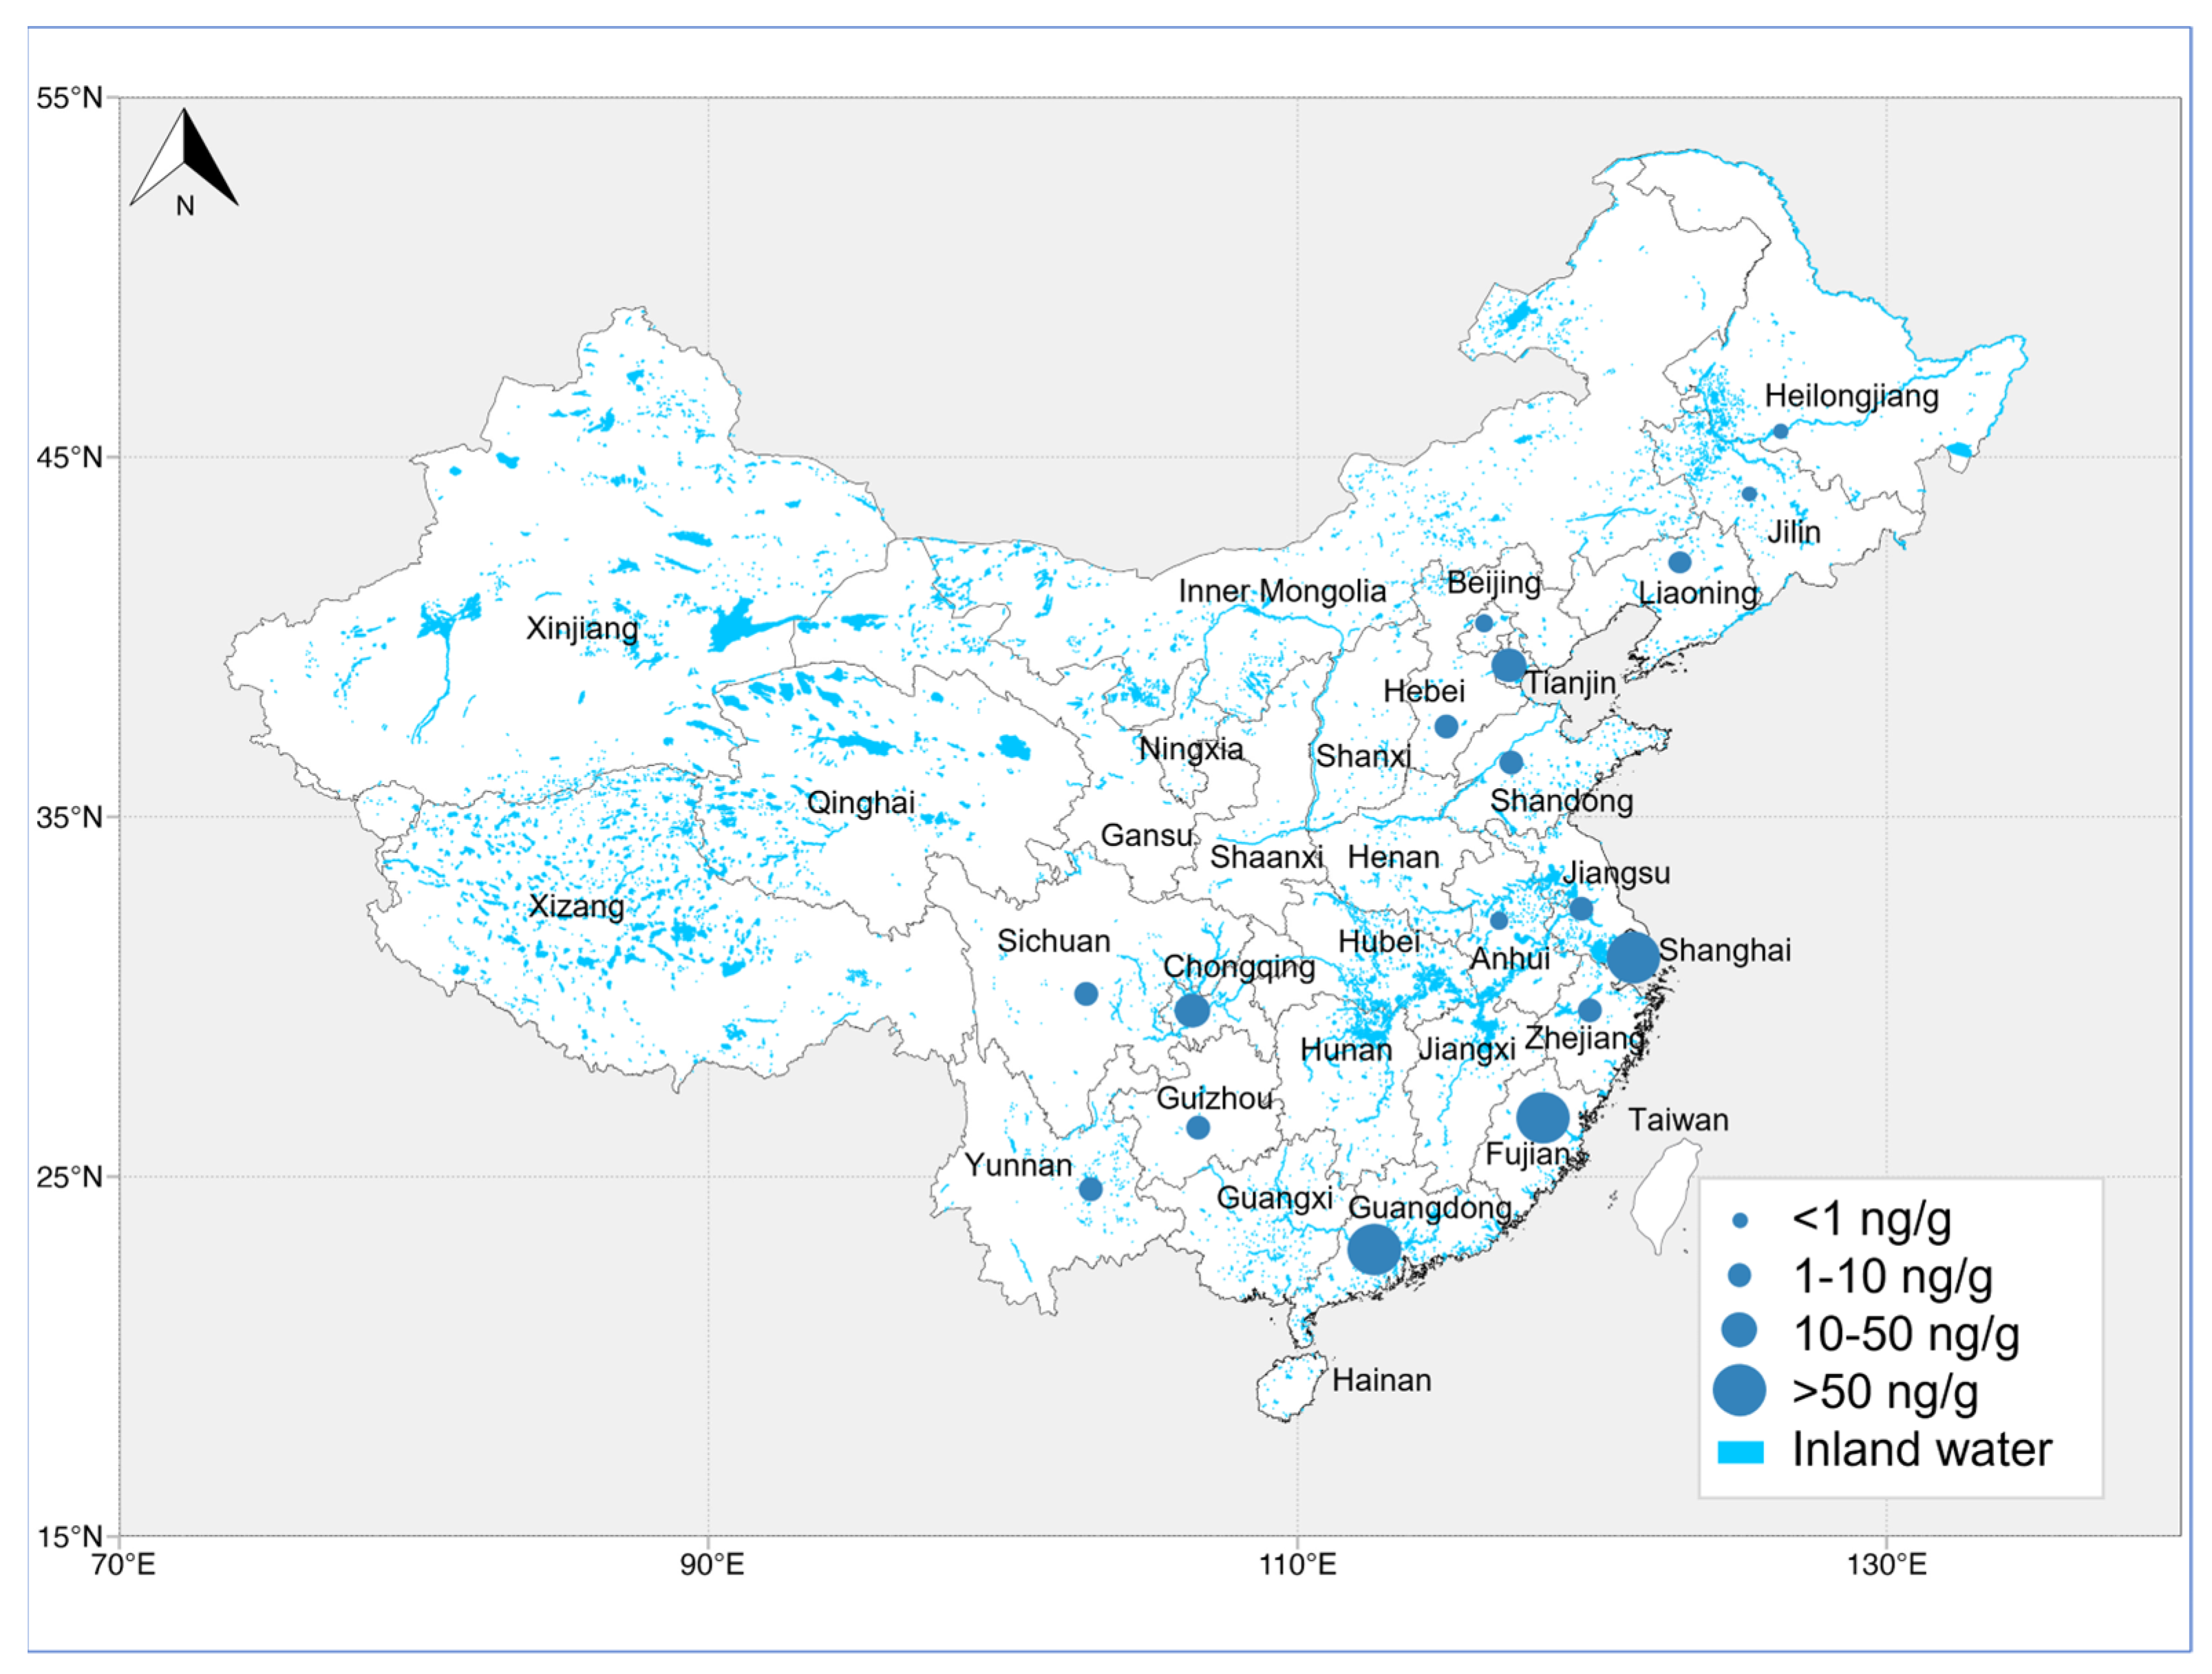
3.1. Spatial Patterns of Total PFAS Concentrations

The data required for this study were obtained directly from the literature and its appendices. Although PFAS distribution may vary in deeper soil layers or the vadose zone, existing studies demonstrate that surface media PFAS concentrations effectively reflect recent pollution inputs and regional source contributions. Thus, they remain suitable for preliminary interprovincial pollution level comparisons [37,38]. The results are presented in Table 1, while Figure 2 preliminarily illustrates the spatial distribution of PFASs. In several provinces, such as Fujian, Guangdong, Hebei, Jiangsu, Shandong, and Shanghai, multiple study areas were assessed, revealing significant differences in PFAS levels even within the same province. The highest reported total PFAS concentration (∑PFAS) in soils for each province highlights substantial differences in the pollution levels, ranging from 0.26 ng/g to 6240 ng/g. Among them, low contamination levels (0–1 ng/g) were observed in Anhui and Beijing. Moderate levels (1–10 ng/g) were found in Hebei, Jiangsu, Liaoning, and Shandong. Higher levels (10–50 ng/g) were detected in Chongqing, Tianjin, Zhejiang, Yunnan, Guizhou, and Sichuan. Severe contamination (>50 ng/g) was observed in Fujian, Guangdong, and Shanghai.
PFAS contamination is most pronounced in southeastern coastal areas, particularly in Guangdong and Fujian Provinces, where the highest total PFAS concentrations were detected. In Fujian Province, the highest average ∑PFAS reached 6240 ng/g [23], likely due to the presence of PFAS manufacturing plants and industrial activity. Conversely, the lowest reported average total PFAS concentration was 0.26 ng/g in Guangdong Province and Tianjin City [39]. This discrepancy may be attributed to broader study areas with limited sampling points, leading to data variability.
In Shanghai, another heavily industrialized coastal city, PFAS pollution is significant, with peak levels reaching 294 ng/g [40]. The survey focused on high-exposure sites, such as fire stations, industrial zones, agricultural areas, and airports. Similarly, in the Huangpu River Basin, the average total PFAS concentration was 185 ng/g [30], reflecting contamination in agricultural, industrial, and residential areas. Most other studies reported average total PFAS concentrations below 10 ng/g. Exceptions include Ningbo in Zhejiang Province (10.1 ng/g) [25], the Dagang Oilfield in Tianjin Binhai New Area (26.6 ng/g) [24], and a landfill site in Chongqing (14.2 ng/g) [26]. The lowest contamination was recorded in Anhui (0.38 ng/g) [40].
Overall, spatial analysis (Figure 3) reveals that eastern and southeastern provinces, including Shanghai, Fujian, and Guangdong, exhibit higher PFAS concentrations compared to inland or southwestern provinces. These trends highlight the influence of industrial activity, urbanization, and PFAS production sites on contamination levels.
Table 1. Summary of PFAS distribution in soils across different provinces in China, including total PFAS concentrations (∑PFASs) and number of PFAS compounds (∑nPFASs), based on literature data.
ProvincesTFAPFPrAPFBAPFPeAPFHxAPFHpAPFOAPFNAPFDAPFUnDAPFBSPFHxSPFOS∑n
PFAS
∑PFAS (ng/g)Median
(ng/g)
Maximum
(ng/g)
Reference
Anhui--0.0220.0340.0260.0160.0940.0490.0110.0260.006<MDL0.01180.381 ± 0.0250.0220.094[39]
Beijing--0.0490.030.0120.0090.090.0290.0170.0110.007<MDL0.023200.334 ± 0.00260.0170.09[39]
Chongqing--2.7621.3821.6530.8480.7720.0960.1470.0674.1051.2061.081714.23 ± 1.2231.084.105[26]
Fujian --14.510.815.78.7547.70.420.690.766254264330186240 ± 1220.3515.74330[23]
Fujian--0.0210.0290.040.0170.070.0380.0250.0230.011<MDL0.014210.367 ± 0.01940.0230.07[39]
Guangdong--n.d.0.83-n.d.1.79-1.670.1734.872.32136.812230.89 ± 48.671.79136.8[22]
Guangdong--0.0340.0320.020.0040.0210.0080.010.0090.017<MDL0.035200.257 ± 0.0050.0170.035[39]
Hebei--0.250.190.050.064.140.130.070.060.020.021.1126.17 ± 1.1580.0954.14[24]
Hebei--0.0380.0390.020.0110.1260.0240.0160.0130.005<MDL0.011240.45 ± 0.0450.0160.126[39]
Jiangsu--0.750.250.060.074.140.130.110.10.020.021.24126.95 ± 1.1840.114.14[24]
Jiangsu--0.0140.0910.0130.0070.0830.0190.0240.0120.004<MDL0.005190.325 ± 0.02610.0140.091[39]
Jiangsu ------7.590.4821.50.425<0.5<0.5<0.5-9.62 ± 3.0620.57.59[41]
Liaoning --0.590.270.060.073.710.140.080.070.020.011.36126.43 ± 1.080.083.71[24]
Sichuan--0.1620.0350.0580.0510.3230.0860.0630.0540.06-0.077110.98 ± 0.0450.0630.323[42]
Shanghai 135.963-0.6411.0390.5880.44435.2480.4310.4430.2780.1820.2729.54115184.74 ± 41.360.588135.396[30]
Shanghai--nd.-54.5nd.-8.080.04–3.540.04–3.540.11–96.7nd.-1.59nd.-3.05nd.-1.59nd.-4.52nd.-1.11nd.-241180.64−2943.54241[40]
Shanghai--0.0110.0950.0390.0290.3160.060.0470.0230.011<MDL0.035170.704 ± 0.0450.0350.316[39]
Shandong --0.0160.0150.0110.0090.3390.0240.0110.0080.007<MDL0.011190.697 ± 0.0990.0110.339[39]
Shandong--0.50.230.130.093.60.220.10.110.040.022.32127.44 ± 1.1130.133.6[24]
Tianjin--0.340.140.090.114.280.310.290.220.020.011.1127.07 ± 1.1860.224.28[24]
Tianjin--0.0440.0260.0130.0080.0820.0230.0210.0090.014<MDL0.012200.363 ± 0.0240.0140.082[39]
Tianjin0.4716.62.30.040.10.11.140.10.10.11.750.042.822026.6 ± 7.610.28516.6[43]
Tianjin------0.5-----0.11-1.37 ± 0.2750.3050.5[27]
Zhejiang--<MDL<MDL0.07<MDL1.050.210.610.38<MDL0.060.57254.7 ± 0.3210.211.05[31]
Zhejiang -- 0.45 0.165.261.653.760.680.070.321.46910.08 ± 0.9280.685.26[25]
Zhejiang--0.0130.030.0240.0160.1580.0390.0490.0230.008<MDL0.024200.486 ± 0.0550.0240.158[39]
Yunnan
Guizhou
Sichuan
1.270.10.960.060.110.020.110.030.030.030.020.050.34345.85 ± 0.3340.061.27[44]
Notes: TFA: trifluoroacetic acid, short-chain perfluorocarboxylic acids; PFPrA: perfluoropropanoic acid, short-chain perfluorocarboxylic acid (C3); PFBA: perfluorobutanoic acid, short-chain perfluorocarboxylic acid (C4); PFPeA: perfluoropentanoic acid, short-chain perfluorocarboxylic acid (C5); PFHxA: perfluorohexanoic acid, medium-chain perfluorocarboxylic acid (C6); PFHpA: perfluoroheptanoic acid, medium-chain perfluorocarboxylic acid (C7); PFOA: perfluorooctanoic acid, long-chain perfluorocarboxylic acid (C8); PFNA: perfluorononanoic acid, long-chain perfluorocarboxylic acid (C9); PFDA: perfluorodecanoic acid, long-chain perfluorocarboxylic acid (C10); PFUnDA: perfluoroundecanoic acid, long-chain perfluorocarboxylic acid (C11); PFBS: perfluorobutanesulfonic acid, short-chain perfluorosulfonic acid (C4); PFHxS: perfluorohexanesulfonic acid, medium-chain perfluorosulfonic acid (C6); PFOS: perfluorooctanesulfonic acid, long-chain perfluorosulfonic acid (C8).

3.2. PFAS Occurrence, Composition, and Predominant Compounds

In the 27 study areas, up to 34 different PFASs were identified, primarily perfluoroalkyl carboxylic acids (C2–C11) and perfluoroalkyl sulfonic acids (C4-C8). Quantification of 34 PFASs was performed using high-performance liquid chromatography-tandem mass spectrometry (HPLC-MS/MS). The analytical system comprised an Ultimate 3000 HPLC system (Thermo Fisher Scientific, Waltham, MA, USA) coupled with an API 3200 triple quadrupole mass spectrometer operated in negative electrospray ionization (ESI−) mode. Separation was achieved using an Acclaim 120 C18 column (5 μm, 4.6 mm × 150 mm; Thermo Fisher Scientific) with a mobile phase consisting of (A) methanol and (B) 50 mM ammonium acetate in water. The gradient elution program was as follows: initial 28% B, linearly decreased to 5% B, held for 3 min, and then returned to initial conditions. For soil samples, pretreatment included freeze-drying, grinding through a 50-mesh sieve, methanol extraction, and SPE cleanup. Groundwater samples were filtered through 0.7 μm glass fiber filters prior to SPE concentration. This method provides a reliable quantification of PFAS in complex environmental matrices through optimized chromatographic separation and selective mass spectrometric detection. Among the 34 PFASs, PFOA and PFOS were the predominant PFAS in 20 and 3 study areas, respectively, including different sampling locations within the same province or city. The highest PFOA and PFOS concentrations were recorded in the northwestern part of Fujian [23].
Soil PFOA concentrations varied significantly across China. In Anhui and Beijing, their levels ranged from 0.01 to 0.1 ng/g, while in Chongqing, Yunnan, Guizhou, and Sichuan, concentrations were slightly higher, between 0.1 and 1 ng/g. In Hebei, Liaoning, Jiangsu, Shandong, Tianjin, Guangdong, and Zhejiang, PFOA levels ranged from 1 to 10 ng/g, whereas in Shanghai and Fujian, concentrations exceeded 10 ng/g, indicating more severe contamination. Similarly, PFOS concentrations in soil showed distinct regional variations. In Anhui and Beijing, levels remained low, within 0.01 to 0.1 ng/g. In contrast, soils from southwestern China (Yunnan, Guizhou, and Sichuan) and coastal provinces, such as Hebei, Jiangsu, Liaoning, Tianjin, Shandong, and Shanghai, exhibited PFOS levels between 0.1 and 1 ng/g and 1 to 10 ng/g, respectively. In Fujian and Shantou (Guangdong Province), PFOS concentrations exceeded 10 ng/g, in some cases surpassing 100 ng/g. The highest recorded values were 117 ng/g in southwestern China and 241 ng/g in the eastern and central parts of Shanghai.
It is evident that PFOA and PFOS typically account for a substantial proportion of PFAS compounds, so soil PFAS pollution in China is primarily composed of long-chain PFASs (C ≥ 8) [45]. While PFOA was the most frequently detected PFAS, with a maximum value of 47.7 ng/g [23], PFOS exhibited significantly higher concentrations, with an average of 4330 ng/g in the same study area. Other notable findings included the predominance of PFPrA in Tianjin (Binhai New Area) at 16.6 ng/g and PFBS, another frequently detected PFAS, which showed a considerably high average detection value of 625 ng/g [23]. In addition, PFDA, PFHxS, PFNS, and 6:2Cl-PFESA were detected only in a limited number of study areas. These emerging PFASs are less likely to enter the soil due to their relatively limited application scope and lower usage compared to traditional PFASs. Additionally, current detection technologies have limitations in identifying emerging PFASs, resulting in lower detection levels of these compounds [46]. Notably and alarmingly, soil PFAS contamination in Fujian, China, remains particularly pronounced when compared with more developed countries/regions globally. For instance, existing reports document maximum soil PFOS concentrations of 741 ng/g (agricultural environments, South Korea) [47], alongside PFOA peaks of 1573 ng/g. Background PFAS concentrations in Swedish forest soils ranged from 0.40 to 6.6 ng/g, with PFOS being the most frequently detected compound (median: 0.39 ng/g) [48]. In contrast, surface soils from a major U.S. metropolitan area exhibited significantly higher median concentrations of 12.2 ng/g (PFOS) and 8.0 ng/g (PFOA) [49]. Collectively, these data demonstrate that Fujian’s PFOS levels rank among the highest globally, warranting urgent attention.
TFA, which reached 136 ng/g, accounted for 90% of the total PFASs in Shanghai (Huangpu River) [30], indicating a dominant presence in that region. The elevated levels of TFA in Shanghai can be attributed to multiple factors, including atmospheric deposition from the breakdown of fluorinated industrial chemicals, industrial discharges, and TFA’s persistent and mobile nature in the environment [30]. Although TFA is an ultra-short chain (C2) perfluoroalkyl acid, it demonstrates significant bioaccumulation in plants, including crops, with high uptake rates [50].
In regions where pollution is less severe, the concentrations of dominant PFASs remain relatively low. For example, PFBA and PFPeA were only detected in the northwestern part of Fujian, at the highest recorded concentrations among all study areas. Despite a few cases of elevated contamination, the average detected concentrations of predominant PFAS in most other studies were less than 100 ng/g.

3.3. Ecological Risk Assessment of PFAS Contamination

An ecological risk assessment was conducted for areas where PFOA or PFOS, or both, were the dominant pollutants, following the method outlined in Section 2.4. Notably, uncertainty values increase significantly when concentrations fall below the MDL, indicating that, while concentrations below MDL are low, they may still carry inherent uncertainties [51]. However, when using the upper bound of MDL as the MEC, calculations based on the PNECs of PFOS and PFOA reveal that the MDL contributes less than 0.001% deviation to the risk quotient (RQ) values. Therefore, setting MDL values to zero can be considered a scientifically valid approach that maintains data integrity. Based on the assessment, study areas were classified into zones of negligible risk, low risk, moderate risk, and high risk. The spatial distribution of these risk categories is illustrated in Figure 4 and Figure 5.
The results indicate that PFOA poses a widespread ecological risk in China’s soil environment, although the overall pollution level is not severe. Among the studied areas, Shanghai exhibited relatively moderate risk quotient (RQ) values, with two study sites classified as medium-risk areas, having RQ values of 0.22 and 0.60. Low-risk areas were identified in Hebei, Jiangsu, Liaoning, Shandong, Tianjin, and Zhejiang, with Jiangsu having the highest RQ value of 0.047, while other low-risk areas ranged between 0.02 and 0.04. Negligible-risk areas, where PFOA was the predominant PFAS, had RQ values below 0.01.
In contrast, PFOS exhibited a smaller spatial distribution but posed a higher ecological risk. High-risk areas were found in Fujian, Guangdong, and Shanghai, with Fujian experiencing the most severe pollution, where the RQ value reached 43.3. In the same study area, PFOA also recorded a high RQ value of 0.29. The RQ value for high-risk PFOS areas in Guangdong was 1.37. Overall, the statistical analysis indicated that no medium-risk areas were observed for PFOS, while low-risk areas were identified in Guangdong, Hebei, Jiangsu, Liaoning, Shandong, and Chongqing, as well as two low-risk areas in Tianjin. The lowest RQ value for a PFOS low-risk area was recorded in Guangdong (0.031), while other low-risk areas ranged from 0.01 to 0.03. Additional study areas located in south-western China (including Yunnan, Guizhou, and Sichuan), where PFOS was the predominant pollutant, had RQ values of 0.0034, indicating a lower ecological risk level; this is likely because the primary PFAS sources in this area originate from industrial processes (e.g., fluoropolymer processing aids, lubricants) rather than traditional firefighting foams (AFFF). The dominant PFASs detected in the study were short-chain PFCAs (such as TFA and PFBA) and HFPO-DA (a replacement compound), whereas PFOS was not a major industrial emission in this region [44].
Notably, Anhui Province, despite being the fastest-growing industrial region in China as of 2024 [52], has maintained a relatively low ecological risk from PFASs. This may be attributed to its stringent regulatory measures, which require municipal ecological and environmental bureaus to share detailed lists of enterprises producing or using chemicals specified in the Key List of New Pollutants for Priority Control (2023 Edition) with relevant authorities. Additionally, the province has implemented a “one substance, one policy” control strategy, ensuring effective PFAS management and mitigation.
Several studies have assessed the ecological risks of PFAS contamination in various industrialized regions. Cao et al. (2019) evaluated PFAS contamination in the Shahe and Lihe River basins in Hebei, an industrialized area, and found that the predominant PFOA RQ value among 17 PFAS species was only 0.014, with PFOS levels even lower, below 0.01 [53]. Similarly, Liu et al. (2019) investigated multiple cities in Guangdong Province (Pearl River Delta) and found that PFOA posed no ecological risk to soils, while the highest PFOS RQ value was 0.87 [54], indicating localized risks to soil plants and animals. In Ningbo City, Zhejiang Province, where the economy is more developed, the PFOS ecological risk was negligible, and the highest PFOA RQ value was only 0.116 [25]. These findings suggest that PFAS pollution levels vary significantly across industrial regions, with some areas maintaining relatively low contamination levels despite rapid industrial growth. However, in high-risk areas such as Fujian, Guangdong, and Shanghai, further attention is needed to assess the sustainability of industrial production processes and implement stricter pollution control measures.
The risk assessment findings of this study align with results from the previous literature. Water and sediments near two PFAS plants along the Futun River in Fujian Province have been reported as heavily contaminated, with PFBS, PFOS, and PFOA posing moderate to high ecological risks and accumulating in fish populations [55]. Similarly, high PFOS and PFOA risks were detected in sediments of the Jinhe River Basin [56], and PFOA was identified as a potential groundwater contaminant in the same region. In addition, PFASs were detected in water and soil samples from Qingliu County, Mingxi County, Shunchang County, and Shaowu City in Fujian Province. Industrial park-related PFAS contamination in these areas was reported to be as severe as that found near PFAS plants in the United States and the Netherlands, posing risks to plankton and predators in freshwater ecosystems [57].
A similar situation was observed in Zhangjiang, Fujian, where mangrove ecosystems were found to be in direct contact with PFAS pollution sources, posing potential threats to the ecosystem and human health [38]. In Guangdong Province, where 25 PFAS compounds were detected in soils near a lithium battery recycling industrial park, PFOS was identified as the dominant pollutant. Caenorhabditis elegans was used as a bioindicator to assess PFOS toxicity, with results showing negative effects on growth, reproduction, and movement at just 200 µM of exposure. Non-targeted analysis identified multiple PFASs in this region, including long-chain compounds (e.g., PFOA, PFOS, PFDA) and short-chain alternatives (e.g., PFBA, PFBS). The PFAS contamination likely originates from battery recycling processes (e.g., degradation of fluoropolymers in electrolytes and binders) subsequently entering farmland. Notably, short-chain PFASs (e.g., PFBA) exhibit higher mobility in water bodies and sediments, while long-chain PFASs (e.g., PFOA) tend to adsorb more readily to farmland soils, explaining the observed elevated PFOA concentrations [58]. Another study on Guangdong’s agricultural areas found that the acceptable risk-based concentration (GAC) of soil PFOA was generally within safety limits. However, PFOA concentrations in farmlands were significantly higher, suggesting potential threats to human health through food consumption [59]. Residents in Guangdong Province were identified as highly exposed to PFOS, with blood concentrations reaching 300.23 ng/mL, significantly exceeding the German Human Biomonitoring Committee’s recommended level of 0.39 ng/mL [60]. Similarly, in Shanghai, high PFOS pollution was detected in agricultural areas, raising concerns about PFAS bioaccumulation in food crops and its potential transfer through the food chain. Encouragingly, regulatory actions, including voluntary elimination policies, have led to a 28.2% reduction in PFOS concentrations [39].
It is encouraging to note that Guangdong Province, a region with relatively prominent PFOS contamination, has implemented timely regulatory and remediation measures. According to 2024 news reports, as a demonstration province for the Global Environment Facility’s “China PFOS Priority Industry Reduction and Elimination Project,” Guangdong has focused on promoting PFOS alternatives in the electroplating and pesticide industries. Key initiatives include revising the electroplating wastewater pollutant discharge standards, screening PFAS removal technologies, and implementing advanced wastewater treatment demonstration projects in typical electroplating industrial parks. The Guangdong Project Office has actively promoted awareness of POPs Convention regulations and enhanced public understanding of emerging contaminants. These comprehensive demonstration projects have yielded positive outcomes across the province [61].

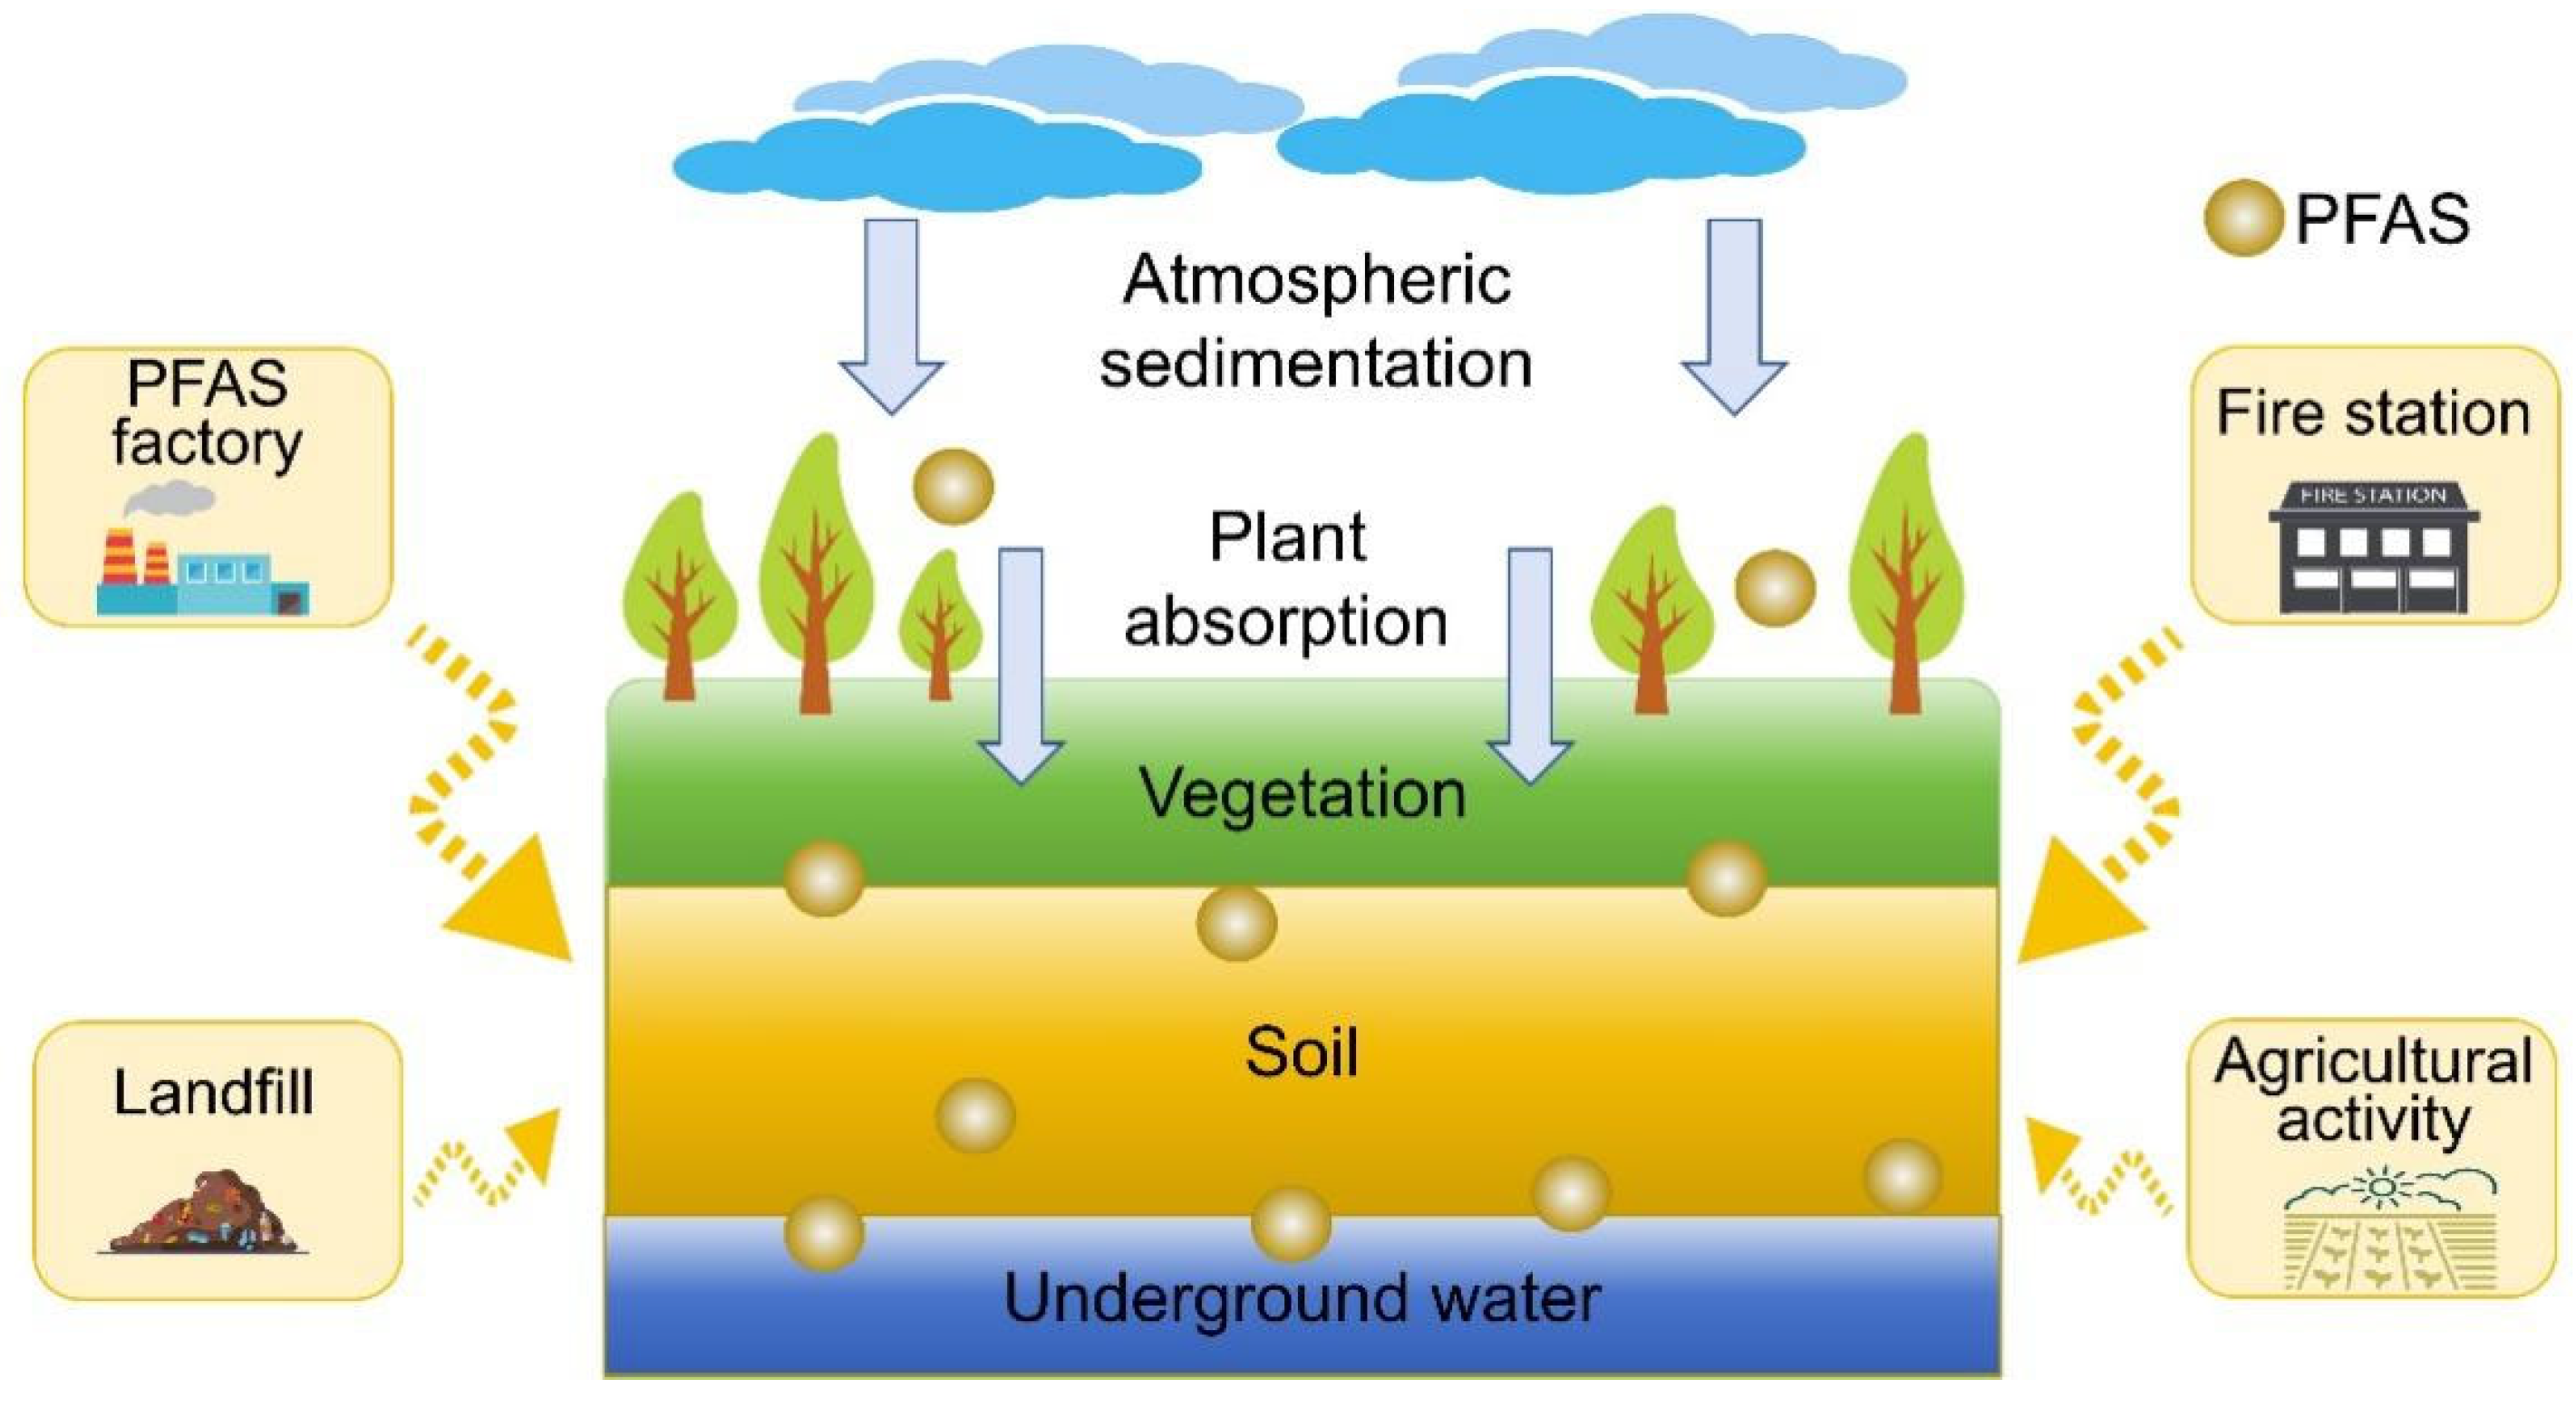
4. Sources and Environmental Pathways of PFAS Contamination in Chinese Soils

The studies reviewed on PFAS contamination in Chinese soils adopted a range of sampling approaches, land use characteristics, and the types and detection of PFAS compounds. When tracing PFAS sources, it is essential to consider the functional zones where the soil is located, as different land uses contribute to contamination through distinct pathways. A major source of soil PFAS pollution is industrial production, particularly in provinces with PFAS manufacturing plants. Shanghai, Fujian, and Guangdong have reported the highest soil PFAS concentrations, exceeding 100 ng/g [23,30,31], indicating severe contamination directly linked to industrial activity. In addition to PFAS manufacturing, other industrial processes, such as oil field exploitation and refinery operations, contribute to PFAS release. For instance, in the Dagang oilfield, the PFAS concentration in the core extraction area was significantly higher than in peripheral areas, suggesting that oil extraction is a direct contributor to PFAS pollution [43]. Similarly, near refineries in Yunnan, Guizhou, and Sichuan, total PFAS concentrations reached 29.3 ng/g, indicating clear industrial impacts on soil quality [44].
Beyond industrial production, certain human activities also contribute to PFAS contamination. In a study conducted in central and northern Shanghai, 102 sampling sites were established in industrial areas, agricultural fields, fire stations, airports, and landfills. Among these, fire stations exhibited the highest average PFAS concentration (57.9 ng/g) [39], highlighting that firefighting foams (AFFF) are a significant source of contamination [62]. Additionally, the electroplating industry and landfills are recognized as major sources of PFAS emissions. PFOS, commonly used as a fog inhibitor in electroplating processes, has been linked to significant emissions, while landfill leachate facilitates PFAS migration into the surrounding soil [26,63,64]. The provinces most affected by these factors include Chongqing, Guangdong, and Zhejiang, where total soil PFAS concentrations exceed 10 ng/g [23,25,26].
Agricultural activities have also been linked to PFAS contamination. In Shifang, Sichuan Province, studies revealed agricultural exposure to PFAS [42], while in Shanghai, agricultural soil PFAS concentrations reached an average of 6.52 ng/g [40]. These findings suggest that contaminated irrigation water, biosolid fertilizers, and pesticide residues may contribute to PFAS accumulation in farmland soils.
Although human activities dominate PFAS pollution sources, natural processes also influence PFAS accumulation. In a study of 21 cities surrounding the Bohai Sea and Yellow Sea, including Hebei, Jiangsu, Shandong, Liaoning, and Tianjin, atmospheric deposition was identified as the dominant source of more than 90% of PFOA and over 60% of PFOS contaminations [24]. This highlights the role of long-range atmospheric transport and precipitation in PFAS distribution across large regions. Additionally, vegetation plays a role in PFAS accumulation. In forested areas of Hebei and Liaoning, plants can absorb PFAS from the air and store them in the soil, facilitating pollutant redistribution. However, forests may also act as natural filters, capturing airborne PFASs due to their high N-octyl alcohol/air distribution coefficient (KOA) [65].
While both human and natural factors contribute to PFAS contamination, statistical analyses indicate that human activities have a far greater impact than natural processes. Areas with high-risk quotient (RQ) values and elevated PFOS concentrations are closely linked to industrial activity, highlighting the need for stricter pollution control and waste management measures. The occurrence of extremely high PFAS concentrations is often associated with sampling sites near PFAS production plants, industrial zones, and public institutions where PFAS-containing products are frequently used. This suggests that emission sources are not being effectively controlled, and intervention is needed to prevent further contamination. Also, natural processes, such as atmospheric deposition and plant uptake, are largely influenced by human activities. For instance, industrial emissions release PFAS into the atmosphere, where they undergo long-range transport before eventually depositing into soil through atmospheric sedimentation [66]. This highlights the interconnected nature of PFAS pollution, where industrial emissions contribute to contamination not only at the source but also in distant regions via environmental pathways (Figure 6).

5. Implications for Water Quality and Human Health

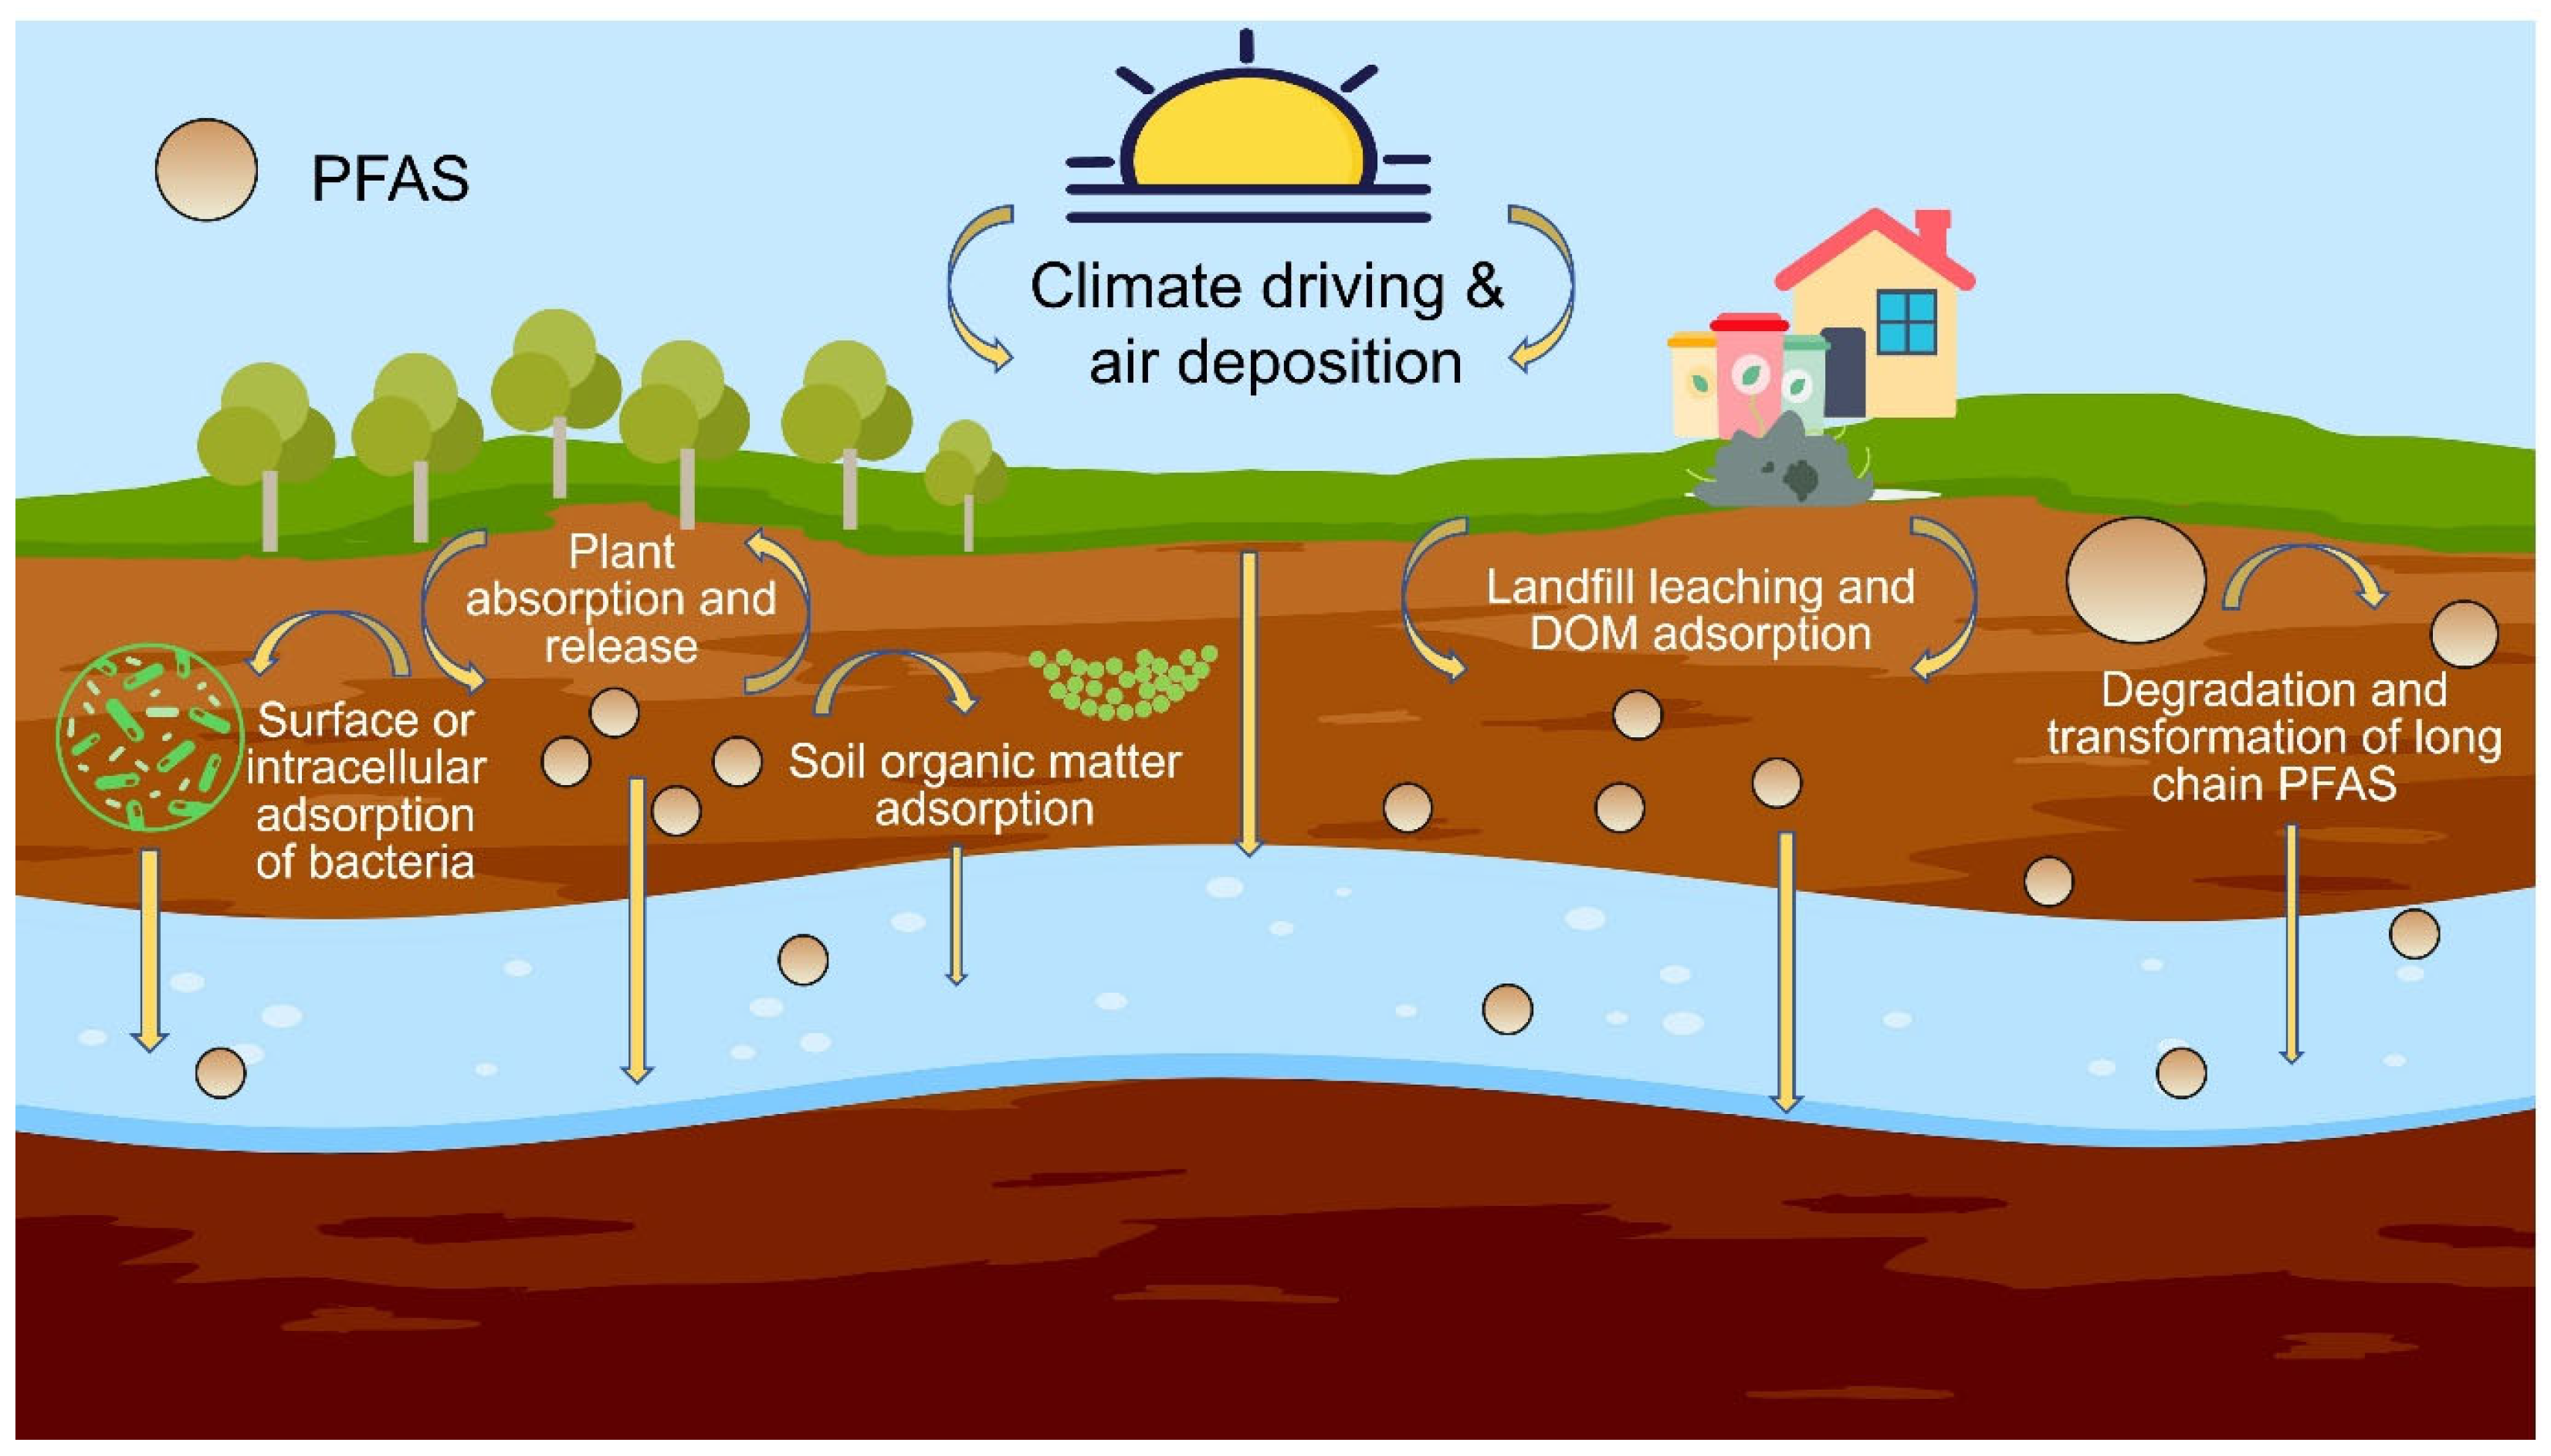
5.1. Soil–Groundwater Interactions

The interaction between soil and groundwater plays a crucial role in the transport and migration of PFASs and other pollutants. Leaching is a key mechanism for downward pollutant migration [67,68]. Some studies suggest that soil organic matter (SOM) can absorb pollutants and facilitate their downward movement, increasing their interaction with groundwater. Under specific environmental conditions, PFASs may also undergo transformation or degradation, converting into short-chain PFASs or other forms with different functional groups, which enhances their mobility in soil. Long-chain PFASs, due to their strong hydrophobicity, exhibit higher affinity for soil particles, limiting their movement [69]. PFASs accumulated in plant tissues can be released back into the soil, while PFASs dissolved in groundwater can be absorbed by plants, creating an exchange cycle between soil and groundwater [70]. The Noah Land Surface Model has been used to simulate groundwater–soil interactions, demonstrating that soil type and vegetation cover strongly influence these processes [71].
The distribution of PFAS species varies across study areas, affecting the mechanisms of soil–groundwater exchange. For instance, in soils near an airport in Canada, aqueous film-forming foam (AFFF) contamination led to high PFAS accumulation. While soil adsorption plays a role, infiltration into groundwater also contributes to PFAS migration. However, due to low soil permeability, PFAS concentrations remained higher in soil than in groundwater [72]. In contrast, a semi-arid region contaminated by AFFF showed that unsaturated soil conditions increased groundwater pollution risks, as climate-driven physical processes dominated soil–groundwater interactions [73]. Similarly, landfill leachate has been identified as a major PFAS source, where dissolved organic matter (DOM) enhances the solubility of PFAS, facilitating their transfer from solid to liquid phases in soil [60].
Studies demonstrate that multiple parameters significantly affect the migration of contaminants from soil to groundwater. Specifically, when the organic matter content is below 2% (0.02), groundwater pollutant concentrations increase markedly, whereas higher organic matter levels exhibit a reduced influence. Darcy velocity also plays a critical role: at low velocities (<1 m/year), contaminants accumulate more readily in slow-moving water, resulting in elevated groundwater concentrations, whereas high velocities (>10 m/year) promote dilution but also facilitate wider contaminant dispersion. Furthermore, the soil–water partition coefficient (Kd) is a key determinant, with low Kd values enhancing contaminant leaching into groundwater. For instance, PFAS exhibit Kd values ranging from 0.2 to 500, and short-chain PFAS—characterized by even lower Kd values (log Kd = −0.7 to 1.0)—demonstrate greater mobility and propensity for groundwater infiltration [35,74]
Through calculation and evaluation, this study found that Fujian exhibited the highest Kd value (386.6 mL/g), indicating lower PFAS mobility and limited diffusion potential but significant accumulation risks in this region. Apart from Fujian, only certain areas in Shanghai (12.09–21.52 mL/g) and Guangdong (12.21 mL/g) had Kd values exceeding 10 mL/g, suggesting that PFAS in most regions still show clear diffusion and migration tendencies. Notably, eastern Fujian recorded extremely low Kd values (~0.006), while central and eastern Guangdong had similarly minimal values (~0.003), demonstrating that these provinces face dual challenges of PFAS accumulation and high diffusion risks. These findings align with prior ecological risk assessments and underscore the urgent need for soil PFAS remediation and regulatory control.
To mitigate PFAS migration into groundwater, adsorbents, such as activated carbon and biochar, have been utilized to enhance soil adsorption capacity, effectively reducing PFAS mobility [69]. Additionally, certain bacteria, including Gram-negative Pseudomonas aeruginosa and Gram-positive Bacillus subtilis, can adsorb PFAS onto their cell surfaces or incorporate them internally, potentially influencing PFAS retention in soil [75].
Overall, multiple factors influence the interaction between soil and groundwater, affecting pollutant retention and migration. These dynamics are illustrated in Figure 7. While PFASs in groundwater can originate from sewage leaks, atmospheric deposition, and biosolid applications, leaching from contaminated soil remains the primary pathway for PFAS transport into underground aquifers [76]. Soil adsorption serves as the primary retention mechanism, while degradation, structural transformations, climate variability, and microbial interactions act as additional influencing factors.

5.2. Health Risks and Bioaccumulation of PFAS

Beyond soil contamination, PFAS pollution has been detected in residential areas, raising concerns about human exposure. In Fuxin City, Liaoning Province, PFOA contamination was found in gardens, vegetables, and even eggs, with groundwater sections near home gardens exceeding health-based recommendations, posing significant risks to residents [77]. PFOA was also detected in soils and grains across 13 provinces, including Heilongjiang, Jilin, Sichuan, and Hunan, with a median detection value of 0.067 ng/g in grain, raising concerns about dietary exposure risks [78]. As a coastal industrial hub, Tianjin has also shown prominent PFAS pollution, particularly during the rainy season, with high PFOS concentrations detected in groundwater [79]. Although the ecological risk assessment indicated no immediate threat to wildlife, concerns remain regarding drinking water safety.
PFAS contamination presents long-term risks due to bioaccumulation and biomagnification in aquatic food webs. PFOS is known to biomagnify in fish [80], while crustaceans and mollusks exposed to PFAS experience impaired growth and reproduction [81]. Additionally, PFOS and PFOA have been detected in edible plants irrigated with contaminated water, including carrots, cucumbers, corn, wheat, potatoes, and oats, raising concerns about food safety and human health [82,83]. In aquatic ecosystems, long-chain PFASs (e.g., PFOA) tend to bioaccumulate in organisms due to the stability of their carbon–fluorine bonds. Benthic organisms exhibit particularly high bioaccumulation potential, with biota-sediment accumulation factors (BSAFs) reaching up to 103. Meanwhile, trophic magnification factors (TMFs) in fish muscle tissue indicate that PFOS undergoes 2- to 5-fold amplification along the food chain [84]. Notably, bioaccumulation patterns vary significantly among PFAS compounds. Biomonitoring data reveal that PFOS demonstrates 3–5 times higher bioaccumulation factors than PFOA in wildlife, whereas these two compounds show opposite accumulation trends in humans [85].
PFAS exposure has been linked to thyroid dysfunction, reproductive issues, kidney disease, metabolic disorders, liver toxicity, and immune suppression [86,87,88,89]. Furthermore, long-term exposure to PFOS and PFOA has been associated with an increased risk of thyroid cancer [90]. Given their persistence and bioavailability, high-risk PFOA and PFOS contamination in soil may enter the human body, disrupt lipid homeostasis, and increase blood lipid levels, leading to potential health complications [91]. PFAS exposure is significantly associated with dyslipidemia, including elevated cholesterol and triglyceride levels. For instance, a U.S. study demonstrated that PFOA exposure was positively correlated with increased levels of total cholesterol (β = 6.1 mg/dL, p< 0.05), low-density lipoprotein cholesterol (LDL-c, β = 2.9 mg/dL, p< 0.05), and triglycerides (β = 17.8 mg/dL, p< 0.05) [92]. Furthermore, PFAS exposure may impair vaccine responsiveness. Research indicates a significant association between PFAS exposure and reduced antibody responses in children. Specifically, a doubling of maternal serum perfluorooctanesulfonic acid (PFOS) concentration was associated with a 39% decrease in diphtheria antibody levels (p < 0.001) in 5-year-old children [93].

6. Conclusions

This study compiled and analyzed soil PFAS concentration data in China-based on published literature and its Supplementary Materials. The available data primarily cover coastal provinces and some inland provinces, excluding Guangxi, Hainan, and Taiwan. Sampling points were distributed across various functional areas, including industrial zones, agricultural fields, residential areas, oil fields, airports, fire stations, shelter belts, and landfill sites. Many studies have focused on topsoil, as it represents the primary interface between the environment and human activity. Notably, even in areas with air filtration functions, such as shelterbelts, small amounts of PFAS were detected, indicating their widespread presence in the environment.
The analysis highlights that PFOA and PFOS pose significant ecological risks in coastal regions, with industrial and agricultural activities serving as the primary human-driven contributors to PFAS contamination, while atmospheric deposition and plant uptake represent natural pathways of PFAS transport. The current focus of soil PFAS research in China remains concentrated in industrialized coastal and inland regions, where PFAS pollution is prevalent. Some areas exhibit exceptionally high PFOS concentrations, reaching thousands of nanograms per gram, presenting serious ecological and human health risks. Given the hepatotoxic, developmental, and carcinogenic effects of PFOS, greater regulatory attention is necessary to mitigate risks in affected regions.
Conversely, PFAS contamination in less industrialized regions, such as northwestern China, remains underexplored. Future research should expand into these areas to provide a more comprehensive understanding of PFAS distribution and risks nationwide. Although topsoil has been widely studied, PFAS accumulation in deeper soil layers and groundwater is an emerging concern. The potential for PFAS migration to deeper soils and underground water reservoirs underscores the need for long-term monitoring and predictive modeling to assess their fate and transport in the environment.
So, China’s PFAS contamination reflects a dual challenge of localized high-risk hotspots (industrial clusters) and diffuse low-level pollution (atmospheric deposition, agricultural runoff). While regulatory progress in provinces like Anhui and Guangdong demonstrates the feasibility of risk reduction, persistent gaps in groundwater protection, food safety, and long-range transport demand integrated, science-driven policies. Future efforts must balance source control, remediation innovation, and cross-sectoral governance to mitigate ecological and health risks in an era of expanding PFAS use.
Encouragingly, the findings suggest that, on a national scale, PFOA and PFOS generally pose low ecological risks to Chinese soil, with only a limited number of high-risk areas primarily driven by PFOS contamination. High-risk regions require targeted remediation strategies, such as policy interventions, pollution control measures, and manual removal techniques, while moderately polluted areas warrant preventive management to avoid further contamination. Additionally, considerations such as topography, climate, and soil-linked ecosystems should inform mitigation and conservation strategies.
Overall, soil acts as a critical reservoir for PFASs, necessitating continued monitoring, regulatory oversight, and sustainable management practices to mitigate long-term environmental and health risks associated with PFAS contamination in China. This study identified PFAS manufacturing, firefighting foam usage, and landfills as the dominant anthropogenic pollution sources. Notably, PFOS exhibited “localized extreme high risk” in coastal industrial areas, whereas PFOA demonstrated generally controllable risk levels, providing a scientific basis for differentiated regulatory strategies. By integrating concentration distribution, ecological risk assessment, and source apportionment, this work establishes a decision-making framework for PFAS-contaminated soil management in developing countries, with China as a representative case.

Supplementary Materials

The following supporting information can be downloaded at: https://www.mdpi.com/article/10.3390/w17152246/s1, Table S1: Chemical structures of different PFAS; Table S2: Distribution of PFAS in soils from different provincial administrative units; Table S3: Median value of PFAS concentrations of different provinces; Table S4: Highest value of PFAS concentrations of different provinces; Table S5: Abbreviations; Table S6: Summary of main-stream detection methods.

Author Contributions

Conceptualization, J.W. and G.Z.; methodology, J.W.; formal analysis, J.W., O.T. and G.J.; data curation, J.W., O.T. and G.J.; writing—original draft preparation, J.W.; writing—review and editing, J.W., O.T., J.T., F.H., C.L., G.J. and G.Z.; visualization, J.W., O.T. and G.J.; supervision, G.Z.; project administration, G.Z. All authors have read and agreed to the published version of the manuscript.

Funding

The authors declare no funding relevant to this article.

Data Availability Statement

Data is contained within the article and Supplementary Materials.

Conflicts of Interest

The authors declare no conflict of interest.

References

  1. Ryu, H.; Li, B.; De Guise, S.; McCutcheon, J.; Lei, Y. Recent progress in the detection of emerging contaminants PFASs. J. Hazard. Mater. 2021, 408, 124437. [Google Scholar] [CrossRef]
  2. Gaines, L.G.T. Historical and current usage of per- and polyfluoroalkyl substances (PFAS): A literature review. Am. J. Ind. Med. 2022, 66, 353–378. [Google Scholar] [CrossRef]
  3. Meegoda, J.N.; Bezerra de Souza, B.; Casarini, M.M.; Kewalramani, J.A. A Review of PFAS Destruction Technologies. Int. J. Environ. Res. Public Health 2022, 19, 16397. [Google Scholar] [CrossRef] [PubMed]
  4. Rehman, A.U.; Crimi, M.; Andreescu, S. Current and emerging analytical techniques for the determination of PFAS in environmental samples. Trends Environ. Anal. Chem. 2023, 37, e00198. [Google Scholar] [CrossRef]
  5. Singh, K.; Kumar, N.; Kumar Yadav, A.; Singh, R.; Kumar, K. Per-and polyfluoroalkyl substances (PFAS) as a health hazard: Current state of knowledge and strategies in environmental settings across Asia and future perspectives. Chem. Eng. J. 2023, 475, 145064. [Google Scholar] [CrossRef]
  6. Li, B.-B.; Hu, L.-X.; Yang, Y.-Y.; Wang, T.-T.; Liu, C.; Ying, G.-G. Contamination profiles and health risks of PFASs in groundwater of the Maozhou River basin. Environ. Pollut. 2020, 260, 113996. [Google Scholar] [CrossRef] [PubMed]
  7. Pan, Y.; Mei, J.; Jiang, J.; Xu, K.; Gao, X.; Jiang, S.; Liu, Y. PFAS in PMs might be the escalating hazard to the lung health. Nano Res. 2023, 16, 13113–13133. [Google Scholar] [CrossRef]
  8. Zhang, W.; Cao, H.; Liang, Y. Plant uptake and soil fractionation of five ether-PFAS in plant-soil systems. Sci. Total Environ. 2021, 771, 144805. [Google Scholar] [CrossRef]
  9. Gebbink, W.A.; van Asseldonk, L.; van Leeuwen, S.P.J. Presence of Emerging Per- and Polyfluoroalkyl Substances (PFASs) in River and Drinking Water near a Fluorochemical Production Plant in the Netherlands. Environ. Sci. Technol. 2017, 51, 11057–11065. [Google Scholar] [CrossRef]
  10. Pétré, M.A.; Salk, K.R.; Stapleton, H.M.; Ferguson, P.L.; Tait, G.; Obenour, D.R.; Knappe, D.R.U.; Genereux, D.P. Per- and polyfluoroalkyl substances (PFAS) in river discharge: Modeling loads upstream and downstream of a PFAS manufacturing plant in the Cape Fear watershed, North Carolina. Sci. Total Environ. 2022, 831, 154763. [Google Scholar] [CrossRef]
  11. Hill, P.J.; Taylor, M.; Goswami, P.; Blackburn, R.S. Substitution of PFAS chemistry in outdoor apparel and the impact on repellency performance. Chemosphere 2017, 181, 500–507. [Google Scholar] [CrossRef]
  12. Brusseau, M.L.; Anderson, R.H.; Guo, B. PFAS concentrations in soils: Background levels versus contaminated sites. Sci. Total Environ. 2020, 740, 140017. [Google Scholar] [CrossRef]
  13. Sofo, A.; Zanella, A.; Ponge, J.F. Soil quality and fertility in sustainable agriculture, with a contribution to the biological classification of agricultural soils. Soil Use Manag. 2021, 38, 1085–1112. [Google Scholar] [CrossRef]
  14. Röhler, K.; Susset, B.; Grathwohl, P. Production of perfluoroalkyl acids (PFAAs) from precursors in contaminated agricultural soils: Batch and leaching experiments. Sci. Total Environ. 2023, 902, 166555. [Google Scholar] [CrossRef] [PubMed]
  15. Kopittke, P.M.; Minasny, B.; Pendall, E.; Rumpel, C.; McKenna, B.A. Healthy soil for healthy humans and a healthy planet. Crit. Rev. Environ. Sci. Technol. 2023, 54, 210–221. [Google Scholar] [CrossRef]
  16. Schroeder, T.; Bond, D.; Foley, J. PFAS soil and groundwater contamination via industrial airborne emission and land deposition in SW Vermont and Eastern New York State, USA. Environ. Sci. Process. Impacts 2021, 23, 291–301. [Google Scholar] [CrossRef]
  17. Kotthoff, M.; Fliedner, A.; Rüdel, H.; Göckener, B.; Bücking, M.; Biegel-Engler, A.; Koschorreck, J. Per-and polyfluoroalkyl substances in the German environment–levels and patterns in different matrices. Sci. Total Environ. 2020, 740, 140116. [Google Scholar] [CrossRef]
  18. Göckener, B.; Fliedner, A.; Rüdel, H.; Fettig, I.; Koschorreck, J. Exploring unknown per-and polyfluoroalkyl substances in the German environment–the total oxidizable precursor assay as helpful tool in research and regulation. Sci. Total Environ. 2021, 782, 146825. [Google Scholar] [CrossRef]
  19. Röhler, K.; Haluska, A.A.; Susset, B.; Liu, B.; Grathwohl, P. Long-term behavior of PFAS in contaminated agricultural soils in Germany. J. Contam. Hydrol. 2021, 241, 103812. [Google Scholar] [CrossRef]
  20. Dauchy, X. Evidence of large-scale deposition of airborne emissions of per- and polyfluoroalkyl substances (PFASs) near a fluoropolymer production plant in an urban area. Chemosphere 2023, 337, 139407. [Google Scholar] [CrossRef]
  21. Sammut, G.; Sinagra, E.; Sapiano, M.; Helmus, R.; de Voogt, P. Perfluoroalkyl substances in the Maltese environment—(II) sediments, soils and groundwater. Sci. Total Environ. 2019, 682, 180–189. [Google Scholar] [CrossRef]
  22. Hu, H.; Zeng, X.; Zheng, K.; Zeng, Z.; Dai, C.; Huo, X. Risk assessment and partitioning behavior of PFASs in environmental matrices from an e-waste recycling area. Sci. Total Environ. 2023, 905, 167707. [Google Scholar] [CrossRef] [PubMed]
  23. Jia, X.; Li, X.; Zhou, L.; Hui, Y.; Li, W.; Cai, Y.; Shi, Y. Variations of the Level, Profile, and Distribution of PFAS around POSF Manufacturing Facilities in China: An Overlooked Source of PFCA. Environ. Sci. Technol. 2023, 57, 5264–5274. [Google Scholar] [CrossRef] [PubMed]
  24. Meng, J.; Wang, T.; Song, S.; Wang, P.; Li, Q.; Zhou, Y.; Lu, Y. Tracing perfluoroalkyl substances (PFASs) in soils along the urbanizing coastal area of Bohai and Yellow Seas, China. Environ. Pollut. 2018, 238, 404–412. [Google Scholar] [CrossRef] [PubMed]
  25. Tang, L.; Liu, X.; Yang, G.; Xia, J.; Zhang, N.; Wang, D.; Deng, H.; Mao, M.; Li, X.; Ni, B.-J. Spatial distribution, sources and risk assessment of perfluoroalkyl substances in surface soils of a representative densely urbanized and industrialized city of China. Catena 2021, 198, 105059. [Google Scholar] [CrossRef]
  26. Huang, X.; Wei, X.; Liu, H.; Li, W.; Shi, D.; Qian, S.; Sun, W.; Yue, D.; Wang, X. Occurrence of per- and polyfluoroalkyl substances (PFAS) in municipal solid waste landfill leachates from western China. Environ. Sci. Pollut. Res. 2022, 29, 69588–69598. [Google Scholar] [CrossRef]
  27. Ma, D.; Zhong, H.; Lv, J.; Wang, Y.; Jiang, G. Levels, distributions, and sources of legacy and novel per- and perfluoroalkyl substances (PFAS) in the topsoil of Tianjin, China. J. Environ. Sci. 2022, 112, 71–81. [Google Scholar] [CrossRef]
  28. Huset, C.A.; Barry, K.M. Quantitative determination of perfluoroalkyl substances (PFAS) in soil, water, and home garden produce. MethodsX 2018, 5, 697–704. [Google Scholar] [CrossRef]
  29. Simon, F.; Gehrenkemper, L.; von der Au, M.; Wittwer, P.; Roesch, P.; Pfeifer, J.; Cossmer, A.; Meermann, B. A fast and simple PFAS extraction method utilizing HR–CS–GFMAS for soil samples. Chemosphere 2022, 295, 133922. [Google Scholar] [CrossRef]
  30. Li, F.; Zhang, C.; Qu, Y.; Chen, J.; Chen, L.; Liu, Y.; Zhou, Q. Quantitative characterization of short- and long-chain perfluorinated acids in solid matrices in Shanghai, China. Sci. Total Environ. 2010, 408, 617–623. [Google Scholar] [CrossRef]
  31. Liu, T.; Hu, L.-X.; Han, Y.; Dong, L.-L.; Wang, Y.-Q.; Zhao, J.-H.; Liu, Y.-S.; Zhao, J.-L.; Ying, G.-G. Non-target and target screening of per- and polyfluoroalkyl substances in landfill leachate and impact on groundwater in Guangzhou, China. Sci. Total Environ. 2022, 844, 157021. [Google Scholar] [CrossRef] [PubMed]
  32. Gonda, N.; Zhang, C.; Tepedelen, D.; Smith, A.; Schaefer, C.; Higgins, C.P. Quantitative assessment of poly- and perfluoroalkyl substances (PFASs) in aqueous film forming foam (AFFF)–impacted soils: A comparison of analytical protocols. Anal. Bioanal. Chem. 2024, 416, 6879–6892. [Google Scholar] [CrossRef]
  33. Dhiman, S.; Jain, H.V.; Yadav, A.; Ansari, N.G. Probing the fate and transport of PFAS in urban soils: Insights from ASE-LC-HR/MS analysis. J. Hazard. Mater. 2025, 494, 138635. [Google Scholar] [CrossRef] [PubMed]
  34. Norwegian Pollution Control Authority. Screening of Polyfluorinated Organic Compounds at Four Fire Training Facilities in Norway. (TA-2444/2008). 2008. Available online: https://kudos.dfo.no/documents/9379/files/9266.pdf (accessed on 5 July 2025).
  35. Jeong, S.-W.; An, Y.-J. Significant Parameters for Assessing Soil Contaminant-Leaching to Groundwater and Determining Soil Sample Size in Field Survey. Environ. Eng. Res. 2008, 13, 73–78. [Google Scholar] [CrossRef]
  36. Cai, Q.; Li, X.; Zhang, F.; Yang, J.; Liu, S.; Chen, C. In situ analysis of distribution characteristics of per-/polyfluoroalkyl substances (PFAS) in water-sediment systems using diffusive gradients in thin-films (DGT). Anal. Chem. 2025, 53, 300–318. (In Chinese) [Google Scholar] [CrossRef]
  37. Dimitrakopoulou, M.-E.; Karvounis, M.; Marinos, G.; Theodorakopoulou, Z.; Aloizou, E.; Petsangourakis, G.; Papakonstantinou, M.; Stoitsis, G. Comprehensive analysis of PFAS presence from environment to plate. Npj Sci. Food 2024, 8, 80. [Google Scholar] [CrossRef]
  38. Xie, X.; Lu, Y.; Wang, P.; Lei, H.; Chen, N.; Liang, Z.; Jiang, X.; Li, J.; Cao, Z.; Liao, J.; et al. Per- and polyfluoroalkyl substances in a subtropical river-mangrove estuary-bay system. J. Hazard. Mater. 2024, 464, 132937. [Google Scholar] [CrossRef]
  39. Cheng, Y.; An, Q.; Qi, H.; Li, R.; Liu, W.; Gu, B.; Liu, K. Temporal Trends of Legacy and Emerging PFASs from 2011 to 2021 in Agricultural Soils of Eastern China: Impacts of the Stockholm Convention. Environ. Sci. Technol. 2023, 57, 9277–9286. [Google Scholar] [CrossRef]
  40. Zhu, Q.; Qian, J.; Huang, S.; Li, Q.; Guo, L.; Zeng, J.; Zhang, W.; Cao, X.; Yang, J. Occurrence, distribution, and input pathways of per- and polyfluoroalkyl substances in soils near different sources in Shanghai. Environ. Pollut. 2022, 308, 119620. [Google Scholar] [CrossRef]
  41. Lu, G.-H.; Jiao, X.-C.; Piao, H.-T.; Wang, X.-C.; Chen, S.; Tan, K.-Y.; Gai, N.; Yin, X.-C.; Yang, Y.-L.; Pan, J. The Extent of the Impact of a Fluorochemical Industrial Park in Eastern China on Adjacent Rural Areas. Arch. Environ. Contam. Toxicol. 2017, 74, 484–491. [Google Scholar] [CrossRef]
  42. Gan, C.-D.; Peng, M.-Y.; Liu, H.-B.; Yang, J.-Y. Concentration and distribution of metals, total fluorine, per- and poly-fluoroalkyl substances (PFAS) in vertical soil profiles in industrialized areas. Chemosphere 2022, 302, 134855. [Google Scholar] [CrossRef]
  43. Meng, Y.; Yao, Y.; Chen, H.; Li, Q.; Sun, H. Legacy and emerging per- and polyfluoroalkyl substances (PFASs) in Dagang Oilfield: Multimedia distribution and contributions of unknown precursors. J. Hazard. Mater. 2021, 412, 125177. [Google Scholar] [CrossRef] [PubMed]
  44. Zhao, M.; Yao, Y.; Dong, X.; Baqar, M.; Fang, B.; Chen, H.; Sun, H. Nontarget Identification of Novel Per- and Polyfluoroalkyl Substances (PFAS) in Soils from an Oil Refinery in Southwestern China: A Combined Approach with TOP Assay. Environ. Sci. Technol. 2023, 57, 20194–20205. [Google Scholar] [CrossRef] [PubMed]
  45. Hu, Y.; Chen, H.; Chen, Y.; Wang, Y.; Luo, Y.; Sang, L.; Jin, T.; Wu, S. Perfluoroalkyl acids (PFAAs) and their precursors in sediments and adjacent riparian soils from the Three Gorges Reservoir, China: Contamination characteristics, source apportionment and ecological risks. Environ. Res. 2025, 274, 121202. [Google Scholar] [CrossRef] [PubMed]
  46. Xing, Z.; Wang, G.; Liu, S.; Chen, H.; Dong, X.; Wang, H.; Liu, Y. Legacy and emerging per- and polyfluoroalkyl substances (PFASs) in agricultural soils affected by fluorochemical manufacturing facilities, North China: Occurrence, region-specific distribution, substitution trend and source appointment. J. Hazard. Mater. 2024, 474, 134770. [Google Scholar] [CrossRef]
  47. Choi, G.-H.; Lee, D.-Y.; Jeong, D.-K.; Kuppusamy, S.; Lee, Y.B.; Park, B.-J.; Kim, J.-H. Perfluorooctanoic acid (PFOA) and perfluorooctanesulfonic acid (PFOS) concentrations in the South Korean agricultural environment: A national survey. J. Integr. Agric. 2017, 16, 1841–1851. [Google Scholar] [CrossRef]
  48. Sörengård, M.; Kikuchi, J.; Wiberg, K.; Ahrens, L. Spatial distribution and load of per- and polyfluoroalkyl substances (PFAS) in background soils in Sweden. Chemosphere 2022, 295, 133944. [Google Scholar] [CrossRef]
  49. Xiao, F.; Simcik, M.F.; Halbach, T.R.; Gulliver, J.S. Perfluorooctane sulfonate (PFOS) and perfluorooctanoate (PFOA) in soils and groundwater of a U.S. metropolitan area: Migration and implications for human exposure. Water Res. 2015, 72, 64–74. [Google Scholar] [CrossRef]
  50. Arp, H.P.H.; Gredelj, A.; Gluge, J.; Scheringer, M.; Cousins, I.T. The Global Threat from the Irreversible Accumulation of Trifluoroacetic Acid (TFA). Environ. Sci. Technol. 2024, 58, 19925–19935. [Google Scholar] [CrossRef]
  51. Hyslop, N.P.; Liu, Y.; Yatkin, S.; Trzepla, K. Application of the U.S. EPA procedure for determining method detection limits to EDXRF measurement of filter-based aerosol samples. J. Air Waste Manag. Assoc. 2022, 72, 905–913. [Google Scholar] [CrossRef]
  52. Top 10 Provinces in China’s Industrial Strength 2024: Guangdong Secures Top Position, Anhui Leads in Growth Rate. 2024. Available online: https://baijiahao.baidu.com/s?id=1834091371028871077&wfr=spider&for=pc (accessed on 5 July 2025). (In Chinese).
  53. Cao, X.; Wang, C.; Lu, Y.; Zhang, M.; Khan, K.; Song, S.; Wang, P.; Wang, C. Occurrence, sources and health risk of polyfluoroalkyl substances (PFASs) in soil, water and sediment from a drinking water source area. Ecotoxicol. Environ. Saf. 2019, 174, 208–217. [Google Scholar] [CrossRef]
  54. Liu, B.; Zhang, H.; Yu, Y.; Xie, L.; Li, J.; Wang, X.; Dong, W. Perfluorinated Compounds (PFCs) in Soil of the Pearl River Delta, China: Spatial Distribution, Sources, and Ecological Risk Assessment. Arch. Environ. Contam. Toxicol. 2019, 78, 182–189. [Google Scholar] [CrossRef]
  55. Qie, M.; Jia, X.; Li, X.; Li, Y.; Wu, X.; Shi, Y.; Cai, Y. Spatial distribution, source, and fate of per- and polyfluoroalkyl substances in the surrounding environment of closed and converted fluorochemical factories in Fujian, China. Sci. Total Environ. 2024, 930, 172766. [Google Scholar] [CrossRef]
  56. Li, Y.; Liu, Y.; Shi, G.; Liu, C.; Hao, Q.; Wu, L. Occurrence and Risk Assessment of Perfluorooctanoate (PFOA) and Perfluorooctane Sulfonate (PFOS) in Surface Water, Groundwater and Sediments of the Jin River Basin, Southeastern China. Bull. Environ. Contam. Toxicol. 2022, 108, 1026–1032. [Google Scholar] [CrossRef] [PubMed]
  57. Liang, Z.; Lu, Y.; Cao, Z.; Huang, X.; Lei, H.; Li, J.; Wu, Z.; An, X.; Wang, P. Co-emissions of fluoride ion, fluorinated greenhouse gases, and per- and polyfluoroalkyl substances (PFAS) from different fluorochemical production processes. Environ. Pollut. 2024, 360, 124609. [Google Scholar] [CrossRef] [PubMed]
  58. Qi, Z.; Cao, Y.; Li, D.; Wu, C.; Wu, K.; Song, Y.; Huang, Z.; Luan, H.; Meng, X.; Yang, Z.; et al. Nontarget Analysis of Legacy and Emerging PFAS in a Lithium-Ion Power Battery Recycling Park and Their Possible Toxicity Measured Using High-Throughput Phenotype Screening. Environ. Sci. Technol. 2024, 58, 14530–14540. [Google Scholar] [CrossRef] [PubMed]
  59. Chen, X.; Li, J.; Han, L.; Wu, W.; Chen, M. Human health risk-based soil generic assessment criteria of representative perfluoroalkyl acids (PFAAs) under the agricultural land use in typical Chinese regions. Environ. Pollut. 2023, 335, 122368. [Google Scholar] [CrossRef]
  60. Li, J.; Sha, H.; Liu, W.; Yuan, Y.; Zhu, G.; Meng, F.; Xi, B.; Tan, W. Transport of per-/polyfluoroalkyl substances from leachate to groundwater as affected by dissolved organic matter in landfills. Environ. Res. 2024, 247, 118230. [Google Scholar] [CrossRef]
  61. Eliminating and Replacing Emerging Pollutants: Guangdong in Action. 2024. Available online: http://sthjj.gz.gov.cn/ysxw/content/post_9738889.html (accessed on 5 July 2025). (In Chinese)
  62. Drenning, P.; Volchko, Y.; Ahrens, L.; Rosén, L.; Söderqvist, T.; Norrman, J. Comparison of PFAS soil remediation alternatives at a civilian airport using cost-benefit analysis. Sci. Total Environ. 2023, 882, 163664. [Google Scholar] [CrossRef]
  63. Capozzi, S.L.; Leang, A.L.; Rodenburg, L.A.; Chandramouli, B.; Delistraty, D.A.; Carter, C.H. PFAS in municipal landfill leachate: Occurrence, transformation, and sources. Chemosphere 2023, 334, 138924. [Google Scholar] [CrossRef]
  64. Göen, T.; Abballe, A.; Bousoumah, R.; Godderis, L.; Iavicoli, I.; Ingelido, A.M.; Leso, V.; Müller, J.; Ndaw, S.; Porras, S.P.; et al. HBM4EU chromates study—PFAS exposure in electroplaters and bystanders. Chemosphere 2024, 346, 140613. [Google Scholar] [CrossRef]
  65. Wang, Q.; Ruan, Y.; Zhao, Z.; Zhang, L.; Hua, X.; Jin, L.; Chen, H.; Wang, Y.; Yao, Y.; Lam, P.K.S.; et al. Per- and polyfluoroalkyl substances (PFAS) in the Three-North Shelter Forest in northern China: First survey on the effects of forests on the behavior of PFAS. J. Hazard. Mater. 2022, 427, 128157. [Google Scholar] [CrossRef]
  66. D’Ambro, E.L.; Murphy, B.N.; Bash, J.O.; Gilliam, R.C.; Pye, H.O.T. Predictions of PFAS regional-scale atmospheric deposition and ambient air exposure. Sci. Total Environ. 2023, 902, 166256. [Google Scholar] [CrossRef]
  67. Hale, S.E.; Arp, H.P.H.; Slinde, G.A.; Wade, E.J.; Bjørseth, K.; Breedveld, G.D.; Straith, B.F.; Moe, K.G.; Jartun, M.; Høisæter, Å. Sorbent amendment as a remediation strategy to reduce PFAS mobility and leaching in a contaminated sandy soil from a Norwegian firefighting training facility. Chemosphere 2017, 171, 9–18. [Google Scholar] [CrossRef] [PubMed]
  68. Mazzieri, F.; Di Sante, M.; Fratalocchi, E.; Pasqualini, E. Modeling contaminant leaching and transport to groundwater in Tier 2 risk assessment procedures of contaminated sites. Environ. Earth Sci. 2016, 75, 1247. [Google Scholar] [CrossRef]
  69. Liu, G.; Usman, M.; Luo, T.; Biard, P.-F.; Lin, K.; Greenwell, H.C.; Hanna, K. Retention and transport of PFOA and its fluorinated substitute, GenX, through water-saturated soil columns. Environ. Pollut. 2023, 337, 122530. [Google Scholar] [CrossRef] [PubMed]
  70. Sima, M.W.; Jaffé, P.R. A critical review of modeling Poly- and Perfluoroalkyl Substances (PFAS) in the soil-water environment. Sci. Total Environ. 2021, 757, 143793. [Google Scholar] [CrossRef]
  71. Samuel, J.B.; Chakraborty, A. Integration of a Groundwater Model to the Noah Land Surface Model for Aquifer-Soil Interaction. J. Adv. Model. Earth Syst. 2023, 15, e2022MS003153. [Google Scholar] [CrossRef]
  72. Liu, M.; Munoz, G.; Vo Duy, S.; Sauvé, S.; Liu, J. Per- and Polyfluoroalkyl Substances in Contaminated Soil and Groundwater at Airports: A Canadian Case Study. Environ. Sci. Technol. 2021, 56, 885–895. [Google Scholar] [CrossRef]
  73. Wallis, I.; Hutson, J.; Davis, G.; Kookana, R.; Rayner, J.; Prommer, H. Model-based identification of vadose zone controls on PFAS mobility under semi-arid climate conditions. Water Res. 2022, 225, 119096. [Google Scholar] [CrossRef]
  74. Nguyen, T.M.H.; Braunig, J.; Thompson, K.; Thompson, J.; Kabiri, S.; Navarro, D.A.; Kookana, R.S.; Grimison, C.; Barnes, C.M.; Higgins, C.P.; et al. Influences of Chemical Properties, Soil Properties, and Solution pH on Soil-Water Partitioning Coefficients of Per- and Polyfluoroalkyl Substances (PFASs). Environ. Sci. Technol. 2020, 54, 15883–15892. [Google Scholar] [CrossRef]
  75. Dai, M.; Yan, N.; Brusseau, M.L. Potential impact of bacteria on the transport of PFAS in porous media. Water Res. 2023, 243, 120350. [Google Scholar] [CrossRef]
  76. Zhao, Z.; Li, J.; Zhang, X.; Wang, L.; Wang, J.; Lin, T. Perfluoroalkyl and polyfluoroalkyl substances (PFASs) in groundwater: Current understandings and challenges to overcome. Environ. Sci. Pollut. Res. 2022, 29, 49513–49533. [Google Scholar] [CrossRef]
  77. Bao, J.; Yu, W.J.; Liu, Y.; Wang, X.; Jin, Y.H.; Dong, G.H. Perfluoroalkyl substances in groundwater and home-produced vegetables and eggs around a fluorochemical industrial park in China. Ecotoxicol. Environ. Saf. 2019, 171, 199–205. [Google Scholar] [CrossRef]
  78. Li, J.; Duan, W.; An, Z.; Jiang, Z.; Li, L.; Guo, M.; Tan, Z.; Zeng, X.; Liu, X.; Liu, Y.; et al. Legacy and alternative per- and polyfluoroalkyl substances spatiotemporal distribution in China: Human exposure, environmental media, and risk assessment. J. Hazard. Mater. 2024, 480, 135795. [Google Scholar] [CrossRef]
  79. Li, Y.; Niu, Z.; Zhang, Y. Occurrence of legacy and emerging poly- and perfluoroalkyl substances in water: A case study in Tianjin (China). Chemosphere 2022, 287 Pt 4, 132409. [Google Scholar] [CrossRef]
  80. Conder, J.M.; Hoke, R.A.; Wolf, W.D.; Russell, M.H.; Buck, R.C. Are PFCAs Bioaccumulative? A Critical Review and Comparison with Regulatory Criteria and Persistent Lipophilic Compounds. Environ. Sci. Technol. 2008, 42, 995–1003. [Google Scholar] [CrossRef] [PubMed]
  81. Qi, P.; Wang, Y.; Mu, J.; Wang, J. Aquatic predicted no-effect-concentration derivation for perfluorooctane sulfonic acid. Environ. Toxicol. Chem. 2011, 30, 836–842. [Google Scholar] [CrossRef] [PubMed]
  82. McCarthy, C.; Kappleman, W.; DiGuiseppi, W. Ecological Considerations of Per- and Polyfluoroalkyl Substances (PFAS). Curr. Pollut. Rep. 2017, 3, 289–301. [Google Scholar] [CrossRef]
  83. Zhu, L.; Li, B.; Wu, R.; Li, W.; Wang, J.; Wang, J.; Du, Z.; Juhasz, A.; Zhu, L. Acute toxicity, oxidative stress and DNA damage of chlorpyrifos to earthworms (Eisenia fetida): The difference between artificial and natural soils. Chemosphere 2020, 255, 126982. [Google Scholar] [CrossRef]
  84. Wang, C.; Magnuson, J.T.; Zheng, C.; Qiu, W. Incidence of Pollution, Bioaccumulation, Biomagnification, and Toxic Effects of Per- and Polyfluoroalkyl Substances (PFAS) in Aquatic Ecosystems: A Review. Aquat. Toxicol. 2025, 286, 107469. [Google Scholar] [CrossRef]
  85. Fujii, Y.; Shibata, Y.; Tokuda, Y.; Ito, Y.; Kudo, N.; Harada, K.H. Human exposure and toxicity of per- and polyfluoroalkyl substances: Narrative review and perspectives. Chemosphere 2025, 385, 144508. [Google Scholar] [CrossRef]
  86. Lau, C.; Thibodeaux, J.R.; Hanson, R.G.; Narotsky, M.G.; Rogers, J.M.; Lindstrom, A.B.; Strynar, M.J. Effects of Perfluorooctanoic Acid Exposure during Pregnancy in the Mouse. Toxicol. Sci. 2006, 90, 510–518. [Google Scholar] [CrossRef]
  87. Stanifer, J.W.; Stapleton, H.M.; Souma, T.; Wittmer, A.; Zhao, X.; Boulware, L.E. Perfluorinated Chemicals as Emerging Environmental Threats to Kidney Health: A Scoping Review. Clin. J. Am. Soc. Nephrol. 2018, 13, 1479–1492. [Google Scholar] [CrossRef]
  88. Tursi, A.R.; Lindeman, B.; Kristoffersen, A.B.; Hjertholm, H.; Bronder, E.; Andreassen, M.; Husøy, T.; Dirven, H.; Andorf, S.; Nygaard, U.C. Immune cell profiles associated with human exposure to perfluorinated compounds (PFAS) suggest changes in natural killer, T helper, and T cytotoxic cell subpopulations. Environ. Res. 2024, 256, 119221. [Google Scholar] [CrossRef]
  89. MacDonald, M.M.; Warne, A.L.; Stock, N.L.; Mabury, S.A.; Solomon, K.R.; Sibley, P.K. Toxicity of perfluorooctane sulfonic acid and perfluorooctanoic acid to Chironomus tentans. Environ. Toxicol. Chem. 2004, 23, 2116–2123. [Google Scholar] [CrossRef]
  90. van Gerwen, M.; Colicino, E.; Guan, H.; Dolios, G.; Nadkarni, G.N.; Vermeulen, R.C.H.; Wolff, M.S.; Arora, M.; Genden, E.M.; Petrick, L.M. Per- and polyfluoroalkyl substances (PFAS) exposure and thyroid cancer risk. eBioMedicine 2023, 97, 104831. [Google Scholar] [CrossRef]
  91. Fragki, S.; Dirven, H.; Fletcher, T.; Grasl-Kraupp, B.; Bjerve Gützkow, K.; Hoogenboom, R.; Kersten, S.; Lindeman, B.; Louisse, J.; Peijnenburg, A.; et al. Systemic PFOS and PFOA exposure and disturbed lipid homeostasis in humans: What do we know and what not? Crit. Rev. Toxicol. 2021, 51, 141–164. [Google Scholar] [CrossRef] [PubMed]
  92. Schlezinger, J.J.; Gokce, N. Perfluoroalkyl/Polyfluoroalkyl Substances: Links to Cardiovascular Disease Risk. Circ. Res. 2024, 134, 1136–1159. [Google Scholar] [CrossRef] [PubMed]
  93. Fenton, S.E.; Ducatman, A.; Boobis, A.; DeWitt, J.C.; Lau, C.; Ng, C.; Smith, J.S.; Roberts, S.M. Per- and Polyfluoroalkyl Substance Toxicity and Human Health Review: Current State of Knowledge and Strategies for Informing Future Research. Environ. Toxicol. Chem. 2021, 40, 606–630. [Google Scholar] [CrossRef] [PubMed]
Figure 1. Trends in PFAS-related research publications globally and in China (2009–2024).
Water 17 02246 g001
Figure 2. Schematic chart of PFAS analysis method. Reproduce with permission [4] Copyright 2023 Elsevier.
Water 17 02246 g002
Figure 3. Spatial distribution of reported total PFAS concentrations (∑PFASs, ng/g) in soils across different provinces of China.
Water 17 02246 g003
Figure 4. Ecological risk assessment of PFOA contamination in different provinces of China.
Water 17 02246 g004
Figure 5. Ecological risk assessment of PFOS contamination in different provinces of China.
Water 17 02246 g005
Figure 6. Schematic representation of PFAS sources and pathways in soil, including emissions from PFAS factories, landfills, fire stations, and agriculture, with environmental transport through atmospheric deposition, plant absorption, and groundwater infiltration.
Water 17 02246 g006
Figure 7. Schematic diagram of migration of PFAS between soil and groundwater.
Water 17 02246 g007
Disclaimer/Publisher’s Note: The statements, opinions and data contained in all publications are solely those of the individual author(s) and contributor(s) and not of MDPI and/or the editor(s). MDPI and/or the editor(s) disclaim responsibility for any injury to people or property resulting from any ideas, methods, instructions or products referred to in the content.

