By making a thorough literature review of both Chinese and foreign research, and taking into account the specific conditions of coastal cities in China, this paper attempts to establish a fine-scale evaluation indicator system of disaster response capability (DRC) with a specific focus on storm surges.
3.3. Construction of an Evaluation Indicator System for Disaster Response Capability
Building on the theory outlined in the previous section, the assessment system for evaluating disaster response capability to SSDs comprises three components: the vulnerability of the disaster-bearing bodies, the stability of the disaster-incubating environment, and the risk of hazard factors. This study has identified suitable indicators for each component, following the principles of establishing an indicator system. In this study, the construction of the indicator system is grounded in a systematic literature review, and supported by disaster system theory. A wide range of peer-reviewed studies, policy guidelines, and technical reports in the fields of coastal vulnerability, storm surge risk assessment, and urban disaster resilience were reviewed. The following types of indicators were prioritized: (1) those widely used across multiple studies; (2) those reflecting the core dimensions of the H-E-V and PPRR frameworks; and (3) indicator with data availability at the urban scale [
5,
29,
30,
31,
32,
33,
34,
35,
36,
37,
38,
39,
40,
41,
42,
43,
44,
45,
46,
47,
48,
49,
50,
51,
52,
53,
54,
55,
56,
57].
For example, indicators such as “population density”, “length of drainage pipelines”, and “proportion of elderly population” are frequently used in marine flood vulnerability assessments. “Land use ratio” is recognized as a key variable in studies on environmental stability. Although no studies were found to define “coastline type” as a specific indicator, many have highlighted its role in buffering storm surge impacts. Since this study evaluates urban disaster response from a city-level perspective, “coastline type” is considered an important component of the disaster-incubating environment. The final indicator system should ensure strong scientific validity and applicability to policy.
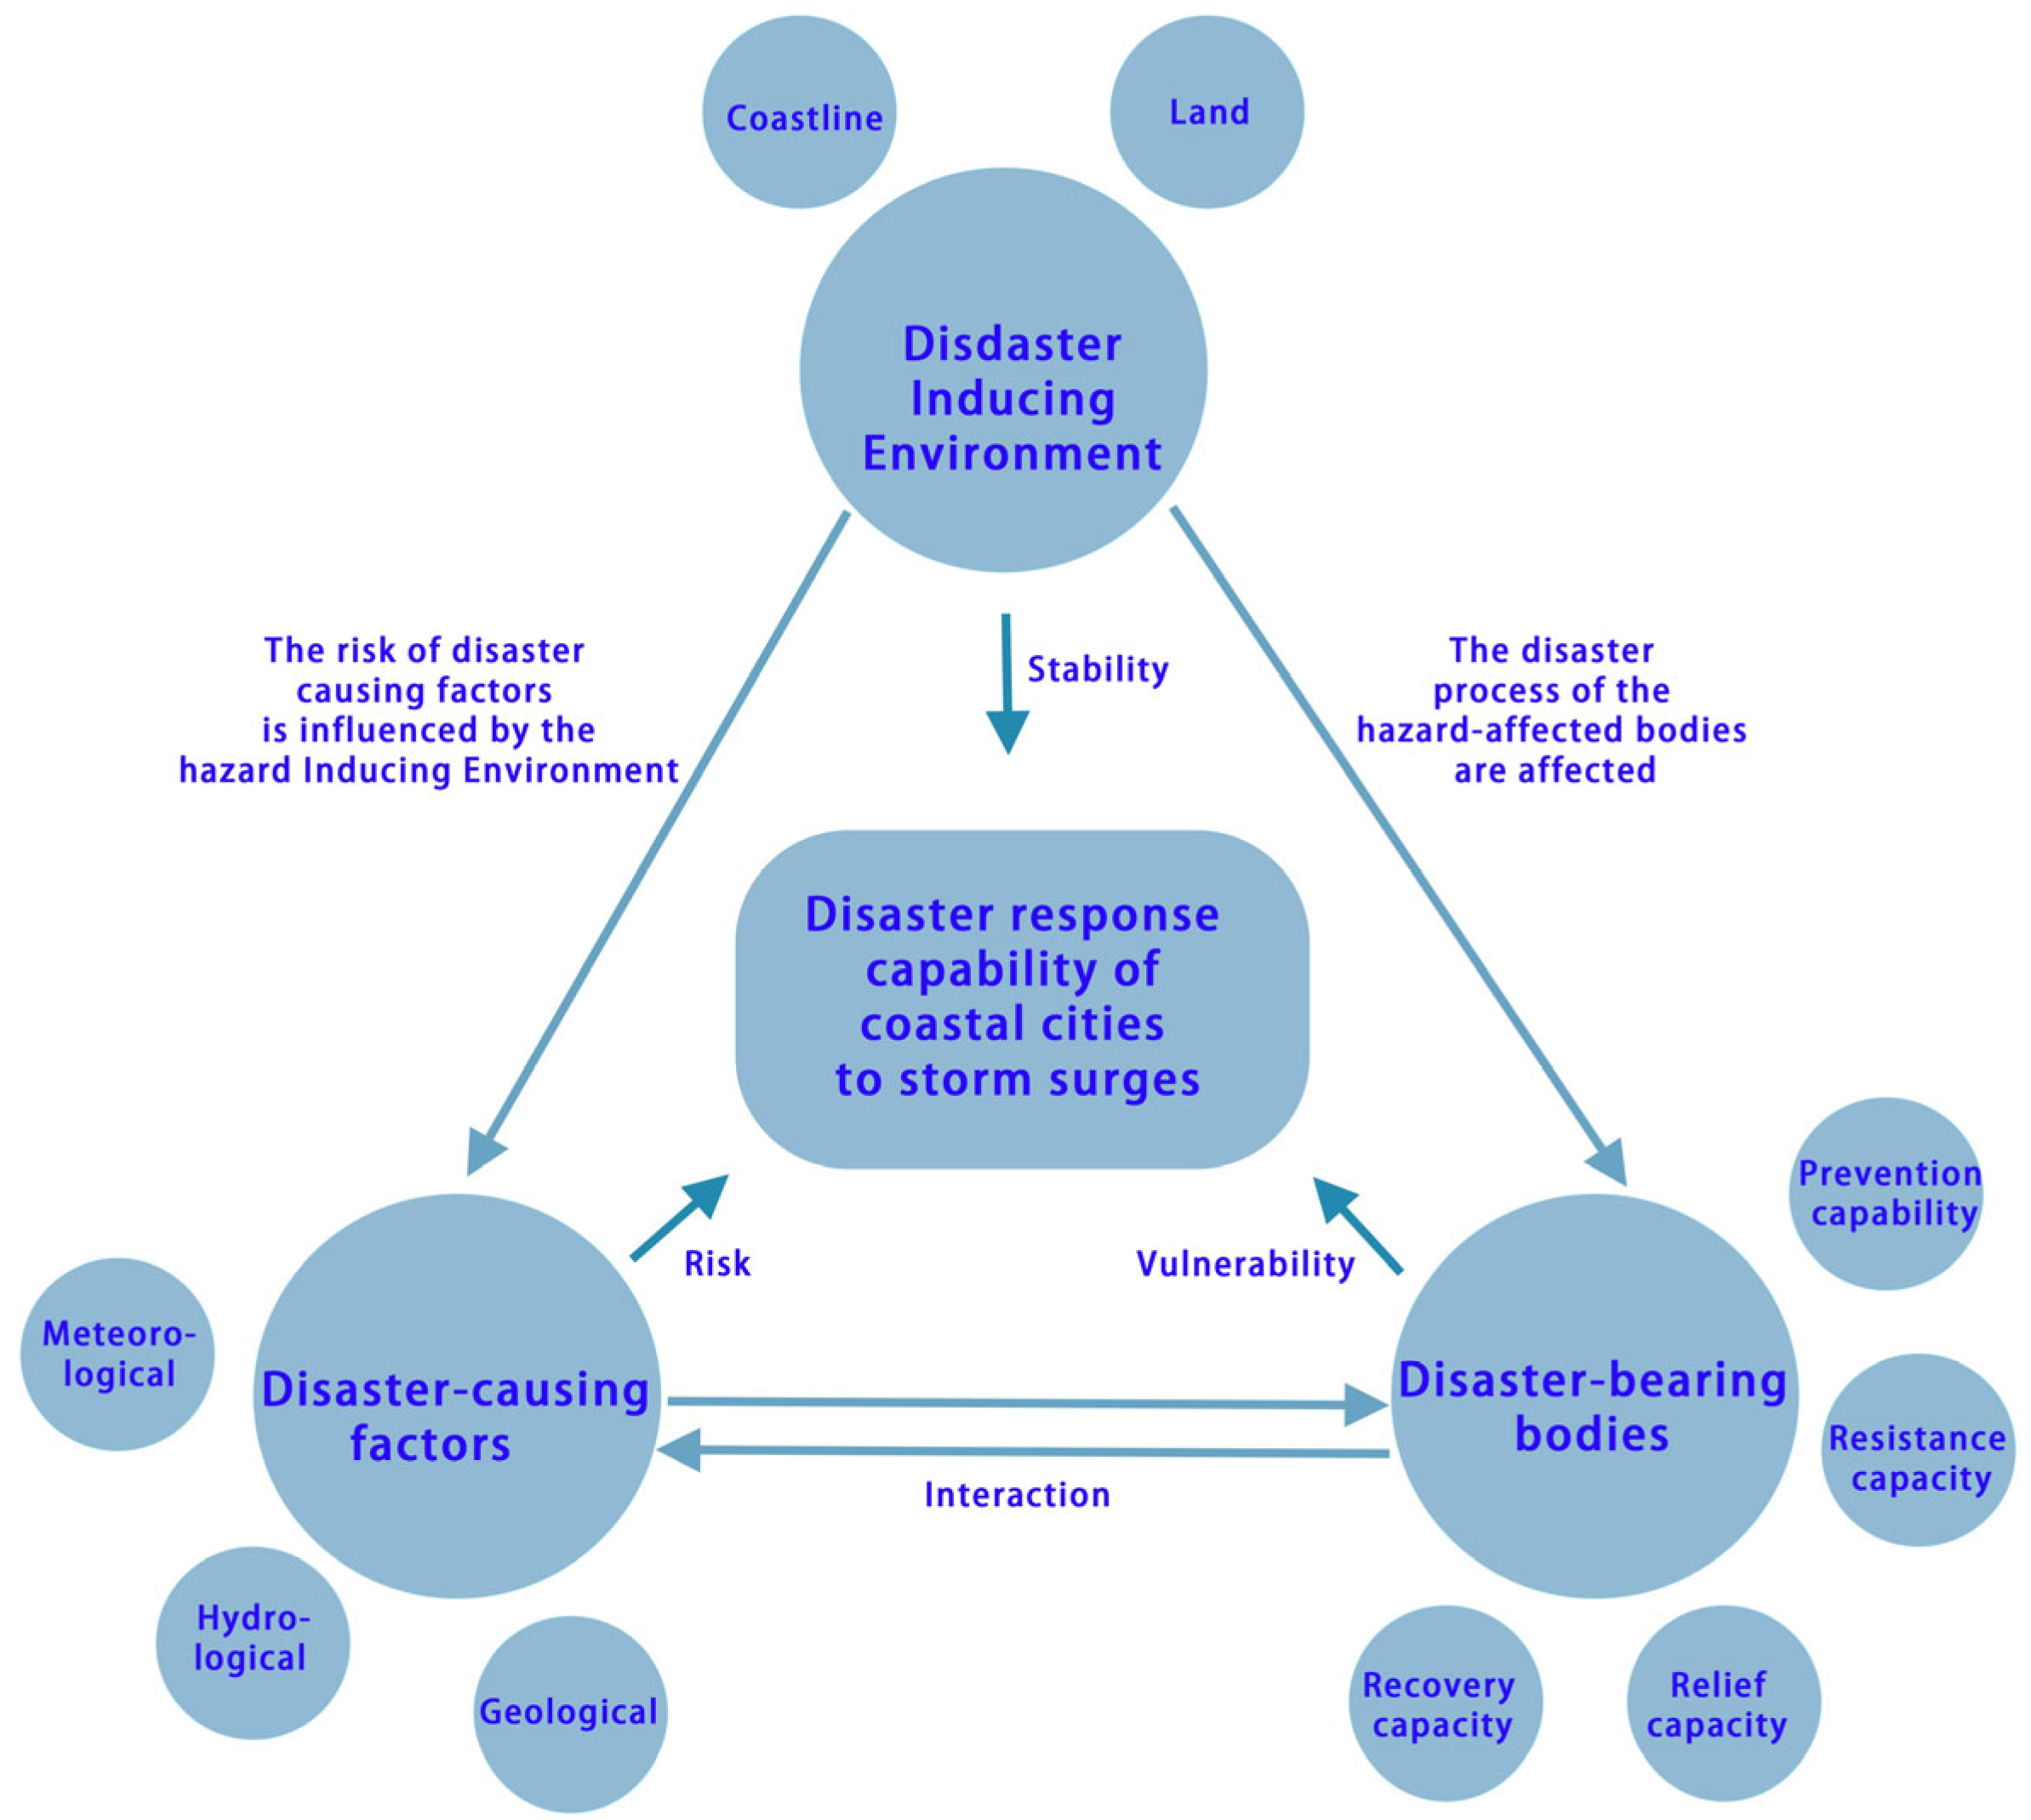
Regarding the vulnerability of the disaster-bearing bodies, the concept is divided into four stages based on disaster life cycle theory and the PPRR model: disaster prevention capability, disaster resistance capability, disaster relief capability, and recovery capability. In conjunction with the characteristics of the indicators and the four systemic concepts, relevant indicators have been chosen, as shown in
Table 1. The stability of the disaster-incubating environment is categorized into natural and human-made environments. The natural environment encompasses various coastline types, each with different abilities to withstand storm surges. Due to varying risks of storm surge damage across different land use types, the human-made environment includes the diverse factors related to land use. The direction definition of indicators is for the subsequent analysis of indicator data using the entropy weight method.
Table 2 displays the relevant indicators. Additionally, hazard factors for SSDs generally involve meteorological, hydrological, and geological elements, with the specific indicators listed in
Table 3. The theoretical diagram of the evaluation system established based on the H-E-V framework and the PPRR model is displayed in
Figure 2.
The indicator framework was designed to align with the thematic priorities of the Chinese “14th Five-Year National Comprehensive Disaster Prevention and Mitigation Plan” issued by the National Disaster Reduction Commission. This includes domains such as monitoring and early-warning systems, infrastructure resilience, emergency response capacity, material reserves, technological support, and community engagement. For instance, indicators related to early-warning stations and emergency shelters directly reflect the Plan’s directives on enhancing multi-source monitoring networks and shelter infrastructure. Moreover, The Sustainable Development Goals (SDGs) adopted by the United Nations in 2015 provide ideas and references for this study. The SDGs provide a unifying framework for achieving human well-being, environmental sustainability, and disaster resilience globally by 2030. A unifying framework is provided to achieve human well-being, environmental sustainability, and disaster resilience globally by 2030. Among the 17 goals, SDG 11 (Sustainable Cities and Communities), SDG 13 (Climate Action), and SDG 1 (End Poverty) explicitly emphasize disaster preparedness, mitigation, and resilience. They integrate the main targets and priorities of the Sendai Framework for Disaster Risk Reduction [
57]. Even though the SDGs are primarily intended to apply to the national level, many cities are referring to them and use the Disaster Resilience Scorecard for Cities [
58] as instrument for addressing disasters. Both the SDGs and the Disaster Resilience Scorecard for Cities are intended to promote integrated and forward-looking planning, through which the resilience of cities, in terms of infrastructure, social systems, and ecological barriers, can be enhanced to achieve sustainable development.
Disaster resilience is considered to be an instrument or precondition facilitating sustainability [
59]. A city’s ability to effectively recover from extreme events is fundamental to achieving its long-term sustainability. Investments in early warning systems, climate-resilient infrastructure, public health services, and inclusive social protection are not only key aspects of disaster risk management, but are directly linked to the core SDG objectives of eradicating poverty, improving health, and securing livelihoods. Therefore, the systematic assessment of SSD resilience from multidimensional perspectives, including environment, infrastructure, society, and economy, is considered important for ensuring consistency between local adaptation strategies and the global sustainability agenda.
In this study, the concept of SDG objectives is fully referenced in the construction of the SSD response capacity evaluation indicator system. Specifically, indicators such as medical resources, communication access, drainage infrastructure, land use structure, income level, and insurance coverage reflect both the technical preparedness of the city and the broader socio-economic and environmental resilience advocated by the SDG framework. By using an indicator system that matches the SDGs, scientific analysis has been made more systematic and based on a stronger theory. At the same time, the policy relevance of the results has been improved. This helps support the design of more sustainable and flexible coastal management strategies for cities.
Each indicator of vulnerability of disaster-bearing bodies has been carefully selected, with its significance explained below and supported by the relevant literature [
5,
30,
33,
34,
37,
38,
39,
40,
41,
44,
45,
47,
49,
50,
51,
52,
53,
54,
55,
56]. Tidal detection stations provide critical real-time data for storm surge monitoring and early warning, enabling timely disaster response. A higher number of mobile users indicates a greater capacity for rapid dissemination of information during emergencies. “Mobile phone subscribers” have been regarded as an indicator for communication accessibility and the capacity for rapid information dissemination during emergencies. For instance, regions with higher mobile phone subscription rates often demonstrate better performance in early warning reception, emergency coordination, and public response [
53,
54]. Higher expenditures on disaster prevention and control indicate stronger institutional capacity for both pre-disaster prevention and post-disaster response. The level of education expenditure reflects public awareness and knowledge of disasters, which indirectly enhances disaster response capacity. The “Coastline Coefficient” indicator represents the abundance of marine resources in terrestrial regions. It is calculated by dividing the coastline length (in kilometers) by the land area (in square kilometers).
The high population density in vulnerable zones increases exposure and response pressure. The proportion of the population aged 0–14 and over 65 represents a group with weaker mobility and greater sensitivity to disasters. The vulnerability of aquaculture areas to storm surge inundation represents potential economic losses, and serves as a test of the resilience of marine economies. Road mileage per unit land area indicates transportation accessibility, which is vital for emergency evacuation and aid delivery. Longer drainage systems suggest better urban flood mitigation capacity. High values of fishery output suggest potential economic vulnerability in coastal areas. A high reliance on fisheries implies greater exposure to marine hazards, such as storm surges. Theoretically, this reflects sectoral dependency vulnerability and socio-ecological sensitivity. Empirical studies have confirmed that cities with higher fishery output tend to suffer more severe economic losses and face longer recovery times after coastal disasters [
55,
56]. The primary industry is easily affected by climate, and areas with a high proportion have weaker disaster resistance capabilities. Therefore, it is necessary to strengthen the disaster prevention system. The tourism industry is highly sensitive to the environment, and disasters will lead to a rapid decline in the tourism economy, affecting regional economic stability.
Health-related indicators, which include the number of hospitals, beds, and doctors per 10,000 persons, measure the adequacy of the emergency healthcare infrastructure. The passenger and freight transport capabilities determine the efficiency of efficient coordination and evacuation of resources and supply to disaster areas during disasters, and are important indicators of logistical support. The more shelters there are, the stronger the city’s ability to accommodate disaster victims during disasters, reflecting the level of emergency reserves. The wide coverage of medical insurance can reduce the burden of post disaster medical care and improve residents’ ability to recover after disasters. The per capita disposable income of urban and rural residents reflects household-level adaptive capacity and financial resilience. The secondary industry is greatly affected by infrastructure, and is prone to work stoppages after disasters, while the tertiary industry is highly dependent on the environment and has a significant impact on service interruption after disasters. Its recovery capacity needs to be evaluated. Higher penetration indicates stronger financial resilience and disaster risk transfer capacity.
Among all disaster-bearing body indicators, only population density was calculated specifically within the 10 km buffer zone from the coastline, as the population within this zone is directly exposed to storm surge impacts and plays a passive role in the disaster system, lacking the capacity to support or respond to the event. Other indicators, such as emergency transportation capacity, medical resources, disaster shelters, and institutional mechanisms, reflect the overall DRC at the city level. These resources are not confined to the coastal zone but are spatially distributed across the urban area and can be rapidly mobilized during SSDs to support affected regions. Furthermore, although storm surges mainly affect coastal zones, the ability to respond depends on systems and resources located across the entire city behind coastal zones. Non-coastal parts of the city frequently provide logistical, economic, and administrative support during both the response and the recovery phases. Therefore, using mixed-scale data for the disaster-bearing body indicators provides a more comprehensive reflection of the overall resilience and coordination capacity of the urban system.
The spatial distribution of coastal areas and the types of shorelines are key factors influencing the resilience of coastal cities to storm surge hazards. The importance of land use and shoreline type in storm surge hazards has been noted in several studies [
29,
32,
33,
34,
42,
43,
47]. Coastal land use affects the vulnerability of urban areas and their response strategies. For example, urban construction land contains dense infrastructure, which faces a higher risk of property loss and greater difficulty in evacuation during storm surge events. Agricultural land is considered highly sensitive to seawater intrusion and salinization, which may result in long-term ecological and economic damage. By contrast, areas dominated by wetlands, forests, or mangroves are regarded as natural buffers, through which wave energy is absorbed and the extent of inundation is reduced. Therefore, land use is not only seen as a reflection of regional economic functions but is considered to influence the spatial distribution of disaster resistance and exposure. In this study, the evaluation of land use stability was conducted using the primary classification from the LUCC system developed by the Chinese Academy of Sciences. At the same time, the data were clipped to a 10 km inland buffer from the coastline, following the same rationale as the population indicator, as this area is directly exposed to storm surge impacts. On the other hand, there are significant differences in the resistance of different types of shorelines to storm surge erosion and wave impacts. For instance, rocky shorelines and mangrove shorelines usually have strong natural defenses, while muddy shorelines and aquaculture shorelines are more vulnerable to erosion and overtopping. Therefore, the type of coastline is an important parameter for assessing the stability of disaster incubating environment and developing coastal management strategies.
In summary, the stability of disaster incubating environment is determined by land use and shoreline characteristics, which are regarded as essential components in the construction of an urban storm surge resilience assessment framework.
The reasons for the selection of indicators related to the disaster causal factors are listed, and these indicators are mentioned in the relevant literature [
29,
31,
34,
35,
36,
45,
48].
During storm surge events, heavy rainfall is often observed, which increases coastal flood risk through surface runoff, and worsens urban waterlogging by expanding the inundation area. Therefore, annual precipitation is considered an important indicator. Maximum wind speed is regarded as a major driving factor in the formation of storm surges, as it determines the wind force on the sea surface and influences wave height, tide accumulation, and the destructive power of the hazard. Moreover, the number of days with wind speeds exceeding 10.8 m/s is used to reflect the frequency and persistence of strong wind events. Frequent occurrences are seen as an indication that coastal areas are regularly exposed to wind-driven processes, which may weaken natural defense systems and increase long-term vulnerability. The annual average of the highest tide height and maximum tidal height reflect the tidal level in the city during the year. If the annual mean maximum tide height is high, the buildup of storm surge on top of it is more likely to cause the over-topping of embankments, increasing the risk of urban inundation and infrastructure damage. Maximum tide heights are regarded as representations of the extremes reached by astronomical tides. When they are superimposed on peak storm surges, sea levels are significantly raised, which greatly increases the intensity of the disaster. The average elevation of a city is used to determine its base height relative to sea level. Lower elevations are more susceptible to seawater inundation and flooding, and elevation is regarded as a fundamental indicator in spatial zoning of exposure and geographic sensitivity analyses. Slope is used to assess the rate of surface runoff and the retention time of standing water. Flat areas are seen as more prone to waterlogging, while steep slopes are viewed as favorable for drainage. Therefore, this indicator is considered highly important in the simulation of inundation processes and the planning of drainage systems.
Although some indicators, such as annual precipitation, are not direct causal factors of storm surges, they are still included in this study because they significantly influence disaster response conditions and tend to compound the pressure on emergency response systems during storm surge events. This study does not aim to evaluate the physical severity of storm surges themselves, but rather focuses on assessing the overall disaster response capacity of coastal cities under storm surge scenarios. Therefore, the selection of indicators prioritizes factors that are most likely to influence response effectiveness during SSDs. The inclusion of such compound risk factors reflects a more realistic urban disaster context and supports a more comprehensive resilience evaluation.
Since key data are usually updated every 5 years, most of the data in this study are based on the 2020 data for model demonstration. In this study, the most relevant indicator data for coastal cities comes from the year 2020 for analysis and evaluation. A smaller subset of data, such as those related to coastlines and land use, is taken from the period between 2020 and 2023, as these factors are likely to change slowly. Much of the data on disaster-bearing bodies were obtained from the “China City Statistical Yearbook 2021” and announcements published on the official websites of municipal governments [
60]. A smaller portion of the data comes from local government responses and local news extracts obtained through a public application. Data related to disaster factors were sourced from the “Tide Table 2020” published in China and the National Oceanic and Atmospheric Administration (NOAA) of the United States, among others [
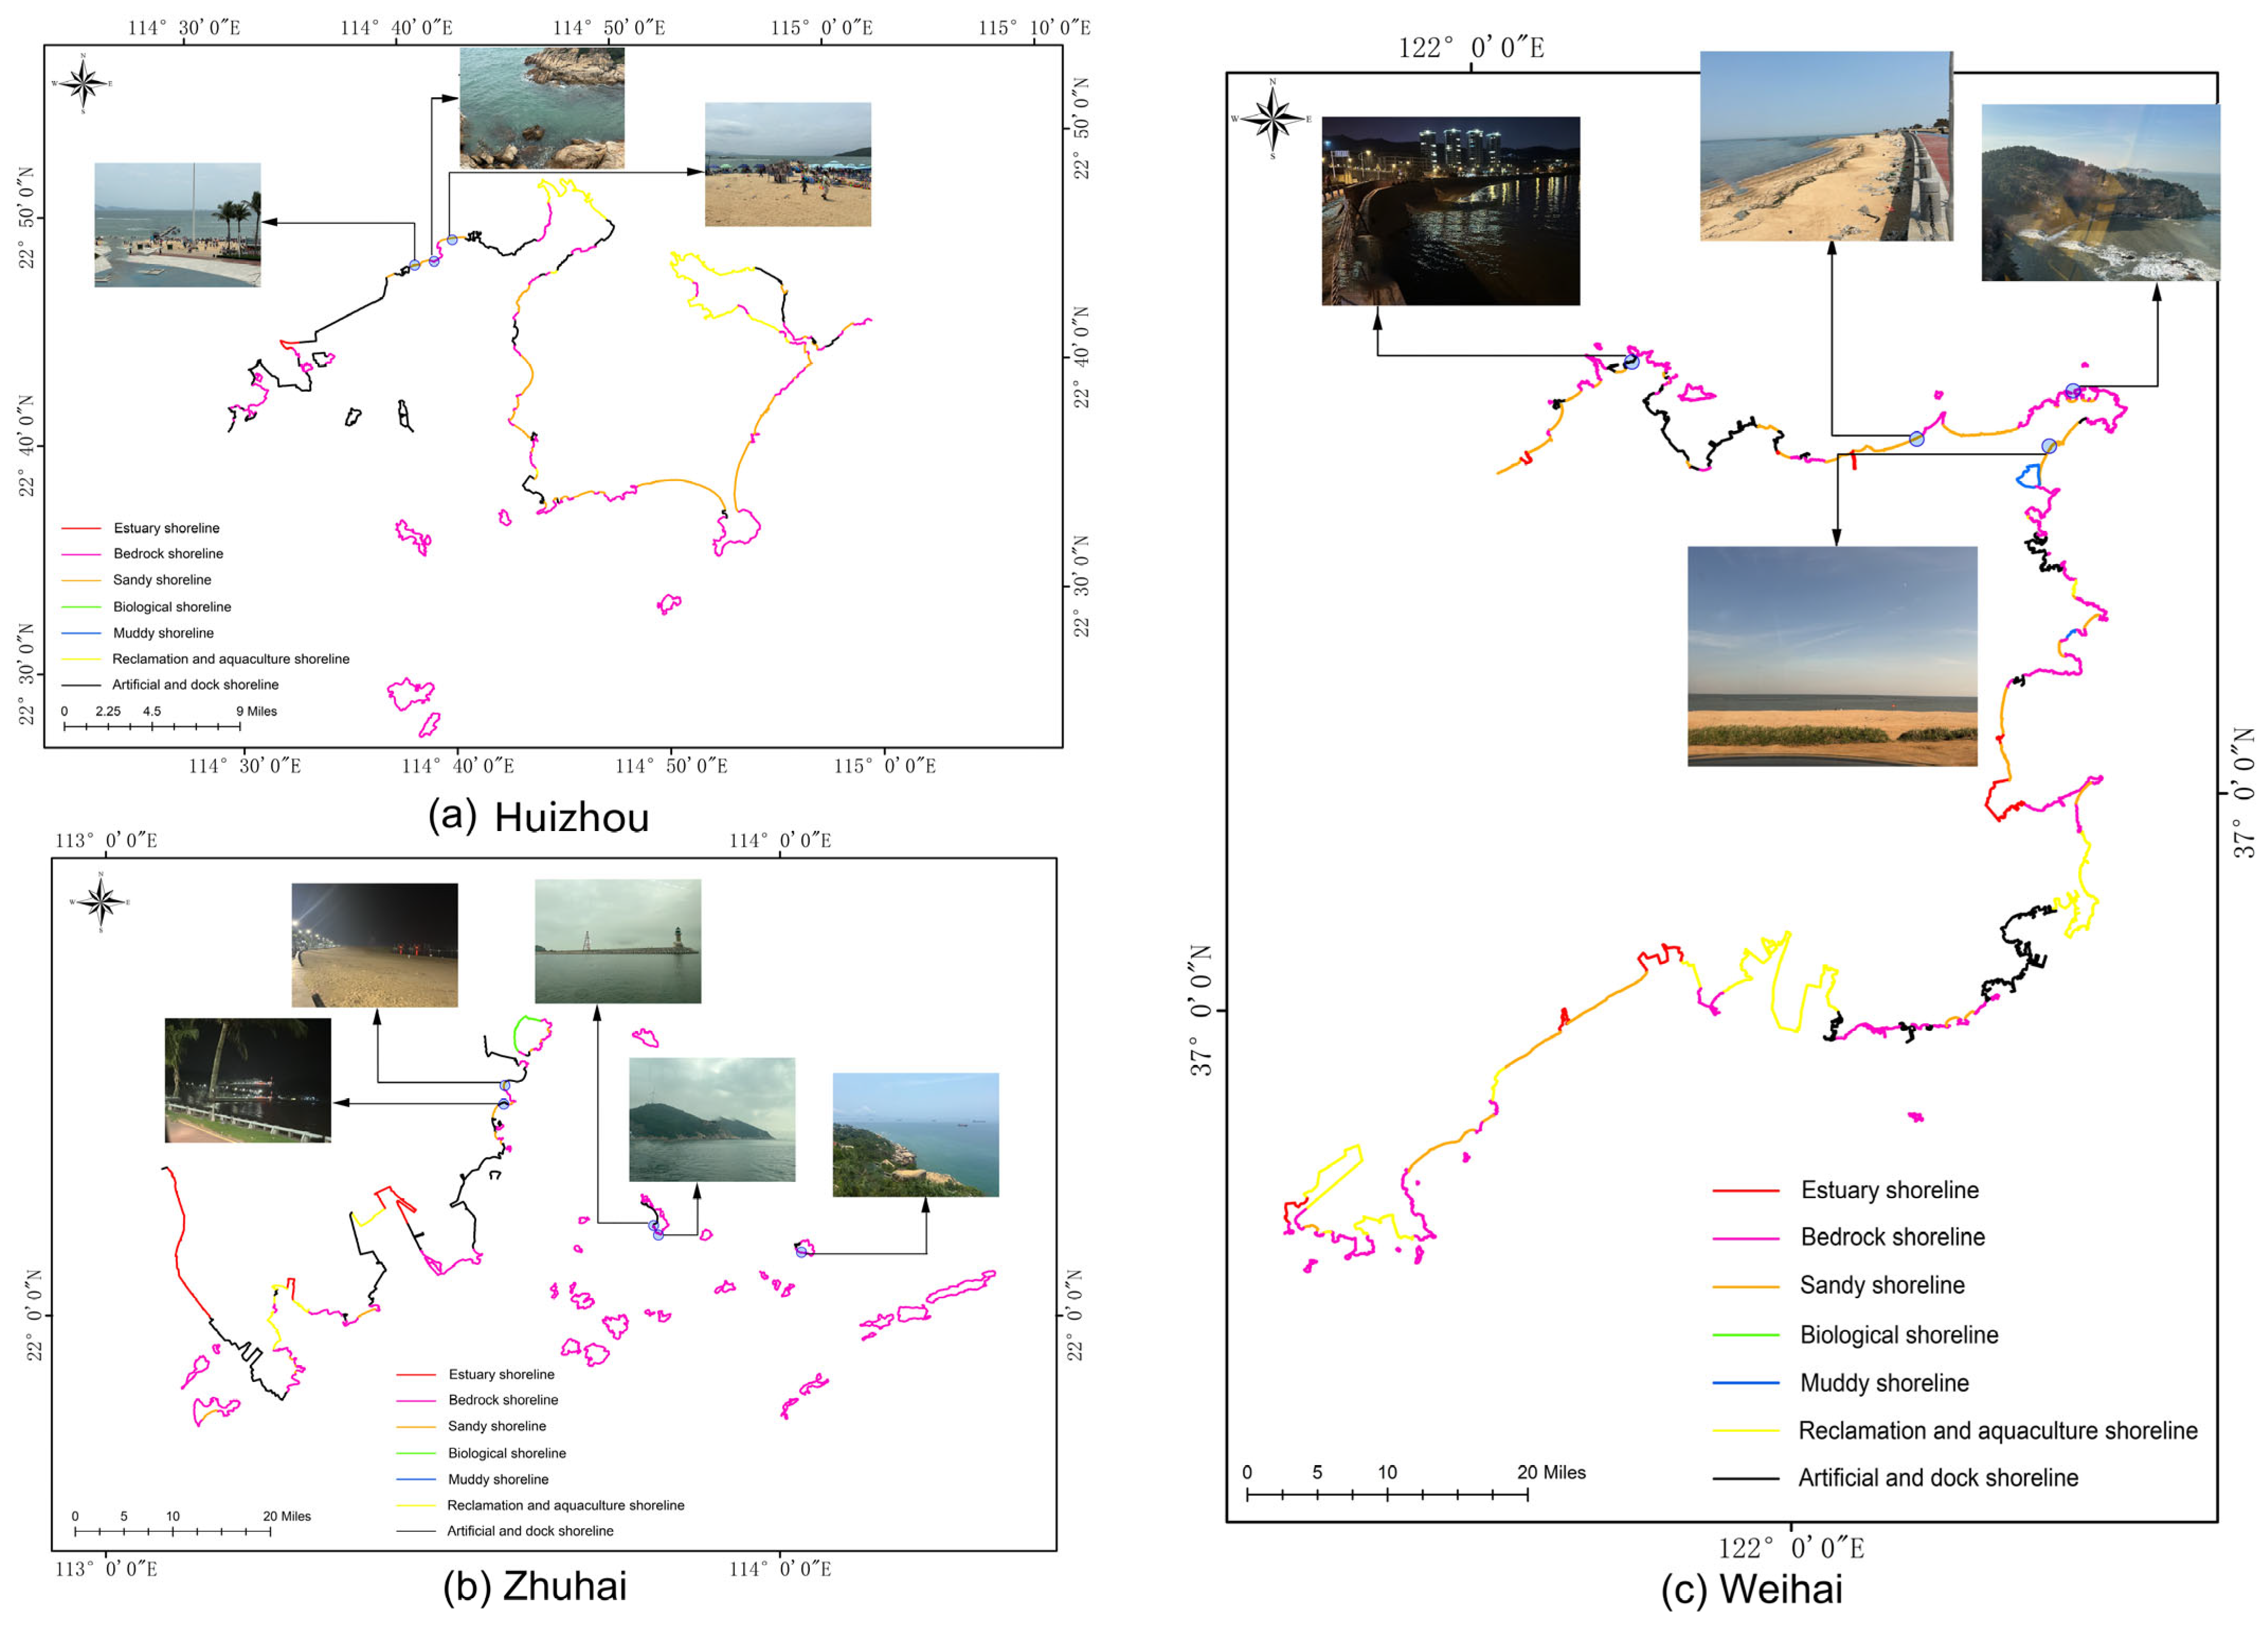
61]. For the indicators “The annual average of the highest tide height” and “Maximum tidal height”, the data were processed using the local mean sea level (MSL) as the vertical reference datum. During data acquisition and calculation, tide levels were adjusted relative to the MSL. The tidal reference datum for each city’s observation station is explicitly documented in the “2020 Tide Table” published by Chinese authorities. Coastal data relevant to the disaster-incubating environment were extracted through the GEE platform for remote sensing image analysis, supplemented by manual identification and on-site geolocation verification (
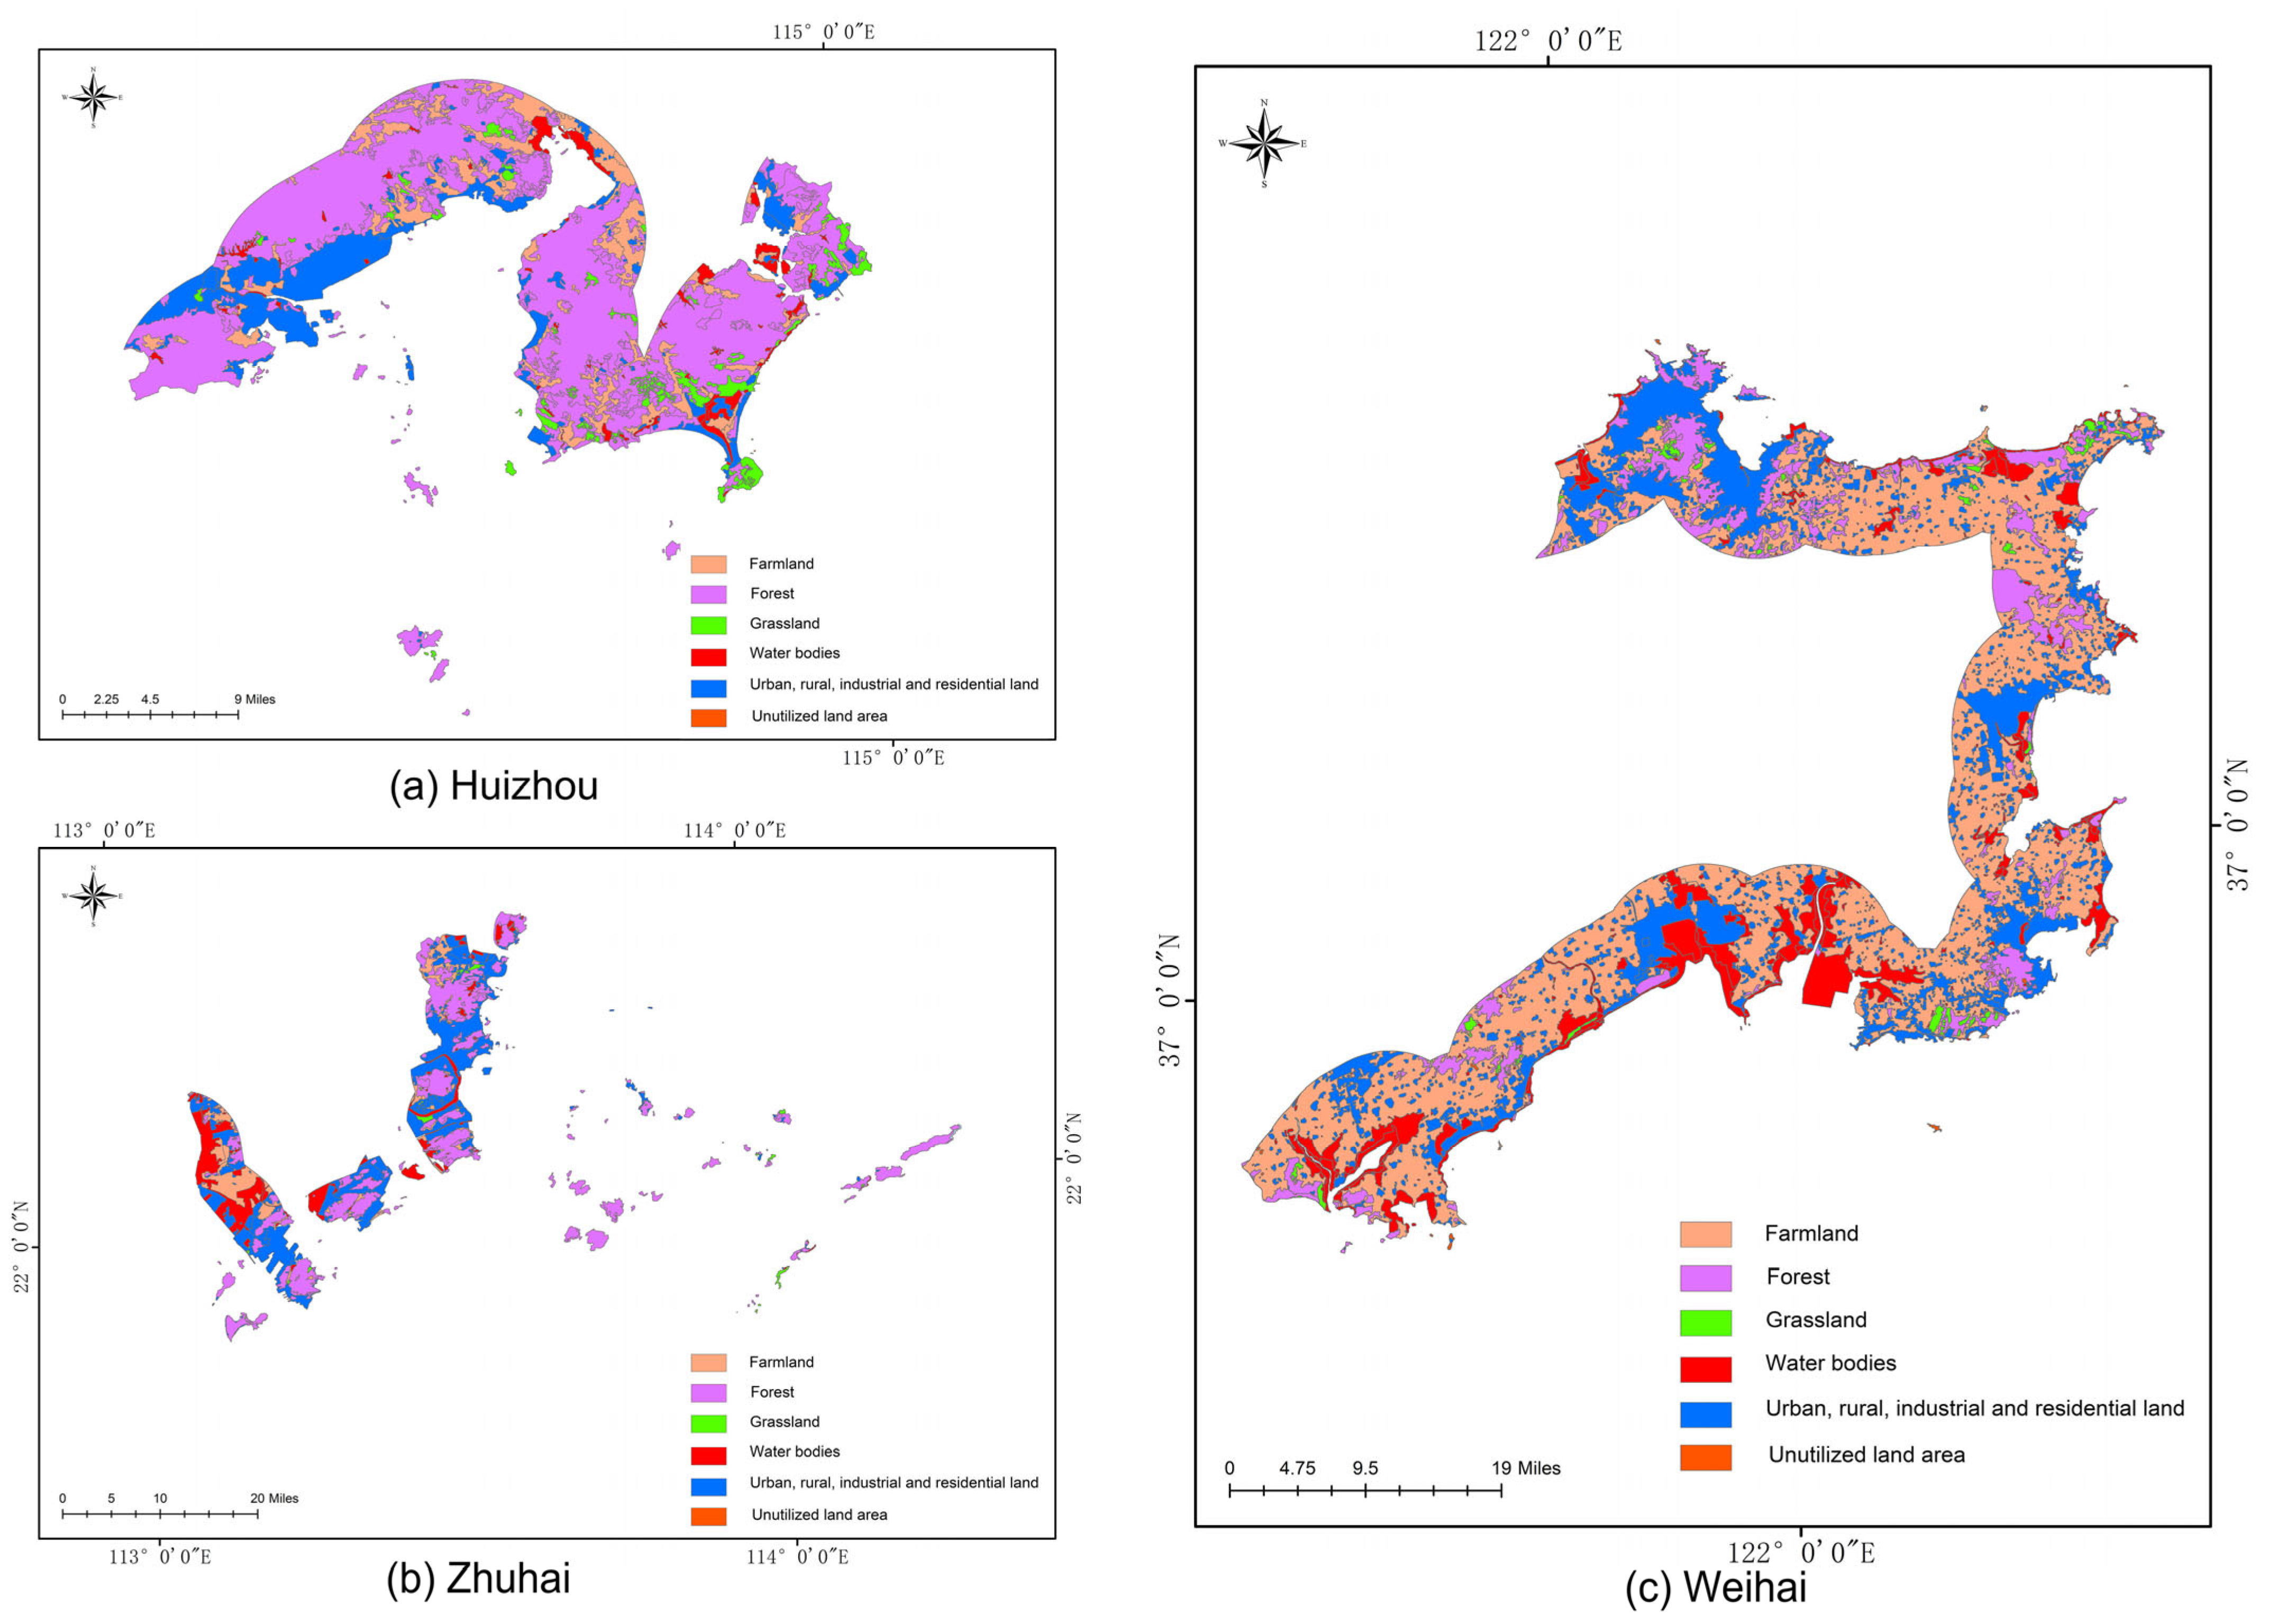
Figure 3). Land use data were sourced from the Institute of Geographic Sciences and Natural Resources Research at the Chinese Academy of Sciences and then processed using ArcGIS (
Figure 4). Due to space constraints, this paper only presents the visualization of remote sensing analysis of the coastline of Weihai, Zhuhai, and Huizhou, and a visual representation of the cropped land use data for Huizhou, Zhuhai, and Weihai.


