Abstract
The Beibu Gulf’s ocean circulation system regulates regional marine ecosystems, sediment transport, and coastal geomorphology while also supporting vital economic activities. This study integrates one-year current observations from four in-situ current observation stations (B1−B4) with simulations using the Regional Ocean Modeling System (ROMS) to characterize circulation dynamics in the gulf. Observations show persistent northward subtidal currents west of Hainan Island year-round, primarily sustained by tidal-induced residual currents. These currents briefly reverse southward during strong northerly wind events, whereas subtidal currents in the northern Beibu Gulf are more wind-dependent, showing pronounced seasonal variations. Numerical results confirm that winter circulation is dominated by a basin-wide cyclonic gyre driven by northeasterly monsoons. In summer, circulation in the northern gulf is cyclonic under southeasterly winds, but turns anticyclonic when southwesterly winds prevail, indicating strong sensitivity to summer monsoon wind direction. By combining multi-station observations and numerical simulations, this study provides a systematic characterization of the seasonal circulation of the oceanic system in the Beibu Gulf, offering new insights into its dynamic mechanisms.
1. Introduction
The Beibu Gulf is a semi-enclosed shelf sea in the northwestern South China Sea (17°–22° N, 105°–110° E) spanning approximately 130,000 km2 with a mean depth of 50 m, bordered by China and Vietnam (Figure 1). This region holds strategic importance due to its rich oil, gas, and biological resources. Despite decades of study, its complex circulation patterns remain controversial. Early efforts, such as the 1964 China–Vietnam Joint Oceanic Survey, outlined the Gulf’s key hydrodynamic features, but sparse observations and conflicting model results have hindered a consensus on its circulation mechanisms [1,2].
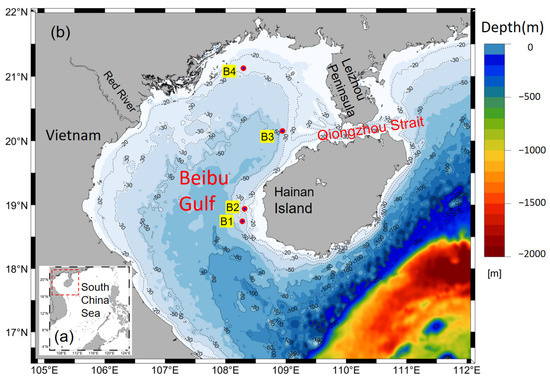
Figure 1.
(a) Geographical location map of the Beibu Gulf; (b) Bathymetry and observation stations in the Beibu Gulf. B1 to B4 are four in-situ current observation stations.
During winter (Dec−Feb), the Beibu Gulf is dominated by strong northeasterly monsoons, forming a basin-scale cyclonic circulation. High-salinity water (>34 PSU) from the open South China Sea enters the Gulf through the central and eastern bay mouth, then flows northward along the eastern coast of Hainan Island under the influence of northeasterly winds. Near ~20° N, this flow is deflected westward by the southward western boundary current and westward flow from the Qiongzhou Strait, eventually merging into the western coastal current that continues southward along the Vietnam coast [3,4,5]. While this forms the framework of winter cyclonic circulation, the relative influence of tidal mixing versus wind forcing remains debated [6]. Spring (Mar–May) circulation may exhibit a gulf-scale cyclonic pattern, with an enclosed cyclonic gyre in the north and an open cyclonic gyre in the south [5]. Recent model results further suggest that the northern and southern Gulf are governed by an enclosed and an open cyclonic gyre, respectively [7]. However, a major limitation of previous research has been the lack of long-term, multi-station oceanic current observations. Most studies have relied on short-term or single-season datasets, leading to inconsistent conclusions. For instance, the Qiongzhou Strait (QS), a key exchange pathway between the South China Sea (SCS) and Beibu Gulf, was traditionally thought to flow eastward in summer and westward in winter [5,6,8], but recent current measurements and models show predominantly westward flow year-round, with brief eastward reversals in spring [7,8,9]. The underlying mechanisms, such as tide-induced residual current, sea-level gradients, and monsoon winds, remain poorly understood.
Compared with winter, the circulation structure of the Beibu Gulf in summer (Jun–Aug) is more complex. Although southwesterly winds dominate, their weak intensity and variability contribute to diverse flow patterns. On the one hand, high-salinity water from the northwestern South China Sea continues to enter through the central and eastern parts of the bay mouth, but its path and extent vary under the influence of the southwesterly monsoon. On the other hand, waters along the western coast experience high temperatures and low salinity (<33 PSU) due to summer heating and freshwater runoff, forming a coastal current that flows southward from the northwestern coast [10,11].
There remains academic debate over the specific pattern of summer circulation in the Beibu Gulf. Some studies describe an anticyclonic surface circulation driven by the dominant southwesterly monsoon and enhanced river runoff along the Vietnamese coast [1,12], while others suggest a persistent cyclonic pattern shaped by wind-driven and density-driven circulation [13,14,15]. In recent years, researchers have employed more advanced numerical methods combined with dynamic field analyses to investigate the Gulf’s circulation mechanisms. These studies reveal that circulation is affected by multiple factors, including topography, waves, typhoons, open-sea water exchange, seawater density distribution, and river discharge [16,17,18]. Findings also suggest that in summer, the southern Gulf is dominated by an anticyclonic eddy, while the northern Gulf features a cyclonic gyre [9].
In summary, the Beibu Gulf exhibits complex and seasonally variable circulation influenced by multiple factors. The scarcity of long-term current velocity observations has limited understanding of its circulation structure and its seasonal dynamics. This study addresses these gaps by using year-long current observations from four ADCP stations (B1–B4) along with high-resolution Regional Ocean Modeling System (ROMS) simulations.
2. Materials and Methods
2.1. Field Observations and Data Processing
We deployed four ADCP (Acoustic Doppler Current Profiler) stations (B1–B4) to investigate the characteristics of tidal and subtidal currents in the Beibu Gulf. Stations B1 and B2 were located off the western coast of Hainan Island, Station B3 lay west of the Qiongzhou Strait, and Station B4 was in the northern Beibu Gulf (Figure 1). The water depths of the four stations ranged between 30 and 40 m. Detailed information, including geographical coordinates, water depths, observation periods, and measured parameters, is summarized in Table 1. Currents were recorded every 30 min, with each value representing the average of continuous sampling over at least 100 s. The current profile cell size was set to 1 or 2 m. Observations spanned multiple seasons to capture seasonal variations in oceanic currents.

Table 1.
Observation information and parameters.
Based on continuous ocean current observations, a filtering method was applied to separate astronomical tidal currents and low-frequency currents from the measured data. The measured currents were first decomposed into eastward and northward components, and each component was then filtered to remove near-inertial oscillations and tidal currents specific to the South China Sea, yielding the subtidal currents.
To isolate subtidal flows from the observed current data (which includes both astronomical tides and low-frequency currents), a low-pass filtering approach was employed. Given that the observation obtained was annual continuous data, the specific steps are as follows:
First, the observed currents were decomposed into eastward and northward components. Then, low-pass filtering was applied to each component [19]. The filter form is expressed as the following formula:
where x represents the time-series data, dt is the sampling interval, T is the cut-off period of the filter (40 h), and XF is the filtered data. The choice of the 40-h cut-off period was closely related to the regional inertial periods and tidal characteristics. The near-inertial period at the latitude of the current observation station was calculated using the formula for inertial periods (, where is the Coriolis parameter, is the angular velocity of the Earth’s rotation, and is the latitude). For the study area, the computed near-inertial period was approximately 37.2 h. Moreover, Diurnal tides typically had periods around 24 h (e.g., M2 tide had a period of about 12.42 h, and diurnal tides like K1 had periods near 23.93 h). By setting a 40-h cut-off period, the filter could suppress signals with periods shorter than 40 h, including diurnal tides and near-inertial oscillations (37.2 h). This ensured that the filtered data (XF) primarily retained the low-frequency subtidal flow components, preventing contamination from these higher-frequency motions.
XF = pl66tn (x, dt, T)
In addition to in-situ observations, hourly wind data from the European Centre for Medium-Range Weather Forecasts (ECMWF) ERA5 reanalysis dataset with a spatial resolution of 0.25° × 0.25° were used to analyze wind–current interactions. The data corresponded to the observation period and were obtained from the Copernicus Climate Data Store [20].
2.2. Model Setup and Configuration
This study employed the Regional Ocean Modeling System (ROMS) numerical model to simulate the dynamic environment of the Beibu Gulf [21]. A two-layer nested grid scheme was adopted to capture the circulation of the broader South China Sea. The outer grid (first layer) spanned 3°–27° N and 105°–125° E (Figure 1a), covering most of the South China Sea, with a horizontal resolution of approximately 5 km using a curvilinear orthogonal grid. The inner grid (second layer) covered 16.5°–22° N and 105.6°–121° E, including the Beibu Gulf and the deep-water area southeast of Hainan Island, with a resolution of approximately 1.5 km (Figure 1b). Model bathymetry was based on the global depth data from the General Bathymetric Chart of the Oceans (GEBCO), and the vertical domain was divided into 20 sigma layers. Atmospheric forcing was provided by ERA5 reanalysis dataset, including wind fields, sea surface air temperature and pressure, shortwave and longwave radiation, relative humidity, precipitation, and other variables at a temporal resolution of 1 h and spatial resolution of 0.25°×0.25°. Momentum, heat, and salt fluxes across the air–sea interface were calculated using the bulk formula in ROMS. The initial temperature–salinity field and boundary conditions for the first-layer grid were derived from the global HYCOM (Hybrid Coordinate Ocean Model) reanalysis (1/12°resolution), providing ocean forecast and reanalysis data for temperature, salinity, sea level, and momentum at model initialization [22]. The open-boundary data had a time step of one day and provided the same parameters. For the second-layer grid, boundary conditions such as sea level, temperature, salinity, and currents were inherited from the first-layer grid. In addition, tidal forcing was sourced from the TPXO global tidal model, which supplied ROMS with 13 tidal constituents, including semi-diurnal, diurnal, and shallow-water tides: MM, MF, Q1, O1, P1, K1, N2, M2, S2, K2, MN4, M4, and MS, with a spatial resolution of 1/30° [23].
Model performance was assessed using the Pearson correlation coefficient (R), root mean square error (RMSE), and model skill score (Skill), defined as the following formulae:
where and are observations and model results at the same time and location, the overbar is the mean of the data, and N is the total number of data points.
Table 2 summarizes the key validation metrics of the ROMS model at the four stations, including correlation (R), root mean square error (RMSE), and model skill (Skill) for water level and current velocity (eastward and northward components). High correlation values (R > 0.85 for most cases) and reasonable RMSE, along with high Skill scores, indicated that the ROMS model could effectively reproduce the observed water level and current velocity patterns, providing a reliable basis for subsequent analyses. Part of the model validation figures can be found in the Supplementary Materials.

Table 2.
Model verification results.
3. Results
3.1. Current off the Western Coast of Hainan Island
In the Beibu Gulf, circulation is seasonally driven by the northeast monsoon in winter and the southwest monsoon in summer. Accordingly, the period from October to March is defined as the winter half-year (northeast monsoon period), and from April to September as the summer half-year (southwest monsoon period) [24].
3.1.1. Winter Half-Year
During the winter half-year, currents at both Stations B1 and B2 were predominantly northward (Figure 2b–g), opposite to the prevailing northerly/northeasterly monsoon (i.e., winds blowing from north to south) (Figure 2a). Subtidal currents, however, flowed from south to north. At Station B1, the vertical distribution of mean current speeds across different layers (surface, 0.2H, 0.4H, 0.6H, 0.8H, bottom, and the vertically average, the “H” refers to the water depth at the observation station) was relatively uniform in some months (e.g., November 2021: 12.8 cm/s at the surface, 13.3 cm/s at 0.2H, and 11.6 cm/s at 0.4H). Although the vertical variation at Station B2 was more complex, the overall northward-directed reverse flow pattern remained (Figure 3).
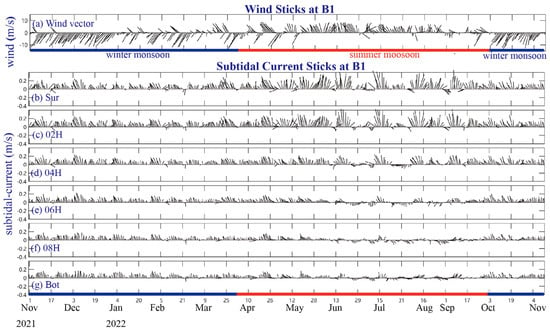
Figure 2.
(a) Daily-averaged wind vectors (ERA5 dataset) at Station B1; (b−g) Observed daily-averaged subtidal current vectors at Station B1, showing profiles at the surface, 0.2H, 0.4H, 0.6H, 0.8H, and bottom layers, respectively.
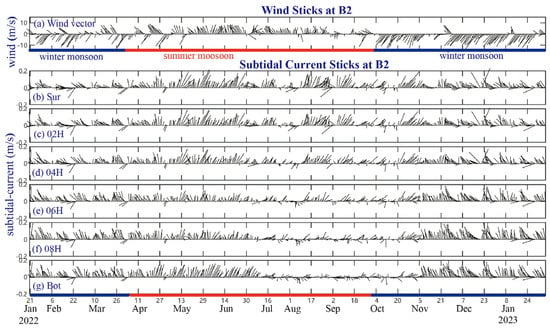
Figure 3.
(a) Daily-averaged wind vectors (ERA5 dataset) at Station B2; (b–g) Observed daily-averaged subtidal current vectors at Station B2, showing profiles at the surface, 0.2H, 0.4H, 0.6H, 0.8H, and bottom layers, respectively.
Maximum current speeds fluctuated at both stations. At B1, speeds were relatively low in January (19.9 cm/s at the surface) and increased significantly in March (up to 31.0 cm/s). At B2, surface speeds peaked at 33.4 cm/s in December 2022 and dropped to 14.9 cm/s in January 2023. Minimum speeds generally fell below 5 cm/s, indicating periods of weak flow.
Figure 4 presents rose diagrams of observed subtidal current vectors at Stations B1 and B2 for both the winter and summer half-years. During the winter half-year, subtidal currents at Station B1 (Figure 4a) predominantly flowed northwards (NNW, N, NNE), with the highest frequency in the N direction and current speeds mainly ranging from 0.05 to 0.2 m/s. At Station B2 (Figure 4c), currents also favored northern directions (NNW, N, NNE) but were more dispersed compared to B1, with the NNE direction most frequent and speeds mostly between 0 and 0.15 m/s.
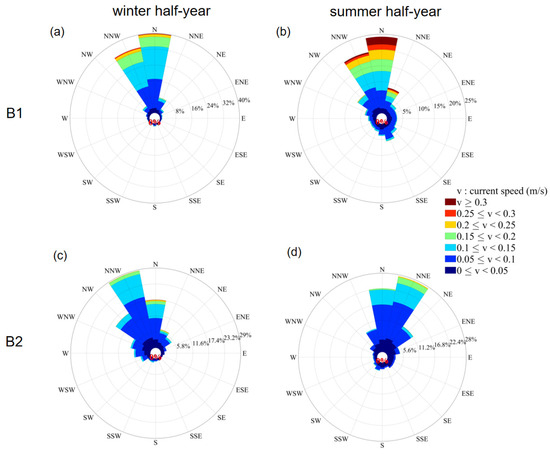
Figure 4.
Rose diagram of observed subtidal current vectors at (a) Station B1 during the winter half-year; (b) Station B1 during the summer half-year; (c) Station B2 during the winter half-year; (d) Station B2 during the summer half-year.
3.1.2. Summer Half-Year
Subtidal currents off the western coast of Hainan Island exhibited more complex characteristics in summer than in winter.
Both Stations B1 and B2 maintained a dominant northward flow, but current speeds and vertical distributions were more variable. At B1, maximum current speeds increased significantly, up to 47.3 cm/s in July and 49.1 cm/s in September. Vertical gradients became evident in most months (e.g., in June, surface mean speed reached 24.0 cm/s, while the bottom was only 5.8 cm/s), indicating strong vertical shear.
At B2, maximum current speeds were also relatively high in some months (e.g., 18.0 cm/s at the surface in August 2022 and 23.6 cm/s in October 2022). Mean current speeds showed significant vertical shear, and, although the flow remained northward, current directions were more dispersed compared to the winter half-year.
In the summer half-year, subtidal currents at Station B1 (Figure 4b) continued to flow predominantly northward (N, NNW, NNE), though with some changes in frequency distribution. The N direction remained the most frequent, and current speeds covered a wider range, including higher values (e.g., 0.15–0.3 m/s). At Station B2 (Figure 4d), currents were also mainly oriented northward and northeastward (N, NNE, NE), with NNE dominant. Similar to B1, current speeds at B2 spanned a broader range than in the winter half-year, reflecting more dynamic summer conditions. Overall, both stations exhibited a persistent northward flow tendency across seasons, though the directional frequencies and current speed ranges differed between winter and summer. In summary, subtidal currents off the western coast of Hainan Island at Stations B1 and B2 were consistently northward throughout the year, with no significant seasonal reversal in the main flow direction.
3.2. Current Structure in the Northern Beibu Gulf
This section focuses on the observation stations in the northern Beibu Gulf (see Figure 1). We analyzed the seasonal variation patterns of subtidal currents using multi-layer subtidal current vector data from Stations B3 and B4 (see Figure 5 and Figure 6) and subtidal current rose diagrams for the winter and summer half-years (see Figure 7), aiming to characterize the regional circulation structure.
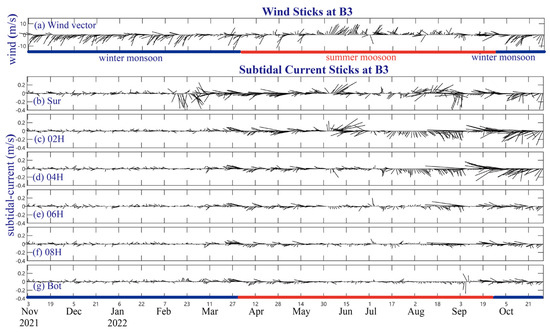
Figure 5.
(a) Daily-averaged wind vectors (ERA5 dataset) at Station B3; (b–g) Observed daily-averaged subtidal current vectors at Station B3, showing profiles at the surface, 0.2H, 0.4H, 0.6H, 0.8H, and bottom layers, respectively.
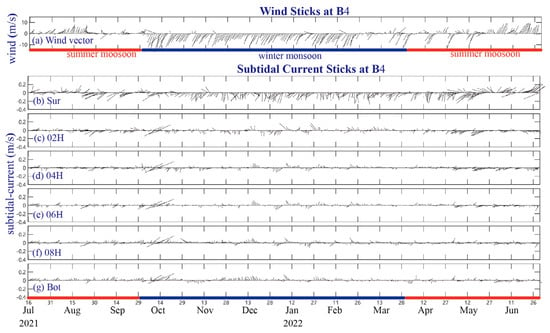
Figure 6.
(a) Daily-averaged wind vectors (ERA5 dataset) at Station B4; (b–g) Observed daily-averaged subtidal current vectors at Station B4, showing profiles at the surface, 0.2H, 0.4H, 0.6H, 0.8H, and bottom layers, respectively.
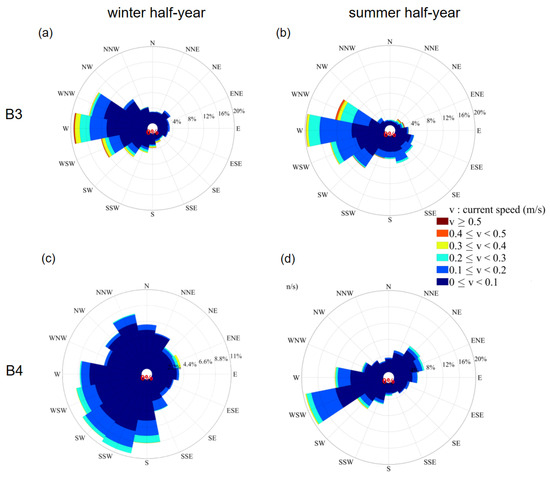
Figure 7.
Rose diagram of observed subtidal current vectors at (a) Station B3 during the winter half-year; (b) Station B3 during the summer half-year; (c) Station B4 during the winter half-year; (d) Station B4 during the summer half-year.
3.2.1. Winter Half-Year
The winter subtidal current rose diagram at Station B3 (Figure 7) shows dominant flow directions concentrated in the west-northwest sector (WNW, W, WSW), with the highest frequency towards the west (W). Current speeds primarily ranged from 0.1 to 0.3 m/s. According to the subtidal current vector time series (Figure 5), under the influence of the winter northerly monsoon, subtidal currents flowed westward or northwestward. Vertically, flow directions from the surface to the upper-middle layers (0.2H–0.6H) were highly consistent. The bottom layer showed a slight southwestward deflection due to seabed friction, but the overall flow remained west-northwestward. Velocity differences between surface and bottom layers were minor: surface velocities peaked at 35 cm/s (mean 8.2 cm/s), while bottom velocities reached up to 25 cm/s (mean 6.5 cm/s).
At Station B4, the winter current rose diagram (Figure 7) shows a wide dispersion of flow directions, with dominant sectors from south (S) to west (W) and north-northwest (NNW) sectors. Current speeds were primarily between 0.1 and 0.3 m/s. Combined with the vector time series (Figure 6), the results indicate that the Beibu Gulf is dominated by northerly winds. Observations revealed that the surface subtidal current at Station B4 generally aligned with the winter wind direction, showing a southward tendency. In contrast, the middle and bottom layers displayed markedly different velocity directions, characterized by northward transport against the prevailing wind. This vertical reversal is likely caused by “compensation currents” in the Guangxi coastal region, where northward flow in the deeper layers replenishes the water removed by the southward surface flow.
3.2.2. Summer Half-Year
In the summer half-year, the subtidal current rose diagram at Station B3 (Figure 7b) showed similarly dispersed flow directions as in winter, with high-frequency flows in the WSW-W-WNW sector, indicating dominant westward transport. Although NNE and NE flows were less frequent, occasional strong events in these directions suggest transient dynamic disturbances within the summer circulation.
The subtidal current vector time series (Figure 5) revealed a distinct phased circulation pattern, which was caused by the weak summer monsoon in 2022. From April to May, the westward flow pattern persisted from the winter season. Around June 15, intensifying southerly winds triggered a strong northeastward current in the surface and 0.2H layers, with peak velocities reaching 0.38 m/s. This wind-induced current showed vertical attenuation. The surface and subsurface layers responded quickly. In contrast, changes in flow direction and velocity in the middle (0.4H–0.6H) and bottom (0.8H) layers were delayed.
At Station B4, the summer rose diagram (Figure 7d) reveals a significantly decreased dispersion in subtidal current directions, presenting a bimodal concentration in the southwest-northeast direction. Currents in the W-WSW and SW directions accounted for approximately 40%, while NE and ENE flows represented 15%. Overall, the southwestward currents dominated. Velocity ranged from 0.1 to 0.4 m/s with low-velocity flows (0–0.2 m/s) comprising more than 60%, reflecting a seasonal pattern dominated by weak currents.
An analysis of the subtidal current vector time series (Figure 6) reveals clear phased responses in the circulation system. From July to September 2021, the summer monsoon was weak. This resulted in highly dispersed subtidal current directions, with flow patterns fluctuating across layers and no dominant trends emerging. During April–May 2022, weak southerly winds and occasional strong northerly events drove southwestward transport at Station B4, though with poor vertical consistency. In June, as the summer monsoon intensified, surface subtidal currents responded rapidly, showing a pronounced northeastward deflection (maximum velocity of 0.35 m/s). However, currents below the surface showed limited response and occasionally moved opposite to the surface flow. The middle and lower layers (0.4H to bottom) were constrained by dynamic factors such as water mass inertia and seabed friction, resulting in significant deviations from surface flow. Vertical flow reversal occurred in approximately 40% of the observation period, highlighting strong stratification between wind-driven surface circulation and inertia-dominated deeper-layer flow in the summer circulation regime.
3.3. Circulation Structure of the Beibu Gulf Under Different Monsoon Conditions
The circulation structure of the Beibu Gulf is significantly influenced by seasonal monsoons, with distinct patterns during the winter and summer monsoon periods. Based on both observational and simulation results, this section analyzes the circulation characteristics under each monsoon regime.
During the winter monsoon, northeasterly winds dominated the Beibu Gulf’s dynamics. Wind vectors at Station B1 (Figure 8a) indicated a persistent northeasterly wind from February 19 to 27, which drove the ocean circulation’s response and adjustment. Layered observations of the north-south subtidal current at Station B1 (surface, 0.6H middle layer, bottom, and vertical average) showed the following:
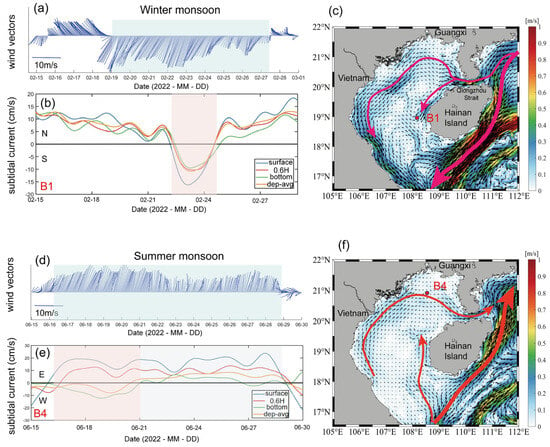
Figure 8.
(a) Wind vectors during winter northerly wind events; (b) Subtidal currents at Station B1 (surface, 0.6H, bottom, and depth-averaged layers) during the winter northerly wind events. Positive values indicate northward flow, while negative values indicate southward flow; (c) Vertically averaged flow field in the Beibu Gulf during the northerly wind period. (d) Wind vectors during summer southerly wind events; (e) Subtidal current at Station B4 (surface, 0.6H, bottom, and depth-averaged layers) during the summer southerly wind events. Positive values indicate northward flow, while negative values indicate southward flow; (f) Vertically averaged flow field in the Beibu Gulf during the southerly wind period.
From February 15 to 22, all layers displayed a stable northward flow with velocities up to 15 cm/s. From February 22 to 25, under intensified northeasterly winds, currents temporarily reversed southward, though velocities remained at 15 cm/s. After the wind weakened, currents resumed their northward direction, directly reflecting the monsoonal influence on current direction (Figure 8b).
The vertically averaged current field from February 22 to 25 (Figure 8c) shows a strong westward flow through the Qiongzhou Strait, driven by the coastal current of the South China Sea. On the western side of the Qiongzhou Strait, the current splits into two branches. One branch extends northwest. It forms a cyclonic circulation in the northern Beibu Gulf. Then, it turns southward along Vietnam’s coast. The other branch flows southward along the west coast of Hainan Island. This caused the local current at Station B1 to shift from northward to southward. These findings confirm that winter monsoonal northerly wind events significantly shape the circulation structure. The Beibu Gulf circulation responds strongly to weather-scale northerly wind events, reflecting dynamic adjustments driven by short-term wind forcing.
During the summer monsoon, southwesterly winds dominated. Wind vectors at Station B4 (Figure 8d) showed persistent southerly winds from June 15 to 29, resulting in layered and stage-wise circulation patterns:
From June 15 to 21, subtidal currents showed vertical stratification: the surface and mid-depth (0.6H) layers flowed eastward (up to 30 cm/s and ~10 cm/s, respectively), while the bottom layer flowed westward. After June 21, all layers shifted to uniform eastward flow, reflecting the summer monsoon’s effect on flow stratification (Figure 8e).
Simulation results revealed that southwesterly winds drove a anticyclonic circulation in the northern Beibu Gulf (Figure 8f). The western coastal current flowed northward along the Vietnam coast, turned east near Station B4, and extended into the Qiongzhou Strait, demonstrating how the summer monsoon dynamically shapes the regional anticyclonic circulation.
Figure 9c,d show the numerically simulated, vertically averaged circulation patterns in the Beibu Gulf for winter and summer half-years. In winter, the gulf exhibited a distinct cyclonic circulation structure (Figure 9c). Driven by prevailing northeasterly winds (Figure 9a), a strong South China Sea western boundary current developed east of Hainan Island, flowing southwestward. Upon entering the Beibu Gulf, a small branch of this current turned northward west of Hainan Island, following the direction of the tidal subtidal currents. In the area about north of 19° N, this branch split into two parts. One part flowed northwestward through the central Beibu Gulf. It formed a cyclonic circulation together with the Vietnam coastal current. The other part continued northward along the western coast of Hainan Island. Then, it turned northwest near the Qiongzhou Strait. It formed another cyclonic gyre together with the Guangxi coastal current. The simulated winter circulation aligns with previous studies, confirming it as a typical winter pattern in which subtidal currents west of Hainan Island play a key role.
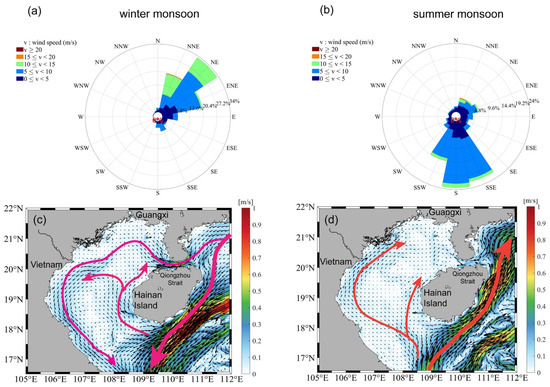
Figure 9.
(a) Wind rose diagram of winter monsoon in the Beibu Gulf (winter half-year of 2022); (b) Wind rose diagram of summer monsoon in the Beibu Gulf (summer half-year of 2022); (c) Vertically averaged circulation in the Beibu Gulf in winter half-year; (d) Vertically averaged circulation in the Beibu Gulf in summer half-year.
Figure 8c depicts the circulation in the Beibu Gulf during a strong winter northerly wind event, while Figure 9c illustrates the mean circulation structure under the winter monsoon. A comparison reveals notable similarities: both exhibited east-to-west flow through the Qiongzhou Strait and a cyclonic circulation pattern in the northern and western gulf. The key difference lies in the coastal current west of Hainan Island: during the strong northerly wind event, the current flowed southward, whereas in the winter-half-year mean flow field, it flowed northward.
Figure 8f illustrates the circulation structure of the Beibu Gulf under southwest monsoons, while Figure 9d depicts the summer half-year averaged flow field. The two circulation patterns differed significantly. Under southwest winds, the Beibu Gulf circulation generally exhibited a basin-scale anticyclonic circulation (Figure 8f), which only closed in the northern gulf due to the northward coastal current west of Hainan Island. In contrast, the summer-averaged flow field (Figure 9d) indicated a less stable circulation. Driven by prevailing southerly winds (Figure 9b), the South China Sea western boundary current east of Hainan Island flowed northeastward from the southwest. A branch entered the central Beibu Gulf, moved northward along its western margin, and weakened off the Guangxi coast. Although subtidal currents west of Hainan Island were weaker than in winter, they still maintained a northward direction. Seasonal mean model results further showed northward subtidal currents on both the western and eastern sides of the gulf, albeit reduced velocities compared to winter.
4. Discussion
4.1. The Mechanism of the Northward Flow off the Western Coast of Hainan Island
The direction of subtidal currents west of Hainan Island plays a critical role in shaping the overall circulation structure of the Beibu Gulf. Year-round observations at Stations B1 and B2 show that subtidal currents in the offshore waters west of Hainan generally flowed northward throughout the year. Even under winter northerly winds, the subtidal currents at both stations generally flowed northward, counter to wind direction, only reversing southward during strong northerly wind events (e.g., in February 2022). In summer, the influence of southerly winds further reinforced this northward trend. The northward coastal current contributes directly to the formation of the wintertime cyclonic circulation in the Beibu Gulf. Therefore, further research is needed to understand the mechanisms sustaining this northward flow west of Hainan Island.
Figure 10 presents the time-series curves of tidal and subtidal currents averaged along the north-south vertical transects at Stations B1 and B2. The subtidal current intensity shows a strong correlation with the spring and neap tides. Specifically, at Station B2, enhanced northward subtidal currents coincided with spring tides, while during the neap tides, the currents weakened or even reversed. This pattern suggests that the subtidal current may be a tide-induced flow driven by nonlinear effects during tidal wave propagation. Wavelet power spectrum analysis, used to examine the energy distribution of signals in the time-frequency domain, was applied in this study to analyze the power spectra of the observed north-south tidal and subtidal currents, as shown in Figure 11. At both stations, the tidal currents exhibited a significant period of approximately 1 day, consistent with the diurnal tidal regime in this region. The power spectrum of the subtidal currents showed an obvious ~14-day period, corresponding closely to the spring–neap tidal cycle. Although subtidal currents in the winter half-year are driven northward against the prevailing southward winter monsoon winds, their vertical structure and speed fluctuations are significantly influenced by factors such as the tidal cycle. This indicates a distinct dynamic response to the combined effects of the monsoon and tides.
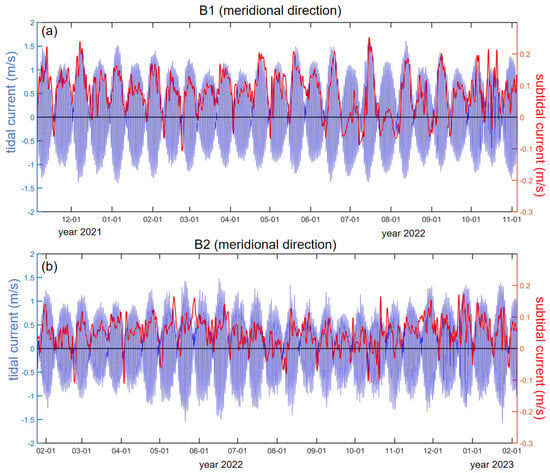
Figure 10.
Depth-averaged tidal current and subtidal currents in the meridional (north-south) direction at (a) Station B1 and (b) Station B2.
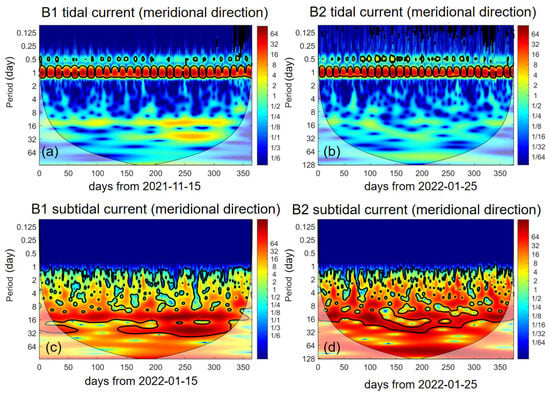
Figure 11.
Wavelet power spectra of tidal currents (a,b) and subtidal currents (c,d) in the north-south direction at Station B1 and Station B2. Color bar numbers represent normalized power spectral density.
Figure 12a,b depict the tidal-induced residual currents averaged vertically during spring tide and neap tide, respectively. During spring tide, the tidal-induced residual currents showed relatively stronger intensities and more complex spatial patterns, especially in the Qiongzhou Strait and around the Hainan Island. The direction of the tidal-induced residual currents during spring tide is characterized by a notable northward flow along the western coast of Hainan Island, accompanied by a weak cyclonic circulation in the northern part of the gulf. In contrast, the neap tide residual currents are generally weaker and the flow structures are more subdued.
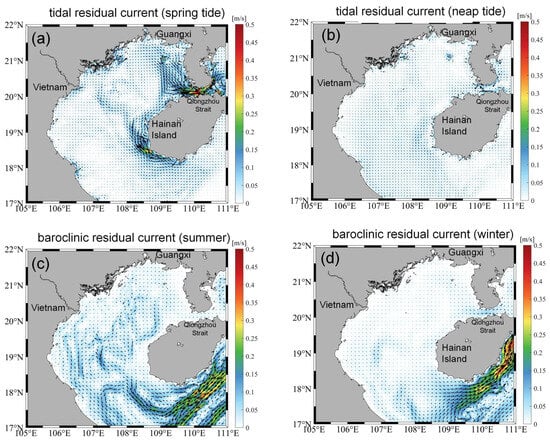
Figure 12.
(a) Vertical-averaged tidal-induced residual current during spring tide; (b) Vertical-averaged tidal-induced residual current during neap tide; (c) Vertical-averaged baroclinic residual current in summer; (d) Vertical-averaged baroclinic residual current in winter.
Figure 12c,d illustrate the baroclinic residual currents averaged vertically in summer and winter. A notable feature is that in the outer area of the Beibu Gulf, the baroclinic currents on the southeast side of Hainan Island show opposite directions in winter and summer. Within the Beibu Gulf, the summer baroclinic circulation is slightly stronger than that in winter. However, the baroclinic-induced circulation is very weak in the coastal area of Hainan Island (with water depth less than 30 m) and in the Qiongzhou Strait. This further confirms that the baroclinic effect is not the dominant driver of the northward residual current west of Hainan Island. Instead, the above analysis indicates that the northward subtidal current in this region is primarily modulated by tidal processes.
4.2. Diverse Circulation Structures of the Beibu Gulf in the Summer Half-Year
The summer circulation structure of the Beibu Gulf has been a subject of ongoing debate, with three prevailing views: a basin-scale anticyclonic circulation, a basin-scale cyclonic circulation, and a two-gyre system featuring a cyclonic gyre in the north and an anticyclonic gyre in the south [11]. Different studies support different structures, primarily due to the lack of long-term in-situ current observations.
Using long-term current measurements from Station B3 (west of the Qiongzhou Strait) and Station B4 (northern Beibu Gulf), this study shows that the summer circulation structure in the northern Beibu Gulf is predominantly cyclonic. Statistical results from Figure 7b,d show that, during the summer half-year, subtidal currents at Station B3 were primarily westward (20%), west-southwest (14%), and west-northwest (12%), with westerly components accounting for about 46%. At Station B4, dominant directions included west-southwest (18%), west (12%), and southwest (8%), with southwestward components totaling about 38%. These subtidal current directions, combined with the stations’geographic locations, indicate a cyclonic circulation structure in the Beibu Gulf during summer.
However, both observations and numerical simulations at Station B4 under typical summer southwesterly winds reveal an anticyclonic circulation structure, suggesting the possible coexistence of cyclonic and anticyclonic structures during summer. Figure 13a,c depict southeasterly summer monsoon wind fields, while Figure 13b,d show the corresponding current fields. Notably, the northern Beibu Gulf exhibits a distinct cyclonic circulation under southeasterly winds, whereas southwesterly winds induce an anticyclonic pattern (Figure 9d). This indicates that different summer monsoon directions (southwesterly vs. southeasterly) lead to opposite circulation patterns. Therefore, discrepancies in simulation timeframes may account for the contrasting circulation structures reported in previous studies, underscoring the critical role of monsoon direction in shaping summer circulation in the Beibu Gulf.
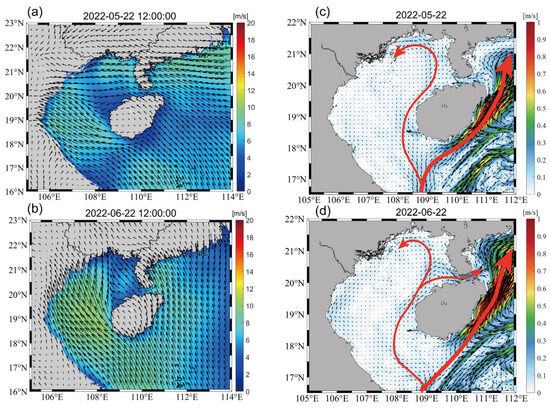
Figure 13.
Cyclonic circulation structure of the Beibu Gulf in summer. (a) Wind field over the Beibu Gulf on 22 May 2022; (b) Vertically averaged circulation on 22 May 2022; (c) Wind field over the Beibu Gulf on 22 June 2022; (d) Vertically averaged circulation on 22 June 2022.
5. Conclusions
This study investigates the circulation characteristics of the Beibu Gulf by integrating long-term current observations from four ADCP stations (B1–B4) with high-resolution simulations using the Regional Ocean Modeling System (ROMS).
Observations revealed persistent year-round northward subtidal residual currents west of Hainan Island, primarily driven by tidal dynamics, as indicated by their 14-day periodicity aligned with the spring-neap tide cycles. These currents only briefly shift southward during intense winter northerly wind events (e.g., February 2022). In the northern Beibu Gulf, subtidal currents show pronounced seasonal variations: winter is characterized by westward-dominated flows (0.1–0.3 m/s) at Station B3 and vertical flow reversals at Station B4 (surface southward, mid-bottom northward), while summer exhibits bimodal southwest-northeast circulation, with wind-driven eastward surface currents (up to 0.38 m/s) and inertia-maintained westward subsurface flows.
Numerical simulations confirmed that winter circulation forms a basin-scale cyclonic gyre driven by northeasterly monsoons, with westward flows through the Qiongzhou Strait interacting with a northern cyclonic cell. These results align with observations and highlight the combined influence of monsoon forcing and tide-induced residual currents. Summer circulation varies with wind direction: southeasterly winds generate a northern cyclonic gyre, while southwesterly winds produce an anticyclonic structure (e.g., June 2022 simulation). This resolves long-standing debates by identifying monsoon wind direction as the primary driver of summer circulation polarity.
By integrating multi-station observations and numerical modeling, this study addresses gaps in long-term circulation data, clarifying the mechanism of tide-driven year-round northward currents west of Hainan Island and the summer circulation’s response to monsoon winds. The findings offer new insights into shelf–sea circulation dynamics and support ecological management efforts in the ecologically sensitive Beibu Gulf, such as nutrient transport and pollutant dispersion forecasting.
Supplementary Materials
The following supporting information can be downloaded at: https://www.mdpi.com/article/10.3390/w17162365/s1, Figure S1: Water Level Validation for Station B1 from November 2021 to April 2022; Figure S2: Water Level Validation for Station B1 from April 2022 to September 2022; Figure S3: Water Level Validation for Station B2 from April 2022 to September 2022; Figure S4: Water Level Validation for Station B3 from June 2022 to March 2023; Figure S5: Verification of Depth-Averaged Flow Velocity and Direction at Station B1 in March 2022; Figure S6: Verification of Depth-Averaged Flow Velocity and Direction at Station B1 in February 2022.
Author Contributions
Conceptualization, G.L. and N.Z.; methodology, G.L.; software, G.L.; validation, G.L., N.Z., and Y.Y.; formal analysis, G.L.; investigation, G.L.; resources, G.L.; data curation, G.L.; writing—original draft preparation, G.L.; writing—review and editing, N.Z., Y.Y., and C.W.; visualization, G.L.; supervision, C.W.; project administration, C.W.; funding acquisition, C.W. All authors have read and agreed to the published version of the manuscript.
Funding
The works presented in this paper is financially sponsored by the Research Innovation Fund of Tianjin Research Institute for Water Transport Engineering, Ministry of Transport, China, grant number TKS20230108; and the National Key Research and Development Program of China, grant number 2023YFB2603803.
Data Availability Statement
Data are contained within the article.
Acknowledgments
We sincerely thank the three reviewers and editors for their valuable comments and dedicated efforts that have significantly improved this manuscript.
Conflicts of Interest
Author Gongpeng Liu was employed by the company POWERCHINA Zhongnan Engineering Corporation Limited. The remaining authors declare that the research was conducted in the absence of any commercial or financial relationships that could be construed as a potential conflict of interest.
References
- Science and Technology Committee of the People’s Republic of China (STCPRC). Reports of Sino—Vietnamese Joint Comprehensive Marine Survey in the Beibu Gulf; Science and Technology Committee of the People’s Republic of China: Beijing, China, 1964.
- Tan, G.H. Preliminary analysis of hydrologic structure and hydrologic feature in the sea region of the Beibu Gulf. Trans. Oceanol. Limnol. 1987, 4, 7–15, (In Chinese with English Abstract). [Google Scholar]
- Gao, J.; Shi, M.; Chen, B.; Guo, P.; Zhao, D. Responses of the circulation and water mass in the Beibu Gulf to the seasonal forcing regimes. Acta Oceanol. Sin. 2014, 33, 1–11. [Google Scholar] [CrossRef]
- Chen, Z.H.; Qiao, F.L.; Xia, C.S.; Wang, G. The numerical investigation of seasonal variation of the cold water mass in the Beibu Gulf and its mechanisms. Acta Oceanol. Sin. 2015, 34, 44–54. [Google Scholar] [CrossRef]
- Zu, T.T. Analysis of the Current and Its Mechanism in the Gulf of Beibu. Master’s Dissertation, Ocean University of China, Qingdao, China, 2005. (In Chinese with English Abstract). [Google Scholar]
- Zhang, G.R.; Pang, W.R.; Lan, J. The characteristics of the volume transport in spring and winter in the northern and eastern Beibu Gulf. In The Essay Collection of the Researches on the Ocean Science in the Beibu Gulf-PT II; Ocean Press of China: Beijing, China, 2009; pp. 127–138, (In Chinese with English Abstract). [Google Scholar]
- Gao, J.; Mo, L.; Lu, H.; Meng, X.; Wu, G.; Wang, D.; Nguyen, K.-C.; Hu, B.; Tran, A.T. Spring circulation characteristics and formation mechanism in the Beibu Gulf. Front. Mar. Sci. 2024, 11, 1398702. [Google Scholar] [CrossRef]
- Zhu, X.-H.; Ma, Y.-L.; Guo, X.; Fan, X.; Long, Y.; Yuan, Y.; Xuan, J.-L.; Huang, D. Tidal and residual currents in the Qiongzhou Strait estimated from shipboard ADCP data using a modified tidal harmonic analysis method. J. Geophys. Res. Oceans 2014, 119, 8039–8060. [Google Scholar] [CrossRef]
- Gao, J.S.; Chen, B.; Shi, M.C. Summer circulation structure and formation mechanism in the Beibu Gulf. Sci. China Ser. D-Earth Sci. 2015, 58, 286–299. [Google Scholar] [CrossRef]
- Chen, B.; Shi, M. Research Progress on Marine Circulation in the Beibu Gulf. Guangxi Sci. 2019, 26, 595–603. [Google Scholar]
- Gao, J.; Wu, G.; Ya, H. Review of the circulation in the Beibu Gulf, South China Sea. Cont. Shelf Res. 2017, 138, 106–119. [Google Scholar] [CrossRef]
- Wang, D.R. Study of the Dynamic-Thermodynamic Mechanic of Beibu Bay Cool Water Masses. Doctoral Dissertation, Ocean University of China, Qingdao, China, 1998. [Google Scholar]
- Xia, H.Y.; Li, S.H.; Shi, M.C. Three-D numerical simulation of wind driven current and density current in the Beibu Gulf. Acta Oceanol. Sin. 2001, 20, 455–472. [Google Scholar]
- Ding, Y.; Chen, C.; Beardsley, R.C.; Bao, X.; Shi, M.; Zhang, Y.; Lai, Z.; Li, R.; Lin, H.; Viet, N.T. Observational and model studies of the circulation in the Beibu Gulf, South China Sea. J. Geophys. Res. Oceans 2013, 118, 6495–6510. [Google Scholar] [CrossRef]
- Wu, D.; Wang, Y.; Lin, X.; Yang, J. On the mechanism of the cyclonic circulation in the Gulf of Tonkin in the summer. J. Geophys. Res. 2008, 113, C09029. [Google Scholar] [CrossRef]
- Sun, H.L.; Huang, W.M.; Zhao, J.S. Three-dimensional numerical simulation of tide-induced, wind-driven and thermohaline residual currents in the Beibu Bay. Ocean. Limnol. Sin. 2001, 32, 561–568, (In Chinese with English Abstract). [Google Scholar]
- Gao, J.; Xue, H.; Chai, F.; Shi, M. Modeling the circulation in the Gulf of Tonkin, South China Sea. Ocean. Dyn. 2013, 63, 979–993. [Google Scholar] [CrossRef]
- Yang, J.L.; Jiang, S.C.; Wu, J.S.; Xie, L.L.; Zhang, S.W.; Bai, P. Effects of wave-current interaction on the waves, cold-water mass and transport of diluted water in the Beibu Gulf. Acta Oceanol. Sin. 2020, 39, 25–40. [Google Scholar] [CrossRef]
- Beardsley, R.C.; Limeburner, R.; Rosenfeld, L.K. CODE-1 Moored Array and Large-Scale Data Report; Woods Hole Oceanographic Institution: Woods Hole, MA, USA, 1983; pp. 1–2. [Google Scholar]
- Hersbach, H.; Bell, B.; Berrisford, P.; Hirahara, S.; Horányi, A.; Muñoz-Sabater, J.; Nicolas, J.; Peubey, C.; Radu, R.; Schepers, D.; et al. The ERA5 global reanalysis. Q. J. R. Meteorol. Soc. 2020, 146, 1999–2049. [Google Scholar] [CrossRef]
- Shchepetkin, A.F.; McWilliams, J.C. The regional ocean modeling system (ROMS): A split-explicit, free-surface, terrain-following coordinate ocean model. Ocean. Model. 2005, 9, 347–365. [Google Scholar] [CrossRef]
- HYCOM Consortium. The Hybrid Coordinate Ocean Model (HYCOM) system: Overview and applications. Ocean. Sci. Discuss. 2019, 16, 1–36. [Google Scholar]
- Egbert, G.D.; Erofeeva, S.Y. Efficient inverse modeling of barotropic ocean tides. J. Atmos. Ocean. Technol. 2002, 19, 183–204. [Google Scholar] [CrossRef]
- Cao, Z.-Y.; Bao, M.; Guan, W.-B.; Chen, Q. Water-mass evolution and the seasonal change in northeast of the Beibu Gulf, China. Oceanol. Limnol. Sin. 2019, 50, 532–542. [Google Scholar]
Disclaimer/Publisher’s Note: The statements, opinions and data contained in all publications are solely those of the individual author(s) and contributor(s) and not of MDPI and/or the editor(s). MDPI and/or the editor(s) disclaim responsibility for any injury to people or property resulting from any ideas, methods, instructions or products referred to in the content. |
© 2025 by the authors. Licensee MDPI, Basel, Switzerland. This article is an open access article distributed under the terms and conditions of the Creative Commons Attribution (CC BY) license (https://creativecommons.org/licenses/by/4.0/).