Article

Analysis of Shoreline Change in Huizhou–Shanwei Region (China) from 1990 to 2023

by
Sizheng Li
1,2,3,
Feng Gui
4,
Jirong Feng
4,
Yang Wang
1,2,3,
Yanwei Song
1,2,3,
Wanhu Wang
1,2,3,* and
Cong Lin
1,2,3,*
1
Haikou Research Center of Marine Geology, China Geological Survey, Haikou 571100, China
2
Haikou Key Laboratory of Marine Contaminants Monitoring Innovation and Application, Haikou 571127, China
3
Innovation Base for Island Reef Spatial Resource Investigation, Monitoring, and Technology Utilization, Haikou 571127, China
4
School of Marine Science and Technology, Zhejiang Ocean University, Zhoushan 316022, China
*
Authors to whom correspondence should be addressed.
Water 2025, 17(10), 1460; https://doi.org/10.3390/w17101460
Submission received: 7 March 2025 / Revised: 25 April 2025 / Accepted: 9 May 2025 / Published: 12 May 2025
(This article belongs to the Special Issue Advanced Research on Marine Geology and Sedimentology)

Abstract

:
The dynamic change in the shorelines reflects an important sign to the socio-economic development of coastal areas. The Huizhou–Shanwei region of China has experienced rapid socio-economic development over the past 33 years. The study of the dynamic change in the shorelines in this region can provide basic data support for the marine environmental protection and regional development planning in this region. Based on Landsat RS (remote sensing) images from 1990 to 2023, this study obtained the length and structure data of the shorelines in eight periods by manual visual interpretation. DSAS (Digital Shoreline Analysis System) and other methods were also used to calculate indices such as EPR (End Point Rate) and fractal dimension of the shorelines The results show that, during 33 years, the length of the shorelines increased 15.83 km, with an average growth rate of 0.48 km/y; the value of the intensity of change in the shorelines was 0.08%; the average EPR was 3.66 (m/y), and the artificiality index of the shorelines increased from 0.2895 to 0.4295; the greatest intensity of change was in the estuarine shorelines, with an intensity of change of −2.69%. The overall change in the fractal dimension of the shorelines was small, both between 1.0395 and 1.0673; the shorelines became slightly more curved. As far as the influencing factors are concerned, the influence of the natural environment is a long process, and human activities are more capable of changing the length and shape of the shorelines in a short period of time, with factors such as the degree of economic development having a greater impact on the shorelines.

1. Introduction

The coastal zone is an important site for human socio-economic development, while the shorelines act as demarcation lines between the land and sea [1,2], reflecting changes induced by the natural environment and human intervention (i.e., socio-economic development) [3,4,5]. Dramatic changes in the shorelines have been associated with a wide range of problems in the coastal zone, such as deterioration of seawater quality, ecological imbalance, etc. In this context, there is an urgent need to strengthen the protection, management, and sustainable use of the shorelines and related to coastal zone resources [6]. Therefore, monitoring and rationally analyzing the changes in the length and type of the shoreline is a highly important task. The use of remote sensing images to extract shorelines and analyze their spatial and temporal changes has become a major part of shorelines research. As Wu [7] (2014) demonstrated, the structural changes to the shoreline of the Chinese mainland over the past 70 years have been remarkably substantial. The prevailing trend has been an increase in artificial features along the shorelines. However, the rate of change in the shoreline and its causes vary significantly between different regions. Zhang [8] used remote sensing images to analyze the changes in the shorelines in the southern part of the Yellow River estuary, and concluded that the shorelines in the southern part of the Yellow River Delta mainly undergo gradual erosion. Zhao [9] (2023) concluded that the shorelines of central Jiangsu have been continuously advancing seaward for many years due to sedimentation and beach reclamation. It is evident that the coast of the poldered land area is distinguished by its high level of activity. Xia Wang [10] argues that in the course of Ningbo’s development, natural erosion or siltation is often disturbed due to activities such as urban development, agricultural development, and port construction. Mshelia [11] analyzed the fluctuation of the Durban shoreline from 1990 to 2023 using Lansat images and DSAS to assess erosion and accretion patterns. Adenugb [12] found that human activities have contributed to the urbanization of the island city, resulting in a shoreline retreat of about 56% of its total length. Although analysis of shoreline changes is critical, few studies have examined changes along the Huizhou–Shanwei shoreline.
The Huizhou–Shanwei region is located in the southeastern part of Guangdong Province and is also an important zone for the development of the marine economy in Guangdong Province [13,14]. The region has many characteristics, such as curved coasts, extensive mudflats, and abundant biological life. The management, protection and scientifically efficient use of its shorelines resources are conducive to the economic growth and the coordinated development of coastal ecology and marine economy in the Huizhou–Shanwei region [15]. However, there are fewer studies related to the shoreline changes in this region.
This study identifies the shoreline length and structural changes in Huizhou–Shanwei over the past 33 years using Landsat remote sensing images by visual interpretation. It then analyses the changes and explains the driving factors. The result provides scientific evidence for the healthy management and development of the coastal zone in Huizhou–Shanwei region.

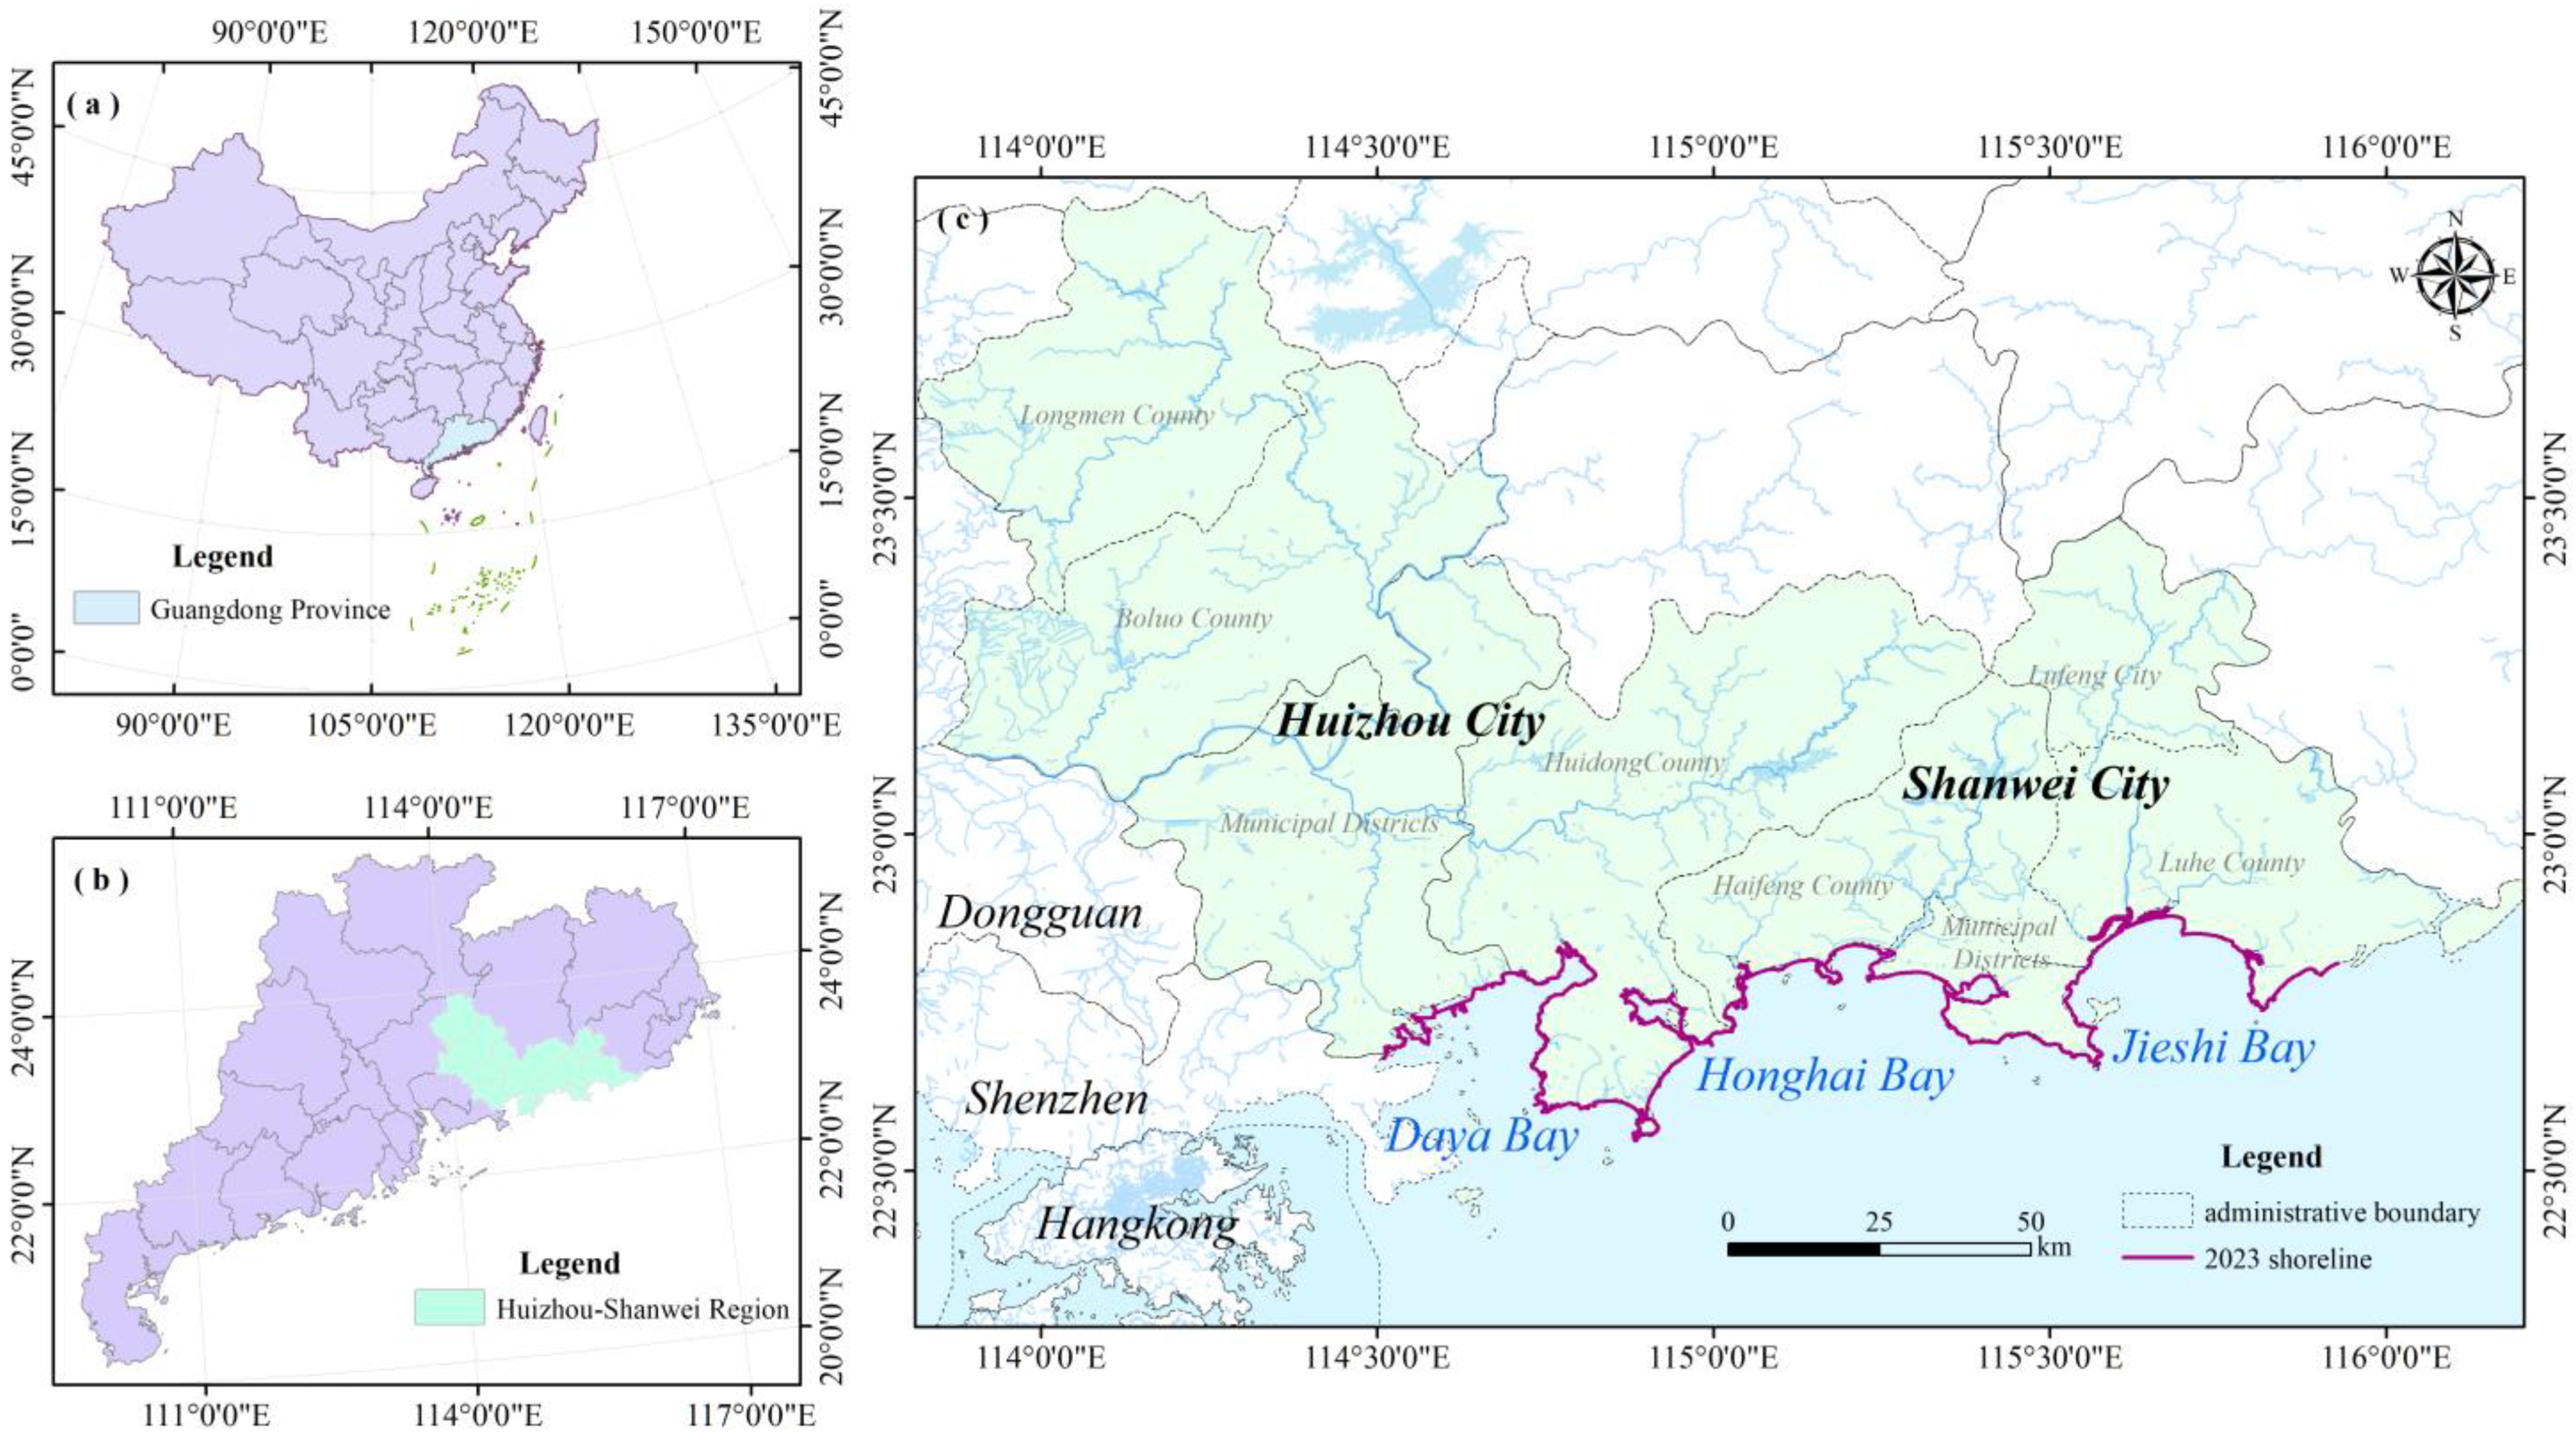
2. Overview of the Study Area

The Huizhou–Shanwei region is located in the southeastern part of China’s Guangdong Province, in a subtropical oceanic monsoon climate zone, with a warm climate, abundant rainfall, and precipitation concentrated in the summer months. The large number of rivers and lakes within the region can be seen in Figure 1. The summer and autumn seasons are heavily affected by typhoons, and there is a clear seasonal shift in wind direction, with the prevailing wind direction being easterly throughout the year. The region is dominated by low hills with a mountain range trend that slopes from northeast to southwest. Small areas of floodplain are distributed along the coast. The sand content of the rivers is moderately high. The intensity of stream erosion in the mountainous areas is high during the rainy season, but is easily influenced by hydraulic engineering [16]. The region plays an important role in the development of the interface between the Pearl River Delta (PRD) and the Chaoshan region, and is an important corridor connecting the PRD and the Chaoshan region. With the reform and opening up, the region has taken over the economic and industrial spillover functions of Shenzhen and Hong Kong. The population has also increased significantly, and socio-economic progress has continued. This has led to significant changes in the construction of the coastal zone area and the development and utilization of the shoreline. However, with the expansion of human development and urbanization, the region is also facing problems such as water pollution and changes in the structure of the shorelines.

3. Data Sources and Methodolgy

3.1. Data Sources

Remote sensing images related to the study area are Landsat (https://www.usgs.gov/ (accessed on 1 May 2024)). In the interpretation of the shoreline from the Landsat images, we also used historical images from Google Earth as a reference for some areas of uncertainty. The socio-economic data of Huizhou–Shanwei region are mainly sourced from the statistical yearbooks and bulletins of the relevant regions. The basic information of Landsat images used is shown in Table 1.

3.2. Shorelines Extraction and Validation

There has been some ambiguity in the definition of the natural shorelines, and in the context of marine management, it is generally regarded as the natural shorelines when there are no artificial non-permeable structures in the intertidal zone up to above the high tide line of the mean high tide, and when the coast is maintained in its natural state [17]. On the contrary, if there are artificial non-permeable dykes such as seawalls, wave protection dykes, erosion protection dykes, etc., between the intertidal zone and the high tide line of the mean high tide, they are regarded as artificial shorelines. The shoreline in this study refers to the multi-year mean high tide level.
After acquiring the remote sensing images of the study area, the remote sensing data were subjected to FLASSH atmospheric correction and radiometric calibration and debarring operations in ENVI 5.6. To minimize errors caused by inconsistencies in the imagery from year to year, the other data were corrected for ensemble accuracy using the 2023 remote sensing images, and the ground control points were also selected for error control. After this step, a Modified Normalized Difference Water Index (MNDWI) is operated on the imagery [18]. This index not only enhances the grey-level gradient at the land-water boundary, but also optimizes the distinction between water bodies and non-water bodies. The improved normalized water body index is calculated as follows:
M N D W I = G r e e n S W I R G r e e n + S W I R
where Green represents the green light band in the image and SWIR represents the short infrared band in the image.
In addition, manual visual interpretation is still the current remote sensing interpretation method with high accuracy. In order to obtain the shorelines of the study area, this study established the shorelines interpretation signs [19] (Table 2) by combining the actual characteristics of the area, the information of the image’s hue, texture, geomorphology, and the characteristics of the surrounding features after the operation of MNDWI.
Subsequently, the shoreline is interpreted and corrected by means of manual visual interpretation. Thereafter, the processed images and the interpreted coastlines are superimposed in ArcGIS 10.7 for the purposes of analysis and mapping. In instances where the clarity of the coastline interpretation was deemed to be questionable, further refinement and improvement was conducted by referring to Google Earth images of similar dates.

3.3. Shoreline Artificial Index

The artificial intensity (frequency of occurrence) of the shorelines indicates the degree of transformation of the natural shoreline into an artificial shoreline, which is expressed by the shorelines artificial index I A (the proportion of artificial shorelines to the total amount of shorelines in a certain coastal sector) [20]. The formula is as follows:
I A = N L ,
where ( I A ) represents the artificial shoreline index; (N) is the artificial shoreline length; (L) is the total length of shoreline.
The greater the I A , the greater the degree of shorelines artificiality.

3.4. Intensity of Shoreline Change

In order to quantify the degree of annual average change in shorelines length over a given period of time [19], the intensity of shoreline length change from year i to year j ( LCI i j ) is used (Equation (3))
LCI i j = L j L i L i ( j i ) × 100 %
where ( L i , L j ) are the lengths of the shorelines in km for the corresponding years ( i , j ), respectively.
The greater the absolute value of LCI i j , the greater and more drastic the change in shorelines length in the study area over the time period.

3.5. Baseline Method for Calculating the Rate of Shorelines Change

The baseline method provides good access to the rate at which the shorelines is advancing or receding seaward [21]. In this study, the EPR (End Point Rate) tool in DSAS (Digital shoreline Analysis System) was used to calculate the rate of change in shorelines [22]. The basic principle is to make a baseline to one side of the shorelines, and then make equally spaced vertical lines intersecting the baseline. The rate of change of the endpoints ( E i , j ) from year i to year j , is calculated using the Static tool in DSAS [23]. The formula is as follows:
E i , j = d j d i Δ T i , j ,
where ( Δ T i , j ) is the time interval between years i and j , and d j and ( d i ) is the vertical distance from the shorelines to the baseline from year j to year.

3.6. Shorelines Fractal Dimension

Since non-regular geometries are difficult to describe quantitatively in terms of units such as length and area, fractal theory introduces a more natural language for description, making it easier to understand non-regular geometries [24,25].
Fractal dimension is a parameter used to characterize the complexity and irregularity of fractals, solving the problem of describing and quantifying irregular geometries [26]. The principle of the grid method is to vary the length ( ε ) of the square grid covering the shorelines, and then count the total number ( N ( ε ) ) of corresponding grids. Thence, we can obtain a series of corresponding square grid ‘length-totals’ of ‘ ε N ( ε ) ’ [27]. Thus, when the length of the square grid is ε 1 , ε 2 , …, ε k , the corresponding number of square grids covering the shoreline is N ( ε 1 ) , N ( ε 2 ) , …, N ( ε k ) . The formula is as follows:
lg N ( ε k ) = D lg ε + Z
where ( D ) is the fractal dimension of the shorelines to be measured and ( Z ) is a constant to be determined.
Since the resolution of Landsat is 30 m, the grid edge length should also be a multiple of 30. By combining the existing research results and the situation of the study area, nine cases with grid edge lengths of 30, 60, 90, 120, 150, 210, 240, and 480 m were selected in this study.

4. Results

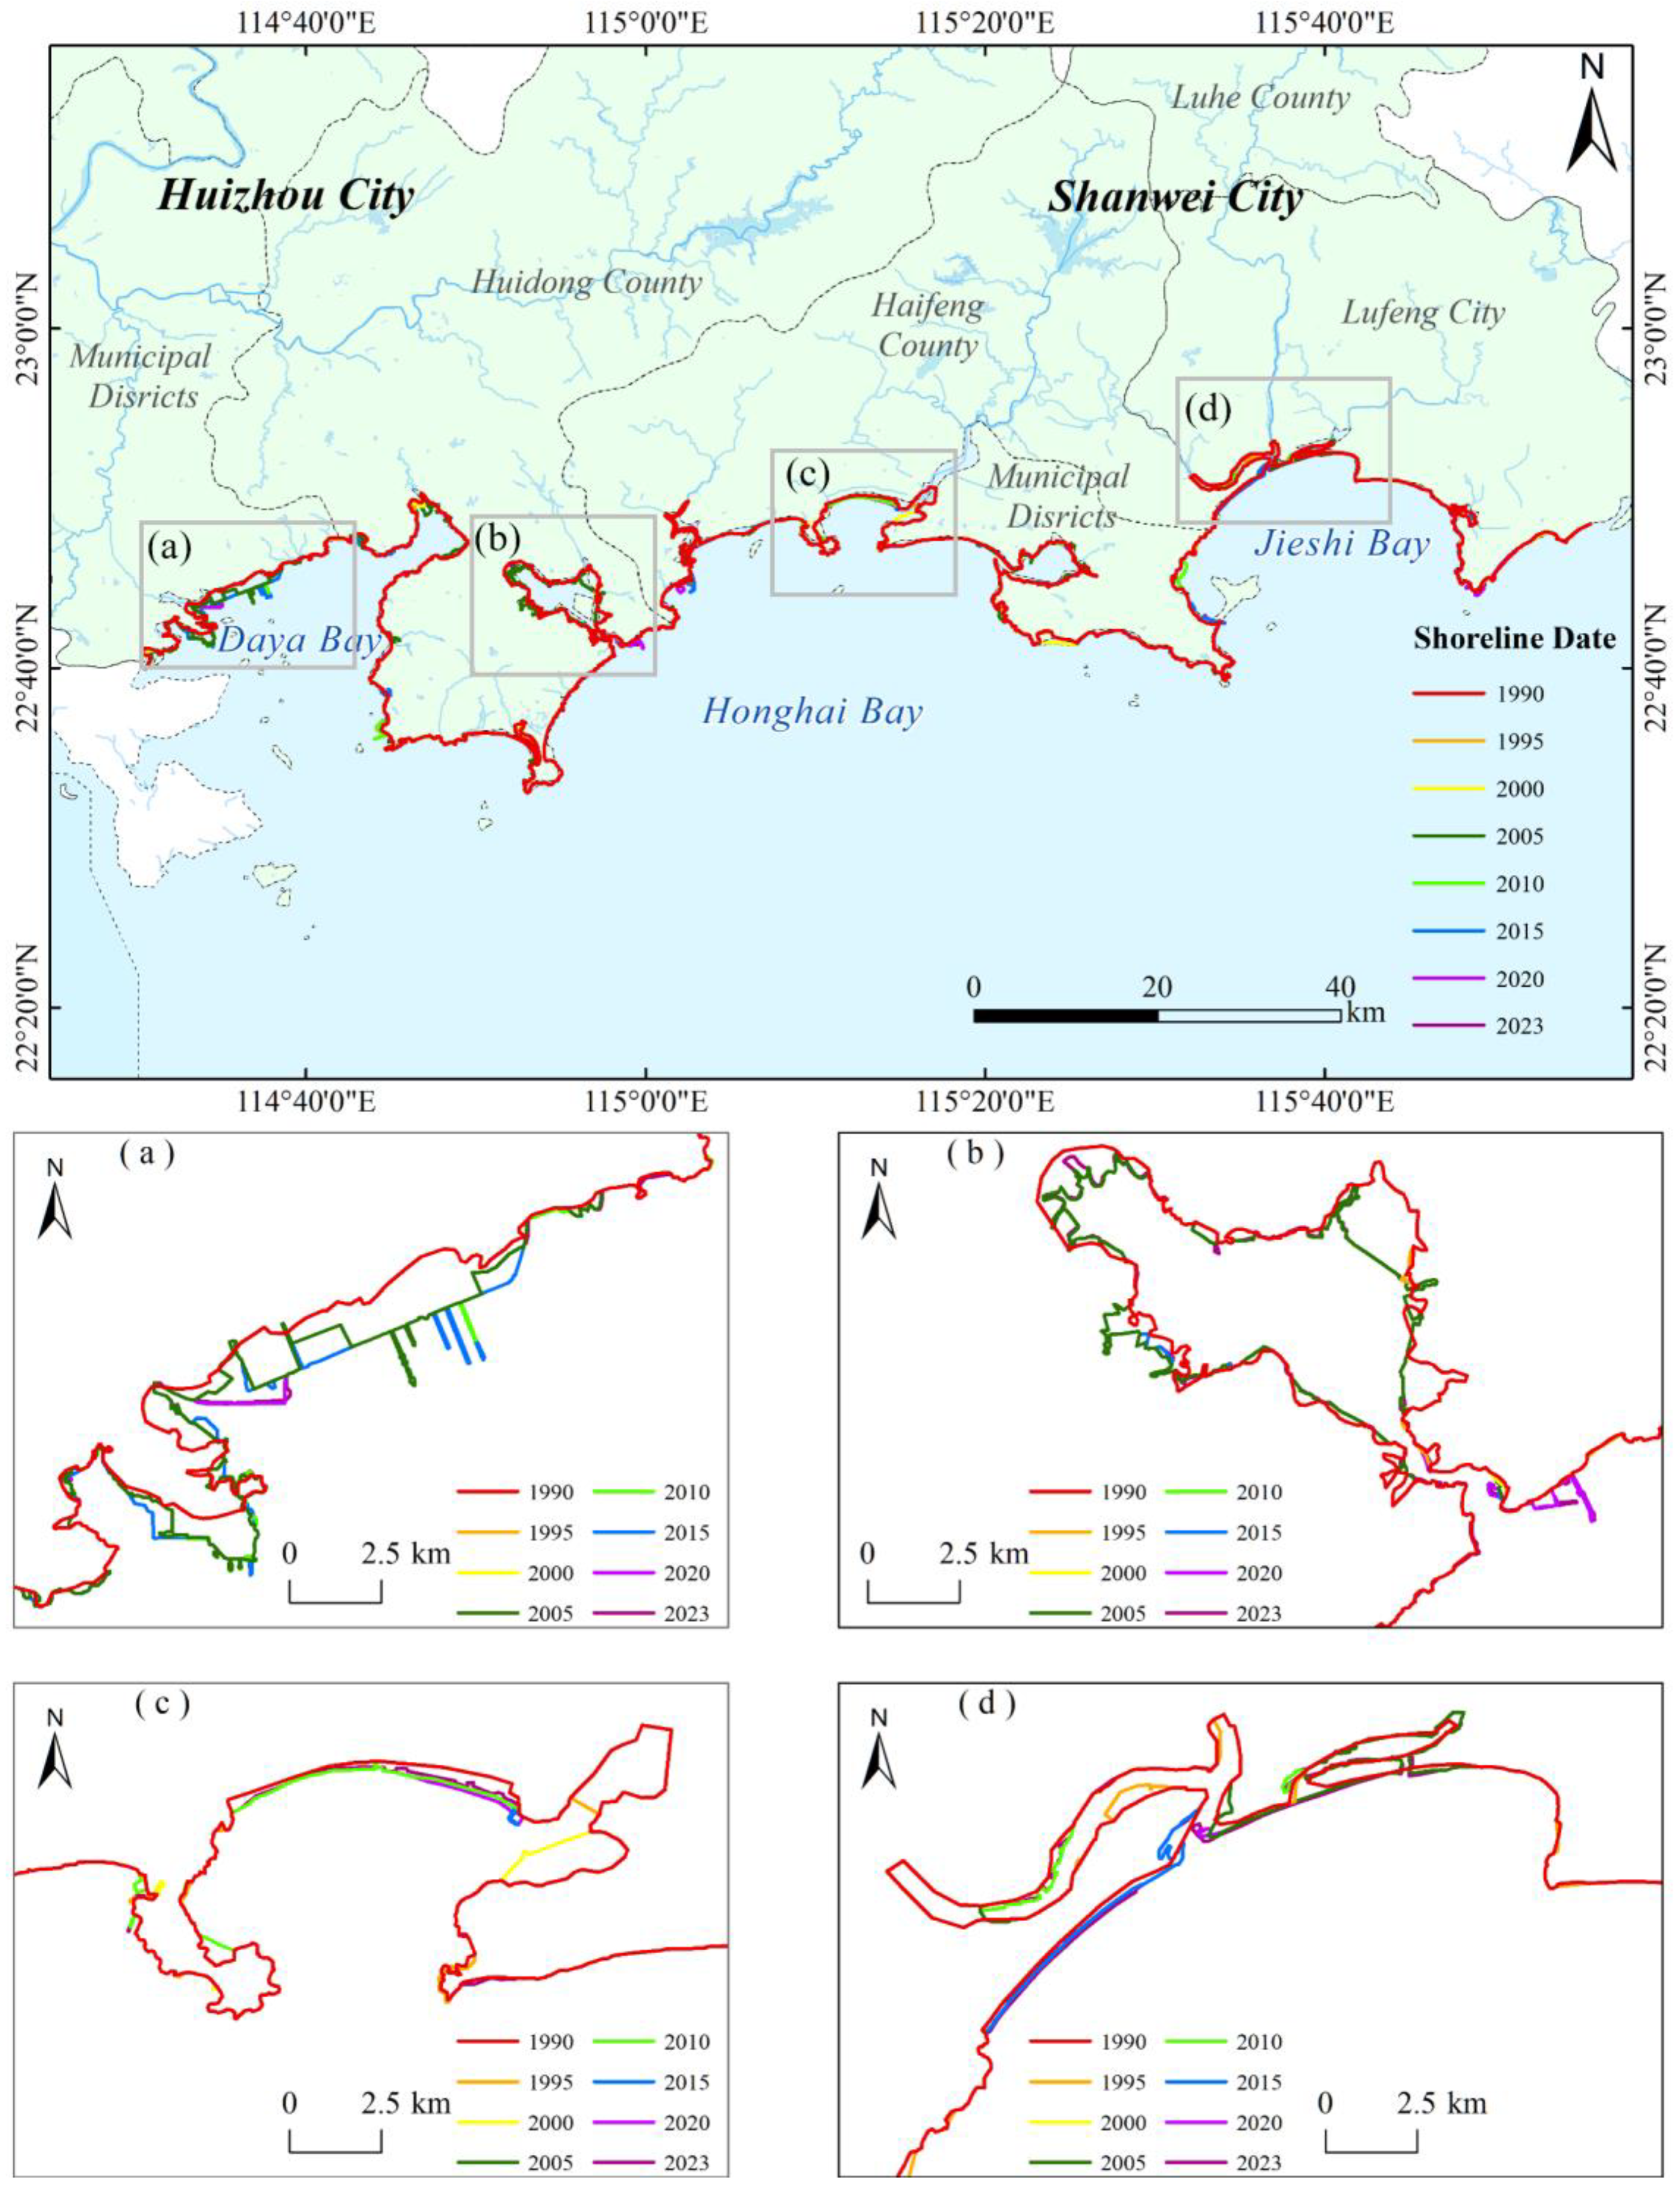
4.1. Analysis of Changes in Shorelines Length and Structure

According to the results of RS images interpretation, the changes in the length of the shorelines and their type changes in the study area can be obtained (see Figure 1). The statistics of shoreline types in each year using ArcGIS 10.7 are reported in Table 1.
The results of the study show that the shoreline increased from 616.71 km to 632.54 km with an average annual growth rate of 0.48 km. However, the overall trend in the evolution of shoreline length is “decrease-increase-decrease”. The places where significant changes have occurred are in Figure 2a–d: the shorelines have become straight in Figure 2a, the shorelines are more curved in Figure 2b, and the two changes in Figure 2c,d are roughly parallel to the shore.
Statistics on the total length of the shorelines in each period show that the overall length of the Huizhou–Shanwei shorelines increased by 15.82 km from 1990 to 2023: the length of the shorelines was 616.71 km in 1990, then gradually decreased to 603.76 km in 2000, and then continued to increase to 634.19 km in 2020, and then decreased to 632.54 km in 2023. As far as shorelines types are concerned, during this 33-year period, there has been an increase in artificial and sandy shorelines and a decrease in other types of shorelines: artificial shorelines have increased by 93.15 km, sandy shorelines have increased by 7.04 km, biogenic shorelines have decreased by 6.79 km, muddy shorelines have decreased by 3.65 km, bedrock shorelines have decreased by 66.78 km, and estuarine shorelines have decreased by 7.14 km. Of these, the three areas with the most significant changes throughout the shorelines are a, b, and c in Figure 2.
Shorelines length change and structural change can only show the change in the length of each type of shoreline, and cannot see the change characteristics between artificial and natural shorelines. And the shorelines artificial index can intuitively reflect the transformation and influence of human activities on the shorelines. It can be seen in Figure 3 and Table 3. From 1990 to 2023, the artificial index of the Huizhou–Shanwei shorelines increased from 0.2895 to 0.4295, which indicates that some of the shoreline was converted to artificial shorelines during this period and the growth was relatively rapid. Prior to 2015, the shorelines labor index consistently showed an increasing trend, and after 2015, the shorelines labor index decreased slightly. This is demonstrated by the fact that in 1990–2000, the artificiality index increased by about 1% per year, a mere 0.0183 over a 10-year period; in 2000–2005, the artificiality index increased rapidly in this period, from 30.78% to 43.56%. In 2005–2015, the shorelines artificiality index is still increasing at this time, but the increase is extremely slow in this period. In 2015–2023, the artificial index decreased by 0.0387.

4.2. Intensity of Shorelines Change

Intensity of shorelines change can be seen in Table 4. In terms of intensity of shorelines change, the overall shoreline intensity of change was 0.08%, which is the smallest change compared to the six shoreline types. However, in terms of phases, in 1990–1995, the estuarine shorelines had the greatest intensity of change at −16.57%; in 1995–2000, the muddy shorelines had the greatest intensity of change at 2.52%; in 2000–2005, the artificial shorelines had the greatest intensity of change at 8.96%; in 2005–2010, the muddy shorelines had the greatest intensity of change at 12.47%; in 2010–2015, the greatest intensity of biological shorelines change was 18.30%; in 2015–2020, the greatest intensity of muddy shorelines change was −2.61%; and in 2020–2023, the greatest intensity of biological shorelines change was −25.35%.

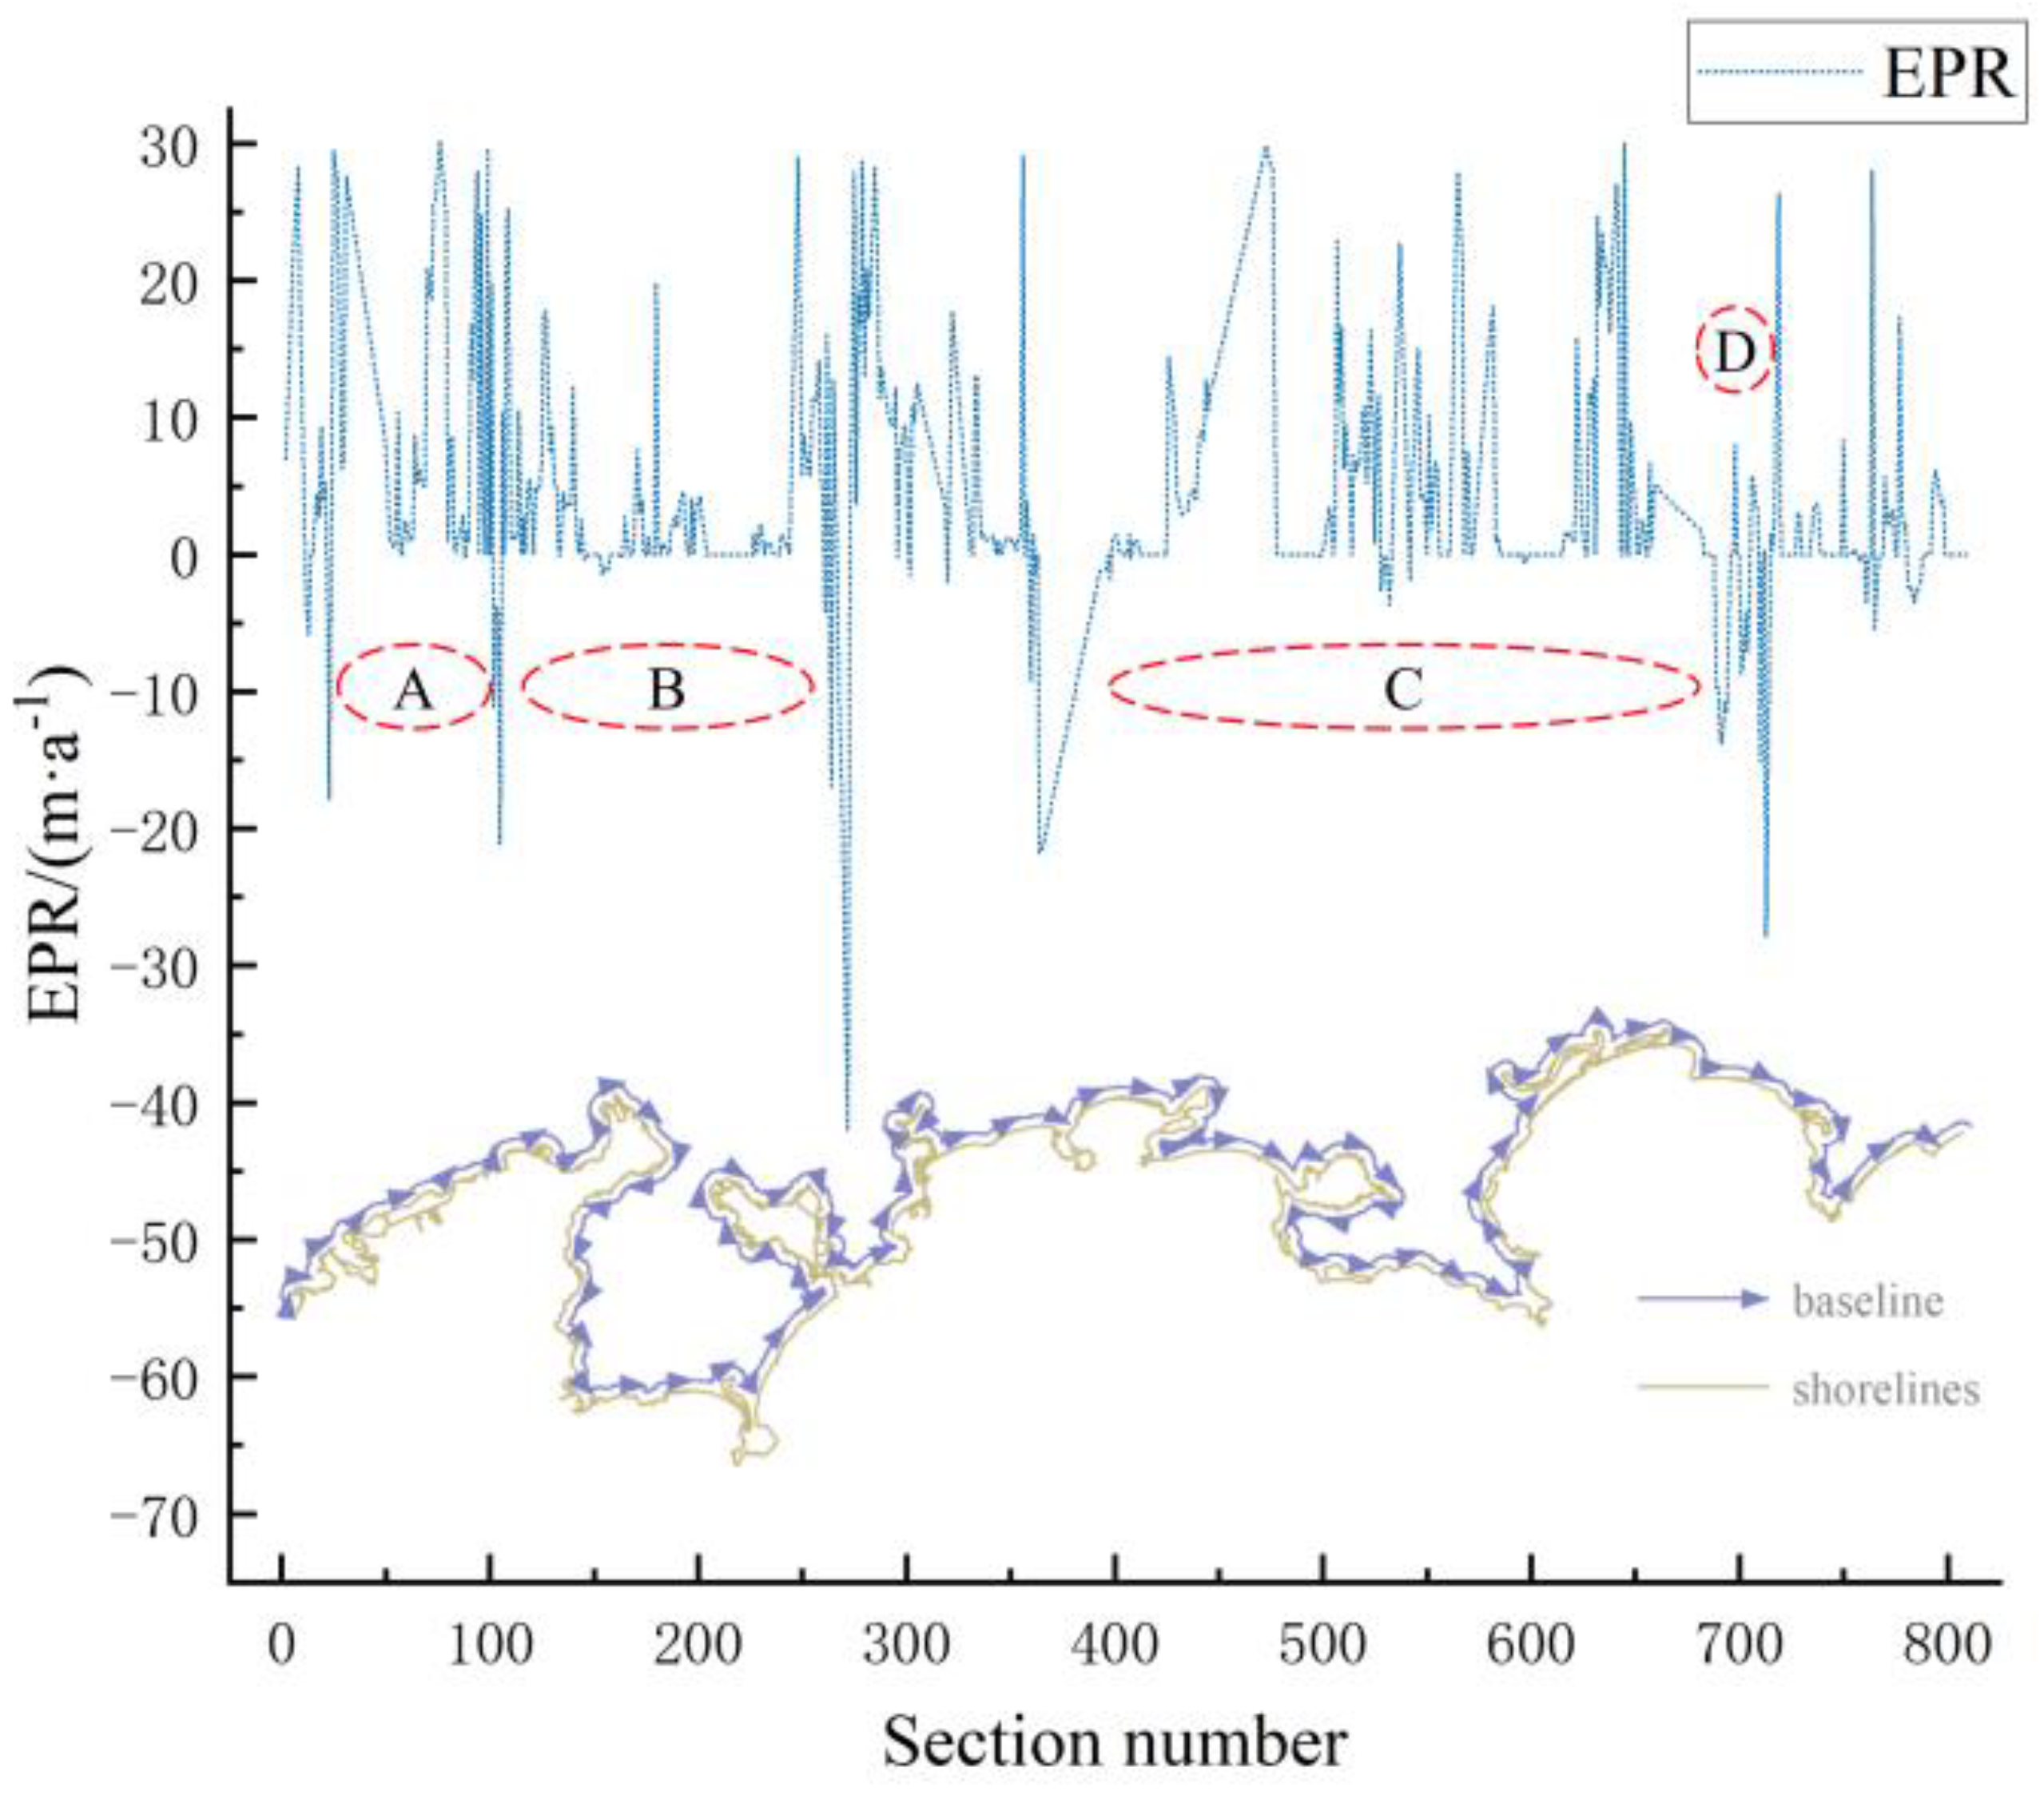
4.3. Rate of Shorelines Change

The 1990 shoreline was buffered by 1000 m in the landward direction, and the baseline was obtained through adjustment. A 2000 m vertical line was then generated from the baseline to the sea direction, and an equally spaced shoreline vertical section with 500 m was created to generate the baseline. Following the deletion of a number of sections deemed to be unqualified, the total number of sections was reduced to 810. However, subsequent analysis revealed that the number of sections in conformity with the study’s requirements was 644.
The EPR of the study area was calculated using the DSAS plug-in and the previous equations, and the spatial and temporal evolution of the Huizhou–Shanwei shorelines was analyzed from 1980 to 2023. The results showed that the average EPR for the entire study area was 3.66 (m/y), with transect number 23 producing the maximum EPR value of 30.21 (m/y) and the transect number 272 producing the minimum EPR value of −42.12 (m/y). There are 350 values of EPR greater than 0.79 values of EPR less than zero, and 215 values of zero. This indicates that the Huizhou–Shanwei shorelines mainly showed spatial seaward advancement during the period 1990–2023, in which the forms of advancement were mainly siltation and reclamation. Combined with Figure 4 and the field study, it appears that the shoreline at sector A is straightening out and advancing seaward, mainly due to harbor construction and engineering works. The area at sector B has an outwardly protruding peninsula, mainly a tourist area, where there is little overall change in the shorelines, and at the left and right ends of sector B are two bays, each with an overall seaward advance in the form of siltation. The shorelines are more variable in sector C, where their western half is advancing seaward in the form of estuarine siltation. The eastern side of the shorelines is overall straighter, advancing seaward in an orderly manner, mainly due to engineering works. The area at sector D is mainly a new tourist area that has been constructed in the last two years, where the original shorelines have been planned and modified artificially, allowing the shorelines to be set back in comparison to 1980.

4.4. Shorelines Fractal Dimension Change

Based on the grid side lengths set in the previous section, the number of grids capable of covering the shorelines was calculated for each side length for each year. The linear relationship “grid side length-number of grids” (“ ε N ( ε ) ”) was then calculated for each year according to Formula (5). The results are given in Table 5.
In Table 5, x denotes lg ε and y denotes lg N ( ε k ) . The calculation results show that the correlation coefficients R2 between x and y are all above 0.9995, indicating that the fractal nature of Huizhou–Shanwei shorelines in each period exists objectively, and it is possible to use this method to study the shoreline change. The change in fractal dimension could reflect the changing characteristics of shoreline morphology. The larger the value of fractal dimension is, the more zig-zagged the shoreline becomes and the morphology tends to be more complex; on the contrary, the shorelines become smooth and the morphology tends to be simpler.
According to Table 5, the fractal dimension of the Huizhou–Shanwei shoreline has ranged from 1.0395 to 1.0673, with the minimum value of 1.0395 (observed in 1990), and the maximum value of 1.0673 (recorded in 2020). Among them, the fractal dimension of the shorelines has been getting larger between 1990 and 2020, with the largest change from 2000 to 2005, increasing from 1.0447 to 1.0594, an increase of 0.0153. After 2020, the fractal dimension of the shorelines decreased by 0.0011. According to the above results it can be seen thatn in 1990, the Huizhou–Shanwei shoreline has the simplest morphology, and in 2020 the Huizhou–Shanwei shoreline has the most tortuous morphology.
The fractal dimension can accurately reflect the morphological changes in the shoreline [24,26].With the expansion of the urban land scale, the impact of human activity on the shoreline has gradually increased, such as the construction of ports, reclamation and breeding, and the development of tourism. These human interventions will change the original morphology of the shoreline, making the originally smooth shoreline more curved, resulting in an increase in the fractal dimension of the shoreline.

5. Discussion

5.1. Comparative Analysis of Shorelines Variation

As an important indicator of regional development, changes in the shorelines can reflect the speed of the development process of the region to a non-negligible extent [28]. Many research studies have shown that the construction of ports and other infrastructures can seriously affect the type structure of shorelines [23,29]. Huizhou–Shanwei region is distributed in three bays: Daya Bay, Honghai Bay, and Jieshi Bay. There are three bays spread across the region and numerous small harbors within the bays. These harbors are critical nodes within provincial maritime transport networks. The rapid economic development has led to an increase in harbor construction so that the conversion of silty shorelines into artificial ones.
In addition, the area of Figure 2b,c—the estuarine delta areas of the region—are susceptible to wave and tidal influences and are characterized by morphological instability [30]. As planning and modifications have been made to the estuarine areas of the study area, both improvements in river transportation and estuarine environments have resulted in the reduction in estuarine shorelines.
Meanwhile, Yang (2014) [31] pointed out that the shorelines of the southern mainland of China were relatively stable from 1990 to 2010, and the fractal dimension basically did not change much. This coincides with the results of this study [31]. In addition, in previous studies, among the many cities in Guangdong’s Greater Bay Area, Huizhou has exhibited a slow growth in shoreline fractal dimension compared to cities like Guangzhou and Shenzhen [24,32]. The present study confirms this view. And this study further concludes that the reason for shoreline stabilization in the region is due to the presence of some sandy and biological shorelines (mainly mangrove reserves) within the region. These areas play an important role in stabilizing the fractal dimension.

5.2. Driving Factor Analysis

5.2.1. Natural Factors

Changes in the shorelines are influenced by a number of factors. For natural shorelines, the location and geology of the shorelines are the main factors affecting its change, and therefore changes in natural shorelines are not likely to be significant in a short period of time [33]. Also, factors affecting shorelines change include river sediment loads, tidal action, etc.
Sandy and bedrock shorelines are more stable in terms of the evolutionary development of the earth itself. The study was carried out in 1990, and there have been no major geological events or earth movement processes in the study area in the past 33 years. Therefore, in terms of the natural evolution of the shorelines during the study period, except for the estuarine shorelines, the shoreline type has not changed much as a result of the changes in the natural environmental factors. For example, in Figure 2c, there is a large river inlet, which was an estuarine shoreline in 1990. After this time, the shoreline was pushed seaward, the length of the shoreline became shorter, and the type of shoreline was converted from an estuary to an artificial shoreline, which led to a change in the depositional environment of the estuary. Affected by the influence of the geostrophic force, deposition began on the right side of the river flow—that is, to the left half of Figure 2c. The shoreline type in the left half of Figure 2c was altered by the process of estuarine water flow. In the aftermath of the changes, artificial shorelines in the left half of the gradually formed through siltation, and then formed a muddy shoreline in 2010.

5.2.2. Socio-Economic Factors

Human socio-economic activities also affect shorelines type changes. Since the reform and opening up, China’s economy has developed rapidly. By integrating relevant yearbooks, statistical bulletins and other information, the changes in major socio-economic indicators in the Huizhou–Shanwei region since 1990 can be obtained, as shown in Figure 5:
In 1990, the year-end resident populations of Huizhou City and Shanwei City were 2312.5 thousand and 2199.9 thousand, respectively. By the end of 2022, the year-end resident populations of Huizhou City and Shanwei City will be 6050.2 and 2682.6, respectively, with a significant increase in population. Within the study period, Huizhou City and Shanwei City also experienced a rapid increase in GDP (Gross Domestic Product), and the city’s industrial structure is undergoing dramatic changes. In 1990, Huizhou’s GDP and Shanwei’s GDP was 4.9 billion yuan and 2.3 billion yuan, respectively. By 2023, Huizhou’s GDP was 540.1 billion yuan and Shanwei’s was 132.2 billion yuan. The rapid increase in population, large-scale economic construction, and the increase in the proportion of industry have led to drastic changes in the surface type of the region [29], as well as influencing changes in the shorelines. Accelerated urban construction, more land reclamation activities, and harbor construction are being carried out, which have a great impact on the shorelines, and the proportion of man-made shorelines begins to rise. The most typical area is the NAME (Figure 2a), where the shoreline has experienced a clear seaward movement and became straightened by 2005 due to the construction of ports; hence, the natural shorelines has changed to an artificial one. In Figure 2d, there are numerous small rivers that discharge into the sea draining a very fertile area. The existence of many villages and towns show that people have been working here for a long time, with their activity contributing to shoreline change, as discussed earlier. Nevertheless, from 1980 to 2023, the shoreline in question remained unaltered as an artificial shoreline.

5.2.3. Policy Factors

Policies play an important role in the economic development of a region, and similarly, changes in policies play a decisive role in shorelines changes [2].
In addition, in 2017, the State Oceanic Administration (China) issued The Measures for the Management of Shorelines Protection and Utilization, emphasizing that the development and utilization of shorelines resources must be constrained by the carrying capacity of the marine ecosystem, and that marine ecological safety must be ensured as a prerequisite. The Measures for the Management of shorelines Protection and Utilization states that, by 2020, the national natural shorelines retention rate will be no less than 35% (excluding island shorelines). For this study area, prior to this document, the artificial index of the shorelines has been increasing, reaching a maximum in 2015 at 0.4682. After this document was published, with the implementation of documents and policies, the artificial shorelines index decreased to 0.4438 in 2020, and the artificial shorelines decreased to 0.4295 in 2023, decreasing to its pre-2005 state. In contrast, the natural retention of the shorelines has increased incrementally, and the length of the natural shorelines has also increased. At present, the natural shoreline retention rate of the region is above this standard, and the overall state is high. As the country requires the development of the marine economy and the development of the coastal zone, the local government should establish a sound system of graded protection of the shoreline, and carry out targeted and hierarchical differentiated management modes for different shorelines.

6. Conclusions

Based on the remote sensing images from 1990 to 2023, the Huizhou–Shanwei shoreline was extracted by visual interpretation. We found that the shoreline increased from 616.71 km to 632.54 km, with an average growth rate of 0.48 km/y. This is associated with a significant reduction in rocky shoreline and increase in artificial shoreline, with the latter becoming increasingly curved. This change is the combined result of natural estuarine processes (i.e., siltation), and human works related to social development and related policies. Therefore, a hierarchical system of shoreline management needs to be established in order to reduce coastal damage and erosion.

Author Contributions

Conceptualization, S.L. and C.L.; methodology, S.L., C.L. and Y.W.; software, S.L., J.F.; validation, S.L., F.G. and J.F.; formal analysis, S.L.; investigation, F.G.; resources, Y.W., Y.S. and C.L.; data curation, S.L., Y.W. and C.L.; writing—original draft preparation, S.L., C.L.; writing—review and editing, S.L., F.G. and Y.S.; visualization, S.L., J.F. and W.W. supervision, F.G. and J.F.; funding acquisition, Y.W. All authors have read and agreed to the published version of the manuscript.

Funding

This research was funded by Science and Technology Innovation Fund of Command Center of Integrated Natural Resources Survey Center (KC20230017), China Geological Survey Projects (DD20230415) and Innovation Foundation of Science and Technology for “Nanhai New Star” Projects (Grant No. NHXXRCXM202353) of Hainan province.

Data Availability Statement

Data are contained within the article.

Acknowledgments

We are deeply grateful for the comments noted by the anonymous reviewers and editors.

Conflicts of Interest

The authors declare no conflicts of interest.

References

  1. Zhang, Y.; Hou, X. Characteristics of Coastline Changes on Southeast Asia Islands from 2000 to 2015. Remote Sens. 2020, 12, 519. [Google Scholar] [CrossRef]
  2. Zheng, Z.; Wu, Z.; Chen, Y.; Yang, Z.; Marinello, F. Exploration of Eco-Environment and Urbanization Changes in Coastal Zones: A Case Study in China over the Past 20 Years. Ecol. Indic. 2020, 119, 106847. [Google Scholar] [CrossRef]
  3. Almar, R.; Boucharel, J.; Graffin, M.; Abessolo, G.O.; Thoumyre, G.; Papa, F.; Ranasinghe, R.; Montano, J.; Bergsma, E.W.J.; Baba, M.W.; et al. Influence of El Niño on the Variability of Global Shoreline Position. Nat. Commun. 2023, 14, 3133. [Google Scholar] [CrossRef] [PubMed]
  4. Barbier, E.B. Climate Change Impacts on Rural Poverty in Low-Elevation Coastal Zones. Estuar. Coast. Shelf Sci. 2015, 165, A1–A13. [Google Scholar] [CrossRef]
  5. Rajasree, B.R.; Deo, M.C.; Sheela Nair, L. Effect of Climate Change on Shoreline Shifts at a Straight and Continuous Coast. Estuar. Coast. Shelf Sci. 2016, 183, 221–234. [Google Scholar] [CrossRef]
  6. Rangel-Buitrago, N. Human Epoch-Human Responsibility: Rethinking Coastal Zone Management in the Anthropocene. Ocean Coast. Manag. 2023, 244, 106801. [Google Scholar] [CrossRef]
  7. Wu, T.; Hou, X.; Xu, X. Spatio-Temporal Characteristics of the Mainland Coastline Utilization Degree over the Last 70 Years in China. Ocean Coast. Manag. 2014, 98, 150–157. [Google Scholar] [CrossRef]
  8. Zhang, X.; Yang, Z.; Zhang, Y.; Ji, Y.; Wang, H.; Lv, K.; Lu, Z. Spatial and Temporal Shoreline Changes of the Southern Yellow River (Huanghe) Delta in 1976–2016. Mar. Geol. 2018, 395, 188–197. [Google Scholar] [CrossRef]
  9. Zhao, B.; Liu, Y.; Wang, L. Evaluation of the Stability of Muddy Coastline Based on Satellite Imagery: A Case Study in the Central Coasts of Jiangsu, China. Remote Sens. 2023, 15, 3323. [Google Scholar] [CrossRef]
  10. Wang, X.; Liu, Y.; Ling, F.; Liu, Y.; Fang, F. Spatio-Temporal Change Detection of Ningbo Coastline Using Landsat Time-Series Images during 1976–2015. ISPRS Int. J. Geo-Inf. 2017, 6, 68. [Google Scholar] [CrossRef]
  11. Mshelia, Z.H.; Amatebelle, E.C.; Belle, J.A. Geospatial Analysis of Shoreline Change of Ethekwini Coastline from 1990–2023. Sci. Afr. 2025, 28, e02685. [Google Scholar] [CrossRef]
  12. Adenugba, O.; Li, H.; Daramola, S.; Adewale, B.; Gong, Z. Effects of Localized Development on Land Use and Coastline Dynamics: A Focus on Recent Changes along the Lekki Peninsula. Reg. Stud. Mar. Sci. 2024, 78, 103744. [Google Scholar] [CrossRef]
  13. Sun, J.; Shu, S.; Hu, H.; Deng, Y.; Li, Z.; Zhou, S.; Liu, Y.; Dang, M.; Huang, W.; Hou, Z.; et al. Location Optimization of Unmanned Aerial Vehicle (UAV) Drone Port for Coastal Zone Management: The Case of Guangdong Coastal Zone in China. Ocean Coast. Manag. 2025, 262, 107576. [Google Scholar] [CrossRef]
  14. Wang, Y.-S.; Lou, Z.-P.; Sun, C.-C.; Sun, S. Ecological Environment Changes in Daya Bay, China, from 1982 to 2004. Mar. Pollut. Bull. 2008, 56, 1871–1879. [Google Scholar] [CrossRef]
  15. Li, K.; Xu, E. High-Accuracy Continuous Mapping of Surface Water Dynamics Using Automatic Update of Training Samples and Temporal Consistency Modification Based on Google Earth Engine: A Case Study from Huizhou, China. ISPRS J. Photogramm. Remote Sens. 2021, 179, 66–80. [Google Scholar] [CrossRef]
  16. Liu, X.J.; Xü, J.N.; Kettner, A.J.; Wang, Y.; Yi, J.J. Decadal Shifts and Future Projections of the Han River Delta Coastline. Mar. Geol. 2025, 484, 107520. [Google Scholar] [CrossRef]
  17. Gairin, E.; Collin, A.; James, D.; Maueau, T.; Roncin, Y.; Lefort, L.; Dolique, F.; Jeanson, M.; Lecchini, D. Spatiotemporal Trends of Bora Bora’s Shoreline Classification and Movement Using High-Resolution Imagery from 1955 to 2019. Remote Sens. 2021, 13, 4692. [Google Scholar] [CrossRef]
  18. Mu, K.; Tang, C.; Tosi, L.; Li, Y.; Zheng, X.; Donnici, S.; Sun, J.; Liu, J.; Gao, X. Coastline Monitoring and Prediction Based on Long-Term Remote Sensing Data—A Case Study of the Eastern Coast of Laizhou Bay, China. Remote Sens. 2024, 16, 185. [Google Scholar] [CrossRef]
  19. Yang, F.; Zhang, L.; Chen, B.; Li, K.; Liao, J.; Mahmood, R.; Hasan, M.E.; Mamun, M.M.A.A.; Raza, S.A.; Sutrisno, D. Long-Term Change of Coastline Length along Selected Coastal Countries of Eurasia and African Continents. Remote Sens. 2023, 15, 2344. [Google Scholar] [CrossRef]
  20. Huang, L.; Zhao, C.; Jiao, C.; Zheng, G.; Zhu, J. Quantitative Analysis of Rapid Siltation and Erosion Caused Coastline Evolution in the Coastal Mudflat Areas of Jiangsu. Water 2023, 15, 1679. [Google Scholar] [CrossRef]
  21. Mansour, N.; Sarhan, T.; El-Gamal, M.; Nassar, K. Assessing the Compatibility of EPR Rates with One-Dimensional Numerical Modelling in Monitoring Shoreline Kinematics along with Supplying near/Long-Term Forecasts. Reg. Stud. Mar. Sci. 2024, 71, 103391. [Google Scholar] [CrossRef]
  22. Rafi, S.; Mourya, N.K.; Balasani, R. Evaluation of Shoreline Alteration Along theJagatsinghpur District Coast, India (1990–2020) Using DSAS. Ocean Coast. Manag. 2024, 253, 107132. [Google Scholar] [CrossRef]
  23. Rahbani, M.; Ghaderi, D. Long Term Investigation on Shoreline Changes of an Island, Inside a Gulf (Hormuz Island). Reg. Stud. Mar. Sci. 2024, 71, 103399. [Google Scholar] [CrossRef]
  24. Hu, X.; Wang, Y. Coastline Fractal Dimension of Mainland, Island, and Estuaries Using Multi-Temporal Landsat Remote Sensing Data from 1978 to 2018: A Case Study of the Pearl River Estuary Area. Remote Sens. 2020, 12, 2482. [Google Scholar] [CrossRef]
  25. Manno, G.; Lo Re, C.; Basile, M.; Ciraolo, G. A New Shoreline Change Assessment Approach for Erosion Management Strategies. Ocean Coast. Manag. 2022, 225, 106226. [Google Scholar] [CrossRef]
  26. Kappraff, J. The Geometry of Coastlines: A Study in Fractals. Comput. Math. Appl. 1986, 12, 655–671. [Google Scholar] [CrossRef]
  27. Colak, A.T.I. Geospatial Analysis of Shoreline Changes in the Oman Coastal Region (2000–2022) Using GIS and Remote Sensing Techniques. Front. Mar. Sci. 2024, 11, 1305283. [Google Scholar] [CrossRef]
  28. Al-Attar, I.M.S.; Basheer, M.A. Multi-Temporal Shoreline Analysis and Future Regional Perspective for Kuwait Coast Using Remote Sensing and GIS Techniques. Heliyon 2023, 9, e20001. [Google Scholar] [CrossRef]
  29. Yuan, R.; Xu, R.; Zhang, H.; Hua, Y.; Zhang, H.; Zhong, X.; Chen, S. Detecting Shoreline Changes on the Beaches of Hainan Island (China) for the Period 2013–2023 Using Multi-Source Data. Water 2024, 16, 1034. [Google Scholar] [CrossRef]
  30. Anthony, E.J.; Dussouillez, P.; Dolique, F.; Besset, M.; Brunier, G.; Nguyen, V.L.; Goichot, M. Morphodynamics of an Eroding Beach and Foredune in the Mekong River Delta: Implications for Deltaic Shoreline Change. Cont. Shelf Res. 2017, 147, 155–164. [Google Scholar] [CrossRef]
  31. Yang, L.; Li, J.; Yuan, Q.; Xu, L.; Lu, X.; Wang, M.; Zhao, S. Spatial-Temporal Changes of Continental Coastline in Southern China. J. Mar. Sci. 2014, 32, 42–49. [Google Scholar] [CrossRef]
  32. Hu, R.; Yao, L.; Yu, J.; Chen, P.; Wang, D. Remote Sensing of the Coastline Variation of the Guangdong–Hongkong–Macao Greater Bay Area in the Past Four Decades. J. Mar. Sci. Eng. 2021, 9, 1318. [Google Scholar] [CrossRef]
  33. Gao, W.; Du, J.; Gao, S.; Xu, Y.; Li, B.; Wei, X.; Zhang, Z.; Liu, J.; Li, P. Shoreline Change Due to Global Climate Change and Human Activity at the Shandong Peninsula from 2007 to 2020. Front. Mar. Sci. 2023, 9, 1123067. [Google Scholar] [CrossRef]
Figure 1. Location of study area. (a) Location map of Huizhou–Shanwei. (b) Huizhou–Shanwei in Guangdong Province. (c) Overview map of the study area.
Water 17 01460 g001
Figure 2. Location of the shorelines in different periods of Huizhou–Shanwei; (a) Significant shoreline artificial; (b) Shoreline changes of the lagoon; (c) Shoreline changes in the northern part of Honghai Bay; (d) Shoreline changes in the estuary.
Water 17 01460 g002
Figure 3. Changes in shoreline types and length in Huizhou–Shanwei.
Water 17 01460 g003
Figure 4. Combination picture of Huizhou–Shanwei EPR changes, baseline and shorelines.
Water 17 01460 g004
Figure 5. Changes in socio-economic indicators in Huizhou–Shanwei Region; (a) Changes in population and GDP; (b) Changes in industry proportions in Huizhou and Shanwei cities. Note: A: Percentage of tertiary industry in Huizhou. B: Percentage of secondary industry in Huizhou. C: Percentage of primary industry in Huizhou. X: Percentage of primary industry in Shanwei. Y: Percentage of secondary industry in Shanwei. Z: Percentage of tertiary industry in Shanwei.
Water 17 01460 g005
Table 1. The basic information of remote sensing images in this study.
Landsat Scene IdentifierSatellite and Sensor IdentifierPath/
Row
Spatial
Resolution
DateCloud Cover
LT51210441990327BJC00LANDSAT5 TM121/4430 m23 November 19900
LT51210441995085CLT03LANDSAT5 TM121/4430 m26 March 19950
LT51210442000259BJC00LANDSAT5 TM121/4430 m15 September 20000
LT51210442005064BJC00LANDSAT5 TM121/4430 m5 March 20050
LE71210442010342EDC00LANDSAT7 ETM121/4430 m8 December 20100
LC81210442015220LGN01LANDSAT8_OLI_TIRS121/4430 m8 August 20155.96
LC81210442020106LGN00LANDSAT8_OLI_TIRS121/4430 m15 April 20204.88
LC91210442023106LGN00LANDSAT9_OLI_TIRS121/4430 m16 April 20230.58
Table 2. Types and their description.
TypePhotoDescription
artificialWater 17 01460 i001It is grayish-white and linear, with a straight waterside line; farmed areas or salt flats are regularly blocky.
biogenicWater 17 01460 i002
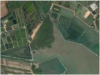
Shorelines with predominantly mangrove-growing and other marine forested shores are imaged in patches.
sandyWater 17 01460 i003
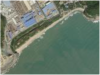
Smooth water’s edge; bright white, even tone in areas not reached by the tide, darker tone in areas wetted by the tide; strips of beach with clear boundaries to land vegetation and sea water
muddyWater 17 01460 i004Darker color tone, dense vegetation on one side, sparse or no vegetation on the other, generally with tidal flume development.
rockyWater 17 01460 i005It has typical textural features. The rocks are light-toned and striped on remote sensing images, and the coast is often dotted with reefs, boulders, sea cliffs and other landforms.
estuarineWater 17 01460 i006
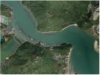
Located at the mouth of the Sea River, it is irregular in shape and undergoes a marked change in hue.
Table 3. Length (km) and artificial index of each type of shorelines in Huizhou–Shanwei.
TypesArtificialBiogenicSandyMuddyRockyEstuarineAll I A
Years
1990178.539.90187.698.73223.828.04616.710.2895
1995180.337.90186.387.84223.001.38606.830.2972
2000185.847.90183.818.83216.001.38603.760.3078
2005269.127.80166.249.70163.681.35617.890.4356
2010274.767.13165.9315.75159.221.35624.140.4402
2015295.1313.66174.4012.08133.811.28630.350.4682
2020281.4312.97187.2610.50140.751.28634.190.4438
2023271.683.11194.725.08157.040.90632.540.4295
Table 4. Intensity of change of Huizhou–Shanwei shorelines.
TypeArtificialBiogenicSandyMuddyRockyEstuarineTotal
Period
1990–19950.20%−4.05%−0.14%−2.04%−0.07%−16.57%−0.32%
1995–20000.61%0.00%−0.28%2.52%−0.63%0.00%−0.10%
2000–20058.96%−0.25%−1.91%1.98%−4.85%−0.40%0.47%
2005–20100.42%−1.71%−0.04%12.47%−0.54%0.00%0.20%
2010–20151.48%18.30%1.02%−4.66%−3.19%−1.14%0.20%
2015–2020−0.93%−1.00%1.48%−2.61%1.04%0.00%0.12%
2020–2023−1.15%−25.35%1.33%−17.22%3.86%−9.69%−0.09%
1990–20231.58%−2.08%0.11%−1.27%−0.90%−2.69%0.08%
Table 5. Indicators of the fractal dimension of the shorelines at each stage of Huizhou–Shanwei.
YearEquation of Linear RegressionR2Fractal Dimension
1990 y = 1.0395 x + 5.9578 0.99971.0395
1995 y = 1.04 x + 5.9517 0.99971.04
2000 y = 1.0447 x + 5.9582 0.99951.0447
2005 y = 1.0594 x + 5.9871 0.99961.0594
2010 y = 1.0615 x + 5.9953 0.99961.0615
2015 y = 1.0671 x + 6.0069 0.99961.0671
2020 y = 1.0673 x + 6.0097 0.99971.0673
2023 y = 1.0662 x + 6.0084 0.99961.0662
Disclaimer/Publisher’s Note: The statements, opinions and data contained in all publications are solely those of the individual author(s) and contributor(s) and not of MDPI and/or the editor(s). MDPI and/or the editor(s) disclaim responsibility for any injury to people or property resulting from any ideas, methods, instructions or products referred to in the content.

