Article

Perceptions and Adaptive Behaviors of Farmers

1
School of Geographic and Environmental Science, Guizhou Normal University, Guiyang 550025, China
2
State Key Laboratory Incubation Base for Karst Mountain Ecology Environment of Guizhou Province, Guiyang 550025, China
3
Acadamy of Ecological Civilization, Guizhou Normal University, Guiyang 550025, China
4
College of Water Sciences, Beijing Normal University, Beijing 100875, China
5
Research Centre for Black River Water Resources and Ecological Protection, Lanzhou 730030, China
*
Author to whom correspondence should be addressed.
Water 2025, 17(13), 1993; https://doi.org/10.3390/w17131993
Submission received: 22 April 2025 / Revised: 26 June 2025 / Accepted: 28 June 2025 / Published: 2 July 2025

Abstract

A clear understanding of drought perceptions and adaptation behaviors adopted by farmers is an important way to cope with climate change and achieve sustainable agricultural development. Karst is a type of landscape where the dissolving of the bedrock has created sinkholes, sinking streams, caves, springs, and other characteristic features. The study took the Huajiang karst dry-hot river valley area located in the southwestern part of Guizhou as the study area and used questionnaire survey method, the index of perception and the diversity index of adaptation strategy to explore the risk perception, adaptation perception and adaptation behavior of farmers to non-climatic droughts in the subtropical karst dry-hot valleys. A total of 530 questionnaires were distributed and 520 were returned. The results show that (1) the farmers’ risk perception of drought is stronger than adaptation perception, which shows that although farmers are well aware of the possible risks posed by drought, their subjective initiative and motivation to adapt to drought are weaker; (2) in the face of drought, farmers prioritize selected non-farm measures for adaptation, followed by crop management and finally water resource management; and (3) compared to farmers in arid and semi-arid regions, those in karst hot-dry river valleys exhibit distinct adaptive behaviors in response to drought, particularly in water resource management.

1. Introduction

The intensification of global warming and climate change has profoundly impacted the global climate system, with its relationship to drought being particularly significant. Studies have shown that climate warming causes abnormal atmospheric circulation, alters the spatiotemporal distribution of precipitation, and accelerates water evaporation, directly exacerbating the severity and scope of droughts. Meanwhile, drought and global warming form a vicious cycle: drought reduces vegetation cover and weakens the carbon sink capacity of land ecosystems, further driving climate warming.
Mounting evidence from precipitation anomalies, hydrological runoff deficits, and standardized drought indices documents indicate accelerating aridity trends across global terrestrial ecosystems [1,2]. As a persistent meteorological hazard, drought exerts cascading impacts on agricultural sustainability through hydrological depletion, crop failure cascades, and livestock mortality spikes [3,4,5]. Farmers, as the primary actors in agricultural activities, are the most vulnerable to the impacts of drought due to the fragility of their livelihoods [6,7]. Consequently, they adopt appropriate adaptation strategies to mitigate the effects of drought, based on their accurate perceptions and experiential knowledge of the phenomenon [8,9,10]. Systematic analysis of farmers’ drought perception–behavior linkages provides critical insights for climate-resilient agricultural policymaking.
Contemporary scholarship has yielded critical insights through empirical investigations of farmers’ drought perceptions and adaptive responses: (1) Drought manifests as the most pervasive natural hazard, surpassing other disasters in population impact. Its cascading socioecological effects include agricultural productivity collapse, fluvial system failures, nutrition insecurity, epidemic emergence, and resource-driven conflicts [11]. (2) In regions with different water resource security conditions, farmers’ perceptions of drought severity vary. A study conducted by dividing China into drought-prone and flood-prone counties found that 63.1% of farmers in drought-prone counties perceived an intensification of drought, while only 32.4% of farmers in flood-prone counties reported an increase in drought severity [12]. In drought-prone areas of Afghanistan, farmers in rainfed regions and irrigated areas also had different perceptions of drought. In rainfed regions, 80% of farmers perceived that drought was becoming more severe, while only 50% of farmers in irrigated areas had the same perception [8]. (3) Farmers’ adaptive behaviors in response to drought are diverse, but primarily revolve around agricultural activities and water needs for daily life [13]. In the Shaanxi North region of China, farmers proactively adopt adaptation strategies, such as increasing irrigation frequency and expanding plastic film coverage, to mitigate the impact of drought on crop yields [14]. In Maharashtra, India, farmers alleviate the effects of drought on daily water supply by deepening wells, drilling boreholes, and using water pumps [15]. (4) Farmers’ drought risk perception positively influences their adoption of adaptive measures. Such perception constitutes a prerequisite for adaptation actions [16], with its intensity directly shaping behavioral choices [17]. Specifically, farmers perceiving severe drought risks demonstrate stronger inclinations to implement preventive strategies [18].
Evidently, existing studies have provided in-depth analyses of drought impacts, farmers’ risk perception, and adaptive behaviors. However, these investigations predominantly focus on arid/semi-arid regions where droughts originate from climatic factors, limiting their applicability to the subtropical karst dry-hot valley region characterized by unique non-climatic drought mechanisms. In karst dry-hot valley regions, drought formation primarily results from the spatial convergence of two geomorphic drivers. This distinctive drought mechanism primarily stems from the spatial superposition of two non-climatic factors: karst subsurface conditions and valley topography. (1) Karst subsurface dynamics: the region exhibits a dual hydrologic–geomorphic structure with thin soil layers and highly permeable bedrock [19,20], which facilitates rapid rainwater infiltration, causing surface water deficits despite high precipitation [21,22]. (2) Valley geomorphology: steep terrain amplifies foehn effects, creating microclimates where evaporation rates chronically exceed rainfall inputs [23], resulting in persistent surface aridity. Such distinct drought etiology may differentially shape farmers’ risk cognition and adaptation strategies compared to climatic drought zones.
Karst dry and hot river valleys are characterized by significant droughts and their impact on agriculture [24,25]. In terms of drought characteristics, the frequency of drought is high, and the surface water of the valley floor dries up for more than 2 months in extreme drought years, and the frequency of drought tends to increase with climate change [26]; spatially the valley floor has the highest intensity of drought, and due to the effect of the dry-heated river valleys and the influence of the karst hydrological structure, it has a high evapotranspiration and is difficult for the surface water to store [27]. Agriculture in the region is dominated by the cultivation of drought-tolerant cash crops such as pepper [28]. Studies have shown that droughts have led to significant yield reductions in traditional crops such as maize, which can be as high as 50–80 percent, while peppers and dragon fruits, with their deep root systems and low evapotranspiration, have reduced their yields by as much as 20–30 percent [25]. Meanwhile, drought accelerates soil degradation, decreasing the total nitrogen content in the 0–20 cm soil layer and affecting biodiversity [24]. Although local adaptation measures such as water diversion and hedging are taken [26], they face challenges such as market price fluctuations [28]. Therefore, it is important to study the perception and adaptation behavior of farmers to drought in the karst dry and hot valley area.
Nevertheless, empirical understanding of drought perception–behavior linkages in karst dry-hot valley region remains deficient, hindering both theoretical advancements in non-climatic drought adaptation research and evidence-based policy formulation.
Accordingly, this study selects the Huajiang karst dry-hot valley region in southwestern Guizhou Province as the research area. Employing farmer surveys combined with the drought perception index and adaptive strategy diversity index, we investigate farmers’ risk perception and adaptive capacity regarding drought, and how these perceptual dimensions jointly influence their behavioral adaptations. The study specifically aims to (1) quantify the divergence between drought risk perception and adaptive efficacy assessments; (2) systematize the typology and implementation pathways of drought adaptation strategies; and (3) identify geomorphologically constrained particularities in farmers’ adaptive decision-making within the karst dry-hot valley region’s unique drought regime.
These findings will advance theoretical frameworks for climate adaptation in karst geoecosystems, while providing evidence-based guidance for enhancing agricultural sustainability initiatives and drought resilience policymaking in analogous fragile ecosystems.

2. Materials and Methods
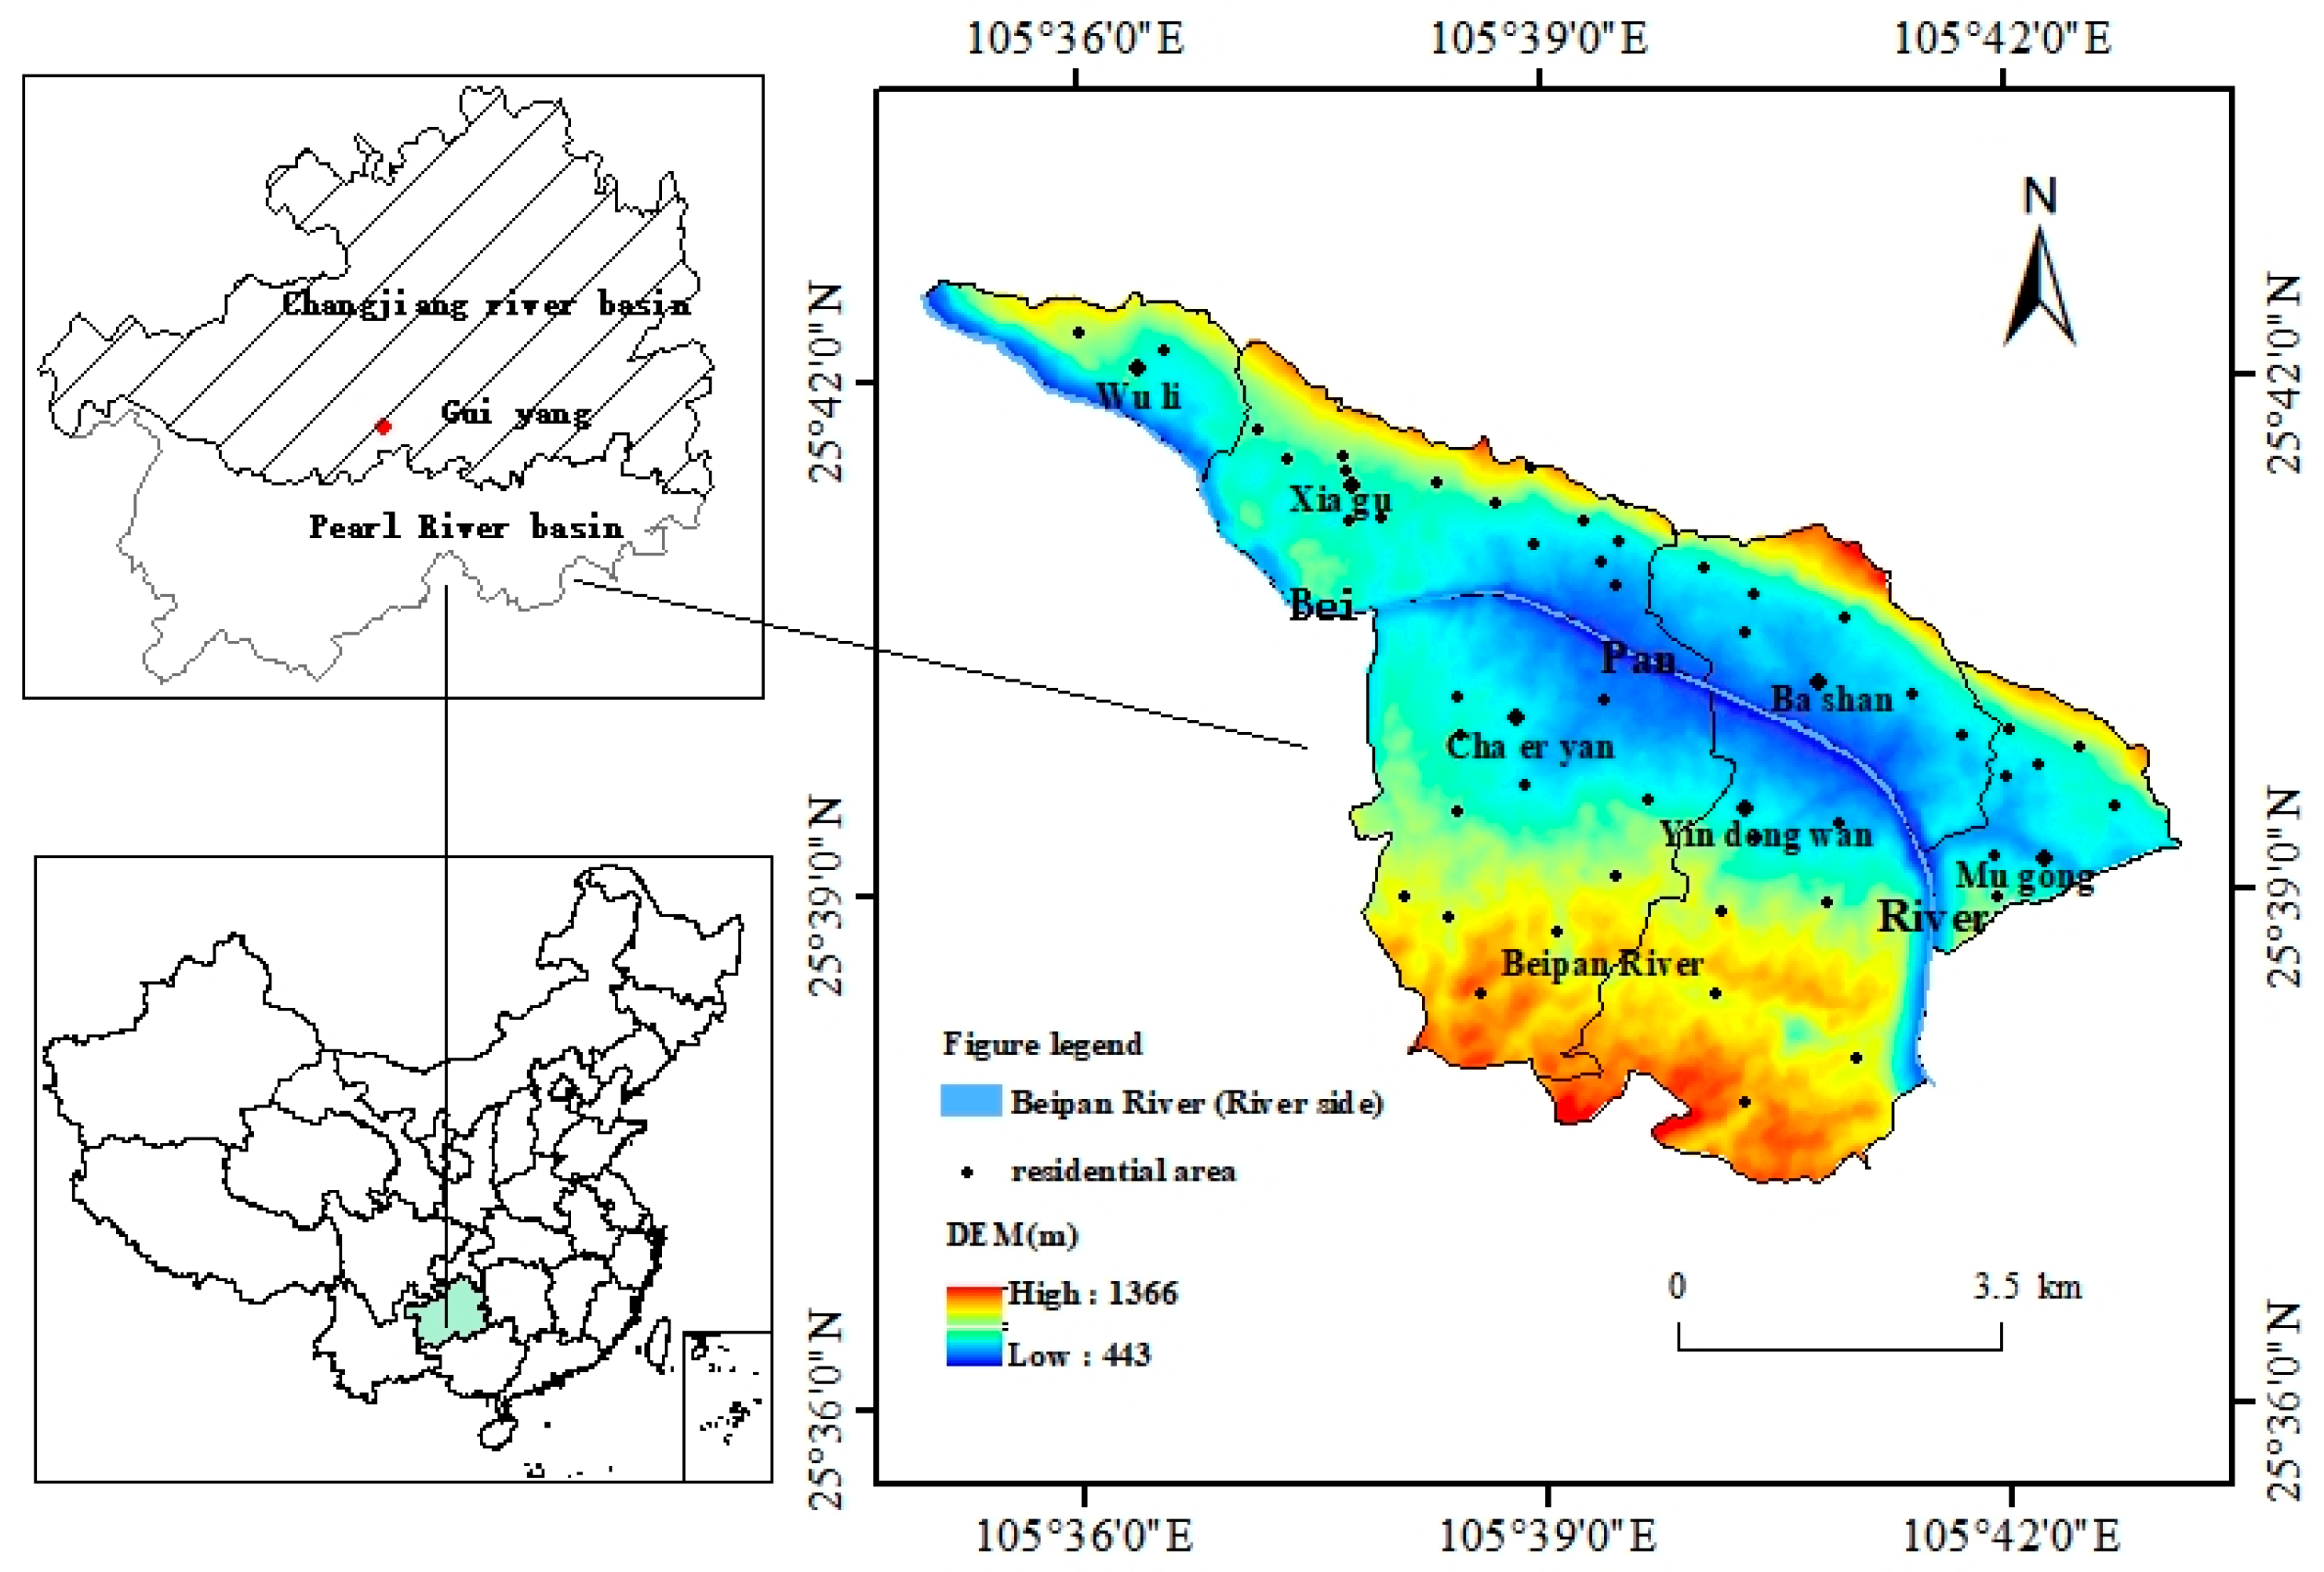
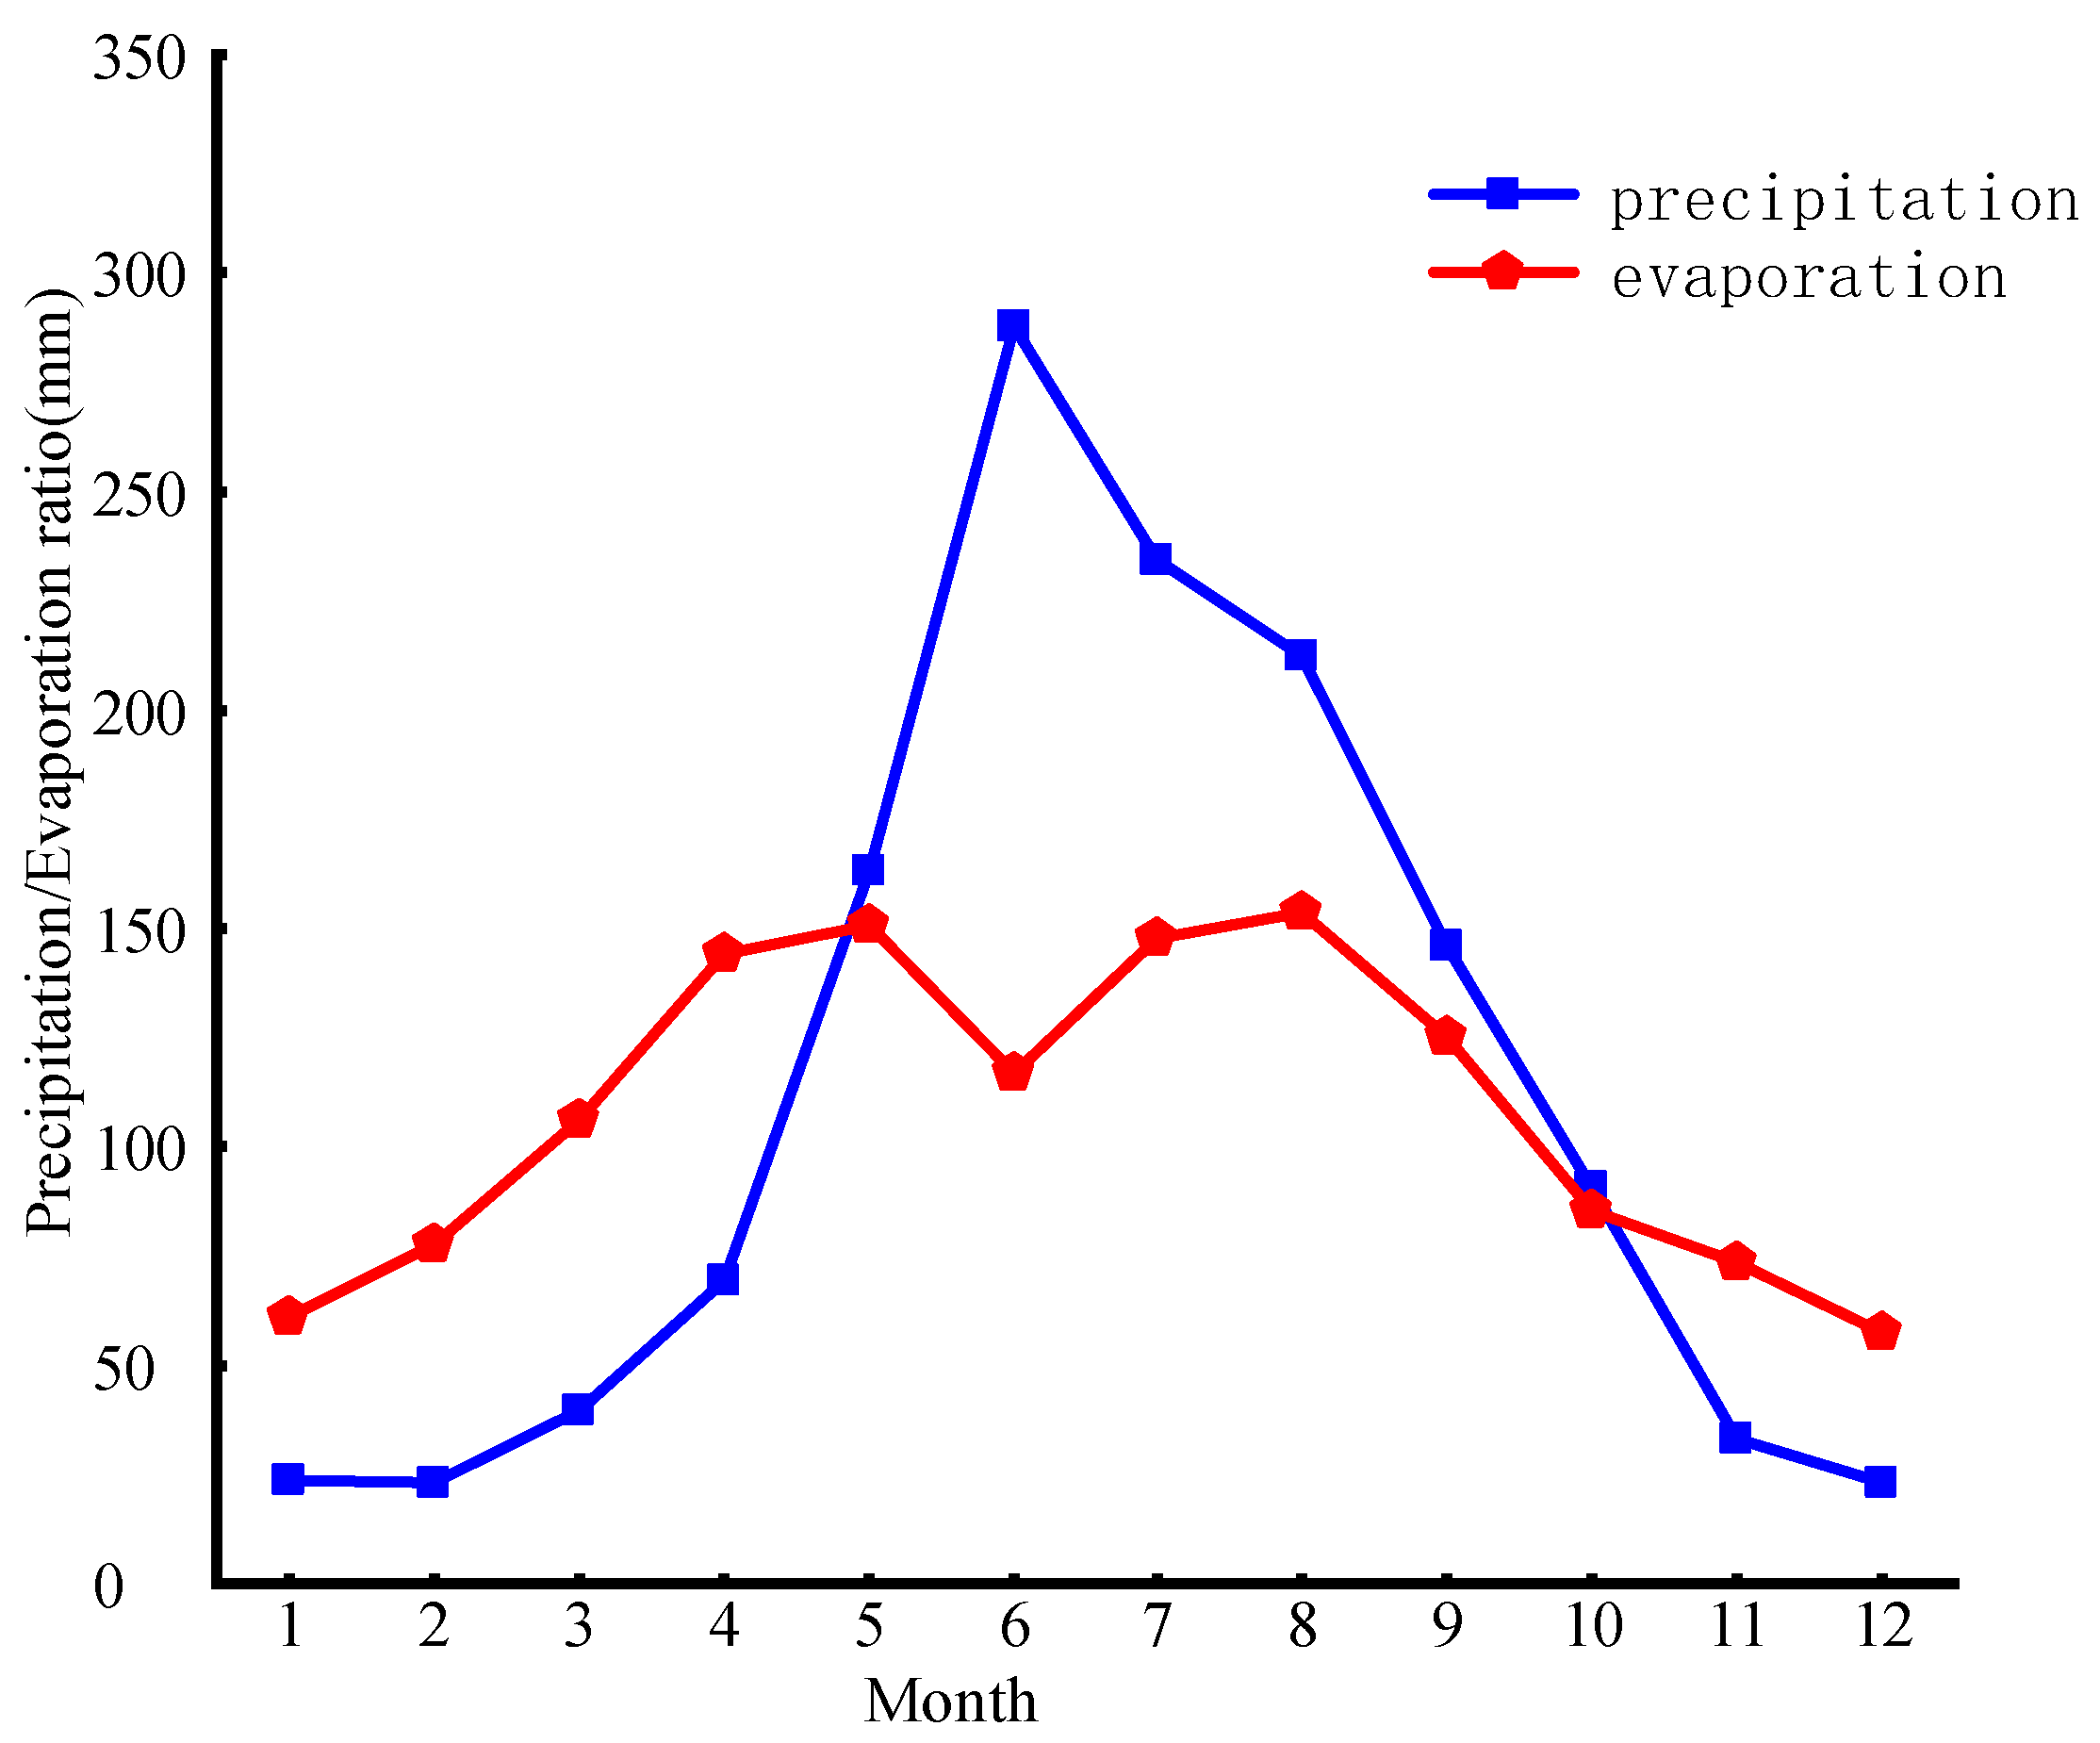
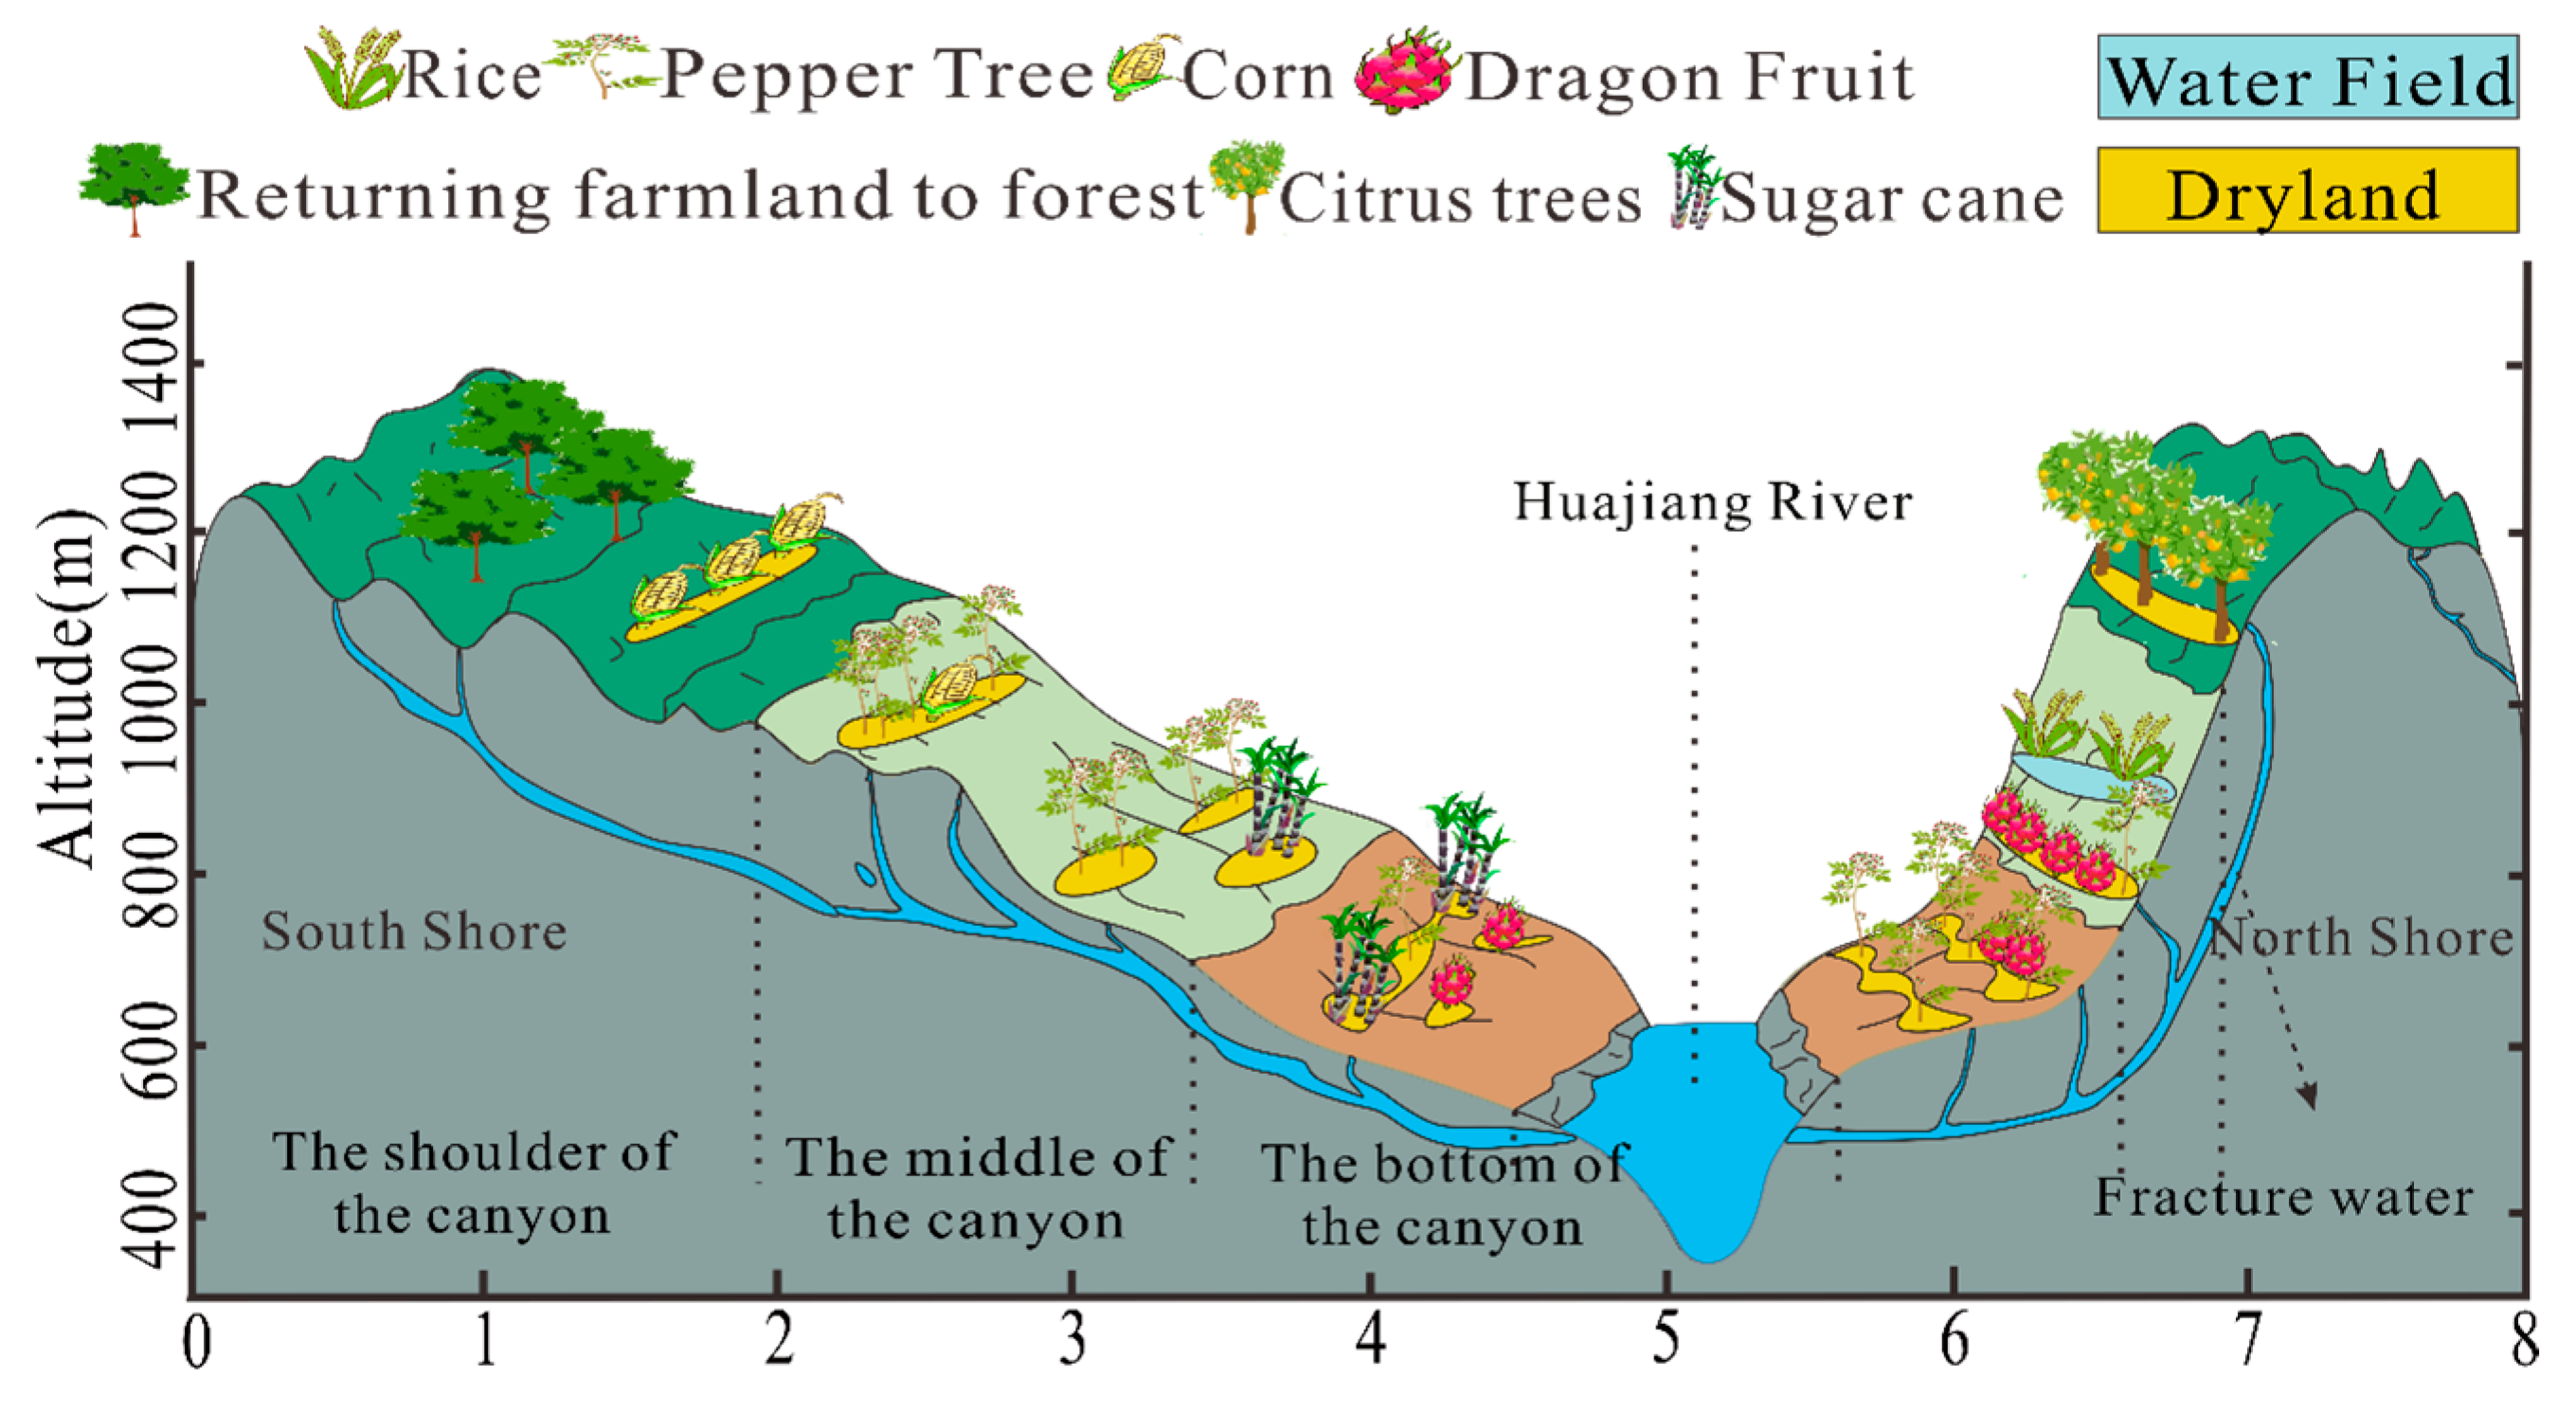
2.1. Study Area

The Huajiang karst dry-hot valley region is a karst area characterized by unique geological features resulting from the dissolution of soluble bedrock, particularly limestone and dolomite, by water. These landscapes are marked by caves, underground streams, sinkholes, and other distinctive landforms. It is situated along both banks of the Beipanjiang River (Huajiang section) south of Guanling Autonomous County and north of Zhenfeng County, Guizhou Province, China (105°35′00″–105°43′05″ E, 25°37′20″–25°42′36″ N; Figure 1). covering a total area of 51.62 km2, with karst landscapes constituting 87.91% of the territory and rocky desertification affecting 49% of the area. Elevation ranges from 446 to 1359 m (relative relief: 913 m), characterized by steep mountainous terrain and significant topographic relief. The area exhibits typical dry-hot valley climate features, with a multi-year average precipitation of 1100 mm (83% concentrated from May to October) and an average annual evaporation of 1300 mm. The mean annual temperature is 18.4 °C. Seasonal drought occurs frequently, with the most severe aridity persisting from October to April of the following year (Figure 2). The maximum discrepancy between evaporation and precipitation reaches 74.86 mm in June, posing significant challenges to farming and local livelihoods. The characteristics of its crops, land use and water resources are profoundly affected by the drought environment [24,25]. In terms of crops, drought-resistant cash crops, such as peppers and navel oranges, are dominant, with planting areas accounting for more than 40% of arable land and output values accounting for 50% of agricultural income; traditional maize, which has suffered severe yield reductions due to drought, has seen its planting area drastically reduced [28]. Land use shows a vertical zoning pattern, with cash crops on the valley floor, mixed cropping on the valley slopes, and ecological conservation on the valley shoulders [27]. The vegetation cover has been increased from 30% to 55% through the ‘slope to ladder’ and ‘agriculture and forestry complex’ management measures [24]. In terms of water resources, spatial and temporal precipitation is uneven, evaporation is exacerbated by the effect of dry and hot river valleys, and surface water leakage is serious due to the karst landscape [26]. The local area relies on projects such as small water cellars and inter-regional water diversion, combined with agronomic measures such as mulching to conserve moisture, to cope with water scarcity, but still faces challenges such as insufficient water conservancy facilities and water quality pollution [28]. As of 2023, the study area administratively comprises six villages (Cha’eryan, Yindongwan, Mugong, Bashan, Xiagu, and Wuli), organized into 45 villager groups, with a total of 1954 households and 9462 residents.

2.2. Questionnaire Design and Data Acquisition

A structured questionnaire survey was conducted to collect data on farmers’ perceptions of drought and their adaptive behaviors. Guided by social cognitive theory [29], the questionnaire categorized perceptions into risk perception including sensitivity perception and severity perception and adaptive perception comprising perceived adaptation efficacy, self-efficacy, and adaptation cost perception (Table 1). The survey instrument covered four key dimensions: (1) Demographic characteristics of farmers (Table 2); (2) Drought risk perception; (3) Drought adaptation perception; and (4) Drought adaptation behaviors.
In this study, sampling was organized around multiple segments to ensure the scientific and representative nature of the sample. In terms of sampling design, a random sampling method was used to obtain a complete list of farm households from the village committees of each village as a sampling frame, which covered all the information of farm households in the study area. In the implementation stage, a 20-day field sampling survey was conducted in October 2023, and the investigator randomly selected the interviewed farmers in each village based on the principle of randomness, and the average interview length of each household was controlled at 50 min to ensure the adequacy and accuracy of data collection. A total of 520 questionnaires were distributed in the study, and 515 valid questionnaires were finally recovered, with a valid recovery rate of 98.5%. Statistically, the number of sampled farm households accounted for 98.5% of the total number of farm households in the study area, far exceeding the 5% threshold recommended by the cross-sectional household survey, indicating that the sample can adequately represent the characteristics of the group of farm households in the study area [30], which provides a reliable database for the subsequent analysis of farmers’ drought cognition and adaptation behavior.

2.3. Research Methodology

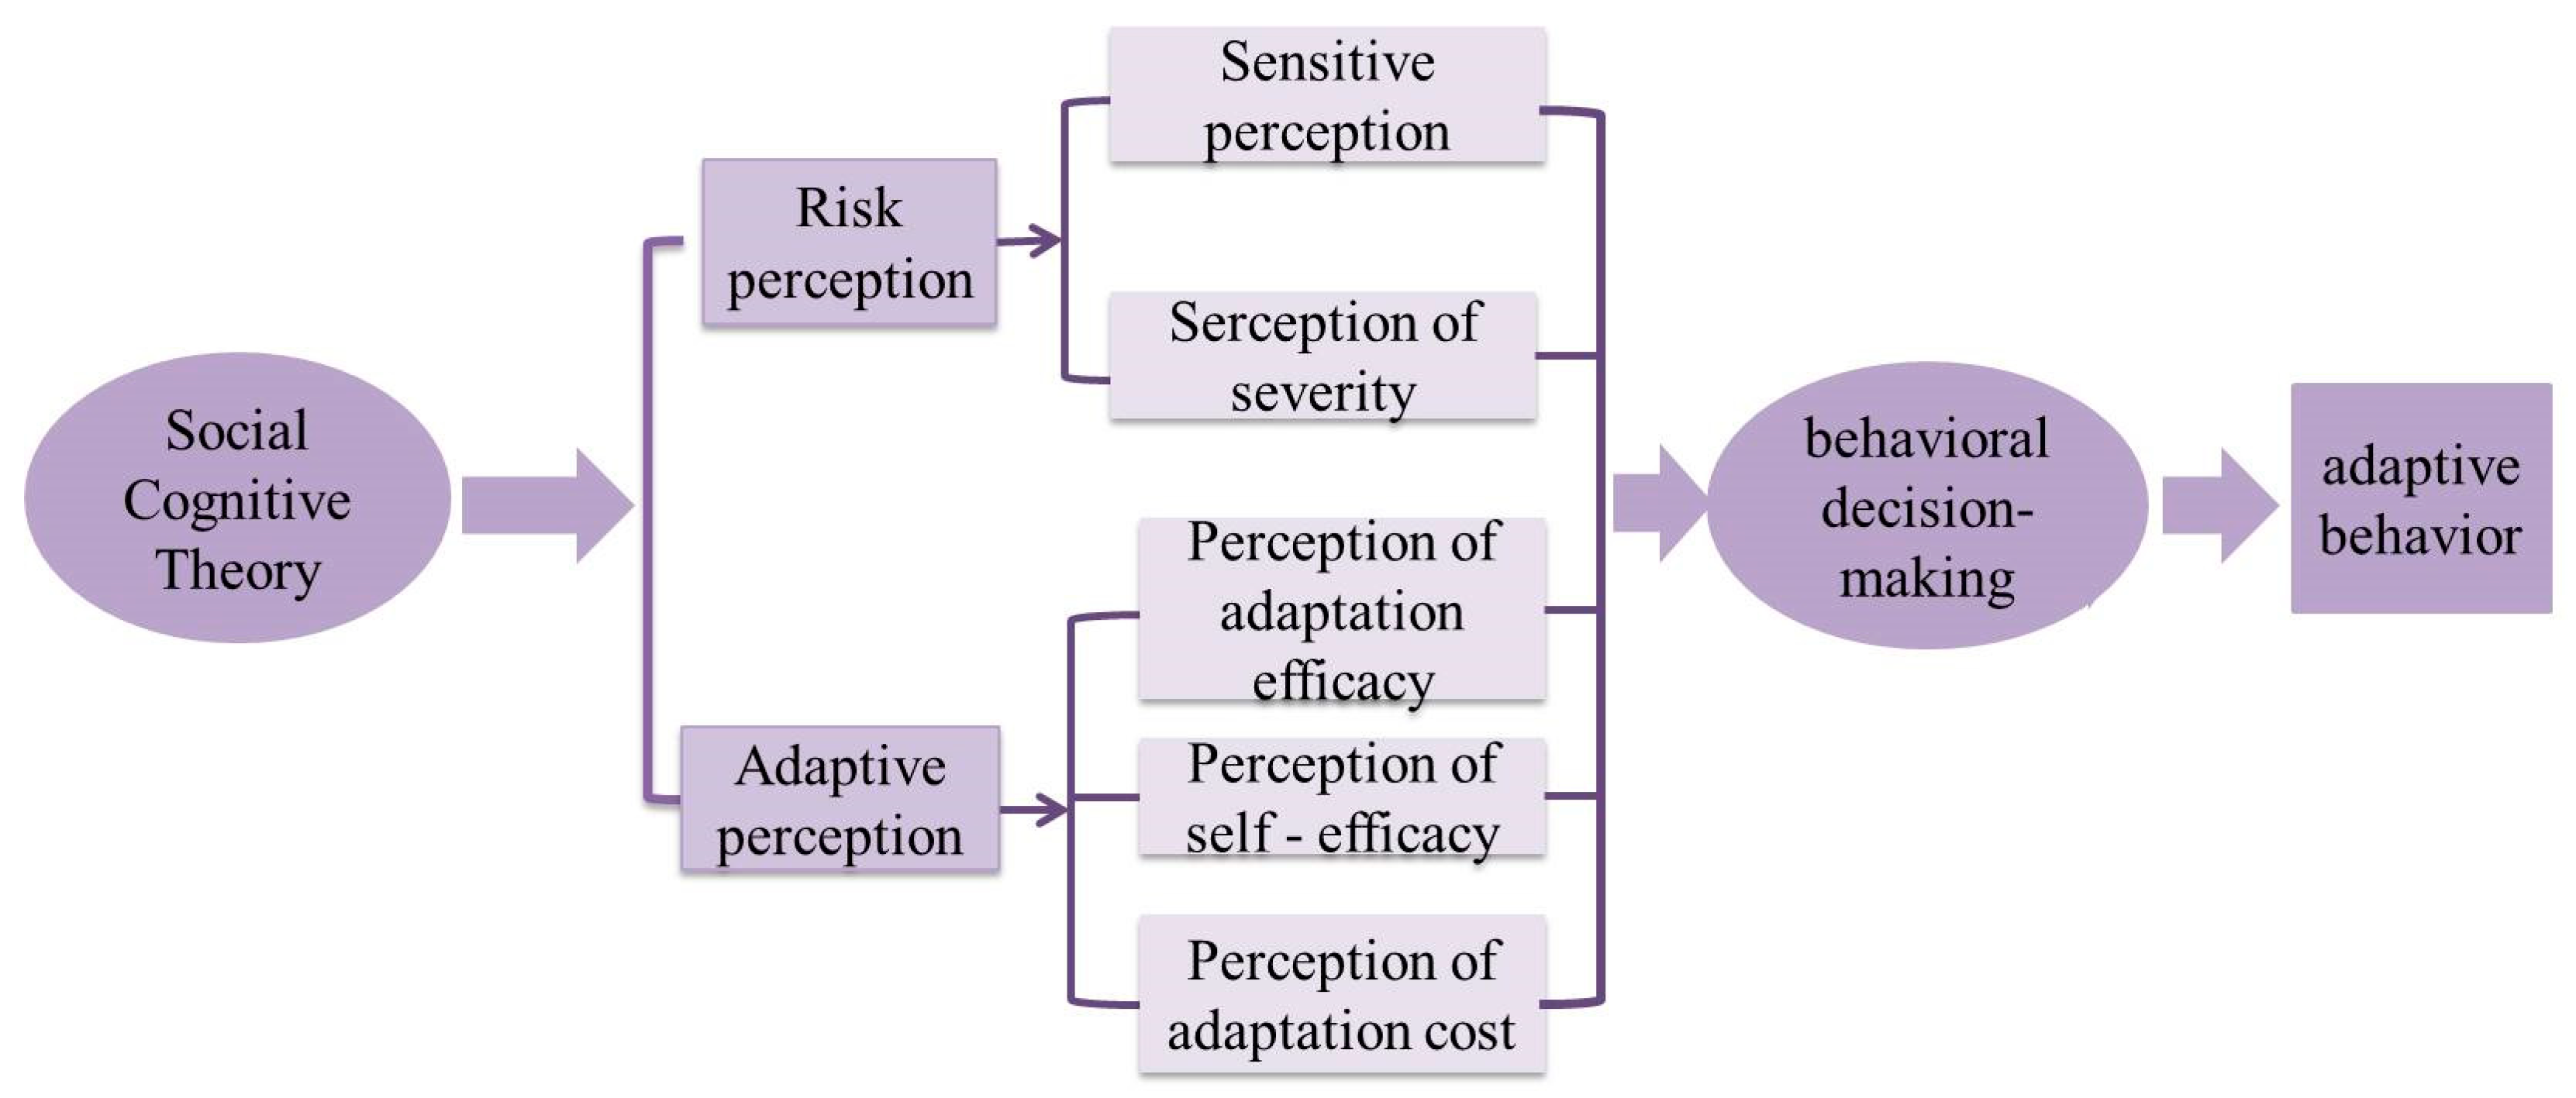
2.3.1. Theoretical Framework of the Study

Within the framework of social cognitive theory, Grothmann et al. conceptualized perception into two distinct dimensions: risk perception and adaptation perception [29]. Risk perception serves as a prerequisite for farmers’ adoption of adaptive behaviors, while the specific choice of adaptation strategies is ultimately governed by adaptation perception. Farmers’ selection of adaptive measures is influenced not only by drought risk perception but also by multifaceted factors encapsulated in adaptation perception, including cost-benefit analysis of adaptation (human, material, and financial resources), effectiveness evaluation of implemented measures, and confidence in drought resistance capabilities [29]. These two perceptual components jointly determine farmers’ adaptive decision-making, forming an indispensable dual mechanism in the behavioral selection process (Figure 3).

2.3.2. General Characteristics of Farmers

Drawing on Zhao Xueyan’s livelihood typology framework [31,32] and contextualizing to our study area’s farmers characteristics, we classify farmers into four distinct categories (Table 3): pure farmers, part-time farmers, multiple occupations farmers, and non-farmers to analyze their general characteristics (Table 3). The definitions are as follows: (1) pure farmers: farmers whose primary livelihood source is agricultural production, agricultural income as a percentage of 100%; (2) part-time farmers: farmers with two main livelihood sources, one of which is agriculture, agricultural income as a percentage of 50–100%; (3) multiple occupations farmers: farmers possessing three or more livelihood sources, one of which includes agriculture, agricultural income as a percentage of 10–50%; (4) non-farmers: farmers whose primary livelihood sources are non-agricultural activities, with agricultural income as less than 10%.

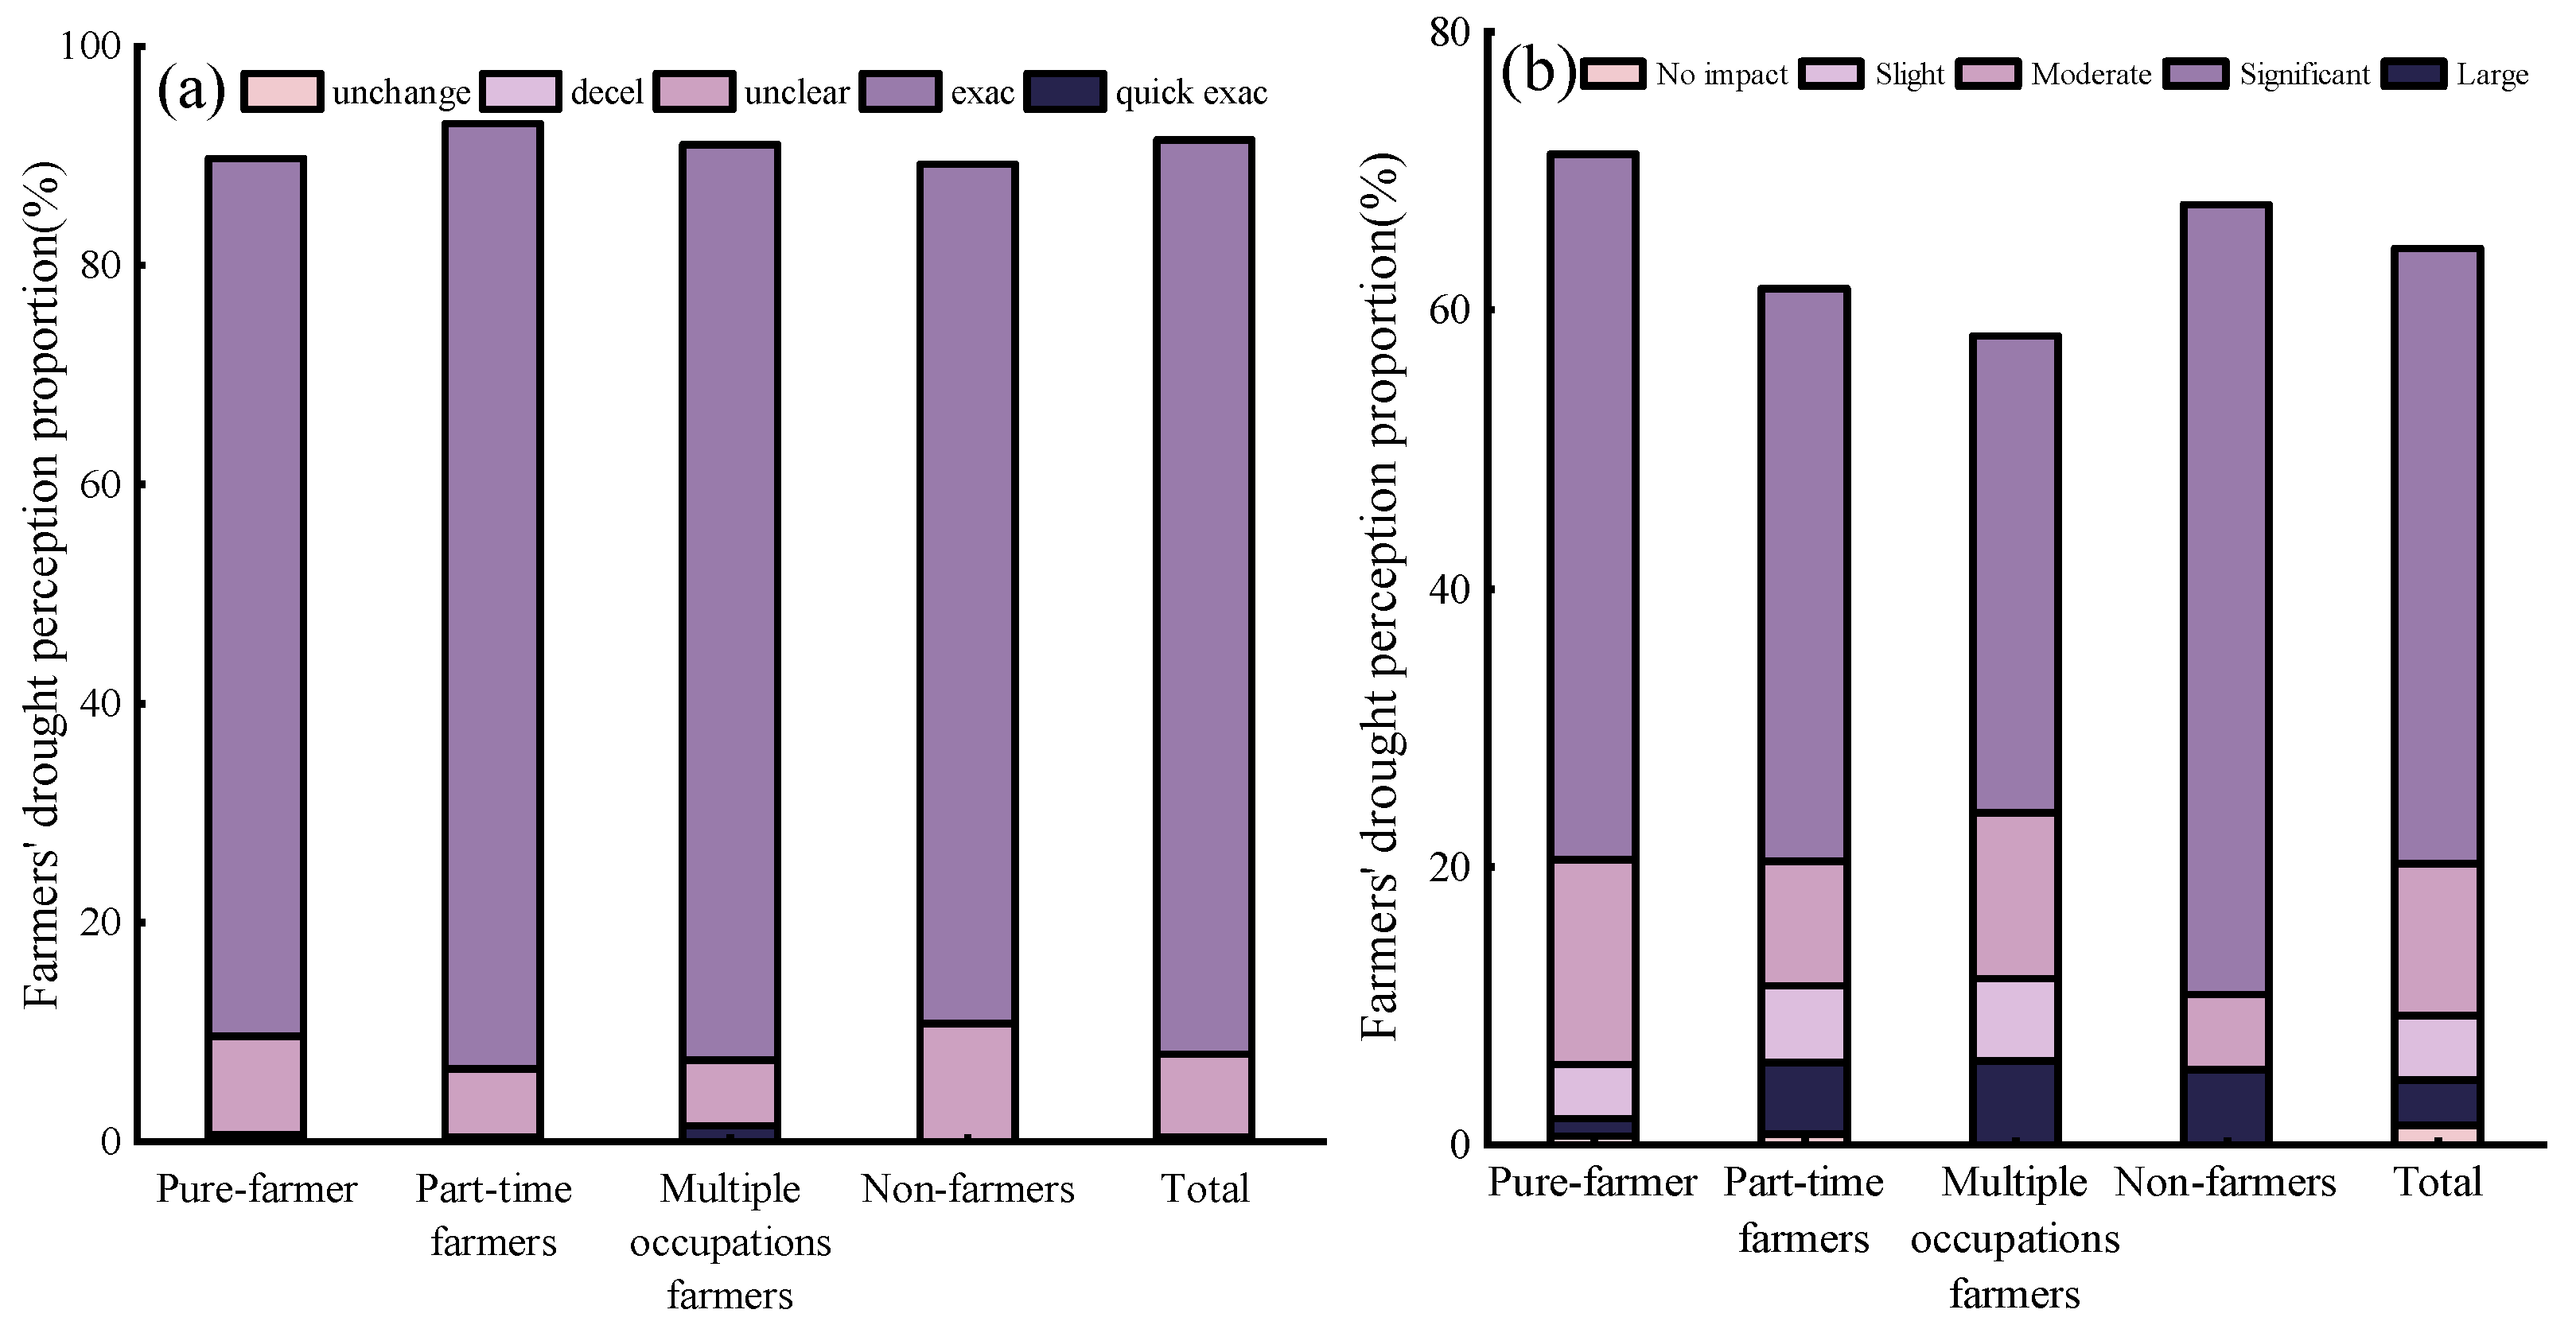
2.3.3. Perceived Intensity of Drought Among Farmers

Perceptivity index was used to analyze the strength of farmers’ perception of drought. The larger the perceptibility index, the stronger the farmers’ perception of drought, and vice versa, the weaker it is [9]. The calculation formula is
p m = 1 n i = 1 n p m i
In Equation (1), p m denotes the perception intensity level for the m-th category of the i-th farmers, where m indexes distinct perception dimensions. The variable p m i represents the quantified score of the m-th perception dimension for household i, assessed using a five-point Likert scale ranging from 1 (weak perception) to 5 (strong perception). Here, n denotes the number of assessment items corresponding to each perception category. A higher value of p m indicates stronger perception intensity among farmers regarding the specified dimension.

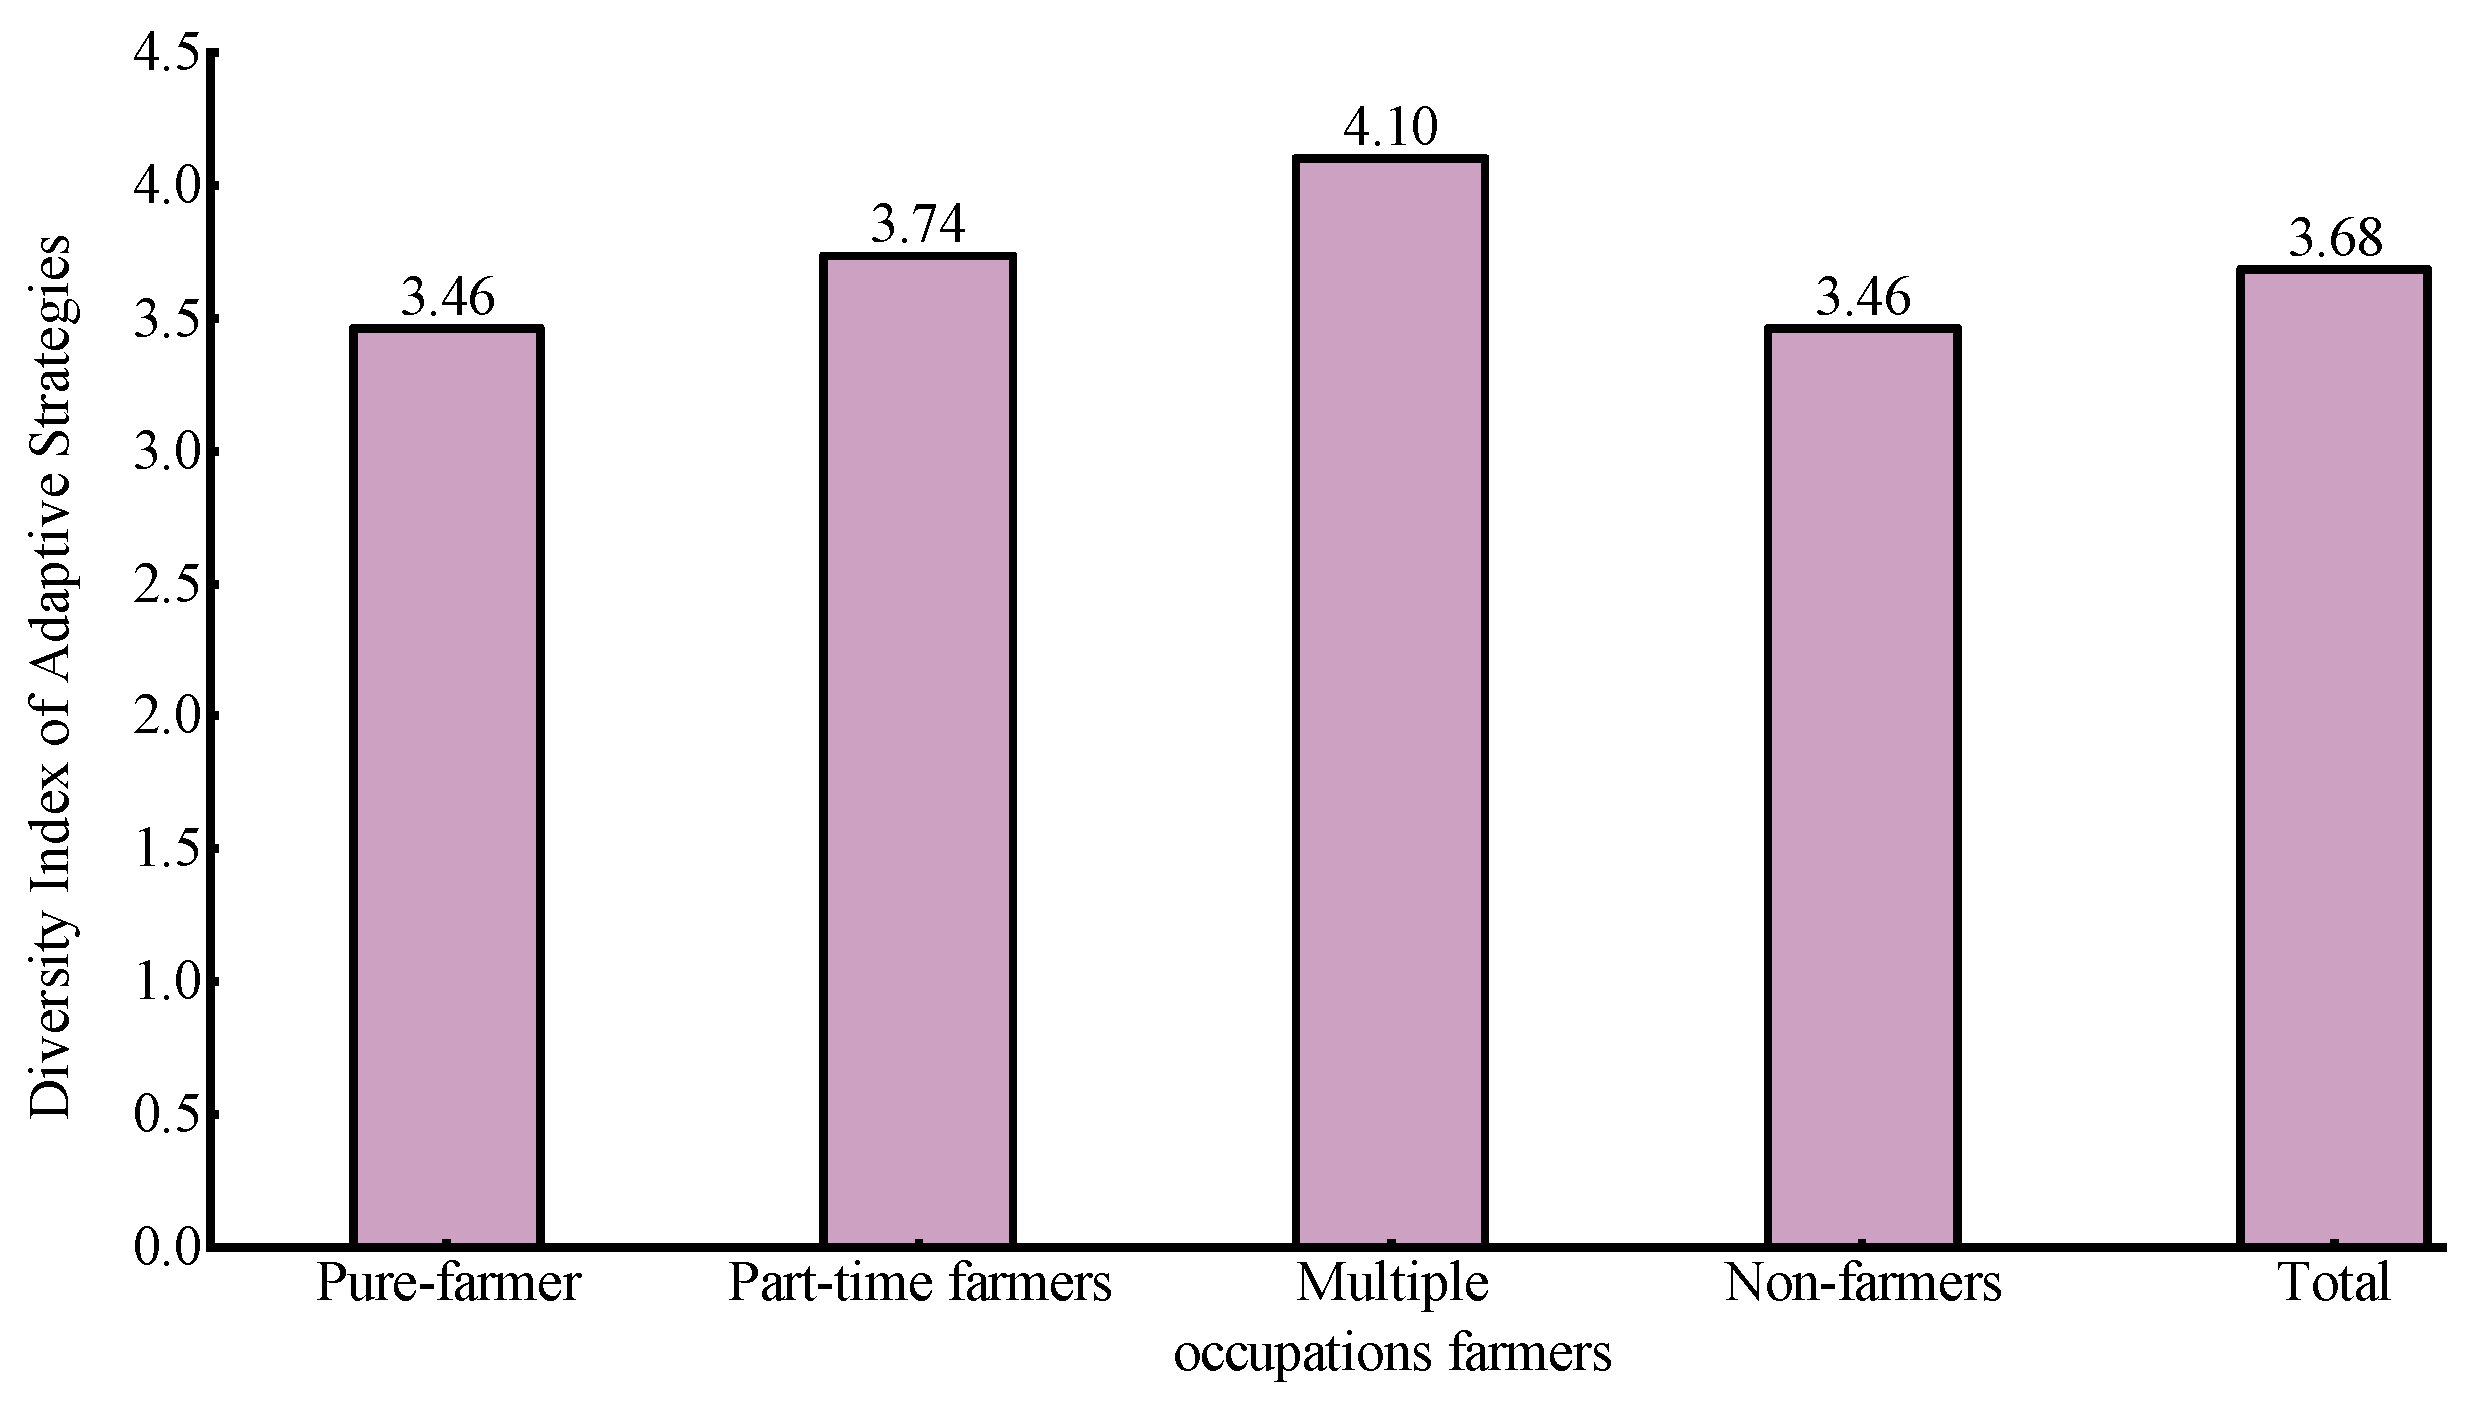
2.3.4. Degree of Diversification of Farmers’ Adaptation Behavior to Drought

The diversification of adaptation strategies index (ASDI) was used to reveal the degree of diversification of farmers’ adaptation behaviors to drought. If a farmer adopts one adaptation behavior, the ASDI is 1; if two adaptation behaviors are adopted, the ASDI is 2; and so on, i.e., if a farmer adopts several behaviors, his ASDI is several [33]. The calculation formula is
D = 1 n i = 1 n d i
In Equation (2), D is the ASDI of the study area, d i is the adaptation strategy diversification index of the ith farm household, and n is the number of surveyed farmers.

2.3.5. Impact of Farmers’ Drought Perceptions on Adaptive Behavioral Choices

A binary logistic regression model was used to analyze the effect of farmers’ drought perception on the choice of adaptation behavior. Its calculation formula is
l n p 1 p i = β 0 + i = 1 m β i X i
In Equation (3) the binary logistic regression model specifies farmers’ adoption decisions of specific adaptive behaviors as the dichotomous dependent variable Y, where Y = 1 denotes adoption and Y = 0 represents non-adoption. Let p i = p (Y = 1|X), representing the conditional probability of the i-th farmer adopting the target adaptive behavior, with 1 − p i corresponding to the non-adoption probability. The independent variable X i represents farmers’ perceptivity index, with age, labor share, farming experience, annual income per capita, and cultivated land area as control variables. The constant term β 0 remains invariant to X i . Regression coefficient β i quantifies the directional influence ( β i > 0: positive; β i < 0: negative) of predictors on adaptive behavior adoption probability. Given the study area’s homogeneous distribution of farmers along transportation corridors and riparian zones, spatial heterogeneity was excluded from the model.

3. Results

3.1. Reliability and Validity Tests

Reliability and validity of the survey data were verified through factor rotation and reliability analysis. The results demonstrated acceptable psychometric properties: Cronbach’s α coefficient (0.61), Kaiser–Meyer–Olkin (KMO) measure (0.72), and Bartlett’s test of sphericity (p < 0.05), confirming the data’s suitability for subsequent statistical analyses.

3.2. General Characteristics of Farmers

According to Table 4, the survey of 515 farmers revealed the following distribution patterns: farmers’ categories were ranked in descending order as multiple occupation time farmers (49.51%) > pure farmers (30.29%) > part-time farmers (13.01%) > non-farmers (7.19%). The average household size was 5.37 individuals per household, with a mean of 3.44 laborers per household. Educational attainment among laborers followed this hierarchy: primary education (36.89%) > junior secondary education (27.38%) > illiteracy (26.41%) > college or higher education (4.85%) > senior secondary education (4.47%). The mean annual family income reached 17,200 yuan. These findings demonstrate that (1) multiple occupation farmers and pure farmers constitute the predominant types in the study area; (2) the workforce predominantly attains primary or junior secondary education levels; (3) non-farmers exhibit the smallest family size and labor force numbers yet achieve the highest per capita annual income; and (4) part-time farmers have the largest family size and labor force numbers, along with the highest educational attainment among workers.

3.3. Farmers’ Perception of Drought

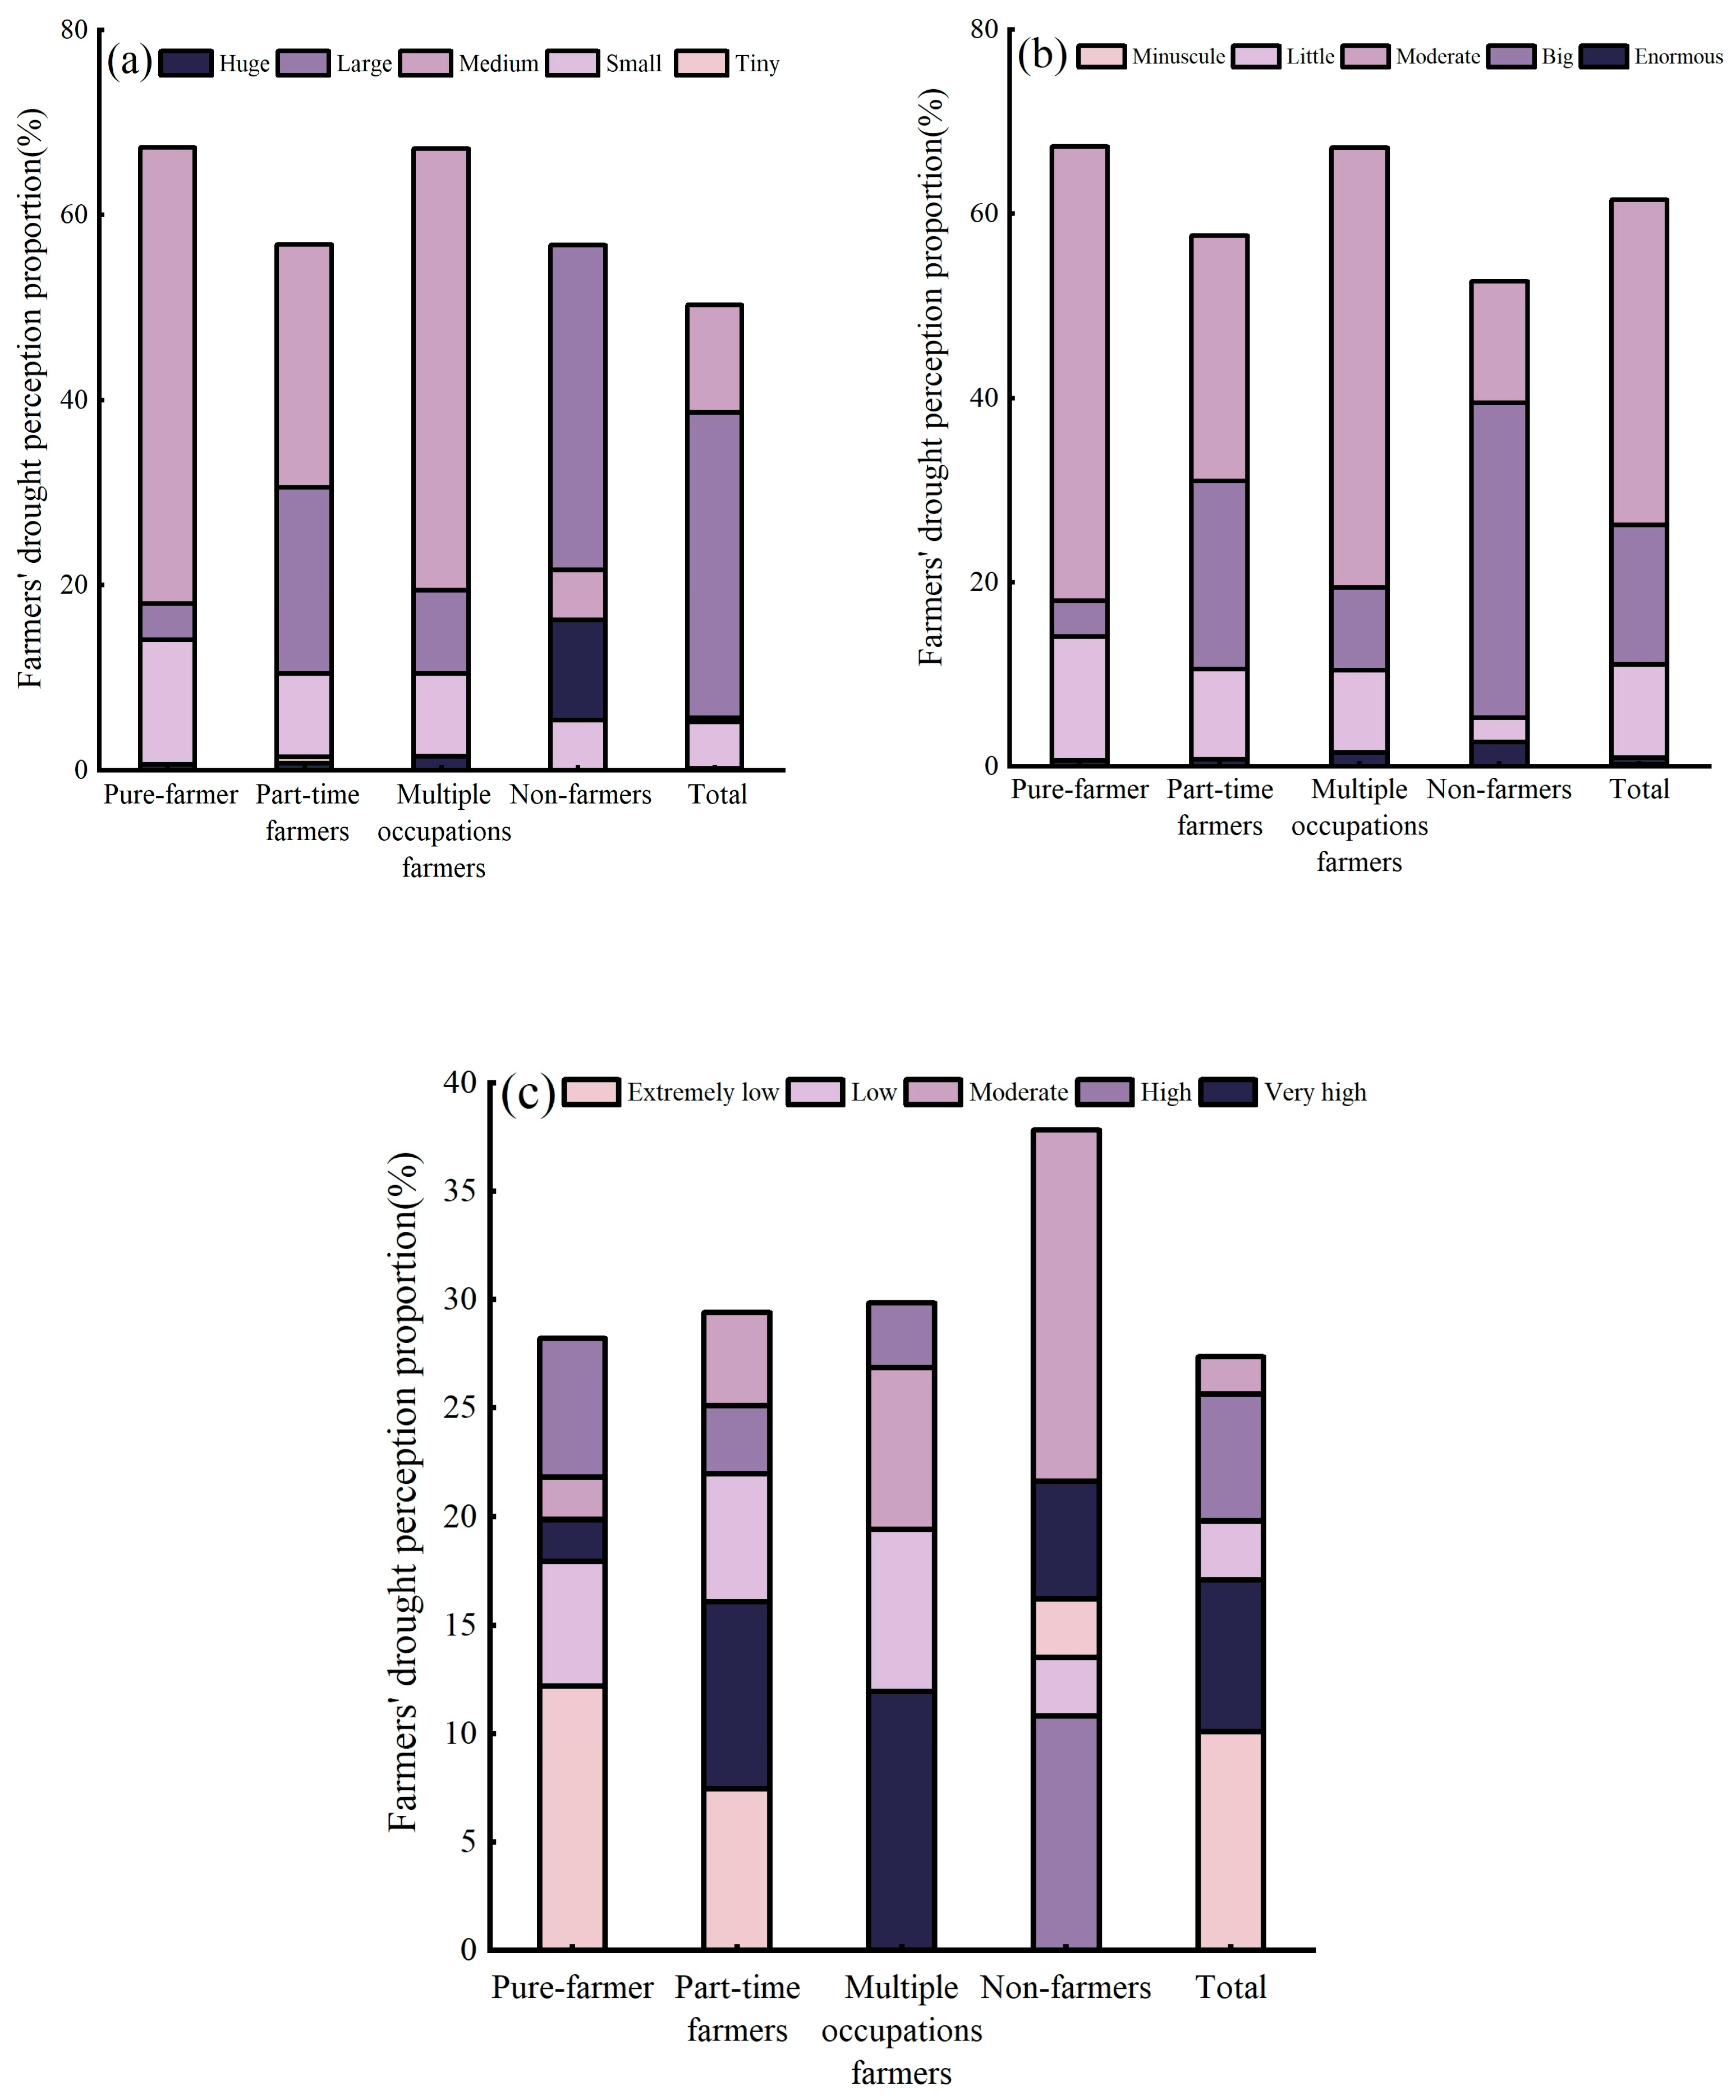
3.3.1. Farmers’ Risk Perception of Drought

Analyzing farmers’ risk perception of drought through the dual dimensions of perceived susceptibility and perceived severity provides a holistic understanding of their perspectives on drought intensity and associated hazards. This approach delivers critical primary data for policymakers to design targeted drought awareness campaigns, enabling farmers to optimize agricultural planning and mitigate drought impacts. By calculating the mean values of susceptibility perception index ( p m ) and severity perception index ( p m ), a composite risk perception index ( p m ) can be derived to quantify farmers’ overall perception of drought risks.
As illustrated in Figure 4a and Table 5, the overall susceptibility perception index ( p m ) for all surveyed farmers is 3.76, with 91.84% of farmers anticipating increased drought frequency in the future. Only a minority expressed uncertainty or predicted reduced drought trends. Key findings across farmer categories include (1) pure farmers: p m = 3.72; 89.74% foresee worsening drought conditions; (2) part-time farmers: p m = 3.80; 93.33% expect increased drought severity; (3) multiple occupation farmers: p m = 3.75; 92.54% anticipate heightened drought risks; and (4) non-farmers: p m = 3.71; 89.19% predict aggravated drought trends.
As depicted in Figure 4b and Table 5, the overall severity perception index ( p m ) for all surveyed farmers is 3.61, with 69.13% of farmers reporting that drought has imposed significant impacts on their livelihoods and agricultural productivity. The findings across farmers categories are as follows: (1) pure farmers: p m = 3.68; 73.97% perceived severe drought-induced disruptions to their lives and production; (2) part-time farmers: p m = 3.59; 67.45% reported severe drought-related challenges; (3) multiple occupation farmers p m = 3.61; 73.03% indicated critical impacts of drought on their activities; and (4) non-farmers: p m = 3.46; 64.18% acknowledged severe consequences of drought on their livelihoods.
As shown in Table 5, the composite risk perception index ( p m ) for all surveyed farmers is 3.69. Among the four farmers categories, the intensity of drought risk perception ( p m ) follows this descending order: pure farmers (3.70) = part-time farmers (3.70) > multiple occupations farmers (3.61) > non-farmers (3.59).

3.3.2. Farmers’ Perception of Adaptation to Drought

Examining farmers’ adaptation perception of drought through three dimensions—perceived adaptation efficacy, perceived self-efficacy, and perceived adaptation costs—provides a clear understanding of the constraints influencing their drought adaptation behaviors. By calculating the mean values of the adaptation efficacy perception index, self-efficacy perception index and adaptation cost perception index, a composite adaptation perception index can be derived to quantify the intensity of farmers’ adaptive responses to drought.
As illustrated in Figure 5a and Table 5, the overall adaptation efficacy perception index p m for all surveyed farmers is 3.28, with 94.56% of farmers reporting that their adaptive measures effectively mitigate drought impacts on livelihoods and production. Only a minority perceived their adaptation strategies as ineffective. Key variations across farmer categories include (1) pure farmers: p m = 3.14; 85.90% acknowledged the efficacy of their adaptive measures; (2) part-time farmers p m = 3.28; 89.41% affirmed the effectiveness of their actions; (3) multiple occupation farmers: p m  = 3.41; 88.06% recognized mitigation benefits; and (4) non-farmers: p m = 3.61; 94.60% reported successful drought impact reduction through adaptation.
As shown in Figure 5b and Table 5, the overall self-efficacy perception index ( p m ) for all farmers is 3.00, with 88.74% of farmers confident in their capacity to adapt to drought. Farmer-specific results are as follows: (1) pure farmers: p m = 2.88; 85.90% expressed adaptive capacity; (2) Ppart-time farmers: p m = 3.06; 89.41% demonstrated confidence in adaptation; (3) multiple occupation farmers: p m = 2.91; 88.06% reported preparedness to cope; and (4) non-farmers: p m = 3.30; 97.30% exhibited strong self-efficacy in adaptation.
As depicted in Figure 5c and Table 5, the overall adaptation cost perception index ( p m ) for all surveyed farmers is 3.03, with 70.10% of farmers perceiving significant human and material resource expenditures required for drought adaptation. Variations across farmer categories are as follows: (1) pure farmers: p m = 3.09; 48.08% reported high adaptation-on costs; (2) part-time farmers: p m = 3.02; 41.18% acknowledged substantial resource investments; (3) multiple occupation farmers: p m = 2.97; 41.79% identified elevated adaptation costs; and (4) non-farmers: p m = 2.90; 32.43% perceived high costs for drought adaptation.
Furthermore, Table 5 reveals that the composite adaptation perception index ( p m ) for all farmers is 3.10. Across the four categories, adaptation perception intensity ( p m ) follows this descending order: non-farmers (3.29) > part-time farmers (3.12) > multiple occupations farmers (3.07) > pure farmers (3.04).
The above results indicate that rural farmers perceive the effectiveness of drought adaptation more strongly than they perceive self-efficacy and adaptation costs. In terms of the intensity of the perception of adaptation effectiveness, non-farmers have the strongest perception, while pure farmers have the weakest. Regarding the intensity of self-efficacy perception, non-farmers also have the strongest perception, and pure farmers have the weakest. As for the intensity of the perception of adaptation costs, pure farmers have the strongest perception, and multiple occupations farmers have the weakest. Overall, different types of farmers show a trend where non-farmers have the strongest perception of drought adaptation, and pure farmers have the weakest.

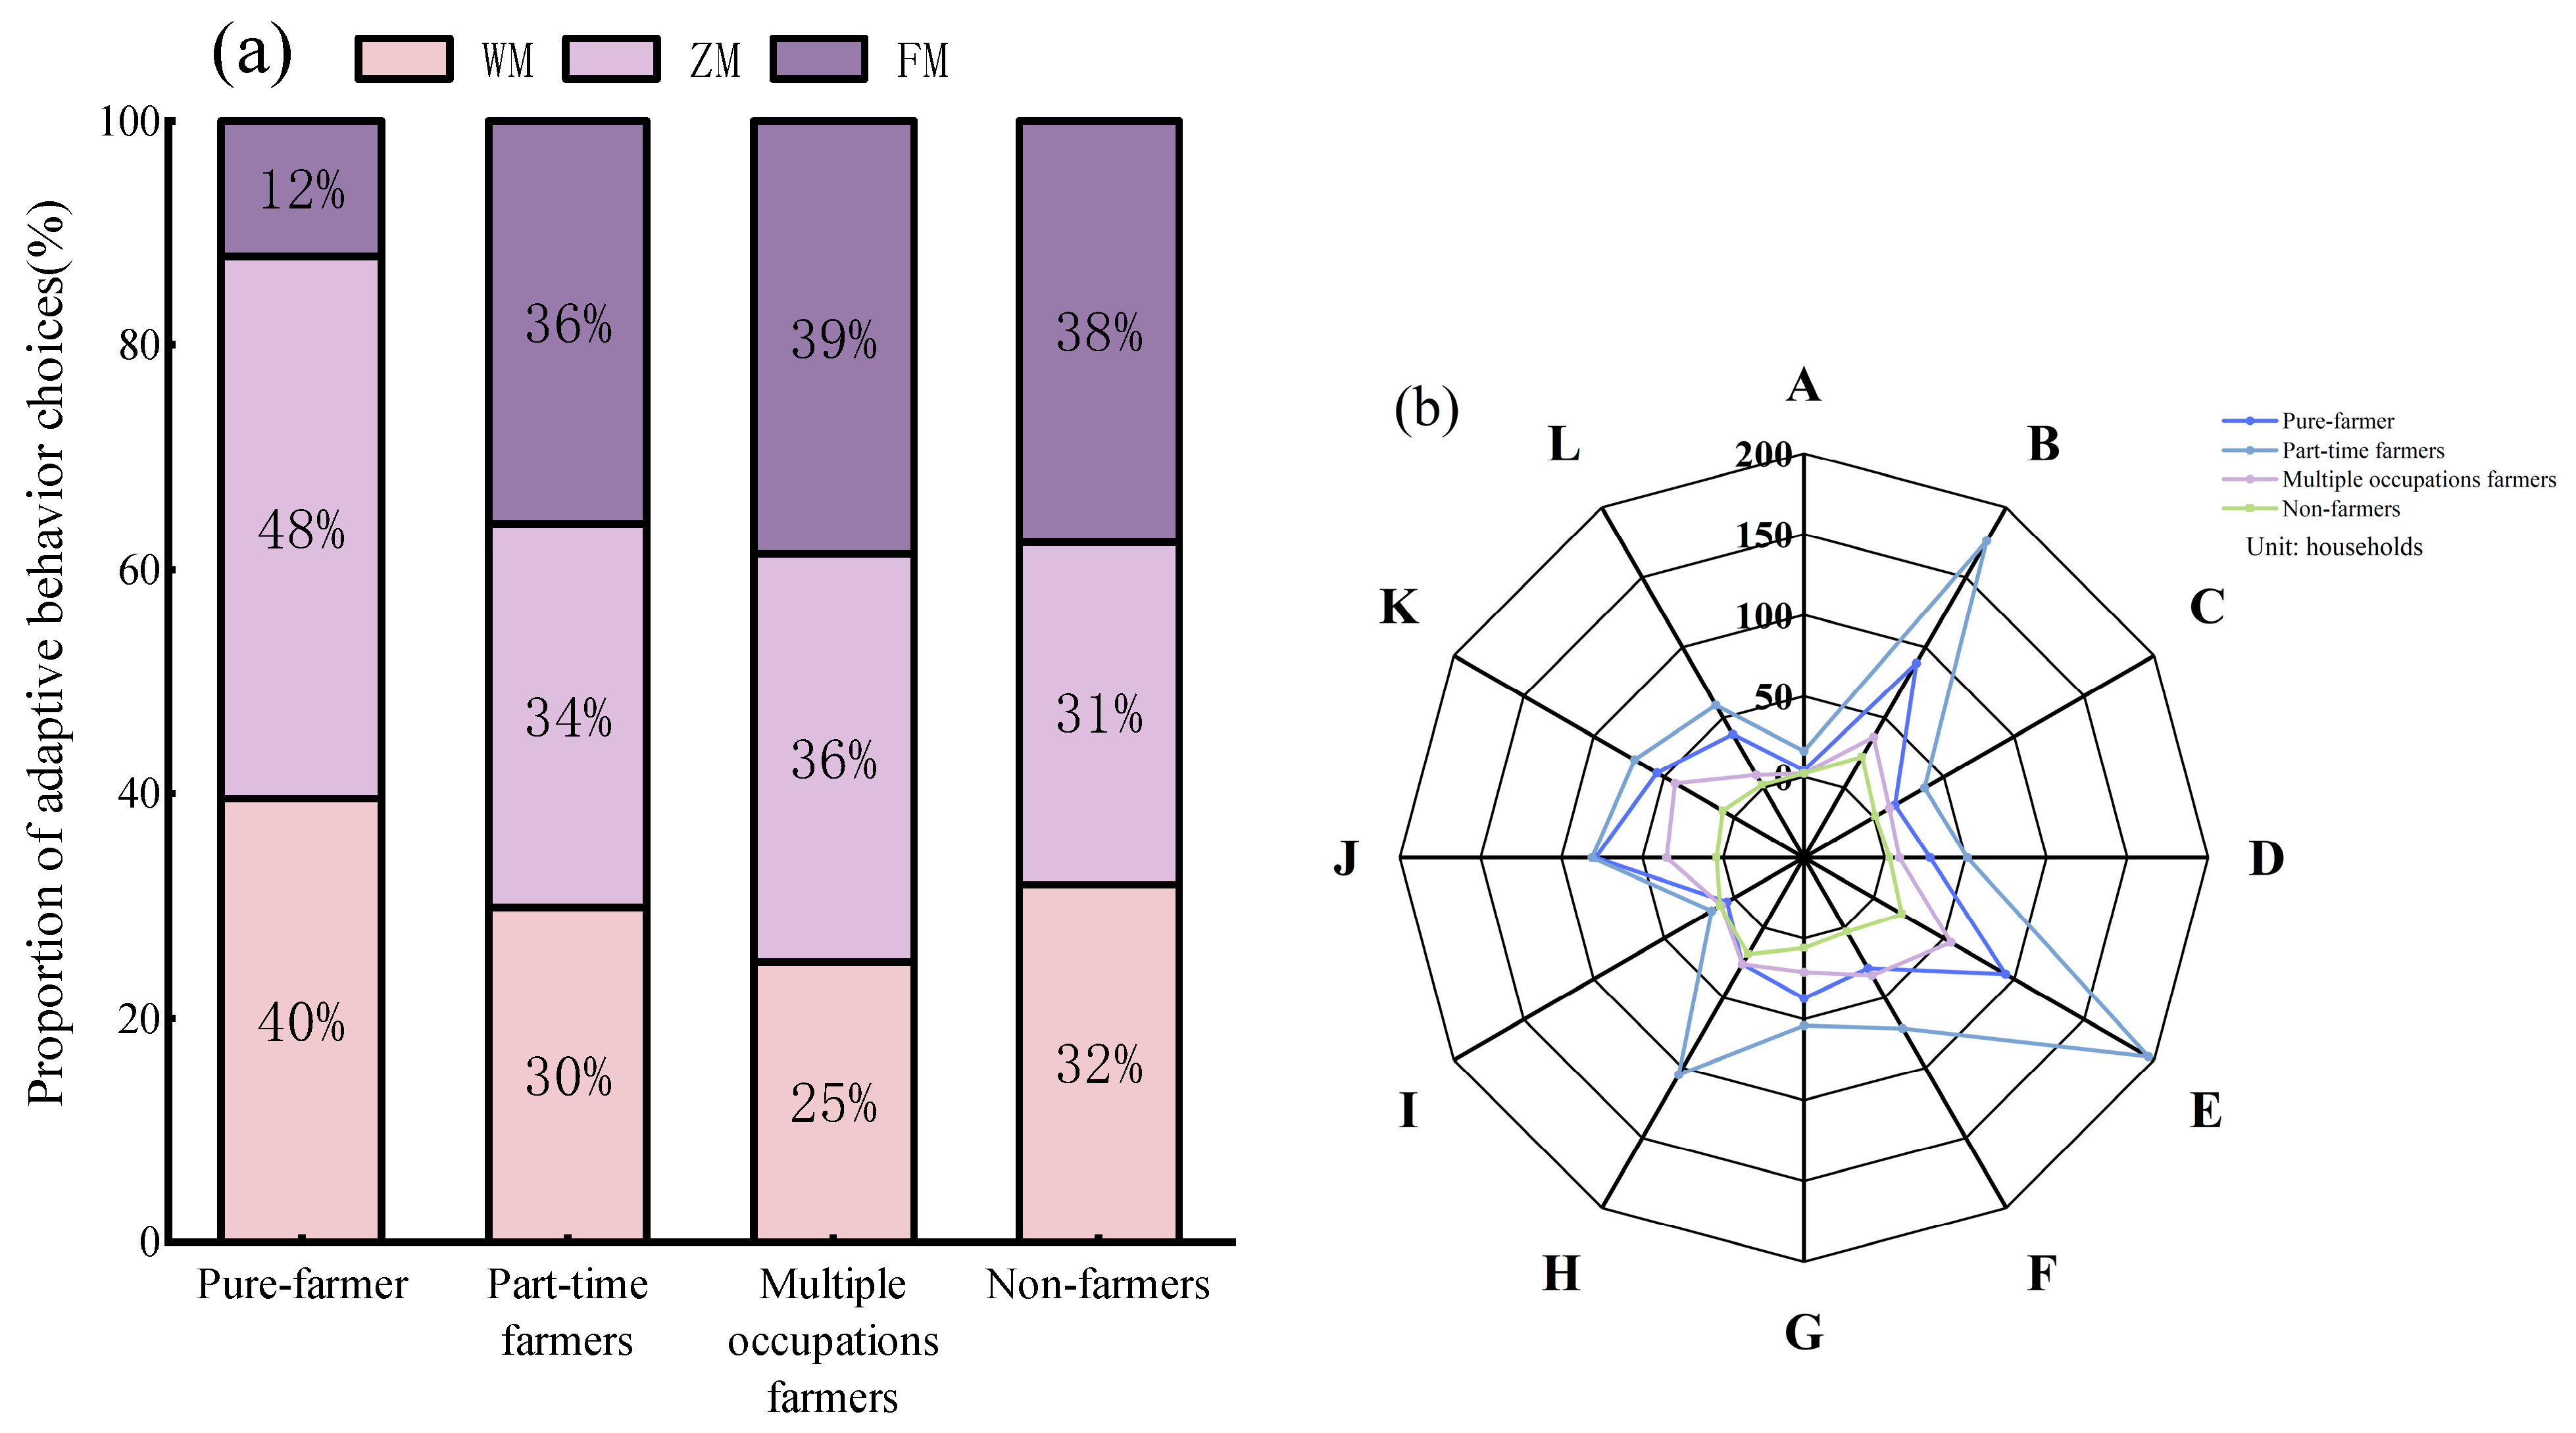
3.4. The Adaptation Behaviors of Farmers to Drought

During drought events, farmers in the karst dry-hot valley region adopt adaptive measures to mitigate impacts on their livelihoods and agricultural production. These adaptation strategies are broadly categorized into three types: water resource management, crop management, and non-agricultural measures. As shown in Table 6, the adoption rates of these strategies follow this descending order: non-agricultural measures (88.93%) > crop management (84.08%) > water resource management (70.49%).
The statistical analysis of the proportional selection of three adaptation behavior categories and corresponding measures among different farmer types, combined with the calculation of drought adaptation strategy diversification indices, reveals varying levels of adaptive capacity across farmers. As illustrated in Figure 6 and Figure 7, pure farmers demonstrate a diversification index of 3.46, primarily implementing water resource management and crop management strategies through pond excavation, water reservoir construction, and cropland reduction. Part-time farmers exhibit a higher index of 3.74, favoring crop management and non-agricultural measures such as drought-resistant crop cultivation, seasonal migration labor, and water storage infrastructure development. Notably, multiple occupation farmers achieve the maximum diversification level index of 4.10, combining crop management with diversified non-agricultural strategies including drought-tolerant crop adoption, poultry sales, and paid temporary agricultural labor. Non-farmers show an equivalent diversification index of 3.46, prioritizing water management and non-agricultural strategies like water infrastructure maintenance and seasonal employment. These findings quantitatively demonstrate that part-time farmers maintain the most sophisticated drought adaptation portfolio, while pure farmers and non-farmers display relatively limited behavioral diversification in climate adaptation responses.

3.5. Impact of Farmers’ Drought Perceptions on Adaptive Behavioral Choices

Using binary logistic regression models, this study analyzes how farmers’ drought perceptions influence their choice of adaptation behaviors. As summarized in Table 7, the key findings are as follows:
(1)
Water Resource Management
Positive correlations: farmers’ perceived adaptation efficacy, perceived self-efficacy, perceived adaptation costs, and years of farming experience significantly predict the adoption of water resource management strategies. Negative correlations: perceived drought susceptibility and age reduce the likelihood of selecting water resource management. Interpretation: farmers who believe adaptation measures are effective possess confidence in their adaptive capacity, perceive higher adaptation costs, and have longer farming experience are more inclined to adopt water resource management. Conversely, older farmers and those anticipating increased drought frequency are less likely to prioritize this strategy.
(2)
Crop Management
No significant correlations: drought perception dimensions (efficacy, self-efficacy, costs) show no statistically significant association with crop management adoption. Negative correlation: age negatively influences the choice of crop management. Interpretation: older farmers are less likely to adopt crop management practices, while drought perceptions do not drive this behavioral choice.
(3)
Non-Agricultural Measures
Positive correlations: perceived adaptation efficacy and adaptation costs increase the likelihood of adopting non-agricultural measures. Negative correlation: perceived self-efficacy reduces the propensity to choose non-agricultural strategies. Interpretation: farmers who recognize the effectiveness of adaptation actions and face high adaptation costs are more likely to pursue non-agricultural measures. However, those confident in their adaptive capacity prefer alternative strategies.

4. Discussion

4.1. Classification of Drought Adaptation Behavior of Farmers in Dry-Hot Karst Valley Area

The analysis of farmers’ adaptation behaviors to drought in the karst dry-hot valley region reveals three main categories of adaptive strategies:
(1)
Technological adaptation
Drought adaptation in this region can be achieved through the enhancement of technologies related to drought monitoring, land use, and surface water resource utilization. Farmers monitor drought conditions across different slope positions in the karst dry-hot valley region and adjust land use patterns based on the drought resistance characteristics of crops. They reduce cultivated land area, planting sugarcane and pitaya at the valley bottom, Sichuan pepper and scattered sugarcane in the valley middle, and scattered rice and citrus on the valley shoulder, thus optimizing the use of water and thermal resources at different slope positions (Figure 8). In terms of surface water resource utilization, technologies such as closed-channel water storage (Figure 9 left) or small-scale water collection devices (Figure 9 right) are employed. During the rainy season (May to October), rainwater is collected in ponds or reservoirs, which is then used for daily life and livestock drinking needs during the dry season (November to the following April).
(2)
Behavioral adaptation
Farmers can adjust their water usage and irrigation practices to adapt to drought conditions. For example, they can implement water recycling behaviors by collecting rice-washing water, vegetable washing water, laundry water, and other wastewater for livestock drinking and irrigation, thereby increasing water use efficiency. Drip irrigation technology (Figure 10) can be applied to reduce irrigation frequency, laundry, and bathing, minimizing unnecessary water consumption.
(3)
Economic adaptation
In terms of economic development, farmers can reduce their reliance on water resources by working outside the agricultural sector during the dry season to earn non-agricultural income. Additionally, they can participate in temporary, remunerative agricultural labor outside the region, which not only provides financial support for household expenses but also helps reduce water consumption on their own farms during the period of external employment.

4.2. Peculiarities of Farmers’ Adaptive Behavior to Drought in the Karst Dry-Hot Valley Area

In regions with different causes of drought, the adaptation behaviors of farmers to drought also vary. Globally, droughts often occur in arid and semi-arid regions with hot and dry climates. Different from the climatic causes of drought in arid and semi-arid regions, the karst dry-hot valley area has a mild climate and abundant precipitation resources. Its drought is mainly caused by non-climatic factors formed by the superposition of the karst underlying surface and the valley terrain. Therefore, the uniqueness of the adaptation behaviors of farmers in the karst dry-hot valley area to drought is manifested as follows: farmers in arid and semi-arid regions mainly adapt to drought through compound behaviors of surface water resource substitution and management, such as measures including pumping groundwater, laying underground/aboveground pipelines, and using dry seedbeds [10,11,12,13], etc. In contrast, farmers in the karst dry-hot valley area mainly adopt surface water resource management behaviors to adapt to drought, such as digging ponds or building reservoirs, and reducing the irrigation frequency, etc. (Table 8).
The reason why farmers in the karst dry-hot valley area choose surface water resource management behaviors instead of surface water resource substitution behaviors to adapt to drought is mainly determined by the special climate, terrain, and geological [35,36] conditions of this region. Firstly, this area belongs to the subtropical monsoon climate zone, with abundant precipitation resources. The average annual precipitation is 1100 mm, providing favorable precipitation conditions for the collection and management of surface water resources. Secondly, this area has a valley terrain, with high mountains and deep waters. The groundwater depth is generally more than 200 m, which is not conducive to the development of groundwater resources to substitute for surface water resources. Thirdly, the karst area is extensive, and the rocky desertification is severe. Laying pipelines aboveground or underground is time-consuming and labor-intensive, and the efficiency is extremely low.
Considering the aforementioned reasons, as well as the technical feasibility and input–output analysis, it is more realistically feasible for farmers in the karst dry-hot valley area to choose surface water resource management behaviors to adapt to drought. Considering the aforementioned reasons, as well as the technical feasibility and input–output analysis, it is more realistically feasible for rural households in the karst dry-hot valley area to choose surface water resource management behaviors to adapt to drought. Regional heterogeneity needs to be fully considered in the formulation of drought risk management policies: for areas with harsh natural conditions and inadequate public services (karst dry and hot river valleys), government investment should be increased and infrastructure should be improved; for areas with a diversified economic structure (e.g., the North China Plain), a balance between technological dependence and the cultivation of risk awareness needs to be struck; whereas, for areas that are highly organized (e.g., Northeast China), the allocation of resources can be further optimized. For regions with a high degree of organization (e.g., northeast China), resource allocation can be further optimized to enhance overall drought resilience. Follow-up studies can adopt a multi-case comparative research method to construct a more generalized theoretical framework, which can provide a reference for farmers’ adaptation strategies in drought-prone regions around the world.

4.3. Reasons for Differences in the Perception of Drought by Different Farmers

Analysis of Section 3.3.1 and Figure 11 reveals significant disparities in drought risk perception intensity among farmer types; it is manifested that pure farmers are the strongest, while non-farmers are the weakest. This hierarchy correlates with differential reliance on water resources. Pure farmers, whose livelihoods depend predominantly on crop sales, face direct threats to income from drought-induced yield reductions, thereby heightening their sensitivity to drought risks [37]. Therefore, pure farmers pay more attention to the drought situation compared with other types of farmers. This is consistent with the findings of stronger risk perception among agriculturally dependent farmers in the southwestern United States [38], and the opposite research findings of weak risk perception among farmers in the North China Plain, which was attributed to the fact that the prevalence of irrigation facilities in the North China Plain weakened some of the risk perceptions of farmers [39]. According to the research results in Section 3.3.2 and Figure 11, it is found that the intensity of adaptation perception to drought varies among different types of farmers. Specifically, pure farmers have the weakest perception, while non-farmers have the strongest perception. This inversion stems from disparities in education and income levels. Non-farmers exhibit higher proportions of laborers with senior high school or advanced education, greater access to non-farmer employment, and enhanced capacity to acquire information and adopt technologies [40], all of which strengthen drought adaptation capabilities. Additionally, their superior financial resilience provides greater flexibility and security in formulating adaptive strategies [41].Thus, non-farming households have the strongest perception of adaptation. This is consistent with the finding that non-farming households in the Sahel enhance their adaptive capacity with non-farm income [42], but the former have government support and the latter rely on community mutual aid.
Overall, risk perception universally outweighs adaptive perception across all farmer types. This asymmetry reflects the region’s economic dependency on drought-sensitive cash crops (e.g., prickly ash, sugarcane, and dragon fruit) [43,44,45]. Prolonged droughts inflict immediate, visible damage to crop physiology, drastically reducing yield and quality, thereby triggering acute short-term livelihood impacts that amplify risk awareness. Conversely, adaptive measures yield benefits incrementally over extended periods, rendering their effects less perceptible to farmers. While heightened risk perception aids proactive agricultural planning, its dominance over adaptive perception creates a psychological barrier: excessive drought apprehension suppresses motivation to implement adaptive actions, inadvertently perpetuating livelihood vulnerabilities. This feedback loop underscores the urgency of bridging perceptual gaps through targeted education and incentivized adaptation programs.

4.4. Recommendations

(1)
Improve farmers’ perception of drought adaptation and increase their motivation to react to drought.
The study reveals a critical imbalance between farmers’ risk perception and adaptive perception of drought, where in their acute awareness of drought risks is not paralleled by proactive adaptation initiatives. This cognitive gap exacerbates drought impacts, necessitating policy interventions to strengthen perceived adaptation efficacy and self-efficacy while reducing perceived adaptation costs. Specifically, agricultural extension services should systematically demonstrate the effectiveness of subjective initiatives and innovative drought-resistant technologies to enhance farmers’ confidence in adaptation capabilities through implementing cost-sharing mechanisms and technical subsidies to lower psychological and economic barriers to adaptation, and developing participatory demonstration programs that validate the tangible benefits of adaptive behaviors through empirical evidence. This three-pronged approach addresses the cognitive–behavioral disconnect by transforming abstract risk awareness into concrete adaptive capacity, ultimately fostering self-driven drought resilience.
(2)
Behaviorally-informed drought adaptation policies.
Studies have found that, when faced with drought, farmers’ willingness to adopt adaptive behaviors follows the order of non-agricultural measures > crop management > water resource management. Based on this understanding, relevant authorities should prioritize providing assistance for non-agricultural measures when offering drought relief to farmers, followed by guidance on crop management and water resource management.

4.5. Limitations

The study has two main limitations. First, in terms of information collection, the questionnaire data were primarily obtained through field surveys, and the responses from some farmers may vary due to changes in time and location, which could affect the accuracy of farmers’ perceptions of drought. Second, in terms of questionnaire design, data on the average monthly rainfall and evaporation over multiple years indicate that seasonal drought is severe in the karst dry-hot valley region, with drought mainly occurring from October to April each year. However, the seasonal differences in drought were not considered in the questionnaire design. Therefore, in future data collection efforts, it is important to bridge the gap between the researchers and farmers, minimizing any psychological barriers the farmers may have towards the investigators. Additionally, the questionnaire design should more closely reflect the reality that the drought in the study area is seasonal.

5. Conclusions

In the context of intensified global climate change and frequent extreme weather events such as drought, this study investigates farmers’ perceptions and adaptive behaviors toward drought induced by the combined effects of karst underlying surfaces and valley topography (non-climatic factors), addressing the existing research gap regarding drought perception and adaptation in non-climatic drought-prone areas while providing novel paradigms for drought adaptation studies in other regions. Key findings reveal the following: (1) The study area predominantly comprises part-time farmers and pure farmers. The workforce predominantly attained elementary and junior high school education levels. Non-farmers exhibited the smallest family size and lowest labor availability but achieved the highest per capita annual income. Conversely, multiple occupation farmers demonstrated the largest family size, highest labor availability, and most educated workforce. (2) Overall, farmers demonstrated stronger risk perception than adaptive perception, indicating recognized drought risks without commensurate proactive adaptation initiatives. (3) Farmers prioritized non-agricultural measures for drought adaptation, followed by crop management, with water resource management being the least utilized. (4) The main mechanisms of adaptation to drought for farmers in the karst dry-hot valley area are technological adaptation, behavioral adaptation and economic adaptation.

Author Contributions

J.W. was responsible for the thesis topic selection, writing, data collection and processing, as well as making the figures, undertaking the main work of this research. Y.R. was in charge of the translation of the thesis. Y.L. provided guidance and made revisions to the thesis, and also ensured the material support. S.Y. and G.D. provided guidance on the content and structure of the thesis. R.L., W.Y. and X.L. were involved in the collection and organization of the thesis data. All authors have read and agreed to the published version of the manuscript.

Funding

This work was supported by The Guizhou Provincial Basic Research Program (Natural Science) (Grant No. Qiankehe MS[2025] 268); The National Natural Science Foundation of China-Guizhou Provincial People’s Government Karst Science Research Center Project (Grant No. U1812401).

Data Availability Statement

Data are contained within the article.

Conflicts of Interest

The authors declare no conflicts of interest.

References

  1. Gao, Y.; Wang, X.; Xiong, J.; Wu, H.; Li, X.; Cai, S.; Zhang, Z. Practice and reflection on climate change research from the perspective of geographical science. Geogr. Res. 2023, 42, 2817–2826. [Google Scholar]
  2. Zhao, Z.; Wang, K. Capability of existing drought indices in reflecting agricultural drought in China. J. Geophys. Res. Biogeosci. 2021, 126, e2020JG006064. [Google Scholar] [CrossRef]
  3. Yang, X.; Wang, J.; Liu, K.; Zhang, X. Quantative analysis on farmer’s resilience toward drought, a case study of Yuzhong County, Gansu Province. J. Arid. Land Resour. Environ. 2010, 24, 101–106. [Google Scholar] [CrossRef]
  4. Yang, F.; An, G.; Sun, F.; He, X. The selection of drought index and leveling its division of natural grassland around qinghai lake. Qinghai Pratacult. 2022, 31, 26–30. [Google Scholar]
  5. Sun, C.; Wei, Y.; Zhao, L. Co-evolution of water-energy-food nexus in arid areas: Take Northwest China as an example. J. Nat. Resour. 2022, 37, 320–333. [Google Scholar] [CrossRef]
  6. Shi, X.; Sun, L.; Chen, X.; Wang, L. Farmers’ perceived efficacy of adaptive behaviors to climate change in the Loess Plateau, China. Sci. Total Environ. 2019, 697, 134217. [Google Scholar] [CrossRef]
  7. Udmale, P.; Ichikawa, Y.; Manandhar, S.; Ishidaira, H.; Kiem, A.S. Farmers’ perception of drought impacts, local adaptation and administrative mitigation measures in Maharashtra State, India. Int. J. Disaster Risk Reduct. 2014, 10, 250–269. [Google Scholar] [CrossRef]
  8. Aliyar, Q.; Zulfiqar, F.; Datta, A.; Kuwornu, J.K.; Shrestha, S. Drought perception and field-level adaptation strategies of farming households in drought-prone areas of Afghanistan. Int. J. Disaster Risk Reduct. 2022, 72, 102862. [Google Scholar] [CrossRef]
  9. Zhao, X. Environmental perception of farmers of different livelihood strategies: A case of Gannan Plateau. Acta Ecol. Sin. 2012, 32, 6776–6787. [Google Scholar] [CrossRef]
  10. Wang, X.; Lu, Q.; Lu, Q. Impact of water scarcity perception on farmers’irrigation adaptive behaviors in northern well-irrigated areas in China. J. Arid. Land Resour. Environ. 2019, 33, 159–164. [Google Scholar] [CrossRef]
  11. Quandt, A. Coping with Drought: Narratives from Smallholder Farmers in Semi-Arid Kenya. Int. J. Disaster Risk Reduct. 2021, 57, 102168. [Google Scholar] [CrossRef]
  12. Hou, L.; Huang, J.; Wang, J. Early warning information, farmers’ perceptions of, and adaptations to drought in China. Clim. Change 2017, 141, 197–212. [Google Scholar] [CrossRef]
  13. Islam, M.S.; Hossain, M.Z.; Sikder, M.B. Drought adaptation measures and their effectiveness at Barind Tract in northwest Bangladesh: A perception study. Nat. Hazards: J. Int. Soc. Prev. Mitig. Nat. Hazards 2019, 97, 1253–1276. [Google Scholar] [CrossRef]
  14. Wei, G.; Shi, X.; Sun, L.; Wang, L.; Li, H. The farmers’ perception of climate change and diversity of adaptive behavior in dry farming region. J. Shaanxi Norm. Univ. Nat. Sci. Ed. 2020, 48, 116–124. [Google Scholar] [CrossRef]
  15. Udmale, P.D.; Ichikawa, Y.; Manandhar, S.; Ishidaira, H.; Kiem, A.S.; Shaowei, N.; Panda, S.N. How did the 2012 drought affect rural livelihoods in vulnerable areas? Empirical evidence from India. Int. J. Disaster Risk Reduct. 2015, 13, 454–469. [Google Scholar] [CrossRef]
  16. Soubry, B.; Sherren, K.; Thornton, T.F. Are we taking farmers seriously? A review of the literature on farmer perceptions and climate change, 2007–2018. J. Rural Stud. 2020, 74, 210–222. [Google Scholar] [CrossRef]
  17. Yarong, L.; Minpeng, C. Farmers’ perception on combined climatic and market risks and their adaptive behaviors: A case in Shandong Province of China. Environ. Dev. Sustain. 2021, 23, 13042–13061. [Google Scholar] [CrossRef]
  18. Hou, L.; Wang, J.; Huang, J. Farmers’ perceptions of extreme drought events at different income levels and their impacts on the adoption of adaptation measures-an empirical analysis based on a large-scale survey of farmers in nine provinces across China. Agric. Technol. Econ. 2016, 11, 24–33. [Google Scholar] [CrossRef]
  19. Hartmann, A.; Goldscheider, N.; Wagener, T.; Lange, J.; Weiler, M. Karst water resources in a changing world: Review of hydrological modeling approaches. Rev. Geophys. 2015, 52, 218–242. [Google Scholar] [CrossRef]
  20. Deng, Y.; Wang, S.; Bai, X.; Luo, G.; Wu, L.; Chen, F.; Wang, J.; Li, Q.; Li, C.; Yang, Y.; et al. Spatiotemporal dynamics of soil moisture in the karst areas of China based on reanalysis and observations data. J. Hydrol. 2020, 585, 124744. [Google Scholar] [CrossRef]
  21. Peng, J.; Yang, M. Analysis of soil erosion status in the Huajiang Karst Canyon, Guizhou. J. Mt. Geol. 2001, 6, 511–515. [Google Scholar]
  22. Xiong, K.; Li, J.; Long, M. Features of Soil and Water Loss and Key Issues in Demonstration Areas for Combating Karst Rocky Desertification. Acta Geogr. Sin. 2012, 67, 878–888. [Google Scholar]
  23. Li, Y.; Wang, S.; Li, R.; Xiong, K. Preliminary Study on the Causes of Rocky Desertification in Huajiang Karst Gorge Area. Adv. Earth Sci. 2006, 21, 526–533. [Google Scholar]
  24. Cai, L.; Xiong, K.; Li, Y.; Liu, Z.; Zhu, D.; Liang, H.; Mu, Y.; Chen, Y. Coexisting plants restored in karst desertification areas cope with drought by changing water uptake patterns and improving water use efficiency. J. Hydrol. 2025, 654, 132813. [Google Scholar] [CrossRef]
  25. Guizhou Meteorological Bureau. Prediction of Agricultural Meteorological Impacts in Guizhou Province in 2025; Guizhou Meteorological Bureau: Guiyang, China, 2025. [Google Scholar]
  26. Institute of Karst Geology, Guizhou Normal University. Research on Vegetation Type Selection in Huajiang Gorge Area; Guizhou Normal University: Guiyan, China, 2023. [Google Scholar]
  27. Xiong, K.N. “Huajiang Model” of Karst Rocky Desertification Control; Science Press: Beijing, China, 2020. [Google Scholar]
  28. Yang, Z.; Ke, Q.; Ma, Q.; Cao, Z.; Zhang, K.; Yang, Y. Response of Soil Moisture to Rainfall on Karst Yellow Soil Slope. J. Soil Water Conserv. 2021, 35, 75–79. [Google Scholar] [CrossRef]
  29. Grothmann, T.; Patt, A. Adaptive capacity and human cognition: The process of individual adaptation to climate change. Glob. Environ. Change 2005, 15, 199–213. [Google Scholar] [CrossRef]
  30. Bartlett, J.E.; Joe, W.; Kotrlik, J.W.; Higgins, C.C. Organizational Research: Determining appropriate sample size in survey research. Inf. Technol. Learn. Perform. J. 2001, 19, 43–50. [Google Scholar]
  31. Zhao, X.; Xue, B. Farmers’ Perception of Water Resource Shortage and Adaption in Continental River Basin of Arid Zone: A Case of the Middle-lower Reaches of the Shiyang River. Sci. Geosci. Sin. 2015, 35, 1622–1630. [Google Scholar] [CrossRef]
  32. Hao, H.; Zhang, J.; Li, X.; Zhang, H.; Zhang, Q. Impact of livelihood diversification of rural households on their ecological footprint in agro-pastoral areas of northern China. J. Arid. Land 2015, 7, 653–664. [Google Scholar] [CrossRef]
  33. Yan, J.; Wu, Y.; Zhang, Y.; Zhou, S.; Shi, Y. Livelihood Diversification of Peasants and Nomads of Eastern Transect in Tibetan Plateau. Acta Geogr. Sin. 2009, 64, 221–233. [Google Scholar]
  34. Zhang, C. Adaptation Behavior of Farmers to Multiple Drought Type Superimposed Environments in Dry-Hot Valley; Guizhou Normal University: Guiyang, China, 2023. [Google Scholar] [CrossRef]
  35. Wang, J.; Peng, J.; Zhang, R.; Xu, Z.; Liu, Y. Research progress and prospect of karst ecosystem services. J. Guizhou Norm. Univ. Nat. Sci. 2024, 42, 77–84 + 105. [Google Scholar]
  36. Luo, Y.; Zhang, R.; Xue, X.; Liu, M.; Wang, J.; Lou, J. Research on karst landform classification based on positive and negative terrains. J. Guizhou Norm. Univ. Nat. Sci. 2024, 42, 9–19. [Google Scholar] [CrossRef]
  37. Twongyirwe, R.; Mfitumukiza, D.; Barasa, B.; Naggayi, B.R.; Odongo, H.; Nyakato, V.; Mutoni, G. Perceived effects of drought on household food security in South-western Uganda: Coping responses and determinants. Weather Clim. Extrem. 2019, 24, 100201. [Google Scholar] [CrossRef]
  38. Cook, B.I.; Ault, T.R.; Smerdon, J.E. Unprecedented 21st century drought risk in the American Southwest and Central Plains. Sci. Adv. 2015, 1, e1400082. [Google Scholar] [CrossRef]
  39. Koch, J.; Zhang, W.; Martinsen, G.; He, X.; Stisen, S. Estimating net irrigation across the North China Plain through dual modelling of evapotranspiration. J. Water Resour. Res. 2020. [Google Scholar] [CrossRef]
  40. Matewos, T. The State of Local Adaptive Capacity to Climate Change in Drought-Prone Districts of Rural Sidama, Southern Ethiopia. Clim. Risk Manag. 2019, 27, 100209. [Google Scholar] [CrossRef]
  41. Maldonado-Méndez, M.D.L.; Romo-Lozano, J.L.; Monterroso-Rivas, A.I. Determinant Indicators for Assessing the Adaptive Capacity of Agricultural Producers to Climate Change. Atmosphere 2022, 13, 1114. [Google Scholar] [CrossRef]
  42. IPCC. Part B: Regional Aspects. Contribution of Working Group II to the Fifth Assessment Report of the Intergovernmental Panel on Climate Change; IPCC: Geneva, Switzerland, 2014. [Google Scholar]
  43. Jia, X.; Wei, C.; Yu, Y. Huajiang Dry-Hot Valley in Central Guizhou Province: Crrent Knowledge and Prespectives. J. Jishou Univ. Nat. Sci. 2024, 45, 56–62. [Google Scholar] [CrossRef]
  44. Pan, L. A Study on the Operating Mechanism of the Dragon Fruit Farmer Cooperative in Guanling County; Guizhou University for Nationalities: Guiyang, China, 2020. [Google Scholar] [CrossRef]
  45. Li, Y. Effect of Planting Combinations on Soil Fertility and Functional Traits of Zanthoxylum planispinum var. Dintanensis Plantations in Huajiang Scenic Area; Guizhou Normal University: Guiyang, China, 2023. [Google Scholar]
Figure 1. Location of the study area.
Water 17 01993 g001
Figure 2. Monthly average rainfall and evapotranspiration in the study area from 2002 to 2021.
Water 17 01993 g002
Figure 3. Relationship between perception and adaption behavior.
Water 17 01993 g003
Figure 4. Percentage of farmers’ drought for risk perception: (a) sensitive perception; (b) severity perception.
Water 17 01993 g004
Figure 5. Percentage of farmers’ drought for adaptation perceptions: (a) adaptation effect perception; (b) self-efficacy perception; (c) adaptation cost perception.
Water 17 01993 g005
Figure 6. Adaptation behavior and adoption measures to drought for farmers. ((a) Proportion of three types of adaptive behavioral selection to drought among different farmers. (b) Adaptation measures to drought among different farmers). WM: Water Resource Management. ZM: Crop Management. FM: Non-agricultural Measures. A: Reducing the frequency of irrigation. B: Digging ponds or building cisterns. C: Reducing the area of cultivated land. D: Changing the planting or harvesting date. E: Planting drought-resistant crops. F: Diversifying and mixing or inter-planting crops. G: Applying organic fertilizers. H: Seasonal outworkers. I: Small business. J: Selling poultry. K: Participating in paid temporary farm work. L: Bank loans or borrowing from relatives.
Water 17 01993 g006
Figure 7. The diversity index of adaptation strategies to drought among different farmers.
Water 17 01993 g007
Figure 8. Planning of crop cultivation using hydrothermal resources on different slopes [34].
Water 17 01993 g008
Figure 9. Farmers adapt to arid environments by upgrading surface water resource utilization techniques; (left: closed solution ditch storage; right: small water harvesting appliances to collect water).
Water 17 01993 g009
Figure 10. Farmers’ drip irrigation behavior in pepper plantations.
Water 17 01993 g010
Figure 11. The index of farmers’ drought perception.
Water 17 01993 g011
Table 1. The measure index of the farmer’s perception of drought.
Indicator Measurement ItemScoring
Risk PerceptionPerceived sensitivity (X1)How do you anticipate future drought trends in your locality?Rapid intensification = 5; Intensification = 4; Uncertain = 3; Mitigation = 2; No change = 1
Perceived severity (X2)To what extent does drought impact your production and livelihood?Extreme = 5; Significant = 4; Moderate = 3; Minor = 2; None = 1
Perceived efficacy (X3)How effective are your current drought adaptation measures?Excellent = 5; Good = 4; Moderate = 3; Poor = 2; Very poor = 1
Adaptation PerceptionSelf-efficacy (X4)How would you assess your capability to adapt to drought?Very strong = 5; Strong = 4; Moderate = 3; Weak = 2; Very weak = 1
Perceived cost (X5)How would you evaluate the cost of implementing drought adaptation measures?Very high = 5; High = 4; Moderate = 3; Low = 2; Very low = 1
Table 2. Basic information on farmers.
VariableDefinitionMeanSD
AgeActual age of household head (years)52.1616.00
Labor forceProportion of working-age population (18–60 years) to total household members3.231.71
Farming experienceYears engaged in agricultural activities30.0715.50
Annual income per capitaCash income per person1.871.00
Cultivated land areaTotal farmland area (mu)12.9712.36
Diversification indexDiversity of drought adaptation behaviors adopted3.681.44
Table 3. Types of respondents.
Type of FarmersMain Sources of Livelihood
Pure farmersFarming
Part-time farmersFarming + Services (Education, Health care, Administration), farming + Labor, Farming + Small business, Farming + Child support, Farming + Government subsidies
Multiple occupations farmers Farming + Labor + Services (Education, Healthcare, Administration), Farming + Labor + Others, Farming + Labor + Government Financial Subsidies, Farming + Labor + Small Businesses, Farming + Labor + Small Businesses
Non-farmersServices (education, health care, administration), Small business, Five-guarantee households, Government financial subsidies, Labor, Labor + Small business, Child support, Small business + Other
Table 4. General characteristics of respondents.
TypeNumberProportion
%
Family Size Person/
Household
Labor Force Persons/
Household
Educational Attainment of Labor Force %Average Annual Household Income
IlliteratePrimary SCHOOLJunior High SchoolSenior High SchoolCollege and AboveTen Thousand
pure farmers15630.295.202.8125.0041.6726.283.213.851.82
part-time
farmers
25549.515.563.5029.0235.2927.065.493.141.89
multiple
occupations farmers
6713.015.703.7628.3628.3625.372.9914.931.83
non-farmers377.184.272.2210.8143.2437.845.412.702.04
total515100.005.373.4426.4136.8927.384.474.851.72
Table 5. The index of farmers’ drought perception.
TypeRisk PerceptionAdaptive Perception
Sensitivity PerceptionSeverity PerceptionMeanPerceived
Adaptation Efficacy
Perceived Self-EfficacyPerceived Adaptation CostsMean
Pure farmers3.723.683.703.142.883.093.04
Multiple occupations farmers3.803.593.703.283.063.023.12
Part-time farmers3.753.613.683.412.912.903.07
Non-farmers3.713.463.593.613.302.973.29
Total3.763.613.693.283.003.033.10
Table 6. The adaptation behavior selection and percentage for farmers.
Adaptation BehaviorSpecific MeasuresPrevalence (%)
Water Resource ManagementConstructing ponds/reservoirs
Reducing cultivated land area
Decreasing irrigation frequency
70.49
Crop ManagementAdjusting planting/harvest dates
Cultivating drought-resistant varieties
Implementing crop diversification/intercropping
Applying organic fertilizers
84.08
Non-agricultural MeasuresSelling livestock/poultry
Seasonal off-farm labor migration
Small-scale entrepreneurship
Participating in paid temporary farm work
Accessing formal/informal loans
88.93
Table 7. The effect of farmers’ drought perception on adaptation behavior.
PredictorWater Resource ManagementCrop ManagementNon-Agricultural Measures
β (SE)β (SE)β (SE)
Risk Perception−0.65 *−0.24−0.30
Risk Sensitivity−0.040.06−0.12
Perceived Adaptation Efficacy0.41 **0.130.42 *
Perceived Self-Efficacy0.47 **−0.01−0.96 ***
Perceived Adaptation Costs0.50 ***0.120.40 ***
Age−1.70 *−0.87 *−0.94
Labor Force Ratio−0.672.120.06
Farming Experience2.03 **0.78−0.16
Annual Income0.67−1.191.15
Cultivated Land Area−1.120.682.71
R20.140.030.10
Notes: *, **, ***, respectively, indicate significance at the levels of 0.1, 0.05, and 0.01.
Table 8. Comparison of farmers adaptative behavior to drought between karst dry-hot valley and arid semi-arid areas.
Divergent StrategiesSemi-Arid Areas (Climatic Arid Regions)Karst Dry-Hot Valley Areas (Non-Climatic Arid Regions)
Crop management & non-agricultural measuresCultivation of drought-resistant crops
Modification of planting/harvesting calendars
Crop diversification/intercropping
Application of organic fertilizers
Adjustment of cropping patterns
Crop insurance adoption
Seasonal off-farm employment
Water resource managementComposite surface water substitution
and management strategies:
Enhanced groundwater exploitation Reduction of irrigated areas
Installation of surface/subsurface pipelines
Dry seedling bed preparation Water diversion system improvements
Surface water management-based strategies:
Reduced irrigation frequency
Cultivated land contraction
Closed karst depression water storage
Construction of rainwater harvesting cisterns
Disclaimer/Publisher’s Note: The statements, opinions and data contained in all publications are solely those of the individual author(s) and contributor(s) and not of MDPI and/or the editor(s). MDPI and/or the editor(s) disclaim responsibility for any injury to people or property resulting from any ideas, methods, instructions or products referred to in the content.

