Article

Temporal and Spatial Variation Characteristics of Seasonal Differences in Extreme Precipitation in China Monsoon Region in the Last 40 Years

1
School of Politics and Public Administration, Qinghai Minzu University, Xining 810007, China
2
Key Laboratory of the Soil and Water Conservation on the Loess Plateau of Ministry of Water Resources, Yellow River Institute of Hydraulic Research, Yellow River Conservancy Commission of Ministry of Water Resources, Zhengzhou 450003, China
*
Authors to whom correspondence should be addressed.
Water 2025, 17(11), 1672; https://doi.org/10.3390/w17111672
Submission received: 29 April 2025 / Revised: 26 May 2025 / Accepted: 30 May 2025 / Published: 31 May 2025

Abstract

:
Based on the long-term daily historical rainfall data, this study analyzes the seasonal differences in extreme rainfall in the monsoon region with frequent extreme rainfall in China over the past 40 years. From the detailed analysis of extreme rainfall indicators, the spatial and temporal variation in extreme rainfall indicators in the monsoon region of China from 1980 to 2020 is explored. Through Mann–Kendall test and multi-index spatial and temporal analysis, the spatial and temporal evolution law and seasonal differentiation characteristics of extreme precipitation events are revealed. The results show the following: (1) The precipitation change presents a dipole pattern of southeast–northeast enhancement, northwest–central attenuation. (2) The precipitation intensity showed the spatial heterogeneity of latitude differentiation of “strong in summer and weak in winter, strong in south and weak in north”, and generally attenuated in winter after reaching the peak in summer. (3) There were significant dry and wet differences between continuous drought days (CDDs) and wet days (CWDs), reflecting the characteristics of “dry in winter and wet in summer”, and the seasonal differentiation of cumulative precipitation (PRCPTOT) was significant. (4) The extreme precipitation threshold is strengthened in winter, and the frequency shows the characteristics of “high in winter and spring, low in summer and autumn”. Studies have shown that extreme precipitation in the monsoon region of China has seasonal redistribution characteristics, which may aggravate the challenge of water resources management. It is necessary to further analyze its driving factors in combination with a dynamic climate mechanism.

1. Introduction

Extreme precipitation refers to the meteorological phenomenon that the precipitation exceeds the normal level on a specific time scale. In the context of global warming, the frequency and intensity of extreme precipitation events have increased significantly, which has a multifaceted impact on ecological environments and socio-economics [1,2,3]. Agricultural production activities are highly dependent on the cyclical characteristics of seasonal rainfall. Any sudden change in the duration or intensity of the rainy season will have a profound and significant impact on the agricultural economy in agricultural production regions such as Asia and Africa [4]. Therefore, the in-depth study of the temporal and spatial variation characteristics of extreme rainfall events is of great significance for grasping the law of extreme precipitation and improving agricultural production efficiency and disaster prevention and mitigation capabilities [5].
Against the background of frequent extreme precipitation, it is particularly important to analyze the change trend of extreme precipitation on global, continental, and regional scales. At the global scale, studies based on global meteorological station data have found that about two-thirds of stations have increased extreme rainfall, and this increasing trend is more pronounced in continents such as Asia, Europe, and North America [6]. On the continental scale, extreme precipitation in North America has increased in recent decades, and the significant increase is concentrated in the central and eastern parts of North America [7,8,9]; extreme precipitation in parts of Central Africa and West Africa showed a decreasing trend, while that in southern East Africa showed an increasing trend [10,11]; and in Asia, extreme rainfall events increased significantly in East and Southeast Asia, while showed different trends in Central and North Asia [12]. At the regional scale, the extreme precipitation patterns in different climatic regions will be slightly different, with significant increases in humid and semi-humid areas, and an increasing trend of extreme precipitation is also observed in arid areas [13,14]. By observing the data for a longer period of time, it was found that the proportion of stations with a significant increase in extreme rainfall increased more, and the detectability of extreme rainfall increased with the extension of observation records [15]. The mean annual maximum precipitation of extreme persistent precipitation events showed a significant increasing trend [16]. Therefore, exploring the variation in the duration of extreme persistent precipitation events is a key entry point for analyzing the complex dynamic mechanism of precipitation systems.
At present, the research on extreme precipitation mainly focuses on the inter-annual differences in extreme precipitation. Many studies have shown that the inter-annual differences in extreme precipitation in different regions show obvious regional characteristics. There are also regional differences in the interannual variation in extreme precipitation in China. The extreme precipitation in the north and southwest regions generally shows a decreasing trend, while the Yangtze River Basin and South China in the southeast show an increasing trend [17,18]. In the Qinghai-Tibet Plateau and its surrounding areas, extreme precipitation generally showed an increasing trend, and its proportion in total precipitation also gradually increased. The extreme precipitation index showed fluctuations over time [19,20]. In addition, in the Nagawali Basin of India, the extreme rainfall index after 1950 showed a downward trend compared with that before 1950 [21]. In Ho Chi Minh City, Vietnam, the intensity and frequency of extreme precipitation events tend to increase in the southern and central parts of the city, while their duration tends to decrease in the northern and central parts [22]. The above studies have comprehensively summarized the differences in extreme precipitation in different regions on the interannual scale. However, the seasonal variation in extreme precipitation has not been fully elaborated on.
The seasonal differences in extreme precipitation events have been widely studied in many regions of the world. The frequency and intensity of extreme precipitation events are more significant in some seasons [23], making extreme precipitation show significant differences in different seasons. This phenomenon is also more pronounced in the monsoon region with more obvious seasonality [24]. For example, in the Indian monsoon region, extreme precipitation events are mainly concentrated in the monsoon season (June to September), and the frequency and intensity of extreme precipitation events have significant intraseasonal variations [25,26]. On the northern coast of the Gulf of Guinea in West Africa, extreme precipitation is most frequent in the early monsoon season, and extreme precipitation events gradually decrease as the monsoon season progresses [27]. In the East Asian monsoon region, there are significant differences in intensity and frequency between precipitation events before the monsoon and extreme precipitation events during the monsoon [28,29]. The extreme precipitation events in this area are more frequent and stronger in the monsoon season. Although a large number of studies have explored the seasonal differences in extreme precipitation, the specific mechanisms in different regions and climate backgrounds still need further study. Especially in the context of climate change, the unique seasonal differences in extreme precipitation in the monsoon region still need to be explored.
The frequency and intensity of extreme rainfall in the monsoon region are significantly higher than those in other regions. For example, the monsoon region of China, as the junction of the largest land and the largest ocean, has a strong monsoon climate. The precipitation is unevenly distributed throughout the year and the seasonality is significant. At the same time, China’s monsoon region is also a densely populated area in China. Similarly, agricultural production activities in the region are strong, and the agricultural economy is extremely dependent on seasonal precipitation. The seasonal differences and spatial-temporal imbalance of extreme precipitation are likely to cause disasters such as floods or droughts in the region, which directly affect food security, urban operation, and the life and property security of the region. However, the current research on extreme rainfall in the monsoon region has insufficient data coverage in the study area [6,15], the high spatial and temporal variability of precipitation measurement makes it difficult to homogenize the data, the accuracy of data products and other issues. Therefore, it is of great significance to explore seasonal differences in extreme rainfall in monsoon regions.
China’s monsoon region covers 67.7% of the country’s land area [30]. Its complex monsoon system leads to the uneven spatial and temporal distribution of precipitation and significant extremes [31]. China’s monsoon region gathers more than 70% of the country’s population and 80% of the country’s economic aggregate [32]. Disasters such as rainstorms and floods caused by extreme precipitation can easily lead to chain losses. For example, the flood in the Yangtze River Basin in 1998 caused more than 3000 deaths and direct economic losses reached 160 billion CNY. In 2021, heavy rain in Henan Province led to urban waterlogging and so on [33,34,35,36]; global warming and urbanization have increased the intensity and uncertainty of precipitation, and it is necessary to improve the prediction ability and optimize the disaster prevention system through mechanism research [37,38]. In addition, the study of extreme precipitation in the monsoon region of China not only reveals the scientific value of the natural-anthropogenic coupling mechanism but also provides key support for the national strategic layout and global climate governance, which is the core issue of addressing climate change and ensuring sustainable development.
Based on the long-term daily historical rainfall data, this study will analyze the seasonal differences in extreme rainfall in the monsoon region with frequent extreme rainfall in China over the past 40 years. Firstly, the spatial and temporal variation in precipitation in this region is analyzed. Secondly, the seasonal differences in multiple indicators in the three aspects of extreme precipitation intensity, duration, and precipitation threshold are analyzed in detail, and the variation law is explored. By analyzing the variation law of extreme precipitation in the monsoon region of China from different angles, it can provide a theoretical basis for a more in-depth understanding of the variation law of extreme precipitation in the region and also provide a reference for disaster prevention and agricultural production in the region.

2. Materials and Methods

2.1. Research Area Summary

The Chinese monsoon region is located in the eastern part of Eurasia, covering a total area of about 40% of China’s land area. Its climate is controlled by the East Asian summer monsoon and the South Asian summer monsoon. It has high temperatures, is rainy in summer and cold and dry in winter, and has strong seasonal precipitation. The regional natural environment presents a significant ladder-like differentiation pattern. The terrain gradient drives the water vapor of the Western Pacific and the Indian Ocean to the inland through dynamic uplift and thermal forcing, forming a convergent rain belt. The Yangtze River, Pearl River, Huaihe River, and the middle and lower reaches of the Yellow River run through the region, and the annual average runoff accounts for more than 80% of China’s total. At the same time, as the core area of the national population and economy, it carries about 75% of the population and contributes 65% of GDP, forming a dense urban agglomeration and a diversified industrial system led by the Yangtze River Delta and the Pearl River Delta. The Yangtze River–Pearl River Basin comprises 80% of China’s rice and 90% of its freshwater aquaculture capacity, while the coastal industrial corridor constitutes the backbone of the national manufacturing industry. The study area is shown in Figure 1.

2.2. Data

The precipitation data used in this study are derived from GloH2O’s MSWEP V2 dataset (https://www.gloh2o.org/mswep/ (accessed on 2 April 2024)). MSWEP V2 integrates multiple data sources, including ground observation stations (such as WorldClim, GHCN-D, GSOD, etc.), satellite data (such as CMORPH, GridSat, GSMaP, TRMM, etc.) and reanalysis data (such as ERA-Interim, JRA-55, etc.). The weighted integration method is used to achieve global land–sea full coverage (1979–2017) and high spatial and temporal resolution (0.1°, 3 h), and the terrestrial precipitation system bias is corrected by using the runoff data of 13,762 hydrological stations [39,40]. Compared with other datasets, the spatial distribution of MSWEP V2 in global precipitation mean (land 781 mm/year), intensity, and frequency (land precipitation occurrence time accounts for 12.3%) is more realistic, especially in mountainous areas where there is a systematic underestimation [41].
The comprehensive evaluation based on multi-source meteorological data shows that there is significant spatial and temporal heterogeneity in the performance of MSWEP V2 precipitation products in China. Monthly and annual scale analysis showed that the correlation coefficients with the observation data of meteorological stations were 0.942 and 0.870, respectively, which confirmed the reliability of the product in the analysis of a long time-series and large spatial range [42]. However, at the high spatial-temporal resolution level, the verification results of 67,000 rainfall stations covering the Chinese mainland in 2016 showed that the 3 h precipitation correlation coefficient (0.52) of GMCP products was slightly superior to that of MSWEP V2 (0.50), but the difference in precipitation event recognition ability between the two was not significant [43]. In particular, in the case of extreme heavy precipitation in Beijing, the accuracy of MSWEP V2 daily precipitation data is significantly higher than that of mainstream products such as CMFD and IMERG, showing its special value in extreme weather research [44].
Its precipitation frequency is higher than that of the CMORPH dataset. This paper selects the data from 1980 to 2020 for research, and the time resolution is day. In order to meet the needs of extreme rainfall research in the monsoon region of China, this study further uses high-resolution climate maps based on Köppen–Geiger climate classification data for analysis (https://www.gloh2o.org/koppen/ (accessed on 2 April 2024)).

2.3. Method

2.3.1. Extreme Precipitation Index

The purpose of this study is to describe the seasonal characteristics of extreme rainfall in the monsoon region of China, using the extreme rainfall index system of the Expert Team on Climate Change Detection and Indices [45], which has been widely used in the study of extreme precipitation. The system covers the following indexes: Rx1day (maximum daily precipitation per season), Rx5day (maximum daily precipitation for five consecutive days per season), SDII (seasonal average daily precipitation intensity), R95p (strong precipitation exceeding 95% quantile), R99p (extremely strong precipitation exceeding 99% quantile), CDDs (continuous drought days), CWDs (continuous wet days), PRCPTOT (total seasonal precipitation), R10 (moderate rain days), R20 (heavy rain days), and R50 (rainstorm days). These indices comprehensively reflect the intensity and frequency of seasonal extreme precipitation [46,47]. In order to facilitate the analysis of the law, this paper divides these indicators into three categories, namely, extreme precipitation intensity index, duration index, and threshold index, as follows.
(1) Extreme precipitation intensity index:
Indicators reflecting precipitation intensity include Rx1day, Rx5day, and SDII. The Rx1day index represents the maximum daily precipitation in each season, and its calculation method is as follows:
R x 1 d a y y   = m a x ( P R y t   )
In the formula, in PRyt, where the t day corresponds to the season y, y is the corresponding season and t is the number of days.
The Rx5day index represents the maximum precipitation for five consecutive days in each season. The calculation method is as follows:
R x 5 d a y y   = max ( P R y t   )
In the formula, in PRyt, where the t day corresponds to the season y, y is the corresponding season and t is the number of days.
The SDII index represents the average daily precipitation in each season, which is calculated as follows:
S D I I t   = P R w t / W
In the formula, in PRyt, where the t is the number of days corresponding to the season w, where t represents the number of days, and W represents the number of days with precipitation.
(2) Extreme precipitation duration index:
The indexes reflecting the duration of precipitation include CDDs, CWDs, and PRCPTOT. The CDD index represents the longest continuous number of days with precipitation less than 1 mm in a quarter. The calculation method is as follows:
C D D = m a x ( Q , P R yt   < 1   mm )
In the formula, PRyt, where the t day corresponds to the season y, is the number of days of continuous rainfall.
The CWD index represents the longest continuous days of precipitation ≥ 1 mm in a quarter. The calculation method is as follows:
C W D = m a x ( Q , P R yt   1   mm )
In the formula, PRyt, where the t day corresponds to the season y, Q is the number of days of continuous rainfall.
The PRCPTOT index represents the total precipitation in a quarter, and its calculation method is as follows:
PRCPTOT = ( P R y t   1   mm )
In the formula, PRyt, where the t day corresponds to the season y.
(3) Extreme precipitation threshold index:
The absolute threshold indexes reflecting precipitation are R10, R20, and R50. The R10, R20, and R50 represent the number of days with daily precipitation exceeding 10 mm, 20 mm, and 50 mm in a quarter, respectively. The calculation principle involves the statistics of the corresponding precipitation threshold. The calculation method is as follows:
R B m m = ( P R yt   B   mm )
In the formula, in PRyt, is the t day corresponding to the season y, B = 10, 20, 50.
The relative threshold indices reflecting precipitation are R95p and R99p. Its R95p and R99p represent extremely strong precipitation with more than 95% and 99% quantiles in a quarter, respectively. The calculation principle is based on the percentile analysis of precipitation distribution. The calculation method is as follows:
R Z p = ( P R yt   > P R Z   )
In the formula, PRyt is the t day corresponding to the season y and PRZ is the rainfall in a quarter. Z = 95, 99.

2.3.2. Mann–Kendall Trend Test and Sen Slope

In this study, the Sen slope [48] and Mann–Kendall (M-K) [49] trend test methods were used to analyze the temporal variation trend and significance of 11 extreme precipitation indicators. Among them, the Sen slope, as a non-parametric method, is suitable for estimating the trend slope in data sample pairs [50]. M-K is relatively robust to outliers in the data and is not affected by missing values and outliers. It is suitable for trend significance test of long-term time-series data. This method has been widely used in detecting the trend and significance of rainfall-related indices [51,52,53].

3. Results

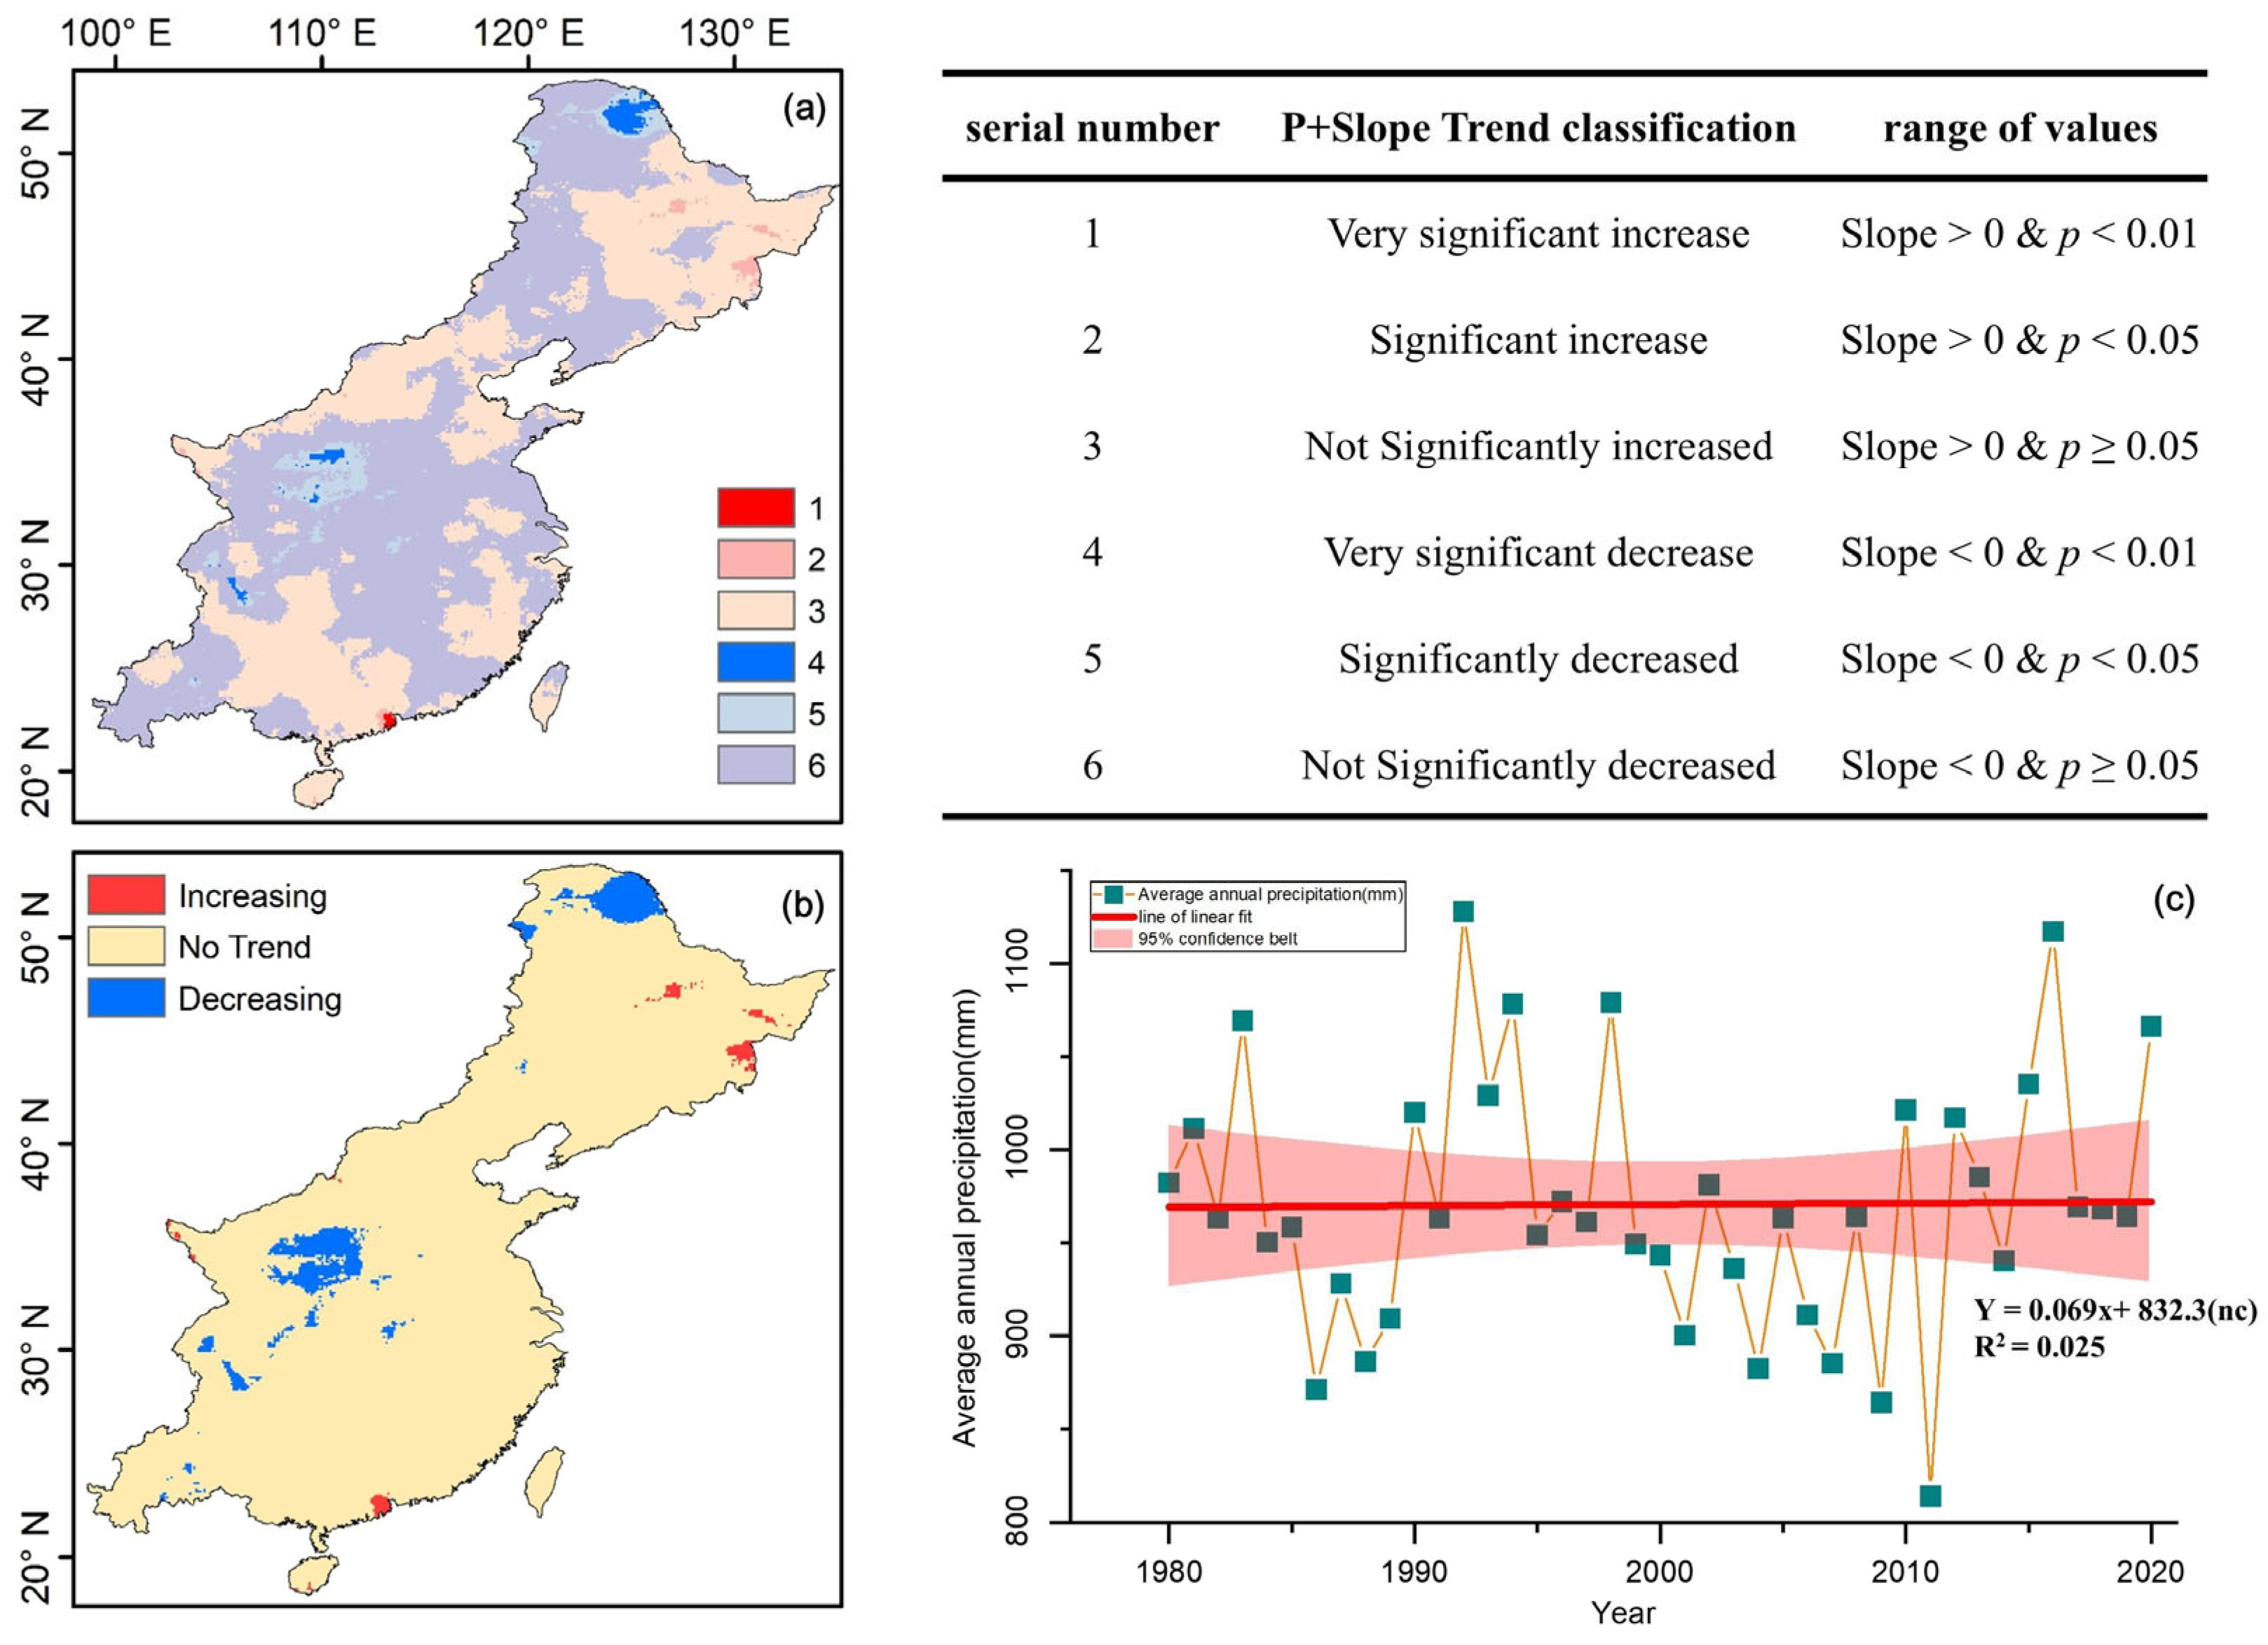
3.1. The Temporal and Spatial Variation Trend of Precipitation in Monsoon Region of China

The Mann–Kendall test (Figure 2), based on 40-year daily precipitation data from the monsoon region of China, reveals notable spatial differentiation in precipitation trends. In the southeast coast, southwest plateau, and parts of the North China Plain, the P value is 1.96 (Figure 2a), confirming the statistical reliability of the trend changes. The trend direction and rate display distinct geographical gradients: the northeast and southeast regions exhibit a significant increasing trend, while the northwest and central areas show a significant decreasing trend. Time-series analysis (Figure 2c) further indicates a downward trend in average annual precipitation from 1980 to 2020. Specifically, the distance between the 25% quantile line and the 75% quantile line has expanded from 200 mm in 1980 to 300 mm in 2020, accompanied by an increased inter-annual fluctuation range, reflecting a rise in extreme precipitation events.
Through the integration of spatial distribution and temporal evolution analyses, a dipole pattern has emerged in the monsoon region of China, characterized by southeast-northeast enhancement and northwest-central weakening. This pattern is validated by the spatial consistency of the p value, Z value, S slope, and Tau value, all meeting the criteria of (p < 0.05, Z > 1.96, S > 0, Slope > 0, and τ > 0).
An analysis of extreme precipitation indices in the monsoon region of China from 1980 to 2020 (Table 1) indicates significant seasonal differentiation in precipitation patterns. The short-duration heavy precipitation index shows continuous weakening in spring, summer, and autumn, with RX5day exhibiting a significant downward trend across these three seasons. In summer, the extreme precipitation days indices (R10 and R20) display accelerated attenuation, but in winter, a contrasting change occurs, marked by a significant increase in extreme precipitation indices such as R20, R95p, and R99p. Notably, the synchronous weakening of the continuous drought days (CDDs) and summer precipitation intensity (SDII) indices, along with a significant increase in the continuous wet days (CWD) index in autumn, is particularly evident.

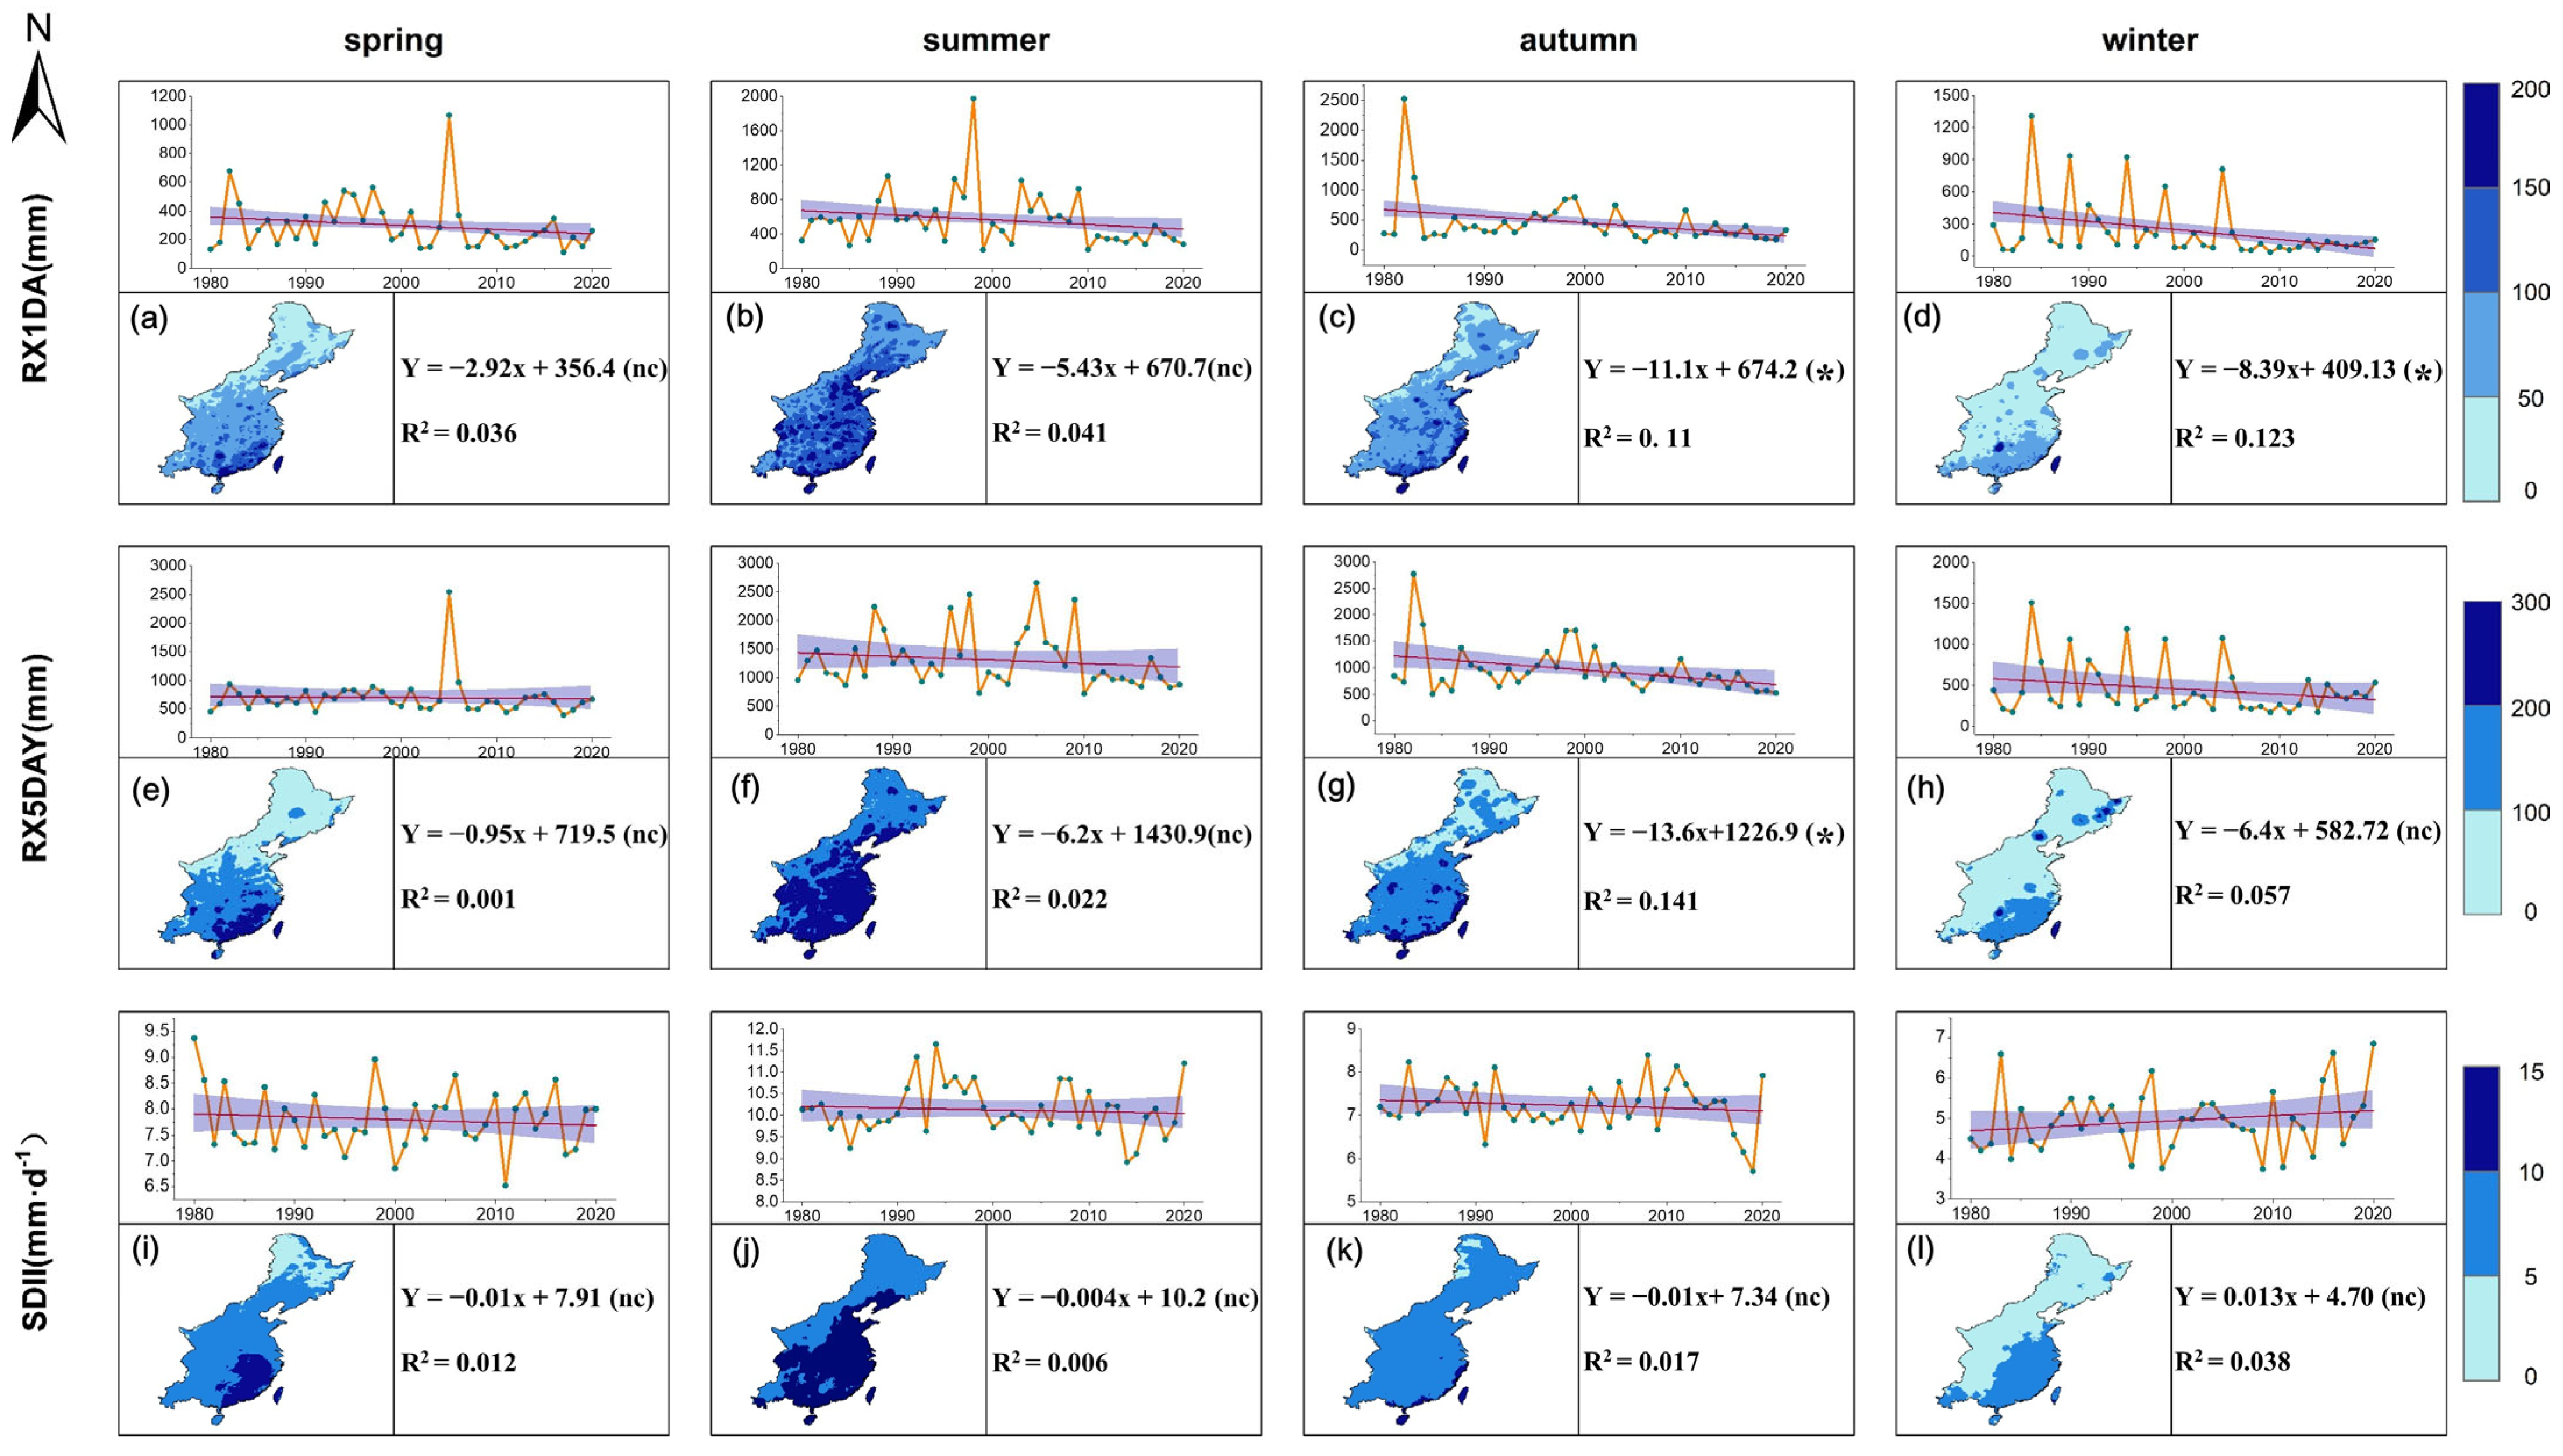
3.2. Temporal and Spatial Variations in Seasonal Differences of Extreme Precipitation Intensity in Monsoon Region of China

This study presents a comprehensive analysis of the seasonal differentiation characteristics of extreme precipitation intensity indices (Rx1day, Rx5day, SDII) in the monsoon region of China, highlighting significant seasonal cycles and spatial heterogeneity. Time-series analysis reveals that precipitation intensity exhibits seasonal fluctuation, characterized by an initial increase followed by a decrease. Summer registers the highest extreme precipitation intensity (Figure 3b,f,h), with Rx1day and Rx5day in the eastern coastal area reaching regional extremes. In winter, precipitation intensity drops to its annual lowest, and Rx1day generally remains below 50 mm (Figure 3d). In autumn, the Rx1day and Rx5day indices (Figure 3c,g) show a downward trend (p < 0.05). Winter SDII, however, only slightly increases (Figure 3k). It is worth noting that in spring and summer, the trend slope absolute values of each index remain within 8.39, and most fail the significance test, indicating the stability of extreme precipitation intensity on a seasonal scale.
Spatial analysis reveals significant latitudinal effects, shaping a pattern of “summer strong/winter weak, south strong/north weak”. After summer intensity peaks, it generally attenuates by 50–80% in winter, with the attenuation rate increasing with latitude. Notably, the weak winter SDII enhancement in the eastern coast and significant attenuation in North China create spatial differentiation (Figure 3k), revealing spatial instability in the winter monsoon precipitation system. Southern regions maintain stable high-value areas in precipitation intensity and frequency, showing typical monsoon characteristics of summer concentration and winter recession. From 1980 to 2020, extreme precipitation intensity indices show no long-term trend, suggesting the overall stability of extreme precipitation intensity in the monsoon region of China.

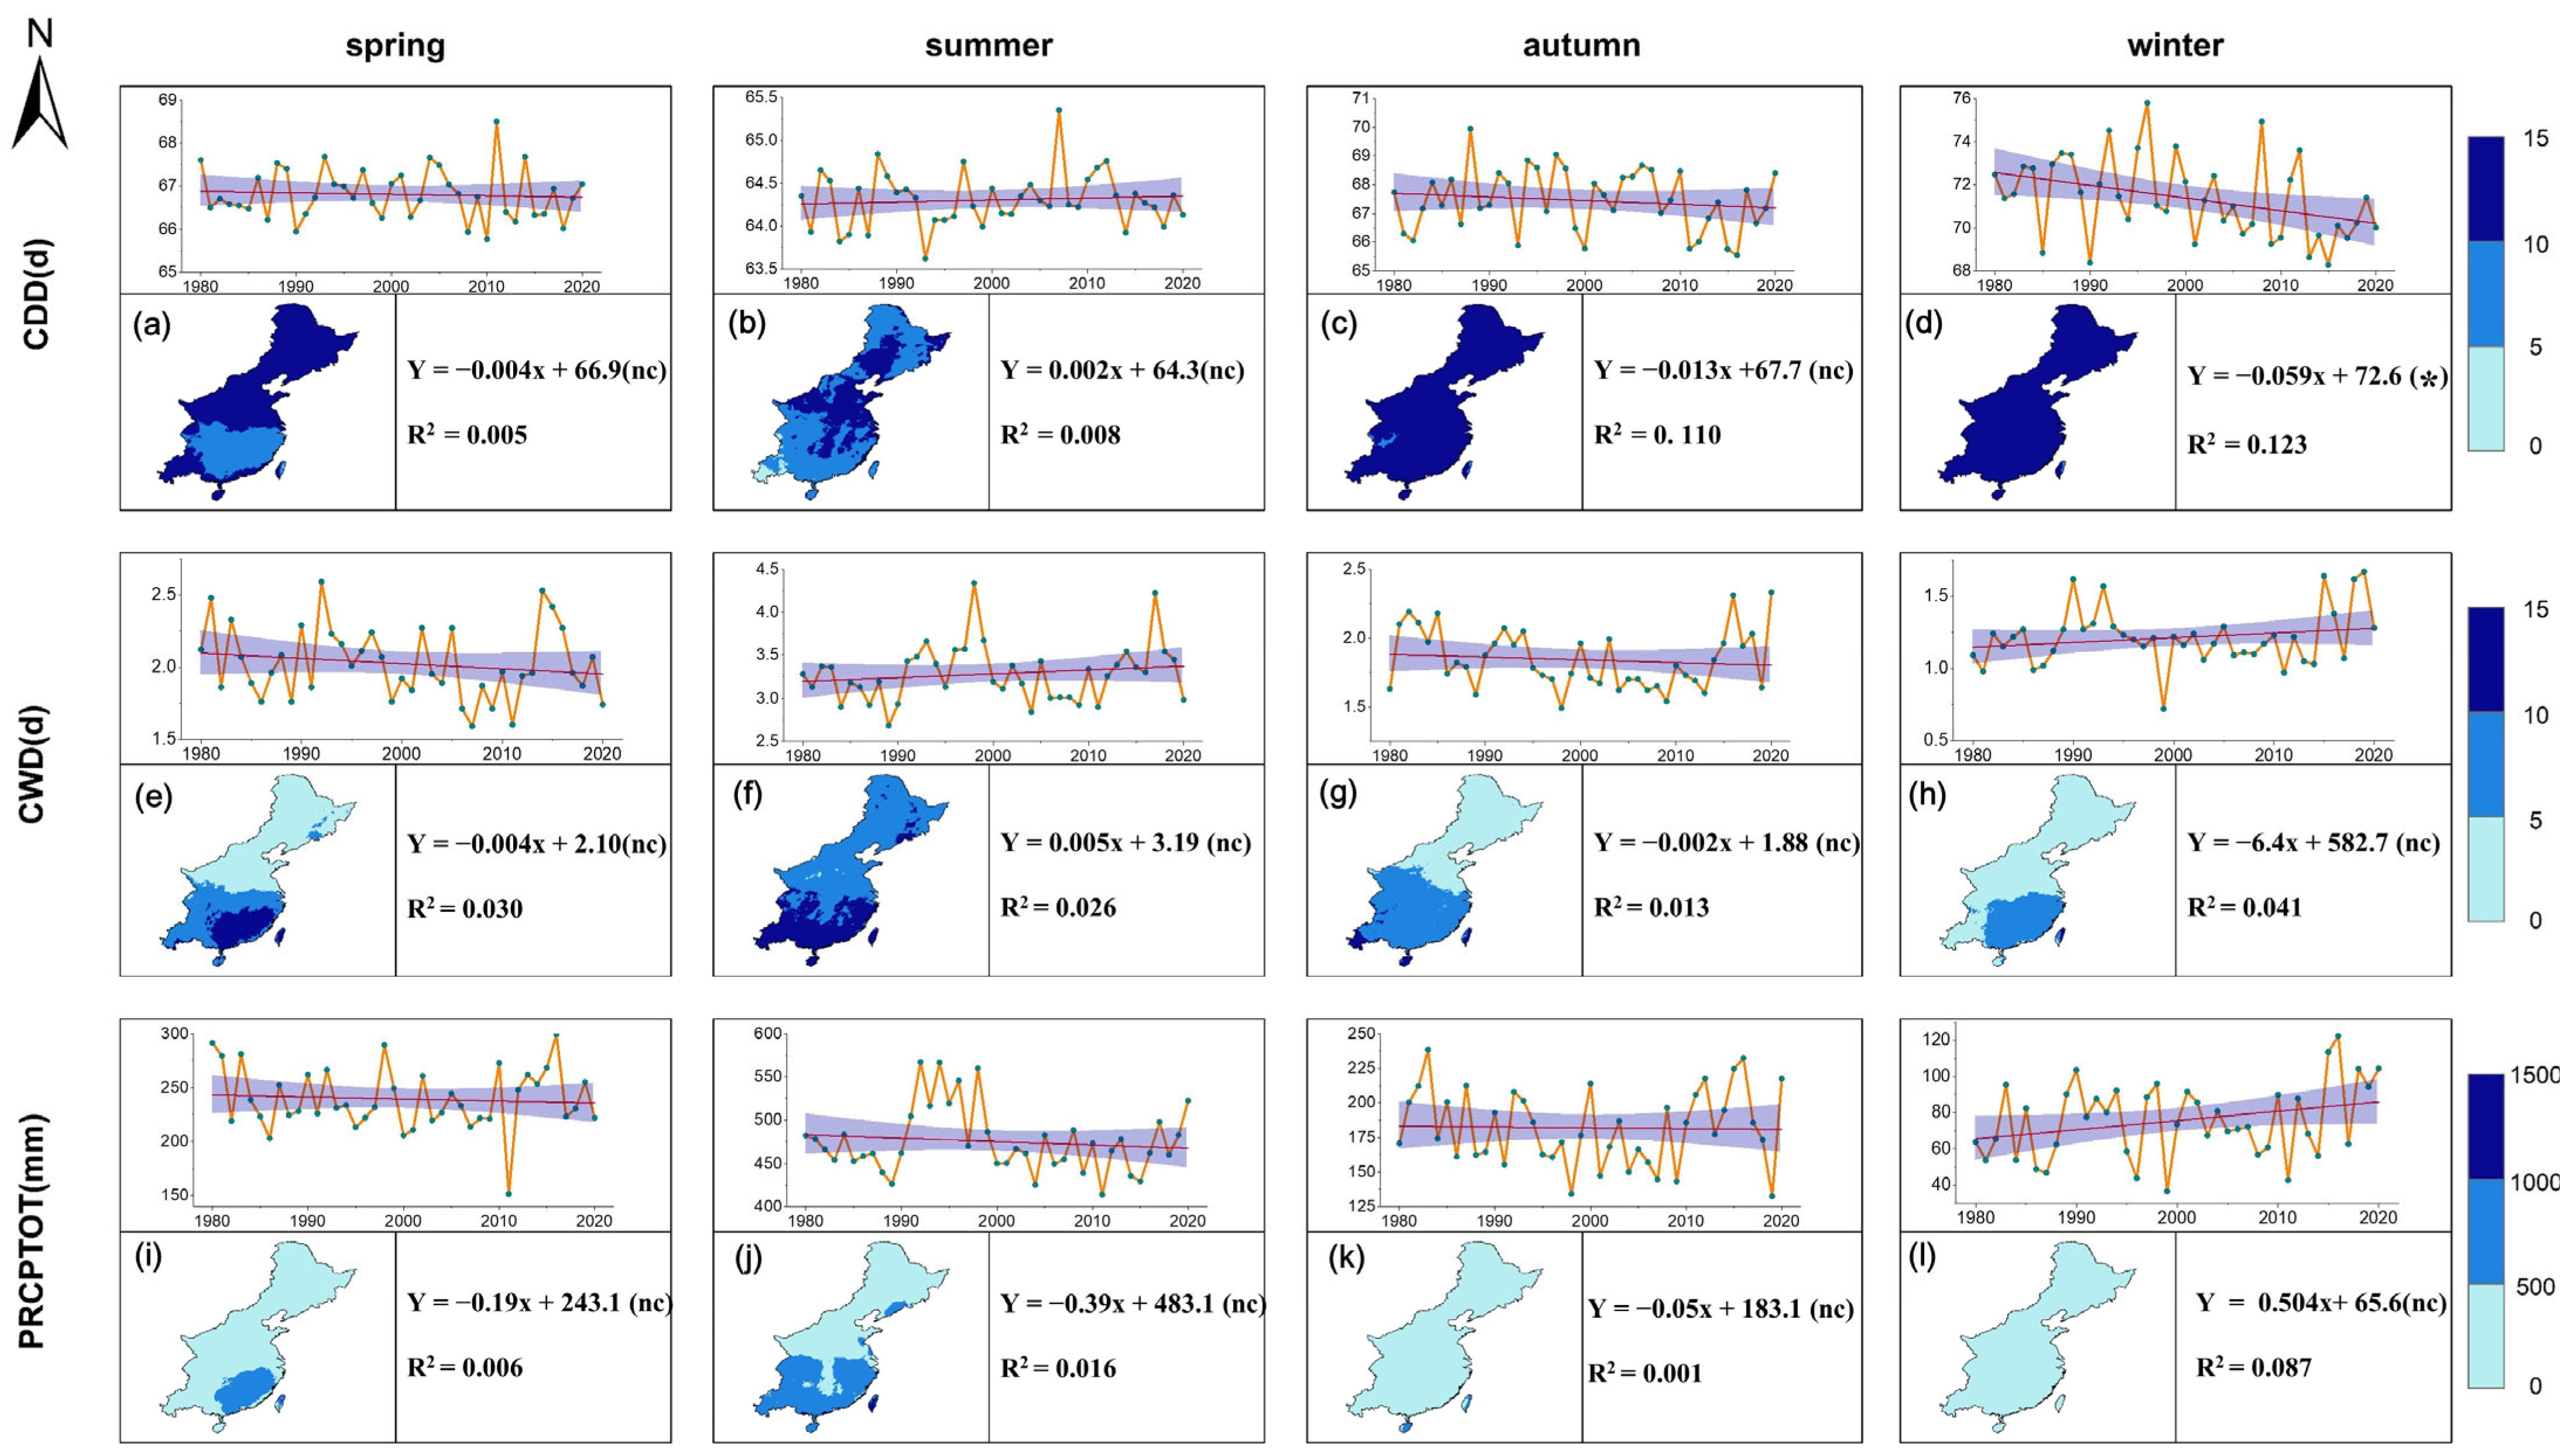
3.3. Temporal and Spatial Variations in Seasonal Differences in Extreme Precipitation Duration in the Monsoon Region of China

In this study, by analyzing the seasonal variation characteristics of extreme precipitation indicators (CDDs, CWDs, PRCPTOT) in the monsoon region of China, the spatial and temporal evolution of dry–wet pattern and precipitation gradient is revealed below.
There were significant spatial differences in dry and wet characteristics between continuous dry days (CDDs) and continuous wet days (CWDs). CDDs and CWDs showed significant seasonal anti-phase changes (Figure 4). In spring, the southeast coast CDD value is 15 days, indicating that the drought period in the north is prolonged; correspondingly, CWDs were > 10 days in the southern monsoon region (south of 28° N), and generally < 5 days in the north (Figure 4e), forming a north–south dry–wet confrontation pattern. The summer monsoon activity drives the CDDs to decrease to ≤10 days (Figure 4b), and the CWDs reach a seasonal peak (Figure 4f). The difference between dry and wet in winter is the most significant: the CDDs in North China reach an annual peak (45–60 days), while the CWDs in the whole country are less than 5 days (Figure 4h), highlighting the monsoon climate characteristics of dry in winter and wet in summer.
The seasonal evolution of cumulative precipitation (PRCPTOT) showed significant gradient characteristics. P decreased from south (>400 mm) to north (<200 mm) in spring. The core area of heavy precipitation was formed after the outbreak of summer monsoon; in autumn, the coastal area saw 300–400 mm, and the inland had attenuation to < 200 mm; the precipitation gradient in winter intensified and was generally <50 mm in the north.
The results showed that the trend of most seasonal indicators did not reach a significant level, and only CDD detected a significant downward trend in winter (p < 0.05). The spatial heterogeneity of PRCPTOT trend is significant: in summer, the Yangtze River Basin shows a slight decline, and in winter, North China shows a partial rise. It is worth noting that extreme dry and wet events have strong temporal instability on a seasonal scale.

3.4. Temporal and Spatial Variations in Seasonal Differences of the Extreme Precipitation Threshold in the Monsoon Region of China

3.4.1. Temporal and Spatial Variations in Seasonal Differences of Absolute Threshold Index

Spatially, the R10, R20, and R50 indices were generally higher in the southern region (Figure 5) and high values were maintained in the 22° N–25° N (South China coast) area throughout the year, which is significantly higher than the 35° N–40° N (North China Plain) low-value area. The frequency of extreme precipitation events in the southern region is relatively high in each season. In terms of time, the frequency of extreme precipitation events in spring and winter is higher, while that in summer and autumn is relatively low. It confirms the distribution pattern of “strong in the south and weak in the north, high in the east and low in the west”.
The frequency of extreme precipitation shows the characteristics of “high in winter and spring, low in summer and autumn”. The R20 index in winter showed a significant upward trend, and its linear equation intercept was 76% lower than that in spring, reflecting the enhancement of persistent precipitation events in winter. In summer, the R50 index decreased slightly in the eastern coastal areas. Only winter R20 (Figure 5h) passed the significance test, and other seasons and indices did not reach significance. The analysis of seasonal interannual variability shows that the standard deviation of R10 is 2.1–3.0 (spring and winter), R20 is 1.6–2.6 (summer and autumn), and R50 is 0.5–1.0 (annual), indicating that there is a significant interannual fluctuation in the frequency of extreme precipitation.

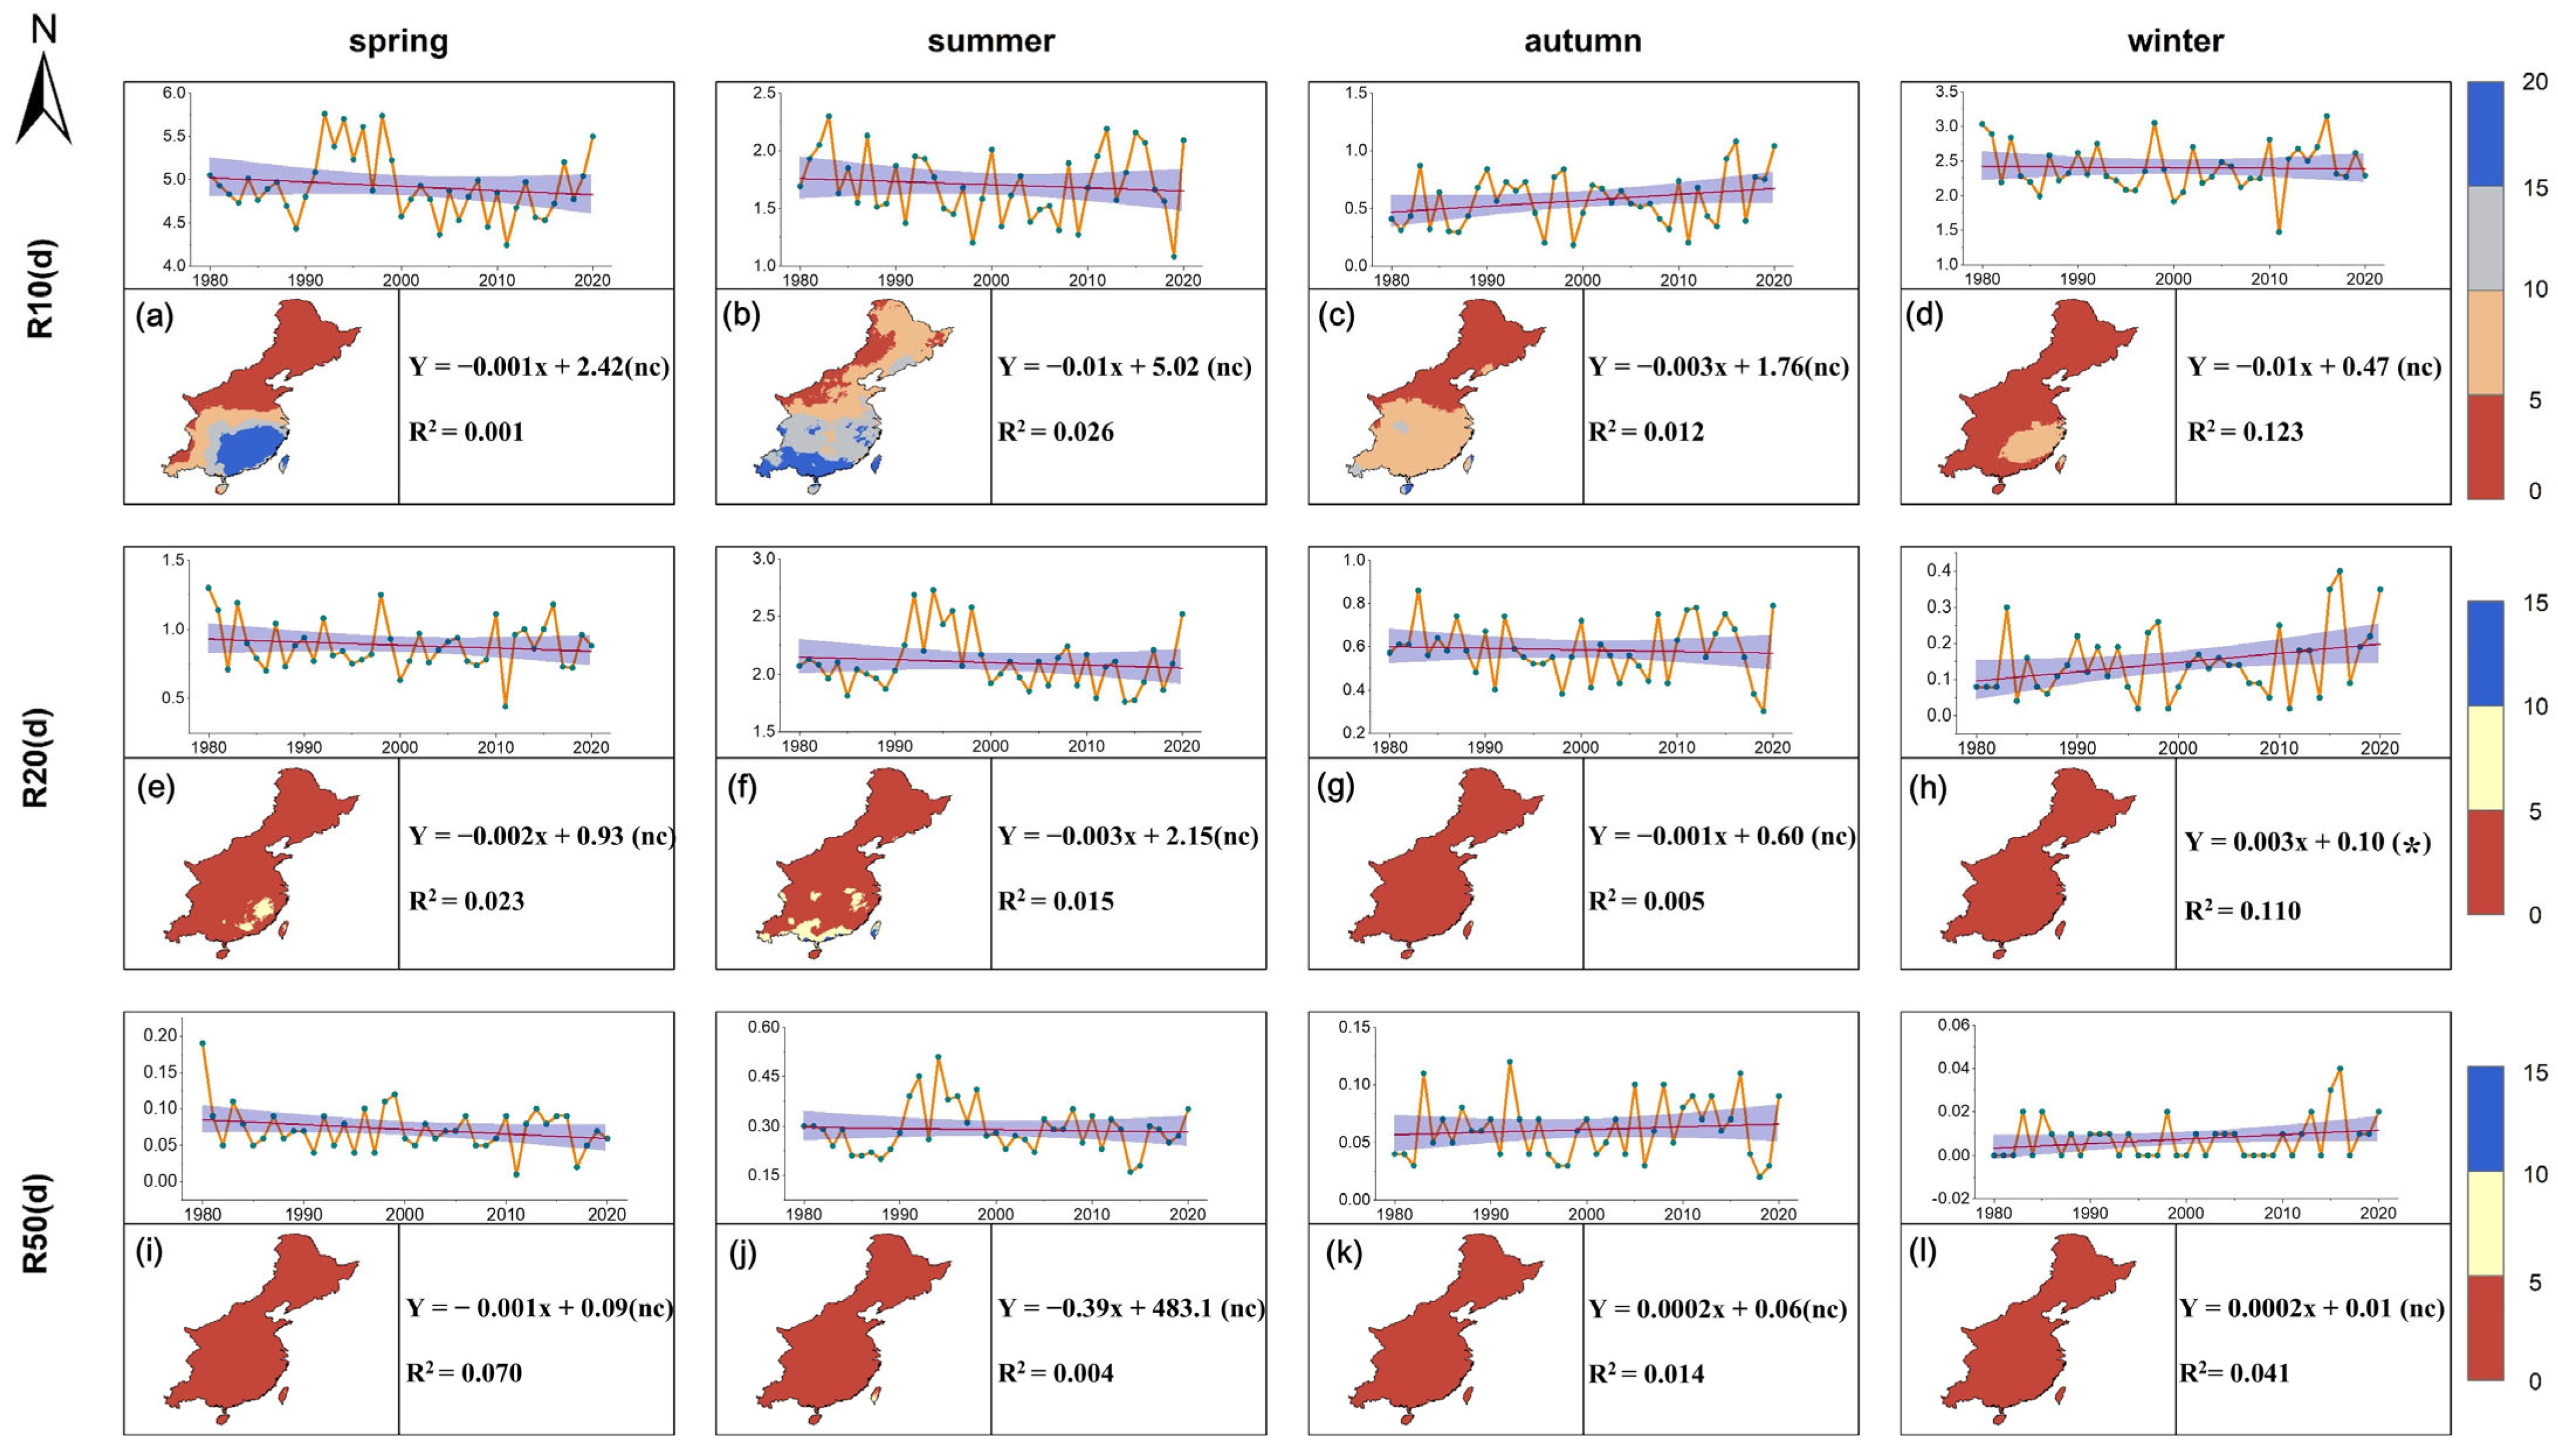
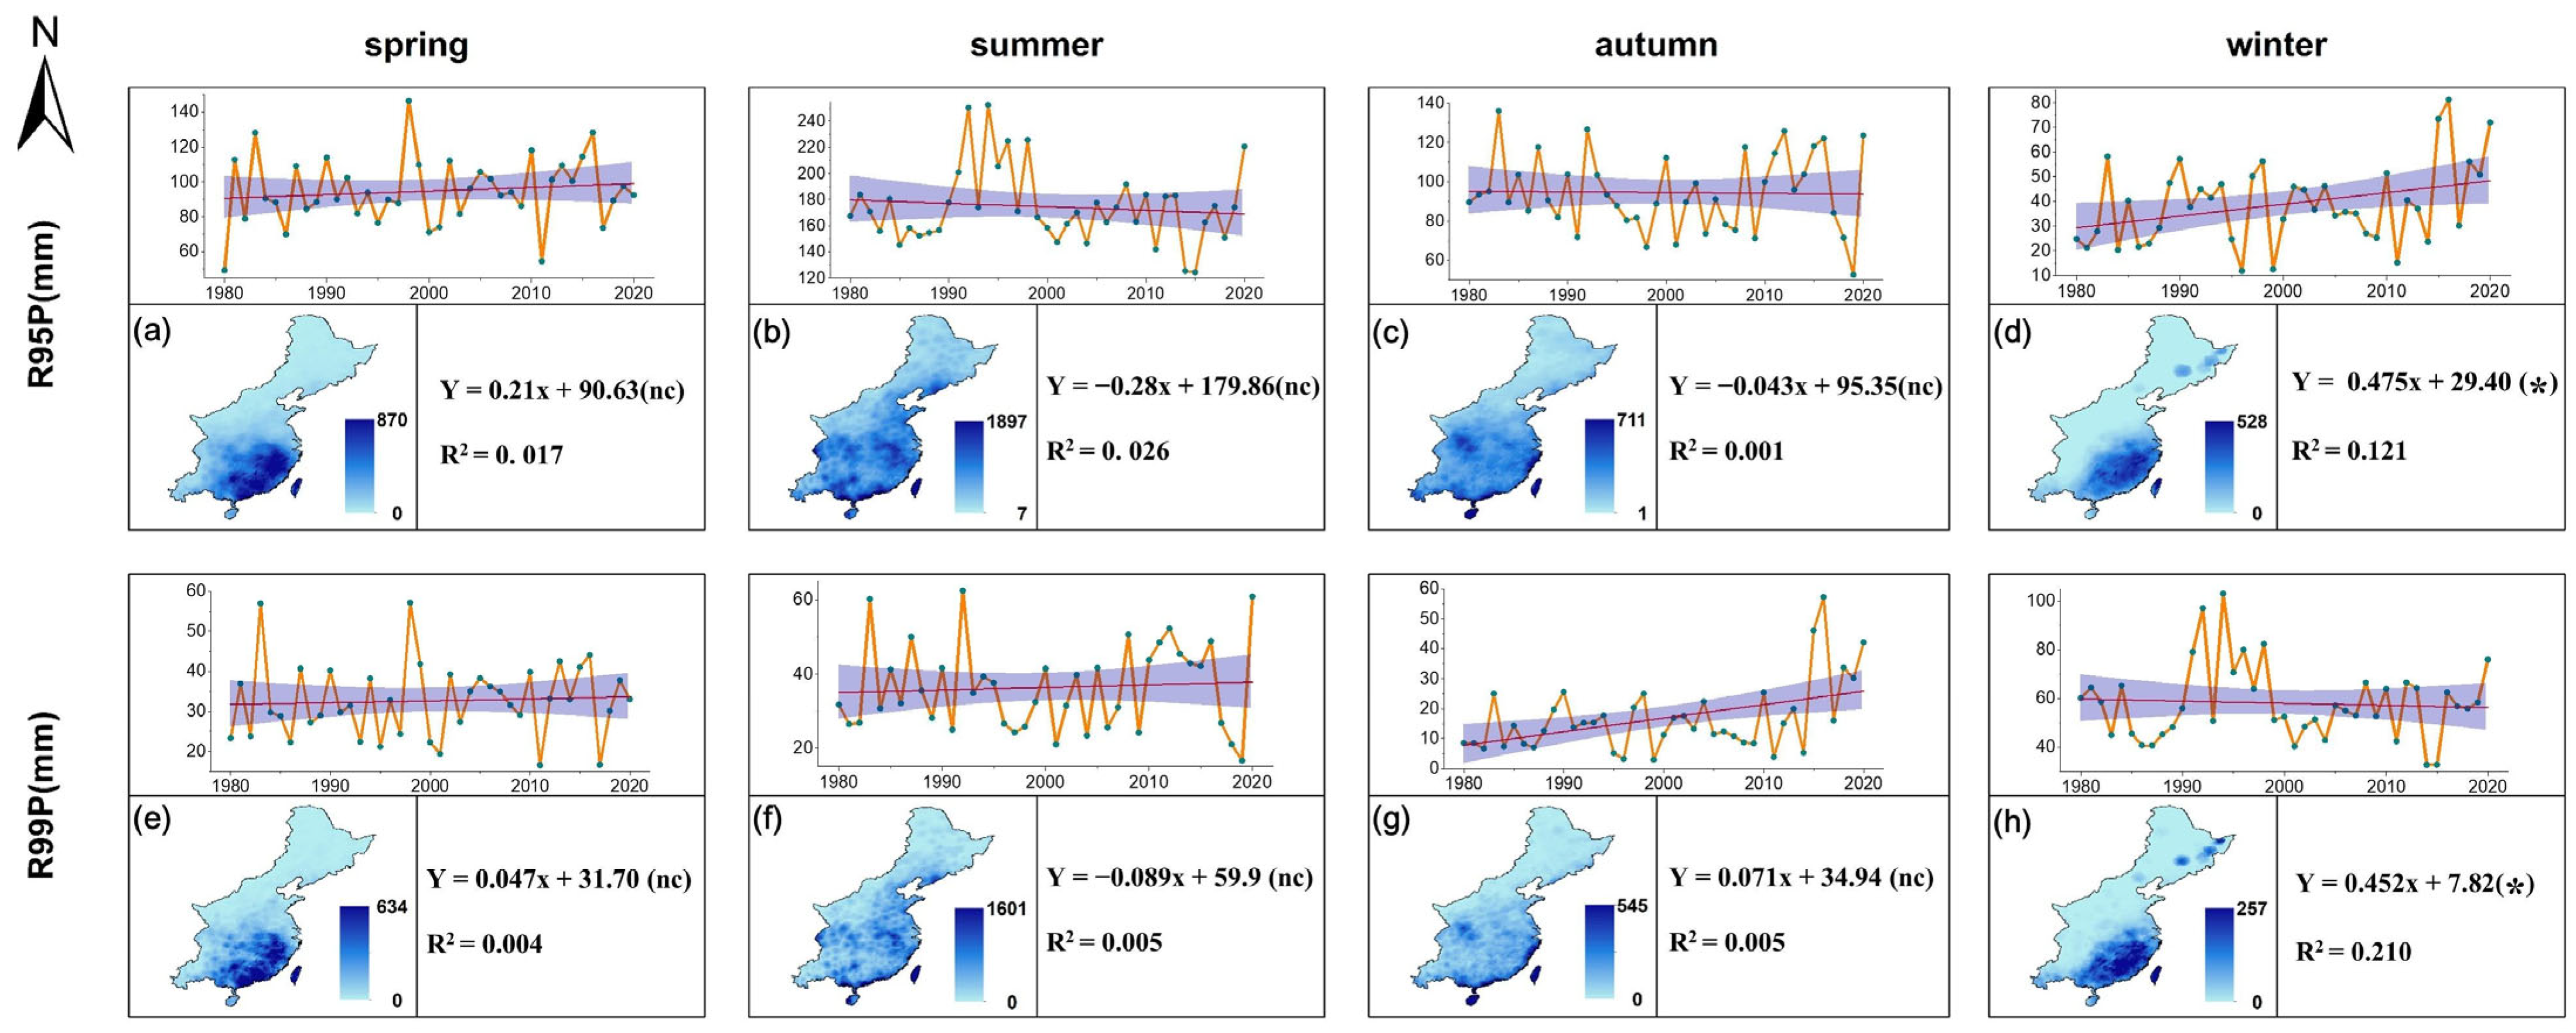
3.4.2. Temporal and Spatial Variations in Seasonal Differences of Relative Threshold Index

Both types of indices show significant north–south gradients: the South China (22° N–25° N) threshold maintains a high value area throughout the year, and the R95 P value of South China in winter is two to three orders of magnitude higher than that of Northeast China in the same period (Figure 6h). During the onset of the summer monsoon, South China formed an extreme center of R95P (1896.03 mm, Figure 6b), which is 4.7–9.5 times higher than the threshold (200–400 mm) of North China (35° N–40° N) during the same period. In the spatial pattern, the two types of indices in the region east of 114° E are characterized by “high in the south and low in the north”, and the threshold of 25° N (South China) is generally two to three orders of magnitude higher than that of 38° N (North China).

4. Discussion

4.1. The Spatial and Temporal Differentiation Characteristics of Precipitation Trend

The precipitation trend in the monsoon region of China from 1980 to 2020 shows distinct spatial differentiation: the southeast and northeast regions show an upward trend, while the northwest and central regions show a significant decline. This spatial pattern may be due to the differential response of the monsoon system to different regions: the southeast is the core channel of monsoon water vapor transport, and its precipitation enhancement is closely related to the extension of the active period of the South China Sea summer monsoon and the shift in the position of the Western Pacific Subtropical High (WPSH). Studies have shown that the early onset of the South China Sea summer monsoon can prolong its active period, forcing the WPSH to jump northward and causing the monsoon trough water vapor channel to converge to the southeast coast. The South China Sea summer monsoon onset triggered by tropical cyclones can enhance the intensity of southwesterly water vapor transport and increase precipitation in the southeastern region by 20–30% [54,55]. When the WPSH ridge line moves southward, the strong ascending motion on the northwest side and the water vapor transport in the South China Sea form a “water vapor dynamic synergistic enhancement” mechanism, which is particularly significant in the El Niño decay year [56,57,58].
The asymmetry of precipitation trend (slope, Tau value difference) between northeast and southeast may reveal the regional difference in land–sea thermal effect against the background of climate warming. Although both of them benefit from the enhanced monsoon, their water vapor sources are essentially different: stable isotope tracers show that 67% of the precipitation in the Northeast China originates from the Okhotsk Sea water vapor, while 82% of the precipitation in the Southeast China depends on the South China Sea–West Pacific water vapor transport. Under the current climate background, the melting of Arctic Sea ice increases the water vapor transport efficiency of the Okhotsk Sea by 13%, while the intensification of the instability of the South China Sea monsoon leads to the enhancement of the volatility of the southeast water vapor flux [59,60].
In summary, the spatial and temporal differentiation of precipitation pattern in the monsoon region of China is a comprehensive reflection of the sea–land–atmosphere coupling effect, and study of its future evolution still requires attention to be paid to the nonlinear regulation of teleconnection factors such as Arctic amplification and Indian Ocean dipole.

4.2. Seasonal and Spatial Differentiation of Extreme Precipitation Intensity

The seasonal differentiation characteristics (summer peak and winter trough) of extreme precipitation intensity (Rx1day, Rx5day, SDII) confirmed the dominant control of monsoon climate on precipitation intensity. The proportion of summer precipitation intensity is the highest, which is closely related to the enhanced water vapor flux during the monsoon active period. The abundant water vapor transport and favorable thermal conditions brought by the East Asian summer monsoon significantly strengthen the extreme precipitation events [61,62]. Although most indicators (such as SDII) did not show significant trends, the significant decrease in Rx1day and Rx5day in autumn and winter may reflect the decrease in the frequency of local extreme precipitation events, which is consistent with the phenomenon of early monsoon retreat and weakened water vapor flux found in recent studies [62].
In terms of spatial distribution, the intensity pattern of “more in the south and less in the north, more in the east and less in the west” highlights the synergistic mechanism of terrain and water vapor transport: the high value area of extreme precipitation is formed in the coastal area of South China due to the combined effect of terrain uplift and water vapor transport in the South China Sea. Studies have shown that the water vapor in the South China Sea contributes more than 70% of the water vapor flux in South China in summer [63], and the forced uplift of the coastal topography to the monsoon water vapor in the South China Sea can trigger a strong convective system [64]. In contrast, in North China, the extreme precipitation intensity is significantly lower due to the constraints of the downdraft on the northwest side of the Western Pacific Subtropical High (WNPSH) and the insufficient inland water vapor transport (only 30–50% of South China) [65].
There was no significant trend in the extreme precipitation intensity index from 1980 to 2020, but the significant decrease in some indexes in autumn and winter suggested the potential adjustment of the frequency of local extreme precipitation events. The results show that the reduction in extreme precipitation in autumn and winter in China’s monsoon region may increase drought vulnerability while alleviating flood risk. In particular, North China needs to address agricultural water shortage and food security challenges by optimizing water resources allocation.

4.3. Dry and Wet Seasonal Dynamics of Extreme Precipitation Duration

The seasonal differentiation of extreme precipitation duration indices (CDDs, CWDs, PRCPTOT) in the monsoon region of China profoundly reveals the dynamic characteristics of regional drought and flood alternation: the spatial and temporal contrast between the maximum CDDs (45–60 days) in winter in North China and the peak CWDs (>15 days) in summer in South China, highlighting the two-way regulation of monsoon advance and retreat on precipitation persistence. The results show that the systematic adjustment of water vapor transport path and intensity plays a key role in the northward push of the East Asian summer monsoon. After the onset of the summer monsoon, the subtropical high (WPSH) jumped northward to the Yangtze River Basin, and the southwest warm and humid air flow continued to converge with the northern cold air to form a quasi-stationary front, which drove the CWDs to peak [66]. On the contrary, when the winter monsoon moves southward, the dry cold air mass dominates North China, resulting in a significant increase in CDDs (Shi et al., 2020). It is worth noting that the significant downward trend of winter CDDs (p < 0.10) may be related to the change in snowfall–freezing–thawing process in North China against the background of winter monsoon weakening. The climate model simulation shows that the intensity of the East Asian winter monsoon will be weakened by 10–20% in the 21st century, and cold air activity will decrease or increase the frequency of snowfall (shortening CDDs), while the increase in freeze–thaw cycle may reshape the persistence of precipitation through the positive feedback mechanism of soil moisture–precipitation [67,68].
The spatial coupling between the high value of PRCPTOT (>600 mm) in summer and the core area of heavy precipitation in the Yangtze River Basin may be due to the strengthening mechanism of water vapor convergence after the monsoon onset. From late May to early June, the water vapor flux in the Bay of Bengal and the South China Sea surged, forming a persistent strong water vapor convergence center in the Yangtze River Basin with the southwest low-level jet at the edge of WPSH [69]. From September to October, the WPSH ridge line southward retreat to the south of 20° N led to the interruption of water vapor transport, and the enhanced sinking movement caused by the southward movement of the East Asian jet was superimposed, which also inhibited the development of persistent precipitation [56,70].

4.4. Seasonal Sensitivity of Extreme Precipitation Threshold

The seasonal variation characteristics of extreme precipitation thresholds (R10/R20/R50 and R95P/R99P) in the monsoon region of China profoundly reveal the multidimensional complexity of regional climate responses. The absolute threshold (R10/R20) shows high frequency characteristics in the south, and the significant upward trend of R20 in winter (p < 0.05) may indicate the enhanced signal of extreme precipitation events in winter against the background of warmth and humidity. Global warming significantly amplifies the potential of extreme precipitation by increasing atmospheric water-holding capacity (for every 1 °C increase in temperature, the saturated water vapor pressure increases by about 7%) and superimposing the winter warming effect [71]. At the same time, the urbanization heat island effect further drives the frequent occurrence of extreme precipitation in winter by enhancing local convective activity [72].
The significant upward trend of the relative threshold (R95P/R99P) in winter is particularly prominent, and its mechanism may involve the increase in atmospheric water holding capacity driven by temperature rise and the enhancement of local convective activity. Against the background of global warming, the synergistic effect of the Indian summer monsoon and the Western Pacific subtropical high enhances the water vapor transport efficiency [73]. In the triggering mechanism of local convection, topographic forcing (e.g., uplift of the windward slope) and low-level wind shear play a key role in the formation of winter convective system. The low-altitude windward slope along the Qinling-Huaihe River has become a convective hot spot due to topographic uplift and water vapor convergence, while the forced uplift of the southeast monsoon in the Nanling and Wuyi Mountains significantly strengthens the precipitation on the windward slope [74,75].
The spatial differentiation characteristics of extreme precipitation thresholds further confirm the synergistic regulation mechanism of water vapor transport and topography: the strong contrast between the high value (869.4 mm) of R95P in South China and the low value (0.6 mm) in Northeast China in spring reflects the regional difference in monsoon water vapor transport intensity. In spring, the Indian Ocean–South China Sea water vapor is transported to South China through the southwest monsoon, and its flux is significantly enhanced during the monsoon active period [76,77]. In contrast, in Northeast China, the water vapor source dominated by the westerly belt (Okhotsk Sea and inland evaporation) transport intensity is less than 30% of that in South China, and the suppression of water vapor convergence by Siberian high in winter and the barrier effect of Changbai Mountains–Great Khingan Mountains on water vapor jointly weaken the potential of extreme precipitation [76,78,79].

4.5. The Actual Impact and Measures of Winter Precipitation Enhancement on Southern China

Based on the above analysis, the extreme precipitation thresholds in China show significant spatial differentiation characteristics. As the core area of extreme precipitation, the absolute thresholds (R10, R20) and relative thresholds (R95p, R99p) in the southern region, especially in South China, are one to three orders of magnitude higher than those in the northern region. It is worth noting that both the winter R20 index (p < 0.05) and the relative threshold (p < 0.05) show a significant upward trend, which is coupled with the increase in winter precipitation intensity and the frequency of extreme weather events in southern China, resulting in a structural contradiction between the design capacity of urban drainage system and the actual demand.
The current urban infrastructure faces two challenges: on the one hand, the existing drainage network design standards are generally lagging behind, and about 80% of cities can only withstand 1–2 years return period rainfall events [80]. In the southern flood season of 2020, the flood in the basin forced the hydropower station to carry out continuous flood discharge operation. Although this emergency measure ensured the safety of flood control, it caused the loss rate of power generation efficiency to reach 18–25%. On the other hand, the hardening of urban underlying surface aggravates the hydrological response. For every 10% increase in impervious surface area, the surface runoff coefficient increases by 37–42%, which significantly amplifies the drainage pressure of the pipe network.
The response of water resources system to precipitation change shows significant spatial and temporal heterogeneity. In May 2024, the increase in water storage in the southwest region drove the hydropower capacity to increase by 40% year-on-year, while the precipitation anomaly in the Yangtze River Basin in the following year of El Niño could increase the annual average power generation of the Three Gorges power station by 8–12% [81]. However, the extreme trend of hydrological factors triggered a chain ecological response: continuous rain in the middle and lower reaches of the Yangtze River in 2018/2019 led to a 72 h extension of the hypoxia time of rape roots and a 12–15% reduction in yield [82], and the composite meteorological disasters (low temperature and cold wave superimposed high humidity environment) increased the freezing injury index of open field vegetables by 3.2–4.8 grades, which was manifested in the significant increase in citrus leaf curl rate (38–45%) and tea shoot frostbite rate (26–33%) [83,84].
This study proposes a comprehensive management framework to cope with extreme precipitation. Firstly, the precipitation return period parameters are dynamically modified based on the climate model, and the threshold of extreme precipitation events is adjusted from “once in ten years” to “once in three to five years”. Secondly, by restoring the regulation and storage function of rivers and lakes and implementing low-impact development (LID) measures such as rainwater gardens and permeable pavement, runoff can be reduced by 20–40% to optimize the urban hydrological system [85]; in order to balance the power supply and demand in winter, the joint scheduling model of cascade hydropower stations is constructed synchronously, and the three-dimensional drainage system of “Xianggou + underground pipe” (drainage efficiency is increased by 50%) and intelligent irrigation technology are promoted to reduce the risk of agricultural disasters. Finally, the relevant parts of agriculture can cooperate across fields to establish a data sharing platform of “meteorology–water conservancy–agriculture” and the measurement results can be used synchronously for reservoir scheduling and sowing guidance.

4.6. Comprehensive Discussion and Mechanism Correlation

The seasonal and spatial differentiation of extreme precipitation trends in the monsoon region of China may be driven by multi-scale climate dynamic processes, as shown below.
The enhancement of extreme precipitation in winter: the significant upward trend of R95P/R99P and R20 in winter (p < 0.05) may be related to the northward expansion of warm and humid airflow against the background of weakening East Asian winter monsoon, which leads to the increase in convective precipitation events in winter in southern China.
The decrease in precipitation intensity in autumn: the significant decrease in Rx1day/Rx5day (p < 0.05) may be affected by the advance of the South China Sea summer monsoon retreat and the weakening of the mid-latitude westerly trough activity, resulting in the deterioration of water vapor convergence conditions.
Regional asymmetric response: The spatial differentiation of precipitation enhancement in the southeast and reduction in the northwest may reflect the interaction between monsoon circulation and westerly system against the background of global warming, such as the competitive effect of subtropical high westward extension and plateau thermal forcing.
This study mainly discusses the characteristics of extreme precipitation in the monsoon region of China. However, climate change is becoming more and more severe against the background of global warming, so the prediction of extreme precipitation is also very important. Therefore, in the future research, we could predict extreme precipitation in China monsoon region and provide a scientific basis for ecological environment, agricultural development, and government emergency management. Future climate prediction can be included in our research in the future. According to the relevant prediction models, such as climate change scenario (RCP), it could be combined with extreme precipitation.

5. Conclusions

Based on the multi-dimensional analysis of 40-year daily precipitation data in the monsoon region of China, this study reveals the temporal and spatial evolution of extreme precipitation events and their seasonal differentiation characteristics. The main conclusions are as follows:
(1) Significant regional differentiation of spatial and temporal variation trend of precipitation
The precipitation changes in the monsoon region of China show significant spatial heterogeneity. The trend of precipitation in the southeast coast, southwest plateau, and part of the North China Plain is statistically significant (p > 1.96, S > 0, Slope > 0), while it tends to decrease in the northwest and central regions (S < 0, Slope < 0). In the time dimension, the seasonal trend differentiation of extreme precipitation indicators is obvious: the extreme single day (RX1day) and continuous five-day precipitation (RX5day) in autumn and winter decreased significantly (p < 0.05), while the number of winter heavy precipitation days (R10, R20) and extreme precipitation thresholds (R95p, R99p) increased significantly (p < 0.05). This indicates that the precipitation process in the monsoon region has changed to a non-equilibrium model with frequent extreme events in winter and weakened intensity in other seasons.
(2) The spatial differentiation shows a significant latitude effect, forming a pattern of “strong in summer and weak in winter, strong in south and weak in north”.
The extreme precipitation intensity (Rx1day, Rx5day, SDII) showed the typical characteristics of “strong in summer and weak in winter, high in south and low in north”. In summer, the single-day and continuous five-day precipitation on the eastern coast can reach more than 200 mm, while in winter, it is generally less than 50 mm. Although the extreme precipitation intensity was generally stable (there was no significant long-term trend from 1980 to 2020), the RX1day and RX5day in autumn and winter decreased significantly (R2 = 0.11–0.14, p < 0.05), while the slight increase in SDII in winter (R2 = 0.04) suggested that there was a decoupling between precipitation intensity and frequency.
(3) Dry–wet alternation characteristics of extreme precipitation duration
The seasonal evolution of continuous dry and wet days (CDDs, CWDs) and cumulative precipitation (PRCPTOT) is highly coupled with monsoon advance and retreat. During the summer monsoon onset period, CWDs peaked (>15 days), PRCPTOT exceeded 600 mm, while in winter, CDDs reached the longest period (45–60 days), and CWDs decreased to the shortest period (<5 days). Trend analysis showed that only winter CDDs showed a significant shortening trend (p < 0.10), reflecting the weakening of the persistence of winter drought, but there was no significant change in the duration of extreme precipitation in other seasons, indicating that the persistence of precipitation events was strongly regulated by seasonal-scale climatic dynamic processes.
(4) The winter strengthening characteristics of extreme precipitation threshold
The spatial and temporal differentiation of absolute thresholds (R10, R20) and relative thresholds (R95p, R99p) reveals that the south is the core area of extreme precipitation, and the threshold in South China is one to three orders of magnitude higher than that in the north. It is worth noting that both R20 (p < 0.05) and relative threshold (p < 0.05) increased significantly in winter, with an increase of 0.45–0.48 mm/decade, while the threshold did not change significantly in other seasons. This “winter intensification” feature may be closely related to the enhancement of winter water vapor transport and the adjustment of local circulation against the background of global warming.

Author Contributions

Conceptualization, K.S.; methodology, K.S. and R.L.; validation, T.C. and L.W.; formal analysis, K.S. and T.C.; resources, R.L. and L.W.; data curation, K.S.; writing—original draft preparation, K.S.; writing—review and editing, K.S. and T.C.; visualization, K.S.; supervision, L.W.; project administration, L.W.; funding acquisition, L.W. All authors have read and agreed to the published version of the manuscript.

Funding

This research was funded by “The national natural science foundation of China, grant number U2243212”, the “Inner Mongolia Department of Science and Technology 2024 major projects to prevent and control sand demonstration ‘unveiled marshal’ project, grant number 2024JBGS0016”, and “Socio-economic Influencing Factors of Soil Erosion in Huangshui River Basin and Its Control Measures, grant number 23Q061”. The APC was funded by U2243212.

Data Availability Statement

The data presented in this study are available upon request from the corresponding author.

Conflicts of Interest

The authors declare no conflicts of interest.

References

  1. Frame, D.J.; Rosier, S.M.; Noy, I.; Harrington, L.J.; Carey-Smith, T.; Sparrow, S.N.; Stone, D.A.; Dean, S.M. Climate Change Attribution and the Economic Costs of Extreme Weather Events: A Study on Damages from Extreme Rainfall and Drought. Clim. Chang. 2020, 162, 781–797. [Google Scholar] [CrossRef]
  2. Kristie, L.E.; Jennifer, V.; Jane, W.B.; Jesse, E.B.; David, M.H.; Nicole, A.E.; Katie, H.; Colleen, E.R.; Shubhayu, S.; June, S.; et al. Extreme Weather and Climate Change: Population Health and Health System Implications. Annu. Rev. Public Health 2021, 42, 293–315. [Google Scholar]
  3. Maximilian, K.; Anders, L.; Leonie, W. The Effect of Rainfall Changes on Economic Production. Nature 2022, 601, 223–227. [Google Scholar]
  4. Pascale, S.; Lucarini, V.; Feng, X.; Porporato, A.; Hasson, S.U. Projected changes of rainfall seasonality and dry spells in a high greenhouse gas emissions scenario. Clim. Dyn. 2015, 46, 1331–1350. [Google Scholar] [CrossRef]
  5. Siyan, D.; Ying, S.; Xuebin, Z. Attributing Observed Increase in Extreme Precipitation in China to Human Influence. Environ. Res. Lett. 2022, 17, 095005. [Google Scholar]
  6. Westra, S.; Alexander, L.V.; Zwiers, F.W. Global Increasing Trends in Annual Maximum Daily Precipitation. J. Clim. 2013, 26, 3904–3918. [Google Scholar] [CrossRef]
  7. Peterson, T.C.; Zhang, X.; Brunet-India, M.; Vázquez-Aguirre, J.L. Changes in North American extremes derived from daily weather data. J. Geophys. Res. Atmos. 2008, 113. [Google Scholar] [CrossRef]
  8. Barbero, R.; Fowler, H.J.; Lenderink, G.; Blenkinsop, S. Is the intensification of precipitation extremes with global warming better detected at hourly than daily resolutions? Geophys. Res. Lett. 2017, 44, 974–983. [Google Scholar] [CrossRef]
  9. Kirchmeier-Young, M.C.; Zhang, X. Human influence has intensified extreme precipitation in North America. Proc. Natl. Acad. Sci. USA 2020, 117, 13308–13313. [Google Scholar] [CrossRef]
  10. Aguilar, E.; Barry, A.A.; Brunet, M.; Ekang, L.; Fernandes, A.; Massoukina, M.; Mbah, J.; Mhanda, A.; do Nascimento, D.J.; Peterson, T.C.; et al. Changes in temperature and precipitation extremes in western central Africa, Guinea Conakry, and Zimbabwe, 1955–2006. J. Geophys. Res. Atmos. 2009, 114, 13308–13313. [Google Scholar] [CrossRef]
  11. Tegegne, G.; Melesse, A.M.; Alamirew, T. Projected changes in extreme precipitation indices from CORDEX simulations over Ethiopia, East Africa. Atmos. Res. 2021, 247, 105156. [Google Scholar] [CrossRef]
  12. Dong, S.; Sun, Y.; Li, C. Detection of Human Influence on Precipitation Extremes in Asia. J. Clim. 2020, 33, 5293–5304. [Google Scholar] [CrossRef]
  13. Donat, M.G.; Alexander, L.V.; Yang, H.; Durre, I.; Vose, R.; Caesar, J. Global land-based datasets for monitoring climatic ex-tremes. Bull. Am. Meteorol. Soc. 2013, 94, 997–1006. [Google Scholar] [CrossRef]
  14. Donat, M.G.; Lowry, A.L.; Alexander, L.V.; O’Gorman, P.A.; Maher, N. Addendum: More extreme precipitation in the world’s dry and wet regions. Nat. Clim. Chang. 2016, 6, 508–513. [Google Scholar] [CrossRef]
  15. Sun, Q.; Zhang, X.; Zwiers, F.; Westra, S.; Alexander, L.V. A Global, Continental, and Regional Analysis of Changes in Extreme Precipitation. J. Clim. 2021, 34, 243–258. [Google Scholar] [CrossRef]
  16. Haibo, D.; Lisa, V.A.; Markus, G.D.; Tanya, L.; Arvind, S.; Jim, S.; Andries, K.; Gwangyong, C.; Hong, S.H.; Fumiaki, F.; et al. Precipitation from Persistent Extremes is Increasing in Most Regions and Globally. Geophys. Res. Lett. 2019, 46, 6041–6049. [Google Scholar]
  17. Zhai, P.; Zhang, X.; Wan, H.; Pan, X. Trends in Total Precipitation and Frequency of Daily Precipitation Extremes over China. J. Clim. 2005, 18, 1096–1108. [Google Scholar] [CrossRef]
  18. Deng, S.; Yang, N.; Li, M.; Cheng, L.; Chen, Z.; Chen, Y.; Chen, T.; Liu, X. Rainfall seasonality changes and its possible teleconnections with global climate events in China. Clim. Dyn. 2019, 53, 3529–3546. [Google Scholar] [CrossRef]
  19. Wenfeng, H.; Lingling, C.; Jianyun, S.; Junqiang, Y.; Qing, H.; Jing, C. Changes in Extreme Precipitation on the Tibetan Plateau and Its Surroundings: Trends, Patterns, and Relationship with Ocean Oscillation Factors. Water 2022, 14, 2509. [Google Scholar] [CrossRef]
  20. Liu, Q.; Yao, X.; Ma, J.; Li, R. Research progress and prospects on summer extreme precipitation over the Qinghai-Xizang Plateau. Trans. Atmos. Sci. 2024, 47, 737–754. [Google Scholar]
  21. Rao, G.V.; Reddy, K.V.; Srinivasan, R.; Sridhar, V.; Umamahesh, N.; Pratap, D. Spatio-temporal analysis of rainfall extremes in the flood-prone Nagavali and Vamsadhara Basins in eastern India. Weather. Clim. Extrem. 2020, 29, 100265. [Google Scholar] [CrossRef]
  22. Quan, N.T.; Khoi, D.N.; Hoan, N.X.; Phung, N.K.; Dang, T.D. Spatiotemporal Trend Analysis of Precipitation Extremes in Ho Chi Minh City, Vietnam During 1980-2017. Int. J. Disaster Risk Sci. 2021, 12, 131–146. [Google Scholar] [CrossRef]
  23. Intergovernmental Panel on Climate Change (IPCC). Climate Change 2021: The Physical Science Basis. Contribution of Working Group I to the Sixth Assessment Report of the Intergovernmental Panel on Climate Change; Masson-Delmotte, V., Zhai, P., Pirani, A., Connors, S.L., Péan, C., Chen, Y., Goldfarb, L., Gomis, M.I., Robin Matthews, J.B., Eds.; Cambridge University Press: Cambridge, UK, 2021. [Google Scholar]
  24. Wang, B. The Asian Monsoon; Springer Science & Business Media: Berlin/Heidelberg, Germany, 2006. [Google Scholar]
  25. Bhardwaj, A.; Wasson, R.J.; Chow, W.T.L.; Ziegler, A.D. High-intensity monsoon rainfall variability and its attributes: A case study for Upper Ganges Catchment in the Indian Himalaya during 1901–2013. Nat. Hazards 2021, 105, 2907–2936. [Google Scholar] [CrossRef]
  26. Konda, G.; Chowdary, J.S.; Gnanaseelan, C.; Parekh, A. Improvement in the skill of CMIP6 decadal hindcasts for extreme rainfall events over the Indian summer monsoon region. Sci. Rep. 2023, 13, 21737. [Google Scholar] [CrossRef]
  27. Djakouré, S.; Amouin, J.; Kouadio, K.Y.; Kacou, M. Mesoscale Convective Systems and Extreme Precipitation on the West African Coast Linked to Ocean–Atmosphere Conditions during the Monsoon Period in the Gulf of Guinea. Atmosphere 2024, 15, 194. [Google Scholar] [CrossRef]
  28. Zhang, C.; Wang, D.; Pang, Z.; Zhang, Y.; Jiang, X.; Zeng, Z.; Wu, Z. Large-scale dynamic, heat and moisture structures of monsoon-influenced precipitation in the East Asian monsoon rainy area. Q. J. R. Meteorol. Soc. 2021, 147, 1007–1030. [Google Scholar] [CrossRef]
  29. You, Y.; Ting, M. Low Pressure Systems and Extreme Precipitation in Southeast and East Asian Monsoon Regions. J. Clim. 2021, 34, 1147–1162. [Google Scholar] [CrossRef]
  30. Tian, Z.; Jiang, D. The changes of monsoon area and monsoon precipitation in China during the mid-Holocene and the last glacial maximum. Sci. Bull. 2015, 60, 400–410. [Google Scholar]
  31. Ding, Y. Summer monsoon rainfalls in China. J. Meteorol. Soc. Jpn. 1992, 70, 373–396. [Google Scholar] [CrossRef]
  32. Gao, Z.; Li, J.; Wan, R.; Dong, X.; Ye, Q. Emergy-Theory-Based Evaluation of Typhoon Disaster Risk in China’s Coastal Zone. Atmosphere 2024, 15, 750. [Google Scholar] [CrossRef]
  33. Yao, J.; Sun, X.; Tang, J.; Ji, Y.; Xu, Y.; Yang, X.-Q. Summer Regional Pentad Heat Wave in Eastern China and Their Possible Causes. Front. Earth Sci. 2020, 8, 598027. [Google Scholar] [CrossRef]
  34. Yang, Y.; Xu, Z.; Zheng, W.; Wang, S.; Kang, Y. Rain Belt and Flood Peak: A Study of the Extreme Precipitation Event in the Yangtze River Basin in 1849. Water 2021, 13, 2677. [Google Scholar] [CrossRef]
  35. Xiao, Y.; Yin, S.; Yu, B.; Fan, C.; Wang, W.; Xie, Y. The most extreme rainfall erosivity event ever recorded in China up to 2022: The 7.20 storm in Henan Province. Hydrol. Earth Syst. Sci. 2023, 27, 4563–4577. [Google Scholar] [CrossRef]
  36. Paul, V.K.; Rastogi, A.; Dua, S.; Basu, C. Healthcare Infrastructure, Resilience and Climate Change: Preparing for Extreme Weather Events; Routledge: Abingdon-on-Thames, UK, 2023. [Google Scholar]
  37. Guo, Y.; Dong, B.; Zhu, J. Anthropogenic impacts on changes in summer extreme precipitation over China during 1961–2014: Roles of greenhouse gases and anthropogenic aerosols. Clim. Dyn. 2022, 60, 2633–2643. [Google Scholar] [CrossRef]
  38. Zhao, A.D.; Stevenson, D.S.; Bollasina, M.A. The role of anthropogenic aerosols in future precipitation extremes over the Asian Monsoon Region. Clim. Dyn. 2018, 52, 6257–6278. [Google Scholar] [CrossRef]
  39. Beck, H.E.; Vergopolan, N.; Pan, M.; Levizzani, V.; Van Dijk, A.I.; Weedon, G.P.; Brocca, L.; Pappenberger, F.; Huffman, G.J.; Wood, E.F. Global-scale evaluation of 22 precipitation datasets using gauge observations and hydrological modeling. Hydrol. Earth Syst. Sci. 2017, 21, 6201–6217. [Google Scholar] [CrossRef]
  40. Beck, H.E.; Pan, M.; Roy, T.; Weedon, G.P.; Pappenberger, F.; Van Dijk, A.I.; Huffman, G.J.; Adler, R.F.; Wood, E.F. Daily evaluation of 26 precipitation datasets using Stage-IV gauge-radar data for the CONUS. Hydrol. Earth Syst. Sci. 2019, 23, 207–224. [Google Scholar] [CrossRef]
  41. Beck, H.E.; Wood, E.F.; Pan, M.; Fisher, C.K.; Miralles, D.G.; Van Dijk, A.I.; McVicar, T.R.; Adler, R.F. MSWEP V2 global 3-hourly 0.1 precipitation: Methodology and quantitative assessment. Bull. Am. Meteorol. Soc. 2019, 100, 473–500. [Google Scholar] [CrossRef]
  42. Deng, Y.; Jiang, W.; Wang, X.; Lu, J. Accuracy assessment of MSWEP precipitation products in Chinese mainland. Adv. Water Sci. 2018, 29, 455–464. [Google Scholar]
  43. Ma, Z.; Xu, J.; Dong, B.; Hu, X.; Hu, H.; Yan, S.; Zhu, S.; He, K.; Shi, Z.; Chen, Y.; et al. GMCP: A Fully Global Multisource Merging-and-Calibration Precipitation Dataset (1-Hourly, 0.1°, Global, 2000–the Present). Bull. Am. Meteorol. Soc. 2025, 106, E596–E624. [Google Scholar] [CrossRef]
  44. Li, Y.; Pang, B.; Ren, M.; Shi, S.; Peng, D.; Zhu, Z.; Zuo, D. Evaluation of Performance of Three Satellite-Derived Precipitation Products in Capturing Extreme Precipitation Events over Beijing, China. Remote Sens. 2022, 14, 2698. [Google Scholar] [CrossRef]
  45. Sillmann, J.; Kharin, V.V.; Zwiers, F.W.; Zhang, X.; Bronaugh, D. Climate extremes indices in the CMIP5 multimodel ensemble: Part 2. Future climate projections. J. Geophys. Res. Atmos. 2013, 118, 2473–2493. [Google Scholar] [CrossRef]
  46. Reddy, N.M.; Saravanan, S. Extreme precipitation indices over India using CMIP6: A special emphasis on the SSP585 scenario. Environ. Sci. Pollut. Res. 2023, 30, 47119–47143. [Google Scholar] [CrossRef]
  47. Lei, X.; Xu, C.; Liu, F.; Song, L.; Cao, L.; Suo, N. Evaluation of CMIP6 models and multi-model ensemble for extreme precipitation over arid Central Asia. Remote Sens. 2023, 15, 2376. [Google Scholar] [CrossRef]
  48. Sen, P.K. Estimates of the regression coefficient based on Kendall’s tau. J. Am. Stat. Assoc. 1968, 63, 1379–1389. [Google Scholar] [CrossRef]
  49. Mann, H.B. Nonparametric tests against trend. Econometrica 1945, 13, 245–259. [Google Scholar] [CrossRef]
  50. El Kasri, J.; Lahmili, A.; Soussi, H.; Jaouda, I.; Bentaher, M. Trend Analysis of Meteorological Variables: Rainfall and Temperature. Civ. Eng. J. 2021, 7, 1868–1879. [Google Scholar] [CrossRef]
  51. Wang, G.Q.; Jiang, J.C.; Jiao, F. Characteristics of Extreme Precipitation in Ansai District of Yan’an City, China. J. Appl. Ecol. 2021, 32, 1417–1423. [Google Scholar]
  52. Sytharith, P.; Saeed, R.; Liheang, B.; Sokhorng, B.; Panha, N.; Lin, L. An Analysis of Extreme Rainfall Events in Cambodia. Atmosphere 2024, 15, 1017. [Google Scholar]
  53. Anil, A.; Jun, M.; Hiroshi, I.; Kazuyoshi, S.; Umesh, C. Evaluating the Extreme Precipitation Indices and Their Impacts in the Volta River Basin in West Africa from a Nexus Perspective. Sustain. Nexus Forum 2025, 33, 1–15. [Google Scholar]
  54. Huangfu, J.; Huang, R.; Chen, W. Statistical analysis and a case study of tropical cyclones that trigger the onset of the South China Sea summer monsoon. Sci. Rep. 2017, 7, 12732. [Google Scholar] [CrossRef] [PubMed]
  55. Xu, L.; Li, Z.-L. Impacts of the Wave Train along the Asian Jet on the South China Sea Summer Monsoon Onset. Atmosphere 2021, 12, 1227. [Google Scholar] [CrossRef]
  56. Chen, J.-M.; Gu, S.-X.; Jiang, R.-C.; Lu, G.-H.; Wu, Z.-Y.; Du, X.-X. The relationship between Pacific SSTA and Autumn Extreme Precipitation Events of China. MATEC Web Conf. 2018, 246, 02056. [Google Scholar] [CrossRef]
  57. Chen, X.; Zhou, T.; Wu, P.; Guo, Z.; Wang, M. Emergent constraints on future projections of the western North Pacific Subtropical High. Nat. Commun. 2020, 11, 1–10. [Google Scholar] [CrossRef]
  58. Yin, J.; Yuan, J.; Peng, J.; Cao, X.; Duan, W.; Nan, Y.; Mao, M.; Feng, T. Role of the subtropical westerly jet wave train in the eastward-moving heavy rainfall event over southern China in winter: A case study. Front. Earth Sci. 2023, 11, 1107674. [Google Scholar] [CrossRef]
  59. Sun, Y.; Ding, Y. Responses of South and East Asian summer monsoons to different land-sea temperature increases under a warming scenario. Chin. Sci. Bull. 2011, 56, 2718–2726. [Google Scholar] [CrossRef]
  60. Kinsley, C.W. Reconstructing Atmospheric Changes in Monsoon Regions Using Eolian Dust; MBLWHOI Library: Woods Hole, MA, USA, 2019. [Google Scholar]
  61. Qu, B.; Lv, A.; Jia, S.; Zhu, W. Daily Precipitation Changes over Large River Basins in China, 1960–2013. Water 2016, 8, 185. [Google Scholar] [CrossRef]
  62. Xu, H.; Chen, H.; Wang, H. Detectable Human Influence on Changes in Precipitation Extremes Across China. Earth’s Future 2022, 10, e2021EF002409. [Google Scholar] [CrossRef]
  63. Wang, Y.-X.; Zeng, J.-S.; Tang, L.; Zhuang, D. Water vapor transport in the Pearl River basin and its influence on NDVI. ITM Web Conf. 2016, 7, 04007. [Google Scholar] [CrossRef]
  64. Yu, S.; Luo, Y.; Wu, C.; Zheng, D.; Liu, X.; Xu, W. Convective and Microphysical Characteristics of Extreme Precipitation Revealed by Multisource Observations Over the Pearl River Delta at Monsoon Coast. Geophys. Res. Lett. 2022, 49, e2021GL097043. [Google Scholar] [CrossRef]
  65. Zhao, C.; Jiang, Z.; Sun, X.; Li, W.; Li, L. How well do climate models simulate regional atmospheric circulation over East Asia? Int. J. Climatol. 2019, 40, 220–234. [Google Scholar] [CrossRef]
  66. Zhang, Z.X.; Jiang, T.; Zhang, J.C.; Zhang, Q.; Liu, X. Spatial-temporal properties of moisture budget and associated large-scale circulation in the Yangtze River Basin. J. Lake Sci. 2008, 20, 733–740. [Google Scholar]
  67. Hong, J.-Y.; Ahn, J.-B.; Jhun, J.-G. Winter climate changes over East Asian region under RCP scenarios using East Asian winter monsoon indices. Clim. Dyn. 2016, 48, 577–595. [Google Scholar] [CrossRef]
  68. Ge, F.; Yan, T.; Zhou, L.; Jiang, Y.; Li, W.; Fan, Y.; Wang, Y.; Mao, K.; Wu, W. Impact of sea ice decline in the Arctic Ocean on the number of extreme low-temperature days over China. Int. J. Clim. 2019, 40, 1421–1434. [Google Scholar] [CrossRef]
  69. Wang, Z.; Chen, X.; Zhou, T. The onset and seasonal march of East Asian summer monsoon from perspective of moist static energy. Chin. Sci. Bull. 2021, 66, 3744–3756. [Google Scholar] [CrossRef]
  70. Shi, Y.; Jiang, Z.; Liu, Z.; Li, L. A Lagrangian analysis of water vapor sources and pathways for precipitation in East China in different stages of the East Asian summer monsoon. J. Clim. 2020, 33, 977–992. [Google Scholar] [CrossRef]
  71. Wallace, B.; Minder, J.R. The impact of snow loss and soil moisture on convective precipitation over the Rocky Mountains under climate warming. Clim. Dyn. 2021, 56, 2915–2939. [Google Scholar] [CrossRef]
  72. Li, C.; Gu, X.; Slater, L.J.; Liu, J.; Li, J.; Zhang, X.; Kong, D. Urbanization-Induced Increases in Heavy Precipitation are Magnified by Moist Heatwaves in an Urban Agglomeration of East China. J. Clim. 2023, 36, 693–709. [Google Scholar] [CrossRef]
  73. Chu, Q.; Wang, Q.; Feng, G.; Jia, Z.; Liu, G. Roles of water vapor sources and transport in the intraseasonal and interannual variation in the peak monsoon rainfall over East China. Clim. Dyn. 2021, 57, 2153–2170. [Google Scholar] [CrossRef]
  74. Zheng, L.; Sun, J.; Qiu, X.; Yang, Z. Five-Year Climatology of Local Convections in the Dabie Mountains. Atmosphere 2020, 11, 1246. [Google Scholar] [CrossRef]
  75. Li, P.; Furtado, K.; Zhou, T.; Chen, H.; Li, J.; Guo, Z.; Xiao, C. The diurnal cycle of East Asian summer monsoon precipitation simulated by the Met Office Unified Model at convection-permitting scales. Clim. Dyn. 2018, 55, 131–151. [Google Scholar] [CrossRef]
  76. Cheng, Z.; Xie, Z.; Tang, W.; Bueh, C.; Gong, Y.; Yan, J. Change in Extreme Precipitation Over Indochina Under Climate Change from a Lagrangian Perspective of Water Vapor. Front. Earth Sci. 2021, 9, 758664. [Google Scholar] [CrossRef]
  77. Zeng, Z.; Xu, J.; Ye, G.; Shen, W. The influence of different intensity of monsoon on typhoon precipitation: A comparative study of typhoons Soudelor and Maria. Front. Earth Sci. 2023, 11, 1251711. [Google Scholar] [CrossRef]
  78. Zhong, Y.; Yang, M.; Yuan, C. Temporal and Spatial Characteristics of Summer Extreme Precipitation in Eastern China and Possible Causalities. J. Geosci. Environ. Prot. 2020, 8, 36–46. [Google Scholar] [CrossRef]
  79. Tang, J.; Xu, X.; Zhang, S.; Xu, H.; Cai, W. Response of remote water vapor transport to large topographic effects and the multi-scale system during the “7.20” rainstorm event in Henan Province, China. Front. Earth Sci. 2023, 11, 1106990. [Google Scholar] [CrossRef]
  80. Li, Y.; Wang, P.; Lou, Y.; Chen, C.; Shen, C.; Hu, T. Assessing urban drainage pressure and impacts of future climate change based on shared socioeconomic pathways. J. Hydrol. Reg. Stud. 2024, 53, 101760. [Google Scholar] [CrossRef]
  81. Yao, W.; Li, X.; Du, S.; Zhan, Z. Hydraulic Facilities Characteristics along the Upstream Lanchang River. Curr. Trends Civ. Struct. Eng. 2020, 5, 1–5. [Google Scholar] [CrossRef]
  82. Lu, C.; Tan, F.; He, L.; Li, Y. The impact of winter meteorological conditions on agricultural production in 2018/2019. China Agric. Meteorol. 2019, 40, 337–339. [Google Scholar]
  83. Zhang, Y.; Li, S.; Tan, F.; Li, Y.; Li, X. The impact of winter meteorological conditions on Agricultural production in 2019/2020. Agric. Meteorol. China 2020, 41, 328–330. [Google Scholar]
  84. Li, Y.; Wang, C.; Liu, W.; Zhao, X.; Li, S. The impact of winter meteorological conditions on agricultural production in 2020/2021. Agric. Meteorol. China 2021, 42, 438–440. [Google Scholar]
  85. Wang, P.; Li, Y.; Fan, J.; Kong, F.; Zhang, D.; Hu, T. Future changes in urban drainage pressure caused by precipitation extremes in 285 cities across China based on CMIP6 models. Sustain. Cities Soc. 2023, 91, 104404. [Google Scholar] [CrossRef]
Figure 1. Research area of monsoon region in China.
Water 17 01672 g001
Figure 2. Analysis chart of M-K test results in monsoon region of China.
Water 17 01672 g002
Figure 3. Seasonal differentiation characteristics of extreme precipitation intensity index in the monsoon region of China.
Water 17 01672 g003
Figure 4. The map of seasonal variation characteristics of extreme precipitation duration index in the monsoon region of China.
Water 17 01672 g004
Figure 5. Seasonal differentiation characteristics of extreme precipitation absolute threshold index in the monsoon region of China.
Water 17 01672 g005
Figure 6. Seasonal differentiation characteristics of extreme precipitation relative threshold index in the monsoon region of China.
Water 17 01672 g006
Table 1. Seasonal trends of extreme precipitation indices in the monsoon region of China from 1980 to 2020.
IndexSpringSummerAutumnWinter
RX1day−29.17/−77.49 *−54.34/−154.07 **−110.45 **/−105.03 ***−83.88 **/−94.57 **
RX5day−96.14/−277.10 *−191.45/−568.46 *−396.58 **/−397.21 ***−351.64 **/−349.17 **
SDII−0.05/0.06−0.04/−0.31 **−0.06/−0.010.13/0.16
R10−1056.92/8628.89−6441.06/−26829.76 **−3493.61/7676.986474.74 */6607.23
R20−2871.49/1382.67−3168.85/−19416.98 ***−1005.06/3173.353298.14 **/4898.14 *
R95p−101.43/565.29−469.99/−1840.11242.50/2234.151333.79 */1393.96
R99p−23.10/107.39−92.94/−367.1749.85/453.73260.21 */268.53
CDD−18.68 */0.00−0.76 **/−0.890.00/0.000.00/0.00
CWD0.00/0.00−0.05/−0.020.20/1.76 *0.53/0.87
R95ptot−0.26 **/−0.43 *0.01/−0.31 *0.19/−0.000.29/0.90
R99ptot−0.08/−0.20 *0.00/−0.100.07/−0.13−0.09/0.25
Note(s): *, **, and *** denote p < 0.10, p < 0.05, and p < 0.01, respectively, and “/” denotes the trend values from 1980 to 2020 and 1990 to 2020.
Disclaimer/Publisher’s Note: The statements, opinions and data contained in all publications are solely those of the individual author(s) and contributor(s) and not of MDPI and/or the editor(s). MDPI and/or the editor(s) disclaim responsibility for any injury to people or property resulting from any ideas, methods, instructions or products referred to in the content.

