
Watershed Prioritization with Respect to Flood Susceptibility in the Indian Himalayan Region (IHR) Using Geospatial Techniques for Sustainable Water Resource Management

 , , ,
, , ,  ,
, 
Abstract
1. Introduction
2. Materials and Methods
2.1. Study Area
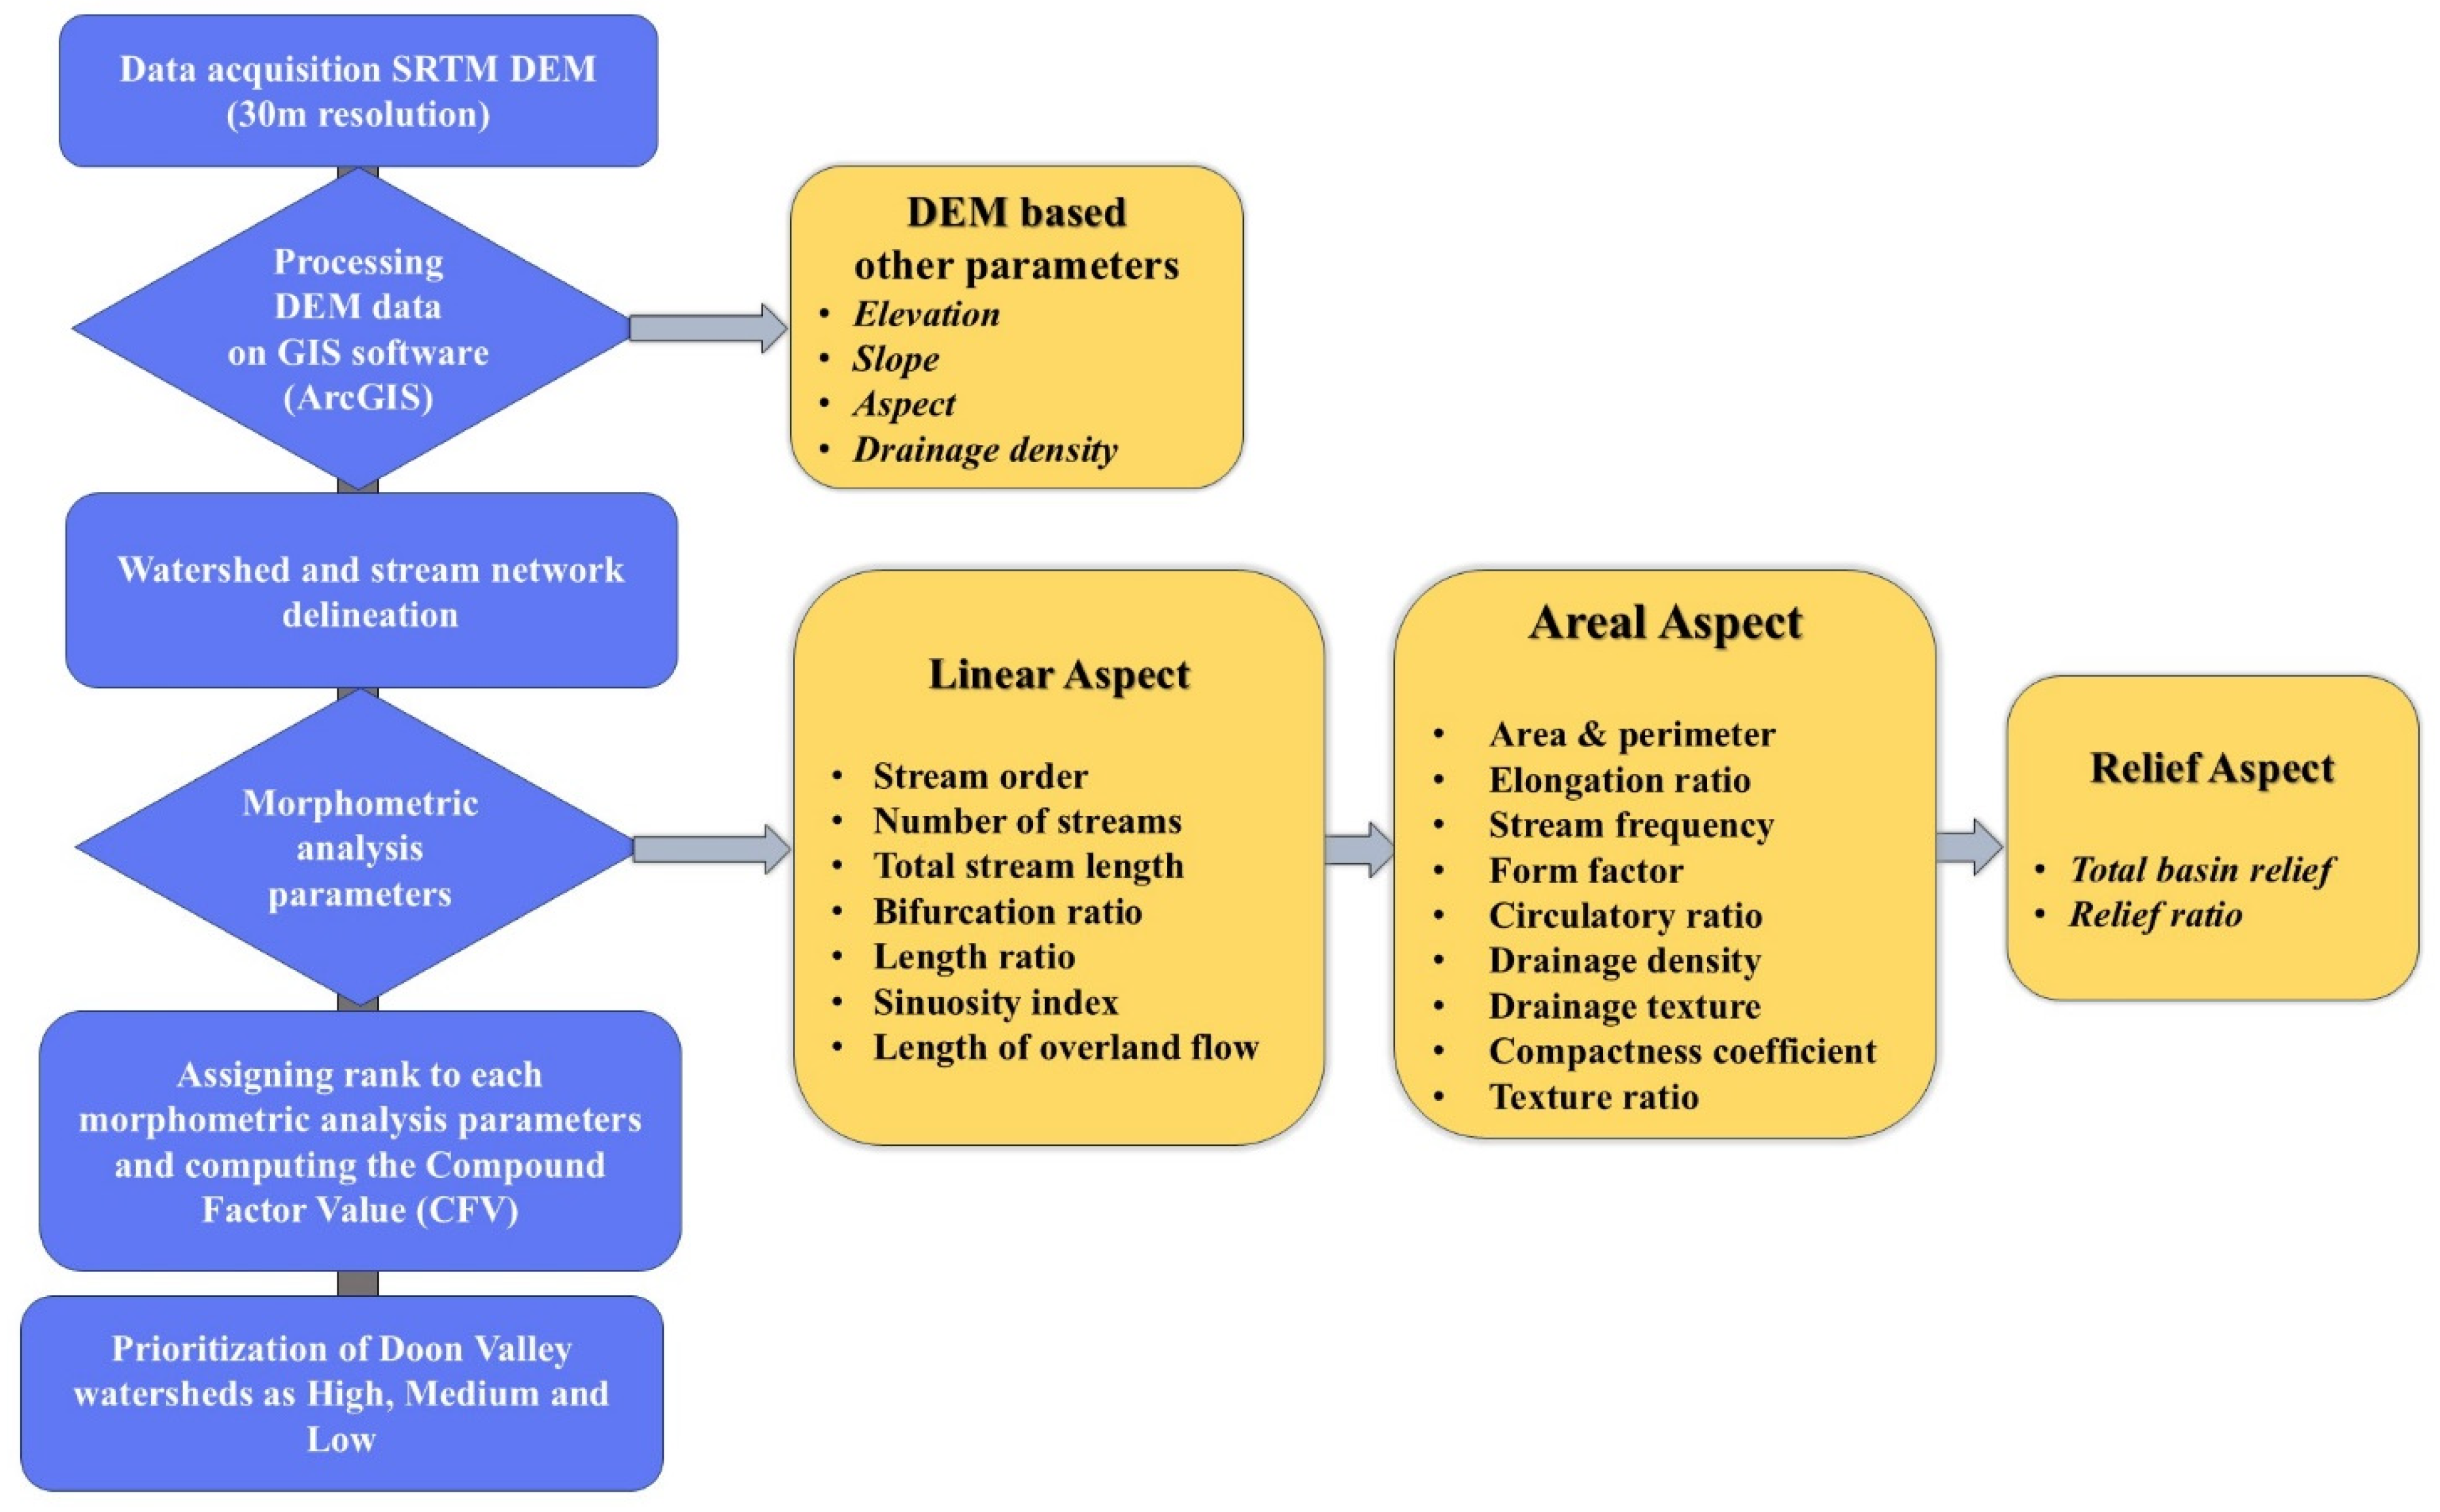
2.2. Data and Methods

| S. No. | Parameter | Formula | Reference |
|---|---|---|---|
| 1 | Stream order (w) | Hierarchical rank | [35] |
| 2 | Stream length (Lu) | Length of the stream | [36] |
| 3 | Sinuosity index (SI) | SI = actual length of the river/straight-line distance between source and mouth | [36] |
| 4 | Mean stream length (Lsm) | Lsm = Lu/Nu | [35] |
| 5 | Stream length ratio (RL) | RL= Lu/(Lu − 1) | [36] |
| 6 | Bifurcation ration (Rb) | (Rb) = Nu/Nu + 1 | [37] |
| 7 | Mean bifurcation ratio (Rbm) | Rbm = average of bifurcation ratios of all orders | [38] |
| 8 | Drainage density (Dd) | Dd = Lu/A | [36] |
| 9 | Drainage texture (Td) | Td = Nu/P | [36] |
| 10 | Texture ratio (Rt) | Rt= N1/P | [36] |
| 11 | Stream frequency (Fs) | Fs = Nu/A | [36] |
| 12 | Elongation ratio (Re) | Re = 2√(A/π)/Lb | [37] |
| 13 | Circularity ratio (Rc) | Rc = 4 π A/P2 | [39] |
| 14 | Form factor (Ff) | Ff = A/L2 | [36] |
| 15 | Basin relief (Rb) | Rb = H − h | [40] |
| 16 | Relief ratio (Rr) | Rr = R/L | [37] |
| 17 | Length of overland flow (Lo) | Lo = 2/Dd | [36] |
| 18 | Compactness coefficient (Cc) | Cc = 0.2821 × P/(A)0.5 | [36] |
3. Results
3.1. Morphometric Analysis
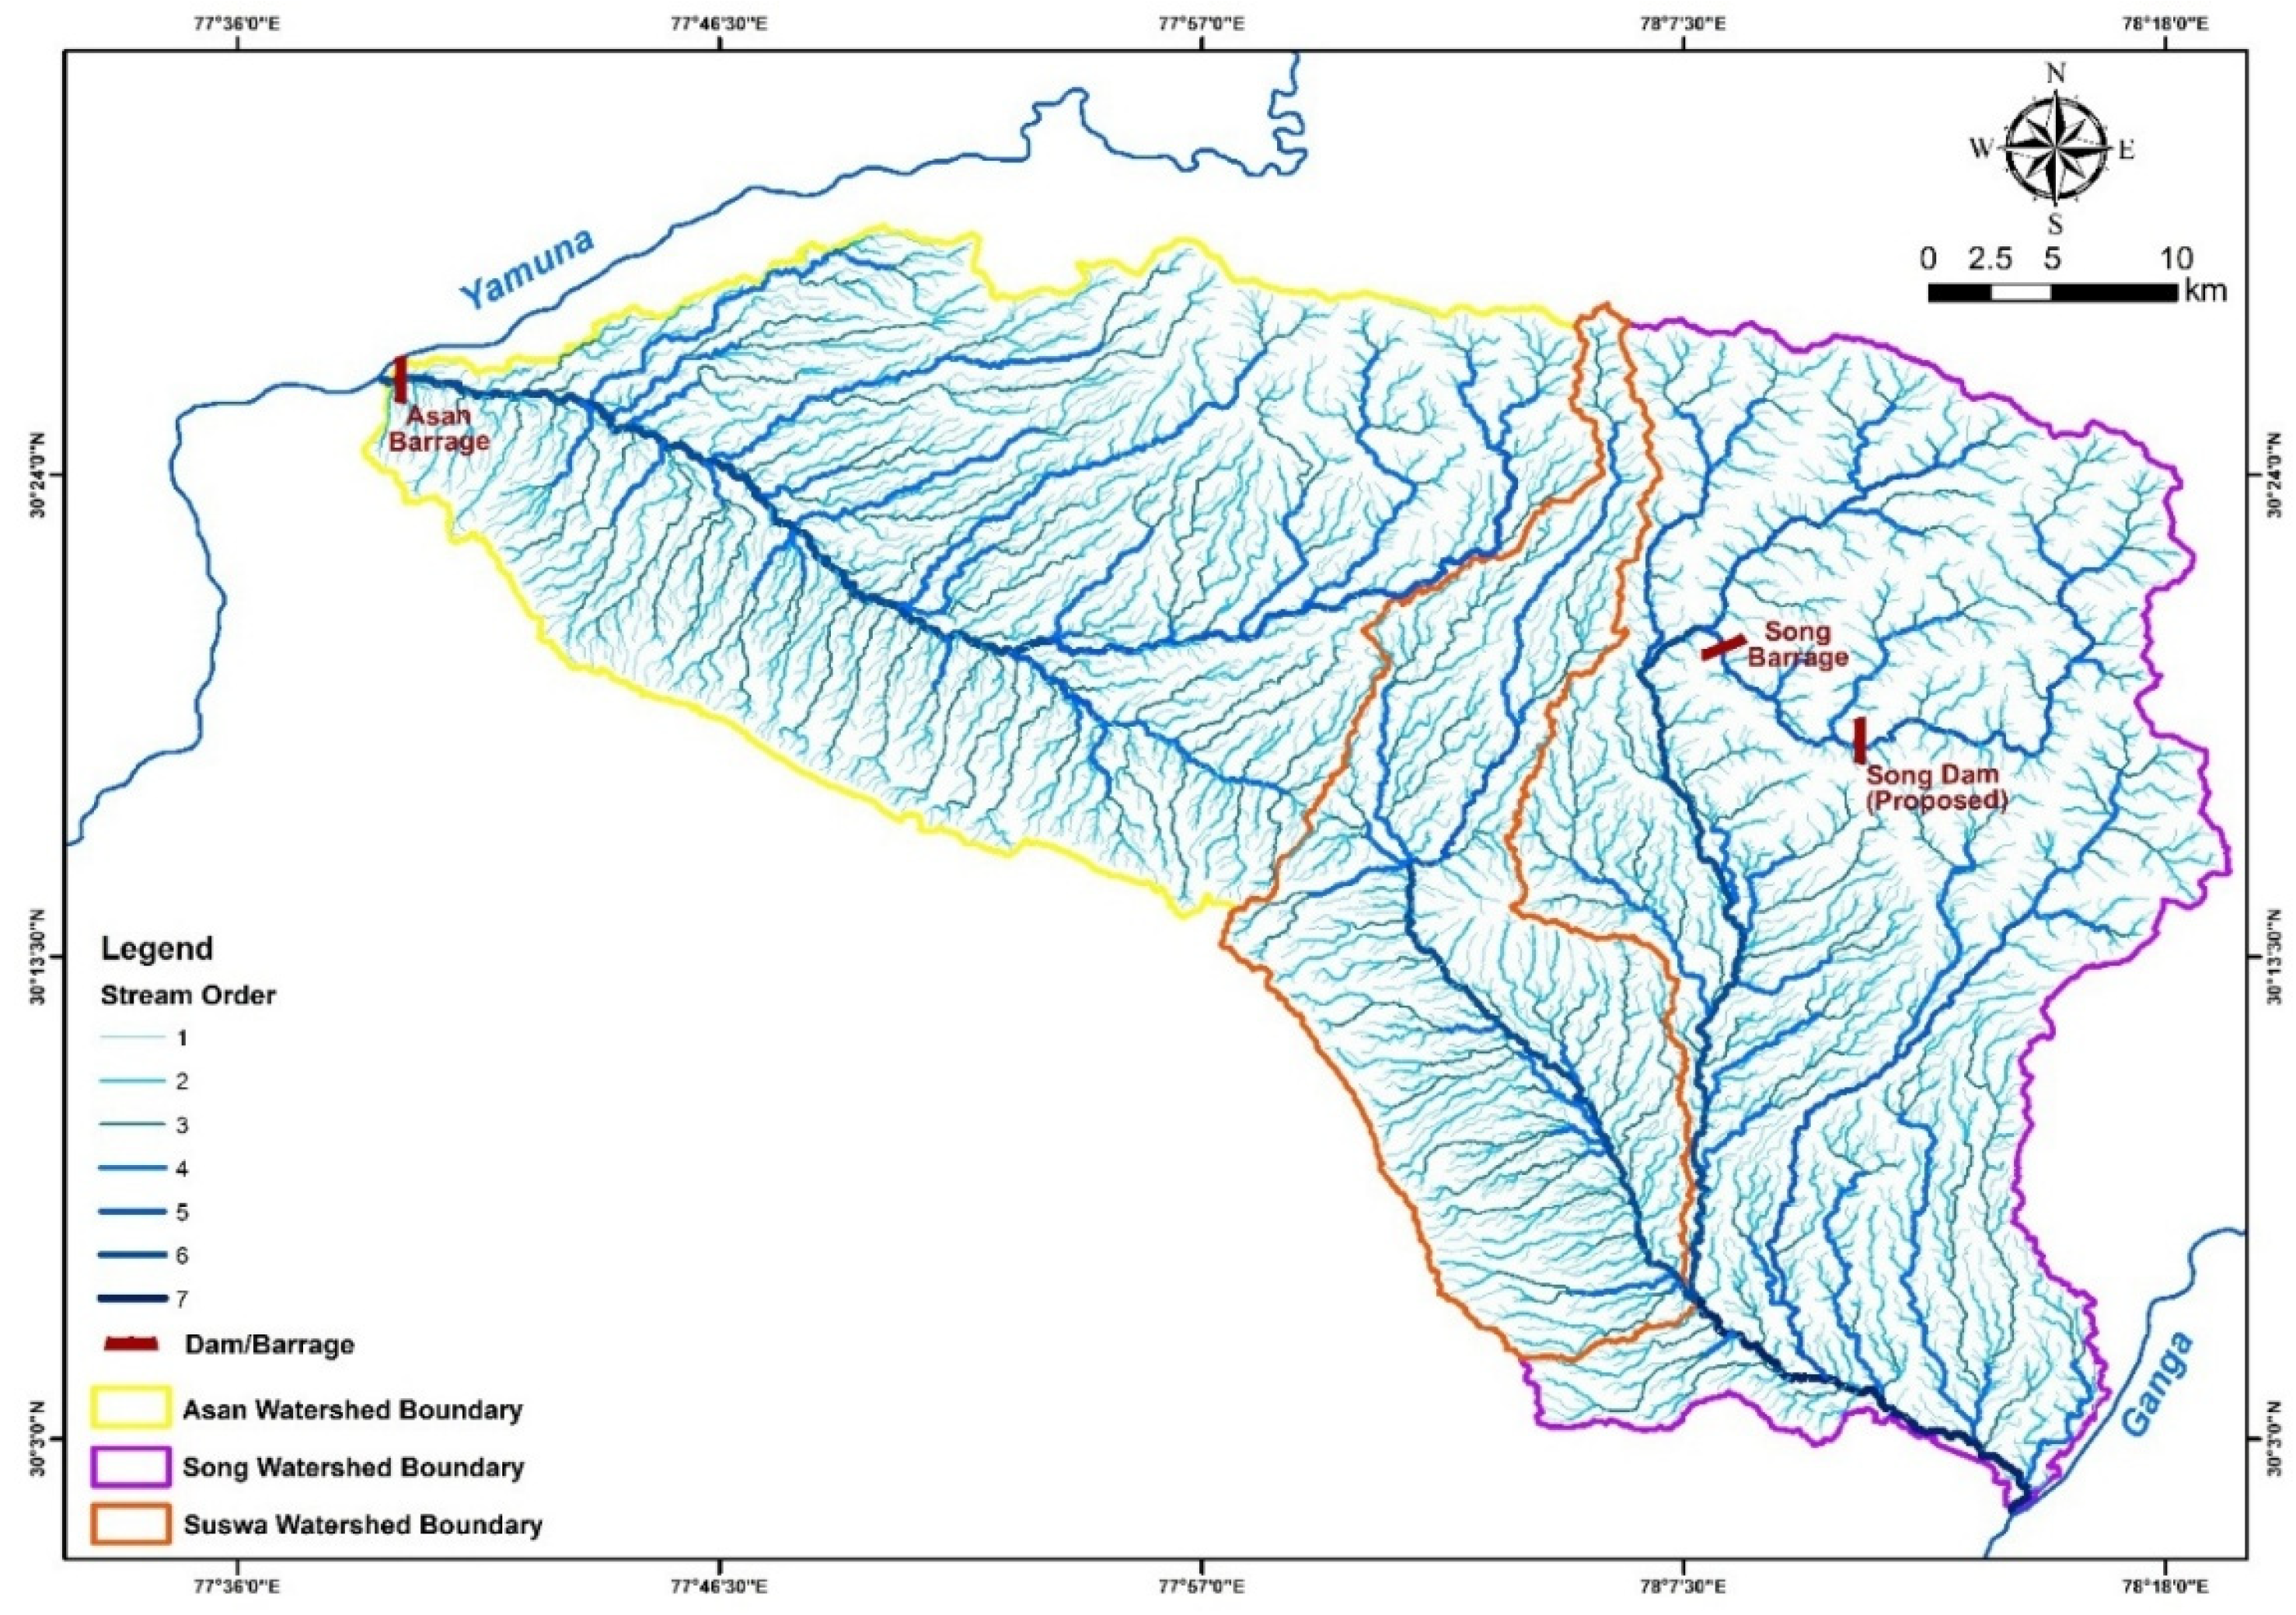
3.1.1. Linear Aspects
- Stream Order (w)
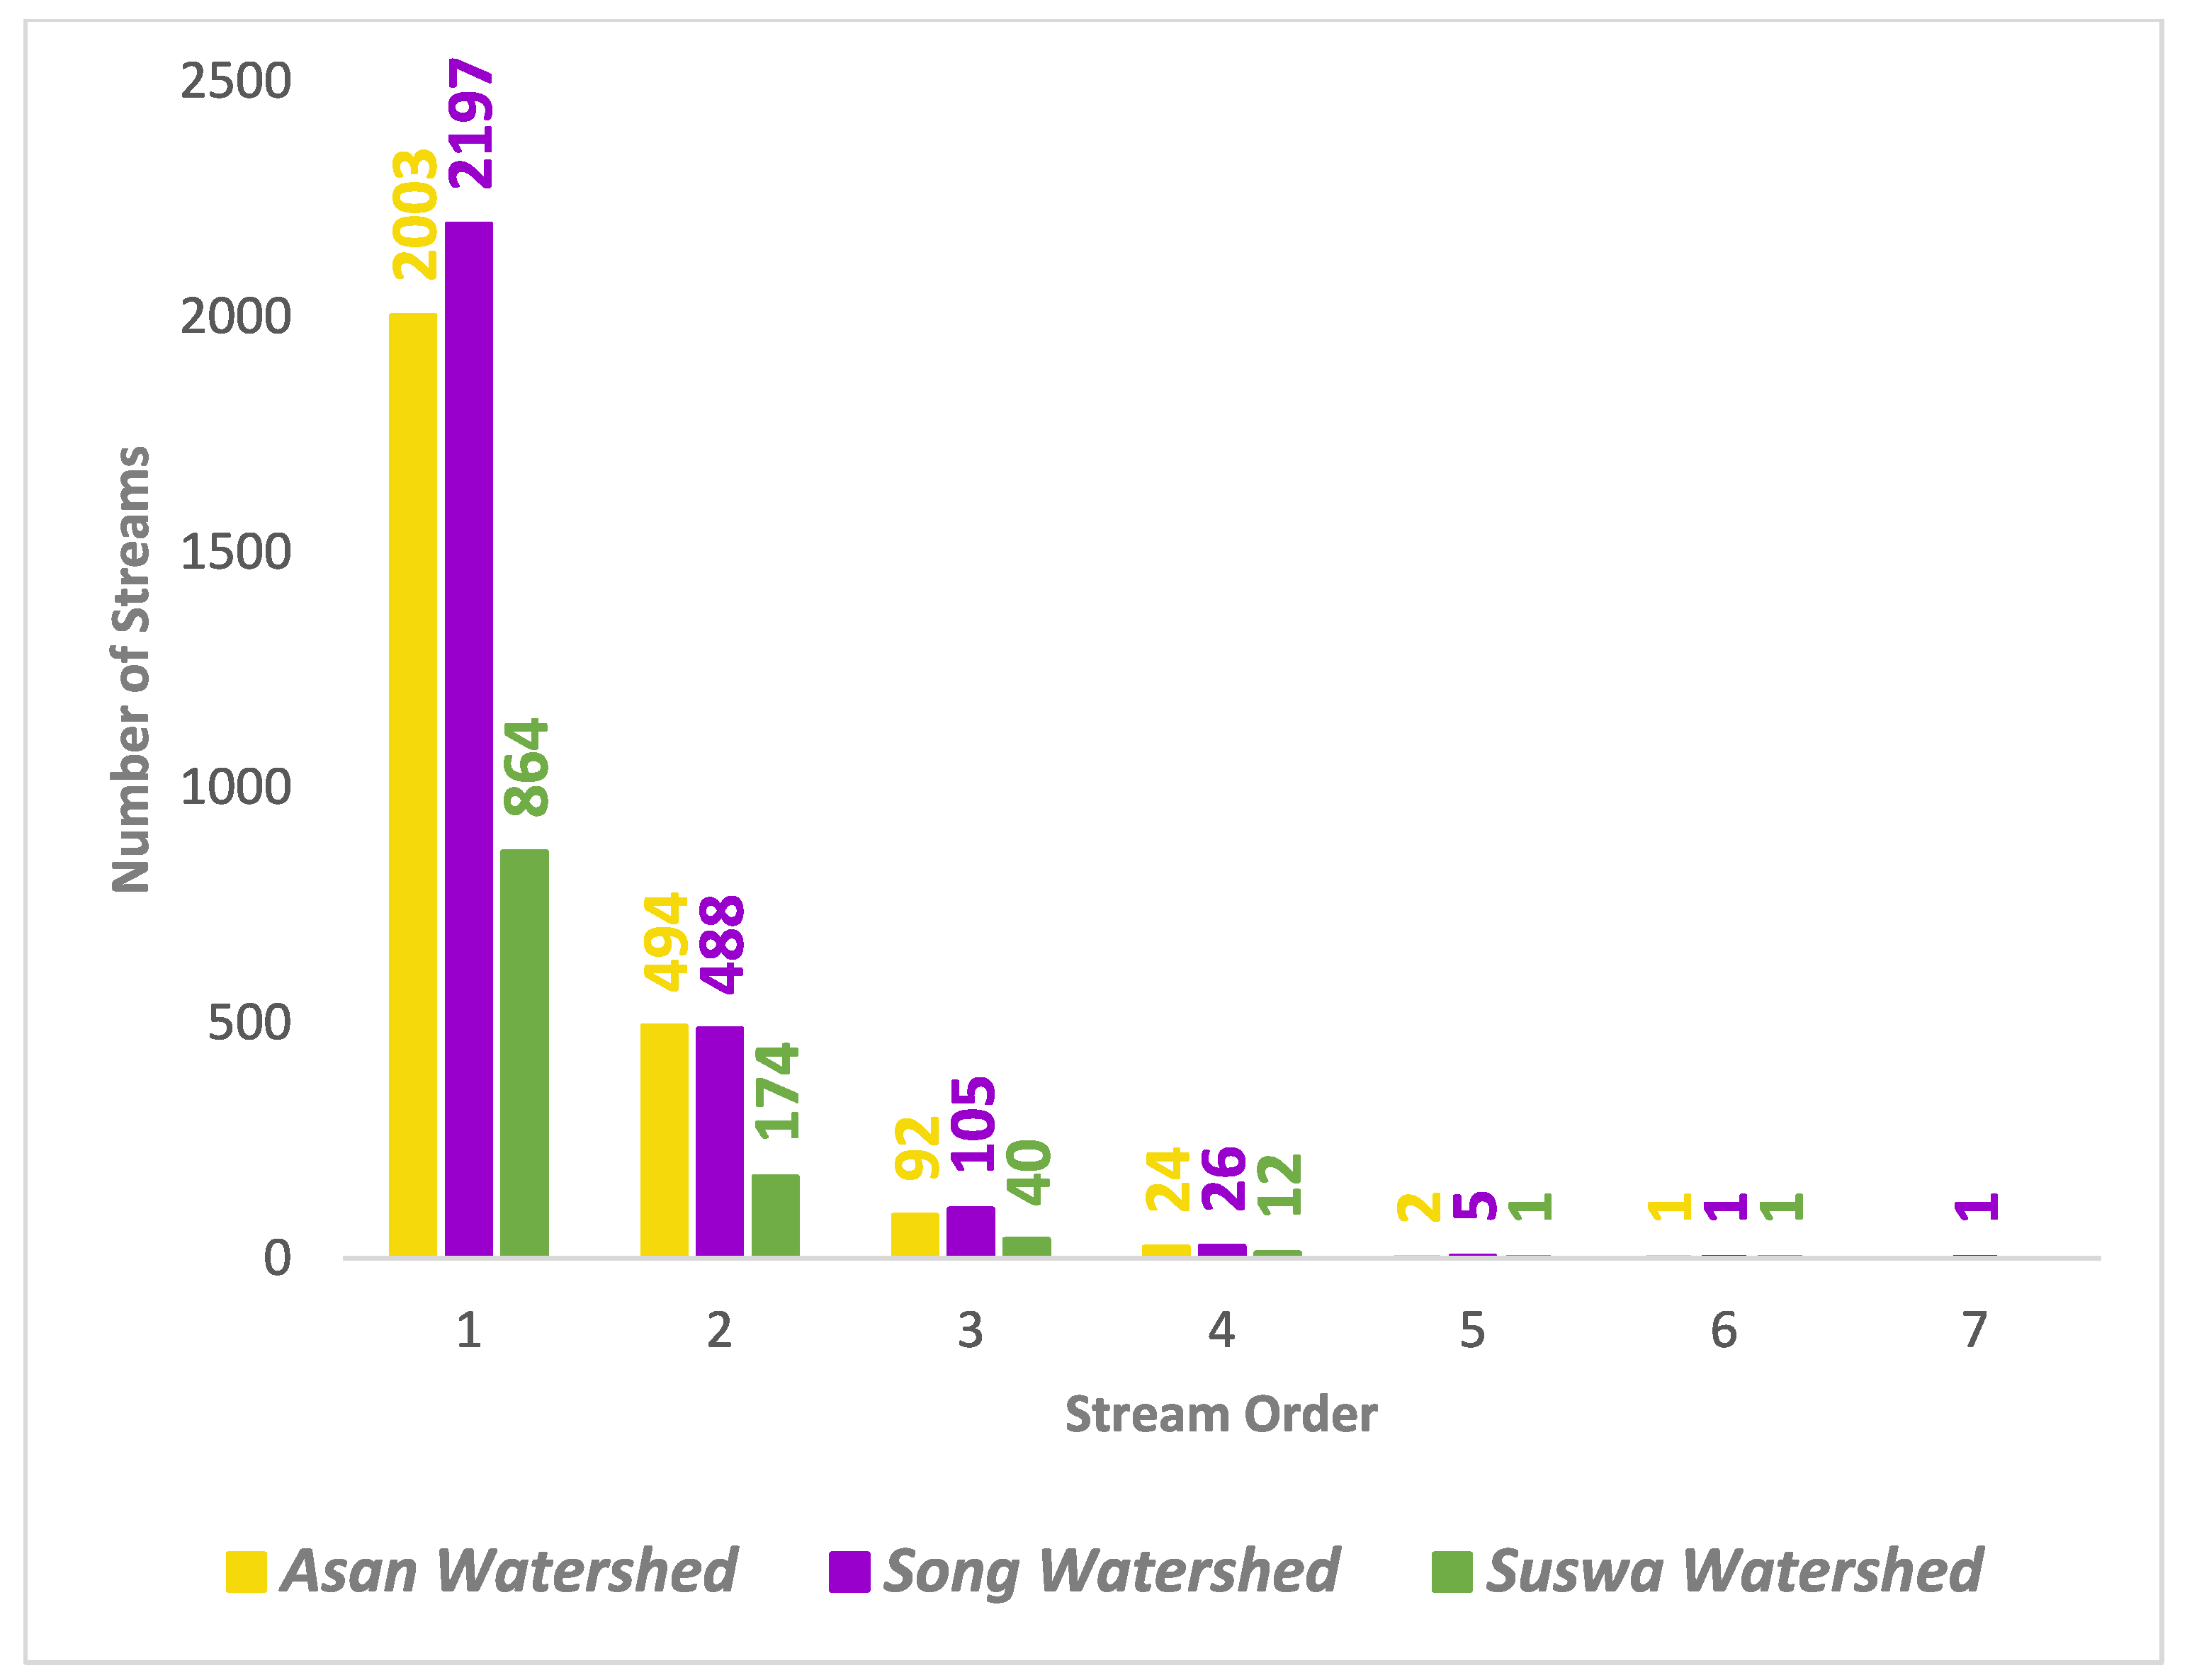
- Stream Number (Nu)
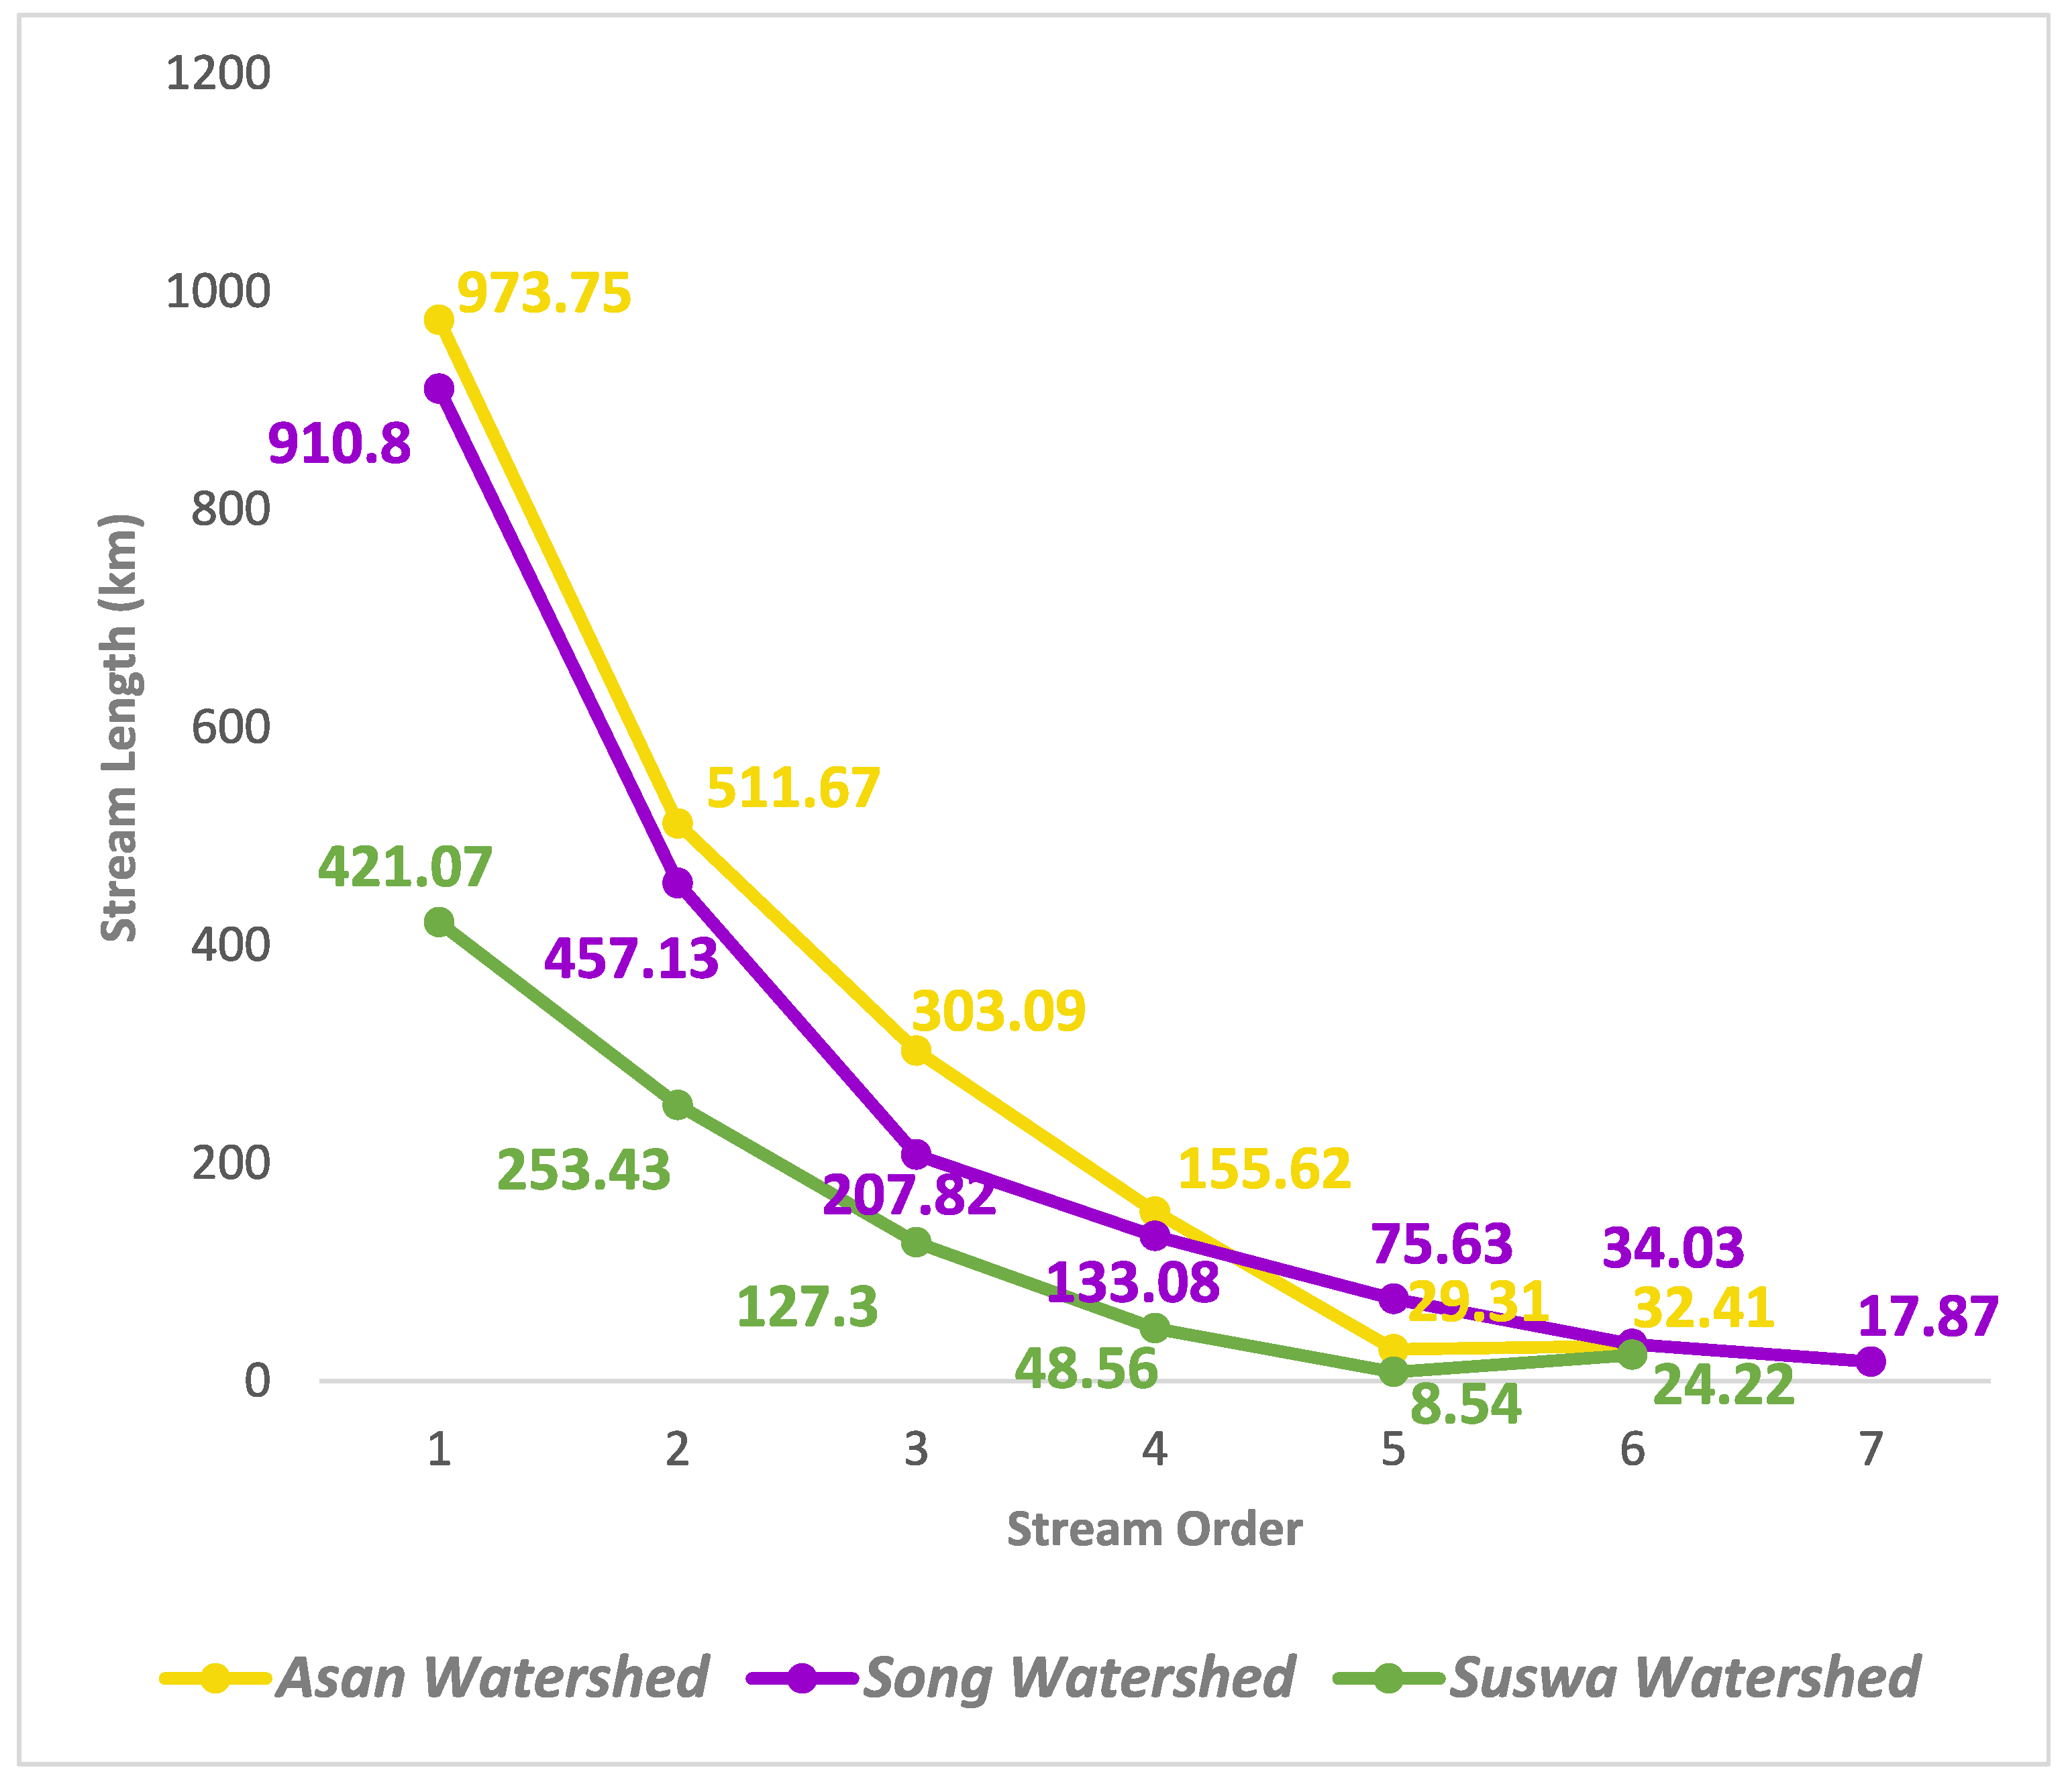
- Stream Length (Ls)
- Sinuosity index (SI)
- Length ratio (RL)
- Bifurcation ratio (Rb)
- Length of overland flow (Lo)
3.1.2. Areal Aspects
- Basin length
- Form factor (Ff)
- Elongation ratio (Re)
- Circularity ratio (Rc)
- Stream frequency (Fs)
- Drainage density (Dd)
- Drainage texture (Td)
- Texture ratio (Rt)
- Compactness coefficient (Cc)
3.1.3. Relief Aspects
- Basin relief (Rb)
- Relief ratio (Rr)
3.2. Other Significant Topographical Factors for Watershed Management
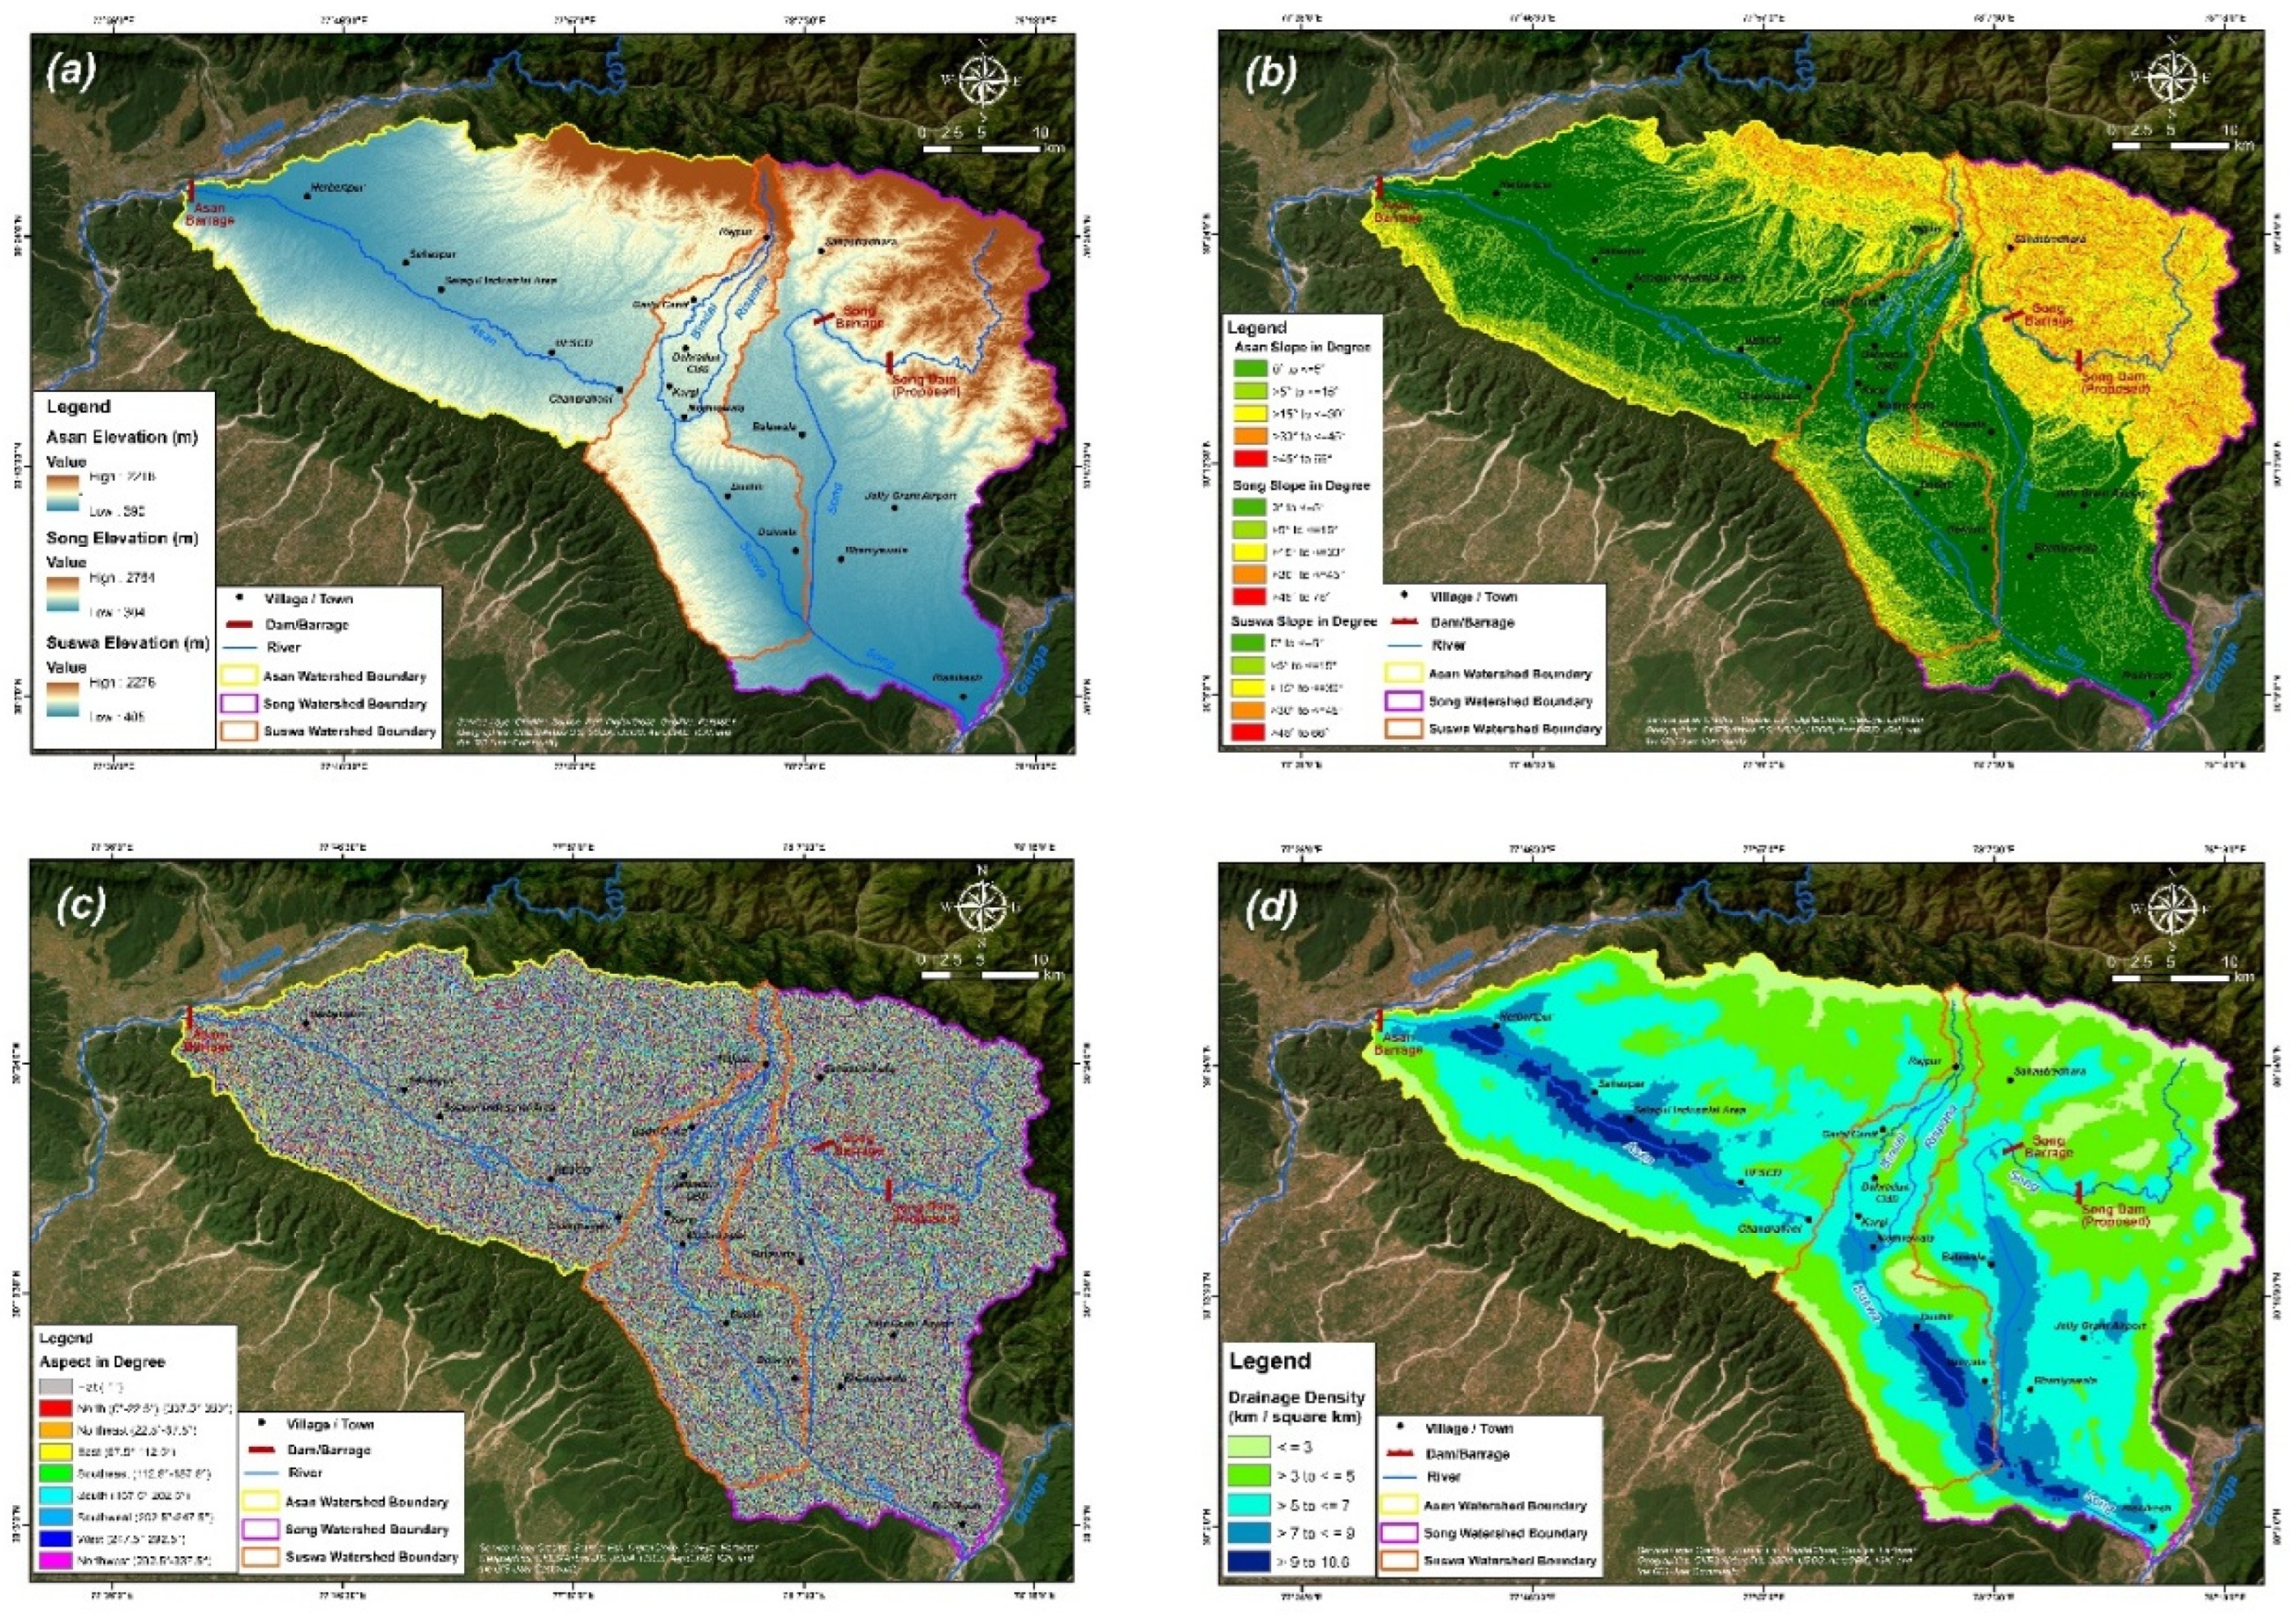
3.2.1. Elevation
3.2.2. Slope and Aspect
3.2.3. Drainage Density
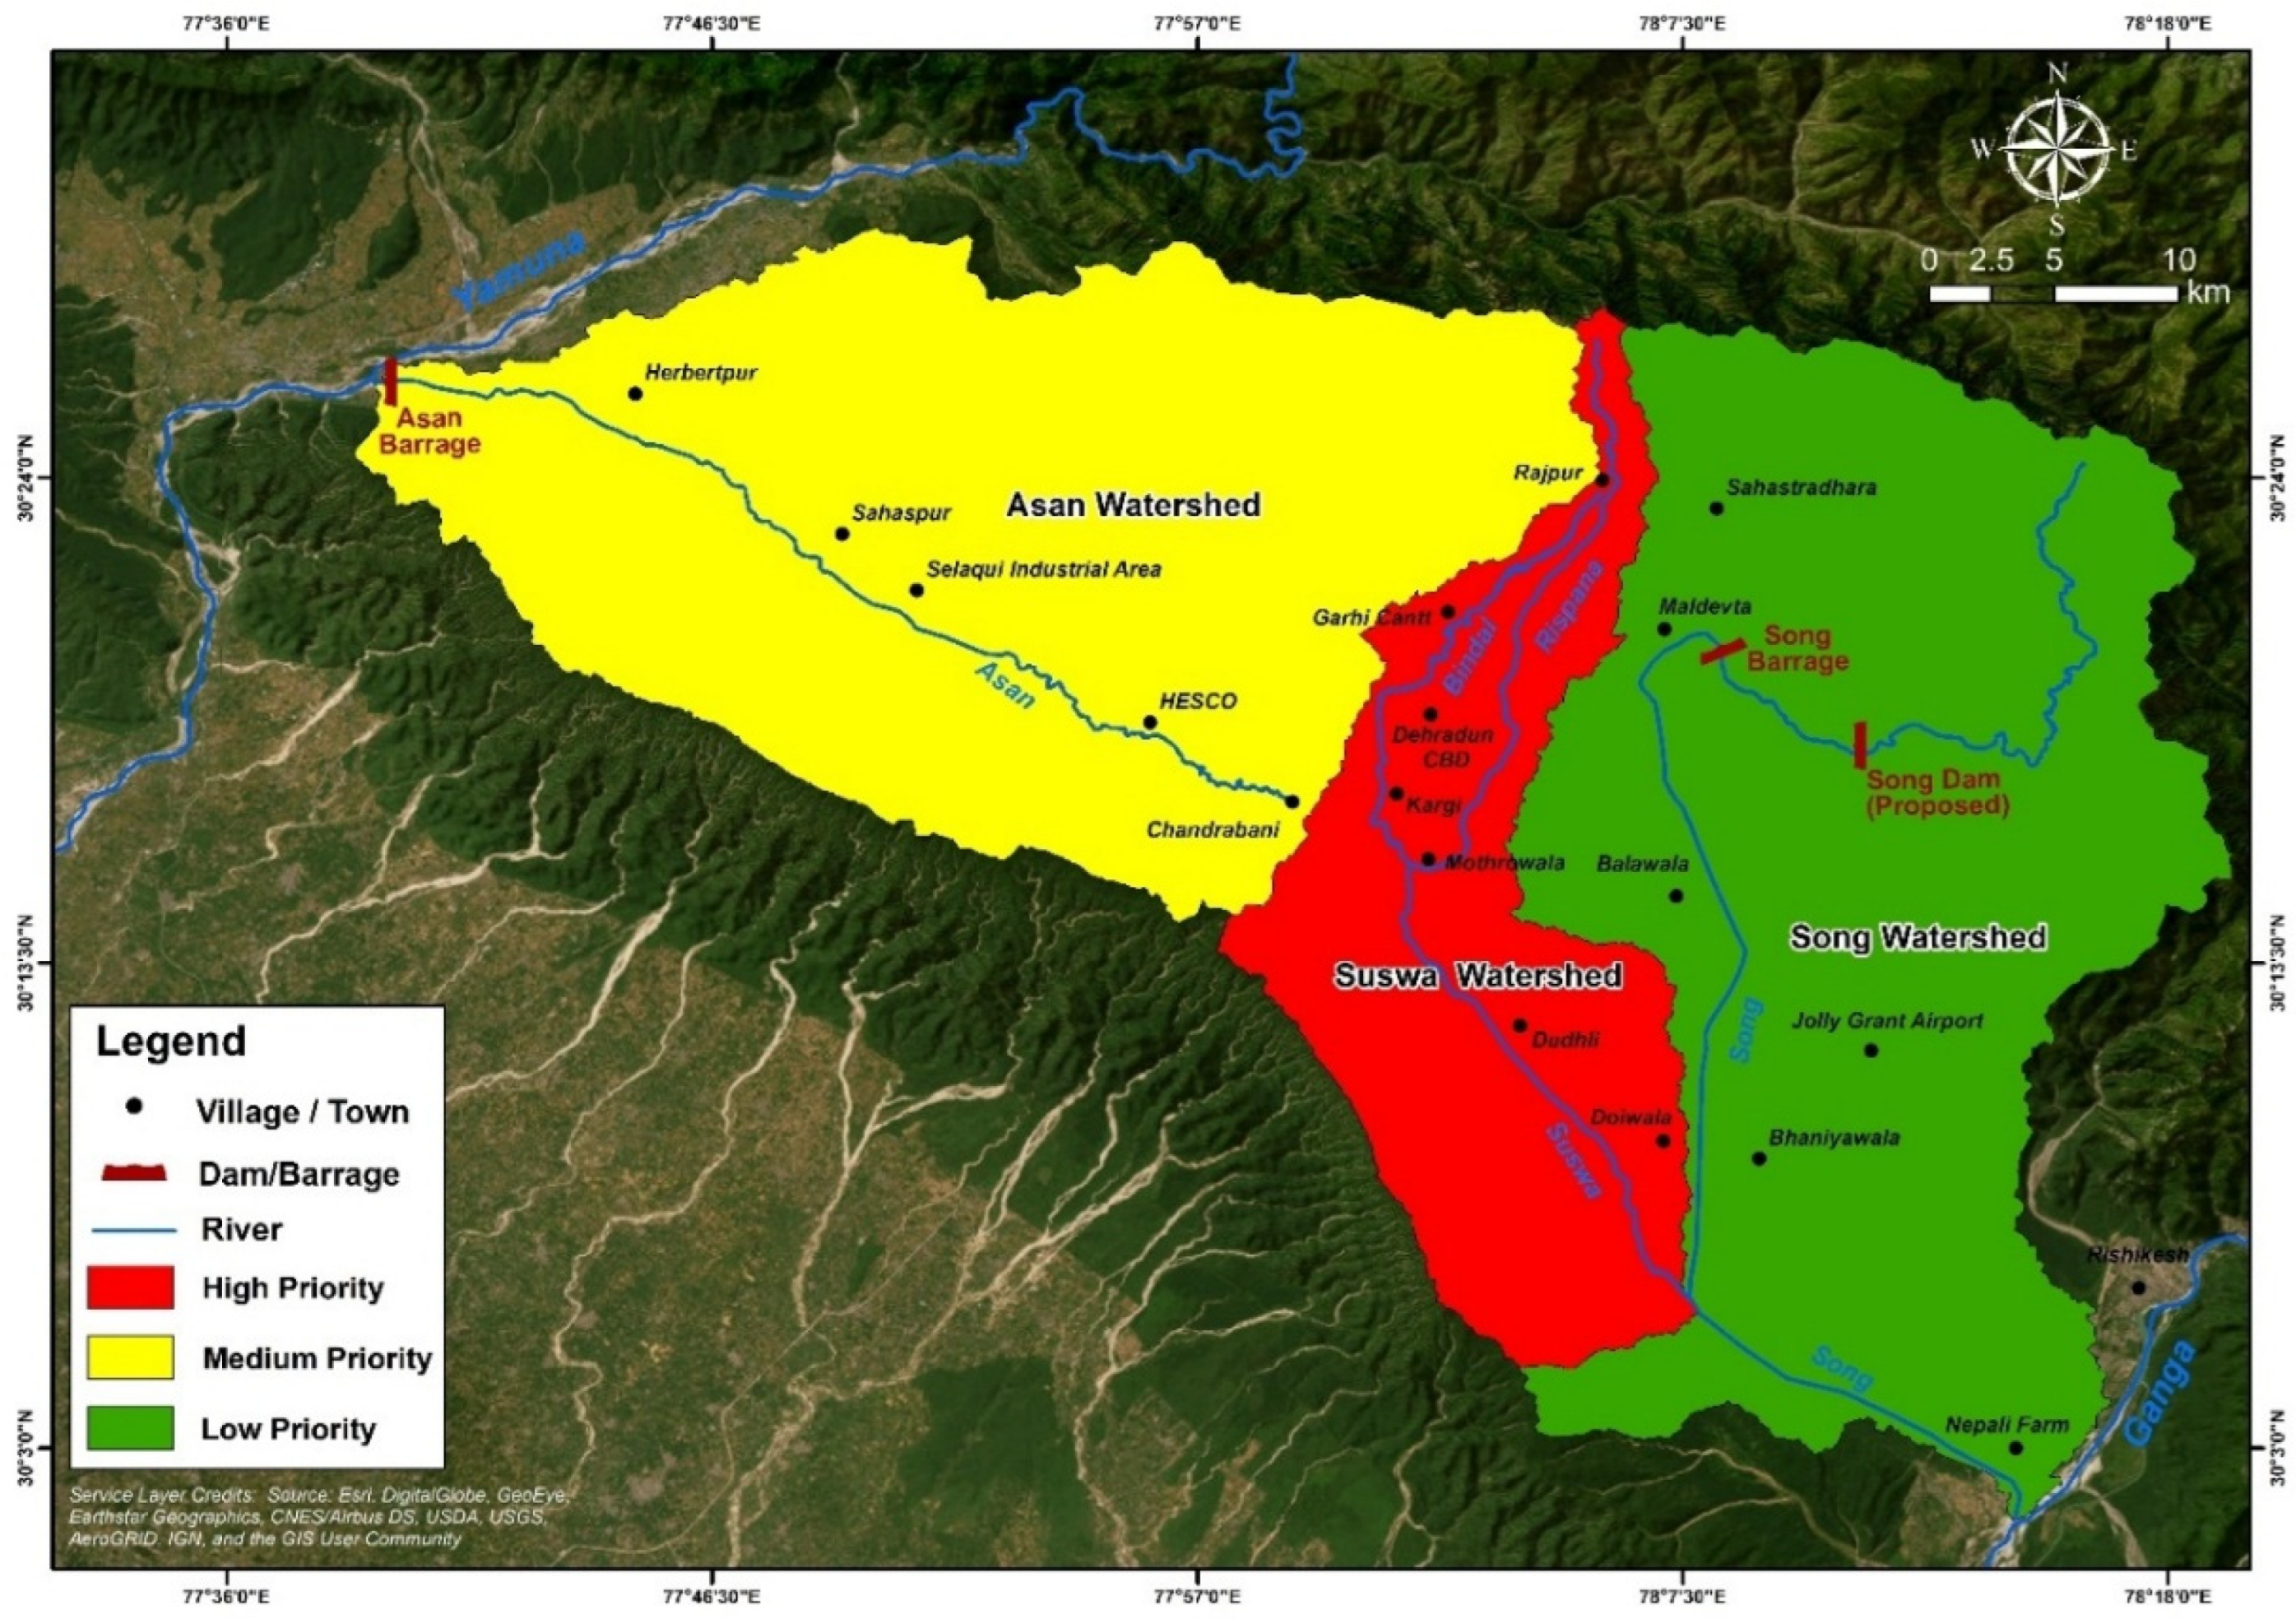
3.3. Prioritization of Doon Valley Watersheds
3.4. Correlations Among Morphometric Parameters
3.4.1. Positive Correlations (Strong Direct Relationships)
- Mean bifurcation ratio, drainage texture, and drainage density: These parameters are highly correlated (1.00), indicating that, as the bifurcation ratio increases, the drainage density and drainage texture also increase. This suggests that areas with a higher number of stream segments tend to have more closely spaced channels.
- Circularity ratio, form factor, and elongation ratio: These parameters show a strong correlation (1.00), meaning that watersheds that are elongated tend to have higher form factor values.
- Texture ratio and compactness coefficient: These are strongly correlated with the elongation ratio, form factor, and circularity ratio (1.00), indicating that watersheds/basins with higher texture ratios also tend to have higher compactness coefficients and are susceptible to soil erosion, with steep slopes and higher runoff.
3.4.2. Negative Correlations (Inverse Relationships)
- Mean bifurcation ratio vs. circularity ratio, form factor, and elongation ratio (−0.5): A higher mean bifurcation ratio is directly associated with a circular watershed/basin with a gentle slope and indirectly with an elongated watershed/basin with a steep slope.
- Relief ratio vs. texture ratio, drainage density, and mean bifurcation ratio (−1.0): This suggests that areas with a high texture ratio, drainage density, and mean bifurcation ratio tend to have lower relief ratios, indicating a more mature landscape with well-developed drainage networks.
- Sinuosity index vs. circularity ratio, form factor, and elongation ratio (−1.0): Higher sinuosity (indicating the meandering nature of rivers) is associated with less elongated and circular watersheds.
- Length of overland flow vs. circularity ratio, form factor, and elongation ratio (−0.5): The length of overland flow shows a negative correlation with the circularity ratio, form factor, and elongation ratio, indicating that more elongated watersheds/basins with steep slopes have shorter overland flow paths, leading to faster runoff and lower infiltration rates.
3.4.3. Neutral and Moderate Correlations
- Stream frequency vs. most parameters (−0.5 to 0.5): The stream frequency shows moderate negative correlations with most parameters, indicating that its influence is relatively balanced across multiple morphometric characteristics.
- Relief ratio: The relief ratio shows a neutral correlation with the elongation ratio, form factor, and circularity ratio (0.5), which indicates that a watershed/basin’s steepness does not directly determine its shape due to geomorphic influences.
4. Discussion
5. Conclusions
Author Contributions
Funding
Data Availability Statement
Acknowledgments
Conflicts of Interest
References
- Grill, G.; Lehner, B.; Thieme, M.; Geenen, B.; Tickner, D.; Antonelli, F.; Babu, S.; Borrelli, P.; Cheng, L.; Crochetiere, H.; et al. Mapping the world’s free-flowing rivers. Nature 2019, 569, 215–221. [Google Scholar] [CrossRef] [PubMed]
- Braga, B.; Chartres, C.; Cosgrove, W.J.; da Cunha, L.V.; Gleick, P.H.; Kabat, P.; Kadi, M.A.; Loucks, D.P.; Lundqvist, J.; Narain, S.; et al. Water and the Future of Humanity: Revisiting Water Security, 1st ed.; Calouste Gulbenkian Foundation; Springer International: Berlin/Heidelberg, Germany, 2014; pp. 1–241. [Google Scholar]
- McGrane, S.J. Impacts of Urbanisation on Hydrological and Water Quality Dynamics, and Urbanwater Management: A Review. Hydrol. Sci. J. 2016, 61, 2295–2311. [Google Scholar] [CrossRef]
- Mani, A.; Kumari, M.; Badola, R. Urban Watershed Management in the Doon Valley: A Geospatial Assessment of Himalayan Watersheds. J. Landsc. Ecol. 2025, 18, 127–149. [Google Scholar] [CrossRef]
- Li, R.; Zhu, G.; Lu, S.; Meng, G.; Chen, L.; Wang, Y.; Huang, E.; Jiao, Y.; Wang, Q. Effects of cascade hydropower stations on hydrologic cycle in Xiying river basin, a runoff in Qilian mountain. J. Hydrol. 2025, 646, 132342. [Google Scholar] [CrossRef]
- Cui, Z.; Chen, Q.; Luo, J.; Ma, X.; Liu, G. Characterizing Subsurface Structures from Hard and Soft Data with Multiple-Condition Fusion Neural Network. Water Resour. Res. 2024, 60, e2024WR038170. [Google Scholar] [CrossRef]
- Singh, P.; Gupta, A.; Singh, M. Hydrological inferences from watershed analysis for water resource management using remote sensing and GIS techniques. Egypt. J. Remote Sens. Space Sci. 2014, 17, 111–121. [Google Scholar] [CrossRef]
- Mani, A.; Kumari, M.; Badola, R. Morphometric Analysis of Suswa River Basin Using Geospatial Techniques. Eng. Proc. 2022, 27, 65. [Google Scholar]
- Mundetia, N.; Sharma, D.; Dubey, S.K. Morphometric assessment and sub-watershed prioritization of Khari River basin in semi-arid region of Rajasthan, India. Arab. J. Geosci. 2018, 11, 530. [Google Scholar] [CrossRef]
- Breyer, S.P.; Scott, S.R. Drainage basin perimeters: A fractal significance. Geomorphology 1992, 5, 143–157. [Google Scholar] [CrossRef]
- Nag, S.K.; Chakraborty, S. Influence of rock types and structures in the development of drainage network in hard rock area. J. Indian Soc. Remote Sens. 2003, 31, 26–35. [Google Scholar] [CrossRef]
- Das, A.K.; Mukherjee, S. Drainage morphometry using satellite data and GIS in Raigad district, Maharashtra. J. Geol. Soc. India 2005, 65, 577–586. [Google Scholar]
- Magesh, N.S.; Chandrasekar, N.; Soundranayagam, J.P. Morphometric evaluation of Papanasam and Manimuthar watersheds, parts of Western Ghats, Tirunelveli district, Tamil Nadu, India: A GIS approach. Environ. Earth Sci. 2011, 64, 373–381. [Google Scholar] [CrossRef]
- Sreedevi, P.D.; Owais, S.H.H.K.; Khan, H.H.; Ahmed, S. Morphometric analysis of a watershed of South India using SRTM data and GIS. J. Geol. Soc. India 2009, 73, 543–552. [Google Scholar] [CrossRef]
- Jhariya, D.C.; Kumar, T.; Pandey, H.K. Watershed Prioritization Based on Soil and Water Hazard Model Using Remote Sensing, Geographical Information System and Multi-Criteria Decision Analysis Approach. Geocarto Int. 2018, 35, 188–208. [Google Scholar] [CrossRef]
- Abdekareem, M.; Al-Arifi, N.; Abdalla, F.; Mansour, A.; El-Baz, F. Fusion of Remote Sensing Data Using GIS-Based AHP-Weighted Overlay Techniques for Groundwater Sustainability in Arid Regions. Sustainability 2022, 14, 7871. [Google Scholar] [CrossRef]
- Das, B.; Singh, S.; Jain, S.K.; Thakur, P.K. Prioritization of Sub-Basins of Gomti River for Soil and Water Conservation Through Morphometric and LULC Analysis Using Remote Sensing and GIS. J. Indian. Soc. Remote Sens. 2021, 49, 2503–2522. [Google Scholar] [CrossRef]
- Bashir, B.; Alsalman, A. Morphometric and Soil Erosion Characterization Based on Geospatial Analysis and Drainage Basin Prioritization of the Rabigh Area Along the Eastern Red Sea Coastal Plain, Saudi Arabia. Sustainability 2024, 16, 9008. [Google Scholar] [CrossRef]
- Pramanik, M.K. Morphometric Characteristics and Water Resource Management of Tista River Basin Using Remote Sensing and GIS Techniques. J. Hydrogeol. Hydrol. Eng. 2016, 5, 17–19. [Google Scholar] [CrossRef]
- Woldesenbet, T.A.; Elagib, N.A.; Ribbe, L.; Heinrich, J. Hydrological responses to land use/cover changes in the source region of the Upper Blue Nile Basin, Ethiopia. Sci. Total Environ. 2017, 575, 724–741. [Google Scholar] [CrossRef]
- Arabameri, A.; Tiefenbacher, J.P.; Blaschke, T.; Pradhan, B.; Tien Bui, D. Morphometric Analysis for Soil Erosion Susceptibility Mapping Using Novel GIS-Based Ensemble Model. Remote Sens. 2020, 12, 874. [Google Scholar] [CrossRef]
- Sampath, V.K.; Radhakrishnan, N. Prioritization of Sub-Watersheds Susceptible to Soil Erosion using Different Combinations of Objective Weighting and MCDM Techniques in an Ungauged River Basin. Water Resour. Manag. 2024, 38, 3447–3469. [Google Scholar] [CrossRef]
- Govarthanambikai, K.; Sathyanarayan Sridhar, R. Prioritization of watershed using morphometric parameters through geospatial and PCA technique for Noyyal River Basin, Tamil Nadu, India. J. Water Clim. Change 2024, 15, 1218–1231. [Google Scholar]
- Kumar, A.; Singh, S.; Pramanik, M.; Chaudhary, S.; Maurya, A.K.; Kumar, M. Watershed prioritization for soil erosion mapping in the Lesser Himalayan Indian basin using PCA and WSA methods in conjunction with morphometric parameters and GIS-based approach. Environ. Dev. Sustain. 2022, 24, 3723–3761. [Google Scholar] [CrossRef]
- Shaikh, M.; Yadav, S.; Manekar, V. Application of the compound factor for runoff potential in sub-watersheds prioritisation based on quantitative morphometric analysis. J. Geol. Soc. India 2022, 98, 687–695. [Google Scholar] [CrossRef]
- Godif, G.; Manjunatha, B.R. Prioritizing sub-watersheds for soil and water conservation via morphometric analysis and the weighted sum approach: A case study of the Geba river basin in Tigray, Ethiopia. Heliyon 2022, 8, e12261. [Google Scholar] [CrossRef]
- Pastor, I.; Tanislav, D.; Nedelea, A.; Dunea, D.; Serban, G.; Haghighi, A.T.; Sabau, D.; Bretcan, P. Morphometric Analysis and Prioritization of Sub-Watersheds Located in Heterogeneous Geographical Units—Case Study: The Buzău River Basin. Sustainability 2024, 16, 7567. [Google Scholar] [CrossRef]
- Shekar, P.R.; Mathew, A.; Hasher, F.F.B.; Mehmood, K.; Zhran, M. Towards Sustainable Development: Ranking of Soil Erosion-Prone Areas Using Morphometric Analysis and Multi-Criteria Decision-Making Techniques. Sustainability 2025, 17, 2124. [Google Scholar] [CrossRef]
- Jones, K.L.; Poole, G.C.; O’Daniel, S.J.; Mertes, L.A.K.; Stanford, J.A. Surface hydrology of low-relief landscapes: Assessing surface water flow impedance using LIDAR-derived digital elevation models. Remote Sens. Environ. 2008, 112, 4148–4158. [Google Scholar] [CrossRef]
- Mani, A.; Kumari, M.; Badola, R. Landslide hazard zonation (LHZ) mapping of Doon Valley using multi-criteria analysis method based on remote sensing and GIS techniques. Discov. Geosci. 2024, 2, 35. [Google Scholar] [CrossRef]
- Rekha, B.V.; George, A.V.; Rita, M.J.E.R. Morphometric analysis and micro-watershed prioritization of Peruvanthanam sub-watershed, the Manimala River Basin, Kerala, South India. Environ. Res. Eng. Manag. 2011, 57, 6–14. [Google Scholar]
- Javed, A.; Khanday, M.Y.; Rais, S. Watershed prioritization using morphometric and land use/land cover parameters: A remote sensing and GIS based approach. J. Geol. Soc. India 2011, 78, 63–75. [Google Scholar] [CrossRef]
- Chandniha, S.K.; Kansal, M.L. Prioritization of subwatersheds based on morphometric analysis using geospatial technique in Piperiya watershed India. Appl. Water Sci. 2014, 7, 329–338. [Google Scholar] [CrossRef]
- Meshram, S.G.; Sharma, S.K. Prioritization of watershed through morphometric parameters: A PCA-based approach. Appl. Water Sci. 2017, 7, 1505–1519. [Google Scholar] [CrossRef]
- Strahler, A.N. Quantative Geomorphology of Drainage Basins and Channel Networks. In Hand Book of Applied Hydrology, 1st ed.; Te Chow, V., Ed.; McGraw Hill Book Company: New York, NY, USA, 1964; pp. 439–476. [Google Scholar]
- Horton, R.E. Erosional Development of Streams and Their Drainage Basins: Hydrophysical Approach to Quantitative Morphology. Geol. Soc. Am. Bull. 1945, 56, 275–370. [Google Scholar] [CrossRef]
- Schumm, S.A. Evolution of Drainage Systems and Slopes in Badlands at Perth Amboy, New Jersey. Geol. Soc. Am. Bull. 1956, 67, 597–646. [Google Scholar] [CrossRef]
- Strahler, A.N. Quantitative Analysis of Watershed Geomorphology. Trans. Am. Geophys. Union 1957, 38, 913–920. [Google Scholar]
- Miller, V.C. A Quantitative Geomorphic Study of Drainage Basin Characteristics in the Clinch Mountain Area, Virginia and Tennessee; Columbia University: New York, NY, USA, 1953; Volume 3, pp. 389–402. [Google Scholar]
- Strahler, A.N. Dynamic Basis of Geomorphology. Geol. Soc. Am. Bull. 1952, 63, 923–938. [Google Scholar] [CrossRef]
- Vannote, R.L.; Minshall, G.W.; Cummins, K.W.; Sedell, J.R.; Cushing, C.E. The River Continuum Concept. Can. J. Fish. Aquat. Sci. 1980, 37, 130–137. [Google Scholar] [CrossRef]
- Rao, G.T.; Rao, V.G.; Dakate, R.; Rao, S.M.; Rao, B.R. Remote sensing and GIS based comparative morphometric study of two sub-watershed of different physiographic conditions, West Godavari District, AP. J. Geol. Soc. India 2012, 79, 383–390. [Google Scholar] [CrossRef]
- Kuchay, N.A.; Bhat, M.S. Automated drainage characterization of Dudganga watershed in western Himalayas. Eur. Sci. J. 2013, 9, 126–138. [Google Scholar]
- Verstappen, H. The Applied Geomorphology; International Institute for Aerial Survey and Earth Science (ITC): Enschede, The Netherlands, 1983. [Google Scholar]
- Horton, R.E. Drainage Basin Characteristics. Trans. Am. Geophys. Union 1932, 13, 350–361. [Google Scholar]
- Shaikh, M.; Birajdar, F. Analysis of watershed characteristics using remote sensing and gis techniques. Int. J. Innov. Res. Sci. Eng. Technol. 2015, 4, 1971–1976. [Google Scholar]
- Farhan, Y.; Anbar, A.; Al-Shaikh, N.; Mousa, R. Prioritization of semi-arid agricultural watershed using morphometric and principal component analysis, remote sensing, and GIS techniques, the Zerqa River Watershed, Northern Jordan. Agric. Sci. 2016, 8, 113–148. [Google Scholar] [CrossRef]
- Nautiyal, M.D. Morphometric Analysis of a Drainage Basin Using Aerial Photographs: A Case Study of Khairkuli Basin, District Dehradun, U.P. J. Indian Soc. Remote Sens. 1994, 22, 251–261. [Google Scholar] [CrossRef]
- Choudhari, P.P.; Nigam, G.K.; Singh, S.K.; Thakur, S. Morphometric based prioritization of watershed for groundwater potential of Mula river basin, Maharashtra, India. Geol. Ecol. Landsc. 2018, 2, 256–267. [Google Scholar] [CrossRef]
- Smith, K.G. Standards for Grading Texture of Erosional Topography. Am. J. Sci. 1950, 248, 655–668. [Google Scholar] [CrossRef]
- Rai, P.K.; Chandel, R.C.; Mishra, V.N.; Singh, P. Hydrological inferences through morphometric analysis of lower Kosi River Basin of India for water resource management based on remote sensing data. Appl. Water Sci. 2018, 8, 15. [Google Scholar] [CrossRef]
- Sinha, R.K.; Eldho, T.I. Assessment of soil erosion susceptibility based on morphometric and landcover analysis: A case study of Netravati River Basin, India. J. Indian Soc. Remote Sens. 2021, 49, 1709–1725. [Google Scholar] [CrossRef]
- Smith, T.; Bookhagen, B. Climatic and biotic controls on topographic asymmetry at the global scale. J. Geophys. Res. Earth Surf. 2021, 126, e2020JF005692. [Google Scholar] [CrossRef]
- Zende, A.M.; Nagarajan, R.; Atal, K.R. Prioritization of sub-watersheds in semi arid region, Western Maharashtra, India using Geographical Information System. Am. J. Eng. Res. 2013, 2, 128–135. [Google Scholar]
- Balasubramanian, A.; Duraisamy, K.; Thirumalaisamy, S.; Krishnaraj, S.; Yatheendradasan, R.K. Prioritization of subwatersheds based on quantitative morphometric analysis in lower Bhavani basin, Tamil Nadu, India using DEM and GIS techniques. Arab. J. Geosci. 2017, 10, 1–18. [Google Scholar] [CrossRef]
- Bagwan, W.A.; Gavali, R.S. An integrated approach for the prioritization of subwatersheds in the Urmodi River catchment (India) for soil conservation using morphometric and land use land cover (LULC) factors. J. Sediment. Environ. 2021, 6, 39–56. [Google Scholar] [CrossRef]
- Das, D. Identification of erosion prone areas by morphometric analysis using GIS. J. Inst. Eng. India A 2014, 95, 61–74. [Google Scholar] [CrossRef]
- Singh, O.; Singh, J. Soil erosion susceptibility assessment of the lower Himachal Himalayan Watershed. J. Geol. Soc. India 2018, 92, 157–165. [Google Scholar] [CrossRef]
- Subudhi, S.P.; Kansal, A.; Ghoshal, T.; Singhal, N.; Rana, D. Recent Trends of Temporal and Spatial Variation in Waste Generation and Its Impacts on River Water Quality: Special Emphasis on Suswa and Song Rivers of Uttarakhand. In International Conference on Advances and Innovations in Recycling Engineering; Springer Nature: Singapore, 2023; pp. 129–140. [Google Scholar]
- Liu, J.; Wang, Y.; Li, Y.; Peñuelas, J.; Zhao, Y.; Sardans, J.; Tetzlaff, D.; Liu, J.; Liu, X.; Yuan, H.; et al. Soil ecological stoichiometry synchronously regulates stream nitrogen and phosphorus concentrations and ratios. CATENA 2023, 231, 107357. [Google Scholar] [CrossRef]
- Prabhakar, A.K.; Singh, K.K.; Lohani, A.K.; Chandniha, S.K. Study of Champua watershed for management of resources by using morphometric analysis and satellite imagery. Appl. Water Sci. 2019, 9, 127. [Google Scholar] [CrossRef]
- Mishra, A.P.; Singh, S.; Jani, M.; Singh, K.A.; Pande, C.B.; Varade, A.M. Assessment of water quality index using Analytic Hierarchy Process (AHP) and GIS: A case study of a struggling Asan River. Int. J. Environ. Anal. Chem. 2022, 104, 1159–1171. [Google Scholar] [CrossRef]
- Mandal, S.; Mani, A.; Lall, A.R.; Kumar, D. Slope stability assessment and landslide susceptibility mapping in the Lesser Himalaya, Mussoorie, Uttarakhand. Discov. Geosci. 2024, 2, 51. [Google Scholar] [CrossRef]
- Singh, S.; Naik, R.; Bahuguna, A.; Kumar, A.; Sharma, N. Habitat Quality Characterization and Management of Asan Wetland Biodiversity. Int. J. Ecol. Environ. Sci. 2024, 50, 557–575. [Google Scholar] [CrossRef]
- Efraimidou, E.; Spiliotis, M. A GIS-Based Flood Risk Assessment Using the Decision-Making Trial and Evaluation Laboratory Approach at a Regional Scale. Environ. Process. 2024, 11, 9. [Google Scholar] [CrossRef]
- Shrestha, S.; Dahal, D.; Poudel, B.; Banjara, M.; Kalra, A. Flood Susceptibility Analysis with Integrated Geographic Information System and Analytical Hierarchy Process: A Multi-Criteria Framework for Risk Assessment and Mitigation. Water 2025, 17, 937. [Google Scholar] [CrossRef]
- Khanduri, S. Cloudbursts Strike over Foothills Himalaya of Uttarakhand, India: A Case Study from Maldeota, Dehradun District. Acad. Platf. J. Nat. Hazards Disaster Manag. 2024, 5, 30–45. [Google Scholar] [CrossRef]
- Dwivedi, S.K.; Thakur, P.K.; Dhote, P.R.; Kruczkiewicz, A.; Upadhyay, M.; Moothedan, A.J.; Bisht, M.; Singh, R.P. Unravelling flash flood dynamics of Song watershed, Doon Valley: Key insights for floodplain management. Geomat. Nat. Hazards Risk 2024, 15, 2378979. [Google Scholar] [CrossRef]
- Singh, S.; Kansal, M.L. Sub-basin prioritisation using RUSLE in a Mountainous River Basin of Uttarakhand (India). Environ. Dev. Sustain. 2024, 26, 6851–6877. [Google Scholar] [CrossRef]
- Kumar, R.; Naqvi, H.R.; Devrani, R.; Deshmukh, B.; Huang, J.C. Sediment yield assessment, prioritization and control practices in Chambal River basin employing SYI model. J. Geol. Soc. India 2022, 98, 1585–1594. [Google Scholar] [CrossRef]
- Chen, L.; Zhu, G.; Lin, X.; Li, R.; Lu, S.; Jiao, Y.; Qiu, D.; Meng, G.; Wang, Q. The Complexity of Moisture Sources Affects the Altitude Effect of Stable Isotopes of Precipitation in Inland Mountainous Regions. Water Resour. Res. 2024, 60, e2023WR036084. [Google Scholar] [CrossRef]
- Zhao, Y.; Wang, H.; Song, B.; Xue, P.; Zhang, W.; Peth, S.; Hill, R.L.; Horn, R. Characterizing uncertainty in process-based hydraulic modeling, exemplified in a semiarid Inner Mongolia steppe. Geoderma 2023, 440, 116713. [Google Scholar] [CrossRef]
- Baidauletova, G.; Yessimzhanova, S.; Beisenova, M.; Yesbolova, Y.; Taizhanov, L. Modern Problems of Water Resources and Ways to Solve Them: The Case of Kazakhstan. Water Conserv. Manag. 2024, 8, 150–155. [Google Scholar] [CrossRef]
- Misra, A.K.; Dolui, S.; Dutta, K.; Baruah, B.; Ranjan, R.K.; Wanjari, N. Sustainable water management in Sikkim Himalayan region: Innovative solutions for rainwater harvesting reservoirs. Geol. Ecol. Landsc. 2024, 1–14. [Google Scholar] [CrossRef]
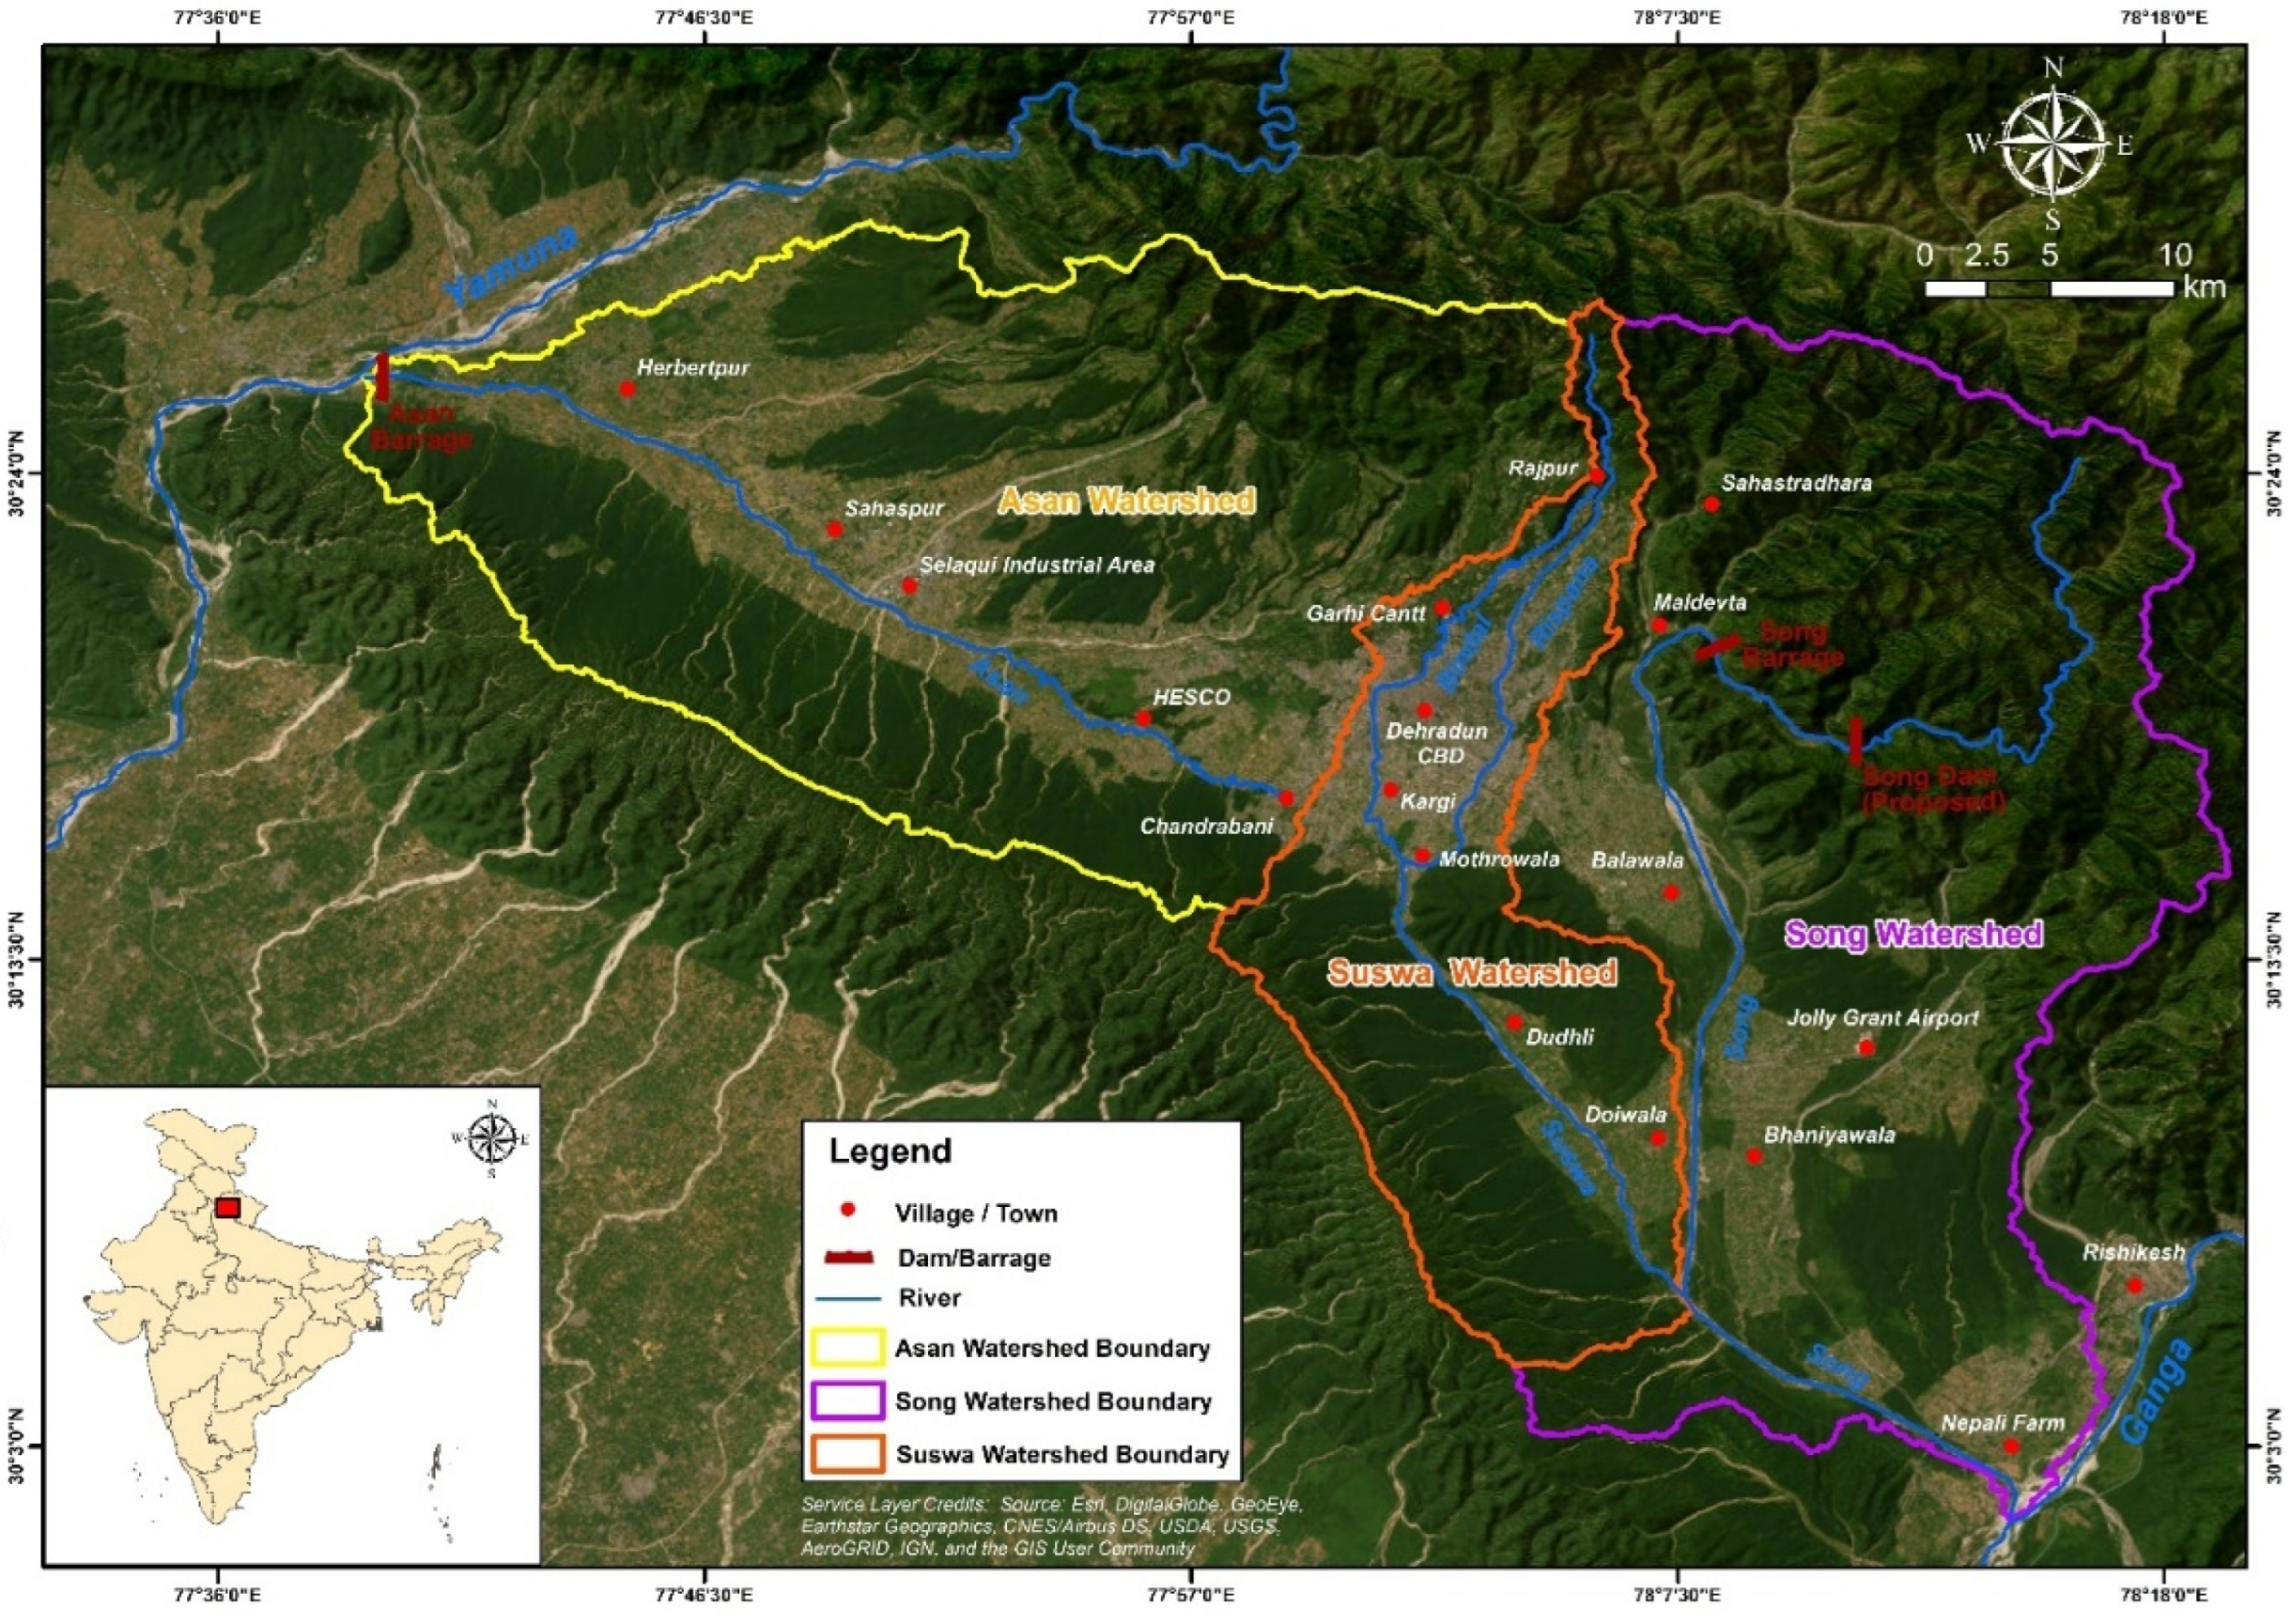
| S. No. | Watershed | River | Location in Doon Valley | Area in km2 | Area in % |
|---|---|---|---|---|---|
| 1 | Asan watershed | Asan | Western Doon Valley | 701.15 | 40.25 |
| 2 | Song watershed | Song | Eastern Doon Valley | 729.51 | 41.89 |
| 3 | Suswa watershed | Suswa | Central Doon Valley | 310.98 | 17.86 |
| Total | 1741.64 | 100 | |||
| Watershed | Stream Order (w) | No. of Streams (Nu) | Bifurcation Ratio (Rb) | Mean Bifurcation Ratio (Rbm) | Total Length of Streams (km) | Mean Stream Length (Lsm) | Length Ratio (RL) | Sinuosity Index (SI) | Length of Overland Flow (Lo) |
|---|---|---|---|---|---|---|---|---|---|
| Asan | 1 | 2003 | 973.75 | 1.11 | 0.70 | ||||
| 2 | 494 | 4.05 | 511.67 | 0.53 | |||||
| 3 | 92 | 5.37 | 5.45 | 303.09 | 0.77 | 0.59 | |||
| 4 | 24 | 3.83 | 155.62 | 0.51 | |||||
| 5 | 2 | 12.00 | 29.31 | 0.19 | |||||
| 6 | 1 | 2.00 | 32.41 | 1.11 | |||||
| Total | 2616 | Total | 2005.85 | ||||||
| Song | 1 | 2197 | 910.8 | 1.07 | 0.79 | ||||
| 2 | 488 | 4.50 | 457.13 | 0.50 | |||||
| 3 | 105 | 4.65 | 207.82 | 0.45 | |||||
| 4 | 26 | 4.04 | 4.06 | 133.08 | 0.65 | 0.64 | |||
| 5 | 5 | 5.20 | 75.63 | 0.57 | |||||
| 6 | 1 | 5.00 | 34.03 | 0.45 | |||||
| 7 | 1 | 1.00 | 17.87 | 0.53 | |||||
| Total | 2823 | Total | 1836.36 | ||||||
| Suswa | 1 | 864 | 421.07 | 1.02 | 0.70 | ||||
| 2 | 174 | 4.97 | 253.43 | 0.60 | |||||
| 3 | 40 | 4.35 | 5.13 | 127.3 | 0.81 | 0.50 | |||
| 4 | 12 | 3.33 | 48.56 | 0.38 | |||||
| 5 | 1 | 12.00 | 8.54 | 0.18 | |||||
| 6 | 1 | 1.00 | 24.22 | 2.84 | |||||
| Total | 1092 | Total | 883.12 | ||||||
| Watershed | Basin Area (km2) | Perimeter (km) | Basin Length (km) | Form Factor (Ff) | Elongation Ratio (Re) | Circularity Ratio (Rc) | Drainage Density (Dd) (km/km2) | Stream Frequency (Fs) | Texture Ratio (Rt) | Drainage Texture (Td) | Compactness Coefficient (Cc) |
|---|---|---|---|---|---|---|---|---|---|---|---|
| Asan | 701.15 | 137.35 | 43 | 0.38 | 0.70 | 0.47 | 2.86 | 3.73 | 14.58 | 10.67 | 1.46 |
| Song | 729.51 | 169.19 | 50.35 | 0.29 | 0.61 | 0.32 | 2.52 | 3.87 | 12.99 | 9.74 | 1.77 |
| Suswa | 310.98 | 122.45 | 40.50 | 0.19 | 0.49 | 0.26 | 2.84 | 3.51 | 7.06 | 9.97 | 1.96 |
| Watershed | Height of Basin Mouth (h), m | Maximum Height of Basin (H), m | Basin Relief (Rb), m | Relief Ratio (Rr) |
|---|---|---|---|---|
| Asan | 390 | 2218 | 1828 | 42.51 |
| Song | 303 | 2764 | 2461 | 48.88 |
| Suswa | 405 | 2278 | 1873 | 46.25 |
| Watershed | Mean Bifurcation Ratio (Rbm) | Drainage Density (Dd) | Drainage Texture (Td) | Form Factor (Ff) | Elongation Ratio (Re) | Circularity Ratio (Rc) | Stream Frequency (Fs) | Texture Ratio (Rt) | Length of Overland Flow (Lo) | Compactness Coefficient (Cc) | Relief Ratio (Rr) | Sinuosity Index | Compound Factor Value (CFV) | Priority |
|---|---|---|---|---|---|---|---|---|---|---|---|---|---|---|
| Asan | 1 | 1 | 1 | 3 | 3 | 3 | 2 | 3 | 1 | 3 | 3 | 1 | 2.08 | Medium |
| Song | 3 | 3 | 3 | 2 | 2 | 2 | 1 | 2 | 3 | 2 | 1 | 2 | 2.17 | Low |
| Suswa | 2 | 2 | 2 | 1 | 1 | 1 | 3 | 1 | 2 | 1 | 2 | 3 | 1.75 | High |
| Morphometric Parameter | Mean Bifurcation Ratio (Rbm) | Drainage Density (Dd) | Drainage Texture (Td) | Form Factor (Ff) | Elongation Ratio (Re) | Circularity Ratio (Rc) | Stream Frequency (Fs) | Texture Ratio (Rt) | Length of Overland Flow (Lo) | Compactness Coefficient (Cc) | Relief Ratio (Rr) | Sinuosity Index (SI) |
|---|---|---|---|---|---|---|---|---|---|---|---|---|
| Mean Bifurcation Ratio (Rbm) | 1 | 1 | 1 | −0.5 | −0.5 | −0.5 | −0.5 | −0.5 | 1 | −0.5 | −1 | 0.5 |
| Drainage Density (Dd) | 1 | 1 | 1 | −0.5 | −0.5 | −0.5 | −0.5 | −0.5 | 1 | −0.5 | −1 | 0.5 |
| Drainage Texture (Td) | 1 | 1 | 1 | −0.5 | −0.5 | −0.5 | −0.5 | −0.5 | 1 | −0.5 | −1 | 0.5 |
| Form Factor (Ff) | −0.5 | −0.5 | −0.5 | 1 | 1 | 1 | −0.5 | 1 | −0.5 | 1 | 0.5 | −1 |
| Elongation Ratio (Re) | −0.5 | −0.5 | −0.5 | 1 | 1 | 1 | −0.5 | 1 | −0.5 | 1 | 0.5 | −1 |
| Circularity Ratio (Rc) | −0.5 | −0.5 | −0.5 | 1 | 1 | 1 | −0.5 | 1 | −0.5 | 1 | 0.5 | −1 |
| Stream Frequency (Fs) | −0.5 | −0.5 | −0.5 | −0.5 | −0.5 | −0.5 | 1 | −0.5 | −0.5 | −0.5 | 0.5 | 0.5 |
| Texture Ratio (Rt) | −0.5 | −0.5 | −0.5 | 1 | 1 | 1 | −0.5 | 1 | −0.5 | 1 | 0.5 | −1 |
| Length of Overland Flow (Lo) | 1 | 1 | 1 | −0.5 | −0.5 | −0.5 | −0.5 | −0.5 | 1 | −0.5 | −1 | 0.5 |
| Compactness Coefficient (Cc) | −0.5 | −0.5 | −0.5 | 1 | 1 | 1 | −0.5 | 1 | −0.5 | 1 | 0.5 | −1 |
| Relief Ratio (Rr) | −1 | −1 | −1 | 0.5 | 0.5 | 0.5 | 0.5 | 0.5 | −1 | 0.5 | 1 | −0.5 |
| Sinuosity Index (SI) | 0.5 | 0.5 | 0.5 | −1 | −1 | −1 | 0.5 | −1 | 0.5 | −1 | −0.5 | 1 |
Disclaimer/Publisher’s Note: The statements, opinions and data contained in all publications are solely those of the individual author(s) and contributor(s) and not of MDPI and/or the editor(s). MDPI and/or the editor(s) disclaim responsibility for any injury to people or property resulting from any ideas, methods, instructions or products referred to in the content. |
© 2025 by the authors. Licensee MDPI, Basel, Switzerland. This article is an open access article distributed under the terms and conditions of the Creative Commons Attribution (CC BY) license (https://creativecommons.org/licenses/by/4.0/).
Share and Cite
Mani, A.; Badola, R.; Kumari, M.; Mishra, V.N.; Thamaga, K.H.; Hasher, F.F.B.; Zhran, M. Watershed Prioritization with Respect to Flood Susceptibility in the Indian Himalayan Region (IHR) Using Geospatial Techniques for Sustainable Water Resource Management. Water 2025, 17, 2039. https://doi.org/10.3390/w17132039
Mani A, Badola R, Kumari M, Mishra VN, Thamaga KH, Hasher FFB, Zhran M. Watershed Prioritization with Respect to Flood Susceptibility in the Indian Himalayan Region (IHR) Using Geospatial Techniques for Sustainable Water Resource Management. Water. 2025; 17(13):2039. https://doi.org/10.3390/w17132039
Chicago/Turabian StyleMani, Ashish, Ruchi Badola, Maya Kumari, Varun Narayan Mishra, Kgabo Humphrey Thamaga, Fahdah Falah Ben Hasher, and Mohamed Zhran. 2025. "Watershed Prioritization with Respect to Flood Susceptibility in the Indian Himalayan Region (IHR) Using Geospatial Techniques for Sustainable Water Resource Management" Water 17, no. 13: 2039. https://doi.org/10.3390/w17132039
APA StyleMani, A., Badola, R., Kumari, M., Mishra, V. N., Thamaga, K. H., Hasher, F. F. B., & Zhran, M. (2025). Watershed Prioritization with Respect to Flood Susceptibility in the Indian Himalayan Region (IHR) Using Geospatial Techniques for Sustainable Water Resource Management. Water, 17(13), 2039. https://doi.org/10.3390/w17132039