1. Introduction
Recently, the confluence of climate change and urbanization, involving concentrated population growth and an increase in impervious surfaces in urban areas, has brought about significant shifts in water circulation. This transformation in urban areas has led to a substantial alteration in the hydrological dynamics compared to historical patterns. The amount of rainfall infiltrating into the ground has decreased, and there is an increase in the runoff along the surface, disrupting the water cycle system. As a result, there is an increase in flood damage, difficulties in securing water resources, deterioration of river water quality, and exacerbation of groundwater depletion and riverbed degradation [
1,
2,
3,
4]. This necessitates a comprehensive examination of the implications of such changes for the urban water cycle. To address the issues arising from the distortion of water circulation due to urbanization and climate change, Low Impact Development (LID) techniques have been introduced for the improvement and sustainable management of water resources [
5,
6,
7]. LID techniques involve allowing rainfall to infiltrate, filter, and be stored in the ground, mimicking the water cycle system in its natural state. Instead of directly discharging rainwater, this method aims to preserve the characteristics of the existing area as much as possible. LID serves as an eco-friendly rainwater management technique that facilitates the sustainable maintenance of natural ecosystems, including rivers and the preservation of biodiversity. LID techniques have become a global focal point, and currently, there is substantial interest and implementation of LID techniques in South Korea, spearheaded by the Ministry of Environment. These techniques are actively applied in managing urban water circulation, controlling nonpoint source pollution, and handling rainwater, demonstrating their relevance in environmental initiatives [
8,
9,
10,
11,
12].
In Colombia as well, various problems have arisen due to the distortion of urban water circulation caused by climate change and urbanization [
13,
14,
15]. To address these issues, studies have been conducted to apply facilities for managing rainfall and runoff from watersheds, analyzing their effectiveness in mitigating the challenges posed by these distortions.
In the case of Bogotá, Colombia, the extensive and steep mountainous terrain poses the risk of additional natural disasters, such as landslides, when there is an increase in rainfall. Therefore, research is being conducted to develop measures to address and respond to such occurrences [
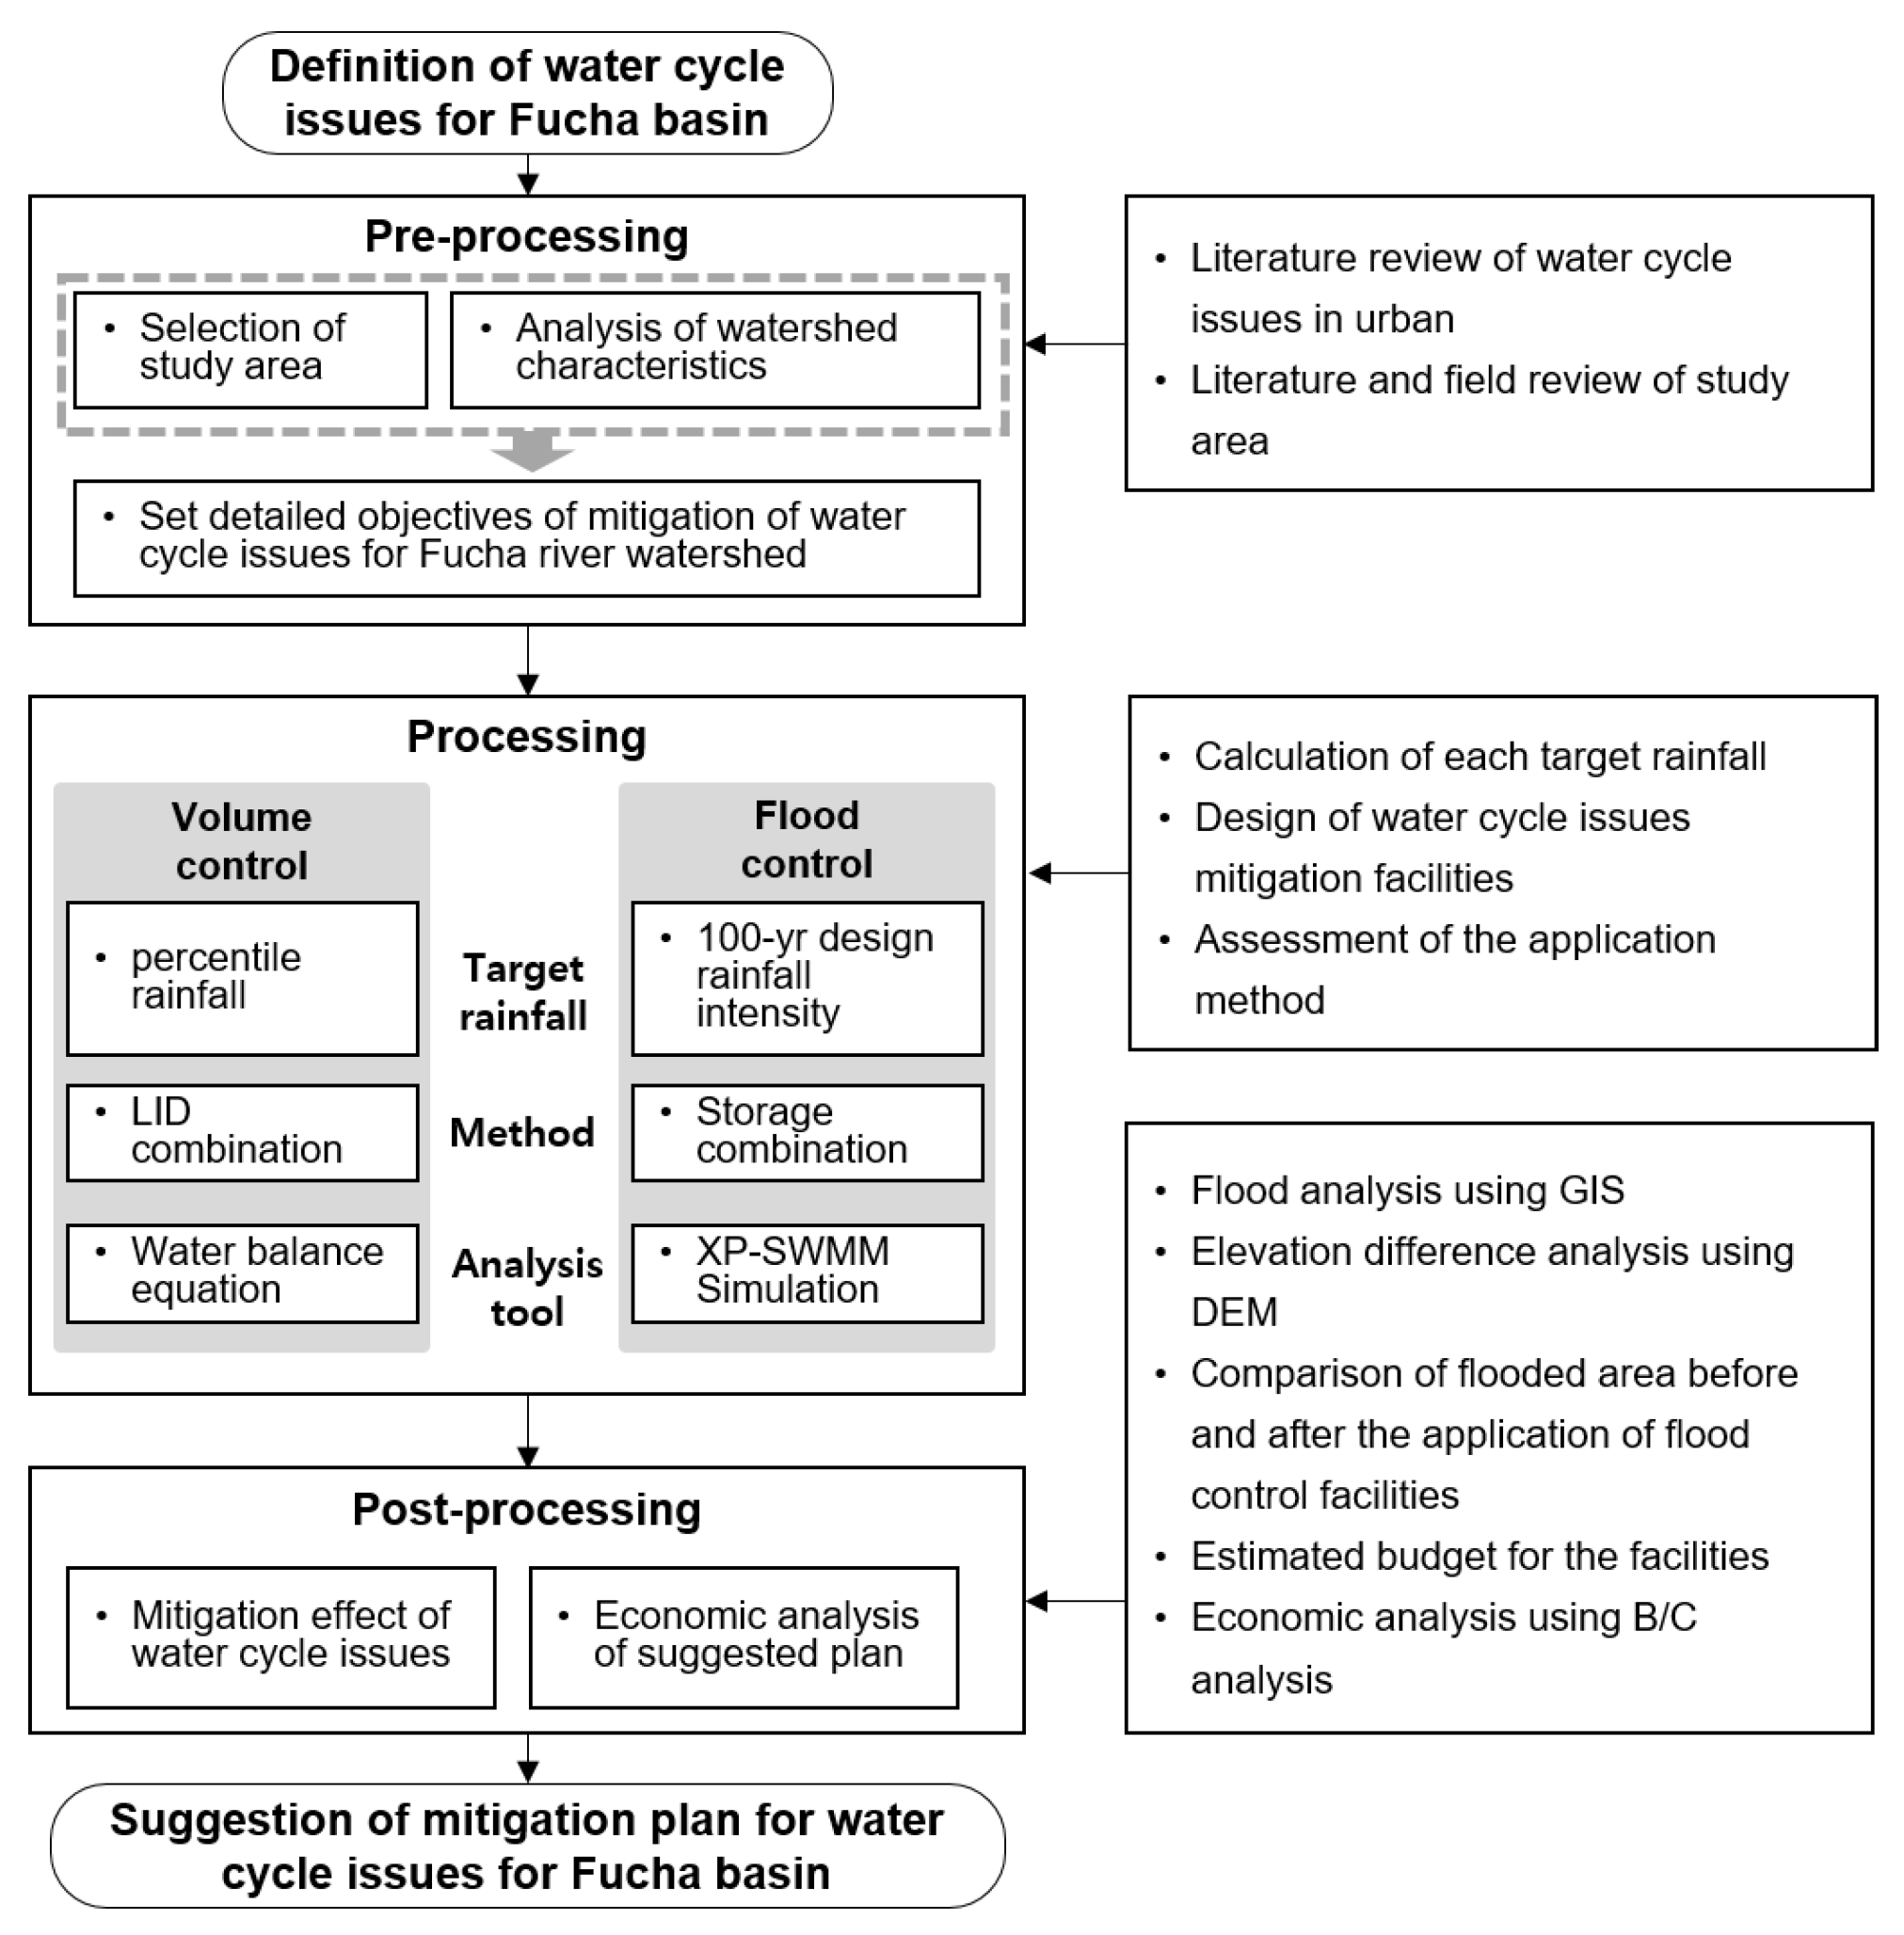
16]. To solve the water circulation issues arising from densely populated areas and steep terrain around cities such as Bogotá, Colombia, the following steps can be taken; (1) analysis of watershed characteristics, (2) establishing a concept for defining and solving water circulation issues, (3) setting goals for controlling rainwater and floods, (4) selection of applicable locations and planning for scales, and (5) assessing the effects of technique implementation. In addition, for the practical implementation of the established plan, it is necessary to provide information on the budget and benefits associated with the project. This study aims to perform the design and effect analysis of water cycle improvement measures for climate adaptation in and population increase Bogotá, Colombia, including an economic analysis to facilitate the actualization of the proposed plans (
Figure 1).
2. Materials and Methods
2.1. Study Area
The upper basin of the Fucha river in Bogotá, Colombia is an area facing distorted water cycle issues and a growing need for water resource management due to climate change and urbanization. In order to prioritize areas where water management measures can be applied, the watershed was divided. The delineation of sub-watershed boundaries within urban areas was acoomplished using stormwater pipelines, canals, and topographic data. Data provided by EAAB and DATOS ABIETOS COLOMBIA (
http://datos.gov.co), as well as MAPAS BOGOTÁ (
https://mapas.bogota.gov.co), was utilized for this research. The Fucha river has five tributaries, comprising a total of 20 sub-watersheds. While most sub-watersheds have an area within 4
, the upper sub-watershed of the Fucha river mountainous region (FC_A8 in the
Figure 2) has an area of
. Considering on-site investigations and facility location conditions, the research scope was set for the upper reaches of the Fucha river, specifically targeting the FC_A5 to FC_A8. FC_A5 and FC_A6, which include urban areas, were prioritized for the application of flood defense facilities and LID facilities in those regions. To introduce LID facilities and detention in the designated area and quantitatively analyze the resulting effects, the area was segmented into 64 channels and 5 zones using the sewage system and watershed data in Bogotá. In addition, it is planned to prioritize the implementation of LID facilities at the currently inactive Vitelma plant (afterward, Vitelma). This place is included in Zone 2.
Table 1 indicates the area of the full extent of the land within the school boundary, park, and road where LID facilities or flood control facilities can be prioritized by zone.
2.2. Target Rainfall Criteria and Management Concepts for Addressing Water Cycle Issues
Two approaches can be applied for addressing the changing water circulation issues occasioned by climate change in Bogotá, Colombia. First, an approach that involves managing standard rainfall events to promote the healthy improvement of the watershed’s water cycle structure. Another approach is to address the increased precipitation, caused by climate change, that leads to flooding. It is necessary to define rainfall criteria tailored to each specific objective because establishing target rainfall criteria that simultaneously deal with both approaches is impractical. The target rainfall mentioned above refers to the design rainfall criterion used to determine the capacity of water management facilities installed within the watershed to address urban water circulation issues [
17].
2.2.1. Volume Control (Healthy Water Cycle)
Various target rainfall criteria exist to deal with water cycle issues arising from climate change and urbanization. Typically, target rainfall, which is used for designing the capacity of water management facilities, includes rainfall that is 90 percent or more of the total 24 h rainfall event for the year, an arbitrary 2.54
rainfall, a 1-year frequency 24 h rainfall event, or rainfall that is 80 to 95 percent of the 24 h rainfall event [
18,
19,
20]. In the case of Sejong Happy City in South Korea, the rainwater management goals and the scale of rainwater management facilities were established based on the analysis of percentiles of rainfall data over the past 10 years, considering changes in runoff volumes ( 445,539
) by urbanization [
21]. In addition, Gwangju city in South Korea established a water circulation management target of 15
per rainfall event based on the analysis of rainfall runoff with an impermeable area ratio of 25% for 10, 15 and 20
rainfall events [
22]. Ulsan city in South Korea set the water circulation management target at 25
per rainfall event and
at the 85th percentile, considering the water quality management and improvement of water circulation effects through percentile analysis of 30 years of daily and hourly rainfall data [
23].
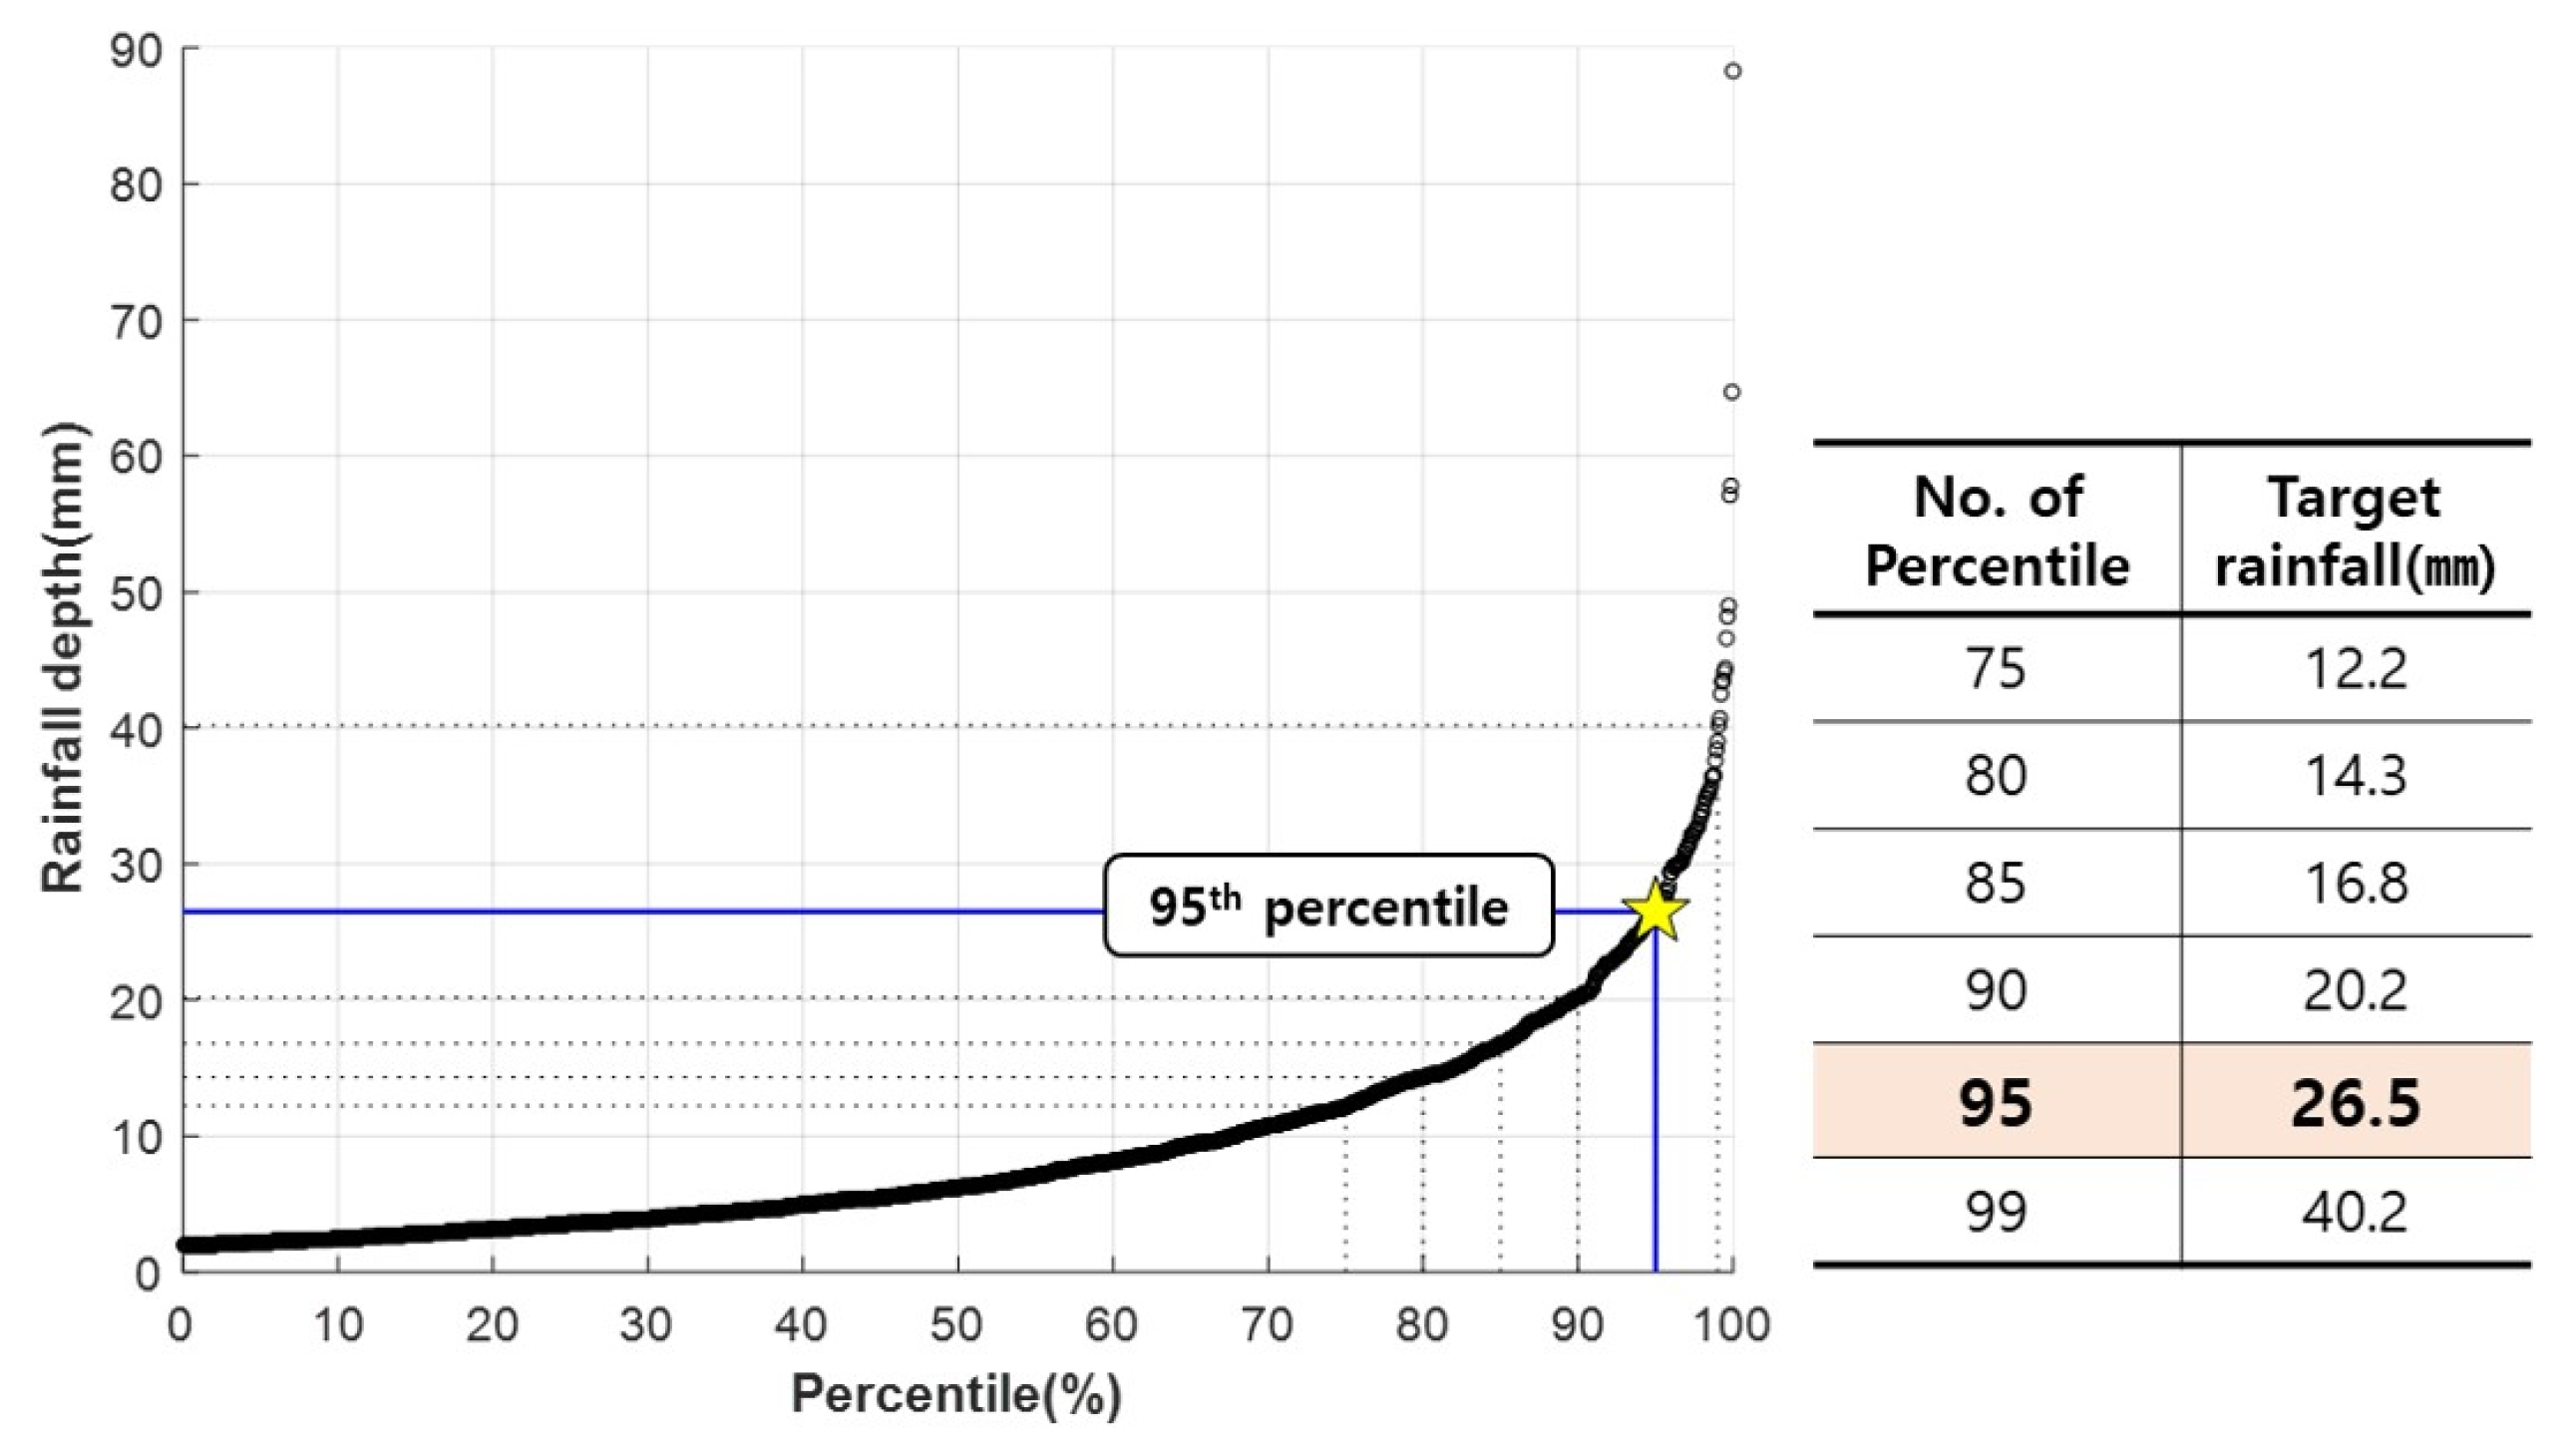
This study aimed to utilize percentile rainfall analysis to establish target rainfall for improving water circulation, considering the rainfall characteristics of the study area. Through a review of previous studies, it was confirmed that for water quality management and non-point source pollution control, the target rainfall is set at 80–85th percentile, and 85–90th percentile rainfall is used for improving the urban water cycle [
18,
19,
24]. In this study, the target rainfall criterion set at the 95th percentile to actively manage water resources in watershed. In other words, it refers to a rainfall criterion for water circulation management, aiming to handle all rainfall events, excluding the top 5%, through LID facilities. The rainfall percentile analysis for Bogotá, Colombia utilized the daily rainfall data from the observation station RIO SAN CRISTOBAL for the last 10 years (2013–2022) in order to reflect the recent climate change trends in the city. The rainfall amount corresponding to the 95th percentile was analyzed to be
(
Figure 3).
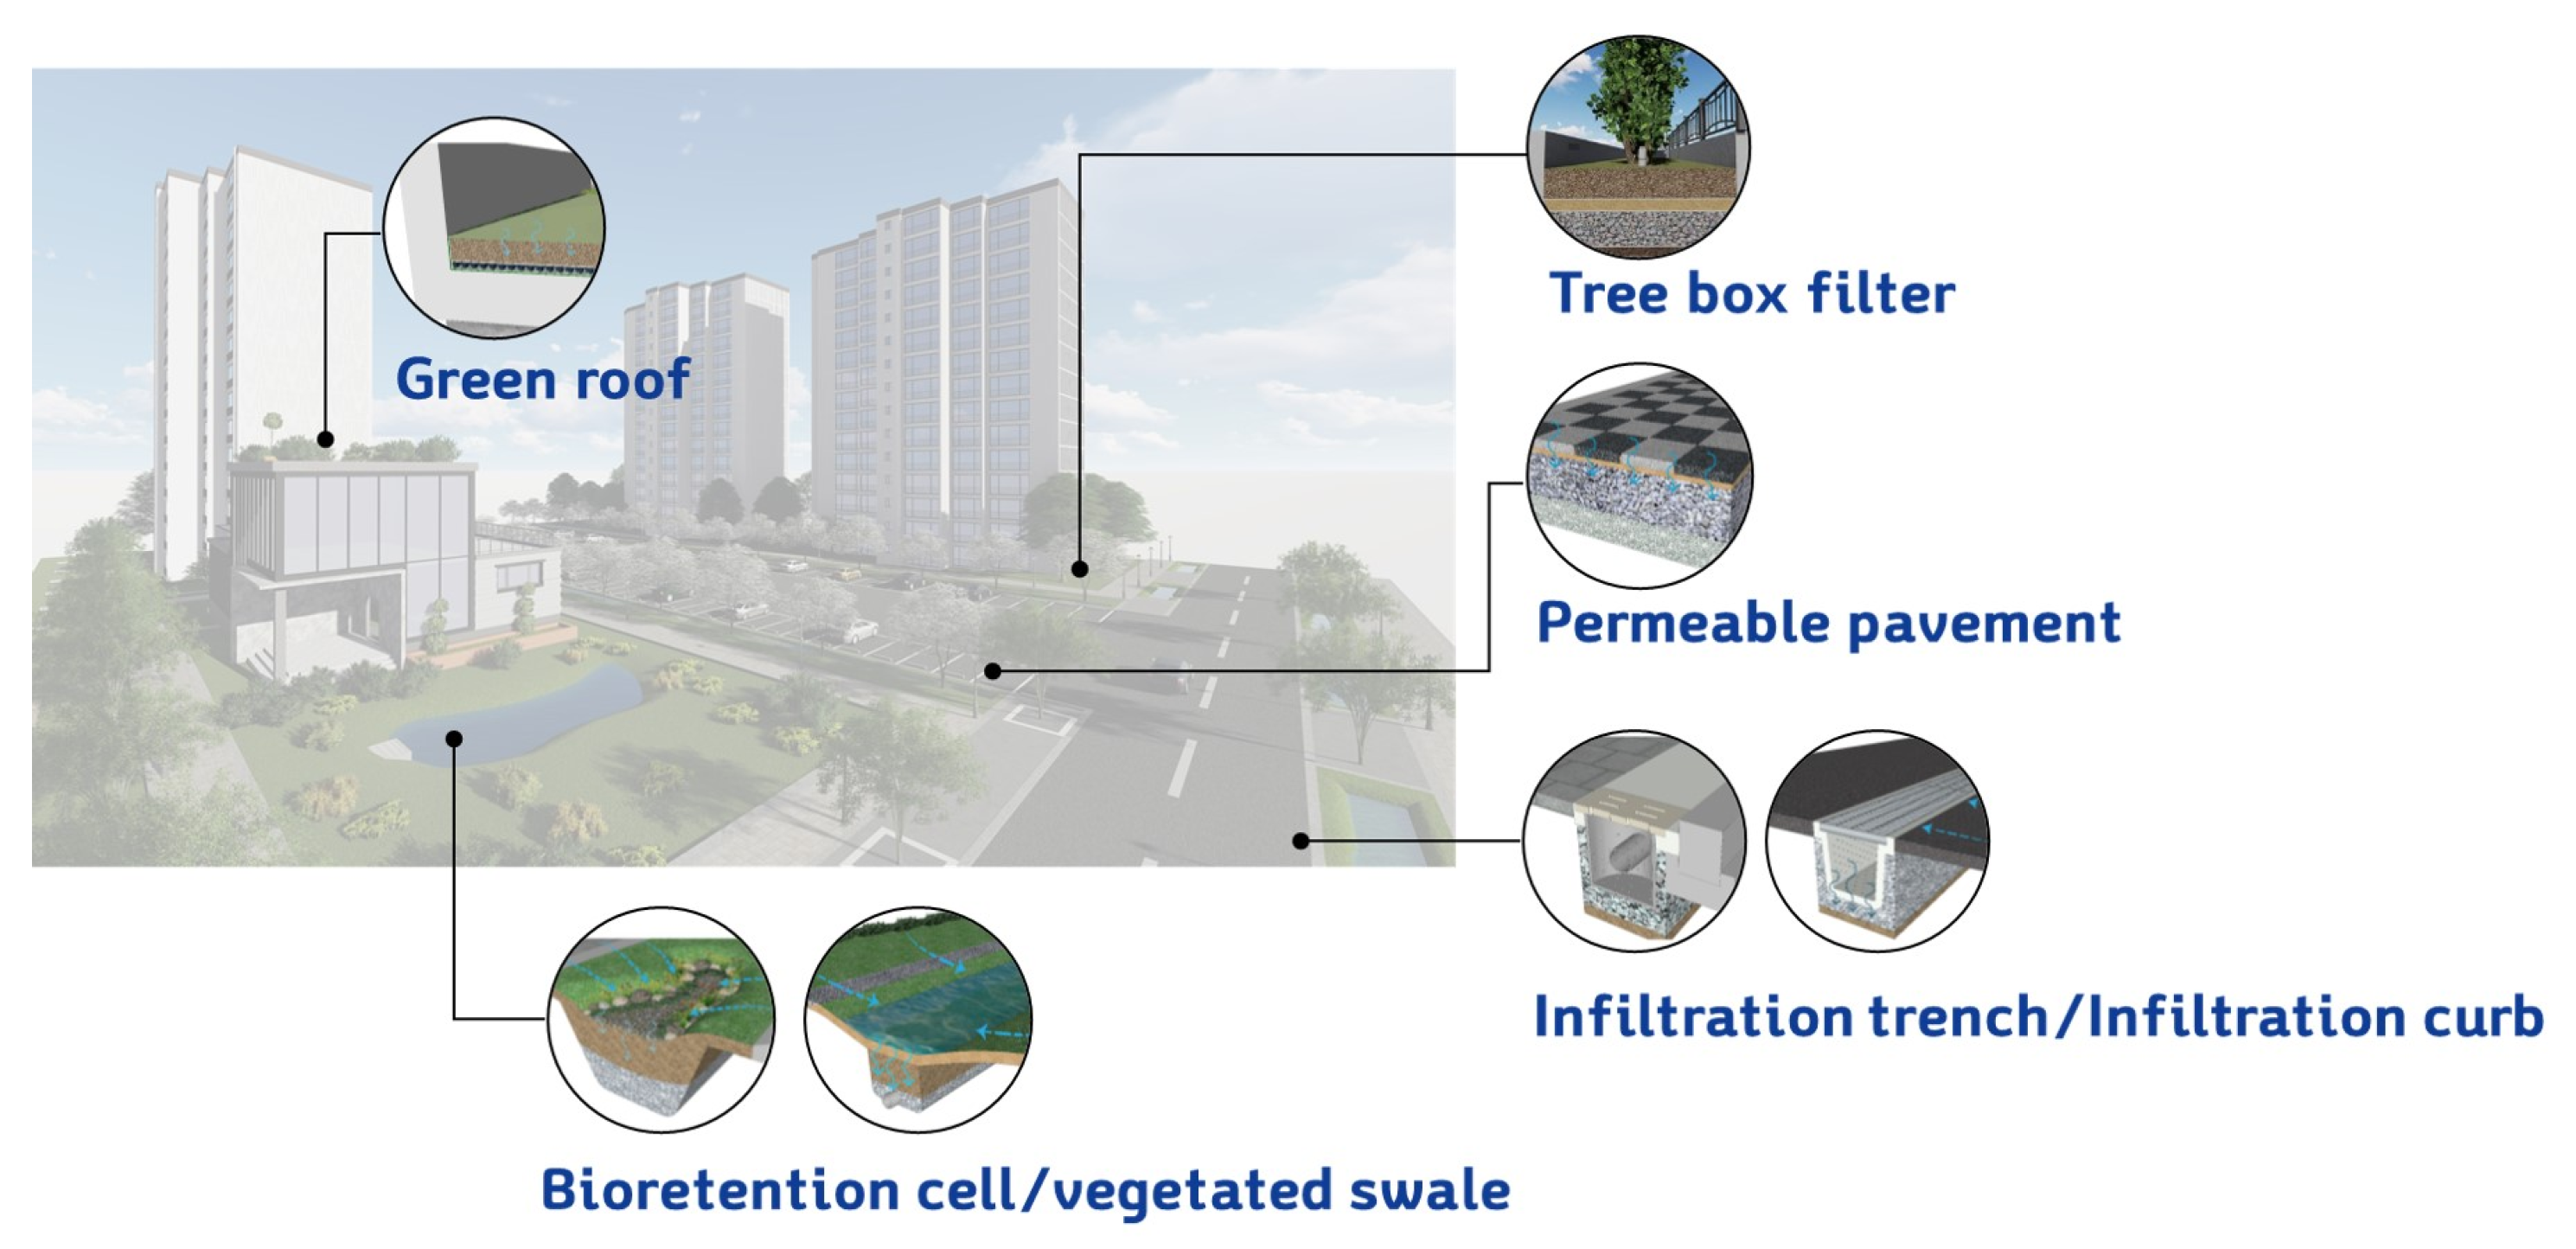
It is necessary to apply appropriate LID facilities based on land use in densely populated urban areas with concentrated infrastructure. In densely populated urban areas with concentrated infrastructure, various types of LID facilities can be applied in different locations, as illustrated in
Figure 4. Green roofs are ecological garden systems installed on building rooftops that help reduce stormwater runoff and manage pollutants through detention and evapotranspiration. Tree box fiters can be installed where street trees are located; these systems consist of containers planted with trees or large shrubs, and reduce stormwater pollutants through filtration in the planted soil media. Bioretention cells and vegetated swales are similar in function to tree box filters but include a wider range of vegetation, such as grasses, herbaceous plants, and trees. These facilities temporarily store runoff and allow infiltration into the underlying soil layers. Lately, structural facilities such as permeable pavements, infiltration trenches, and infiltration curbs have been designed to allow stormwater to infiltrate laterally or vertically into the subsurface. In this study, appropriate LID facility types were seleted for the target area by comprehensively considering their functional characteristics and site-specific applicability.
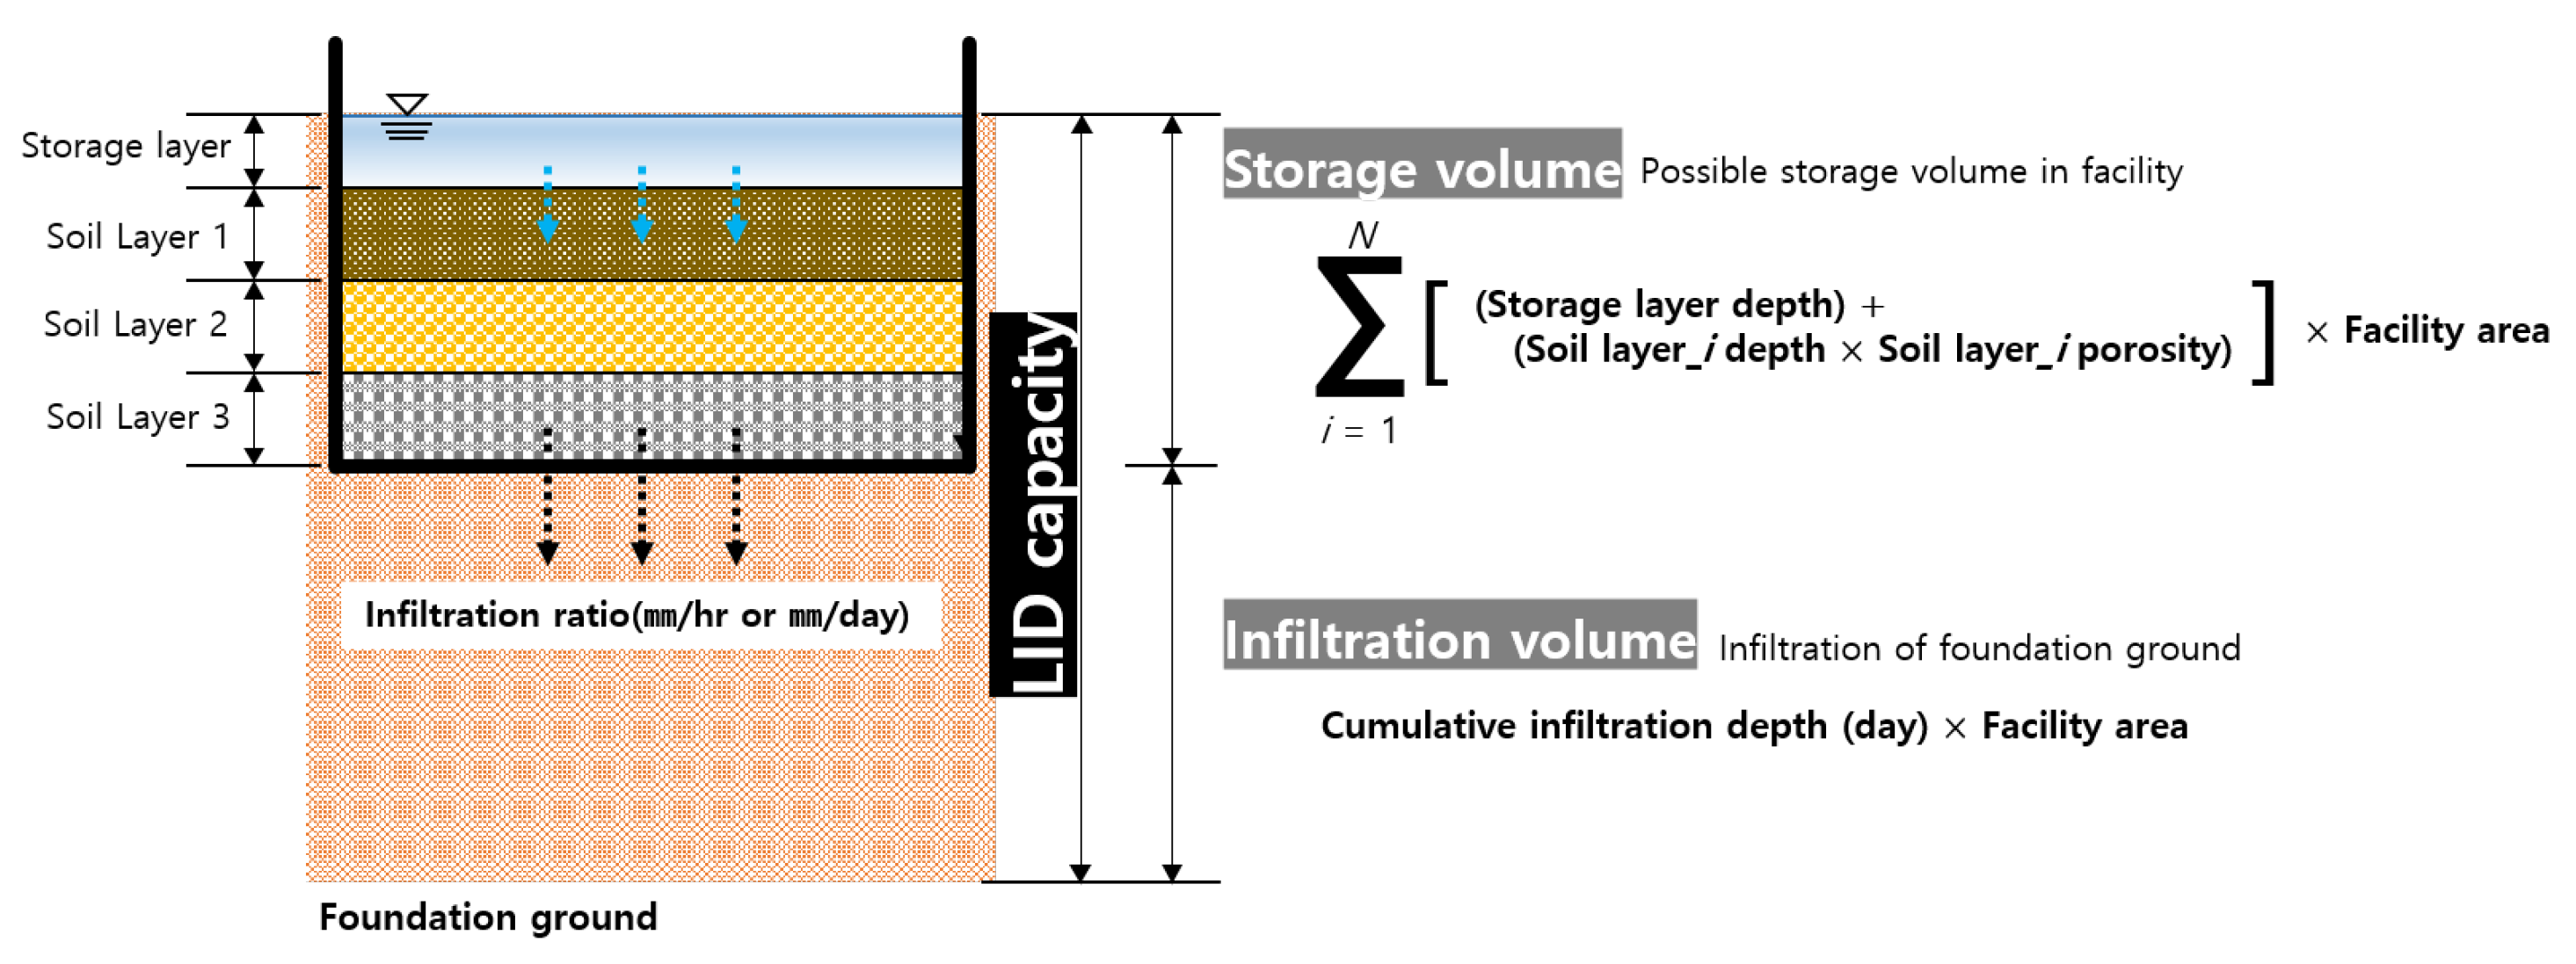
Based on the selected types of LID facilities, various types of LID facilities exist for urban water cycle management, and the rainwater management capacity of an LID facility is conceptually calculated as the sum of its storage volume and infiltration volume, as shown in
Figure 5. In this conceptual estimation of LID facility capacity, evaporation from the surface and storage layer is not considered. This is because the purpose of this analysis is to assess the potential volume of incoming rainfall that the facility can accommodate, rather than to model detailed hydrological processes such as drying or water loss through evaporation. To perform this calculation, information on the freeboard, soil layer depth, soil porosity, and native soil infiltration rate of the target area is required as shown in the
Table 2.
2.2.2. Flood Control
The design standards for hydraulic structures for flood control are based on hydrological design methods, which determine their required capacity. According to River Design Criteria and Commentary [
25] in South Korea, the design flood frequency varies depending on the function of the structure. For instance, reservoirs are designed based on a return period ranging from 50 years to the Standard Design Flood (SDF), spillways are designed to accommodate the Probable Maximum Flood (PMF), and levees are designed within a range from a 10-year return period to the standard design flood. These criteria serve as the minimum requirements to ensure adequate flood protection performance, reflecting the function and criticality of each structure. For the design of stormwater runoff reduction facilities for flood control in Bogotá, Colombia, the 25-year design frequency of the Fucha River could be used as a reference. However, considering environmental changes such as climate change, a 100-year return period was adopted as the target rainfall standard for flood control. Using the rainfall intensity equation for Bogotá (Equation (
1)), the IDF (Intensity–Duration–Frequency) was derived by applying the coefficient corresponding to the 100-year return period (
Table 3).
In this formula,
I signifies intenstiy
, and
D stands for Duration (min).
,
, and
are the coefficients of the IDF equation, and their values vary depending on the return period, as shown in
Table 3.
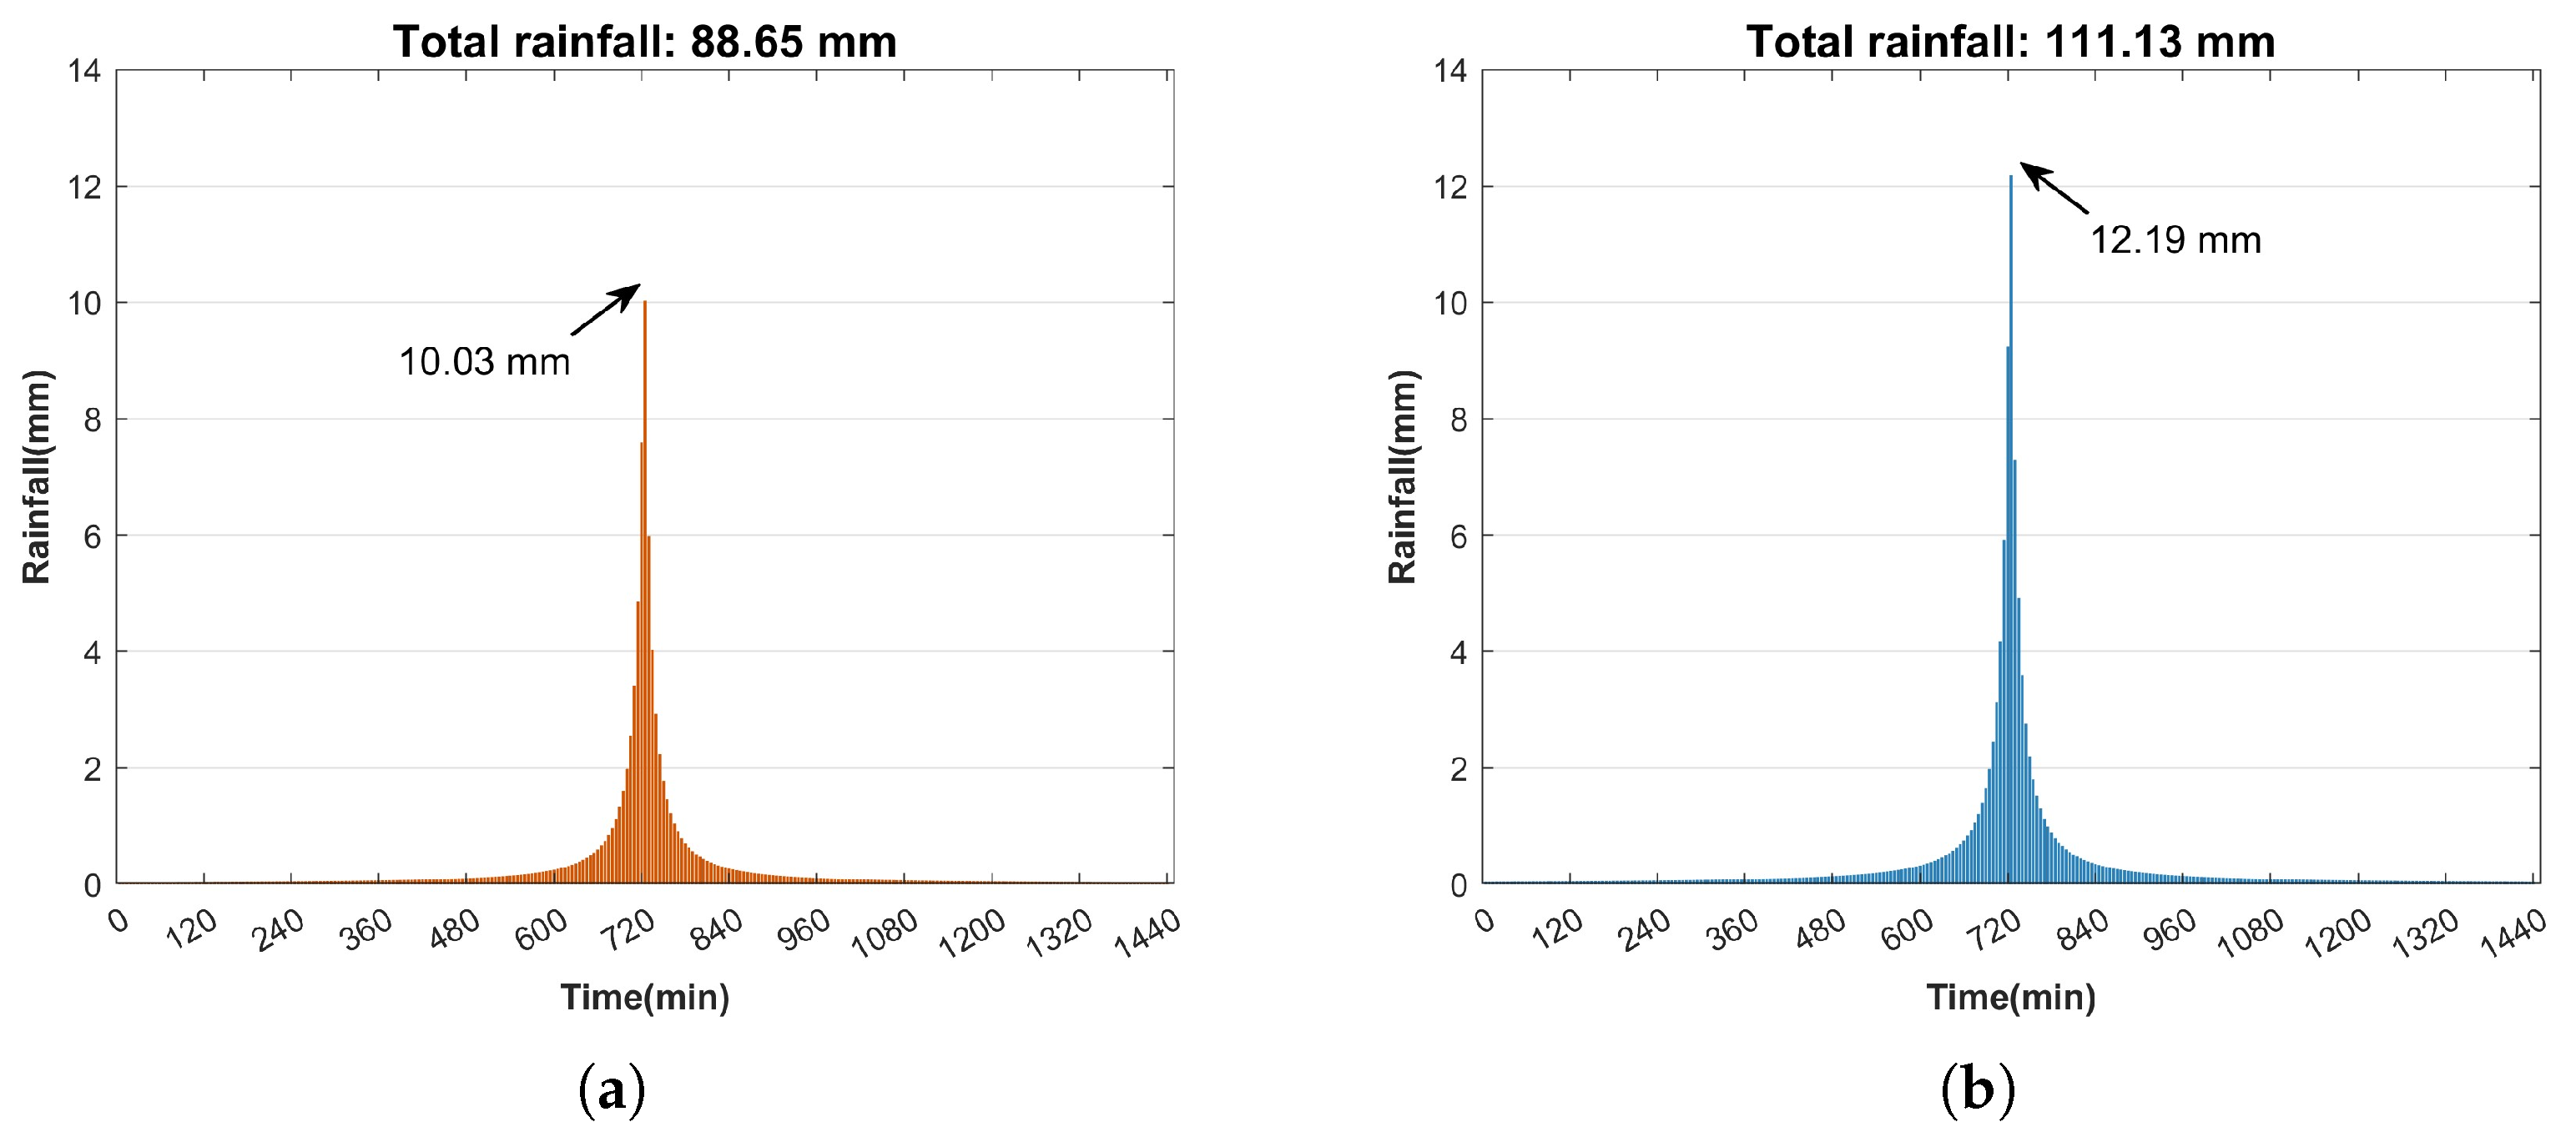
The design frequency for the Fucha river was set at a 25-year return period, but considering climate change, a 100-year, high-frequency return period was adopted as the target rainfall criterion for flood control. Subsequently, to analyze the temporal distribution of rainfall and the resulting changes in watershed–river flow, an Alternating Block Method (ABM) was applied to generate rainfall time series data at 5 min intervals (
Figure 6). The ABM is a technique for constructing design hyetographs using IDF curves or rainfall intensity equations [
26]. When generating hyetographs using this method, rainfall amounts are distributed over time based on maximum precipitation conditions for a given return period across all consecutive durations.
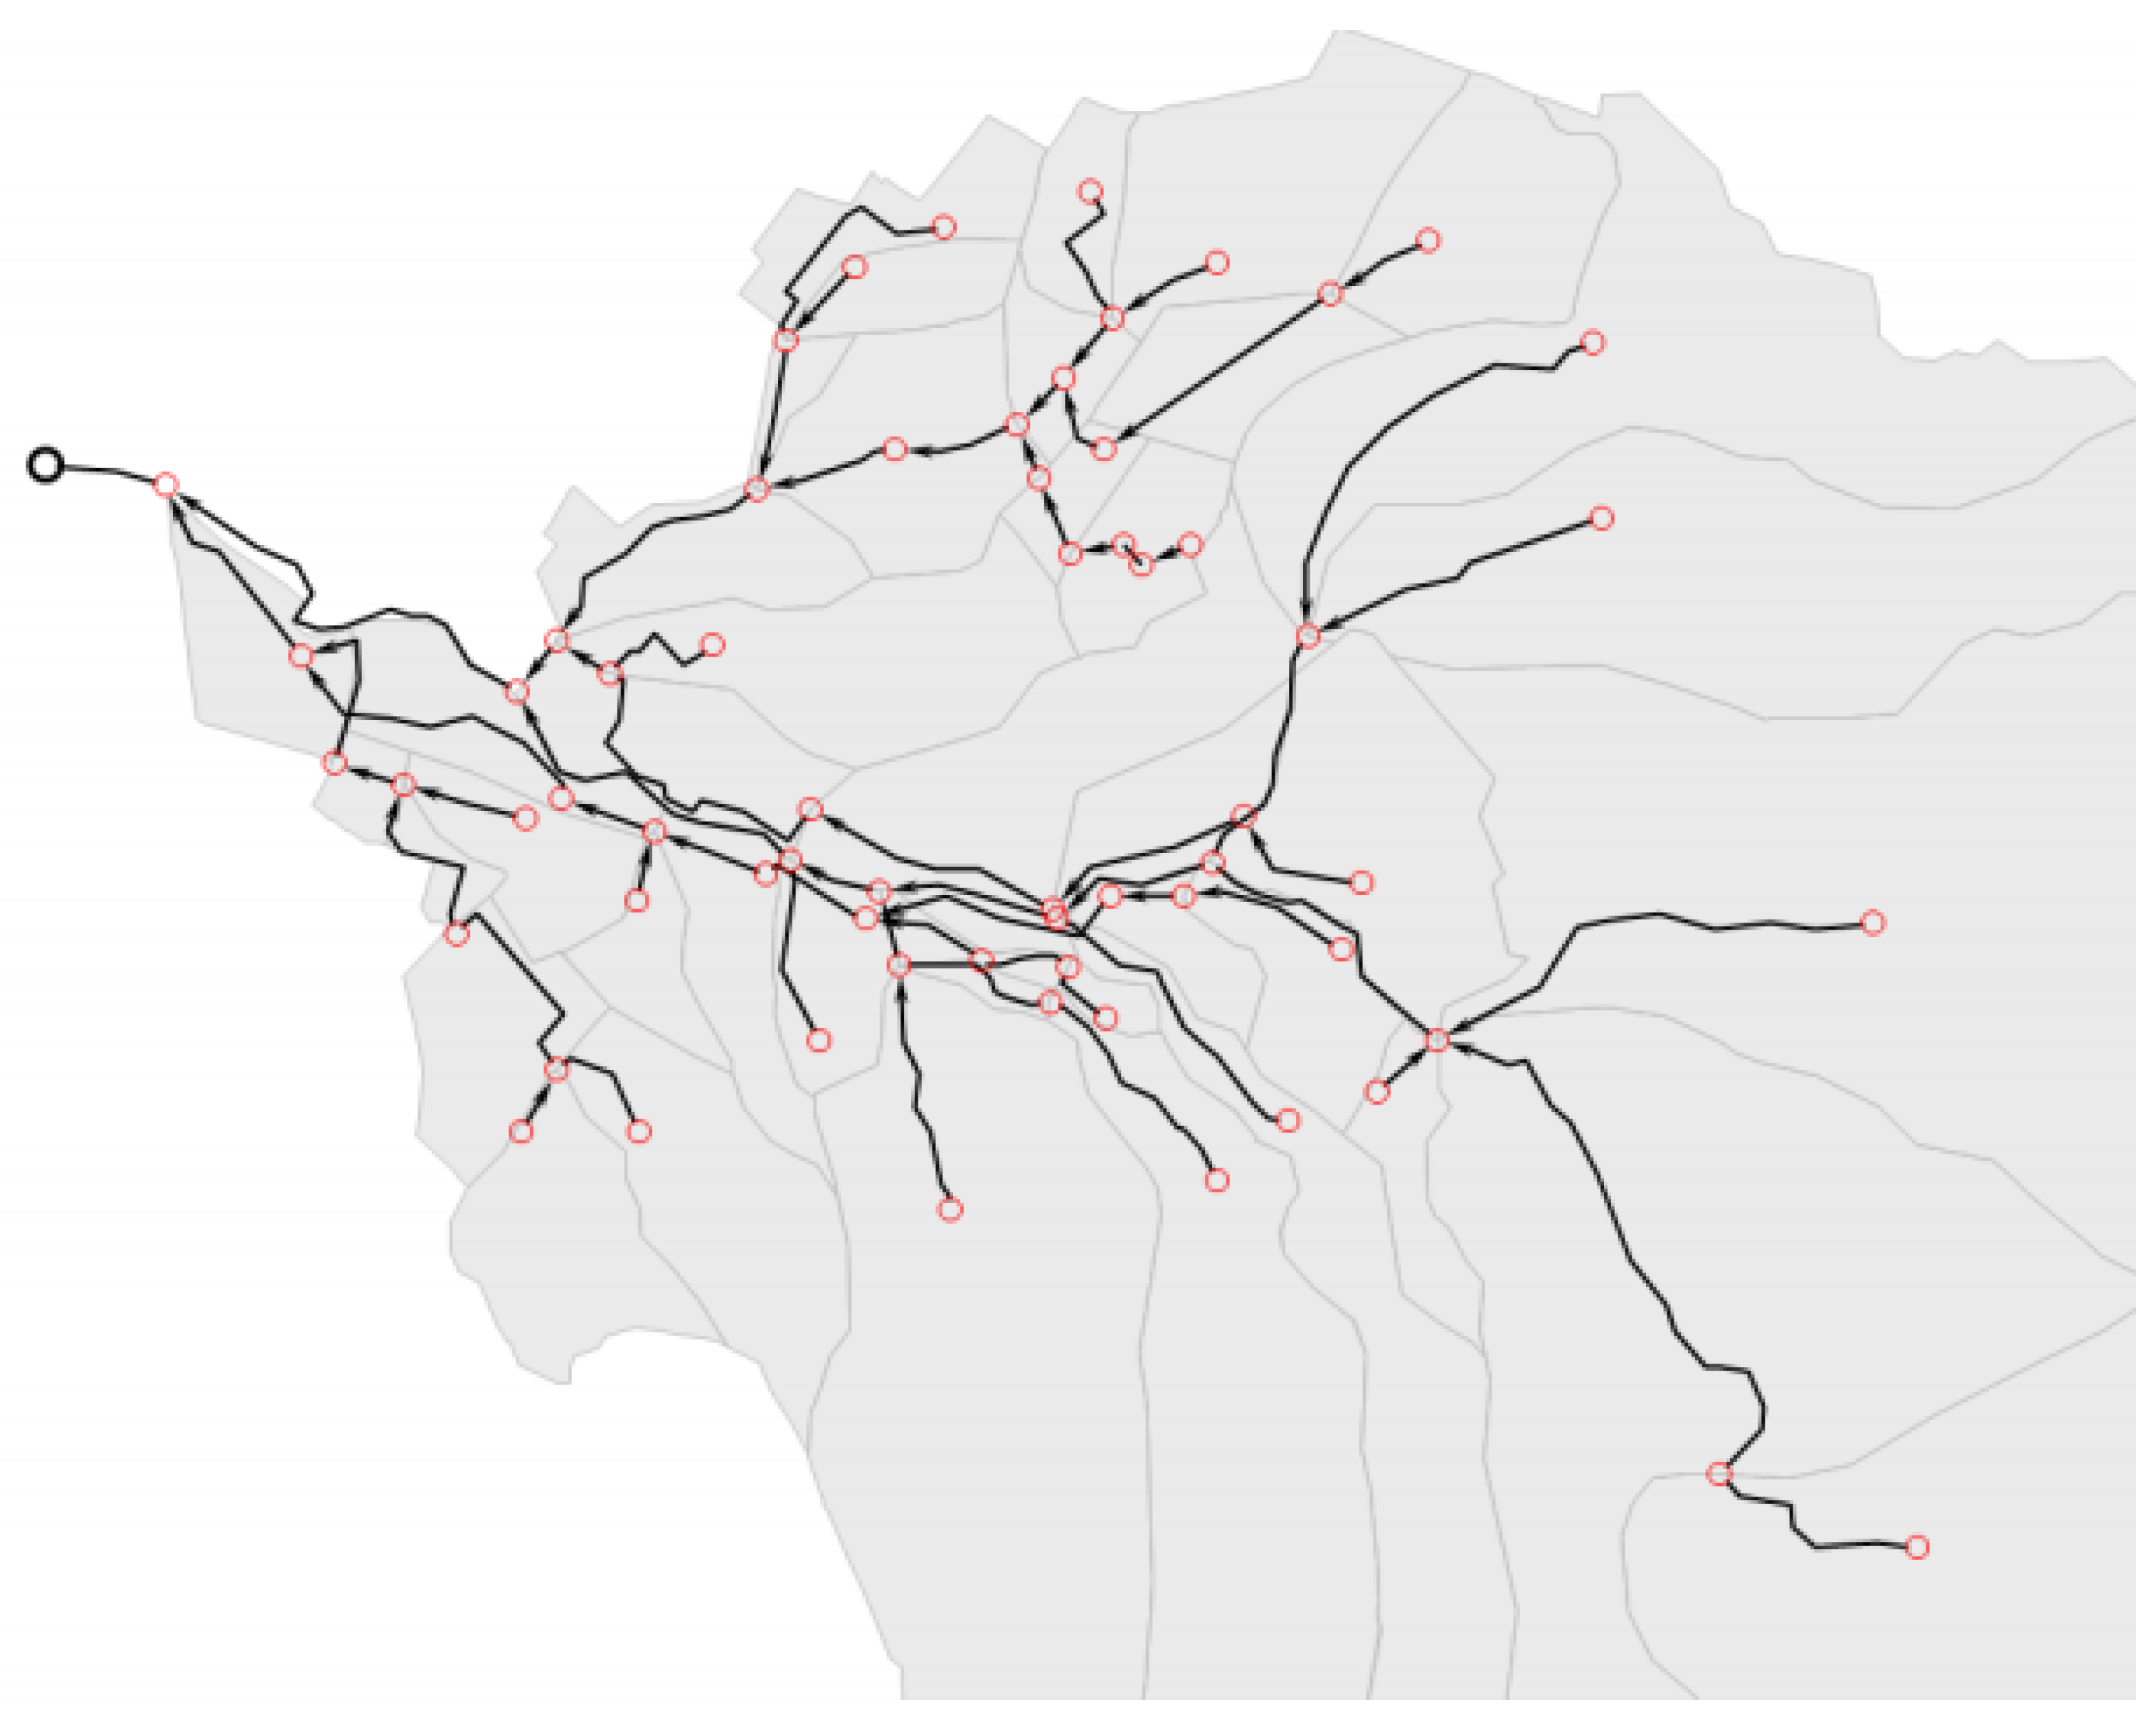
For flood control of the Fucha river, the design aimed to implement an off-line type, which is relatively efficient in terms of runoff reduction compared to the detention area. The off-line type of detention involves redirecting runoff to a detention based on water level when high water levels occur at urban control points. This method cuts the runoff from the watershed, reducing the peak runoff volume and, consequently, minimizing flood risks in urban areas during rainfall events. To mitigate flooding in the Fucha river, a plan was devised to add detention, including one in the Vitelma area and four additional places. The capacity of the Vitelma was determined using relevant drawings and on-site investigations. For other locations, suitable areas near riverbanks and public facilities were identified through field surveys and topographical studies to plan their respective capacities. To estimate the runoff volume in the target area and analyze the flood mitigation effects resulting from the application of detention basins, XP-SWMM was utilized. This model is based on the SWMM4 engine developed by the U.S. Environmental Protection Agency and is capable of time-based rainfall runoff simulations as well as hydrological and hydraulic computations. In addition, it supports various conduit network structures, making it a suitable model for simulating urban stormwater runoff. Accordingly, it has been widely used for urban runoff analysis in many applications.
Figure 7 shows the XP-SWMM model constructed for the study area.
2.3. Economic Analysis of Facility Implementation for Resolving Water Circulation Issues
It is essential to conduct an economic analysis to commercialize the implementation of facilities for healthy water circulation and flood control. This analysis is crucial for selecting the optimal solution by carefully weighing the costs and benefits associated with the application of these facilities. The economic analysis was conducted through a benefit–cost analysis. Given the difficulty of quantifying the benefits for adapting to climate change through the implementation of facilities for healthy water circulation and flood control, this study evaluated by adopting the economic analysis method for hydraulic projects proposed by the KDI [
27]. This method involves estimating costs, including construction expenses, project costs, and maintenance fees incurred by the implementation of facilities. It also considers various damages caused by flooding as benefits in conducting a benefit–cost analysis using Equation (
2):
Here, B represents benefits, and C represents costs. is the benefit in the k year from the year of commencement, is the cost in the k year from the year of commencement, n is the analysis period, and i is the discount rate. Costs are composed of construction expenses, annual project costs, and annual maintenance costs. Benefits are calculated through assessing damages caused by flooding. The damages caused by flooding were quantified by categorizing them into casualties, displaced individuals, crop losses, damage to public facilities, building and agricultural land damage, and other miscellaneous damages. The valuation of casualties, displaced individuals, and crop losses utilized the unit value method, while damage to buildings, agricultural land, public facilities, and other hard-to-define damages are estimated using damage functions based on the relationship between flooded area and damage cost. The current status data for Bogotá, Colombia, needed for the analysis, was utilized to the maximum extent possible. In cases where acquiring specific information was challenging, data interpolation was performed using available data from South Korea.
3. Results
3.1. Design and Analysis of Facilities for Healthy Water Cycle
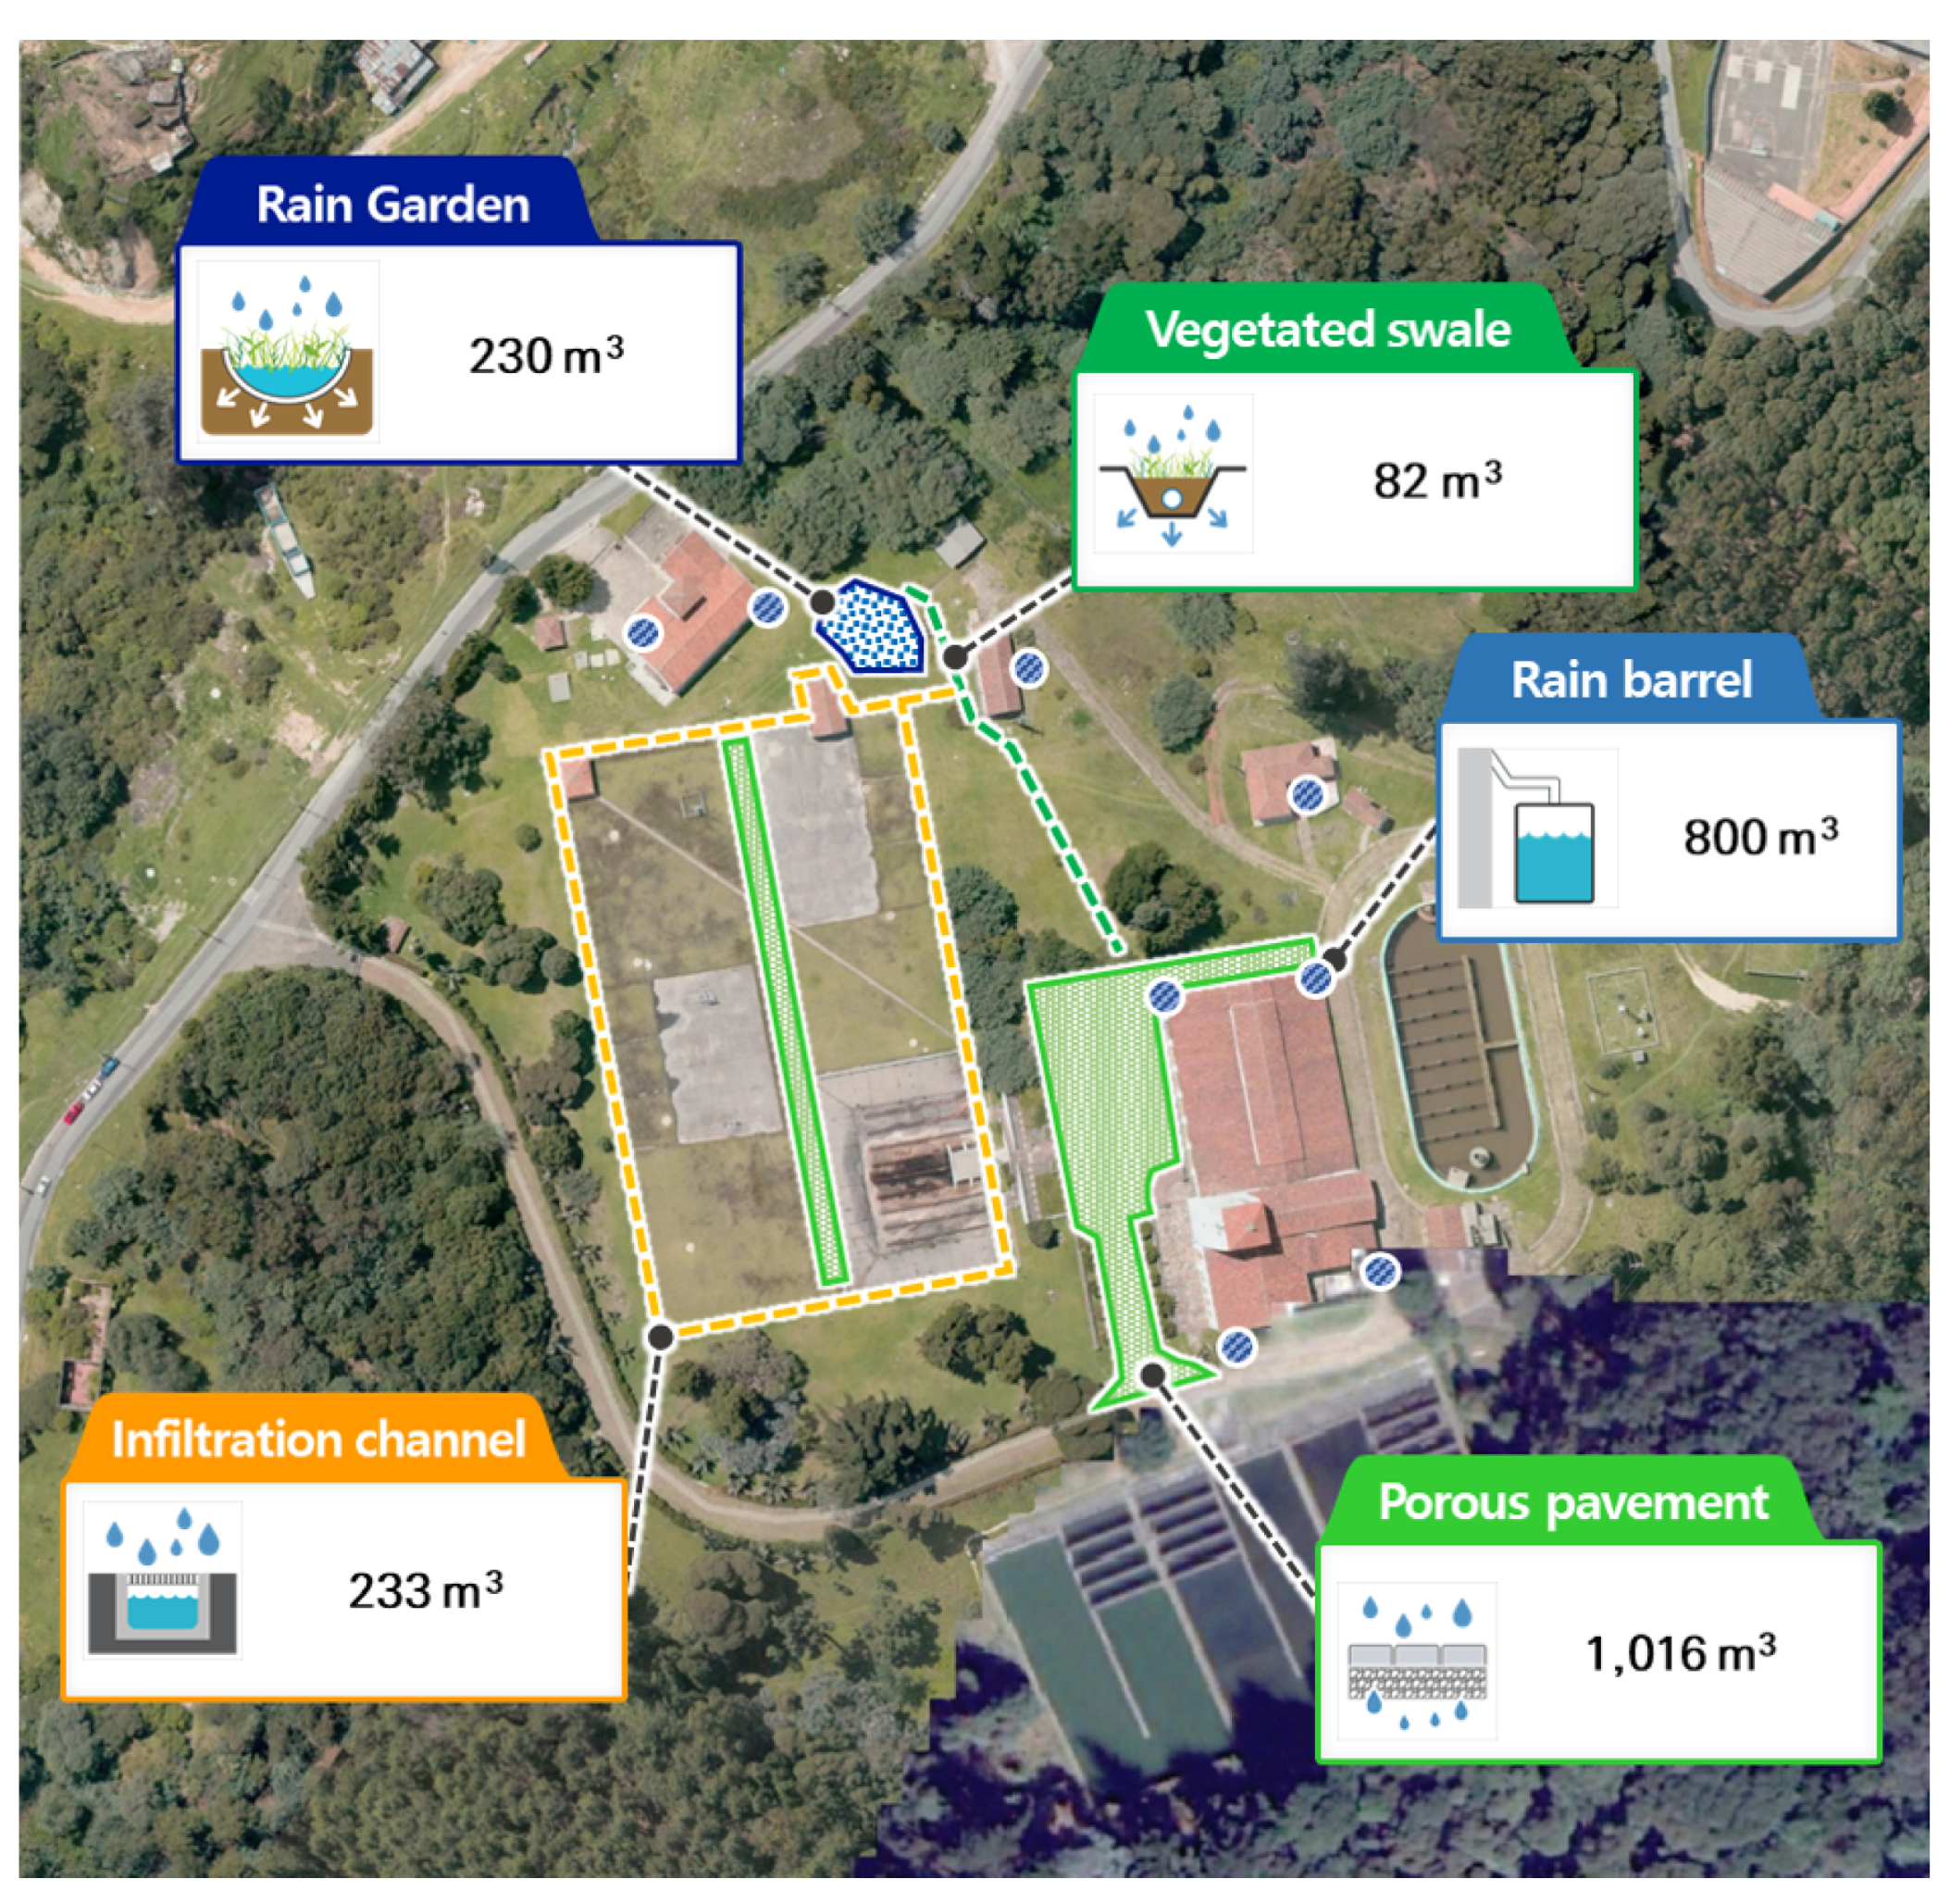
Based on the results of calculating the rainwater management target rainfall, the placement of applicable LID facilities and the determination of rainwater management capacity were carried out for Vitelma. Considering the land use of the target area, a plan for implementing LID was formulated. The proposed LID facilities for Vitelma include vegetated swale, rain garden (resembling bioretention), porous pavement, infiltration channel, and rain barrel for rainwater harvesting system. To establish a preliminary plan for the entire target area, assumed values for soil layer depth, freeboard, soil porosity, and infiltration rate of foundating ground were applied using
Table 2. The rainwater management capacity of LID facilities was calculated as the sum of detention volume and infiltration volume (Equation shown in
Figure 4). For the infiltration volume, a 24 h infiltration rate was considered. The rainfall management target for Bogotá is
, and the corresponding rainwater management target capacity is 2329
.
Table 4 summarizes the scale, storage capacity, infiltration, and rain management capcity for each LID application in the Vitelma region.
Figure 8 illustrates the layout plan for the deployment of LID in Vitelma.
The calculated rainfall management capacity of the applied LID facilities for achieveing the rain management target is 2362
, which exceeds the planned rain management target capacity of 2329
for the target area. The analysis indicates that the planned LID facilities are in accordance with the rainfall target and satisfy the set objectives. The evaluation results for achieving the rain management target have been summarized in
Table 5.
3.2. Design and Analysis of Facilities for Flooding Control
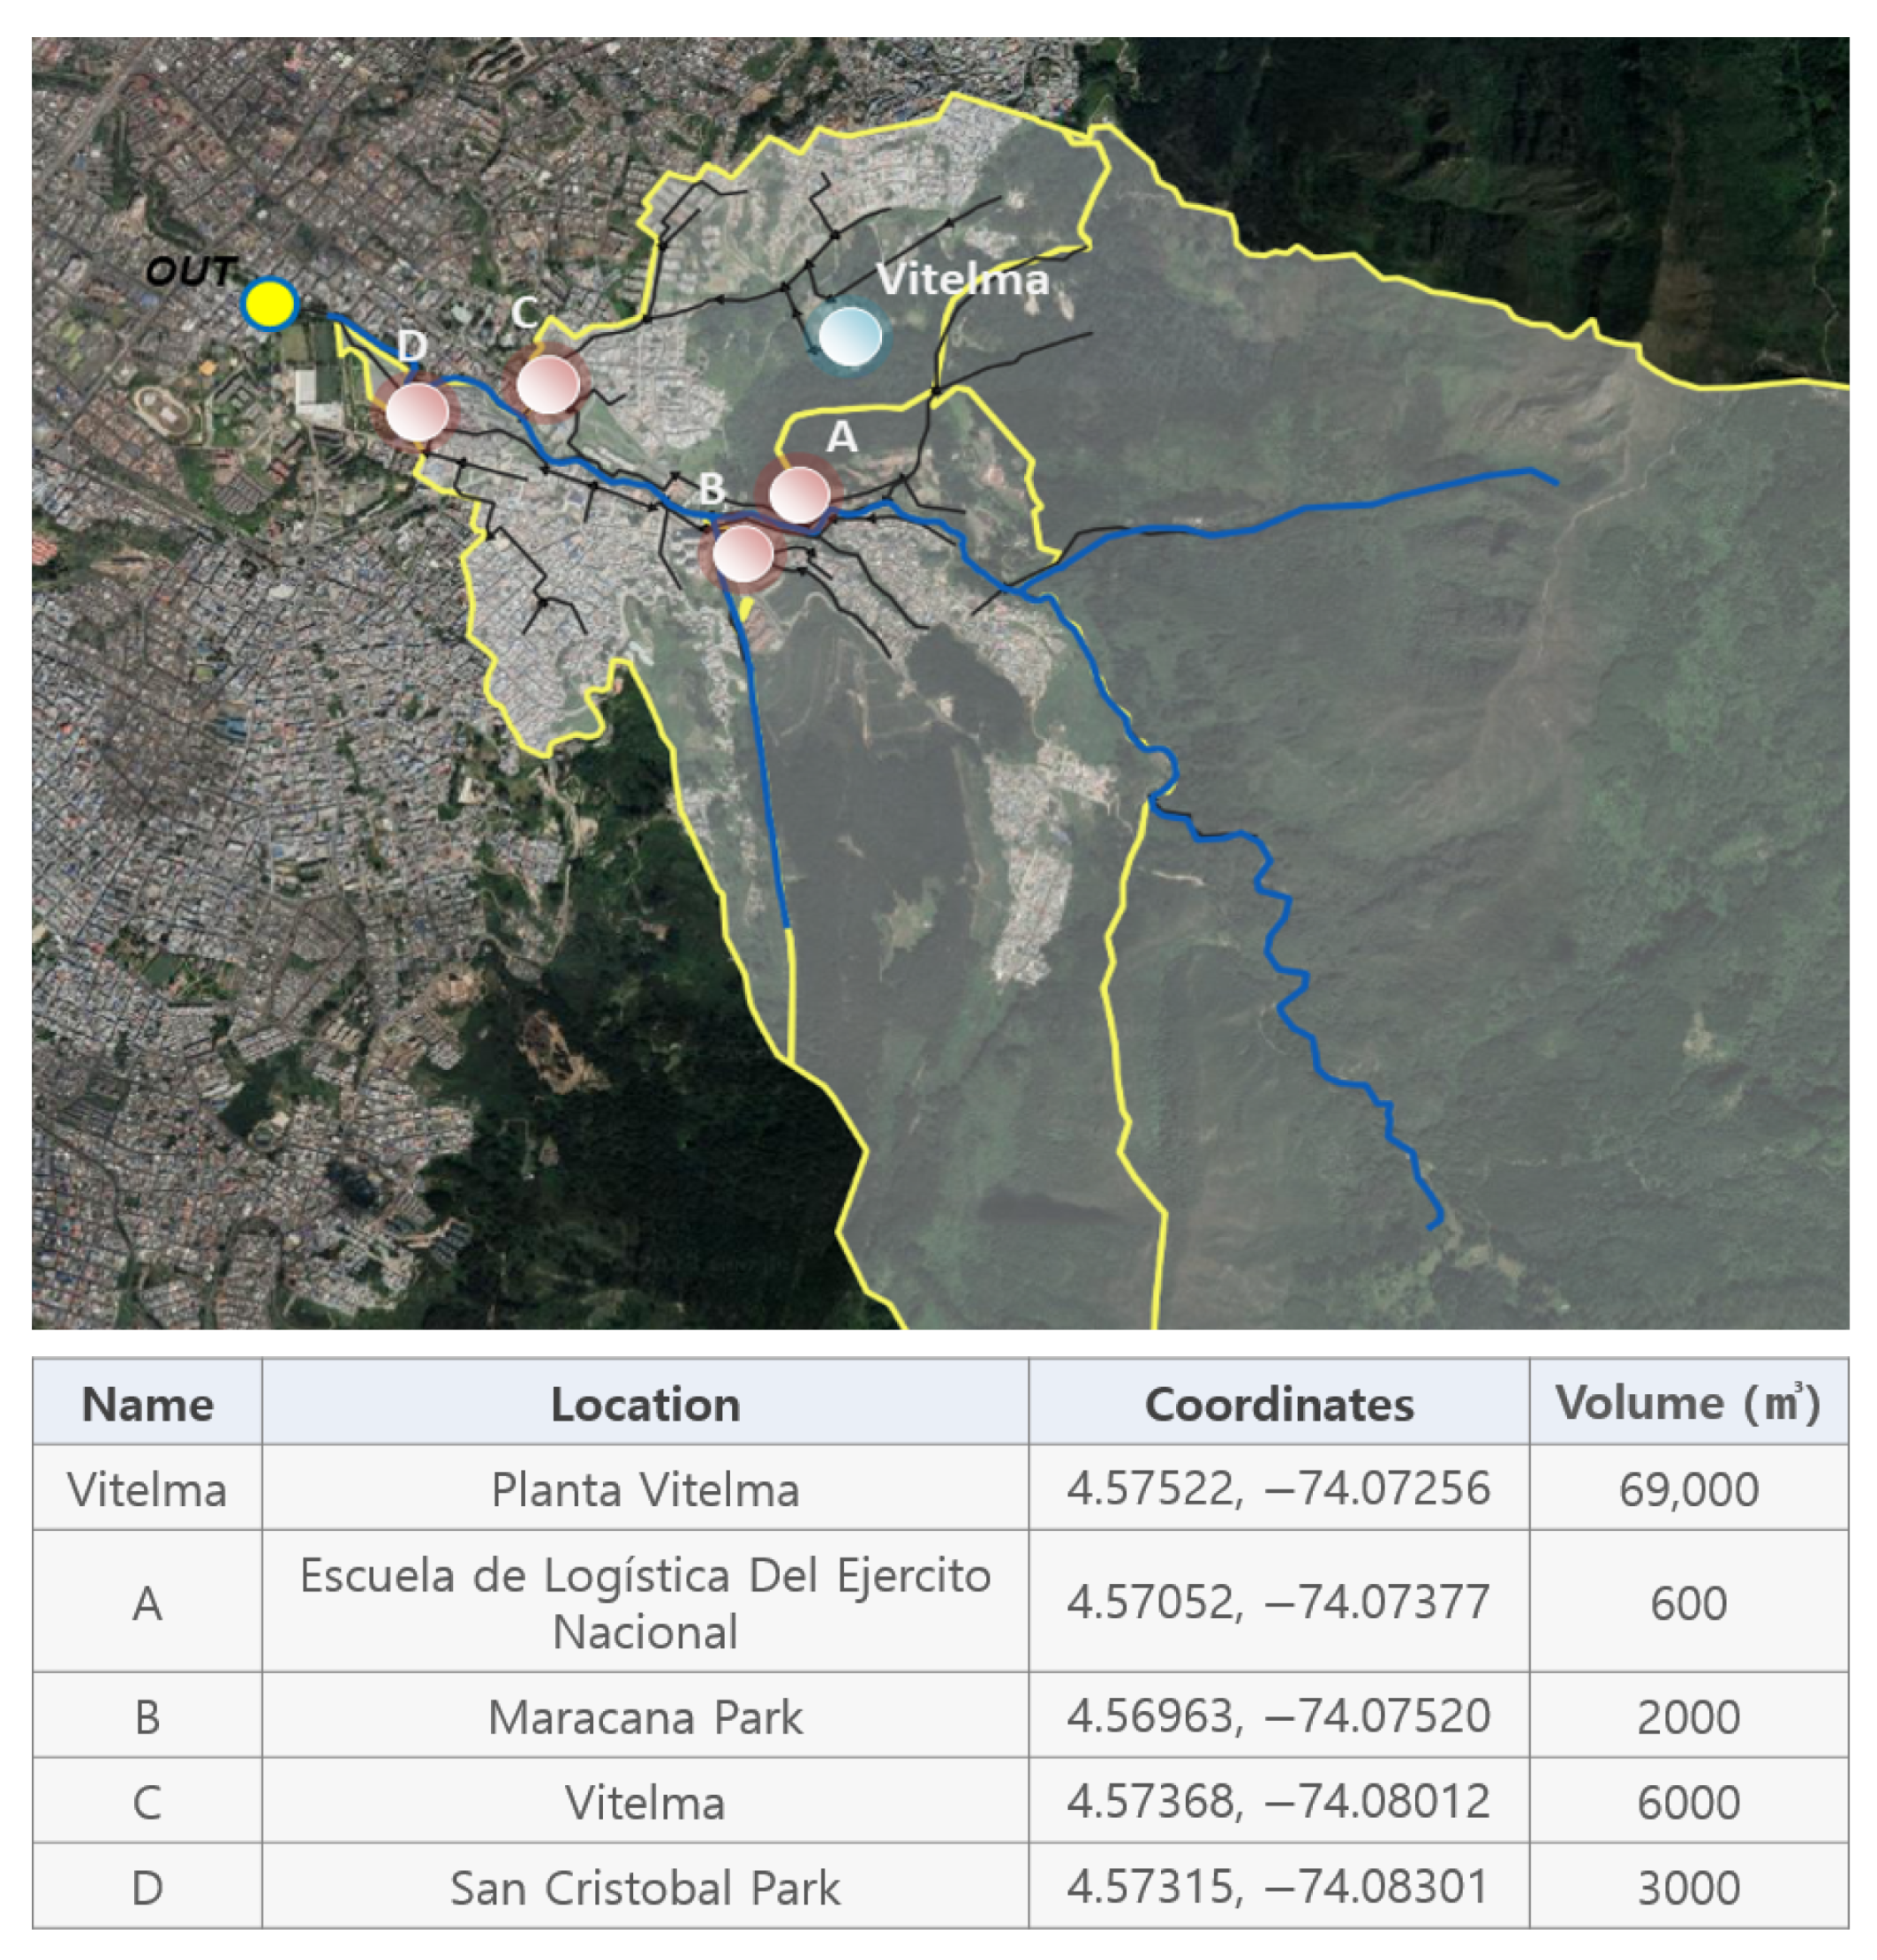
The effectiveness analysis of flood control facilities involved sequentially adding scenarios A to D after applying them to the Vitelma region.
Figure 9 shows their location. Vitelma is located in Planta Vitelma, and a detention tank with a volume of 69,000
can be installed there. The A detention, located at Esculea de Logística Del Ejercito nacional, has a total storage capacity of 600
. The B, C, and D detention tanks, which are to be installed in the park, have storage capacities of 2000, 6000, and 3000
, respectively.
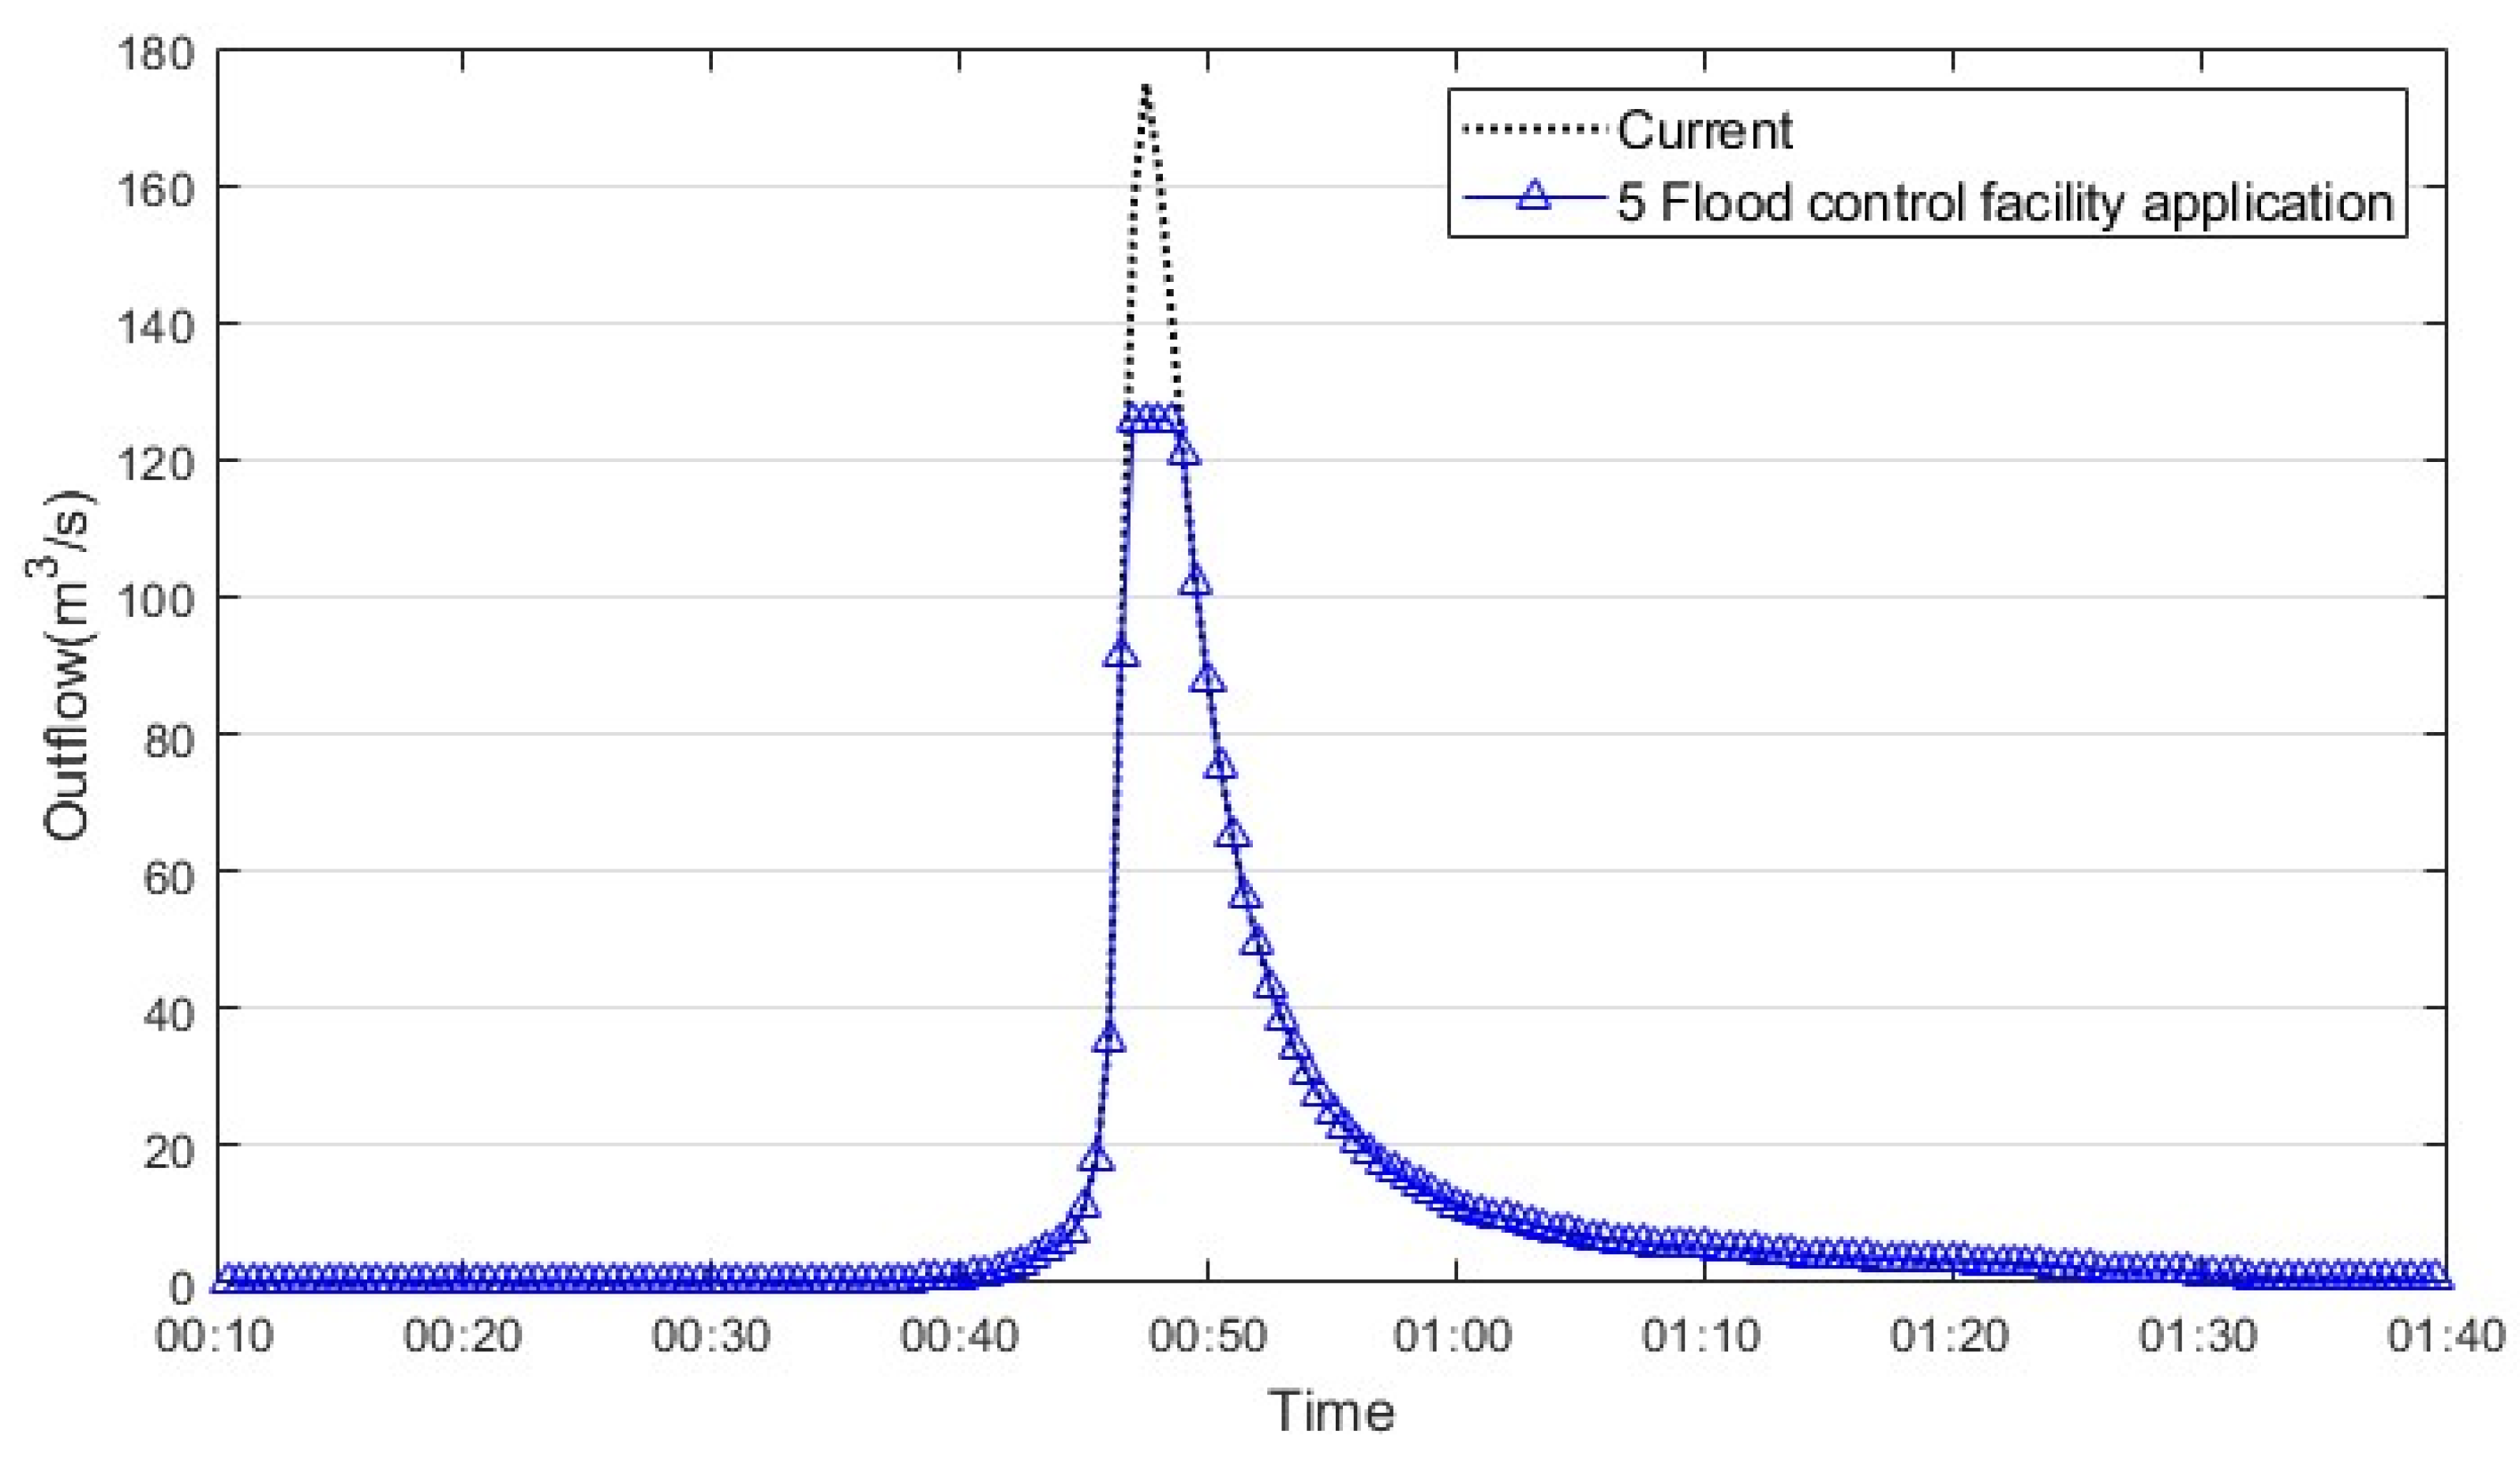
Applying all flood control facilities to the final outlet in the upper basin of the Fucha river, the analysis indicates that, compared to the pre-detention installation conditions, the peak flow is reduced by
, and the total discharge is reduced by 80,600
. In other words, the analysis indicates that the installation of detention results in a reduction of 7.3% in total discharge (
Table 6).
3.3. Benefit–Cost Analysis
3.3.1. Flood Reduction Effect
The target area of this study, the upper watershed of the Fucha river, is located in highland area, and it is expected that in the event of flooding, damage will occur in the downstream of watershed, which is the lowland area. Therefore, in order to understand the extent of the flooded area in the target watershed, the scope was expanded to include the downstream watershed, aiming to comprehend the overall flooding range. For this purpose, a comparison of the flow rates at different return periods (3, 5, 10, 25, 50, and 100 years) was conducted downstream of the Fucha river (
Table 7 and
Figure 10). Considering the natural channel capacity of the Fucha river itself, it was calculated that the flow up to the 25-year frequency would not cause flooding and would flow smoothly. Therefore, the analysis aimed to analyze the flood reduction effect of reservoirs using the flow rates, excluding the 25-year frequency from the 100-year frequency flow. When comparing the peak flow rates before and after the application of the five reservoirs, the peak flow rate before installation was
, which decreased to
after installation, confirming a reduction effect of 28.1%. The total discharge volume was 1,210,941
before the installation of the detention tanks, and after installation it decreased by 80,600
to 1,130,341
.
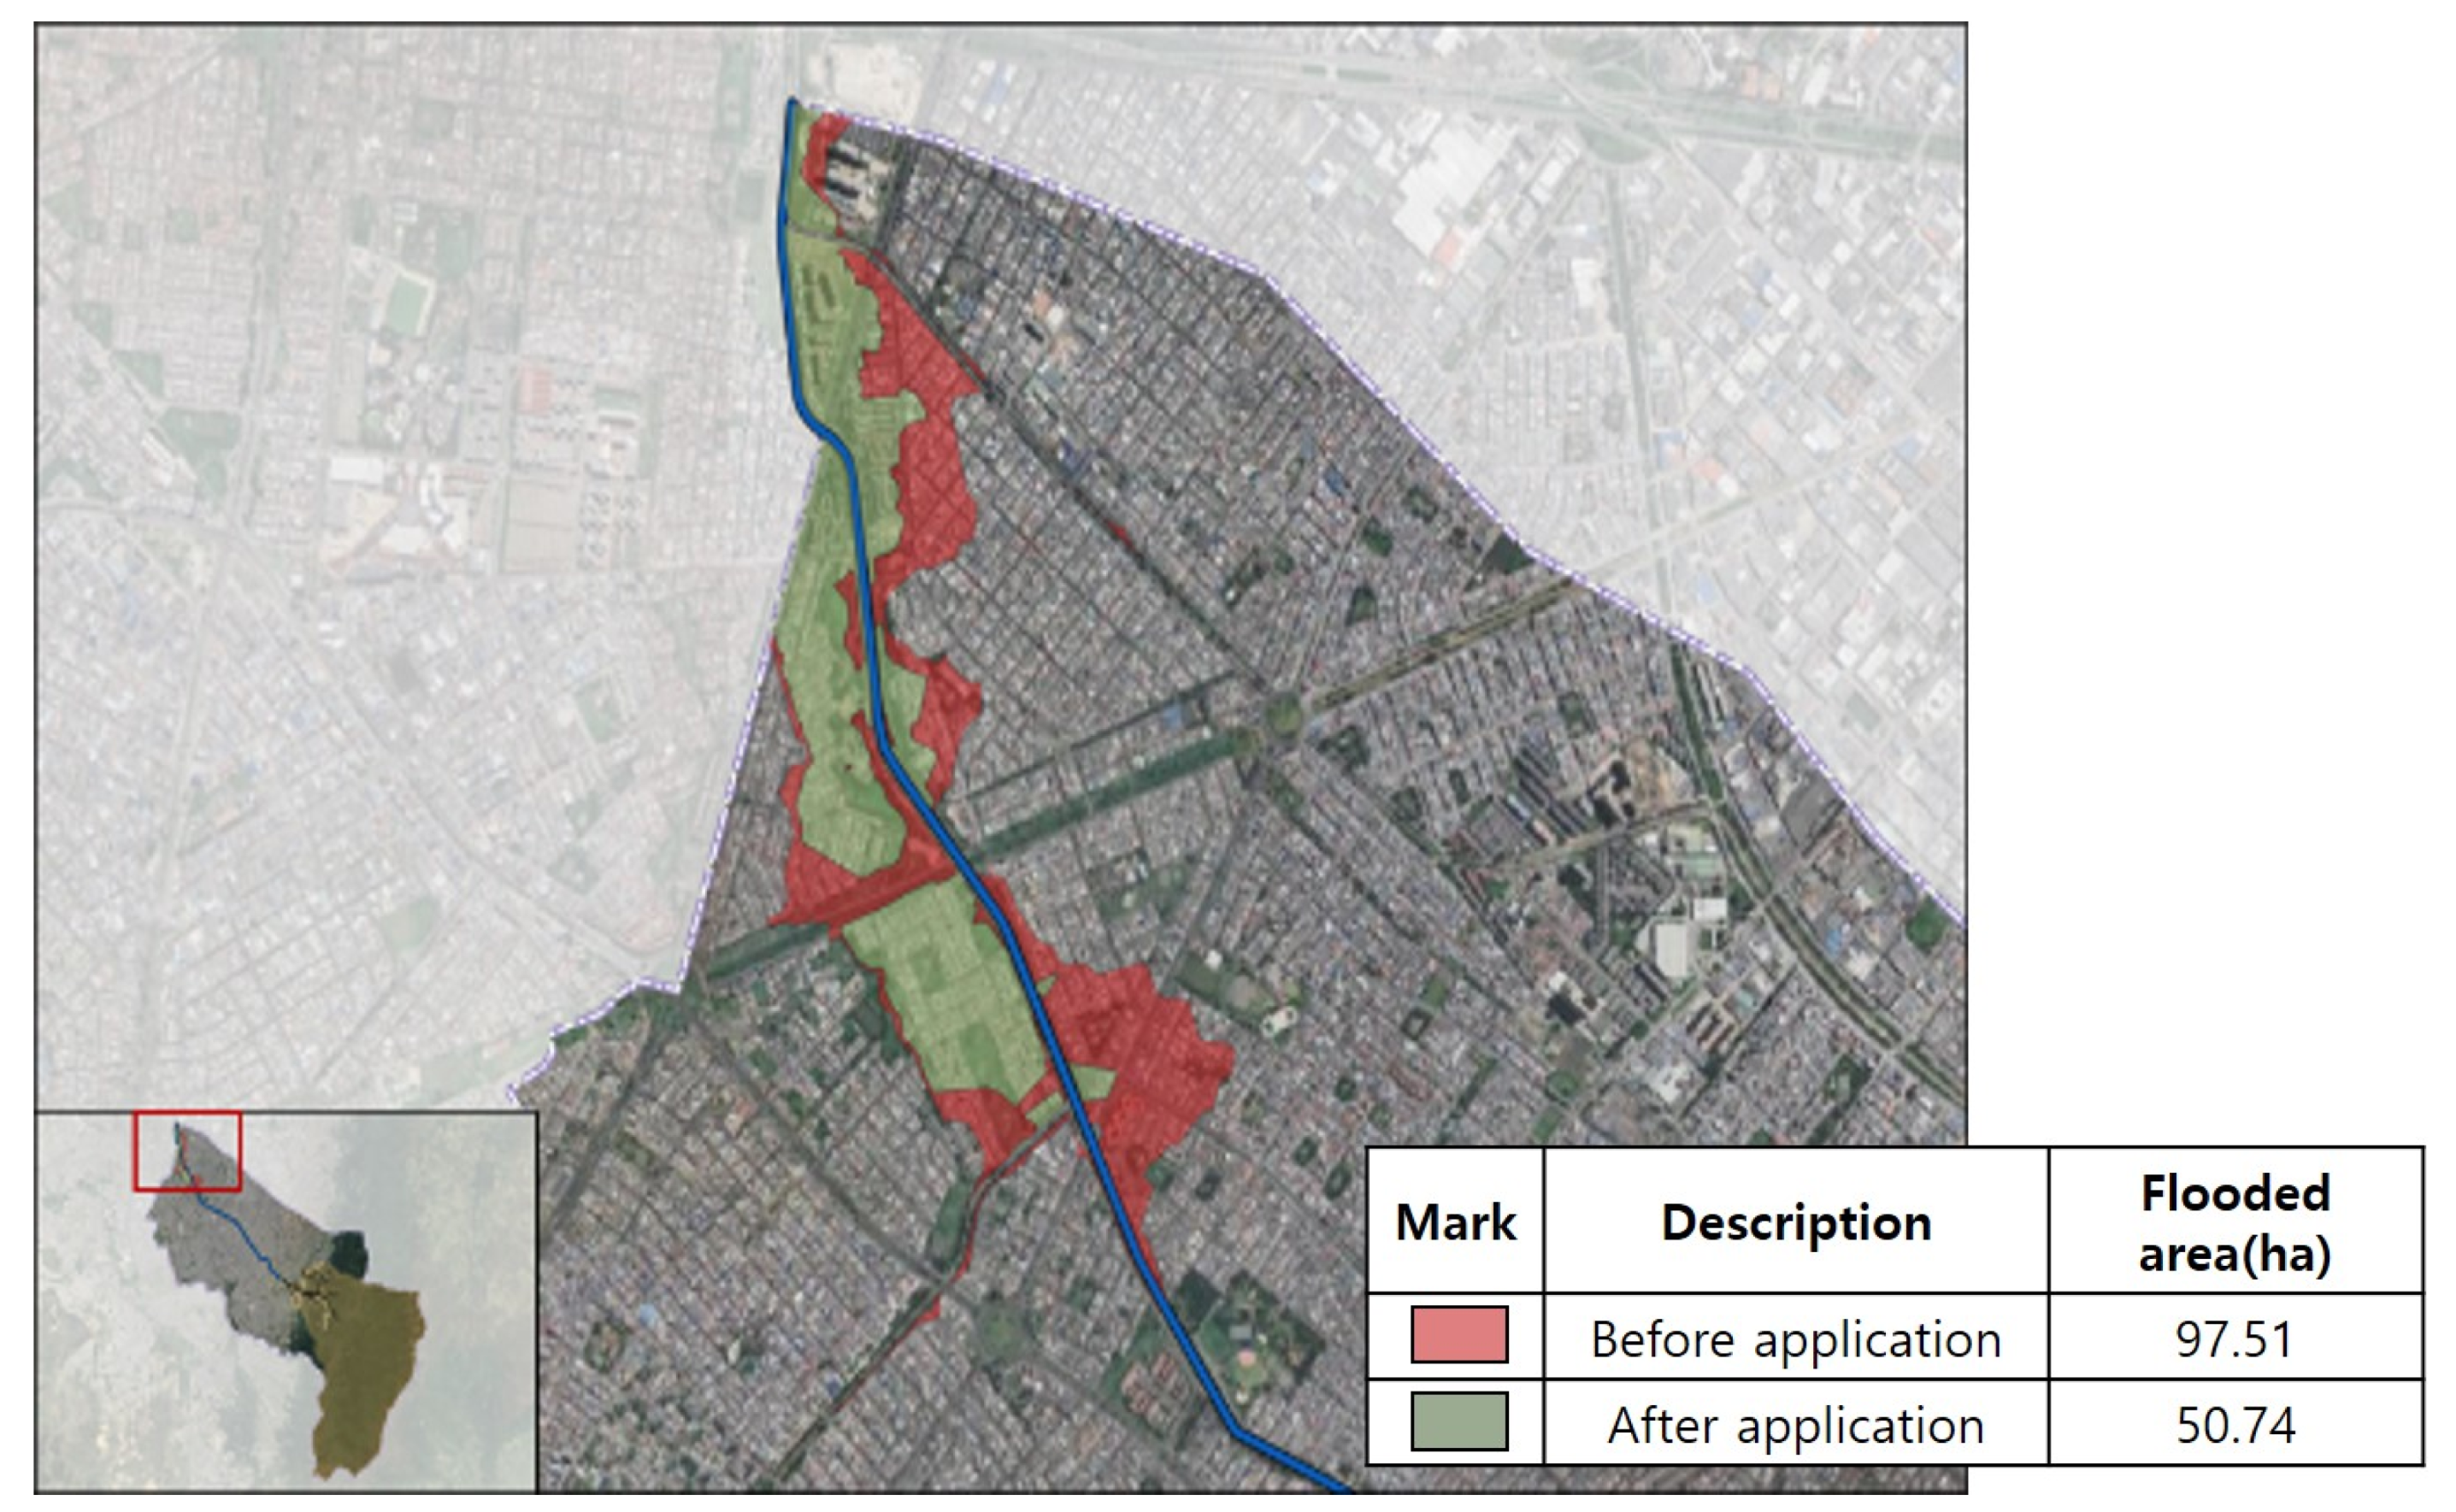
Estimated total runoff volume of the lower watershed of the Fucha river, along with DEM (Digital Elevation Model), was utilized to create a flood inundation map uisng QGIS (Quantum Geographic Information) tools. The flood reduction area, defined as the beneficiary area, is identified by the flood inundation map as
Figure 11. The beneficiary area of the study area is
, and benefit–cost analysis is conducted for the implementation of five reservoirs using the flood reduction area.
3.3.2. Economic Analysis According to LID and Detention Tanks Application
The economic analysis of applying LID and detention facilities is conducted in three steps. Firstly, the costs incurred by the implementation of the facilities are estimated. Secondly, the benefits resulting from the implementation of the facilities are calculated. Using data from first and second step, an economic analysis is performed. In this study, the planned facilities include LID facilities and reservoir installed within the Vitelma, and four reservoirs applicable to the watershed of Fucha river. The approximate construction costs for these facilities were estimated. The construction costs for LID facilities were calculated considering material costs, labor costs, and additional expenses for each facility type. For reservoirs for flooding control, the construction costs were calculated by combining standard construction costs and facility-related expenses based on the size of the reservoir. The approximate project cost for the proposed facilities has been estimated to be 36250 thousand dollars. The suggested budget in this study is summarized in
Table 8.
The benefit is the effect of installing a planned facility, and can be defined as the amount of damage caused to an area that was flooded before the LID facility and detention were installed but which is no longer flooded after installation (beneficiary area). This study focused on a large-scale urban area, and the beneficiary area has been analyzed to be
. The annual benefits for this area are calculated as showin in
Table 9.
To calculate the benefit–cost ratio resulting from the implementation of the proposed LID facilities and detention reservoirs in this study, a 50-year operational period was assumed. All costs were converted to a common basis using a real discount rate of 7.5%, allowing for time-independent comparison. Assuming a construction cost of 3625 thousand dollars and annual operation and maintenanace costs of 16.9 thousand dollars over 50 years, the total cost amounts to 4228 thousand dollars. Similarly, the benefits generated by the implementation of the facilities are projected over the same period (50 years). When a real discount rate of 7.5% is applied, the total benefit is estimated at 3379 thousand dollars. As a result, the benefit–cost ratio of installing the proposed LID and reservoirs was calculated to be 1.02. The net present value (NPV) and internation rate of return (IRR) were also calculated as indicators of economic feasibility. This project yields an NPV of 797,000 dollars and IRR of 7.7%. A review of previous studies on benefit–cost analysis of hydraulic structure applications shows that the benefit–cost ratio was estimated at 0.373 for newly constructed levees and 0.412 for reinforced levees in the context of flood control [
28]. These values reflect not only the initial capital investment but also the annual operation and maintenance costs incurred throughout the service life of the facilities after completion. Wang et al. [
29] conducted an economic analysis of five disaster prevention projects implemented in South Korea to mitigate flood damage. The resulting benefit–cost ratios ranged from 0.0008 to 0.08333. Generally, a benefit–cost ratio of less than 1 indicates that the project has low economic feasibility in terms of public investment efficiency. Although the proposed strategy in this study does not demonstrate a high benefit–cost ratio, being close to 1, it still holds potential justification for implementation, as it aims to protect lives and property from natural disasters.
4. Discussion
This study focuses on addressing the water circulation issues in the Fucha river by proposing the application of LID facilities and reservoirs. Besides implementing structural measures, such as LID and reservoirs as suggested in this study, another approach to mitigate flooding in the Fucha river is to establish a flood forecasting and warning system. The flood forecasting and warning system is a non-structural measure that can reduce the flooded area caused by heavy rainfall. However, it can be immensely helpful in mitigating the impact of disaster on human lives and property damage by providing hydro-meteorological conditions-based early warnings, allowing for proactive responses, and facilitating evacuation of residents before water-related issues such as floods occur. Indeed, many researchers have presented the investment benefits and positive introduction effects through flood forecasting and warning systems. The severe flooding that occurred in Colombia during the 2010–2011 La Niña event highlighted the critical absence of a flood forecasting and warning system, which was recognized as a key factor contributing to the extent of the damages [
30].
Hawley et al. [
31] indicates that the economic benefits relative to the investment costs of meteorogical and hydrological services along with early warning systems are very high. It underscores the importance of disaster-related information provision and the establishment of alert systems in reducing disasters. Specifically, it presents an investment benefit ranging from 0.96 to 70.0 through the provision of meteorological and hydrological services. UN water [
32] reports an increase in socio-economically devastating water-related disasters, especially in the context of climate change. They anticipate that flood-prone area management, early warning systems, risk awareness enhancement, and organized response measures, including disaster preparedness, can significantly enhance the community’s capacity to respond to disasters in the region. According to Lal et al. [
33], there have been reported cases in Bangladesh where, despite persistent poverty, the number of facilities due to floods has dramatically decreased. This reduction is attributed to improved disaster preparedness, response, and relatively higher household resilience levels. To address these urban water circulation issues, it is necessary to put in place not only structural measures, but also disaster preparedness measures, including early warning and emergency plans.
The flood damage reduction rate for the Fucha river is estimated based on a practical benefit research case, which involves estimating the benefits of early flood warning implementation for residents of a city near the Susquehanna river in the United States. According to Day [
34], in the absence of early warning, the maximum damage cost could be up to 300 thousand dollars. Through early warning, it was found that 100 thousand dollars of the potential damage costs could be reduced. Furthermore, it is generally stated that reliable early warning issued 6 to 12 h in advance can save about 66 thousand dollars, which corresponds to two-thirds of the 100 thousand dollars potential cost reduction. As a result, it is estimated that establishing a flood forecasting and warning system for the Fucha river could lead to a maximum cost reduction of 33%. This indicates that implementing an early warning system could be more effective in reducing damages compared to simply devising structural measures.
5. Conclusions
Due to climate change, rainfall patterns are changing, and urbanization is increasing impervious surfaces within cities, preventing water from infiltrating into the ground. This leads to a reduction in groundwater infiltration when it rains, causing a lowering of the groundwater level. Additionally, if the initial rainfall contains high concentrations of pollutants, this contaminated runoff may be directly discharged into rivers or the sea. To address the issues arising from the distortion of water circulation due to climate change and urbanization, the LID technique has been introduced. This technique aims to improve problems caused by these changes and sustainably manage water resources. This study analyzed the effects of applying LID facilities and flood control facilities to address the issues of water circulation distortion caused by climate change and urbanization in the target area, the upper watershed of the Fucha river, and to manage water resources effectively. The research process for the application of LID and flood control facilities in the upper watershed of the Fucha river involved the following steps: (1) watershed characteristics analysis, (2) establishing a concept for defining and solving water circulation issues, (3) goal setting for rainwater and flood control, (4) selection of facility locations and scale planning, (5) analysis of the effects of facility application, and (6) economic analysis (benefit–cost analysis).
To regulate the specific amount of rainfall during normal conditions, LID facilities were applied, including vegetated swales, rain gardens, infiltration channel, and porous pavement, to manage the target rainfall of . Through these measures, it was analyzed that 2362 of rainfall could be effectively managed. From the flood control perspective, a total of five detention tank installation areas were proposed. With the application of these five detention tanks, it was observed that the peak flow rate decreased by , resulting in a reduction of 31.8%. Additionally, the total discharge volume decreased by 80,600 , indicating a reduction of 7.3%. Lastly, it was confirmed that the flooded area in the lower watershed decreased from to , resulting in a reduction of in the flooded area. Based on this data, the benefit–cost ratio was calculated as 1.02. Through this study, structural measures to address various water circulation issues in Bogotá, Colombia were proposed, along with a rough estimate of the necessary budget. This provides confirmation that effective water circulation management and flood damage reduction are achievable. The past and current disaster management has been primarily focused on responding to disasters and recovering post-event. This approach emphasizes on-field response and recovery after a disaster occurs. Similarly, this study can be considered as an approach within the framework of response measures. However, in the future, there is a need to shift the paradigm of disaster management towards a proactive approach focused on prevention and thorough preparedness, aiming to minimize damages through pre-disaster prevention and preparedness measures. To achieve this, it is deemed necessary to introduce a flood early warning system, emphasizing proactive disaster safety management with a focus on prevention. Given the complexity of urban infrastructure and the heightened sensitivity of hydrological systems to climate change in cities like Bogotá, Colombia, it is imperative to undertake further research aimed at the validation of existing flood warning systems and the development of strategies for their effective expansion.
Author Contributions
The paper was supervised by R.K., the volume control and flood control analyses were conducted by Y.P., I.S., and C.W., and economic analysis was carried out by Y.P. and J.P. The whole manuscript was composed and written by Y.P. All authors have read and agreed to the published version of the manuscript.
Funding
Research for this paper was carried out under the KICT Research Program (Project No. 20250284-001), Name, funded by the Ministry of Science and ICT.
Data Availability Statement
Conflicts of Interest
Authors Sim, I., Won, C., and Park, J. were employed by the company HECOREA Inc. The remaining authors declare that the research was conducted in the absence of any commercial or financial relationships that could be construed as a potential conflict of interest.
Abbreviations
The following abbreviations are used in this manuscript:
| ABM | Alternating Block Method |
| DEM | Digital Elevation Model |
| EAAB | Empresa de Acueducto y Alcantarillado de Bogotá |
| IDF | Intensity–Duration–Frequency |
| IRR | Internation Rate of Return |
| KDI | Korea Development Institute |
| LID | Low Impact Development |
| NPV | Net Present Value |
| PMF | Probable Maximum Flood |
| QGIS | Quantum Geographic Information System |
| SDF | Standard Design Flood |
References
- Asoka, A.; Gleeson, T.; Wada, Y.; Mishra, V. Relative Contribution of Monsoon Precipitation and Pumping to Changes in Groundwater Storage in India. Nat. Geosci. 2017, 10, 109–117. [Google Scholar] [CrossRef]
- Abbott, B.W.; Bishop, K.; Zarnetske, J.P.; Minaudo, C.; Chapin, F.S., III; Krause, S.; Hannah, D.M.; Conner, L.; Ellison, D.; Godsey, S.E.; et al. Human Domination of the Global Water Cycle Absent from Depictions and Perceptions. Nat. Geosci. 2019, 12, 533–540. [Google Scholar] [CrossRef]
- Li, J.; Xie, S.P.; Cook, E.R.; Chen, F.; Shi, J.; Zhang, D.D.; Fang, K.; Gou, X.; Li, T.; Peng, J.; et al. Deciphering Human Contributions to Yellow River Flow Reductions and Downstream Drying Using Centuries-long Tree Ring Records. Geophys. Res. Lett. 2019, 46, 898–905. [Google Scholar] [CrossRef]
- Allan, R.P.; Barlow, M.; Byrne, M.P.; Cherchi, A.; Douville, H.; Fowler, H.J.; Gan, T.Y.; Pendergrass, A.G.; Rosenfeld, D.; Swann, A.L.S.; et al. Advances in Understanding Large-scale Responses of the Water Cycle to Climate Change. Ann. N. Y. Acad. Sci. 2020, 1472, 49–75. [Google Scholar] [CrossRef] [PubMed]
- Darnthamrongkul, W.; Mozingo, L.A. Toward Sustainable Stormwater Management: Understanding Public Appreciation and Recognition of Urban Low Impact Development (LID) in the San Francisco Bay Area. J. Environ. Manag. 2021, 300, 113716. [Google Scholar] [CrossRef] [PubMed]
- Kim, H.; Kim, G. An Effectiveness Study on the Use of Different Types of LID for Water Cycle Recovery in a Small Catchment. Land 2021, 10, 1055. [Google Scholar] [CrossRef]
- Sui, X.; van de Ven, F.H.M. The Influence of Low Impact Development (LID) on Basin Runoff in a Half-urbanized Catchment: A Case Study in San Antonio, Texas. J. Hydrol. 2023, 616, 128793. [Google Scholar] [CrossRef]
- Lee, O.; Kim, S.; Lee, J.; Park, Y. Optimal Design of Bioretention Cells Using Multi-objective Optimization Technique. Desalin. Water Treat. 2018, 102, 134–140. [Google Scholar] [CrossRef]
- Park, Y.; Kim, R.; Jang, J.-K.; Song, Y.; Yang, D.M. Basin Management Using Multi-objective Optimization: Focus on Reductions of TP Loading and Runoff. J. Korean Soc. Hazard Mitig. 2019, 19, 433–441. [Google Scholar] [CrossRef]
- Abduljaleel, Y.; Demissie, Y. Evaluation and Optimization of Low Impact Development Designs for Sustainable Stormwater Management in a Changing Climate. Water 2021, 13, 2889. [Google Scholar] [CrossRef]
- Mattos, T.S.; Oliveira, P.T.S.; Bruno, L.S.; Oliveira, N.D.; Vasconcelos, J.G.; Lucas, M.C. Improving Urban Flood Resilience under Climate Change Scenarios in a Tropical Watershed Using Low-impact Development Practices. J. Hydrol. Eng. 2021, 26, 05021031. [Google Scholar] [CrossRef]
- Park, Y.; Kim, R.; Kim, L.-H.; Lee, O.; Kim, S. Optimal Watershed Management Practices for the Reduction of Future Non-point Pollutants Loads. Desalin. Water Treat. 2021, 219, 379–391. [Google Scholar] [CrossRef]
- Ariza, J.; Garces, K.; Cardozo, N.; Sanchez, J.P.R.; Vargas, F.J. IoT Architecture for Adaptation to Transient Devices. J. Parallel Distrib. Comput. 2021, 148, 4–30. [Google Scholar] [CrossRef]
- Salamanca, D.; Husserl, J.; Ramos-Bonilla, J.P.; Sanchez, J.P.R. Pathogens in Runoff Water Treated by a Sustainable Urban Drainage System in a Developing Country. Environ. Processes 2023, 10, 3. [Google Scholar] [CrossRef]
- Silva, T.F.; Beltran, D.; Nascimento, N.O.; Rodriguez, J.P.; Mancipe-Munoz, N. Assessing Major Drivers of Runoff Water Quality Using Principal Component Analysis: A Case Study from a Colombian and a Brazilian Catchments. Urban Water J. 2023, 20, 1555–1567. [Google Scholar] [CrossRef]
- Ortega, A.D.; Rodriguez, J.P.; Bharati, L. Building Flood-resilient Cities by Promoting SUDS Adoption: A Multi-sector Analysis of Barriers and Benefits in Bogotá, Colombia. Int. J. Disaster Risk Reduct. 2023, 88, 103621. [Google Scholar] [CrossRef]
- Al Mamoon, A.; Joergensen, N.E.; Rahman, A.; Qasem, H. Estimation of design rainfall in arid region: A case study for Qatar using L moments. In The Wise Find Pleasure in Water: Meandering through Water Science and Engineering: Proceedings of the 35th IAHR World Congress, 8–13 September 2013, Chengdu, China; Tsinghua University Press: Beijing, China, 2013. [Google Scholar]
- United States Environmental Protection Agency (USEPA). Technical Guidance on Implementing the Stormwater Runoff Requirements for Federal Projects under Section 438 of the Energy Independence and Security Act; EPA 841-B-09-001; USEPA: Washington, DC, USA, 2009. [Google Scholar]
- United States Environmental Protection Agency (USEPA). Municipal Separate Storm Sewer System Permits: Postconstruction Performance Standards and Water Quality-based Requirements. A Compendium of Permitting Approaches; EPA 833-R-14-003; USEPA: Washington, DC, USA, 2014. [Google Scholar]
- Ministry of Environment (ME). Manual for Installation and Management of Non-point Pollution Reduction Facility; No. 11-1480000-001430-01; Ministry of Environment: Sejong, Republic of Korea, 2016. [Google Scholar]
- Land and Housing Institute (LHI). A Study on Introduction Plan of Low Impact Development Techniques in Multifunctional Administrative City (MAC); Land and Housing Institute: Daejeon, Republic of Korea, 2017. [Google Scholar]
- Gwangju Metropolitan City (GMC). Gwangju Master Plan for Water Cycle Management; Gwangju Metropolitan City: Gwangju, Republic of Korea, 2018. [Google Scholar]
- Ulsan Metropolitan City (UMC). Master Plan for Water Cycle Leading City; Ulsan Metropolitan City (UMC): Ulsan, Republic of Korea, 2018. [Google Scholar]
- Kim, B.; Kim, J.; Lee, S. A Study on the Rainfall-Runoff Reduction Efficiency on Each Design Rainfall for the Green Infrastructure-based Stormwater Management. J. Korea Water Resour. Assoc. 2022, 55, 613–621. [Google Scholar]
- Ministry of Land, Infrastructure and Transport (MLT). River Design Criteria and Commentary; Ministry of Land, Infrastructure and Transport: Sejong, Republic of Korea, 2009. [Google Scholar]
- Chow, V.T.; Maidment, D.R.; Mays, L.W. Design Storms—Chapter 14. In Applied Hydrology; McGraw-Hill: New York, NY, USA, 1988. [Google Scholar]
- Korea Development Institute (KDI). Study on Improvement Strategies for Economic Analysis of Water Management Projects; Korea Development Institute (KDI): Sejong, Republic of Korea, 2001. [Google Scholar]
- Kim, G.; Choi, C.; Yi, C.; Lee, J. Cost-Effective Analysis for Evaluating Utility of River Levee in Policy Aspects. J. Korean Soc. Hazard Mitig. 2012, 12, 247–254. [Google Scholar] [CrossRef]
- Wang, W.-j.; Choi, C.; Kim, D.; Yoo, Y.; Seo, Y.-S.; Kim, H.S. Economic Analysis and Evaluation of Disaster Prevention Projects in Consideration of Indirect Benefits. J. Korean Soc. Hazard Mitig. 2019, 19, 63–73. [Google Scholar] [CrossRef]
- Werner, M.; Loaiza, J.C.; Mesa, M.R.; Sanchez, M.F.; De Keizer, O.; Sandoval, M.C. Developing Flood Forecasting Capabilities in Colombia (South America). In Flood Forecasting; Academic Press: Cambridge, MA, USA, 2016; pp. 349–368. [Google Scholar]
- Hawley, K.; Moench, M.; Sabbag, L. Understanding the Economics of Flood Risk Reduction: A Preliminary Analysis; Institute for Social and Environmental Transition-International: Boulder, CO, USA, 2012. [Google Scholar]
- United Nations Water. The Human Cost of Weather-Related Disasters; United Nations Water: Geneva, Switzerland, 2015. [Google Scholar]
- Lal, P.N.; Mitchell, T.; Aldunce, P.; Auld, H.; Mechler, R.; Miyan, A.; Romano, L.E.; Zakaria, S.; Dlugolecki, A.; Masumoto, T.; et al. National Systems for Managing the Risks from Climate Extremes and Disasters. In Managing the Risks of Extreme Events and Disasters to Advance Climate Change Adaptation; A Special Report of Working Groups I and II of the Intergovernmental Panel on Climate Change (IPCC); Cambridge University Press: Cambridge, UK; New York, NY, USA, 2012; pp. 339–392. [Google Scholar]
- Day, H.T. Flood Warning Benefit Evaluation—Susquehanna River Basin. EAAA Tech. Memo. Wbtm Hydro 1970, 10, 1–42. [Google Scholar]
Figure 1.
Research flowchart for mitigation for water cycle issues for Fucha basin.
Figure 1.
Research flowchart for mitigation for water cycle issues for Fucha basin.
Figure 3.
Estimation of rainwater management capacity of LID.
Figure 3.
Estimation of rainwater management capacity of LID.
Figure 4.
Examples of LID faciliteis applicable in urban areas.
Figure 4.
Examples of LID faciliteis applicable in urban areas.
Figure 5.
Percentile rainfall analysis.
Figure 5.
Percentile rainfall analysis.
Figure 6.
Rainfall distribution according to return period (Duration: 24 h, they should be listed as: (a) 25-year (b) 100-year.
Figure 6.
Rainfall distribution according to return period (Duration: 24 h, they should be listed as: (a) 25-year (b) 100-year.
Figure 7.
Construction of XP-SWMM in study area.
Figure 7.
Construction of XP-SWMM in study area.
Figure 8.
LID application plan in Vitelma and rainwater management volume.
Figure 8.
LID application plan in Vitelma and rainwater management volume.
Figure 9.
Flood control facilities location and detention volme.
Figure 9.
Flood control facilities location and detention volme.
Figure 10.
Comparison of flow hydrographs of the lower watershed of Fucha river before and after application of 5 flood control facilities.
Figure 10.
Comparison of flow hydrographs of the lower watershed of Fucha river before and after application of 5 flood control facilities.
Figure 11.
Comparison of flooded area before and after application of flood control facilities.
Figure 11.
Comparison of flooded area before and after application of flood control facilities.
Table 1.
Topographic charactersistics of 5 zones in the study area.
Table 1.
Topographic charactersistics of 5 zones in the study area.
| Zone | 1 | 2 | 3 | 4 | 5 |
|---|
| Total area () | 74.60 | 101.87 | 24.27 | 220.50 | 2483.65 |
| School () | 0.09 | 0.35 | 0.00 | 0.25 | 0.00 |
| (0.12%) | (0.34%) | (0.00%) | (0.12%) | (0.00%) |
| Park () | 17.02 | 9.02 | 0.01 | 63.21 | 0.00 |
| (23.05%) | (8.85%) | (0.03%) | (28.66%) | (0.00%) |
| Road () | 6.39 | 6.79 | 0.00 | 5.73 | 2.96 |
| (8.56%) | (6.67%) | (0.00%) | (2.60%) | (0.12%) |
Table 2.
Basic assumption of facility planning.
Table 2.
Basic assumption of facility planning.
| Name | Soil Layer
Depth (m) | Freeboard
(m) | Soil Porosity | Infiltration
Rate (mm
h−1) | Infiltration
Availability |
|---|
Vegetated
swale | 0.60 | 0.30 | 0.35 | 13.00 | ✓ |
| Rain garden | 0.60 | 0.30 | 0.35 | 13.00 | ✓ |
Infiltration
channel | 0.50 | 0.50 | 0.32 | 13.00 | ✓ |
Porous
pavement | 0.50 | - | 0.30 | 13.00 | ✓ |
| Rain barrel | - | - | - | - | - |
Table 3.
Coefficient of equation for IDF in Bogotá.
Table 3.
Coefficient of equation for IDF in Bogotá.
| Return Period | Coefficeint |
|---|
| | |
| 10 | 2707.19 | 28.5 | −0.93134 |
| 25 | 3010.89 | 28.2 | −0.91930 |
| 50 | 3355.99 | 28.5 | −0.91910 |
| 100 | 3502.74 | 27.9 | −0.90908 |
Table 4.
LID application size and rainwater management capacity.
Table 4.
LID application size and rainwater management capacity.
| Name | Quantity | Unit | Storage
Volume (m3) | Infiltration
Volume (m3) | Rainwater
Management
Volume (m3) |
|---|
Vegetated
swale | 100 | | 51 | 31 | 82 |
| Rain garden | 280 | | 143 | 87 | 230 |
Infiltration
channel | 240 | | 158 | 75 | 233 |
Porous
pavement | 2200 | | 330 | 686 | 1016 |
| Rain barrel * | 8 | pcs | 800 | - | 800 |
Table 5.
LID application size and rainwater management capacity.
Table 5.
LID application size and rainwater management capacity.
Target Area
(m2) | Target
Rainfall
(mm) | Runoff Rate | Target
Rainwater
Volume
(m3) | Treatment
Capacity
(m3) | Goal
Achieved |
|---|
| 219,729 | 26.5 | 0.4 | 2329 | 2362 | Satisfaction |
Table 6.
Effect analysis of each step of flood control facility application.
Table 6.
Effect analysis of each step of flood control facility application.
| Step | Flood Control
Facility | Peak Flow (m3s−1) | Runoff Volume (m3) |
|---|
| Before | After | Before | After |
| 1 | Vitelma | 126.7 | 90.3
(−28.7%) | 1,101,010 | 1,032,010
(−6.3%) |
| 2 | Vitelma + A | 126.7 | 90.1
(−28.9%) | 1,101,010 | 1,031,410
(−6.3%) |
| 3 | Vitelma + A + B | 126.7 | 89.4
(−29.4%) | 1,101,010 | 1,029,410
(−6.5%) |
| 4 | Vitelma + A + B + C | 126.7 | 87.4
(−31.0%) | 1,101,010 | 1,023,410
(−7.0%) |
| 5 | All (Vitelma + A + B + C + D) | 126.7 | 86.4
(−31.8%) | 1,101,010 | 1,020,410
(−7.3%) |
Table 7.
Peak flow and runoff volume by return period of the lower watershed of Fucha river.
Table 7.
Peak flow and runoff volume by return period of the lower watershed of Fucha river.
Return
Period (yr) | 3 | 5 | 10 | 25 | 50 | 100 |
|---|
Peak flow
() | 94.5 | 134.7 | 200.5 | 297.0 | 372.7 | 459.7 |
Runoff
volume
() | 1,394,345 | 1,799,405 | 2,409,459 | 3,209,156 | 3,755,918 | 4,420,097 |
Table 8.
Overview of estimated budget for LID and flood control facility.
Table 8.
Overview of estimated budget for LID and flood control facility.
| Category | Rainwater
Management
Volume | Unit | Estimated
Budget
(Thousand
Dollars) | Remarks |
|---|
| Basic and detailed design | - | - | 2370 | Construction
cost rate 7%
applied |
| | | Vegetated swale | 82 | | 10 | |
| Rain garden | 230 | | 260 | |
Infiltration
channel | 233 | | 10 | |
| | LID | Permeable
pavement | 1016 | | 10 | |
| Rain barrel | 800 | | 1220 | |
Construction
cost | | Design Costs | - | - | 530 | Construction
cost × 0.35 |
| | Additional
Costs | - | - | 190 | Construction
cost × 0.125 |
| | Flood control
facility | Vitelma | 69,000 | | 24,350 | |
| | A | 600 | | 520 | Optional |
| | B | 2000 | | 1070 | Optional |
| | C | 6000 | | 4010 | Optional |
| | D | 3000 | | 1700 | Optional |
| | Sub Total (Construction) | | 33,880 | |
| Grand Total | | 36,250 | |
Table 9.
Details of benefit items analysis (unit: thousand of dollars per year).
Table 9.
Details of benefit items analysis (unit: thousand of dollars per year).
| Benefit Item | Human Life | Evacuee | Tangible Factor |
|---|
| Death | Injury | Buildings | Agriculture | Public
Facilities | Others |
| Benefit | 311 | 12 | 552 | 88 | 1 | 2408 | 366 |
| Subtotal | 323 | 552 | 2863 |
| Total | 3739 | |
| Disclaimer/Publisher’s Note: The statements, opinions and data contained in all publications are solely those of the individual author(s) and contributor(s) and not of MDPI and/or the editor(s). MDPI and/or the editor(s) disclaim responsibility for any injury to people or property resulting from any ideas, methods, instructions or products referred to in the content. |
© 2025 by the authors. Licensee MDPI, Basel, Switzerland. This article is an open access article distributed under the terms and conditions of the Creative Commons Attribution (CC BY) license (https://creativecommons.org/licenses/by/4.0/).


