
Episodic vs. Sea Level Rise Coastal Flooding Scenarios at the Urban Scale: Extreme Event Analysis and Adaptation Strategies


Abstract
1. Introduction
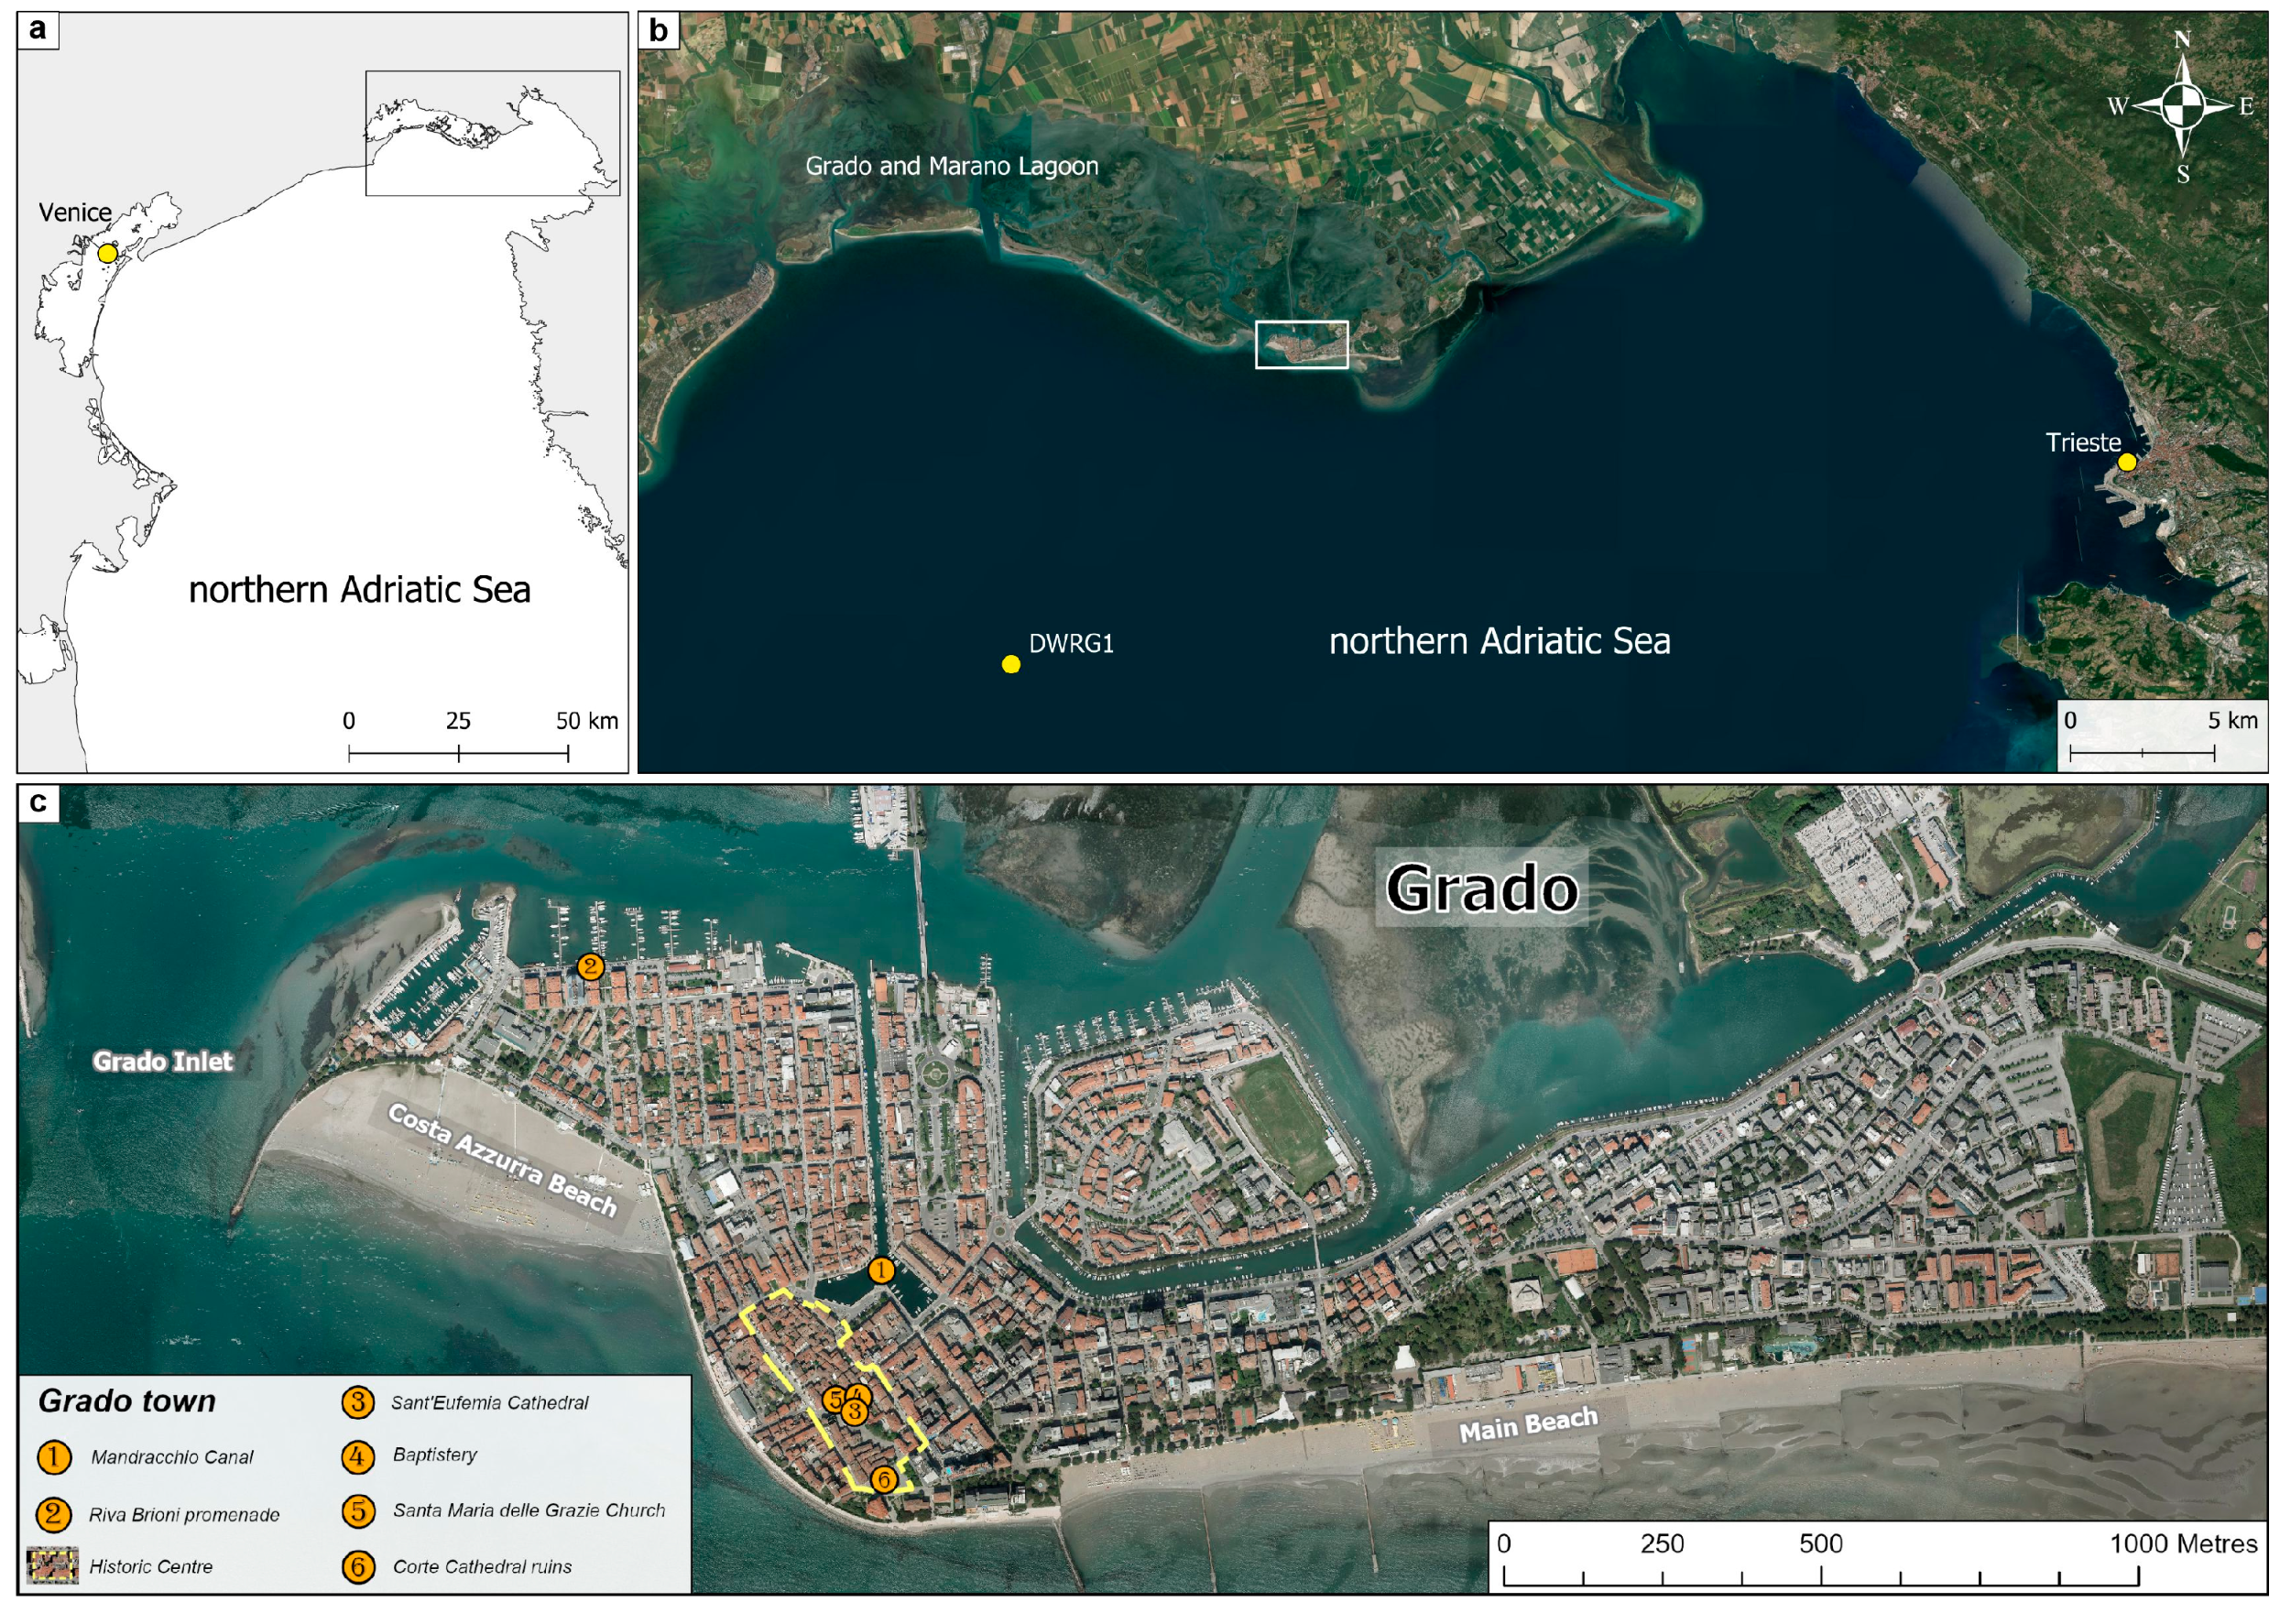
2. Study Area
2.1. The Town of Grado
2.2. Oceanographic and Meteoclimatic Forcing
3. Materials and Methods
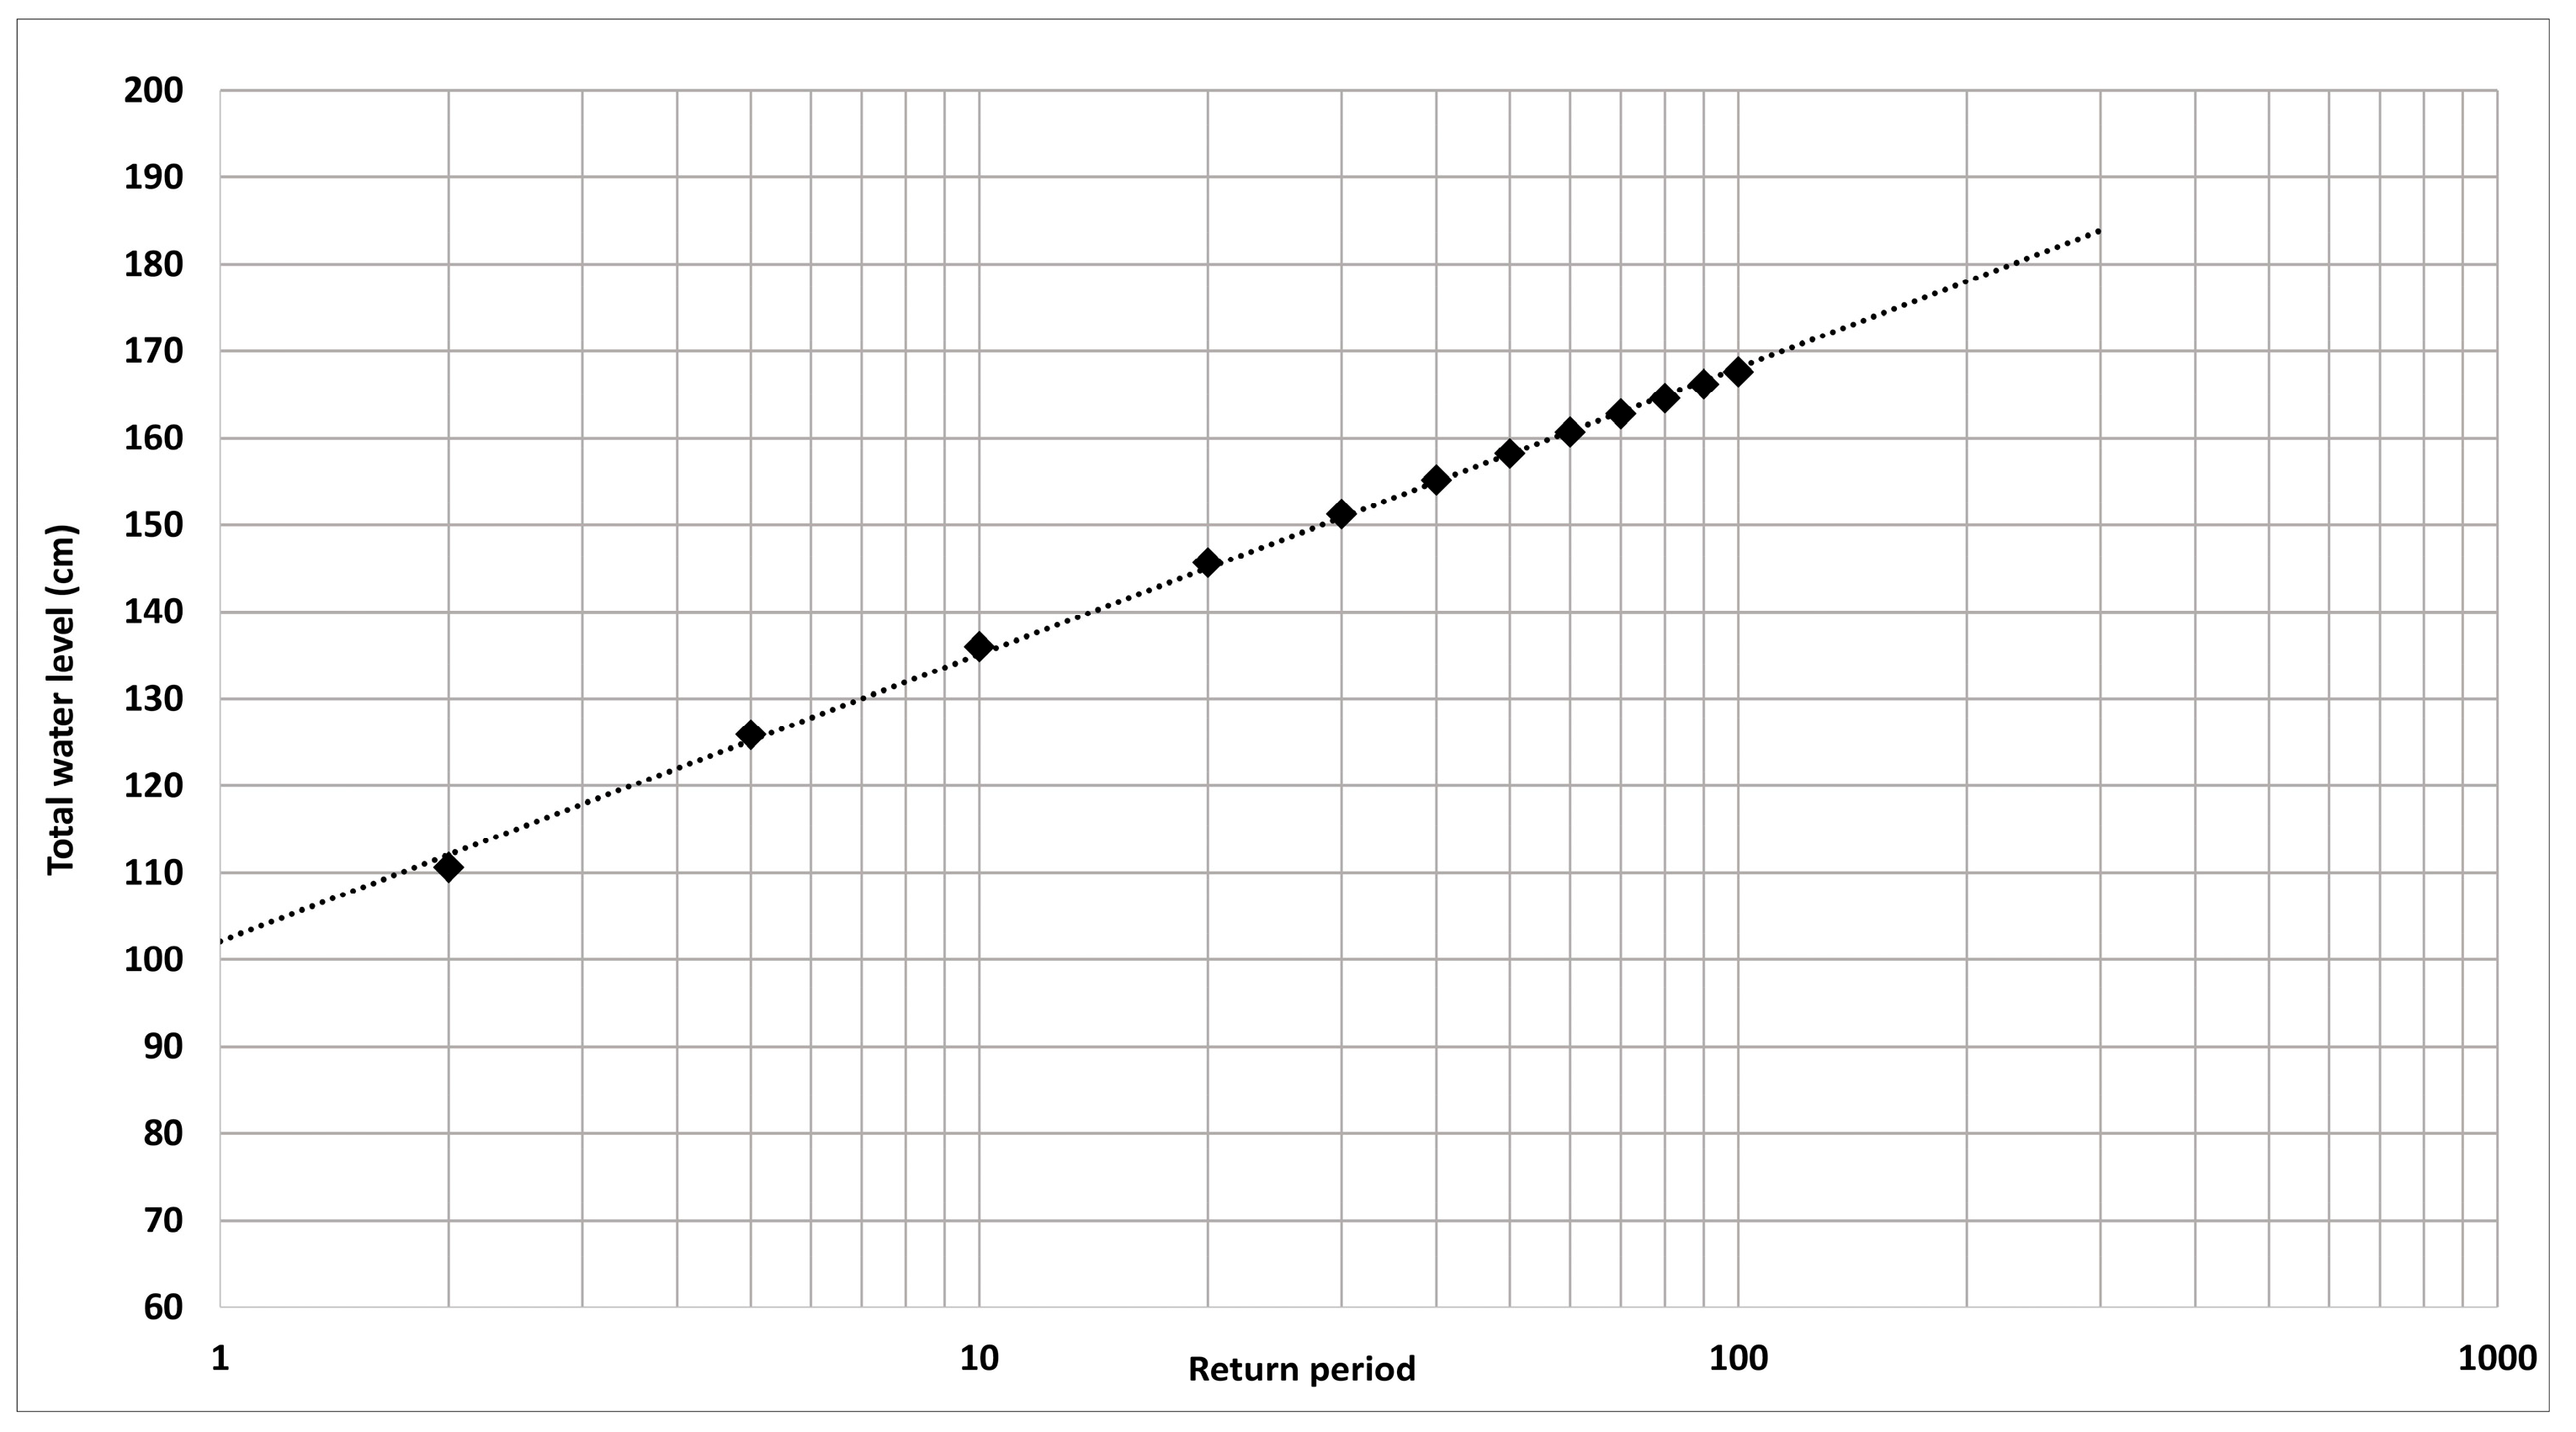
- Analysing the time series of sea level data recorded in three important tide gauges in the northern Adriatic Sea, to define the return period (RP) of extreme sea levels.
- Defining the threshold for the urban flooding of the city of Grado and estimating the occurrence and possible exceedance above the threshold.
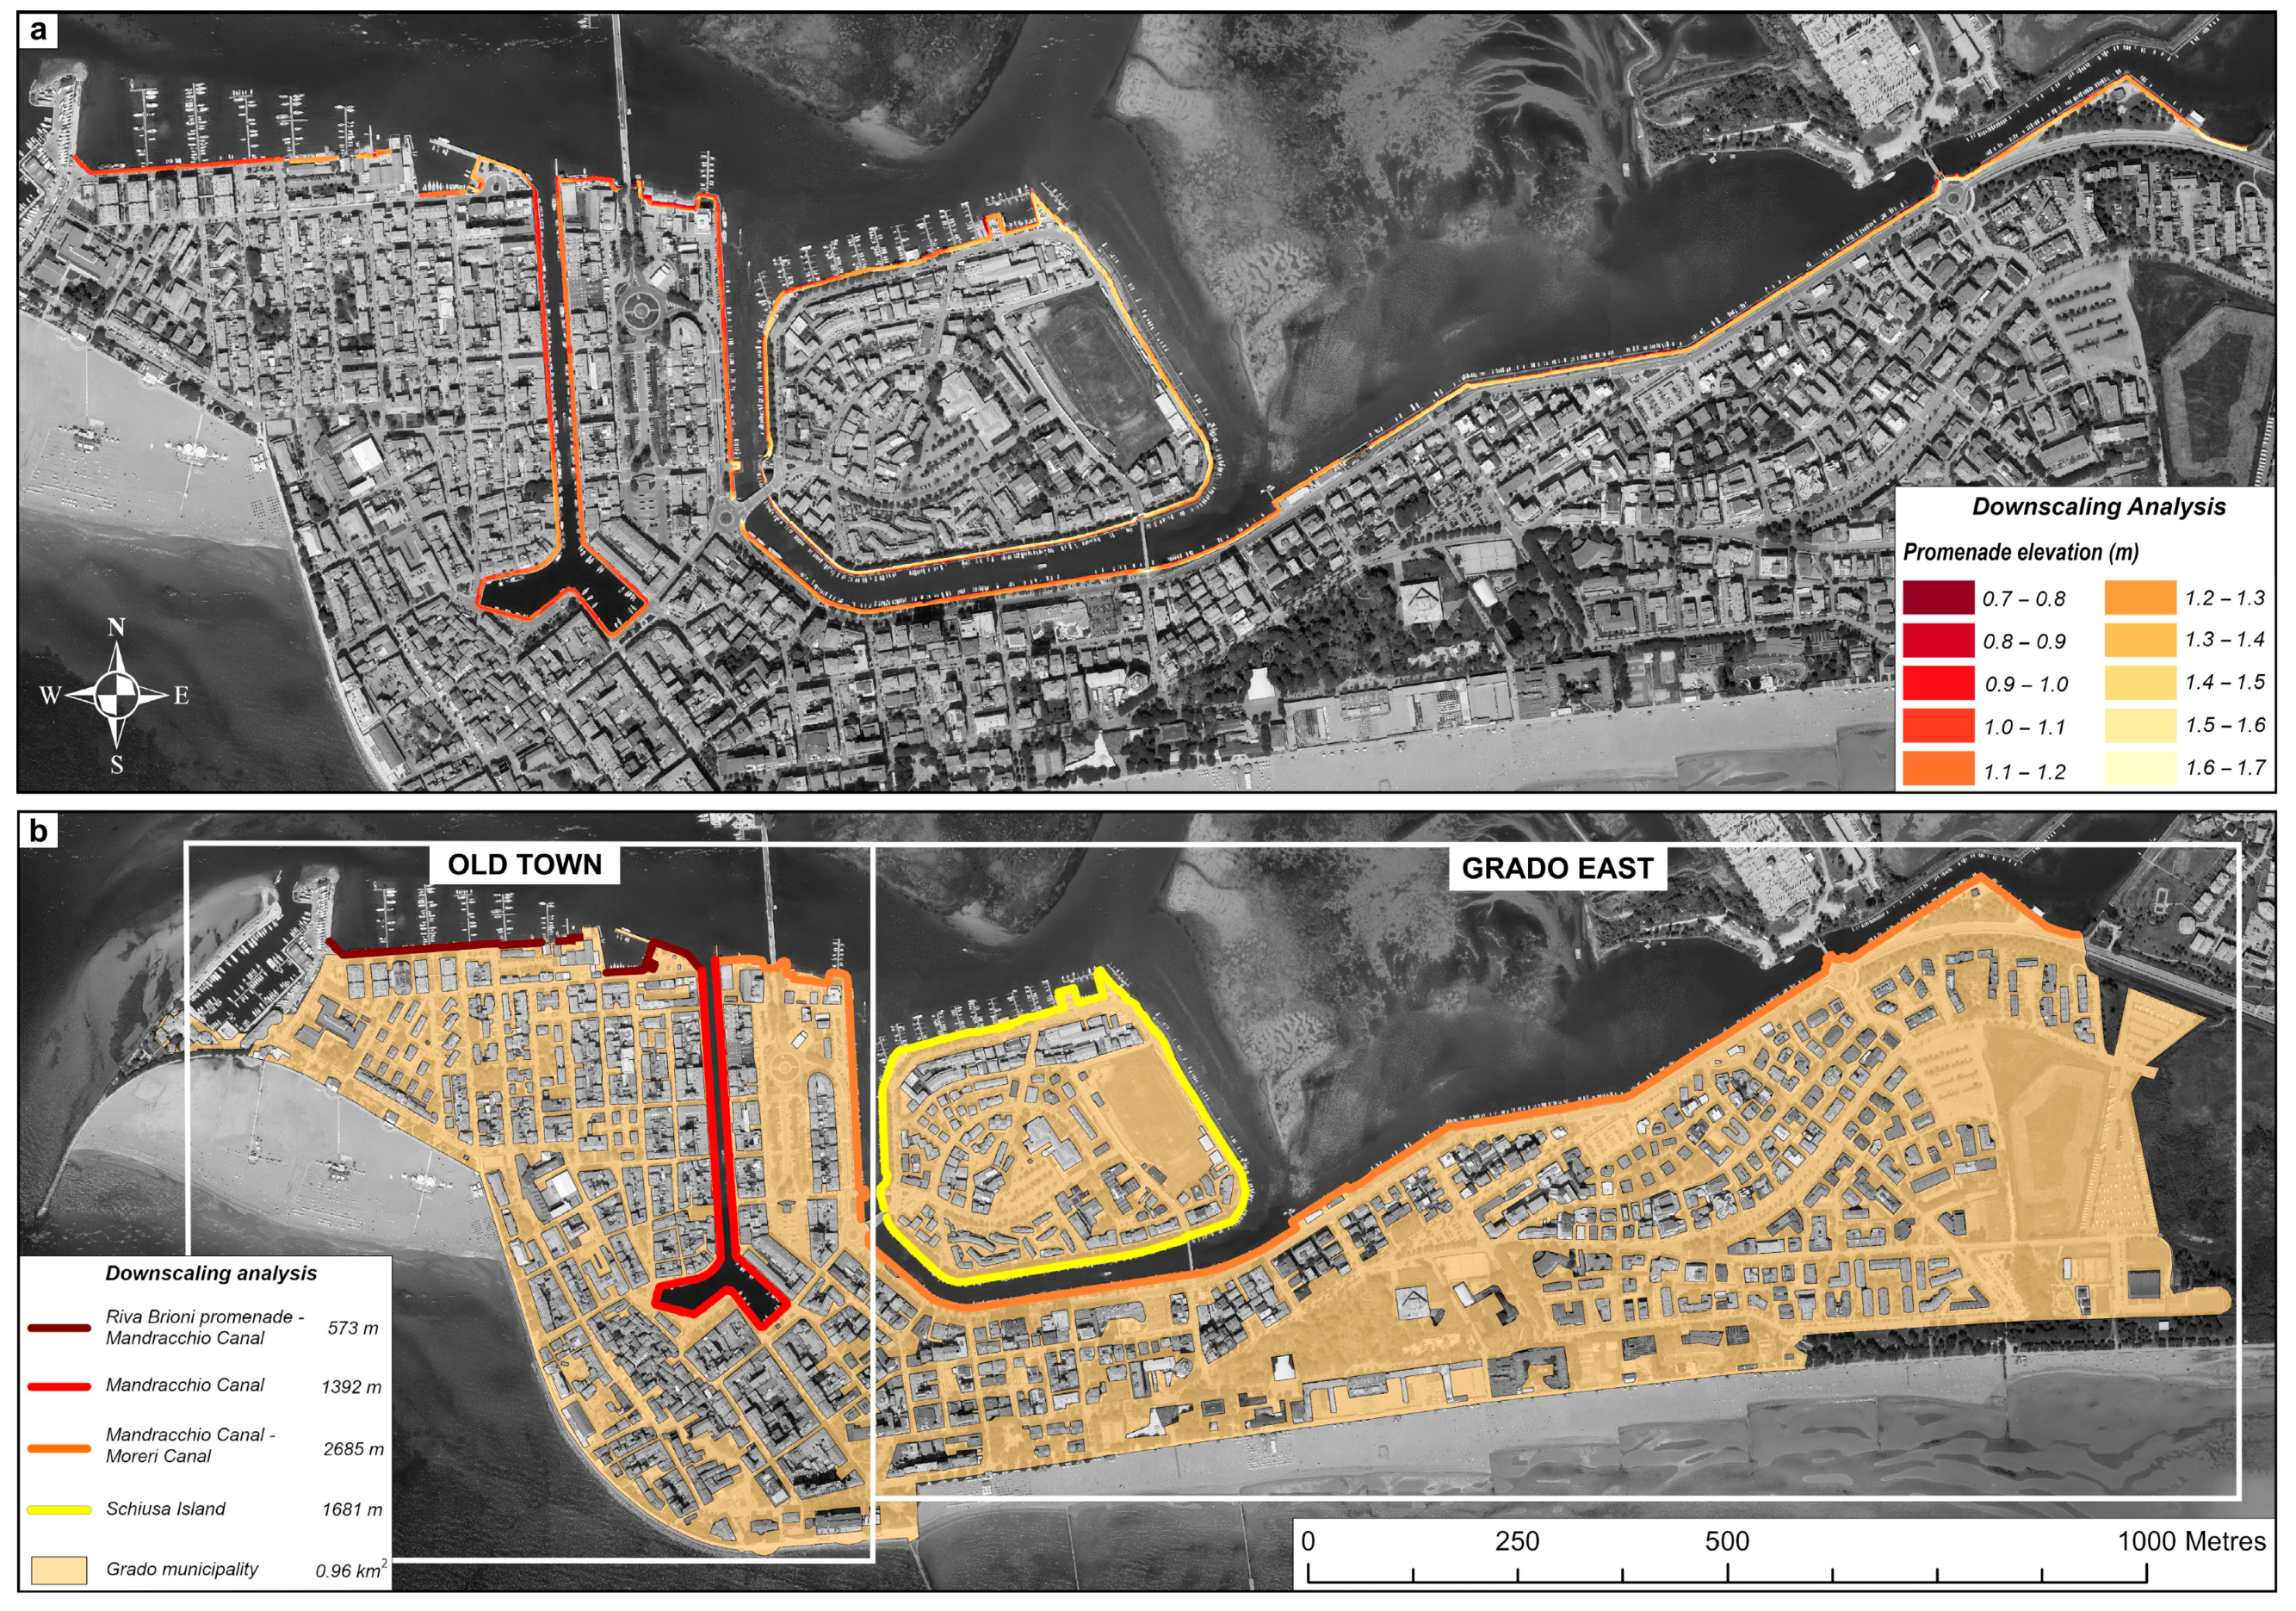
- Using the LiDAR-derived digital terrain model (DTM), dividing the Grado territory into sectors with varying levels of vulnerability to obtain a series of downscaling maps of episodic flood-inducing extreme events with different RPs. The analysis also includes a detailed inspection of the promenade elevation along the lagoon border.
- Estimating relative sea level rise (RSLR) for the town of Grado, by comparing the IPCC AR6 Report [35], tide gauge data from Trieste and Grado, and the literature, for inferring the vertical land motion (VLM) component.
- Combining the RSLR predictions for 2050 and 2100 with the episodic events statistics and RPs, in order to assess the reduction of the same RPs of given flooding thresholds.
3.1. Statistics of the Extreme Water Levels
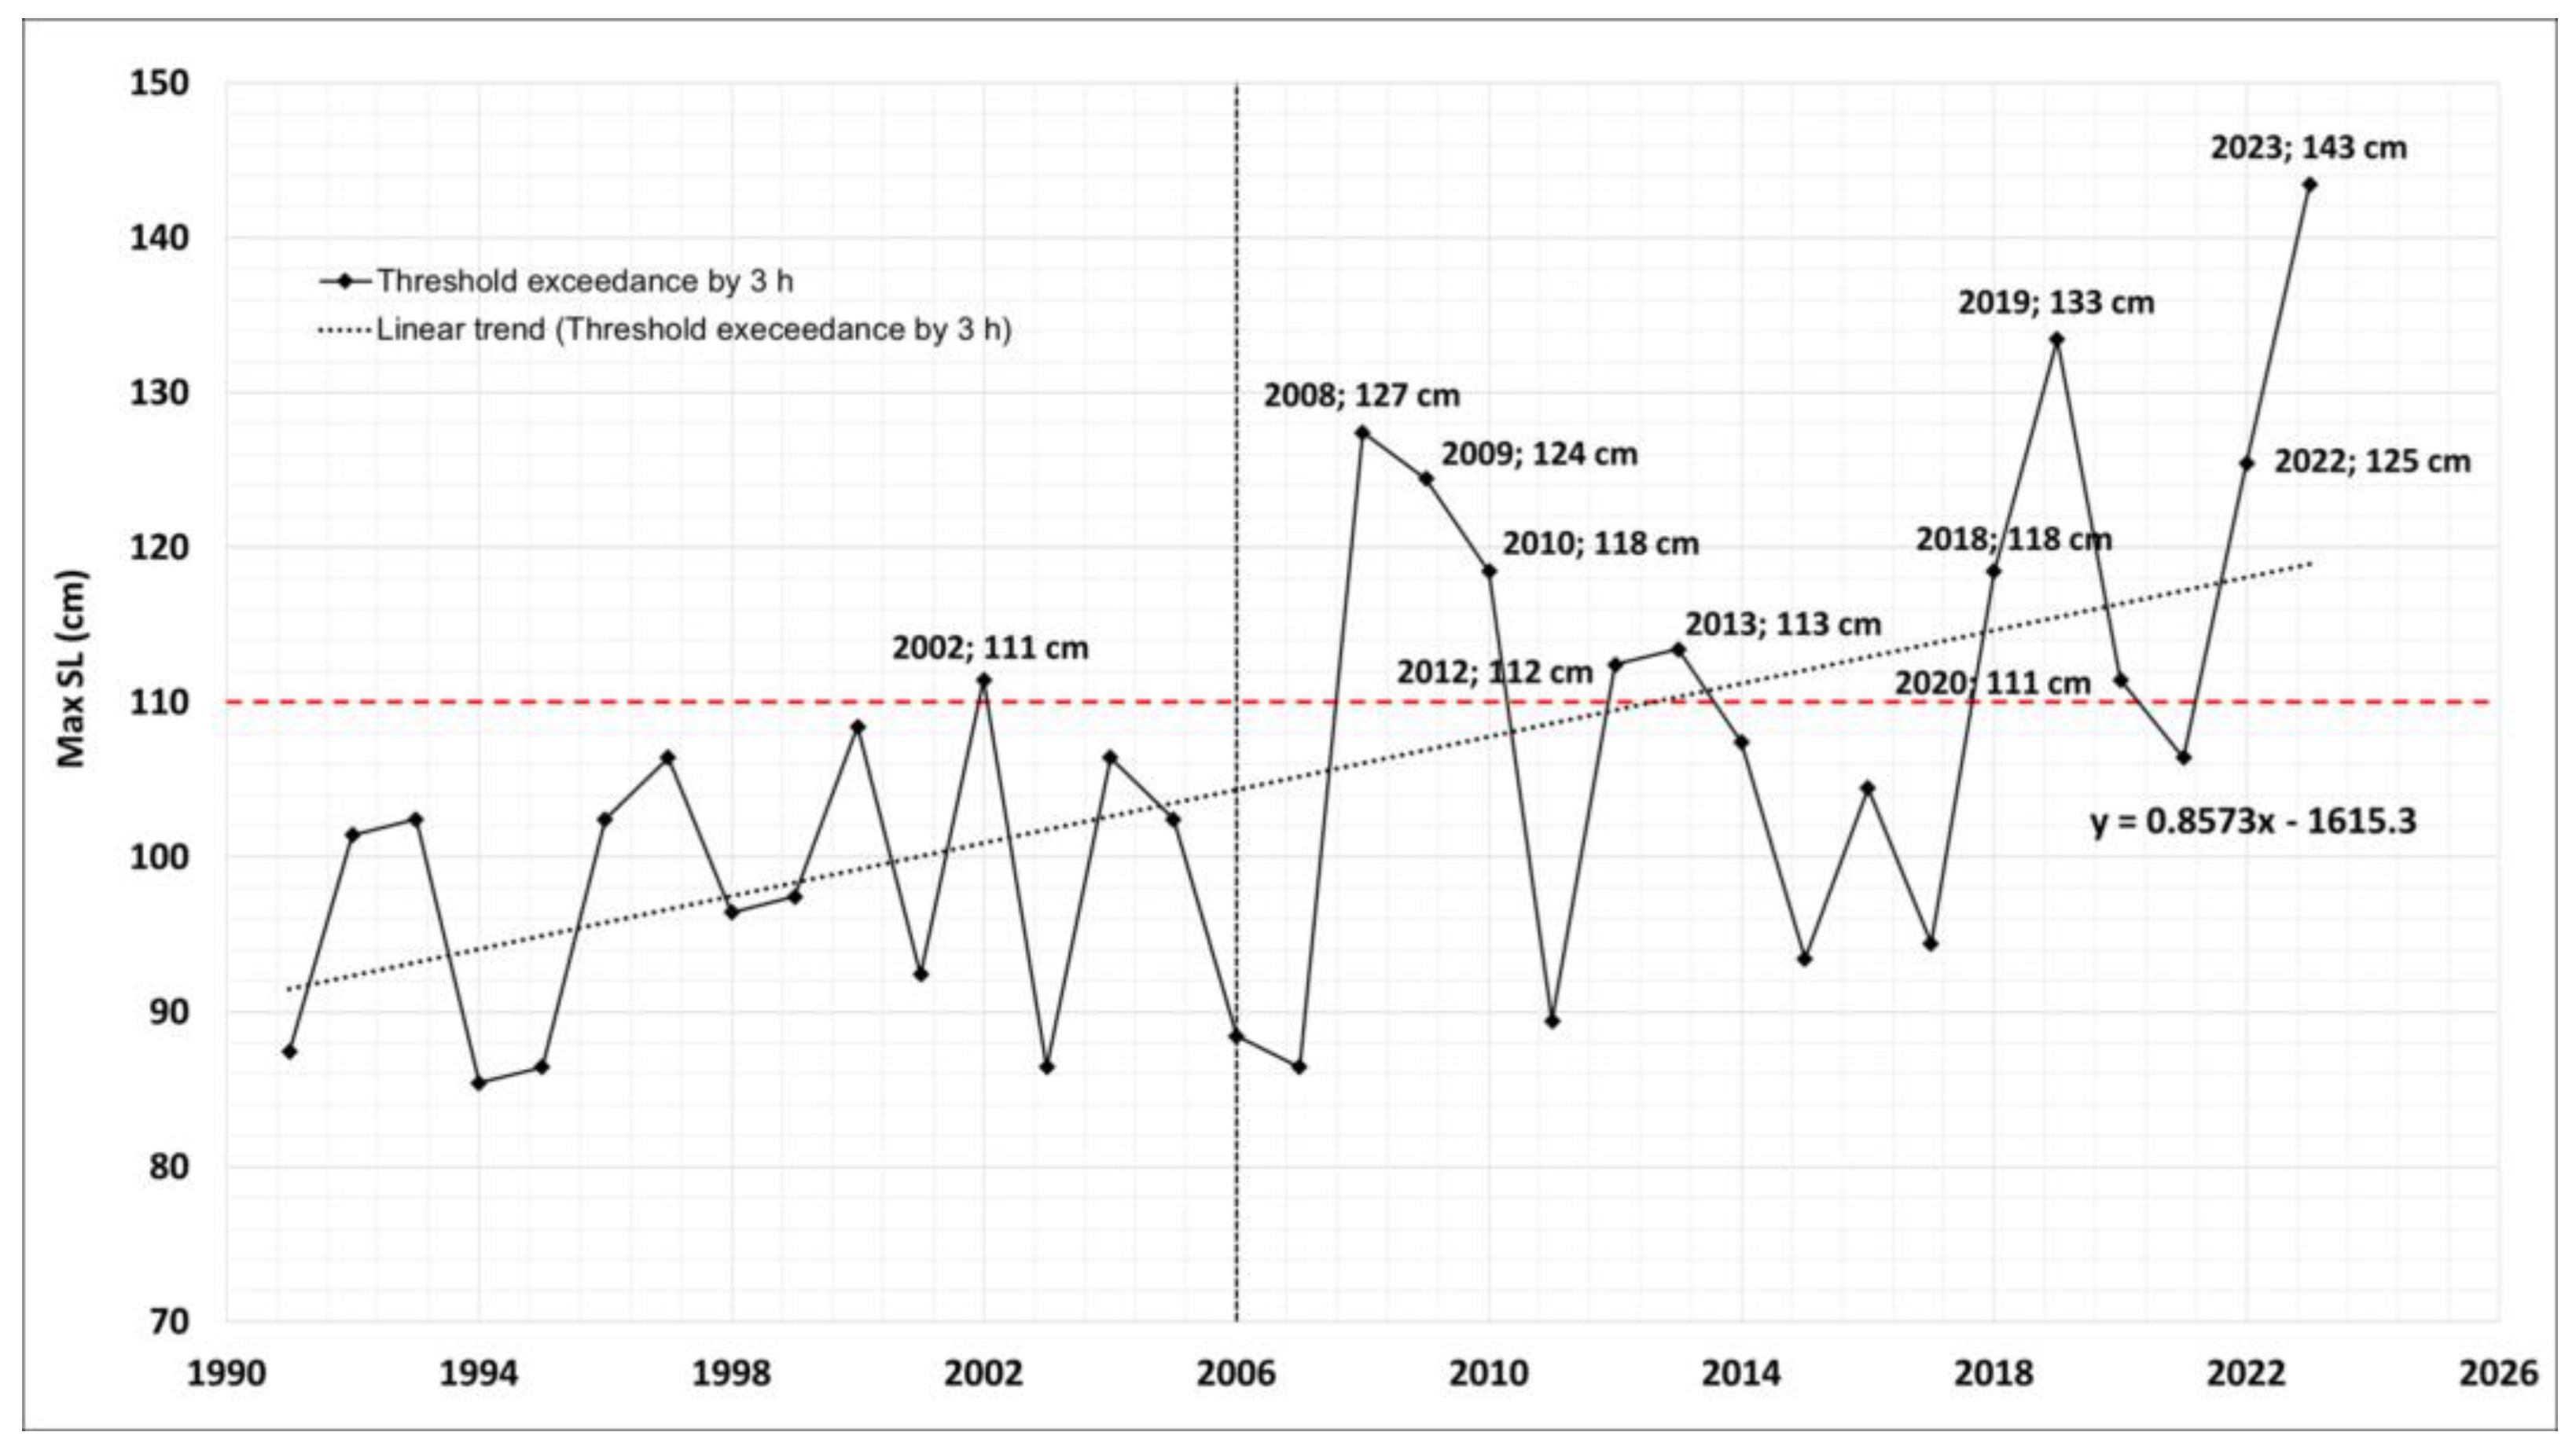
3.2. Annual Exceedance of Flooding Threshold
3.3. Base for Downscaling Analysis
3.4. Short-Term (Surge) Analysis
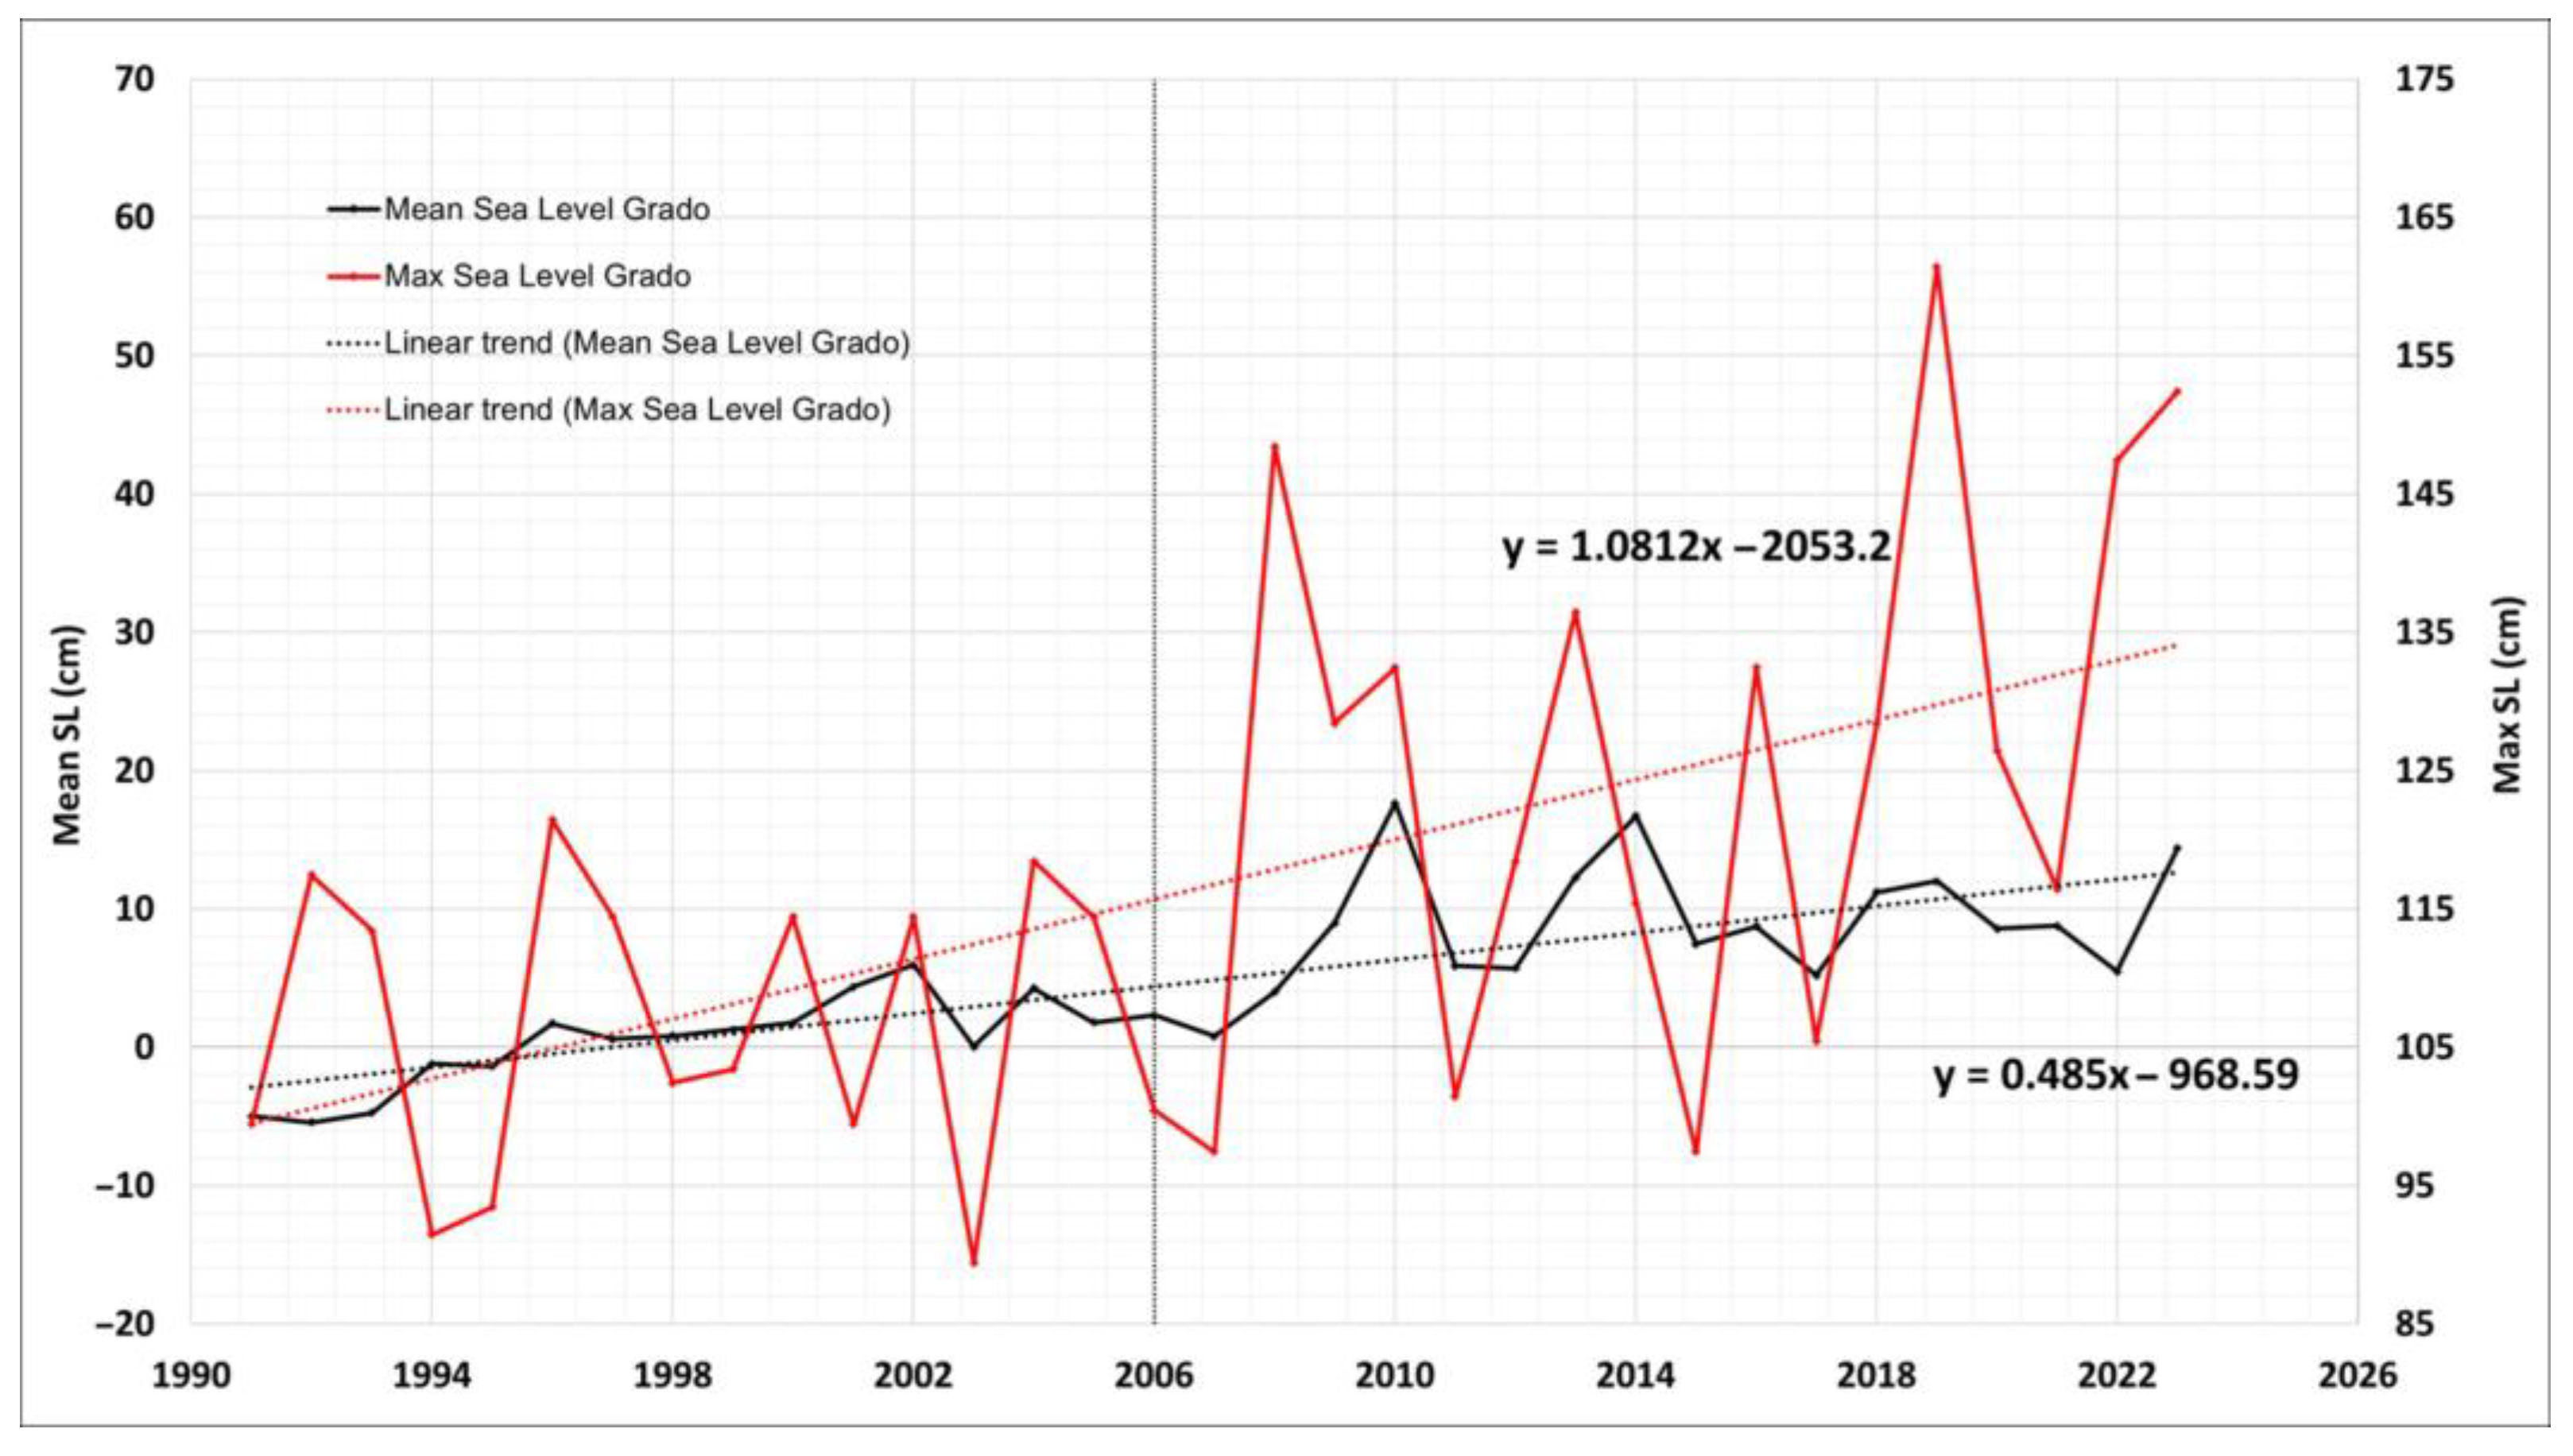
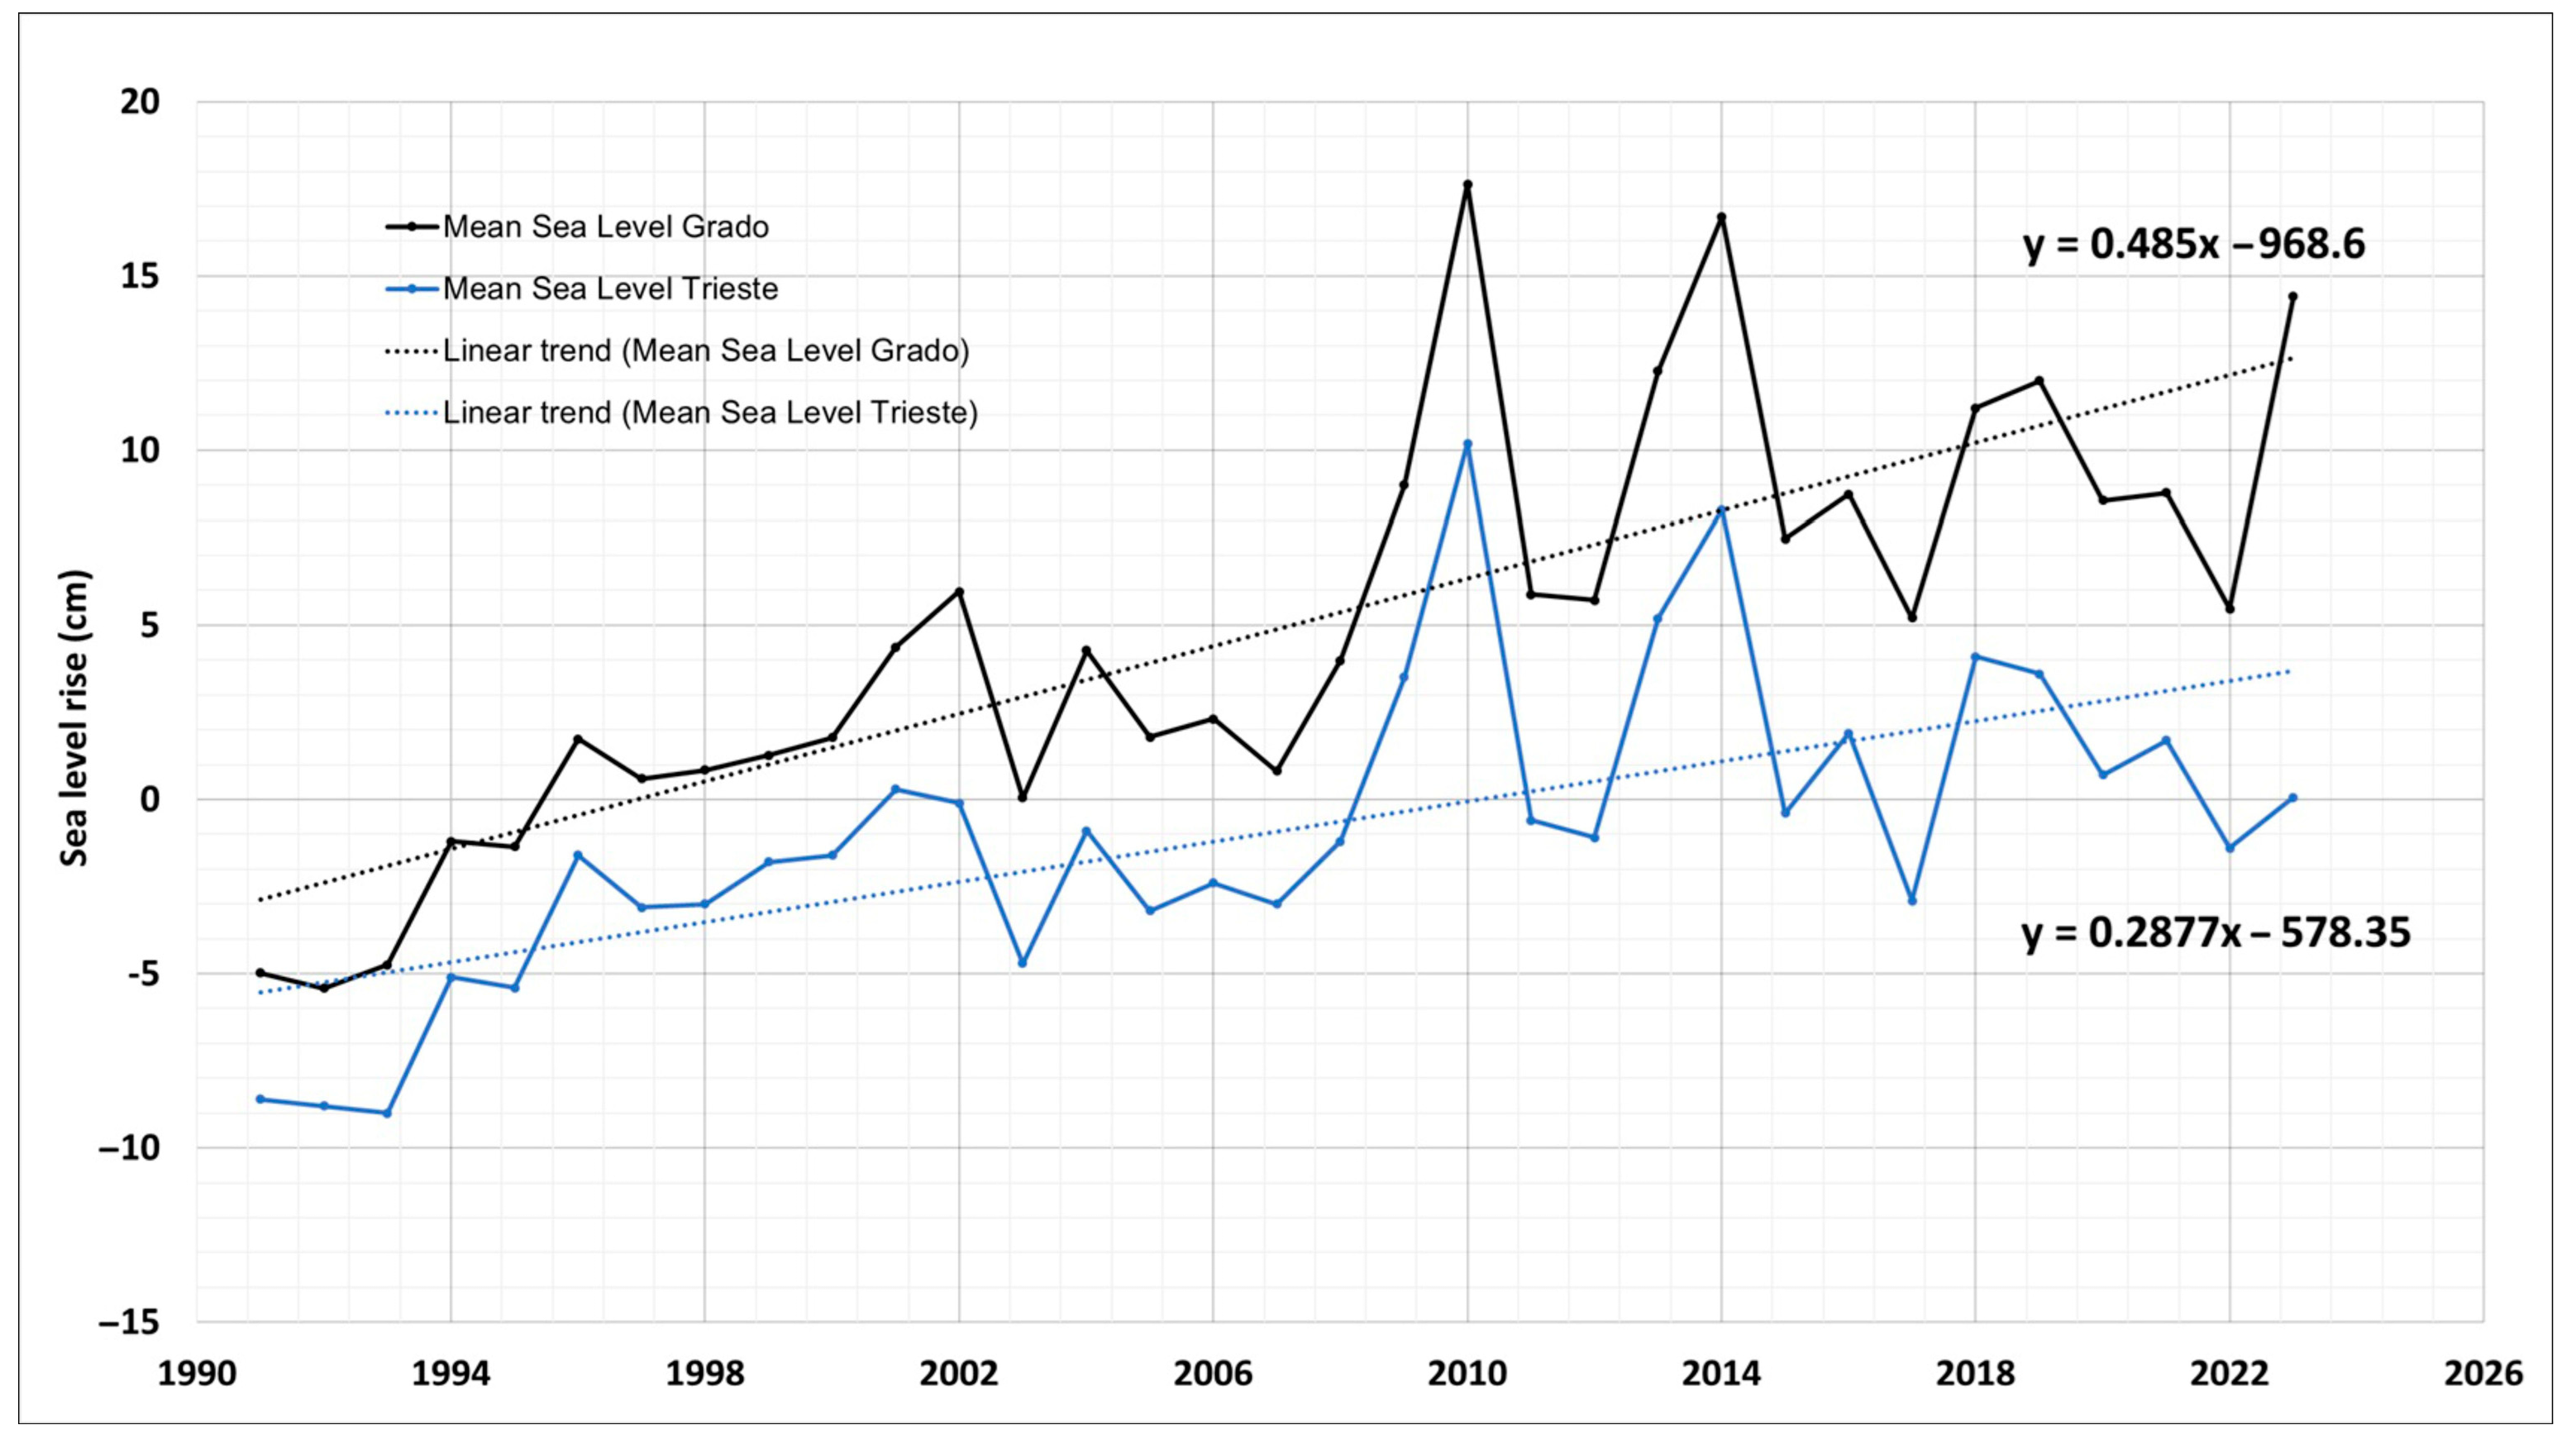
3.5. Long-Term (RSLR) Analysis
4. Results and Discussion
4.1. Extreme Water Levels
4.2. Analysis of Mean vs. Max Levels and Threshold Exceedance
4.3. Downscaling Analysis of Short-Term Flooding
4.3.1. The 2-Year Return Period Episodic Event
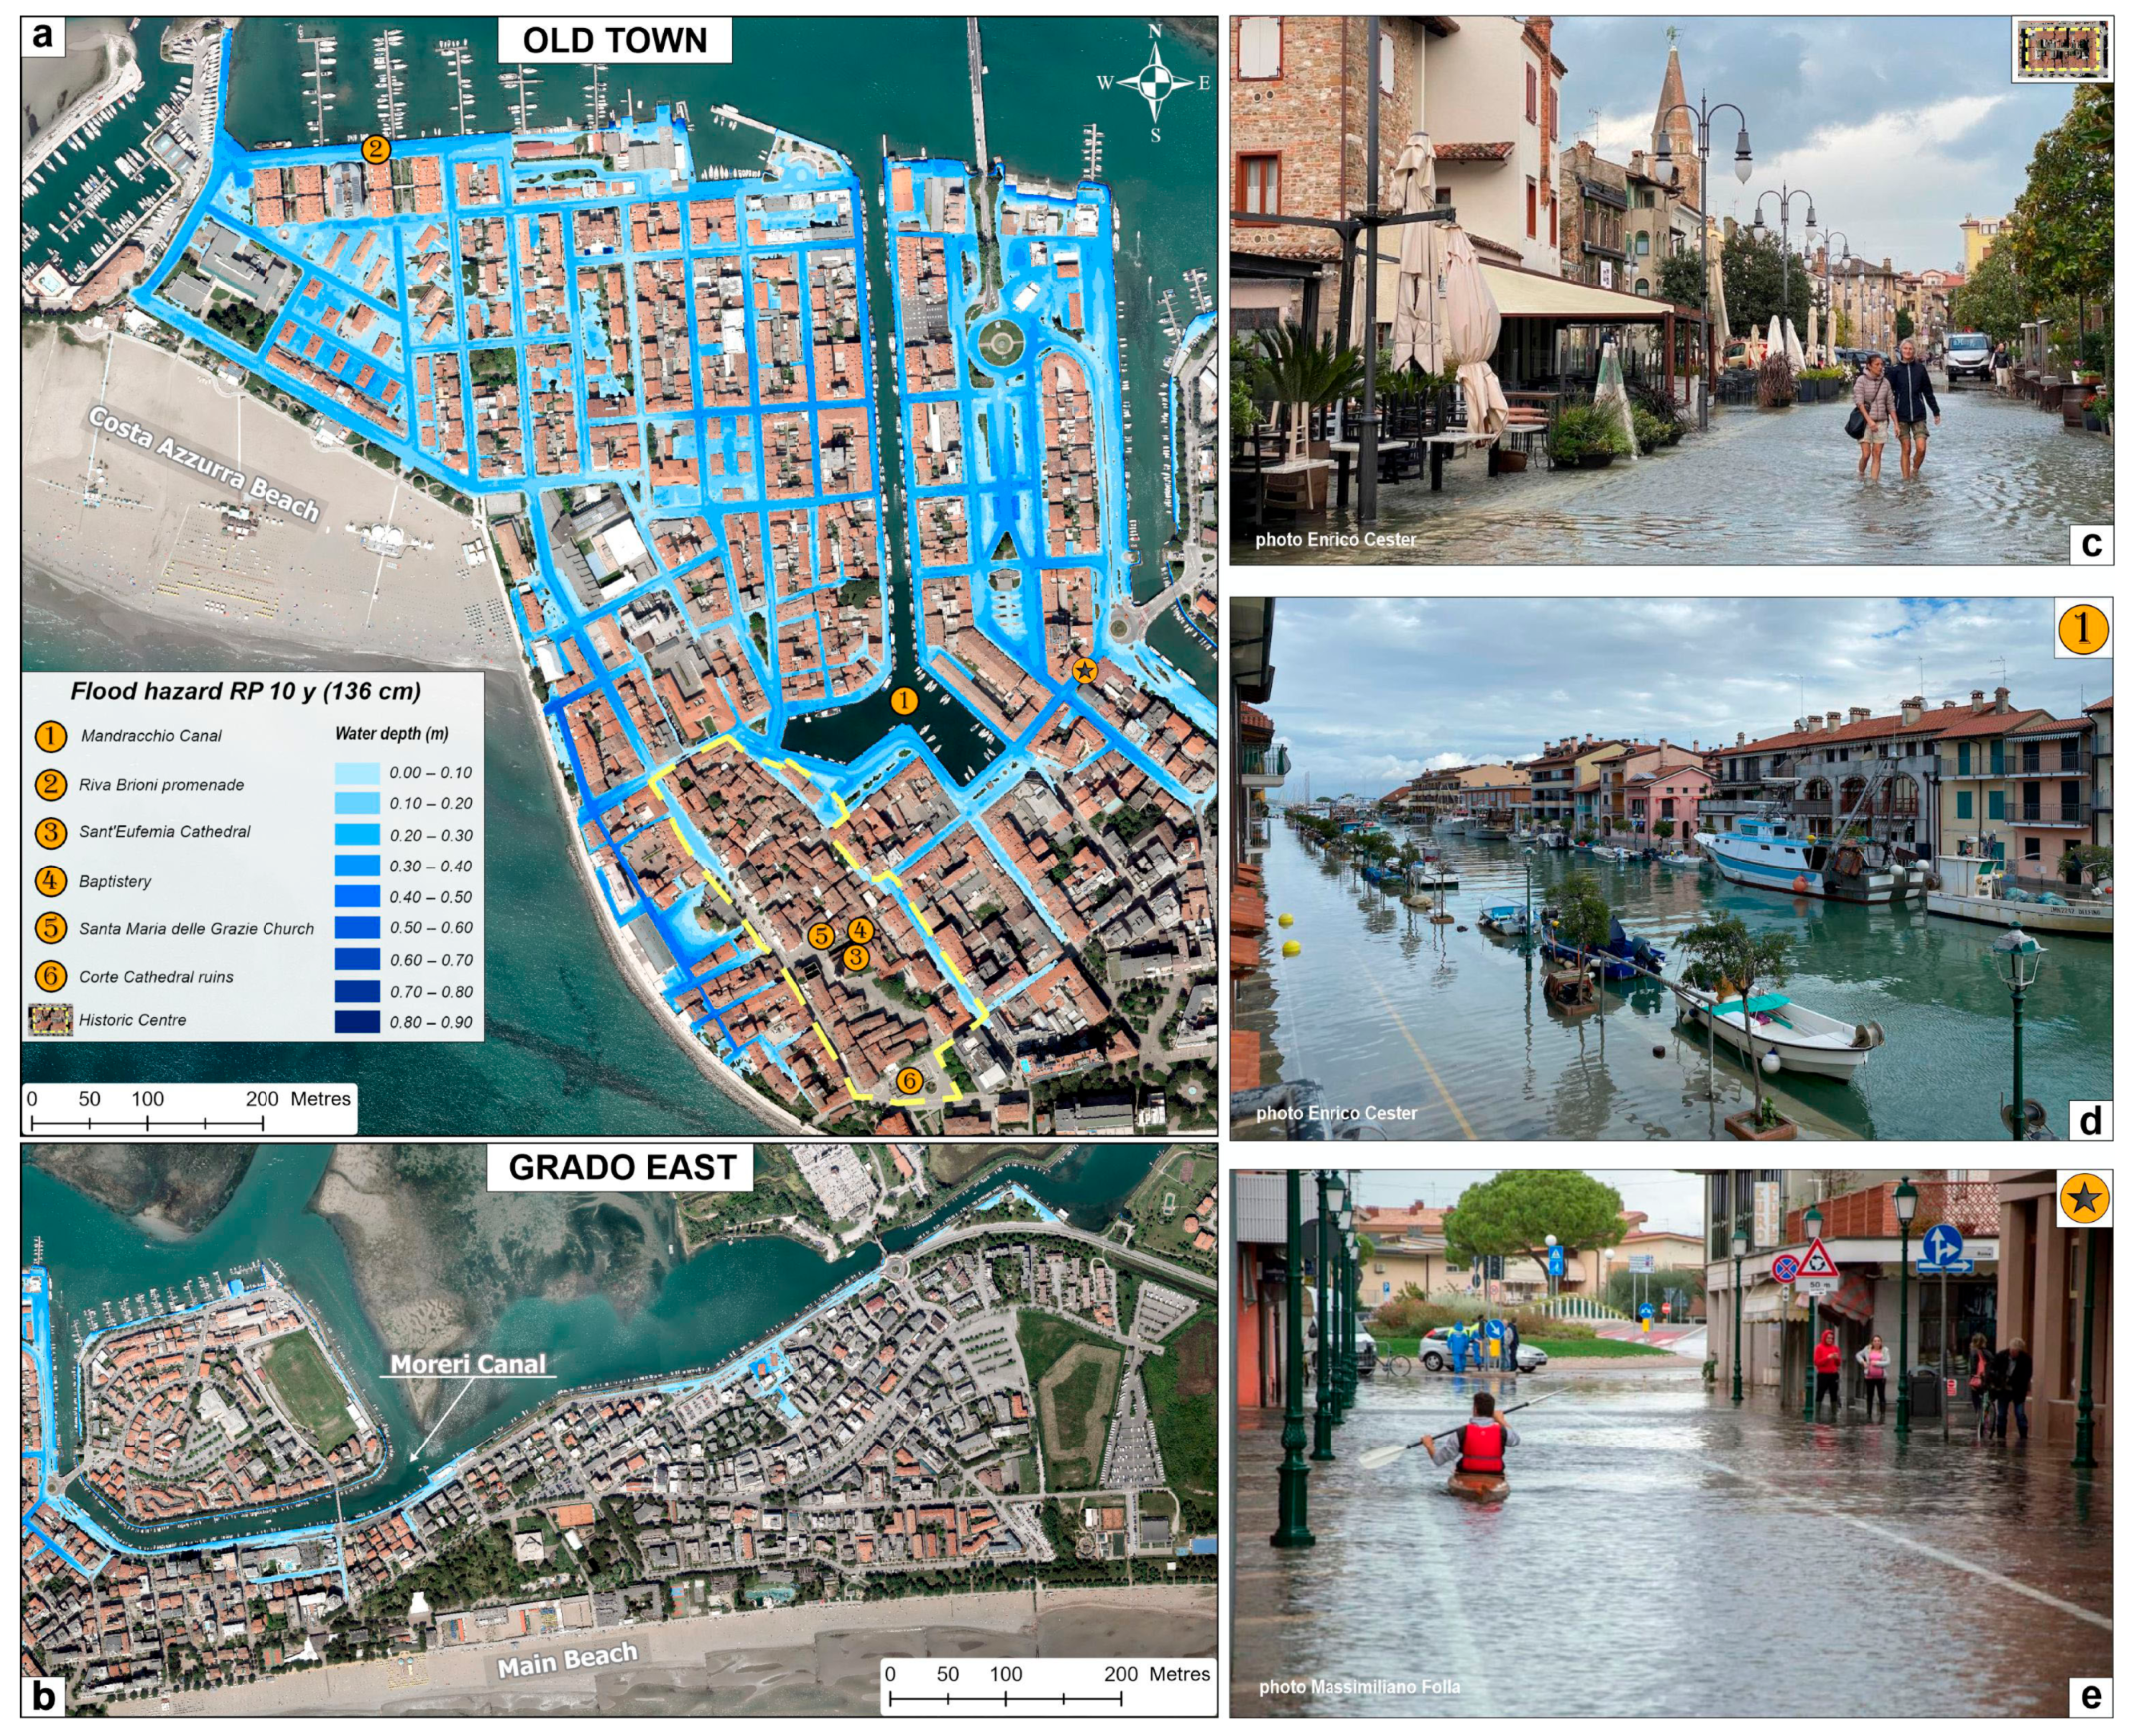
4.3.2. The 10-Year Return Period Episodic Event
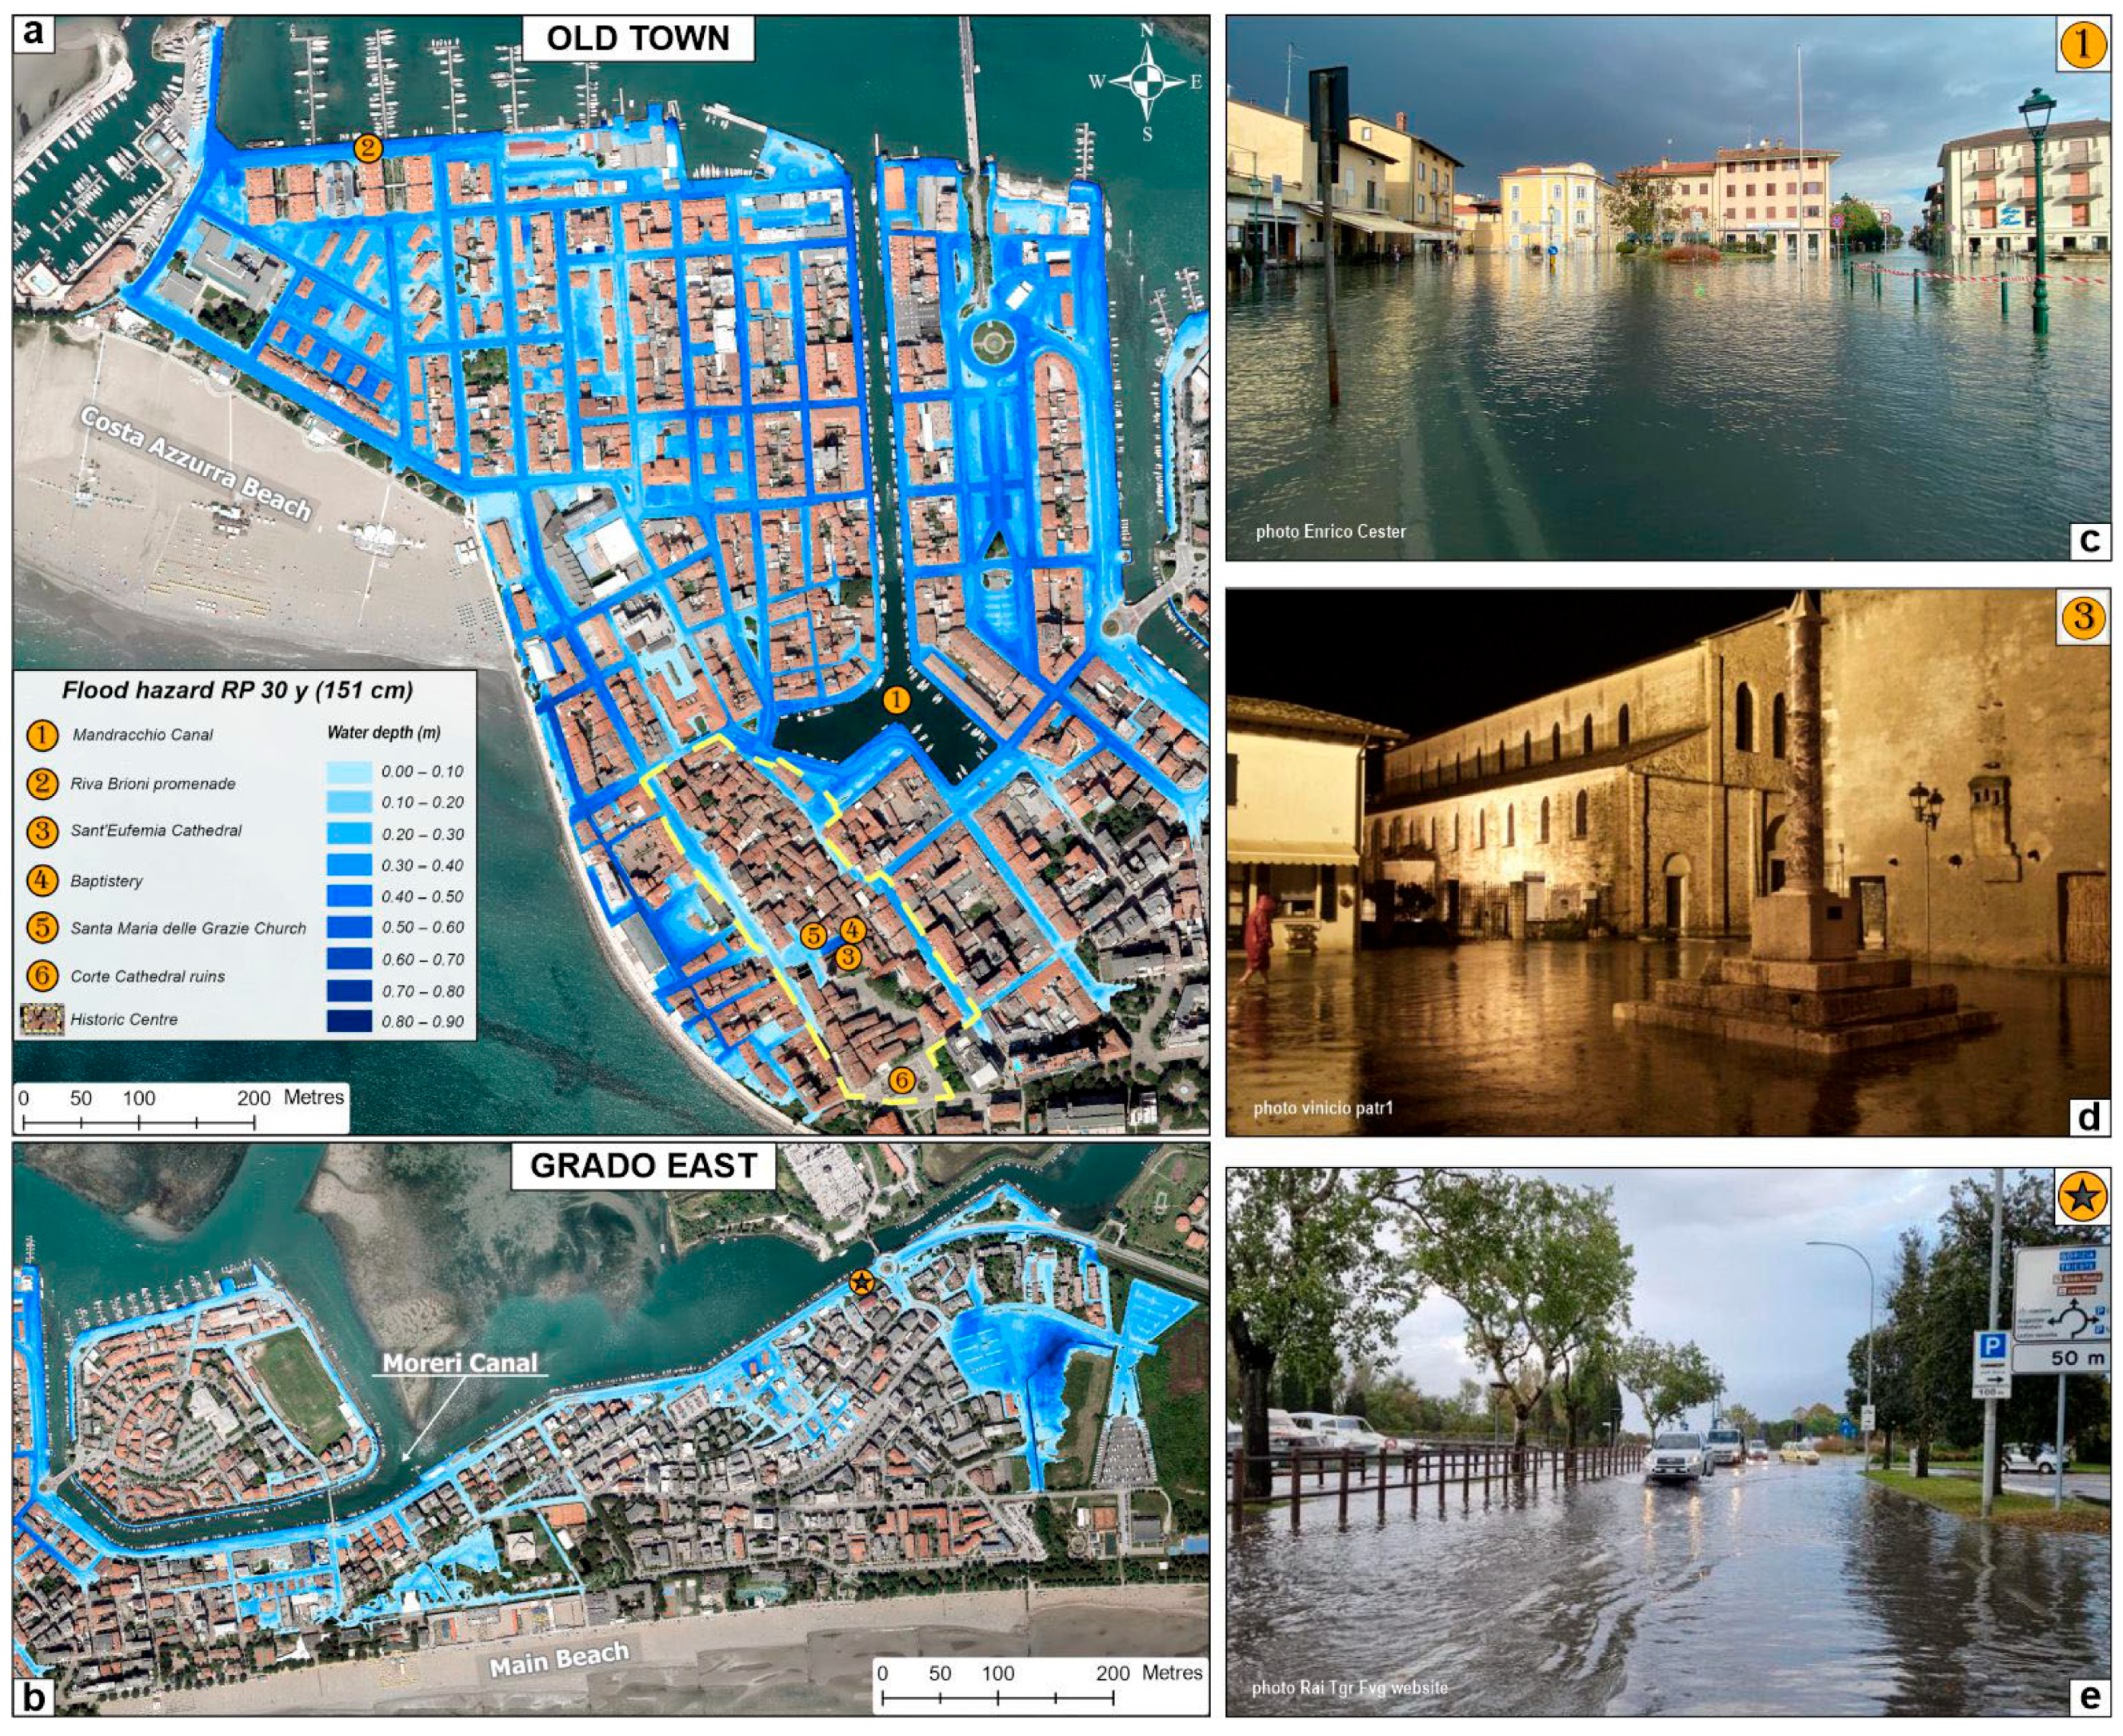
4.3.3. The 30-Year Return Period Episodic Event
4.3.4. The 100-Year Return Period Episodic Event
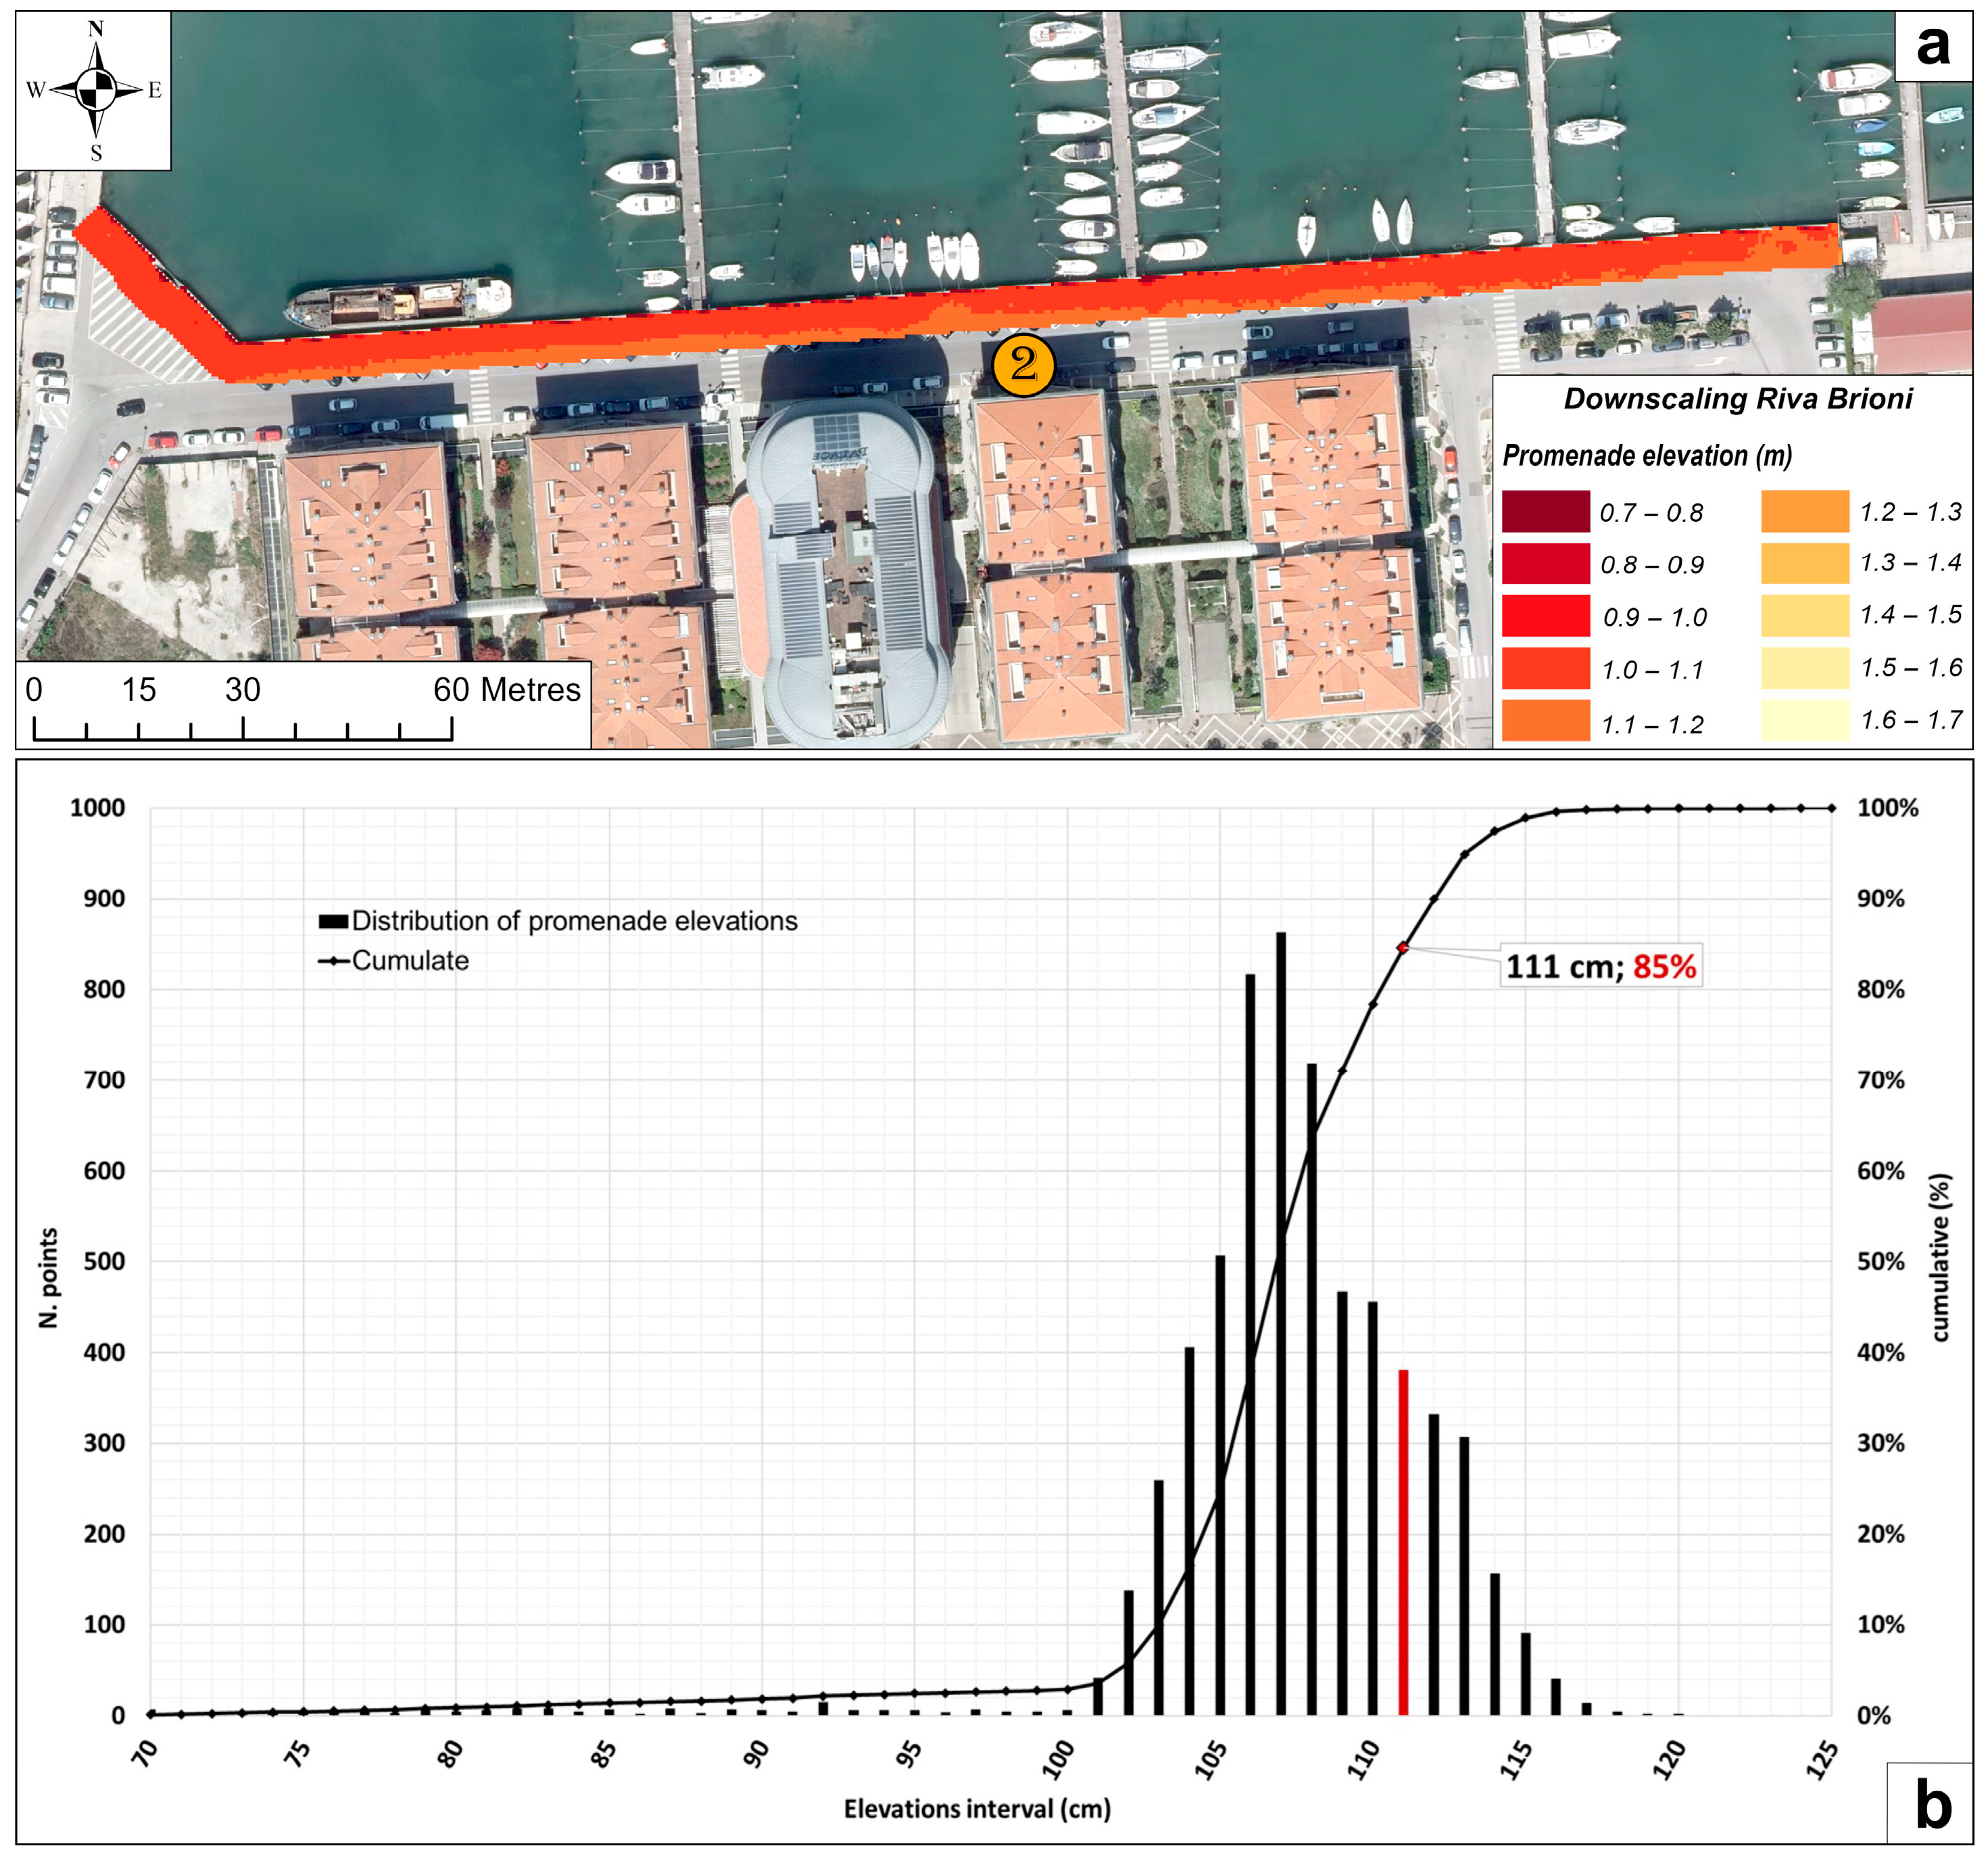
4.3.5. Lagoon Promenade Downscaling Analysis
Riva Brioni—Mandracchio C.
Mandracchio C.
4.4. Downscaling Analysis of Long-Term Flooding
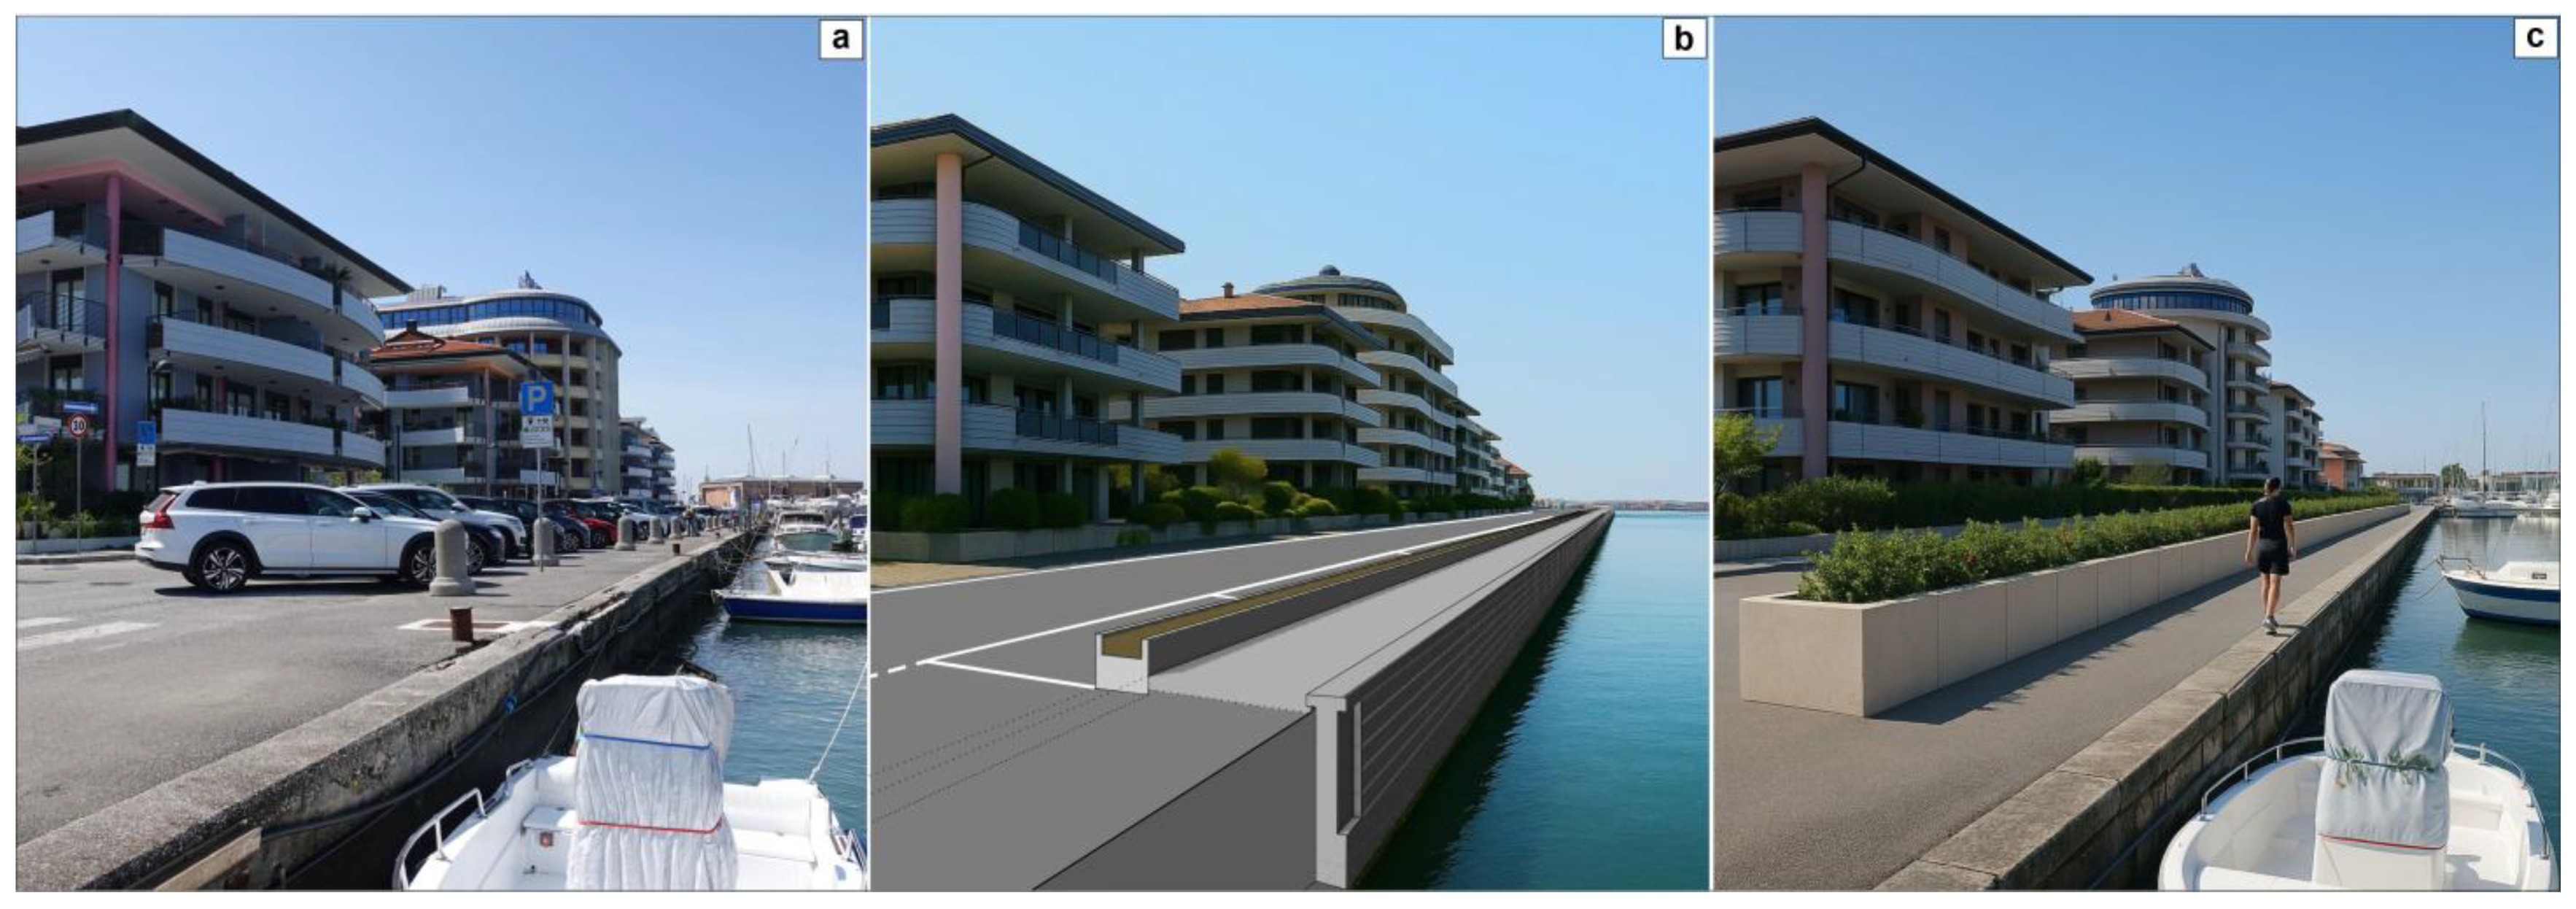
4.5. Adaptation Plans
5. Conclusions
Supplementary Materials
Author Contributions
Funding
Data Availability Statement
Acknowledgments
Conflicts of Interest
Abbreviations
| SLR | Sea Level Rise |
| RSLR | Relative Sea Level Rise |
| VLM | Vertical Land Motion |
| RP | Return Period |
| DTM | Digital Terrain Model |
References
- Tuel, A.; Eltahir, E.A.B. Why Is the Mediterranean a Climate Change Hot Spot? J. Clim. 2020, 33, 5829–5843. [Google Scholar] [CrossRef]
- Paxian, A.; Hertig, E.; Seubert, S.; Vogt, G.; Jacobeit, J.; Paeth, H. Present-Day and Future Mediterranean Precipitation Extremes Assessed by Different Statistical Approaches. Clim. Dyn. 2015, 44, 845–860. [Google Scholar] [CrossRef]
- Cramer, W.; Guiot, J.; Fader, M.; Garrabou, J.; Gattuso, J.-P.; Iglesias, A.; Lange, M.A.; Lionello, P.; Llasat, M.C.; Paz, S.; et al. Climate Change and Interconnected Risks to Sustainable Development in the Mediterranean. Nat. Clim. Change 2018, 8, 972–980. [Google Scholar] [CrossRef]
- Lionello, P.; Scarascia, L. The Relation of Climate Extremes with Global Warming in the Mediterranean Region and Its North versus South Contrast. Reg. Environ. Change 2020, 20, 31. [Google Scholar] [CrossRef]
- MedECC. Climate and Environmental Change in the Mediterranean Basin. In Current Situation and Risks for the Future. First Mediterranean Assessment Report (MAR1); Cramer, W., Marini, K., Guiot, J., Eds.; Union for the Mediterranean, Plan Bleu, UNEP/MAP: Marseille, France, 2020; p. 632. [Google Scholar] [CrossRef]
- IPCC. IPCC, 2022: Climate Change 2022: Impacts, Adaptation, and Vulnerability. Working Group II Contribution of to the Sixth Assessment Report of the Intergovernmental Panel on Climate Change; Pörtner, H.-O., Roberts, D.C., Tignor, M.M.B., Poloczanska, E., Mintenbeck, K., Alegría, A., Craig, M., Langsdorf, S., Löschke, S., Möller, V., et al., Eds.; Cambridge University Press: Cambridge, UK; New York NY, USA, 2022; p. 3056. [Google Scholar]
- Giorgi, F. Climate Change Hot-Spots. Geophys. Res. Lett. 2006, 33, L08707. [Google Scholar] [CrossRef]
- Giorgi, F.; Lionello, P. Climate Change Projections for the Mediterranean Region. Glob. Planet. Change 2008, 63, 90–104. [Google Scholar] [CrossRef]
- Vitousek, S.; Barnard, P.L.; Limber, P.; Erikson, L.; Cole, B. A Model Integrating Longshore and Cross-Shore Processes for Predicting Long-Term Shoreline Response to Climate Change. J. Geophys. Res. Earth Surf. 2017, 122, 782–806. [Google Scholar] [CrossRef]
- Taherkhani, M.; Vitousek, S.; Barnard, P.L.; Frazer, N.; Anderson, T.R.; Fletcher, C.H. Sea-Level Rise Exponentially Increases Coastal Flood Frequency. Sci. Rep. 2020, 10, 6466. [Google Scholar] [CrossRef]
- Ku, H.; Kim, T.; Song, Y.-I. Coastal Vulnerability Assessment of Sea-Level Rise Associated with Typhoon-Induced Surges in South Korea. Ocean Coast. Manag. 2021, 213, 105884. [Google Scholar] [CrossRef]
- Neumann, B.; Vafeidis, A.T.; Zimmermann, J.; Nicholls, R.J. Future Coastal Population Growth and Exposure to Sea-Level Rise and Coastal Flooding—A Global Assessment. PLoS ONE 2015, 10, e0131375. [Google Scholar] [CrossRef]
- Ranasinghe, R. Assessing Climate Change Impacts on Open Sandy Coasts: A Review. Earth Sci. Rev. 2016, 160, 320–332. [Google Scholar] [CrossRef]
- Vousdoukas, M.I.; Mentaschi, L.; Voukouvalas, E.; Verlaan, M.; Jevrejeva, S.; Jackson, L.P.; Feyen, L. Global Probabilistic Projections of Extreme Sea Levels Show Intensification of Coastal Flood Hazard. Nat. Commun. 2018, 9, 2360. [Google Scholar] [CrossRef] [PubMed]
- Nicholls, R.J.; Adger, W.N.; Hutton, C.W.; Hanson, S.E. (Eds.) Deltas in the Anthropocene; Palgrave Macmillan: Cham, Switzerland, 2020; p. 282. [Google Scholar]
- Bakkensen, L.A. Mediterranean Hurricanes and Associated Damage Estimates. J. Extrem. Events 2017, 4, 1750008. [Google Scholar] [CrossRef]
- Portmann, R.; González-Alemán, J.J.; Sprenger, M.; Wernli, H. How an Uncertain Short-Wave Perturbation on the North Atlantic Wave Guide Affects the Forecast of an Intense Mediterranean Cyclone (Medicane Zorbas). Weather Clim. Dynam. 2020, 1, 597–615. [Google Scholar] [CrossRef]
- Scicchitano, G.; Scardino, G.; Monaco, C.; Piscitelli, A.; Milella, M.; De Giosa, F.; Mastronuzzi, G. Comparing Impact Effects of Common Storms and Medicanes along the Coast of South-Eastern Sicily. Mar. Geol. 2021, 439, 106556. [Google Scholar] [CrossRef]
- Marcos, M.; Tsimplis, M.N.; Shaw, A.G.P. Sea Level Extremes in Southern Europe. J. Geophys. Res. Ocean. 2009, 114, C01007. [Google Scholar] [CrossRef]
- Conte, D.; Lionello, P. Characteristics of Large Positive and Negative Surges in the Mediterranean Sea and Their Attenuation in Future Climate Scenarios. Glob. Planet. Change 2013, 111, 159–173. [Google Scholar] [CrossRef]
- Lionello, P.; Cavaleri, L.; Nissen, K.M.; Pino, C.; Raicich, F.; Ulbrich, U. Severe Marine Storms in the Northern Adriatic: Characteristics and Trends. Phys. Chem. Earth 2012, 40–41, 93–105. [Google Scholar] [CrossRef]
- Međugorac, I.; Orlić, M.; Janeković, I.; Pasarić, Z.; Pasarić, M. Adriatic Storm Surges and Related Cross-Basin Sea-Level Slope. J. Mar. Syst. 2018, 181, 79–90. [Google Scholar] [CrossRef]
- Pervan, M.; Šepić, J. Analysis of the Eastern Adriatic Sea Level Extremes. ST-OPEN 2023, 4, e2023.2111.5. [Google Scholar] [CrossRef]
- Mel, R.; Pietro Viero, D.; Carniello, L.; Defina, A.; D’Alpaos, L. Simplified Methods for Real-Time Prediction of Storm Surge Uncertainty: The City of Venice Case Study. Adv. Water Resour. 2014, 71, 177–185. [Google Scholar] [CrossRef]
- Ferrarin, C.; Valentini, A.; Vodopivec, M.; Klaric, D.; Massaro, G.; Bajo, M.; De Pascalis, F.; Fadini, A.; Ghezzo, M.; Menegon, S.; et al. Integrated Sea Storm Management Strategy: The 29 October 2018 Event in the Adriatic Sea. Nat. Hazards Earth Syst. Sci. 2020, 20, 73–93. [Google Scholar] [CrossRef]
- Perini, L.; Calabrese, L.; Luciani, P.; Olivieri, M.; Galassi, G.; Spada, G. Sea-Level Rise along the Emilia-Romagna Coast (Northern Italy) in 2100: Scenarios and Impacts. Nat. Hazards Earth Syst. Sci. 2017, 17, 2271–2287. [Google Scholar] [CrossRef]
- Gallina, V.; Torresan, S.; Zabeo, A.; Rizzi, J.; Carniel, S.; Sclavo, M.; Pizzol, L.; Marcomini, A.; Critto, A. Assessment of Climate Change Impacts in the North Adriatic Coastal Area. Part II: Consequences for Coastal Erosion Impacts at the Regional Scale. Water 2019, 11, 1300. [Google Scholar] [CrossRef]
- Noon, V.; Rivière, C.; Strosser, P.; Manea, E.; Gissi, E.; Barbanti, A. Study on Integrating an Eco-System-Based Approach into Maritime Spatial Planning—Valuation Case Study: Assessing and Valuing Ecosystem Services in the Northern Adriatic. Final Report. 2021. Available online: https://www.milieu.be/wp-content/uploads/2021/08/Study-on-EBA-in-MSP-NAdriatic-case-study-final-report-25.08.2021.pdf (accessed on 23 May 2025).
- Ferrarin, C.; Bajo, M.; Benetazzo, A.; Cavaleri, L.; Chiggiato, J.; Davison, S.; Davolio, S.; Lionello, P.; Orlić, M.; Umgiesser, G. Local and Large-Scale Controls of the Exceptional Venice Floods of November 2019. Prog. Oceanogr. 2021, 197, 102628. [Google Scholar] [CrossRef]
- Rizzi, J.; Torresan, S.; Zabeo, A.; Critto, A.; Tosoni, A.; Tomasin, A.; Marcomini, A. Assessing Storm Surge Risk under Future Sea-Level Rise Scenarios: A Case Study in the North Adriatic Coast. J. Coast. Conserv. 2017, 21, 453–471. [Google Scholar] [CrossRef]
- Melet, A.; Meyssignac, B.; Almar, R.; Le Cozannet, G. Under-Estimated Wave Contribution to Coastal Sea-Level Rise. Nat. Clim. Chang. 2018, 8, 234–239. [Google Scholar] [CrossRef]
- Bonaldo, D.; Antonioli, F.; Archetti, R.; Bezzi, A.; Correggiari, A.; Davolio, S.; De Falco, G.; Fantini, M.; Fontolan, G.; Furlani, S.; et al. Integrating Multidisciplinary Instruments for Assessing Coastal Vulnerability to Erosion and Sea Level Rise: Lessons and Challenges from the Adriatic Sea. J. Coast. Conserv. 2019, 23, 19–37. [Google Scholar] [CrossRef]
- McEvoy, S.; Haasnoot, M.; Biesbroek, R. How Are European Countries Planning for Sea Level Rise? Ocean. Coast. Manag. 2021, 203, 105512. [Google Scholar] [CrossRef]
- Lagarias, A.; Stratigea, A. Coastalization Patterns in the Mediterranean: A Spatiotemporal Analysis of Coastal Urban Sprawl in Tourism Destination Areas. GeoJournal 2023, 88, 2529–2552. [Google Scholar] [CrossRef]
- Masson-Delmotte, V.; Zhai, P.; Pirani, A.; Connors, S.L.; Péan, C.; Chen, Y.; Goldfarb, L.; Gomis, M.I.; Robin Matthews, J.B.; Berger, S.; et al. (Eds.) IPCC, 2021: Climate Change 2021: The Physical Science Basis. Working Group I Contribution of to the Sixth Assessment Report of the Intergovernmental Panel on Climate Change; Cambridge University Press: Cambridge, UK; New York, NY, USA, 2021. [Google Scholar]
- Lionello, P. Climate Change 2022—Impatti, Adattamento e Vulnerabilità Il Secondo Volume (WG2) Del Sesto Rapporto Di Valutazione Dell’IPCC, La Più Aggiornata e Completa Rassegna Scientifica Sui Cambiamenti Climatici. Available online: https://files.cmcc.it/ar6/wg2/scienziati_italiani_IPCC_ar6_wg2.pdf (accessed on 14 May 2025).
- Merkens, J.L.; Reimann, L.; Hinkel, J.; Vafeidis, A.T. Gridded Population Projections for the Coastal Zone under the Shared Socioeconomic Pathways. Glob. Planet. Change 2016, 145, 57–66. [Google Scholar] [CrossRef]
- Andreadis, K.M.; Wing, O.E.J.; Colven, E.; Gleason, C.J.; Bates, P.D.; Brown, C.M. Urbanizing the Floodplain: Global Changes of Imperviousness in Flood-Prone Areas. Environ. Res. Lett. 2022, 17, 104024. [Google Scholar] [CrossRef]
- Nicholls, R.J.; Wong, P.P.; Burkett, V.R.; Codignotto, J.O.; Hay, J.E.; McLean, R.F.; Ragoonaden, S.; Woodroffe, C.D. Coastal Systems and Low-Lying Areas. In Climate Change 2007: Impacts, Adaptation and Vulnerability. Contribution of Working Group II to the Fourth Assessment Report of the Intergovernmental Panel on Climate Change; Parry, M., Canziani, O., Palutikof, J., van der Linden, P., Hanson, C., Eds.; Cambridge University Press: Cambridge, UK, 2007; pp. 315–356. [Google Scholar]
- Wong, P.P.; Losada, I.J.; Gattuso, J.-P.; Hinkel, J.; Khattabi, A.; Mclennes, K.L.; Saito, Y.; Sallenger, A. Coastal Systems and Low-Lying Areas. In Climate Change 2014: Impacts, Adaptation, and Vulnerability. Part A: Global and Sectoral Aspects. Contribution of Working Group II to the Fifth Assessment Report of the Intergovernmental Panel on Climate Change; Field, C.B., Barros, V.R., Dokken, D.J., Mach, K.J., Mastrandrea, M.D., Eds.; Cambridge University Press: Cambridge, UK; New York, NY, USA, 2014; pp. 361–409. [Google Scholar]
- Hlodversdottir, A.O.; Bjornsson, B.; Andradottir, H.O.; Eliasson, J.; Crochet, P. Assessment of Flood Hazard in a Combined Sewer System in Reykjavik City Centre. Water Sci. Technol. 2015, 71, 1471–1477. [Google Scholar] [CrossRef] [PubMed]
- Harley, M.D.; Turner, I.L.; Kinsela, M.A.; Middleton, J.H.; Mumford, P.J.; Splinter, K.D.; Phillips, M.S.; Simmons, J.A.; Hanslow, D.J.; Short, A.D. Extreme Coastal Erosion Enhanced by Anomalous Extratropical Storm Wave Direction. Sci. Rep. 2017, 7, 6033. [Google Scholar] [CrossRef]
- Wu, X.; Wang, Z.; Guo, S.; Liao, W.; Zeng, Z.; Chen, X. Scenario-Based Projections of Future Urban Inundation within a Coupled Hydrodynamic Model Framework: A Case Study in Dongguan City, China. J. Hydrol. 2017, 547, 428–442. [Google Scholar] [CrossRef]
- Locatelli, L.; Guerrero, M.; Russo, B.; Martínez-Gomariz, E.; Sunyer, D.; Martínez, M. Socio-Economic Assessment of Green Infrastructure for Climate Change Adaptation in the Context of Urban Drainage Planning. Sustainability 2020, 12, 3792. [Google Scholar] [CrossRef]
- Rufat, S.; Tate, E.; Burton, C.G.; Maroof, A.S. Social Vulnerability to Floods: Review of Case Studies and Implications for Measurement. Int. J. Disaster Risk Reduct. 2015, 14, 470–486. [Google Scholar] [CrossRef]
- Hammond, M.J.; Chen, A.S.; Djordjević, S.; Butler, D.; Mark, O. Urban Flood Impact Assessment: A State-of-the-Art Review. Urban Water J. 2015, 12, 14–29. [Google Scholar] [CrossRef]
- Agonafir, C.; Lakhankar, T.; Khanbilvardi, R.; Krakauer, N.; Radell, D.; Devineni, N. A Review of Recent Advances in Urban Flood Research. Water Secur. 2023, 19, 100141. [Google Scholar] [CrossRef]
- Cooley, S.; Schoeman, D.; Bopp, L.; Boyd, P.; Donner, S.; Ghebrehiwet, D.Y.; Ito, S.-I.; Kiessling, W.; Martinetto, P.; Ojea, E.; et al. Oceans and Coastal Ecosystems and Their Services. In Climate Change 2022—Impacts, Adaptation and Vulnerability; Pörtner, H.-O., Roberts, D.C., Tignor, M., Poloczanska, E.S., Mintenbeck, K., Alegría, A., Craig, M., Langsdorf, S., Löschke, S., Möller, V., et al., Eds.; Cambridge University Press: Cambridge, UK; New York, NY, USA, 2022; pp. 379–550. [Google Scholar]
- Reimann, L.; Vafeidis, A.T.; Brown, S.; Hinkel, J.; Tol, R.S.J. Mediterranean UNESCO World Heritage at Risk from Coastal Flooding and Erosion Due to Sea-Level Rise. Nat. Commun. 2018, 9, 4161. [Google Scholar] [CrossRef]
- Vousdoukas, M.I.; Clarke, J.; Ranasinghe, R.; Reimann, L.; Khalaf, N.; Duong, T.M.; Ouweneel, B.; Sabour, S.; Iles, C.E.; Trisos, C.H.; et al. African Heritage Sites Threatened as Sea-Level Rise Accelerates. Nat. Clim. Change 2022, 12, 256–262. [Google Scholar] [CrossRef]
- Tong, S.; Bambrick, H.; Beggs, P.J.; Chen, L.; Hu, Y.; Ma, W.; Steffen, W.; Tan, J. Current and Future Threats to Human Health in the Anthropocene. Environ. Int. 2022, 158, 106892. [Google Scholar] [CrossRef] [PubMed]
- Rafiq, F.; Ahmed, S.; Ahmad, S.; Khan, A.A. Urban Floods in India. Int. J. Sci. Eng. Res. 2016, 7, 721–734. [Google Scholar]
- Shah, M.A.R.; Rahman, A.; Chowdhury, S.H. Challenges for Achieving Sustainable Flood Risk Management. J. Flood Risk. Manag. 2018, 11, S352–S358. [Google Scholar] [CrossRef]
- Chen, K.F.; Leandro, J. A Conceptual Time-Varying Flood Resilience Index for Urban Areas: Munich City. Water 2019, 11, 830. [Google Scholar] [CrossRef]
- UNFCCC (United Nations Framework Convention on Climate Change). Defining and Understanding Transformational Adaptation at Different Spatial Scales and Sectors, and Assessing Progress in Planning and Implementing Transformational Adaptation Approaches at the Global Level; 2024. Technical Paper by the Secretariat, FCCC/TP/2024/8. Available online: https://unfccc.int/sites/default/files/resource/tp2024_08.pdf (accessed on 23 May 2025).
- Mariano, C.; Marino, M.; Pisacane, G.; Sannino, G. Sea Level Rise and Coastal Impacts: Innovation and Improvement of the Local Urban Plan for a Climate-Proof Adaptation Strategy. Sustainability 2021, 13, 1565. [Google Scholar] [CrossRef]
- Melica, G.; De, F.; Rios, L.; Palermo, C.; Ferrario, M.; Baldi, F.; Ulpiani, M.; Hortelano, O.; Barbosa, A. Covenant of Mayors: 2022 Assessment—Climate Change Mitigation and Adaptation at Local Level; JRC130957; Publications Office of the European Union: Luxembourg, 2022. [Google Scholar] [CrossRef]
- Manzan, M.; Bacaro, G.; Nardini, A.; Casagrande, G.; Pezzi, A.; Petruzzellis, F.; Tordoni, E.; Fontolan, G. Climate Change Risk and Vulnerabilities Analysis in Trieste SECAP. Sustainability 2022, 14, 5973. [Google Scholar] [CrossRef]
- Bisht, D.S.; Chatterjee, C.; Kalakoti, S.; Upadhyay, P.; Sahoo, M.; Panda, A. Modeling Urban Floods and Drainage Using SWMM and MIKE URBAN: A Case Study. Nat. Hazards 2016, 84, 749–776. [Google Scholar] [CrossRef]
- Mignot, E.; Li, X.; Dewals, B. Experimental Modelling of Urban Flooding: A Review. J. Hydrol. 2019, 568, 334–342. [Google Scholar] [CrossRef]
- Habel, S.; Fletcher, C.H.; Anderson, T.R.; Thompson, P.R. Sea-Level Rise Induced Multi-Mechanism Flooding and Contribution to Urban Infrastructure Failure. Sci. Rep. 2020, 10, 3796. [Google Scholar] [CrossRef]
- Gao, M.; Wang, Z.; Yang, H. Review of Urban Flood Resilience: Insights from Scientometric and Systematic Analysis. Int J Env. Res Public Health 2022, 19, 8837. [Google Scholar] [CrossRef] [PubMed]
- Shi, S.; Yang, B.; Jiang, W. Numerical Simulations of Compound Flooding Caused by Storm Surge and Heavy Rain with the Presence of Urban Drainage System, Coastal Dam and Tide Gates: A Case Study of Xiangshan, China. Coast. Eng. 2022, 172, 104064. [Google Scholar] [CrossRef]
- Balaian, S.K.; Sanders, B.F.; Abdolhosseini Qomi, M.J. How Urban Form Impacts Flooding. Nat. Commun. 2024, 15, 6911. [Google Scholar] [CrossRef]
- Xie, W.; Tang, B.; Meng, Q. The Impact of Sea-Level Rise on Urban Properties in Tampa Due to Climate Change. Water 2022, 14, 13. [Google Scholar] [CrossRef]
- Comune Di Grado. La Laguna Di Grado. Available online: https://comune.grado.go.it/it/vivere-il-comune-22477/luoghi-22478/la-laguna-di-grado-69770 (accessed on 2 April 2025).
- Bezzi, A.; Casagrande, G.; Fracaros, S.; Martinucci, D.; Pillon, S.; Sponza, S.; Bratus, A.; Fattor, F.; Fontolan, G. Geomorphological Changes of a Migrating Sandbank: Multidecadal Analysis as a Tool for Managing Conflicts in Coastal Use. Water 2021, 13, 3416. [Google Scholar] [CrossRef]
- Demo. Demografia in Cifre. Bilancio Demografico Mensile e Popolazione Residente per Sesso, Anno 2024. Available online: https://demo.istat.it/app/?a=2024&i=D7B (accessed on 26 May 2025).
- ISTAT. I Flussi Turistici—Anno 2023. Available online: https://www.istat.it/comunicato-stampa/i-flussi-turistici-anno-2023/ (accessed on 23 May 2025).
- Marocco, R. Le Spiagge Di Grado: Situazione Attuale, Tendenze Evolutive Ed Ipotesi d’intervento per Il Risanamento Degli Arenili. GORTANIA—Atti Del Mus. Friul. Di Stor. Naturale. 2000, 22, 5–37. [Google Scholar]
- De Grassi, V. Le Rovine Subacquee Di San Gottardo a Grado. Aquil. Nostra 1952, 23, 27–36. [Google Scholar]
- Gaddi, D. Approdi Nella Laguna Di Grado. Antichità Altoadriatiche XLVI. Strutture Portuali e Rotte Marittime Nell’alto Adriatico Di Età Romana; Zaccaria, C., Ed.; EUT Edizione Università Trieste: Trieste, Roma, 2001. [Google Scholar]
- Tortorici, E. Archeologia Subacquea e Trasformazioni Geomorfologiche Del Territorio: Il Caso Della Laguna Di Grado. In Proceedings of the Atti Convegno Nazionale di Archeologia Subacquea, Anzio, Italy, 30 May–1 June 1997; pp. 315–325. [Google Scholar]
- Bezzi, A.; Pillon, S.; Martinucci, D.; Fontolan, G. Inventory and Conservation Assessment for the Management of Coastal Dunes, Veneto Coasts, Italy. J. Coast. Conserv. 2018, 22, 503–518. [Google Scholar] [CrossRef]
- Regione Autonoma Friuli Venezia Giulia-Autorità Di Sistema Portuale Del Mare Adriatico Orientale. Piano Regolatore Portuale Del Porto Di Monfalcone, Variante Localizzata. Studio Meteomarino. Progettisti: Modimar, SJS Engineering, Archest. 2019. Available online: https://www.regione.fvg.it/rafvg/export/sites/default/RAFVG/ambiente-territorio/pianificazione-gestioneterritorio/FOGLIA9/allegati/Allegato_33_alla_Delibera_2066-2019.pdf (accessed on 27 March 2025).
- Ferla, M.; Crosato, F.; Ragazzo, M. Litorali e Lagune Del Nord Est. Presentazione Convegno “Aree Costiere Del Nord Adriatico e Gestione Delle Alluvioni: Attuazione Della Direttiva 2007/60/CE Sulla Gestione Dal Rischio Alluvione”, Mestre 5 Ottobre 2012. Available online: https://www.venezia.isprambiente.it/ispra/upload/en_home/ricerche/litorali_e_lagune_del_nord-est.pdf (accessed on 27 March 2024).
- Casagrande, G.; Bezzi, A.; Fracaros, S.; Martinucci, D.; Pillon, S.; Salvador, P.; Sponza, S.; Fontolan, G. Quantifying Transgressive Coastal Changes Using UAVs: Dune Migration, Overwash Recovery, and Barrier Flooding Assessment and Interferences with Human and Natural Assets. J. Mar. Sci. Eng. 2023, 11, 1044. [Google Scholar] [CrossRef]
- Petti, M.; Pascolo, S.; Bosa, S.; Bezzi, A.; Fontolan, G. Tidal Flats Morphodynamics: A New Conceptual Model to Predict Their Evolution over a Medium-Long Period. Water 2019, 11, 1176. [Google Scholar] [CrossRef]
- Dorigo, L. La Laguna di Grado e le Sue Foci. Ricerche e Rilievi Idrografici; Pubbl. 165; Magistrato Alle Acque—Ufficio Idrografico: Venezia, Italy, 1965; p. 231. [Google Scholar]
- Perini, L.; Emilia-Romagna, R.; Calabrese, L.; Luciani, P. Il Rischio Da Mareggiata in Emilia-Romagna: L’evento Del 5-6 Febbraio 2015. Il Geol. 2016, 53, 8–17. [Google Scholar]
- Coles, S. An Introduction to Statistical Modeling of Extreme Values; Springer: London, UK, 2001; p. 209. [Google Scholar]
- Caruso, M.F.; Marani, M. Extreme-Coastal-Water-Level Estimation And Projection: A Comparison Of Statistical Methods. Nat. Hazard Earth Syst. Sci. 2022, 22, 1109–1128. [Google Scholar] [CrossRef]
- Città Di Venezia. Grafici e Statistiche. Available online: https://www.comune.venezia.it/it/content/grafici-e-statistiche (accessed on 23 May 2025).
- Gumbel, E. Statistics of Extremes; Columbia University Press: New York, NY, USA, 1958; p. 375. [Google Scholar]
- Goda, Y.; Asce, M. On the Methodology of Selecting Design Wave Height. In Proceedings of the 21st Coastal Engineering Conference, ASCE, New York, NY, USA, 20–25 June 1988; pp. 899–913. [Google Scholar]
- Città Di Venezia. Riferimenti Altimetrici. Available online: https://www.comune.venezia.it/it/content/riferimenti-altimetrici (accessed on 23 May 2025).
- ISPRA. Dati. La Rete Meteo-Mareografica Della Laguna Di Venezia (RMLV). Le Stazioni Meteo-Mareografiche. Available online: https://www.venezia.isprambiente.it/rete-meteo-mareografica (accessed on 23 May 2025).
- National Oceanic and Atmospheric Administration (NOAA). Mapping Coastal Inundation Primer; National Oceanic and Atmospheric Administration: Washington, DC, USA, 2012. Available online: https://coast.noaa.gov/data/digitalcoast/pdf/coastal-inundation-guidebook.pdf (accessed on 27 May 2025).
- Regione Autonoma Della Sardegna; Autorità Di Bacino Regionale Della Sardegna. Piano Di Gestione Del Rischio Di Alluvioni. Relazione Metodologica Sulle Inondazioni Costiere. Available online: https://pianogestionerischioalluvioni.regione.sardegna.it/documenti/1_617_20190124124513.pdf (accessed on 14 May 2025).
- Perini, L.; Calabrese, L.; Deserti, M.; Valentini, A.; Ciavola, P.; Armaroli, C. Le Mareggiate e Gli Impatti Sulla Costa in Emilia-Romagna 1946–2010; I Quaderni ARPA; Regione Emilia Romagna Ambiente: Emilia-Romagna, Italy, 2011; p. 144. Available online: https://www.researchgate.net/publication/290441941 (accessed on 26 May 2025).
- Perini, L.; Calabrese, L.; Salerno, G.; Luciani, P. Mapping of flood risk in Emilia-Romagna coastal areas. In Proceedings of the Abstracts 86° Congresso Nazionale della Società Geologica Italiana, Arcavacata di Rende (CS), Cosenza, Italy, 18–20 September 2012. [Google Scholar] [CrossRef]
- Perini, L.; Calabrese, L.; Salerno, G.; Ciavola, P.; Armaroli, C. Evaluation of Coastal Vulnerability to Flooding: Comparison of Two Different Methodologies Adopted by the Emilia-Romagna Region (Italy). Nat. Hazards Earth Syst. Sci. 2016, 16, 181–194. [Google Scholar] [CrossRef]
- Permanent Service for Mean Sea Level (PSMSL). Trieste. Tide Gauge Data. Available online: https://www.psmsl.org/data/obtaining/stations/154.php (accessed on 23 May 2025).
- Da Lio, C.; Tosi, L. Land Subsidence in the Friuli Venezia Giulia Coastal Plain, Italy: 1992–2010 Results From SAR-Based Interferometry. Sci. Total Environ. 2018, 633, 752–764. [Google Scholar] [CrossRef]
- Areggi, G.; Pezzo, G.; Merryman Boncori, J.P.; Anderlini, L.; Rossi, G.; Serpelloni, E.; Zuliani, D.; Bonini, L. Present-Day Surface Deformation in North-East Italy Using InSAR and GNSS Data. Remote Sens. 2023, 15, 1704. [Google Scholar] [CrossRef]
- IPCC AR6 Sea Level Projection Tool. Nasa Earth Data, Sea Level Change. Available online: https://sealevel.nasa.gov/ipcc-ar6-sea-level-projection-tool (accessed on 23 May 2025).
- Autorità Di Bacino Distrettuale Delle Alpi Orientali. Aggiornamento e Revisione Del Piano Di Gestione Del Rischio Di Alluvioni. Allegato I. Elementi Tecnici Di Riferimento Nell’impostazione Del Piano. Distretto Delle Alpi Orientali. Available online: https://sigma.distrettoalpiorientali.it/sigma/documentDownload/downloadDocumentById?documentId=360 (accessed on 14 May 2025).
- Tomasin, A.; Pirazzoli, P.A. Extreme Sea Levels on Adriatic Coasts: A Comparison on Estimation Methods. In Atti dell’Istituto Veneto di Scienze, Lettere ed Arti; Tomo CLXVII (2008-2009)—Classe Scienze Matematiche, Fisiche e Naturali; Istituto Veneto di Scienze, Lettere ed Arti: Venice, Italy, 2008; pp. 53–82. [Google Scholar]
- Arguez, A.; Vose, R.S. The Definition of the Standard WMO Climate Normal: The Key to Deriving Alternative Climate Normals. Bull. Am. Meteorol. Soc. 2011, 92, 699–704. [Google Scholar] [CrossRef]
- Sánchez, L.; Völksen, C.; Sokolov, A.; Arenz, H.; Seitz, F. Present-Day Surface Deformation of the Alpine Region Inferred from Geodetic Techniques. Earth Syst. Sci. Data 2018, 10, 1503–1526. [Google Scholar] [CrossRef]
- Zerbini, S.; Bruni, S.; Raicich, F. Tide Gauge Data Archaeology Provides Natural Subsidence Rates along the Coasts of the Po Plain and of the Veneto-Friuli Plain, Italy. Geophys. J. Int. 2021, 225, 253–260. [Google Scholar] [CrossRef]
- Lionello, P.; Barriopedro, D.; Ferrarin, C.; Nicholls, R.J.; Orlić, M.; Raicich, F.; Reale, M.; Umgiesser, G.; Vousdoukas, M.; Zanchettin, D. Extreme Floods of Venice: Characteristics, Dynamics, Past and Future Evolution (Review Article). Nat. Hazards Earth Syst. Sci. 2021, 21, 2705–2731. [Google Scholar] [CrossRef]
- Marsico, A.; Lisco, S.; Lo Presti, V.; Antonioli, F.; Amorosi, A.; Anzidei, M.; Deiana, G.; De Falco, G.; Fontana, A.; Fontolan, G.; et al. Flooding Scenario for Four Italian Coastal Plains Using Three Relative Sea Level Rise Models. J. Maps 2017, 13, 961–967. [Google Scholar] [CrossRef]
- Galluccio, G.; Hinkel, J.; Fiorini Beckhauser, E.; Bisaro, A.; Biancardi Aleu, R.; Campostrini, P.; Casas, M.F.; Espin, O.; Vafeidis, A.T. Sea Level Rise in Europe: Adaptation Measures and Decision-Making Principles. State Planet 2024, 2024, 1–36. [Google Scholar] [CrossRef]
- van de Wal, R.; Melet, A.; Bellafiore, D.; Camus, P.; Ferrarin, C.; Oude Essink, G.; Haigh, I.D.; Lionello, P.; Luijendijk, A.; Toimil, A.; et al. Sea Level Rise in Europe: Impacts and Consequences. State Planet 2023, 2023, 1–65. [Google Scholar] [CrossRef]
- Mel, R.A.; Viero, D.P.; Carniello, L.; Defina, A.; D’Alpaos, L. The First Operations of Mo.S.E. System to Prevent the Flooding of Venice: Insights on the Hydrodynamics of a Regulated Lagoon. Estuar. Coast. Shelf Sci. 2021, 261, 107547. [Google Scholar] [CrossRef]
- Shayegh, S.; Moreno-Cruz, J.; Caldeira, K. Adapting to Rates versus Amounts of Climate Change: A Case of Adaptation to Sea-Level Rise. Environ. Res. Lett. 2016, 11, 104007. [Google Scholar] [CrossRef]
- Sriver, R.L.; Lempert, R.J.; Wikman-Svahn, P.; Keller, K. Characterizing Uncertain Sea-Level Rise Projections to Support Investment Decisions. PLoS ONE 2018, 13, e0190641. [Google Scholar] [CrossRef]
- Horton, B.P.; Khan, N.S.; Cahill, N.; Lee, J.S.H.; Shaw, T.A.; Garner, A.J.; Kemp, A.C.; Engelhart, S.E.; Rahmstorf, S. Estimating Global Mean Sea-Level Rise and Its Uncertainties by 2100 and 2300 from an Expert Survey. NPJ Clim. Atmos. Sci. 2020, 3, 18. [Google Scholar] [CrossRef]
- Hinkel, J.; Feyen, L.; Hemer, M.; Le Cozannet, G.; Lincke, D.; Marcos, M.; Mentaschi, L.; Merkens, J.L.; de Moel, H.; Muis, S.; et al. Uncertainty and Bias in Global to Regional Scale Assessments of Current and Future Coastal Flood Risk. Earths Future 2021, 9, e2020EF001882. [Google Scholar] [CrossRef]
- Cin, F.D.; Fleischmann, M.; Romice, O.; Costa, J.P. Climate Adaptation Plans in the Context of Coastal Settlements: The Case of Portugal. Sustainability 2020, 12, 8559. [Google Scholar] [CrossRef]
- Barnard, P.L.; Dugan, J.E.; Page, H.M.; Wood, N.J.; Hart, J.A.F.; Cayan, D.R.; Erikson, L.H.; Hubbard, D.M.; Myers, M.R.; Melack, J.M.; et al. Multiple Climate Change-Driven Tipping Points for Coastal Systems. Sci. Rep. 2021, 11, 15560. [Google Scholar] [CrossRef]
- Toledo, I.; Pagán, J.I.; López, I.; Aragonés, L.; Olcina, J. Nature-Based Solutions on the Coast in Face of Climate Change: The Case of Benidorm (Spain). Urban Clim. 2024, 53, 101816. [Google Scholar] [CrossRef]
- Bol, R. Operation of the “Maeslant Barrier”: (Storm Surge Barrier in the Rotterdam New Waterway). In Flooding and Environmental Challenges for Venice and its Lagoon: State of Knowledge; Fletcher, C., Spencer, T., Eds.; Cambridge University Press: Cambridge, UK, 2005; pp. 311–315. [Google Scholar]
- Jorissen, R.; Kraaij, E.; Tromp, E. Dutch Flood Protection Policy and Measures Based on Risk Assessment. E3S Web Conf. 2016, 7, 20016. [Google Scholar] [CrossRef]
- Binini Partners. Porta Vinciana a Cesenatico. Sbarramento Mobile per La Difesa Dalle Esondazioni Meteomarine. Available online: https://www.bininipartners.it/progetti/porta-vinciana-a-cesenatico/ (accessed on 22 May 2025).
- Il Baby MOSE per La Difesa Di Chioggia Dalle Acque Alte. Available online: http://www.forumtelecontrollo.it/allegati/11.20_progea_angelini.pdf (accessed on 22 May 2025).
- Munaretto, S.; Vellinga, P.; Tobi, H. Flood Protection in Venice under Conditions of Sea-Level Rise: An Analysis of Institutional and Technical Measures. Coast. Manag. 2012, 40, 355–380. [Google Scholar] [CrossRef]


| Site | Station Name | Latitude (°) | Longitude (°) |
|---|---|---|---|
| Venice | RMLV | 45° 25′ 50.49″ | 12° 20′ 11.97″ |
| Trieste | Molo Sartorio | 45° 38′ 50.00″ | 13° 45′ 33.90″ |
| Grado | RMLV | 45° 40′ 59.26″ | 13° 23′ 00.38″ |
| Return Period (Years) | Extreme Water Levels (cm) | Confidence Interval (95%) |
|---|---|---|
| 2 | 111 | 107–115 |
| 10 | 136 | 125–146 |
| 30 | 151 | 136–165 |
| 100 | 168 | 147–186 |
| Return Period | Extreme Water Levels (cm) | Inhabitated Area (km2) | Flooded Area (%) |
|---|---|---|---|
| 2 | 111 | 0.016 | 1.67 |
| 10 | 136 | 0.20 | 20.8 |
| 30 | 151 | 0.40 | 41.7 |
| 100 | 168 | 0.61 | 63.5 |
| Promenade/Embankment Sector | Length (m) | Percent (%) of Total Length |
|---|---|---|
| Riva Brioni-Mandracchio C. | 573 | 9 |
| Mandracchio C. | 1392 | 22 |
| Schiusa Island | 1681 | 27 |
| Mandracchio C.–Moreri C. | 2685 | 42 |
| Total embankment | 6334 | 100 |
| Year | SLR Scenario Reference 2006 Baseline (1995–2014) | Trieste Sea Level (cm) | Total VLM (cm) for Grado (Average Rate) | Total Sea Level for Grado (cm) |
|---|---|---|---|---|
| 2050 | SSP1-2.6 (median) | 17 | 6.6 | 23.6 |
| SSP5-8.5 (median) | 21 | 6.6 | 27.6 | |
| 2100 | SSP1-2.6 (median) | 39 | 14.1 | 53.1 |
| SSP5-8.5 (median) | 67 | 14.1 | 81.1 |
Disclaimer/Publisher’s Note: The statements, opinions and data contained in all publications are solely those of the individual author(s) and contributor(s) and not of MDPI and/or the editor(s). MDPI and/or the editor(s) disclaim responsibility for any injury to people or property resulting from any ideas, methods, instructions or products referred to in the content. |
© 2025 by the authors. Licensee MDPI, Basel, Switzerland. This article is an open access article distributed under the terms and conditions of the Creative Commons Attribution (CC BY) license (https://creativecommons.org/licenses/by/4.0/).
Share and Cite
Spadotto, S.; Fracaros, S.; Bezzi, A.; Fontolan, G. Episodic vs. Sea Level Rise Coastal Flooding Scenarios at the Urban Scale: Extreme Event Analysis and Adaptation Strategies. Water 2025, 17, 1991. https://doi.org/10.3390/w17131991
Spadotto S, Fracaros S, Bezzi A, Fontolan G. Episodic vs. Sea Level Rise Coastal Flooding Scenarios at the Urban Scale: Extreme Event Analysis and Adaptation Strategies. Water. 2025; 17(13):1991. https://doi.org/10.3390/w17131991
Chicago/Turabian StyleSpadotto, Sebastian, Saverio Fracaros, Annelore Bezzi, and Giorgio Fontolan. 2025. "Episodic vs. Sea Level Rise Coastal Flooding Scenarios at the Urban Scale: Extreme Event Analysis and Adaptation Strategies" Water 17, no. 13: 1991. https://doi.org/10.3390/w17131991
APA StyleSpadotto, S., Fracaros, S., Bezzi, A., & Fontolan, G. (2025). Episodic vs. Sea Level Rise Coastal Flooding Scenarios at the Urban Scale: Extreme Event Analysis and Adaptation Strategies. Water, 17(13), 1991. https://doi.org/10.3390/w17131991