

Bridging the Gap: A Novel Approach to Flood Risk Assessment for Resilience


Abstract
1. Introduction
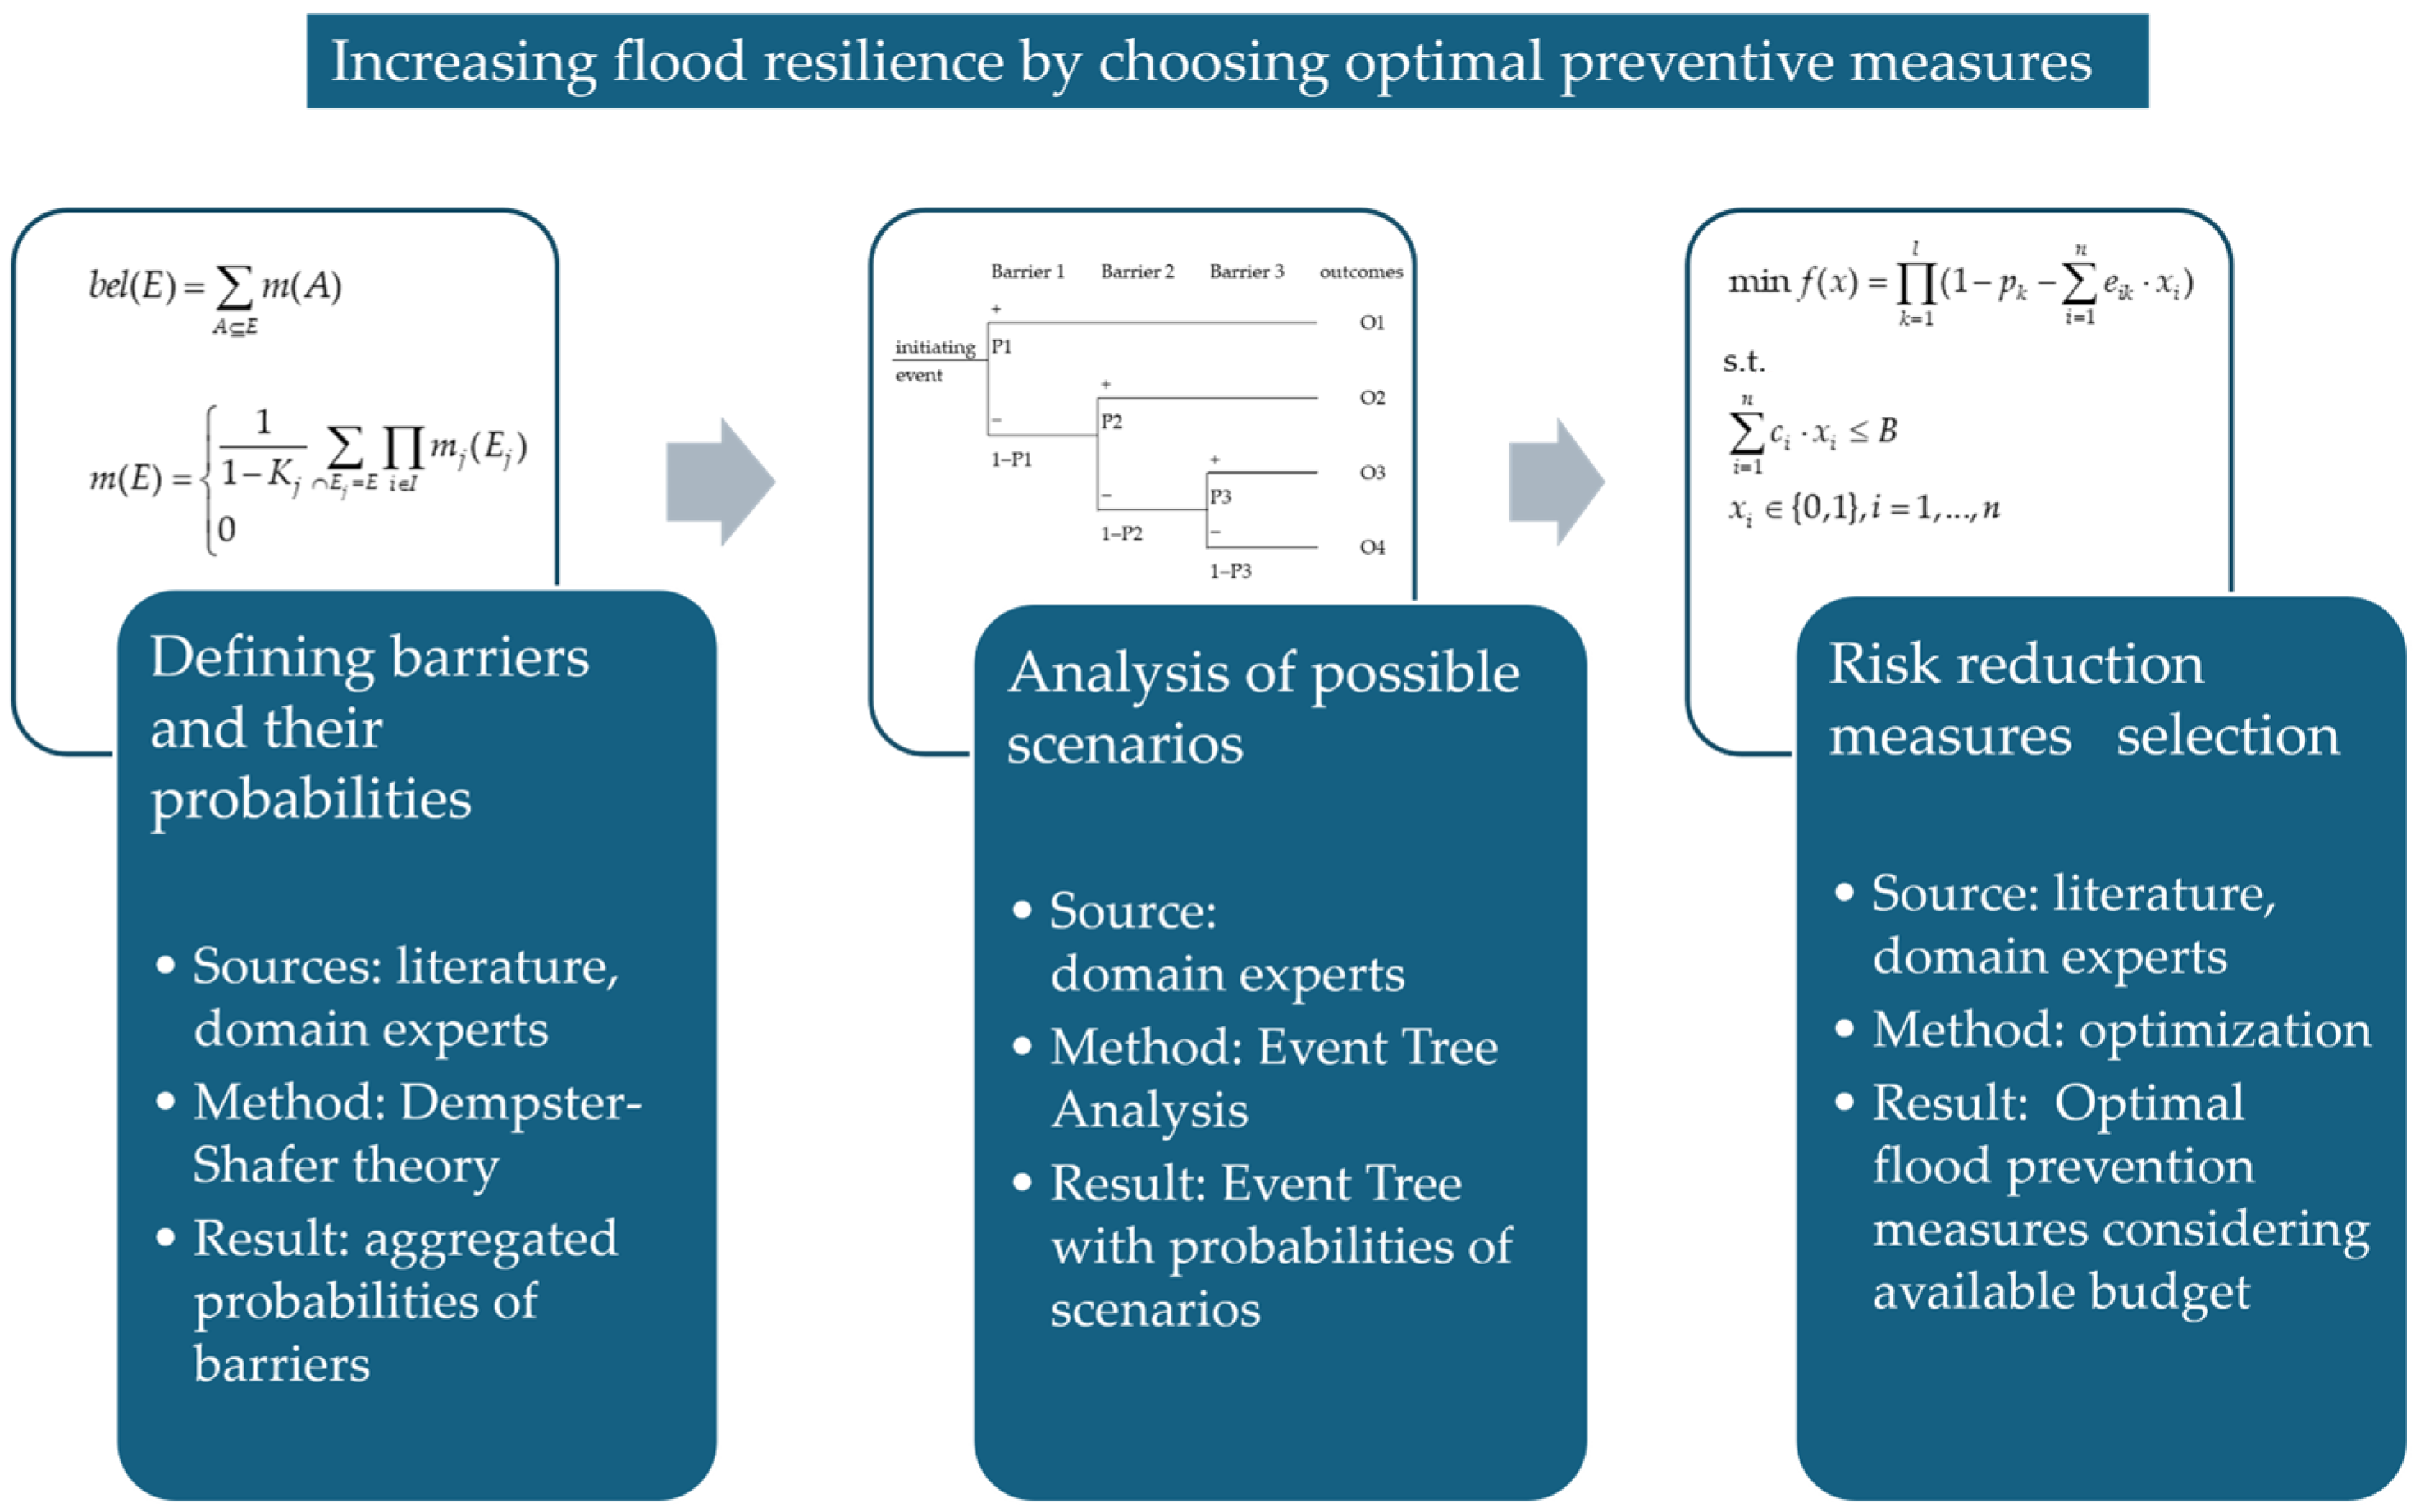
2. Materials and Methods
- Defining barriers that could prevent the negative consequences of a flood event, collecting data from experts on the probabilities of the barriers’ success, and aggregating their assessments using Dempster–Shafer theory of evidence.
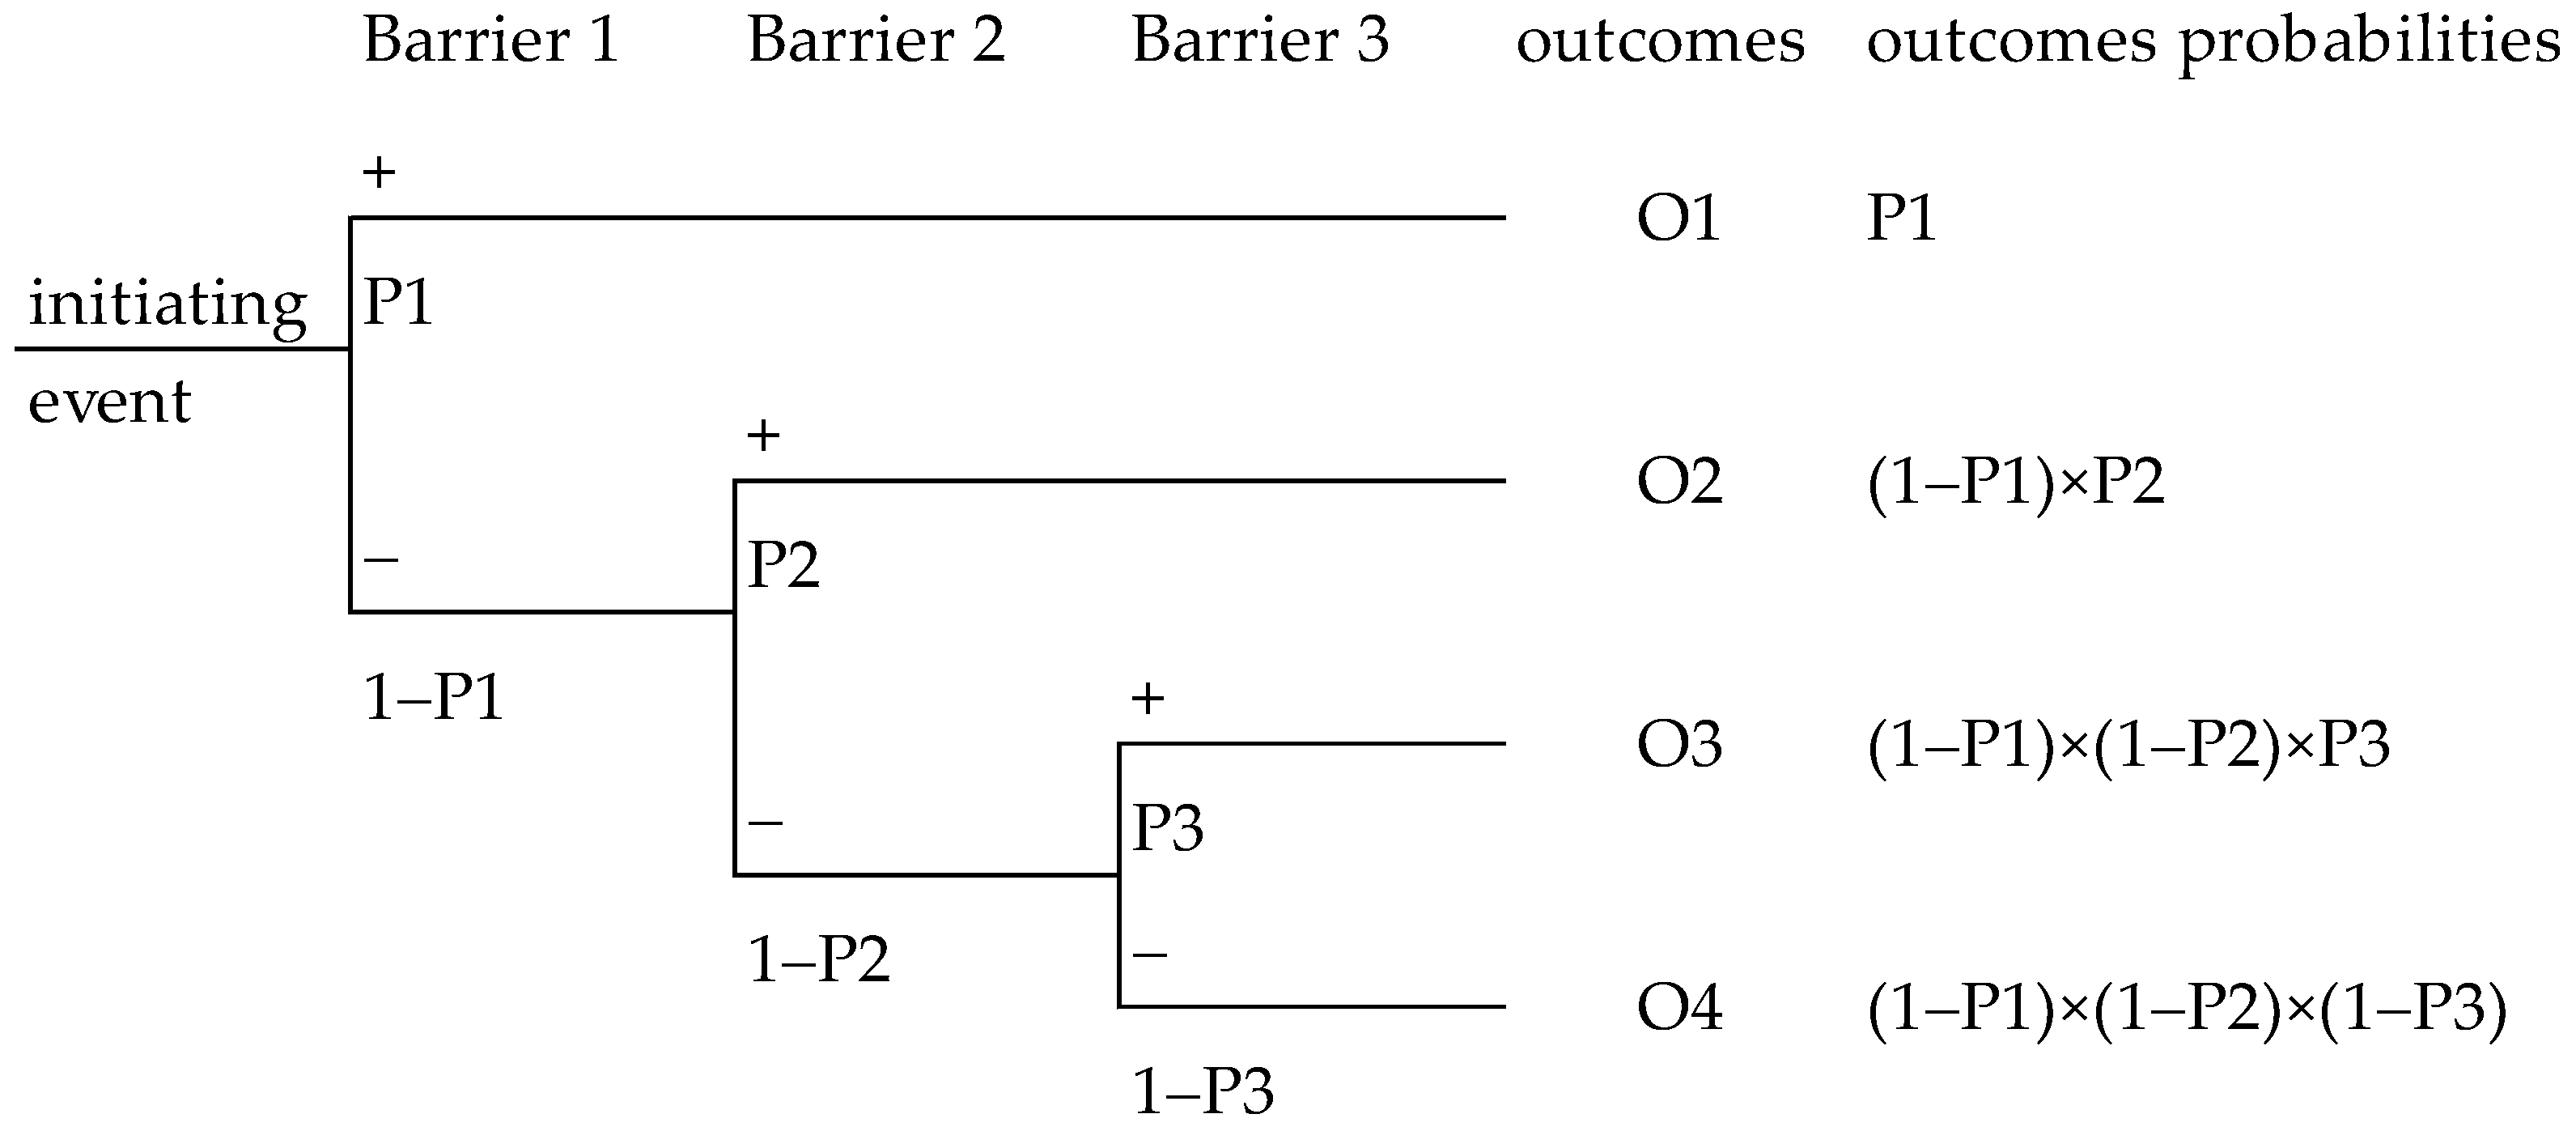
- Constructing an Event Tree and determining the probabilities of scenarios and their outcomes.
- Defining measures to increase the success of barriers and determining the measures to be taken by applying the optimization approach.
2.1. Dempster–Shafer Evidence Theory
2.2. Event Tree Analysis
2.3. Optimal Measures Selection
3. Results
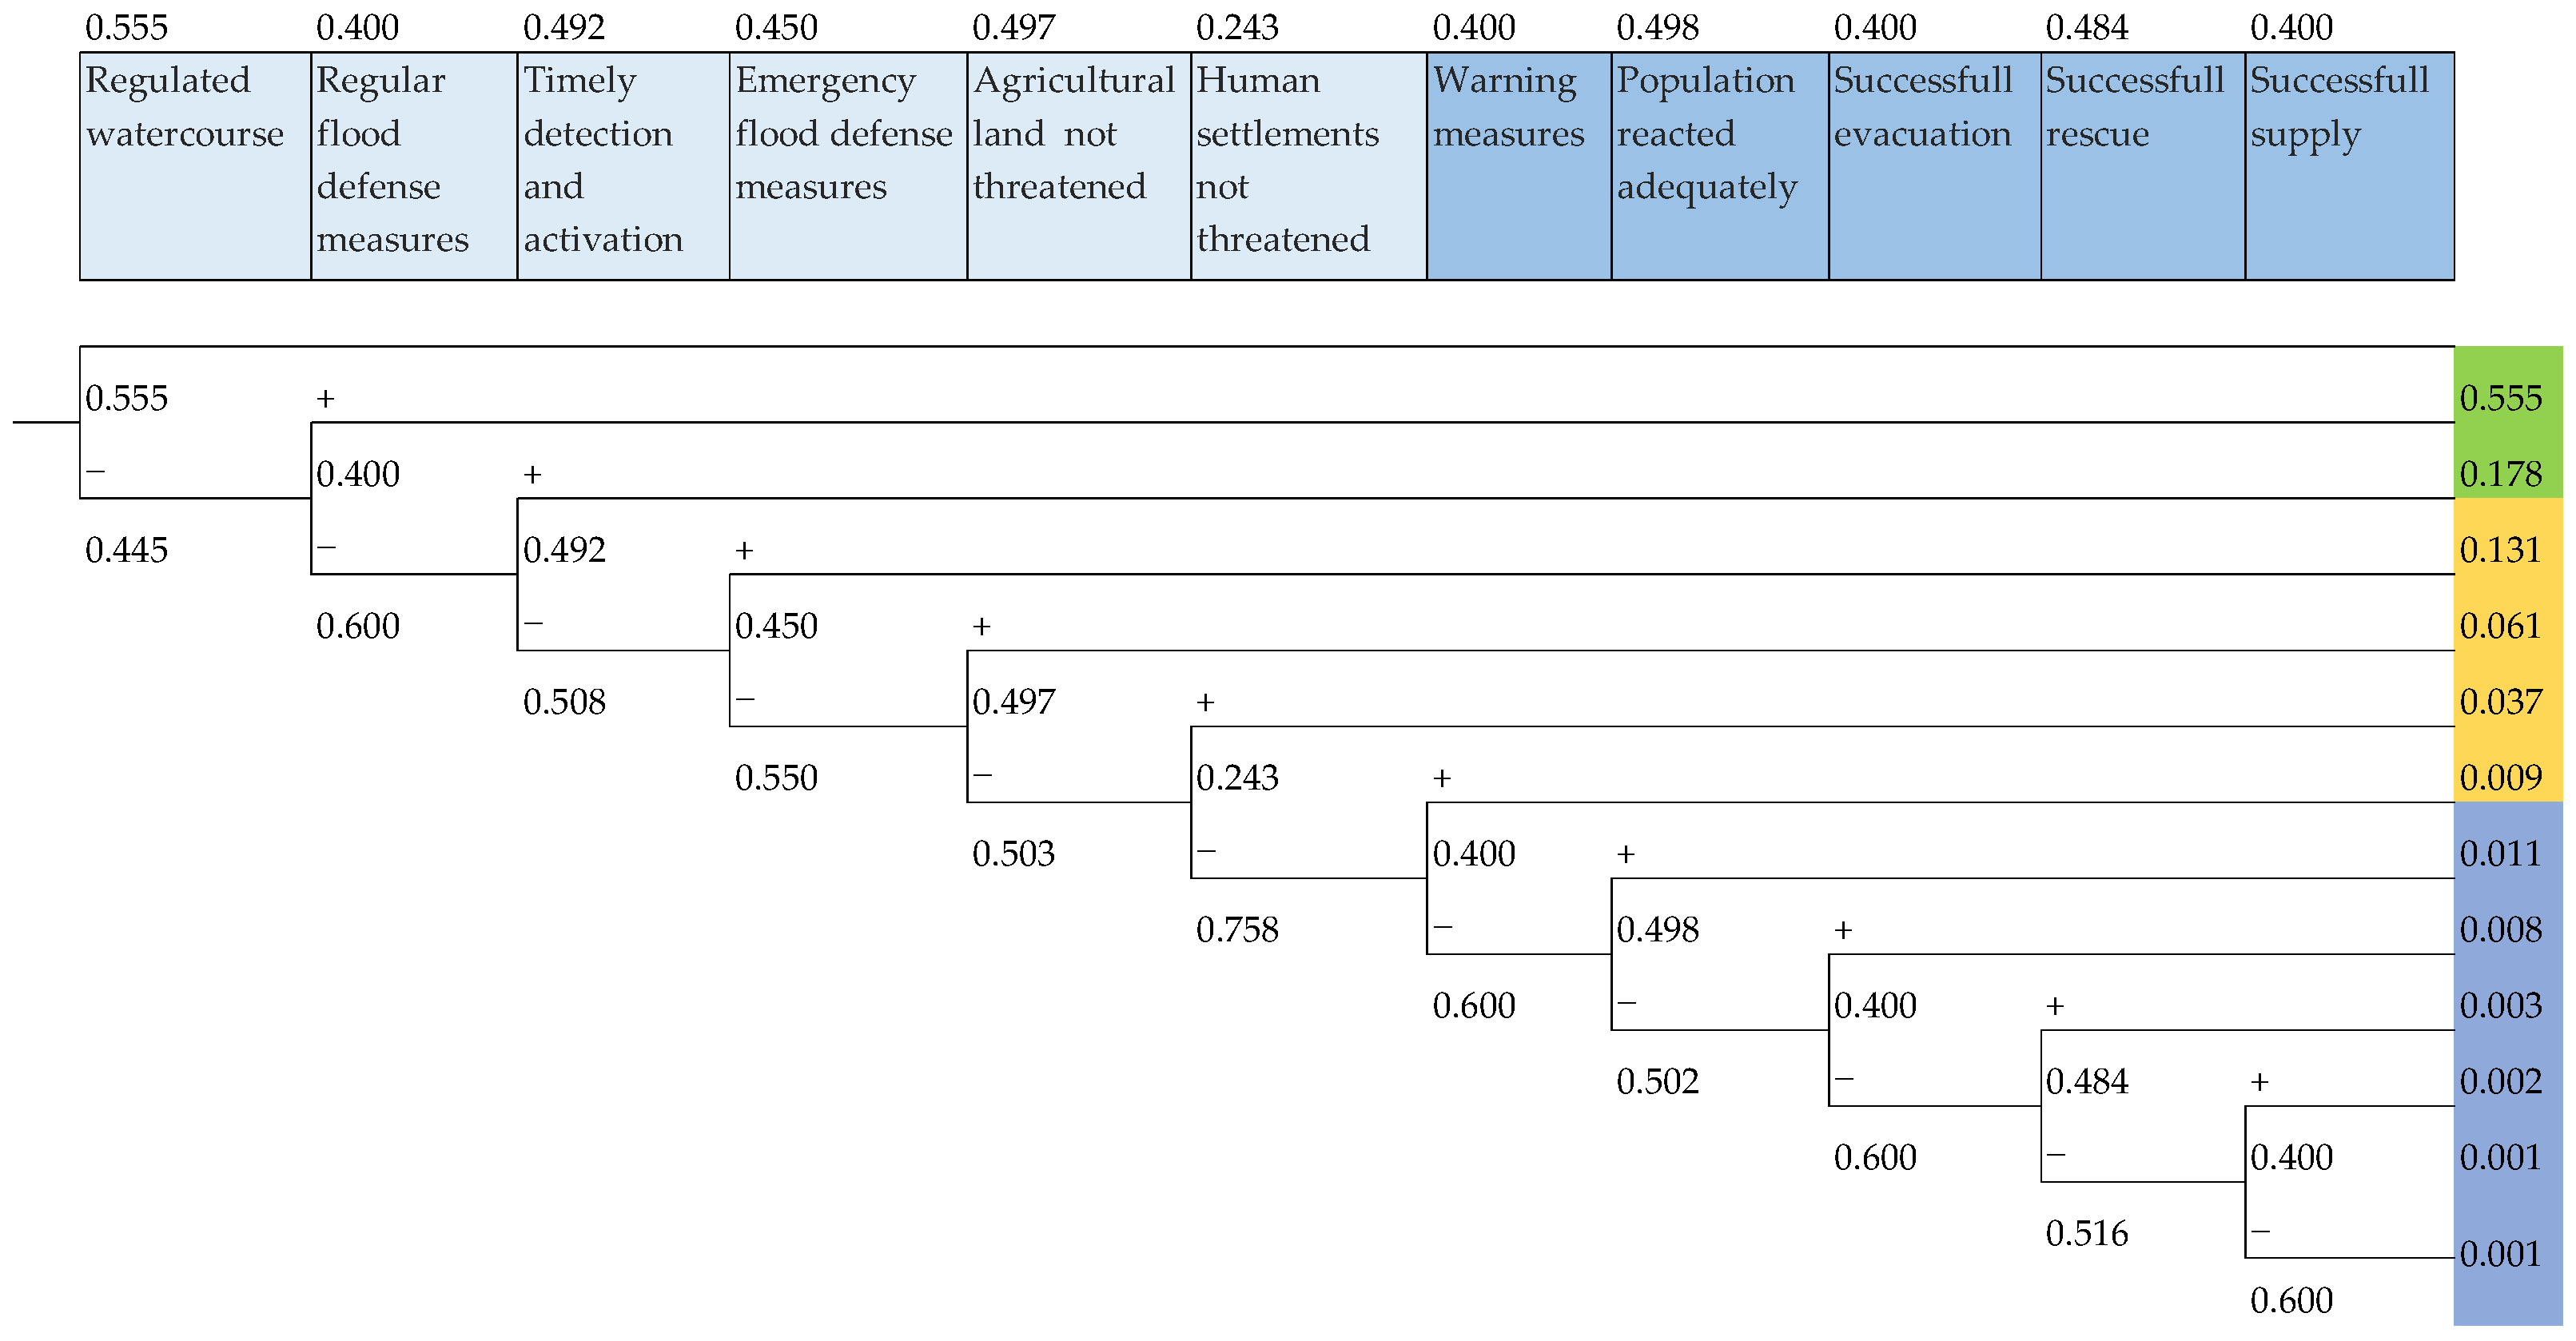
3.1. Creating the Event Tree Using DS Theory and Expert Knowledge
- B1. Regulated watercourse—the state of the watercourse will prevent flooding.
- B2. Regular flood defense measures are successful.
- B3. Timely detection and activation of warning systems.
- B4. Emergency flood defense measures are successful.
- B5. Water does not threaten agricultural land (non-retention).
- B6. Water does not threaten human settlements.
- B7. Warning measures have been issued to the population.
- B8. The population reacted adequately to flood warning measures.
- B9. The evacuation was carried out successfully.
- B10. A certain part of the population did not evacuate, but people who found themselves in the flood were successfully rescued.
- B11. The successful supply of food to the population affected by the floods is carried out.
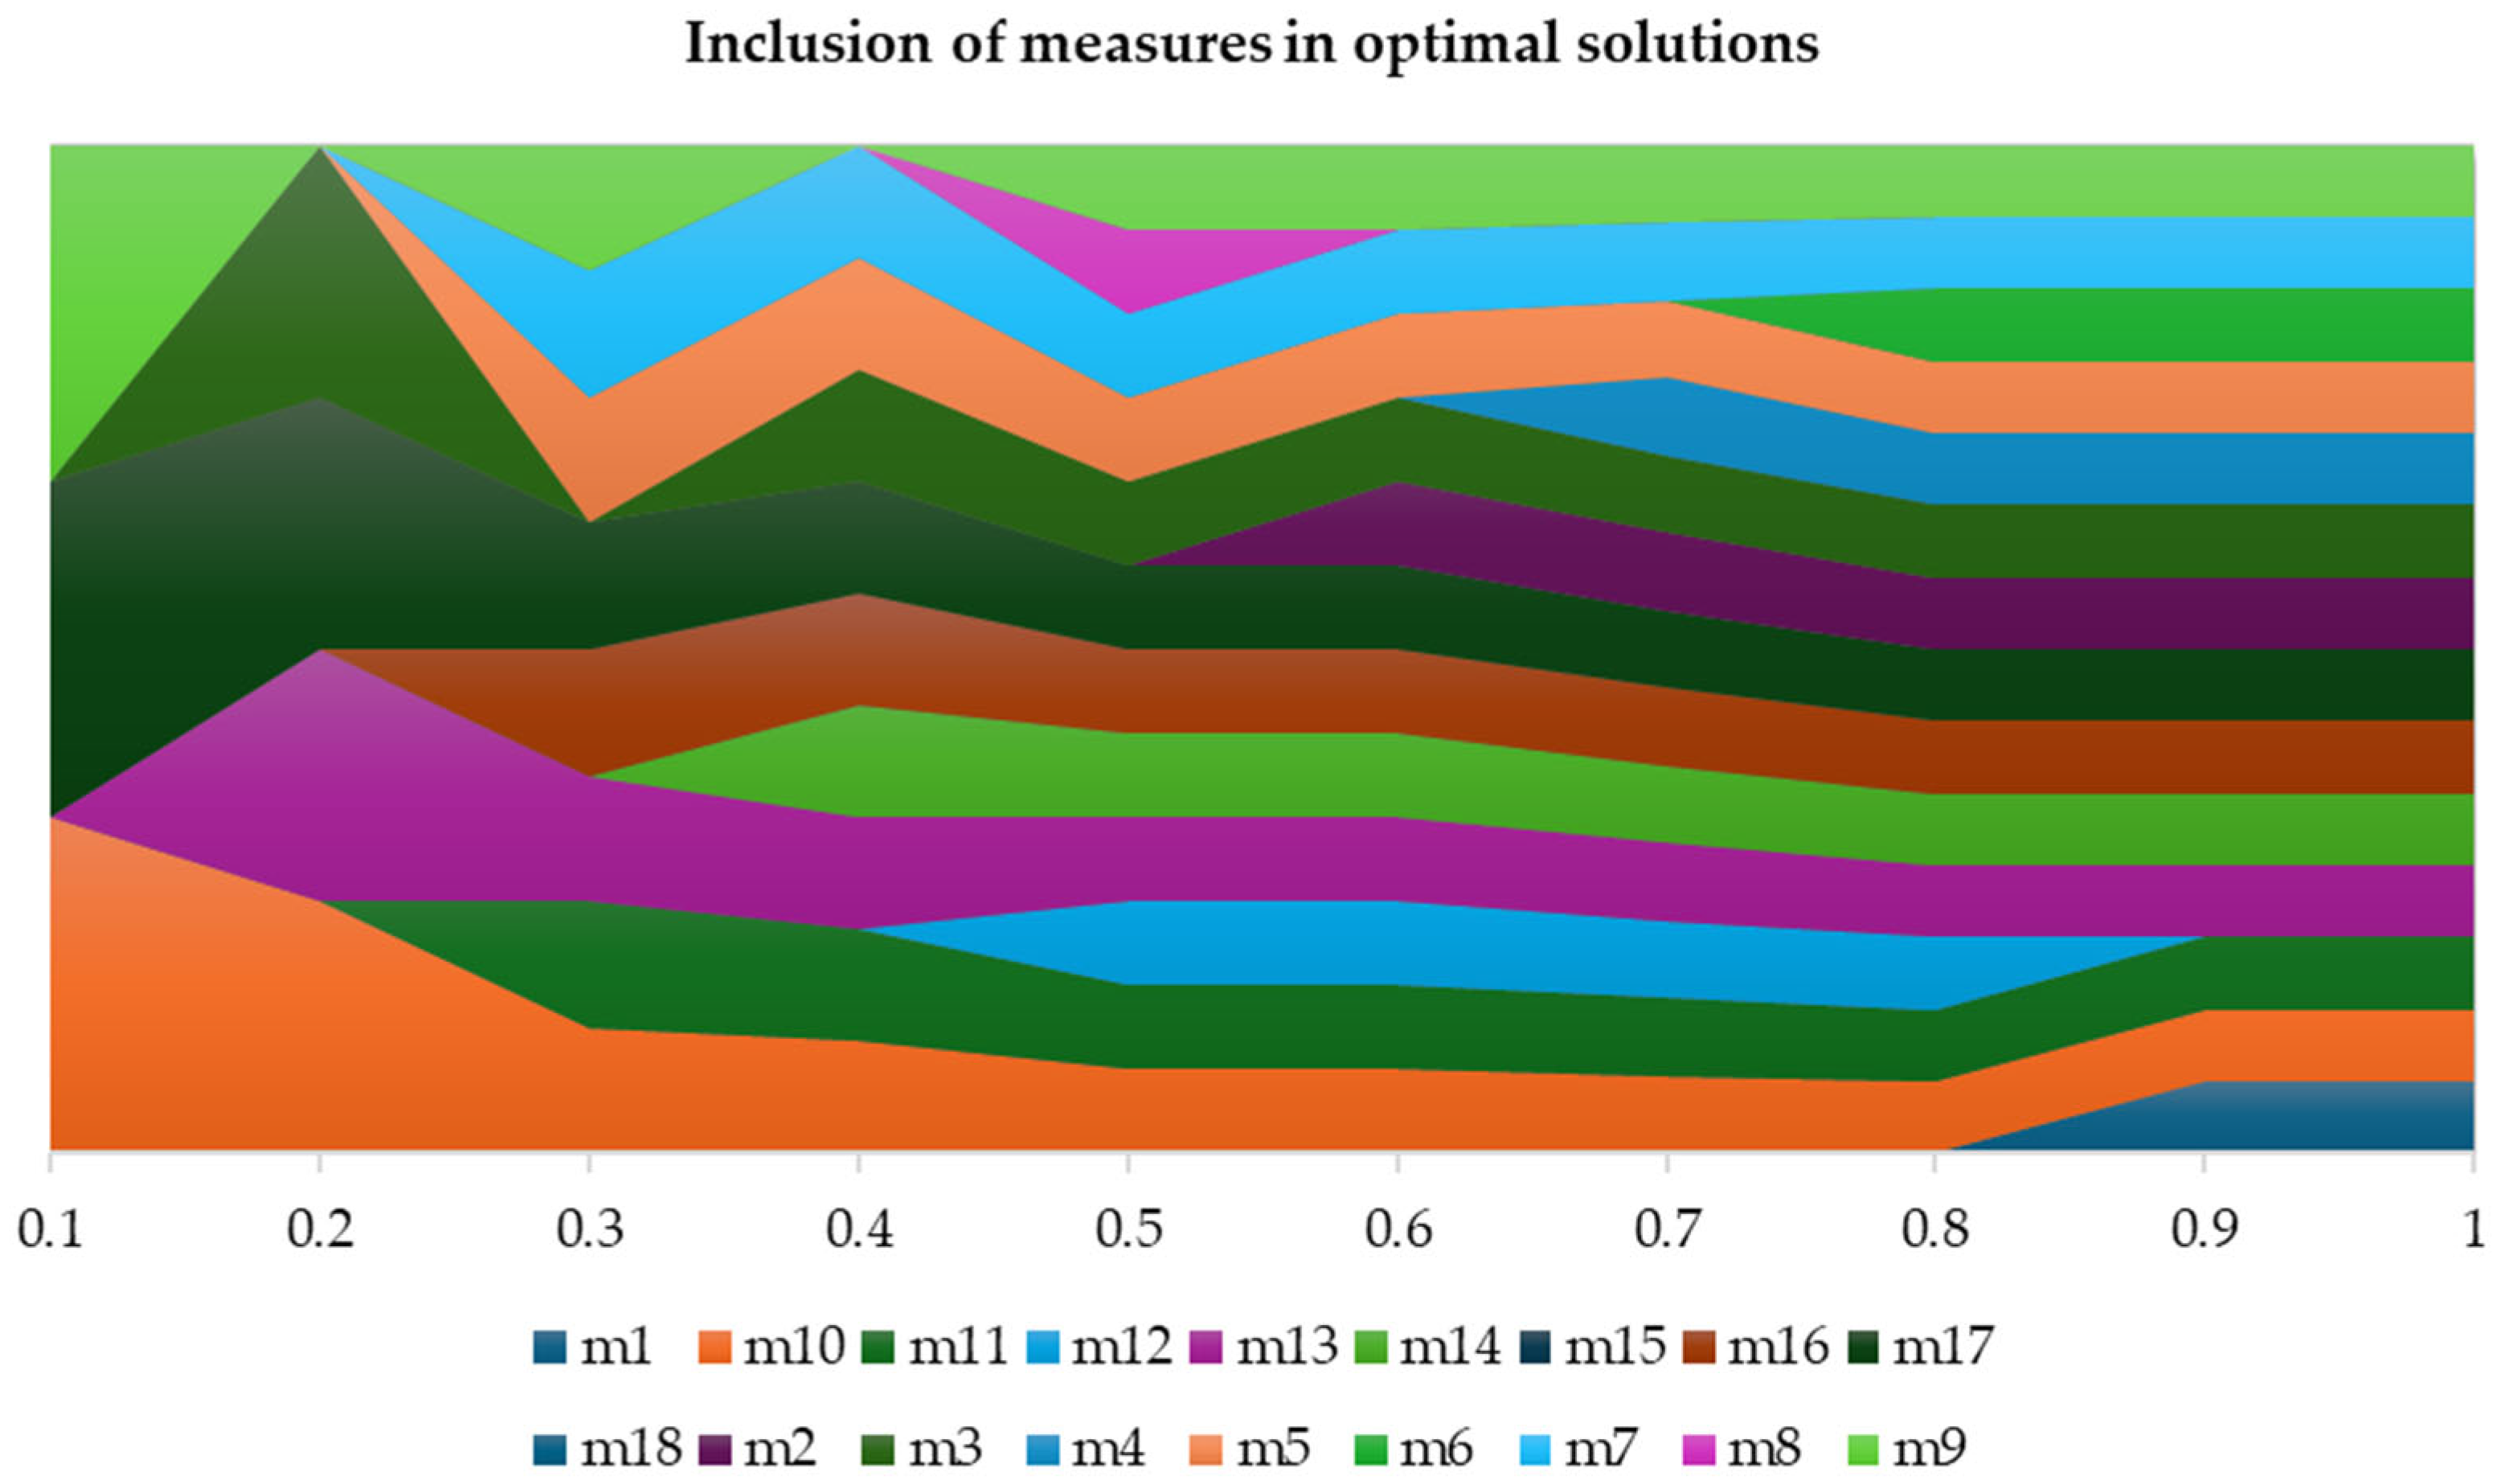
3.2. Selecting Prevention Measures and Applying Them to the OMS Model
- m1. Dams and reservoirs, relative cost = 1;
- m2. Levees and floodwalls, relative cost = 0.9;
- m3. Diversion channels, relative cost = 0.8;
- m4. Floodgates and sluices, relative cost = 0.85;
- m5. Retention basins and ponds, relative cost = 0.7;
- m6. Detention basins, relative cost = 0.65.
- m7. Flood forecasting and early warning systems, relative cost = 0.3;
- m8. Floodplain zoning and land use planning, relative cost = 0.25;
- m9. Building codes and standards, relative cost = 0.2;
- m10. Emergency response plans, relative cost = 0.15;
- m11. Maintenance of drainage systems, relative cost = 0.1.
- m12. Wetland restoration, relative cost = 0.2;
- m13. Riparian buffer zone, relative cost = 0.15;
- m14. Reforestation and afforestation, relative cost = 0.18;
- m15. Sustainable agriculture practices, relative cost = 0.15;
- m16. Coastal wetland protection, relative cost = 0.17.
- m17. Smart flood management systems, relative cost = 0.35;
- m18. Permeable pavements, relative cost = 0.25.
4. Discussion
5. Conclusions
Author Contributions
Funding
Data Availability Statement
Acknowledgments
Conflicts of Interest
Appendix A
Appendix B

| Experts | ||||||||
|---|---|---|---|---|---|---|---|---|
| E1 | E2 | E3 | E4 | |||||
| Barriers | bpa | bel | bpa | bel | bpa | bel | bpa | bel |
| B1 | 0.6 | 0.7 | 0.8 | 0.5 | 0.5 | 0.6 | 0.6 | 0.6 |
| 0.3 | 0.2 | 0.1 | 0.4 | 0.45 | 0.3 | 0.3 | 0.3 | |
| 0.25 | 0.1 | 0.1 | 0.1 | 0.4 | 0.1 | 0.2 | 0.1 | |
| B2 | 0.45 | 0.4 | 0.7 | 0.7 | 0.5 | 0.6 | 0.6 | 0.6 |
| 0.4 | 0.35 | 0.2 | 0.2 | 0.45 | 0.2 | 0.4 | 0.3 | |
| 0.5 | 0.25 | 0.1 | 0.1 | 0.4 | 0.2 | 0.3 | 0.1 | |
| B3 | 0.5 | 0.6 | 0.2 | 0.8 | 0.5 | 0.7 | 0.5 | 0.7 |
| 0.45 | 0.3 | 0.2 | 0.1 | 0.45 | 0.2 | 0.4 | 0.2 | |
| 0.4 | 0.1 | 0.6 | 0.1 | 0.4 | 0.1 | 0.35 | 0.1 | |
| B4 | 0.7 | 0.6 | 0.9 | 0.9 | 0.5 | 0.6 | 0.8 | 0.8 |
| 0.5 | 0.25 | 0.1 | 0.1 | 0.45 | 0.3 | 0.4 | 0.1 | |
| 0.45 | 0.15 | 0 | 0 | 0.4 | 0.1 | 0.4 | 0.1 | |
| B5 | 0.55 | 0.65 | 0.5 | 0.8 | 0.4 | 0.1 | 0.5 | 0.7 |
| 0.4 | 0.3 | 0.3 | 0.15 | 0.45 | 0.1 | 0.4 | 0.2 | |
| 0.35 | 0.05 | 0.2 | 0.05 | 0.5 | 0.8 | 0.2 | 0.1 | |
| B6 | 0.55 | 0.7 | 0.5 | 0.9 | 0.5 | 0.5 | 0.5 | 0.7 |
| 0.5 | 0.2 | 0.25 | 0.05 | 0.45 | 0.3 | 0.4 | 0.2 | |
| 0.4 | 0.1 | 0.25 | 0.05 | 0.4 | 0.2 | 0.3 | 0.1 | |
| B7 | 0.6 | 0.45 | 0.2 | 0.8 | 0.5 | 0.8 | 0.5 | 0.8 |
| 0.45 | 0.35 | 0.3 | 0.1 | 0.45 | 0.1 | 0.4 | 0.1 | |
| 0.4 | 0.2 | 0.5 | 0.1 | 0.4 | 0.1 | 0.35 | 0.1 | |
| B8 | 0.55 | 0.7 | 0.5 | 0.9 | 0.5 | 0.6 | 0.5 | 0.8 |
| 0.45 | 0.2 | 0.25 | 0.05 | 0.45 | 0.3 | 0.4 | 0.1 | |
| 0.35 | 0.1 | 0.25 | 0.05 | 0.4 | 0.1 | 0.3 | 0.1 | |
| B9 | 0.65 | 0.8 | 0.7 | 0.5 | 0.5 | 0.7 | 0.6 | 0.8 |
| 0.4 | 0.15 | 0.2 | 0.3 | 0.45 | 0.2 | 0.4 | 0.15 | |
| 0.3 | 0.05 | 0.1 | 0.2 | 0.4 | 0.1 | 0.3 | 0.05 | |
| B10 | 0.35 | 0.2 | 0.6 | 0.4 | 0.5 | 0.7 | 0.5 | 0.6 |
| 0.4 | 0.3 | 0.3 | 0.4 | 0.45 | 0.3 | 0.4 | 0.3 | |
| 0.6 | 0.5 | 0.1 | 0.2 | 0.4 | 0.1 | 0.5 | 0.1 | |
| B11 | 0.35 | 0.05 | 0.1 | 0.1 | 0.5 | 0.6 | 0.3 | 0.05 |
| 0.4 | 0.2 | 0.1 | 0.45 | 0.45 | 0.3 | 0.4 | 0.25 | |
| 0.6 | 0.75 | 0.8 | 0.45 | 0.4 | 0.1 | 0.7 | 0.7 | |
| Variable | Expert 1 | Expert 2 | Expert 3 | Expert 4 | |
|---|---|---|---|---|---|
| 1. Expert 1 | Pearson’s r | — | |||
| p-value | — | ||||
| 2. Expert 2 | Pearson’s r | 0.538 | — | ||
| p-value | 0.001 | — | |||
| 3. Expert 3 | Pearson’s r | 0.296 | 0.320 | — | |
| p-value | 0.095 | 0.070 | — | ||
| 4. Expert 4 | Pearson’s r | 0.824 | 0.758 | 0.399 | — |
| p-value | <0.001 | <0.001 | 0.022 | — |
Appendix C
| Experts | |||||
|---|---|---|---|---|---|
| E1 | E2 | E3 | E4 | ||
| Measures | Estimated Cost Ratio | Estimated Cost Ratio | Estimated Cost Ratio | Estimated Cost Ratio | Median Value |
| m1 | 1.0 | 1.0 | 1.0 | 1.0 | 1.0 |
| m2 | 0.9 | 0.95 | 0.9 | 0.9 | 0.912 |
| m3 | 0.85 | 0.8 | 0.7 | 0.85 | 0.8 |
| m4 | 0.8 | 0.85 | 0.9 | 0.85 | 0.85 |
| m5 | 0.7 | 0.65 | 0.7 | 0.75 | 0.7 |
| m6 | 0.65 | 0.7 | 0.65 | 0.6 | 0.65 |
| m7 | 0.25 | 0.3 | 0.35 | 0.35 | 0.3 |
| m8 | 0.25 | 0.25 | 0.3 | 0.2 | 0.25 |
| m9 | 0.2 | 0.15 | 0.25 | 0.20 | 0.2 |
| m10 | 0.1 | 0.2 | 0.15 | 0.15 | 0.15 |
| m11 | 0.1 | 0.15 | 0.1 | 0.1 | 0.1 |
| m12 | 0.25 | 0.2 | 0.2 | 0.2 | 0.2 |
| m13 | 0.2 | 0.1 | 0.15 | 0.15 | 0.15 |
| m14 | 0.18 | 0.15 | 0.18 | 0.19 | 0.18 |
| m15 | 0.1 | 0.15 | 0.15 | 0.2 | 0.15 |
| m16 | 0.17 | 0.15 | 0.18 | 0.18 | 0.17 |
| m17 | 0.35 | 0.4 | 0.3 | 0.35 | 0.35 |
| m18 | 0.2 | 0.25 | 0.3 | 0.25 | 0.25 |
| Barriers | ||||||
|---|---|---|---|---|---|---|
| Measures | B1 | B2 | B3 | B4 | B5 | B6 |
| m1 | 0.045 | 0.045 | ||||
| m2 | 0.0375 | 0.040 | 0.040 | 0.045 | ||
| m3 | 0.033 | 0.037 | 0.035 | 0.040 | ||
| m4 | 0.040 | 0.030 | 0.035 | |||
| m5 | 0.030 | 0.035 | 0.035 | 0.025 | 0.030 | |
| m6 | 0.030 | 0.020 | 0.025 | |||
| m7 | 0.030 | 0.045 | ||||
| m8 | 0.025 | 0.020 | ||||
| m9 | 0.045 | 0.015 | ||||
| m10 | 0.030 | 0.045 | ||||
| m11 | 0.020 | 0.010 | ||||
| m12 | 0.015 | 0.015 | ||||
| m13 | 0.018 | 0.012 | 0.010 | 0.005 | ||
| m14 | 0.020 | 0.010 | 0.005 | |||
| m15 | 0.003 | |||||
| m16 | 0.033 | 0.008 | 0.002 | |||
| m17 | 0.032 | 0.048 | 0.048 | 0.045 | 0.048 | |
| m18 | 0.003 | |||||
References
- Peduzzi, P. The Disaster Risk, Global Change, and Sustainability Nexus. Sustainability 2019, 11, 957. [Google Scholar] [CrossRef]
- Thomas, V. Climate Change and Natural Disasters: Transforming Economies and Policies for a Sustainable Future; Routledge: London, UK, 2017. [Google Scholar]
- Furtak, K.; Wolińska, A. The impact of extreme weather events as a consequence of climate change on the soil moisture and on the quality of the soil environment and agriculture—A review. Catena 2023, 231, 107378. [Google Scholar] [CrossRef]
- Abdalzaher, M.S.; Elsayed, H.A.; Fouda, M.M.; Salim, M.M. Employing Machine Learning and IoT for Earthquake Early Warning System in Smart Cities. Energies 2023, 16, 495. [Google Scholar] [CrossRef]
- Courtney, C. The Nature of Disaster in China: The 1931 Yangzi River Flood; Cambridge University Press: Cambridge, UK, 2018. [Google Scholar]
- DesRoches, R.; Comerio, M.; Eberhard, M.; Mooney, W.; Rix, G.J. Overview of the 2010 Haiti Earthquake. Earthq. Spectra. 2011, 27, S1–S21. [Google Scholar] [CrossRef]
- Hamilton, J.P.; Halvorson, S.J. The 2005 Kashmir Earthquake: A Perspective on Women’s Experiences. Mt. Res. Dev. 2007, 27, 296–301. [Google Scholar] [CrossRef]
- Moustafa, S.S.R.; Abdalzaher, M.S.; Abdelhafiez, H.E. Seismo-Lineaments in Egypt: Analysis and Implications for Active Tectonic Structures and Earthquake Magnitudes. J. Remote Sens. 2022, 14, 6151. [Google Scholar] [CrossRef]
- Tin, D.; Cheng, L.; Le, D.; Hata, R.; Ciottone, G. Natural Disasters: A Comprehensive Study Using EMDAT Database 1995–2022. Public Health 2024, 226, 255–260. [Google Scholar] [CrossRef]
- Arnell, N. Hydrology and Global Environmental Change; Pearson Education Limited: London, UK, 2002. [Google Scholar]
- Gosling, S.N.; Arnell, N.W. A Global Assessment of the Impact of Climate Change on Water Scarcity. Clim. Change 2016, 134, 371–385. [Google Scholar] [CrossRef]
- Hartmann, D.L.; Klein Tank, A.M.G.; Rusticucci, M.; Alexander, L.V.; Brönnimann, S.; Charabi, Y.; Dentener, F.J.; Dlugokencky, E.J.; Easterling, D.R.; Kaplan, A.; et al. Observations: Atmosphere and Surface. In Climate Change 2013: The Physical Science Basis. Contribution of Working Group I to the Fifth Assessment Report of the Intergovernmental Panel on Climate Change; Stocker, T.F., Qin, D., Plattner, G.-K., Tignor, M., Allen, S.K., Boschung, J., Nauels, A., Xia, Y., Bex, V., Midgley, P.M., Eds.; Cambridge University Press: Cambridge, UK, 2013; pp. 159–254. [Google Scholar] [CrossRef]
- National Research Council. Global Change and Extreme Hydrology: Testing Conventional Wisdom; The National Academies Press: Washington, WA, USA, 2011. [Google Scholar]
- Shiklomanov, I.A.; Rodda, J.C. (Eds.) World Water Resources at the Beginning of the Twenty-First Century; Cambridge University Press: Cambridge, UK, 2003. [Google Scholar]
- Wang, F.; Harindintwali, J.-D.; Wei, K.; Shan, Y.; Mi, Z.; Costello, M.J.; Grunwald, S.; Feng, Z.; Wang, F.; Guo, Y.; et al. Climate Change: Strategies for Mitigation and Adaptation. Innov. Geosci. 2023, 1, 100015. [Google Scholar] [CrossRef]
- Aldardasawi, A.F.M.; Eren, B. Floods and their impact on the environment. Acad. Perspect. Procedia 2021, 4, 42–49. [Google Scholar] [CrossRef]
- Brazda, S.; Šraj, M.; Bezak, N. Classification of floods in Europe and North America with focus on compound events. ISPRS Int. J. Geo-Inf. 2022, 11, 580. [Google Scholar] [CrossRef]
- Kundzewicz, Z.W.; Matczak, P. Hydrological extremes and security. Proc. IAHS 2015, 366, 44–53. [Google Scholar] [CrossRef]
- Sezen, C.; Šraj, M.; Medved, A.; Bezak, N. Investigation of rain-on-snow floods under climate change. Appl. Sci. 2020, 10, 1242. [Google Scholar] [CrossRef]
- Wachowicz, L.J.; Mote, T.L.; Henderson, G.R. A rain on snow climatology and temporal analysis for the eastern United States. Phys. Geogr. 2020, 41, 54–69. [Google Scholar] [CrossRef]
- Zscheischler, J.; Martius, O.; Westra, S.; Bevacqua, E.; Raymond, C.; Horton, R.M.; van den Hurk, B.; Aghakouchak, A.; Jézéquel, A.; Mahecha, M.D.; et al. A typology of compound weather and climate events. Nat. Rev. Earth Environ. 2020, 1, 333–347. [Google Scholar] [CrossRef]
- Hamidifar, H.; Nones, M. Global to regional overview of floods fatality: The 1951–2020 period. Nat. Hazards Earth Syst. Sci. Discuss. 2021, 1–22. [Google Scholar] [CrossRef]
- Floods. Available online: https://wmo.int/topics/floods (accessed on 20 April 2025).
- Makajić-Nikolić, D. Risk assessment and management. In Climate Action; Leal Filho, W., Azul, A.M., Brandli, L., Özuyar, P.G., Wall, T., Eds.; Encyclopedia of the UN Sustainable Development Goals; Springer: New York, NY, USA, 2020. [Google Scholar] [CrossRef]
- Alves, R.; Branco, J.C.; Baptista, J.S. Flood risk assessment and emergency planning—A short review. In Occupational and Environmental Safety and Health IV; Arezes, P.M., Baptista, J.S., Melo, R.B., Branco, J.C., Carneiro, P., Colim, A., Costa, N., Costa, S., Duarte, J., Guedes, J.C., et al., Eds.; Studies in Systems, Decision and Control; Springer: New York, NY, USA, 2023. [Google Scholar]
- Grigg, N.S. Comprehensive flood risk assessment: State of the practice. Hydrology 2023, 10, 46. [Google Scholar] [CrossRef]
- Romali, N.S.; Yusop, Z. Flood damage and risk assessment for urban area in Malaysia. Hydrol. Res. 2021, 52, 142–159. [Google Scholar] [CrossRef]
- Ashraf, I.; Ahmad, S.R.; Ashraf, U. Flood risk assessment and mitigation strategy–Taunsa Barrage Wildlife Sanctuary, Kot Mithan–Chachran, Indus Dolphin Reserve. Pol. J. Environ. Stud. 2021, 30, 5453–5463. [Google Scholar] [CrossRef]
- Koks, E.E.; Jongman, B.; Husby, T.G.; Botzen, W.J. Combining hazard, exposure and social vulnerability to provide lessons for flood risk management. Environ. Sci. Policy 2015, 47, 42–52. [Google Scholar] [CrossRef]
- Xu, W.; Cong, J.; Proverbs, D.; Zhang, L. An evaluation of urban resilience to flooding. Water 2021, 13, 2022. [Google Scholar] [CrossRef]
- Hegger, D.L.T.; Driessen, P.P.J.; Wiering, M.; Van Rijswick, H.F.M.W.; Kundzewicz, Z.W.; Matczak, P.; Crabbé, A.; Raadgever, G.T.; Bakker, M.H.N.; Priest, S.J.; et al. Toward more flood resilience: Is a diversification of flood risk management strategies the way forward? Ecol. Soc. 2016, 21, 52. [Google Scholar] [CrossRef]
- Wang, L.; Cui, S.; Li, Y.; Huang, H.; Manandhar, B.; Nitivattananon, V.; Fang, X.; Huang, W. A review of the flood management: From flood control to flood resilience. Heliyon 2022, 8, e11763. [Google Scholar] [CrossRef] [PubMed]
- Sayers, P.; Yuanyuan, L.; Galloway, G.; Penning-Rowsell, E.; Fuxin, S.; Kang, W.; Le Quesne, T. Flood Risk Management: A Strategic Approach; Asian Development Bank, GIWP, UNESCO and WWF-UK: Manila, Philippines, 2013; Available online: https://www.adb.org/publications/flood-risk-management-strategic-approach (accessed on 25 April 2025).
- Hutter, G.; Schanze, J. Learning how to deal with uncertainty of flood risk in long-term planning. Int. J. River Basin Manag. 2008, 6, 175–184. [Google Scholar] [CrossRef]
- Emami, K. Adaptive flood risk management. Irrig. Drain. 2020, 69, 230–242. [Google Scholar] [CrossRef]
- Ferdous, R.; Khan, F.; Sadiq, R.; Amyotte, P.; Veitch, B. Fault and event tree analyses for process systems risk analysis: Uncertainty handling formulations. Risk Anal. 2011, 31, 86–107. [Google Scholar] [CrossRef]
- Ayyub, B.M. Risk Analysis in Engineering and Economics; Chapman and Hall/CRC eBooks: Boca Raton, FL, USA, 2003. [Google Scholar] [CrossRef]
- Salicone, S.; Prioli, M. Measuring uncertainty within the theory of evidence. In Springer Series in Measurement Science and Technology; Springer: Berlin/Heidelberg, Germany, 2018. [Google Scholar] [CrossRef]
- Dempster, A.P. Upper and lower probabilities induced by a multivalued mapping. Ann. Math. Stat. 1967, 38, 325–339. [Google Scholar] [CrossRef]
- Shafer, G. A Mathematical Theory of Evidence; Princeton University Press eBooks: Princeton, NJ, USA, 1976. [Google Scholar]
- Feizizadeh, B. A novel approach of fuzzy Dempster–Shafer theory for spatial uncertainty analysis and accuracy assessment of object-based image classification. IEEE Geosci. Remote Sens. Lett. 2017, 15, 18–22. [Google Scholar] [CrossRef]
- Rakowsky, U.K. Fundamentals of the Dempster-Shafer theory and its applications to reliability modeling. Int. J. Reliab. Qual. Saf. Eng. 2007, 14, 579–601. [Google Scholar] [CrossRef]
- Andrews, J.D.; Dunnett, S.J. Event-tree analysis using binary decision diagrams. IEEE Trans. Reliab. 2000, 49, 230–238. [Google Scholar] [CrossRef]
- Aerts, J.C.J.H. A review of cost estimates for flood adaptation. Water 2018, 10, 1646. [Google Scholar] [CrossRef]
- Design and Construction of Dams, Reservoirs, and Balancing Lakes. Available online: https://inis.iaea.org/collection/NCLCollectionStore/_Public/43/035/43035255.pdf (accessed on 1 May 2025).
- Linham, M.M.; Green, C.H.; Nicholls, R.J. Costs of Adaptation to the Effects of Climate in the World’s Largest Port Cities; AVOID: London, UK, 2010; p. 225. [Google Scholar]
- Jonkman, S.N.; Hillen, M.M.; Nicholls, R.J.; Kanning, W.; van Ledden, M. Costs of adapting coastal defences to sea-level rise—New estimates and their implications. J. Coast. Res. 2013, 29, 1212–1226. [Google Scholar] [CrossRef]
- Aerts, J.C.; Botzen, W.W.; de Moel, H.; Bowman, M. Cost estimates for flood resilience and protection strategies in New York City. Ann. N. Y. Acad. Sci. 2013, 1294, 1–104. [Google Scholar] [CrossRef] [PubMed]
- Aerts, J.C.; Barnard, P.L.; Botzen, W.; Grifman, P.; Hart, J.F.; De Moel, H.; Mann, A.N.; De Ruig, L.T.; Sadrpour, N. Pathways to resilience: Adapting to sea level rise in Los Angeles. Ann. N. Y. Acad. Sci. 2018, 1427, 1–90. [Google Scholar] [CrossRef]
- Lasage, R.; Veldkamp, T.I.E.; de Moel, H.; Van, T.C.; Phi, H.L.; Vellinga, P.; Aerts, J.C.J.H. Assessment of the effectiveness of flood adaption strategies for HCMC. Nat. Hazards Earth Syst. Sci. 2014, 14, 1441–1457. [Google Scholar] [CrossRef]
- Bayraktarov, E.; Saunders, M.; Abdullah, S.; Mills, M.; Beher, J.; Possingham, H.P.; Mumby, P.J.; Lovelock, C.E. The cost and feasibility of marine coastal restoration. Ecol. Appl. 2016, 26, 1055–1074. [Google Scholar] [CrossRef]
- Lamond, J.; Rose, C.; Bhattacharya-Mis, N.; Joseph, R. Evidence Review for Property Flood Reliance Phase 2 Report. 2017. Available online: https://www.floodre.co.uk/wp-content/uploads/UWE-report_Evidence-review-for-PFR_Phase-2-report-1.pdf (accessed on 10 May 2025).
- Narayan, S.; Beck, M.; Reguero, B.; Losada, I.; Van Wesenbeeck, B.; Pontee, N.; Sanchirico, J.; Ingram, J.; Lange, G.; Burks-Copes, K. The Effectiveness, Costs and Coastal Protection Benefits of Natural and Nature-Based Defences. PLoS ONE 2016, 11, e0154735. [Google Scholar] [CrossRef]
- Certa, A.; Hopps, F.; Inghilleri, R.; La Fata, C.M. A Dempster-Shafer Theory-based approach to the Failure Mode, Effects and Criticality Analysis (FMECA) under epistemic uncertainty: Application to the propulsion system of a fishing vessel. Reliab. Eng. Syst. Saf. 2016, 159, 69–79. [Google Scholar] [CrossRef]
- Chen, L.; Deng, Y. A new failure mode and effects analysis model using Dempster–Shafer evidence theory and grey relational projection method. Eng. Appl. Artif. Intell. 2018, 76, 13–20. [Google Scholar] [CrossRef]
- Hu, Y.; Gou, L.; Deng, X.; Jiang, W. Failure mode and effect analysis using multi-linguistic terms and Dempster–Shafer evidence theory. Qual. Reliab. Eng. Int. 2020, 37, 920–934. [Google Scholar] [CrossRef]
- Jiang, W.; Xie, C.; Wei, B.; Zhou, D. A modified method for risk evaluation in failure modes and effects analysis of aircraft turbine rotor blades. Adv. Mech. Eng. 2016, 8, 1687814016644579. [Google Scholar] [CrossRef]
- Spasenic, Z.; Makajic-Nikolic, D.; Benkovic, S. Risk assessment of financing renewable energy projects: A case study of financing a small hydropower plant project in Serbia. Energy Rep. 2022, 8, 8437–8450. [Google Scholar] [CrossRef]
- Su, X.; Deng, Y.; Mahadevan, S.; Bao, Q. An improved method for risk evaluation in failure modes and effects analysis of aircraft engine rotor blades. Eng. Fail. Anal. 2012, 26, 164–174. [Google Scholar] [CrossRef]
- Suo, B.; Zhao, L.; Yan, Y. A novel Dempster-Shafer theory-based approach with weighted average for failure mode and effects analysis under uncertainty. J. Loss Prev. Process Ind. 2020, 65, 104145. [Google Scholar] [CrossRef]
- Wang, Z.; Gao, J.; Wang, R.; Chen, K.; Gao, Z.; Jiang, Y. Failure mode and effects analysis using Dempster-Shafer theory and TOPSIS method: Application to the gas insulated metal enclosed transmission line (GIL). Appl. Soft Comput. 2018, 70, 633–647. [Google Scholar] [CrossRef]
- Wang, W.; Liu, X.; Chen, X.; Qin, Y. Risk assessment based on hybrid FMEA framework by considering decision maker’s psychological behavior character. Comput. Ind. Eng. 2019, 136, 516–527. [Google Scholar] [CrossRef]
- Yang, J.; Huang, H.; He, L.; Zhu, S.; Wen, D. Risk evaluation in failure mode and effects analysis of aircraft turbine rotor blades using Dempster–Shafer evidence theory under uncertainty. Eng. Fail. Anal. 2011, 18, 2084–2092. [Google Scholar] [CrossRef]
- Tayyebi, A.H.; Delavar, M.R.; Tayyebi, A.; Golobi, M. Combining Multi-Criteria Decision Making and Dempster–Shafer Theory for Landfill Site Selection. Int. Arch. Photogramm. Remote Sens. Spat. Inf. Sci. 2010, 38, 1073–1078. [Google Scholar]
- van Leusen, M.; Millard, A.R.; Ducke, B. Dealing with Uncertainty in Archaeological Prediction. In Archaeological Prediction and Risk Management; Oxbow Books: Oxford, UK, 2009; p. 123. [Google Scholar]
- Polomčić, D.; Bajić, D.; Ratković, J. Assessment of historical flood risk to the groundwater regime: Case study of the Kolubara Coal Basin, Serbia. Water 2018, 10, 588. [Google Scholar] [CrossRef]
- Plavšić, J.; Vladiković, D.; Despotović, J. Floods in the Sava River basin in May 2014. In Proceedings of the Mediterranean Meeting on Monitoring, Modelling, Early Warning of Extreme Events Triggered by Heavy Rainfall, PON 01_01503-MED-FRIEND Project, University of Calabria, Cosenza, Italy, 26–28 June 2014. [Google Scholar]
- Optimising Flood Risk Assessment through Scenario-Based Modelling, Probabilistic Risk Quantification, and Comprehensive Vulnerability Assessments. Available online: https://www.floodcontrol2015.com/optimising-flood-risk-assessment-through-scenario-based-modelling-probabilistic-risk-quantification-and-comprehensive-vulnerability-assessments/?utm_source=chatgpt.com (accessed on 5 April 2025).
- Zhao, L.; Su, Y.; Song, Z.; Xu, T.; Chen, D. Study on coupled assessment method of collapse risk in tunnel construction. J. Saf. Environ. 2024, 24, 0291. [Google Scholar] [CrossRef]
- Huang, Z.; Jiang, W.; Tang, Y. A new method to evaluate risk in failure mode and effects analysis under fuzzy information. Soft Comput. 2018, 22, 4779–4787. [Google Scholar] [CrossRef]
- Ahmadisharaf, E.; Alamdari, N.; Tajrishy, M.; Ghanbari, S. Effectiveness of retention ponds for sustainable urban flood mitigation across range of storm depths in northern Tehran. J. Sustain. Water Built Environ. 2021, 7, 05021003. [Google Scholar] [CrossRef]
- Boulange, J.; Hanasaki, N.; Yamazaki, D.; Pokhrel, Y. Role of dams in reducing global flood exposure under climate change. Nat. Commun. 2021, 12, 417. [Google Scholar] [CrossRef] [PubMed]
- Bu, J.; Zhang, S.; Li, C.; Xu, X.; Wang, X.; Liu, Q.; Wang, X.A. A longitudinal functional connectivity comprehensive index for multi-sluice flood control system in plain urban river networks. J. Hydrol. 2022, 613, 128362. [Google Scholar] [CrossRef]
- Mel, R.A.; Viero, D.P.; Carniello, L.; D’Alpaos, L. Optimal floodgate operation for river flood management: The case study of Padova (Italy). J. Hydrol. Reg. Stud. 2020, 30, 100702. [Google Scholar] [CrossRef]
- Serra-Llobet, A.; Kondolf, G.M.; Magdaleno, F.; Keenan-Jones, D. Flood diversions and bypasses: Benefits and challenges. Wiley Interdiscip. Rev. Water 2022, 9, e1562. [Google Scholar] [CrossRef]
- Tan, W.Y.; Teo, F.Y.; Chong, C.X.Y.; Tan, C.Y.; Lim, C.H. A Review on lightweight mobile flood wall barrier: Way forward for Malaysia. J. Inst. Eng. Malays. 2024, 84, 1–10. [Google Scholar] [CrossRef]
- Terêncio, D.P.; Fernandes, L.S.; Cortes, R.M.V.; Moura, J.P.; Pacheco, F.A.L. Flood risk attenuation in critical zones of continental Portugal using sustainable detention basins. Sci. Total Environ. 2020, 721, 137727. [Google Scholar] [CrossRef]
- Wenger, C. Better use and management of levees: Reducing flood risk in a changing climate. Environ. Rev. 2015, 23, 240–255. [Google Scholar] [CrossRef]
- Aerts, J.C.; Botzen, W.J.W. Flood-resilient waterfront development in New York City: Bridging flood insurance, building codes, and flood zoning. Ann. N.Y. Acad. Sci. 2011, 1227, 1–82. [Google Scholar] [CrossRef]
- Fernández-Nóvoa, D.; García-Feal, O.; González-Cao, J.; De Gonzalo, C.; Rodríguez-Suárez, J.A.; Ruiz Del Portal, C.; Gómez-Gesteira, M. MIDAS: A new integrated flood early warning system for the Miño River. Water 2020, 12, 2319. [Google Scholar] [CrossRef]
- Gimenez-Maranges, M.; Breuste, J.; Hof, A. Sustainable Drainage Systems for transitioning to sustainable urban flood management in the European Union: A review. J. Clean. Prod. 2020, 255, 120191. [Google Scholar] [CrossRef]
- Handayani, W.; Chigbu, U.E.; Rudiarto, I.; Putri, I.H.S. Urbanization and increasing flood risk in the northern coast of Central Java-Indonesia: An assessment towards better land use policy and flood management. Land 2020, 9, 343. [Google Scholar] [CrossRef]
- Hossain, B. Role of organizations in preparedness and emergency response to flood disaster in Bangladesh. Geoenvironmental Dis. 2020, 7, 33. [Google Scholar] [CrossRef]
- Kumar, V.; Azamathulla, H.M.; Sharma, K.V.; Mehta, D.J.; Maharaj, K.T. The state of the art in deep learning applications, challenges, and future prospects: A comprehensive review of flood forecasting and management. Sustainability 2023, 15, 10543. [Google Scholar] [CrossRef]
- Serra-Llobet, A.; Jähnig, S.C.; Geist, J.; Kondolf, G.M.; Damm, C.; Scholz, M.; Lund, J.; Opperman, J.J.; Yarnell, S.M.; Pawley, A.; et al. Restoring rivers and floodplains for habitat and flood risk reduction: Experiences in multi-benefit floodplain management from California and Germany. Front. Environ. Sci. 2022, 9, 778568. [Google Scholar] [CrossRef]
- Teshome, M.A. Review of Recent Studies on Urban Stormwater Drainage System for Urban Flood Management; Preprints: Basel, Switzerland, 2020. [Google Scholar] [CrossRef]
- Costanza, R.; Anderson, S.J.; Sutton, P.; Mulder, K.; Mulder, O.; Kubiszewski, I.; Wang, X.; Liu, X.; Pérez-Maqueo, O.; Martinez, M.L.; et al. The global value of coastal wetlands for storm protection. Glob. Environ. Change 2021, 70, 102328. [Google Scholar] [CrossRef]
- Markart, G.; Teich, M.; Scheidl, C.; Kohl, B. Flood Protection by Forests in Alpine Watersheds: Lessons Learned from Austrian Case Studies; IntechOpen eBooks: London, UK, 2022. [Google Scholar] [CrossRef]
- Olokeogun, O.S.; Ayanlade, A.; Popoola, O.O. Assessment of riparian zone dynamics and its flood-related implications in Eleyele area of Ibadan, Nigeria. Environ. Syst. Res. 2020, 9, 6. [Google Scholar] [CrossRef]
- Srivastav, A.L.; Dhyani, R.; Ranjan, M.; Madhav, S.; Sillanpää, M. Climate-resilient strategies for sustainable management of water resources and agriculture. Environ. Sci. Pollut. Res. 2021, 28, 41576–41595. [Google Scholar] [CrossRef]
- Takata, K.; Hanasaki, N. The effects of afforestation as an adaptation option: A case study in the upper Chao Phraya River basin. Environ. Res. Lett. 2020, 15, 044020. [Google Scholar] [CrossRef]
- Wu, Y.; Zhang, G.; Rousseau, A.N.; Xu, Y.J.; Foulon, É. On how wetlands can provide flood resilience in a large river basin: A case study in Nenjiang River Basin, China. J. Hydrol. 2020, 587, 125012. [Google Scholar] [CrossRef]
- Cvetkovic, V.M.; Martinović, J. Innovative solutions for flood risk management. Int. J. Disaster Risk Manag. 2020, 2, 71–100. [Google Scholar] [CrossRef]
- Iqbal, A.; Rahman, M.M.; Beecham, S. Permeable pavements for flood control in Australia: Spatial analysis of pavement design considering rainfall and soil data. Sustainability 2022, 14, 4970. [Google Scholar] [CrossRef]
- Sulasikin, A.; Nugrahat, Y.; Aminanto, M.E.; Nasution, B.I.; Kanggrawan, J.I. Developing a knowledge management system for supporting flood decision-making. In Proceedings of the 2022 IEEE International Smart Cities Conference (ISC2), Pafos, Cyprus, 26–29 September 2022; IEEE: New York, NY, USA; pp. 1–4. [Google Scholar] [CrossRef]
- Campos, P.C.d.O.; Paz, T.d.S.R.; Lenz, L.; Qiu, Y.; Alves, C.N.; Simoni, A.P.R.; Amorim, J.C.C.; Lima, G.B.A.; Rangel, M.P.; Paz, I. Multi-Criteria Decision Method for Sustainable Watercourse Management in Urban Areas. Sustainability 2020, 12, 6493. [Google Scholar] [CrossRef]
- Thampapillai, D.J.; Musgrave, W.F. Flood Damage Mitigation: A Review of Structural and Nonstructural Measures and Alternative Decision Frameworks. Water Resour. Res. 1985, 21, 411–424. [Google Scholar] [CrossRef]
- Kim, S.; Yoon, S. The Role of Risk Mitigation and Adaptation Measures in Climate Resilience: A Case Study of Ho Chi Minh City in Vietnam. J. Clim. Change Res. 2025, 16, 113–132. [Google Scholar] [CrossRef]
- Zhang, Y.; Zhou, M.; Kong, N.; Li, X.; Zhou, X. Evaluation of Emergency Response Capacity of Urban Pluvial Flooding Public Service Based on Scenario Simulation. Int. J. Environ. Res. Public Health 2022, 19, 16542. [Google Scholar] [CrossRef]
- Feleke, H.G.; Amdie, T.A.; Rasche, F.; Mersha, S.Y.; Brandt, C. Climate on the Edge: Impacts and Adaptation in Ethiopia’s Agriculture. Sustainability 2025, 17, 5119. [Google Scholar] [CrossRef]
- Vicario, S.A.; Mazzoleni, M.; Bhamidipati, S.; Gharesifard, M.; Ridolfi, E.; Pandolfo, C.; Alfonso, L. Unravelling the influence of human behaviour on reducing casualties during flood evacuation. Hydrol. Sci. J. 2020, 65, 2359–2375. [Google Scholar] [CrossRef]
- Morisaki, Y.; Fujiu, M.; Takayama, J. Analysis of flood risk for vulnerable people using assumed flood area data focused on aged people and infants. Sustainability 2023, 15, 16282. [Google Scholar] [CrossRef]
- Cutter, S.L.; Boruff, B.J.; Shirley, W.L. Social vulnerability to environmental hazards. Soc. Sci. Q 2003, 84, 242–261. [Google Scholar] [CrossRef]
- Insani, N.; Akman, D.; Taheri, S.; Hearne, J. Short-notice flood evacuation plan under dynamic demand in high populated areas. Int. J. Disaster Risk Reduct. 2022, 74, 102844. [Google Scholar] [CrossRef]
- Yazdani, M.; Haghani, M. Elderly people evacuation planning in response to extreme flood events using optimisation-based decision-making systems: A case study in western Sydney, Australia. Knowl.-Based Syst. 2023, 274, 110629. [Google Scholar] [CrossRef]
- International Federation of Red Cross and Red Crescent Societies. Public Awareness and Public Education for Disaster Risk Reduction: Action-Oriented Key Messages for Households and Schools, 2nd ed.; International Federation of Red Cross and Red Crescent Societies: Geneva, Switzerland, 2018. [Google Scholar]
- Chopra, B.; Venkatesh, M. Dealing with disasters: Need for awareness and preparedness. Med. J. Armed Forces India 2015, 71, 211–213. [Google Scholar] [CrossRef]
- Bernardini, G.; Postacchini, M.; Quagliarini, E.; Brocchini, M.; Cianca, C.; D’Orazio, M.A. Preliminary combined simulation tool for the risk assessment of pedestrians’ flood-induced evacuation. Environ. Model. Softw. 2017, 96, 14–29. [Google Scholar] [CrossRef]
- Nagendra, N.P.; Narayanamurthy, G.; Moser, R. Management of humanitarian relief operations using satellite big data analytics: The case of Kerala floods. Ann. Oper. Res. 2022, 319, 885–910. [Google Scholar] [CrossRef]
- Jain, G.; Singh, C.; Coelho, K.; Malladi, T. Long-term implications of humanitarian responses: The case of Chennai. In IIED Working Paper; International Institute for Environment and Development: London, UK, 2017. [Google Scholar]
- Wahl, T.; Haigh, I.D.; Nicholls, R.J.; Arns, A.; Dangendorf, S.; Hinkel, J.; Slangen, A.B. Understanding Extreme Sea Levels for Broad-Scale Coastal Impact and Adaptation Analysis. Nat. Commun. 2017, 8, 16075. [Google Scholar] [CrossRef]
- Salvadore, E.; Bronders, J.; Batelaan, O. Hydrological Modelling of Urbanized Catchments: A Review and Future Directions. J. Hydrol. 2015, 529, 62–81. [Google Scholar] [CrossRef]
- Chaurasia, K.; Garg, P.K.; Arun, P.V.; Yan, Y. Spatial Intelligence for a Greener Planet: AI Applications in Environmental Pollution Mapping, Analysis and Mitigation, 1st ed.; CRC Press: Boca Raton, FL, USA, 2024. [Google Scholar] [CrossRef]
- Das, J.; Halder, S. (Eds.) New Advancements in Geomorphological Research—Issues and Challenges in Quantitative Spatial Science; Springer Nature: Cham, Switzerland, 2024. [Google Scholar]
- He, M.; Rozos, E. Editorial: Harnessing Artificial Intelligence to Address Climate-Induced Challenges in Water Resources Management. Front. Water 2025, 7, 1637341. [Google Scholar] [CrossRef]
- Nivedita, V.; Begum, S.; Sakthi, U.; Sellam, V.M.; Navaneethan, C.; Sikkandar, M.Y.; Jayasankar, T.; Vivek, S. Assessment of flood vulnerability in a coastal metropolitan city for sustainable environmental using Machine Learning methods. Res. Sq. 2024. [Google Scholar] [CrossRef]
- Song, Z.; Yang, Z.; Zhang, Y.; Huo, R. Application status and prospects of deep learning applications in tunnel and underground engineering. Tunn. Constr. 2025, 45, 221. [Google Scholar] [CrossRef]
- Wang, J. Numerical Simulation of Groundwater Problem Using a Deep Learning Approach. Ph.D. Thesis, Wuhan University, Wuhan, China, 2021. [Google Scholar]
- Zhan, C. Identification of Aquifer Facies Structures Integrating Data Fusion and Deep Learning. Ph.D. Thesis, Jilin University, Changchun, China, 2023. [Google Scholar]
- Altay, N.; Green, W.G. OR/MS research in disaster operations management. Eur. J. Oper. Res. 2005, 175, 475–493. [Google Scholar] [CrossRef]
- Díaz, H.L.; Imitola, K.A.; Amado, R.J.A. OR/MS research perspectives in disaster operations management: A literature review. Rev. Fac. Ing. 2019, 91, 43–59. [Google Scholar] [CrossRef]
- Operations Research in Disaster Preparedness and Response—The Public Health Perspective. Available online: https://op.europa.eu/en/publication-detail/-/publication/8579c689-ff66-4c6e-b394-b9e57a4ae8dc/language-en (accessed on 6 May 2025).
- Hertelendy, A.J.; Ciottone, G.R. Averting flood-related deaths and injuries from hurricanes: Enhancing hospital resilience. Lancet Reg. Health Am. 2024, 40, 100930. [Google Scholar] [CrossRef]
- Blöschl, G.; Hall, J.; Viglione, A.; Perdigão, R.A.P.; Parajka, J.; Merz, B. Changing climate both increases and decreases European river floods. Nature 2019, 573, 108–111. [Google Scholar] [CrossRef]
- Alfieri, L.; Feyen, L.; Dottori, F.; Bianchi, A. Ensemble flood risk assessment in Europe under high end climate scenarios. Glob. Environ. Change 2015, 35, 199–212. [Google Scholar] [CrossRef]
- IPCC. Climate Change 2021: The Physical Science Basis. In Contribution of Working Group I to the Sixth Assessment Report of the Intergovernmental Panel on Climate Change; Cambridge University Press: Cambridge, UK, 2021; Available online: https://www.ipcc.ch/report/ar6/wg1/ (accessed on 6 May 2025).
- Thieken, A.H.; Bessel, T.; Kienzler, S.; Kreibich, H.; Müller, M.; Pisi, S.; Schröter, K. The flood of June 2013 in Germany: How much do we know about its impacts? Nat. Hazards Earth Syst. Sci. 2016, 16, 1519–1540. [Google Scholar] [CrossRef]
- Kreibich, H.; Di Baldassarre, G.; Vorogushyn, S.; Aerts, J.C.J.H.; Apel, H.; Aronica, G.T.; Arnbjerg-Nielsen, K.; Bouwer, L.M.; Bubeck, P.; Caloiero, T.; et al. Adaptation to flood risk: Results of international paired flood event studies. Earth’s Future 2017, 5, 953–965. [Google Scholar] [CrossRef]
- Bubeck, P.; Botzen, W.J.W.; Aerts, J.C.J.H. A review of risk perceptions and other factors that influence flood mitigation behavior. Risk Anal. 2012, 32, 1481–1495. [Google Scholar] [CrossRef]
| Barriers | B1 | B2 | B3 | B4 | B5 | B6 | B7 | B8 | B9 | B10 | B11 |
|---|---|---|---|---|---|---|---|---|---|---|---|
| bpa | 0.560 | 0.421 | 0.490 | 0.430 | 0.511 | 0.512 | 0.426 | 0.512 | 0.417 | 0.415 | 0.418 |
| % of Available Budget | |||||||||||
|---|---|---|---|---|---|---|---|---|---|---|---|
| Measure Symbol | Measures | 10 | 20 | 30 | 40 | 50 | 60 | 70 | 80 | 90 | 100 |
| m1 | Dams and reservoirs | 0 | 0 | 0 | 0 | 0 | 0 | 0 | 0 | 1 | 1 |
| m2 | Levees and floodwalls | 0 | 0 | 0 | 0 | 0 | 1 | 1 | 1 | 1 | 1 |
| m3 | Diversion channels | 0 | 1 | 0 | 1 | 1 | 1 | 1 | 1 | 1 | 1 |
| m4 | Floodgates and sluices | 0 | 0 | 0 | 0 | 0 | 0 | 1 | 1 | 1 | 1 |
| m5 | Retention basins and ponds | 0 | 0 | 1 | 1 | 1 | 1 | 1 | 1 | 1 | 1 |
| m6 | Detention basins | 0 | 0 | 0 | 0 | 0 | 0 | 0 | 1 | 1 | 1 |
| m7 | Flood forecasting and early warning systems | 0 | 0 | 1 | 1 | 1 | 1 | 1 | 1 | 1 | 1 |
| m8 | Floodplain zoning and land use planning | 0 | 0 | 0 | 0 | 1 | 0 | 0 | 0 | 0 | 0 |
| m9 | Building codes and standards | 1 | 0 | 1 | 0 | 1 | 1 | 1 | 1 | 1 | 1 |
| m10 | Emergency response plans | 1 | 1 | 1 | 1 | 1 | 1 | 1 | 1 | 1 | 1 |
| m11 | Maintenance of drainage systems | 0 | 0 | 1 | 1 | 1 | 1 | 1 | 1 | 1 | 1 |
| m12 | Wetland restoration | 0 | 0 | 0 | 0 | 1 | 1 | 1 | 1 | 0 | 0 |
| m13 | Riparian buffer zone | 0 | 1 | 1 | 1 | 1 | 1 | 1 | 1 | 1 | 1 |
| m14 | Reforestation and afforestation | 0 | 0 | 0 | 1 | 1 | 1 | 1 | 1 | 1 | 1 |
| m15 | Sustainable agriculture practices | 0 | 0 | 0 | 0 | 0 | 0 | 0 | 0 | 0 | 0 |
| m16 | Coastal wetland protection | 0 | 0 | 1 | 1 | 1 | 1 | 1 | 1 | 1 | 1 |
| m17 | Smart flood management systems | 1 | 1 | 1 | 1 | 1 | 1 | 1 | 1 | 1 | 1 |
| m18 | Permeable pavements | 0 | 0 | 0 | 0 | 0 | 0 | 0 | 0 | 0 | 0 |
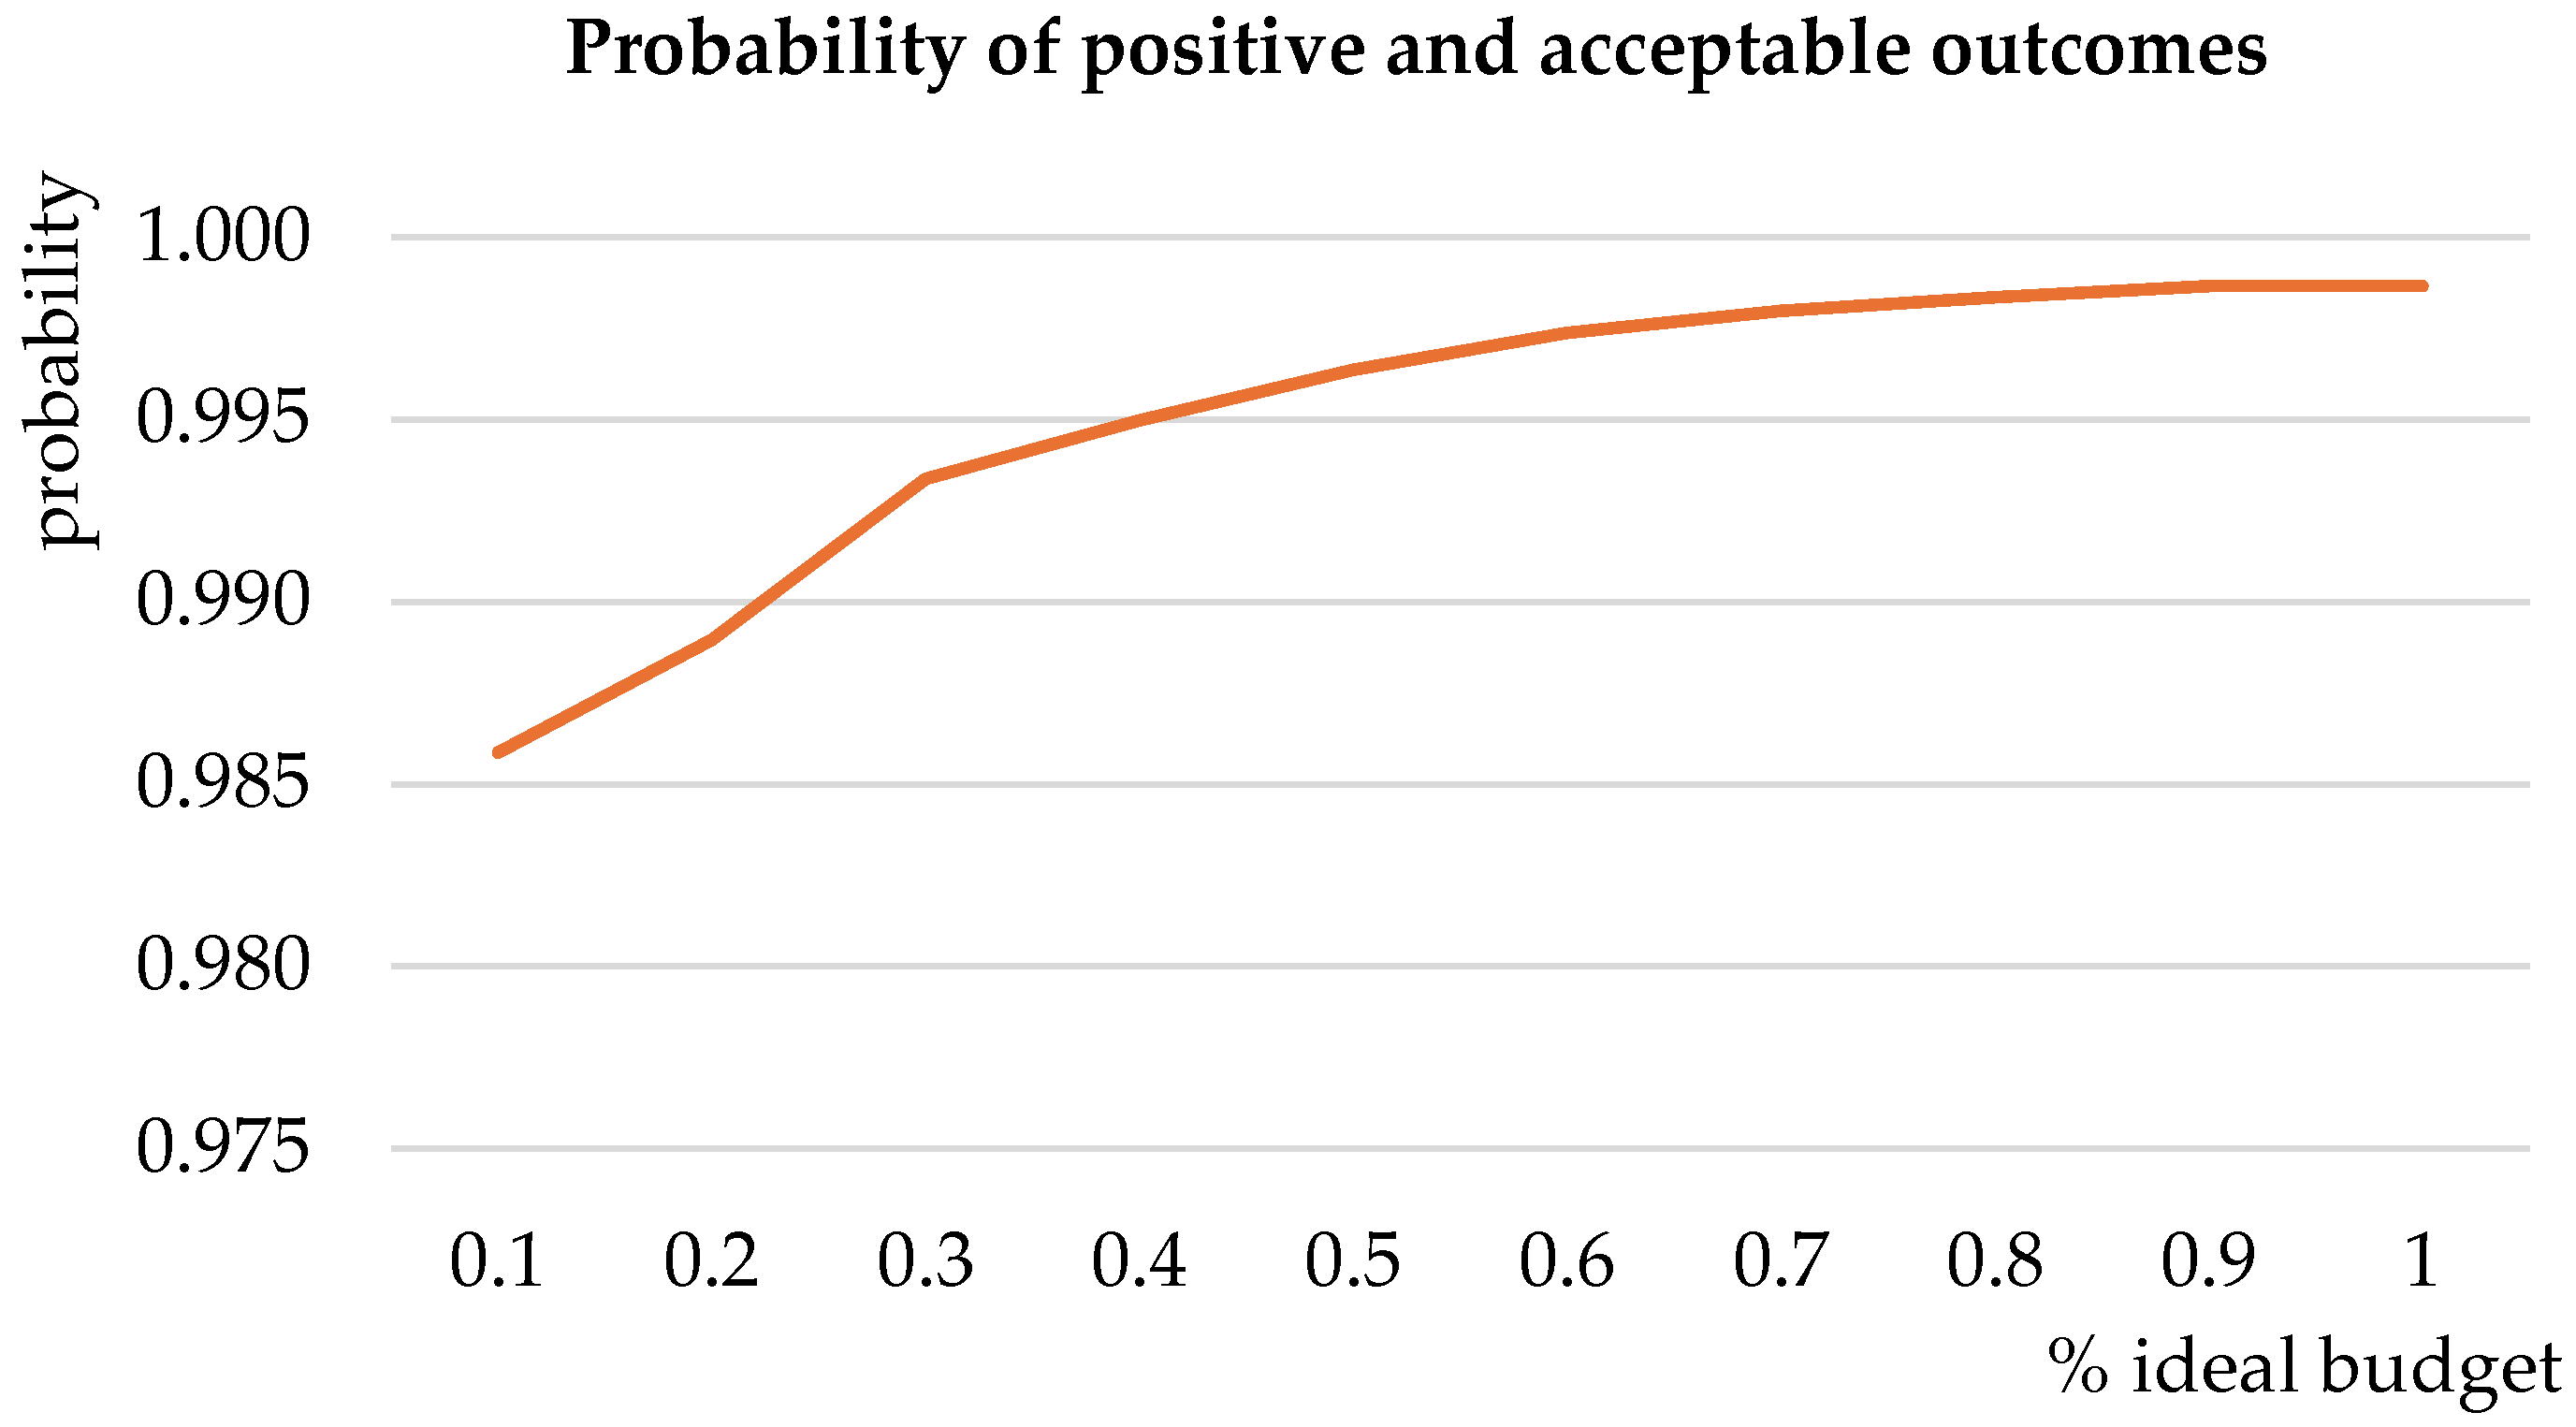
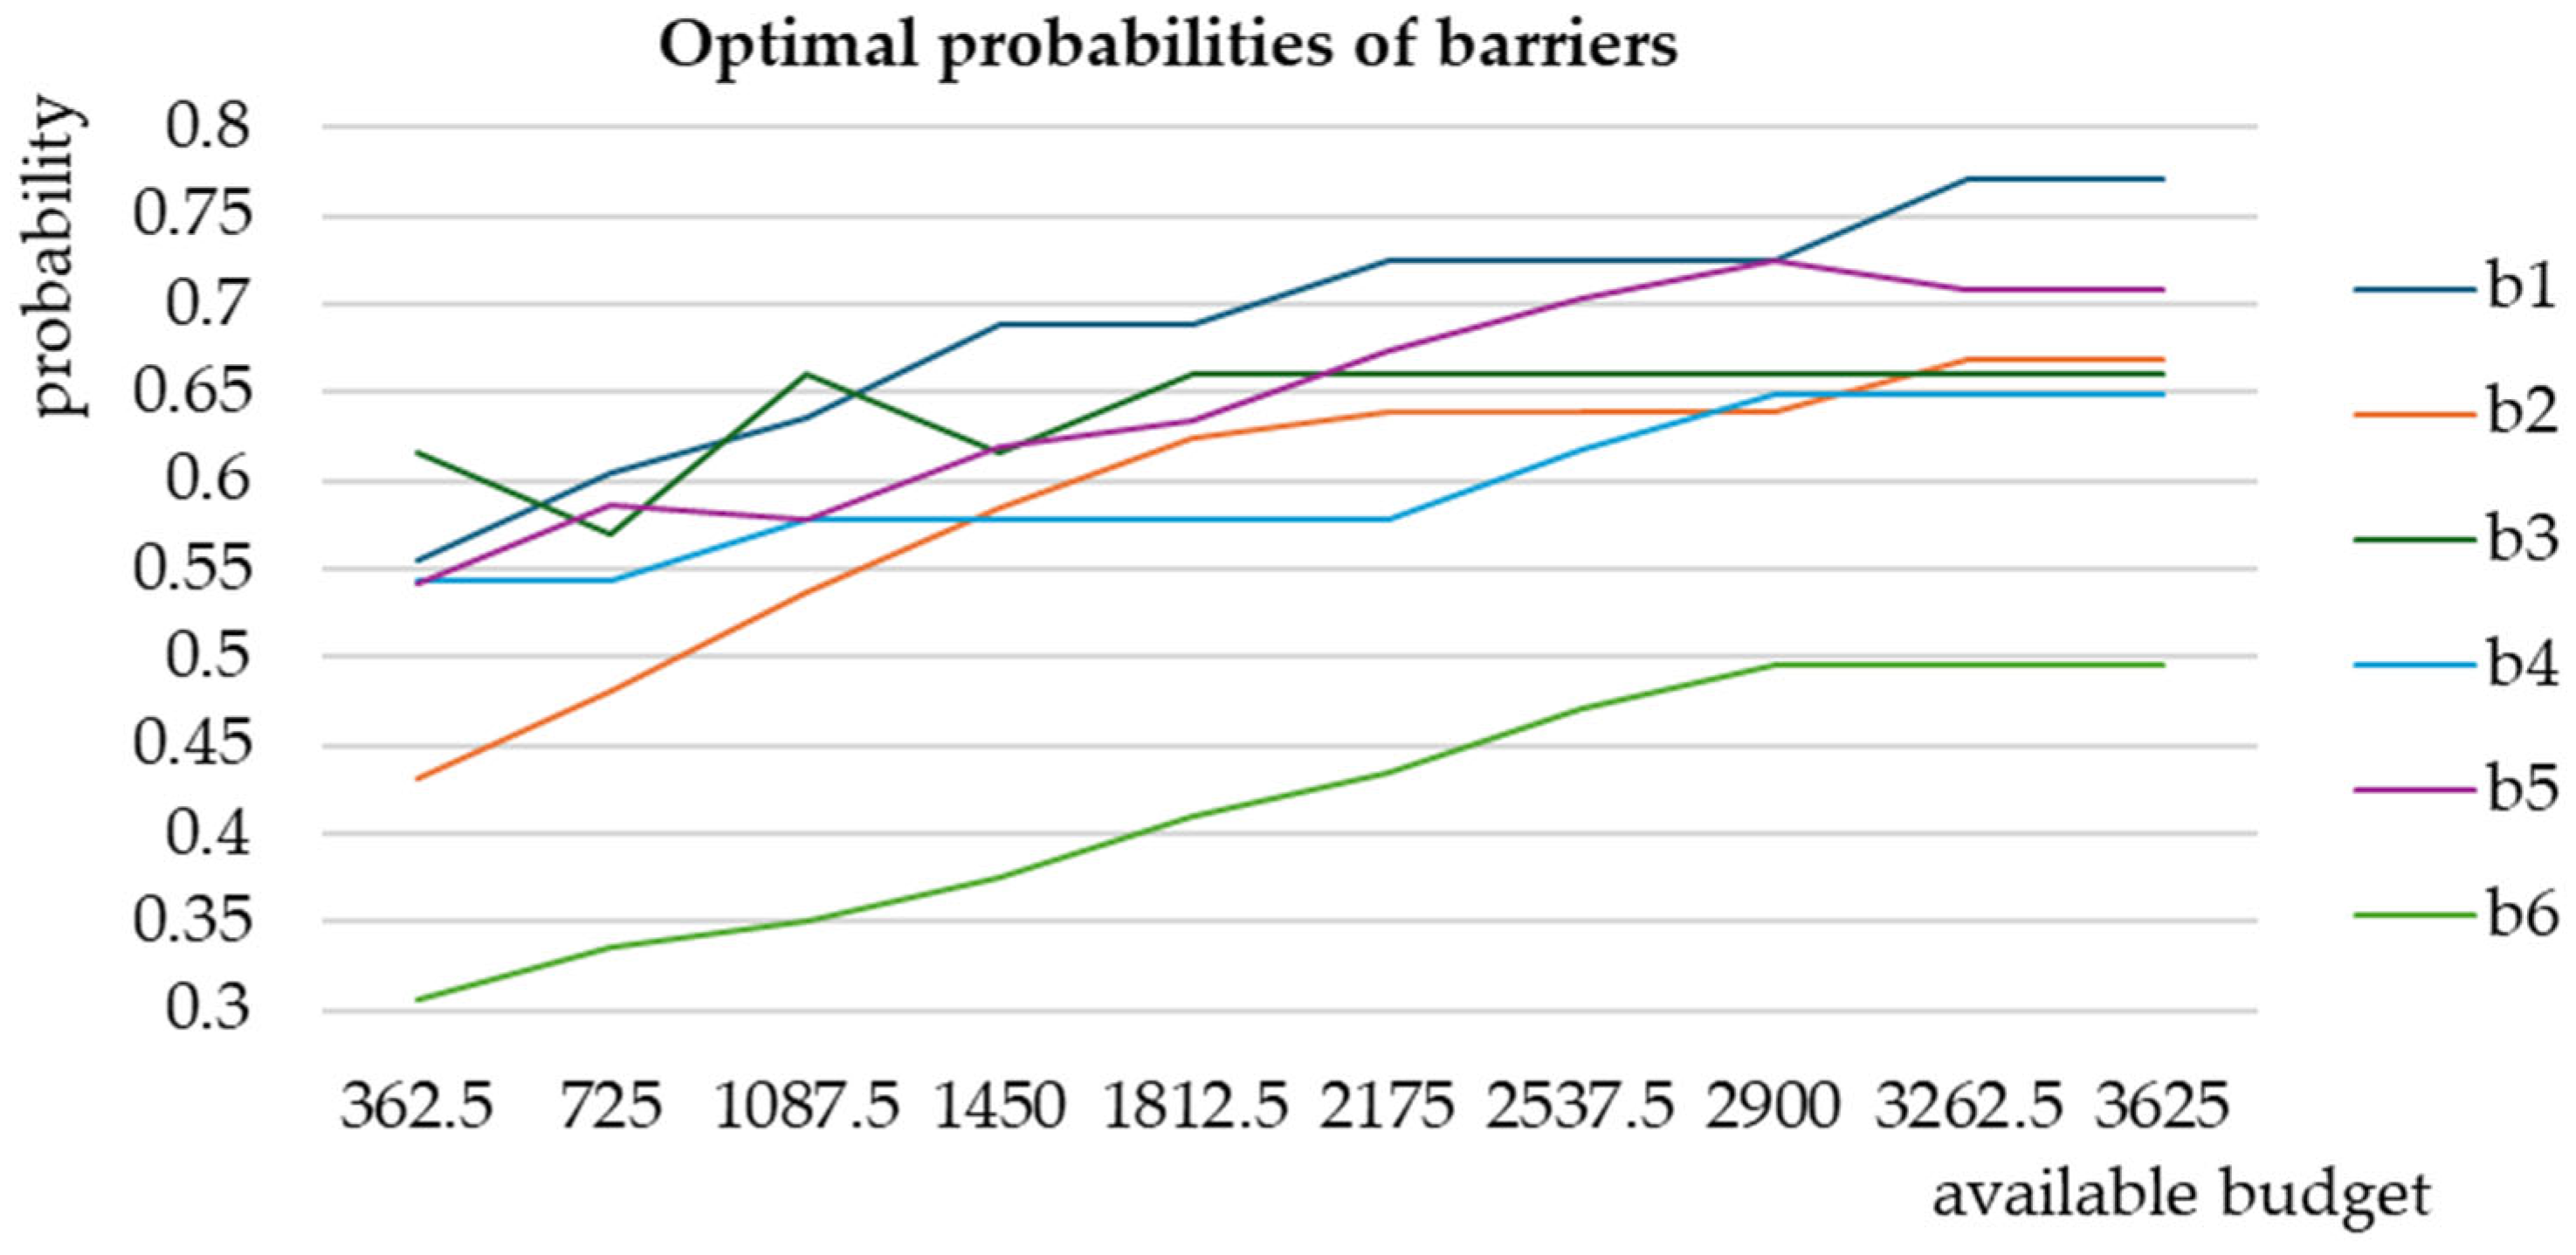
| %Ideal Budget | Available Budget | Probability | No of Measures | Probability Increase | |||||
|---|---|---|---|---|---|---|---|---|---|
| b1 | b2 | b3 | b4 | b5 | b6 | ||||
| 0.1 | 362.5 | 0.9859 | 3 | 0.0000 | 0.0800 | 0.2498 | 0.2066 | 0.0906 | 0.2598 |
| 0.2 | 725 | 0.9890 | 4 | 0.0901 | 0.2025 | 0.1584 | 0.2066 | 0.1812 | 0.3835 |
| 0.3 | 1087.5 | 0.9934 | 8 | 0.1441 | 0.3425 | 0.3411 | 0.2844 | 0.1651 | 0.4454 |
| 0.4 | 1450 | 0.9950 | 9 | 0.2387 | 0.4600 | 0.2498 | 0.2844 | 0.2456 | 0.5485 |
| 0.5 | 1812.5 | 0.9964 | 12 | 0.2387 | 0.5600 | 0.3411 | 0.2844 | 0.2758 | 0.6928 |
| 0.6 | 2175 | 0.9974 | 12 | 0.3063 | 0.5975 | 0.3411 | 0.2844 | 0.3563 | 0.7959 |
| 0.7 | 2537.5 | 0.9980 | 13 | 0.3063 | 0.5975 | 0.3411 | 0.3733 | 0.4167 | 0.9402 |
| 0.8 | 2900 | 0.9983 | 14 | 0.3063 | 0.5975 | 0.3411 | 0.4399 | 0.4569 | 1.0433 |
| 0.9 | 3262.5 | 0.9987 | 14 | 0.3873 | 0.6725 | 0.3411 | 0.4399 | 0.4267 | 1.0433 |
| 1 | 3625 | 0.9987 | 14 | 0.3873 | 0.6725 | 0.3411 | 0.4399 | 0.4267 | 1.0433 |
Disclaimer/Publisher’s Note: The statements, opinions and data contained in all publications are solely those of the individual author(s) and contributor(s) and not of MDPI and/or the editor(s). MDPI and/or the editor(s) disclaim responsibility for any injury to people or property resulting from any ideas, methods, instructions or products referred to in the content. |
© 2025 by the authors. Licensee MDPI, Basel, Switzerland. This article is an open access article distributed under the terms and conditions of the Creative Commons Attribution (CC BY) license (https://creativecommons.org/licenses/by/4.0/).
Share and Cite
Radaković, J.A.; Makajić-Nikolić, D.; Nikolić, N. Bridging the Gap: A Novel Approach to Flood Risk Assessment for Resilience. Water 2025, 17, 1848. https://doi.org/10.3390/w17131848
Radaković JA, Makajić-Nikolić D, Nikolić N. Bridging the Gap: A Novel Approach to Flood Risk Assessment for Resilience. Water. 2025; 17(13):1848. https://doi.org/10.3390/w17131848
Chicago/Turabian StyleRadaković, Jelena Andreja, Dragana Makajić-Nikolić, and Nebojša Nikolić. 2025. "Bridging the Gap: A Novel Approach to Flood Risk Assessment for Resilience" Water 17, no. 13: 1848. https://doi.org/10.3390/w17131848
APA StyleRadaković, J. A., Makajić-Nikolić, D., & Nikolić, N. (2025). Bridging the Gap: A Novel Approach to Flood Risk Assessment for Resilience. Water, 17(13), 1848. https://doi.org/10.3390/w17131848