Article

Water Demand and Photosynthetic Performance of Tomatoes Grown Hydroponically Under Increasing Nitrogen Concentrations

by
Pablo Rugero Magalhães Dourado
1,
Martha Katharinne Silva Souza Paulino
1,*,
Lucas Yago de Carvalho Leal
1,
Cicero Aparecido Ferreira Araújo
1,
José Alfredo Nunes
1,
Emidio Cantídio de Oliveira
1,
José Amilton Santos Júnior
1,
Aline de Camargo Santos
2,
Diego Arruda Huggins de Sá Leitão
3,
Márcio Renato Nunes
3,
Bruce Schaffer
4 and
Edivan Rodrigues de Souza
1
1
Department of Agronomy, Federal Rural University of Pernambuco, Recife 52171-900, PE, Brazil
2
School of Environment and Natural Resources, The Ohio State University, Columbus, OH 43210, USA
3
Department of Soil, Water and Ecosystem Sciences, University of Florida, Gainesville, FL 32608, USA
4
Tropical Research and Education Center, University of Florida, Homestead, FL 33031, USA
*
Author to whom correspondence should be addressed.
Water 2025, 17(13), 1951; https://doi.org/10.3390/w17131951
Submission received: 10 June 2025 / Revised: 26 June 2025 / Accepted: 27 June 2025 / Published: 29 June 2025
(This article belongs to the Special Issue Soil Water Use and Irrigation Management)

Abstract

Water and nitrogen (N) availability are among the primary limiting factors for the productivity of tomato (Solanum licopersicum L.). This study evaluated the interaction between these factors by assessing the effects of different N concentrations (85.5, 128.3, 171.0, 213.8, and 256.1 ppm N) on the water consumption, growth, and photosynthetic efficiency of hydroponically-grown tomato plants. The variables that were analyzed included the leaf N content, leaf chlorophyll index (LCI), maximum quantum efficiency of photosystem II (the ratio of variable to maximum chlorophyll fluorescence; Fv/Fm), non-photochemical quenching (NPQ), fresh mass (FM), dry mass (DM), cumulative water consumption, and water use efficiency (WUE). Increasing N concentrations led to higher water consumption and FM accumulation. Dry biomass was quadratically related to the N concentration, which peaked between doses of 213.8 and 256.1 ppm N. The LCI and Fv/Fm increased with the N supply, reaching a peak at N concentrations above 171 ppm, and then remained relatively constant. Conversely, the NPQ was reduced at the highest N level (256.1 ppm), which indicated diminished excess energy dissipation capacity. The highest WUE was observed at 213.8 ppm N, which was associated with greater DM and reduced water consumption compared to the highest N treatment. These findings suggest that the N concentration significantly affects the biomass production and water use in hydroponically-grown tomato plants, with 213.8 ppm N being the most efficient for vegetative growth under the studied conditions.

1. Introduction

Contemporary horticulture faces increasing challenges driven by climate change and new consumer demands for high-quality food, affordable prices, and lower environmental impacts [1]. To meet these demands, the use of intensive vegetable production systems, both in open fields and protected environments, has expanded significantly [2]. At the same time, rising input costs and the limited availability of arable land, exacerbated by environmental stresses, make the adoption of more efficient practices essential [3]. In this context, innovative strategies have been developed to increase productivity, improve quality, and reduce environmental and energy impacts [4,5]. Tomato (Solanum lycopersicum L.) stands out as the most widely cultivated vegetable crop worldwide, being grown under intensive systems with high input demands [6]. In these systems, water availability and nitrogen (N) deficiency are the most limiting factors for tomato productivity globally [7].
Studies indicate that N deficiency can reduce the water consumption of plants by limiting their growth and leaf area, which in turn decreases their transpiration and consequently their uptake of water and nutrients [8,9,10,11,12]. Although the interaction between the N concentration and water consumption has been studied in various crops [13,14], most studies on tomatoes focus on the combined effects of water stress and nutrient deficiency [15,16]. However, there is a scarcity of studies evaluating the impact of high N concentrations on the water demand under conditions of optimal water supply. Addressing this knowledge gap provides insights not only into the reduction of water consumption in N-deficient plants but also into whether the water consumption increases in overfertilized plants. This also helps to determine the water cost associated with excessive N application for tomato cultivation [10], considering that many growers adopt fertilization practices that are aimed at minimizing N deficiency, often without properly accounting for the losses caused by overfertilization [17].
While N fertilization is essential for enhancing crop profitability, it is equally important to not overlook the detrimental effects of excessive N application [18]. These losses are not limited to the financial costs from unnecessary input but also extend to reduced fruit quality and the risk of contaminating water sources [19,20]. Additionally, the higher water and energy demands required to supply the increased water consumption of N-overfed tomato plants further exacerbate these issues [21].
A precise approach for assessing plants’ response to different N concentrations under a non-limited water supply is the use of hydroponic cultivation combined with weighing lysimeters. This system eliminates the influence of the soil and allows for greater control over mineral nutrition [6,22,23]. With advancements in automation and environmental monitoring, it has become possible to accurately study plant–water relations [24,25,26]. Weighing lysimeters enable the continuous measurement of evapotranspiration by tracking variations in the plant mass [27,28,29], and thereby allow a direct correlation between water consumption, plant growth, and nutrient uptake to be obtained.
Evaluating the photosynthetic performance of plants serves as an important diagnostic parameter for plants subjected to N overfertilization, given the strong correlation between photosynthesis rates and the leaf N content [8,30]. This study aimed to evaluate the effects of different N concentrations in the nutrient solution fed to hydroponically grown tomato plants on their water consumption and photosynthetic performance under non-limiting water conditions using weighing lysimeters.

2. Materials and Methods

2.1. Location and Experimental Characterization

This study was conducted in a greenhouse at the Agrofito company, located in the municipality of Irecê, in the north-central region of the state of Bahia, Brazil (Figure 1).
The greenhouse was equipped with temperature, humidity, and lighting control systems, with the temperature being maintained at 25 °C (±2 °C), the relative humidity below 60% (±5%), and a 16 h daily photoperiod.
The experimental units consisted of an adaptation of the Dutch bucket system [31,32,33], in which the plant cultivation containers were individualized and connected through inlet and outlet pipes for the recirculation of the nutrient solution to and from a common storage tank. The system operated in two alternating cycles: irrigation and drainage.
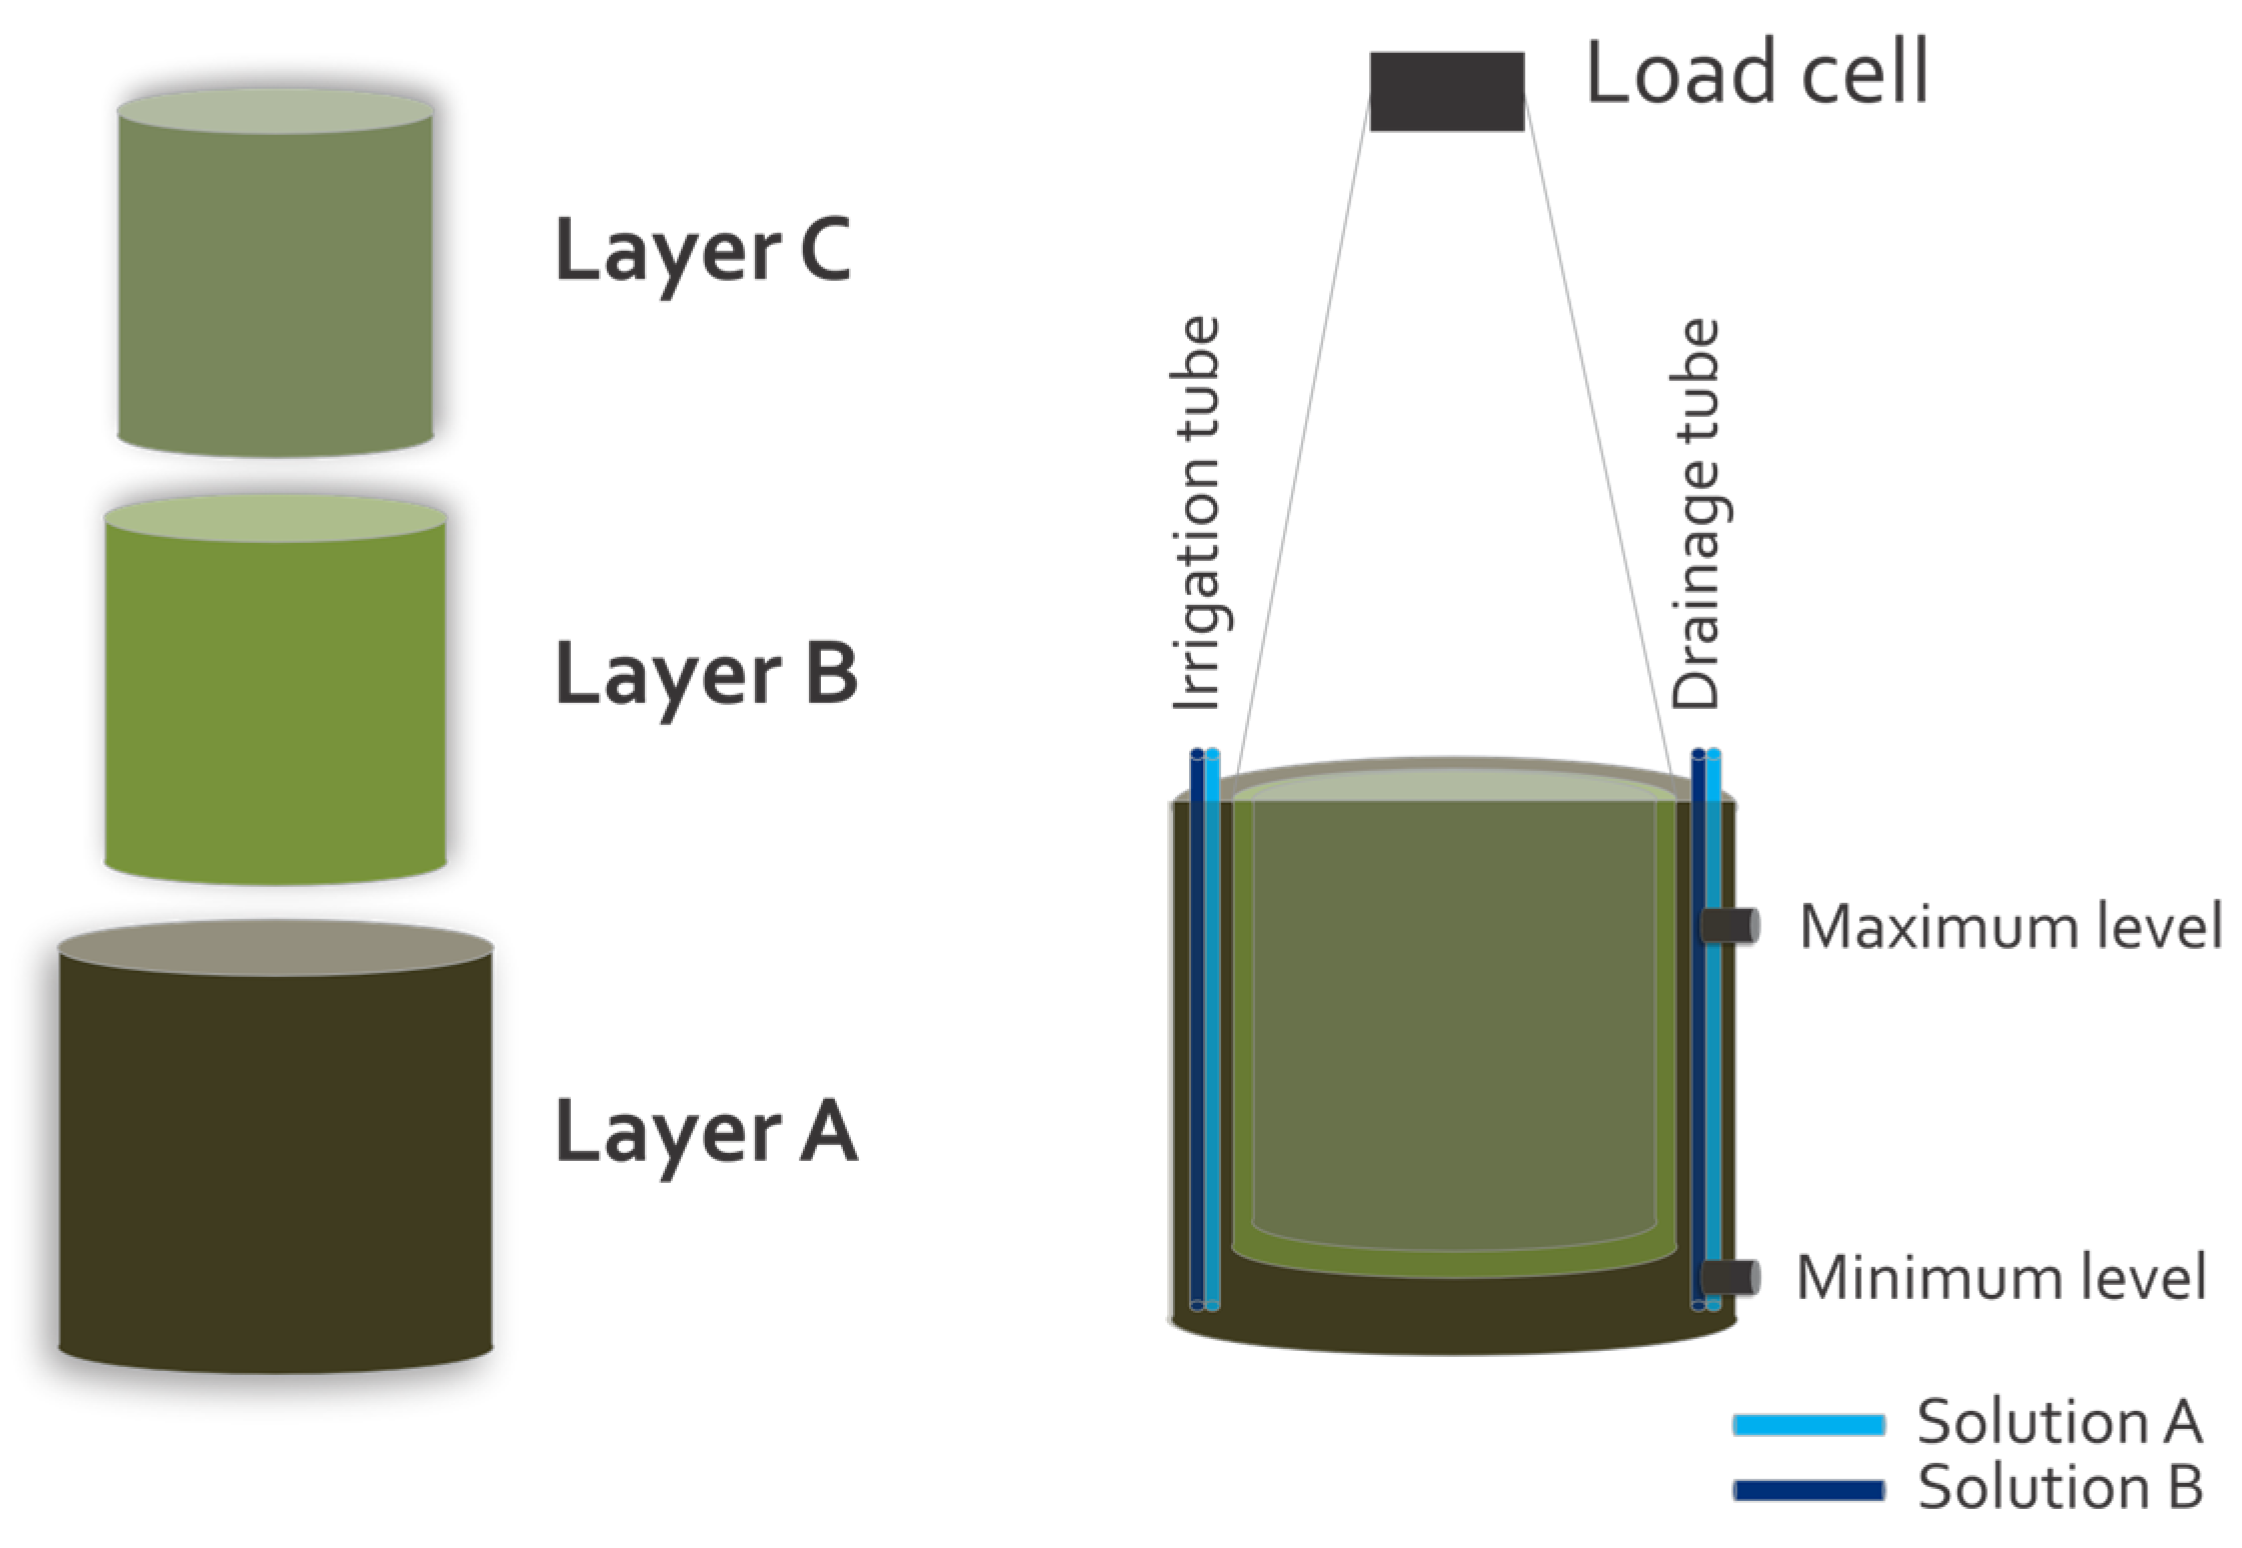
The cultivation containers were composed of three layers, each designed to perform a specific function to maintain the operational efficiency of the system (Figure 2).
Layer A (bottom layer) consisted of a 15 L plastic container, where the nutrient solution volume was controlled by two electronic level sensors.
Layer B (intermediate layer) was composed of a 7 L plastic container with four drainage holes at its base, serving as a support for plant cultivation. This configuration allowed the percolation of the nutrient solution during the irrigation cycles and its subsequent drainage. This layer was suspended above Layer A and installed on a load cell, which was programmed to automatically record two weight measurements per cycle (irrigation and drainage). The mass data were transmitted and stored on a local server connected to the system’s control boards.
Layer C (top layer) corresponded to an internal liner of Layer B, was made of felt fabric, and had a volume of 11 L. This layer functioned as a filtration system and contained an inert substrate composed of a 2:1 (v/v) mixture of perlite and expanded clay. The composition and structure of the substrate favored efficient drainage and promoted alternation between the saturation cycles (during irrigation) and aeration cycles (between irrigations), allowing the pores of the substrate to periodically fill and empty.
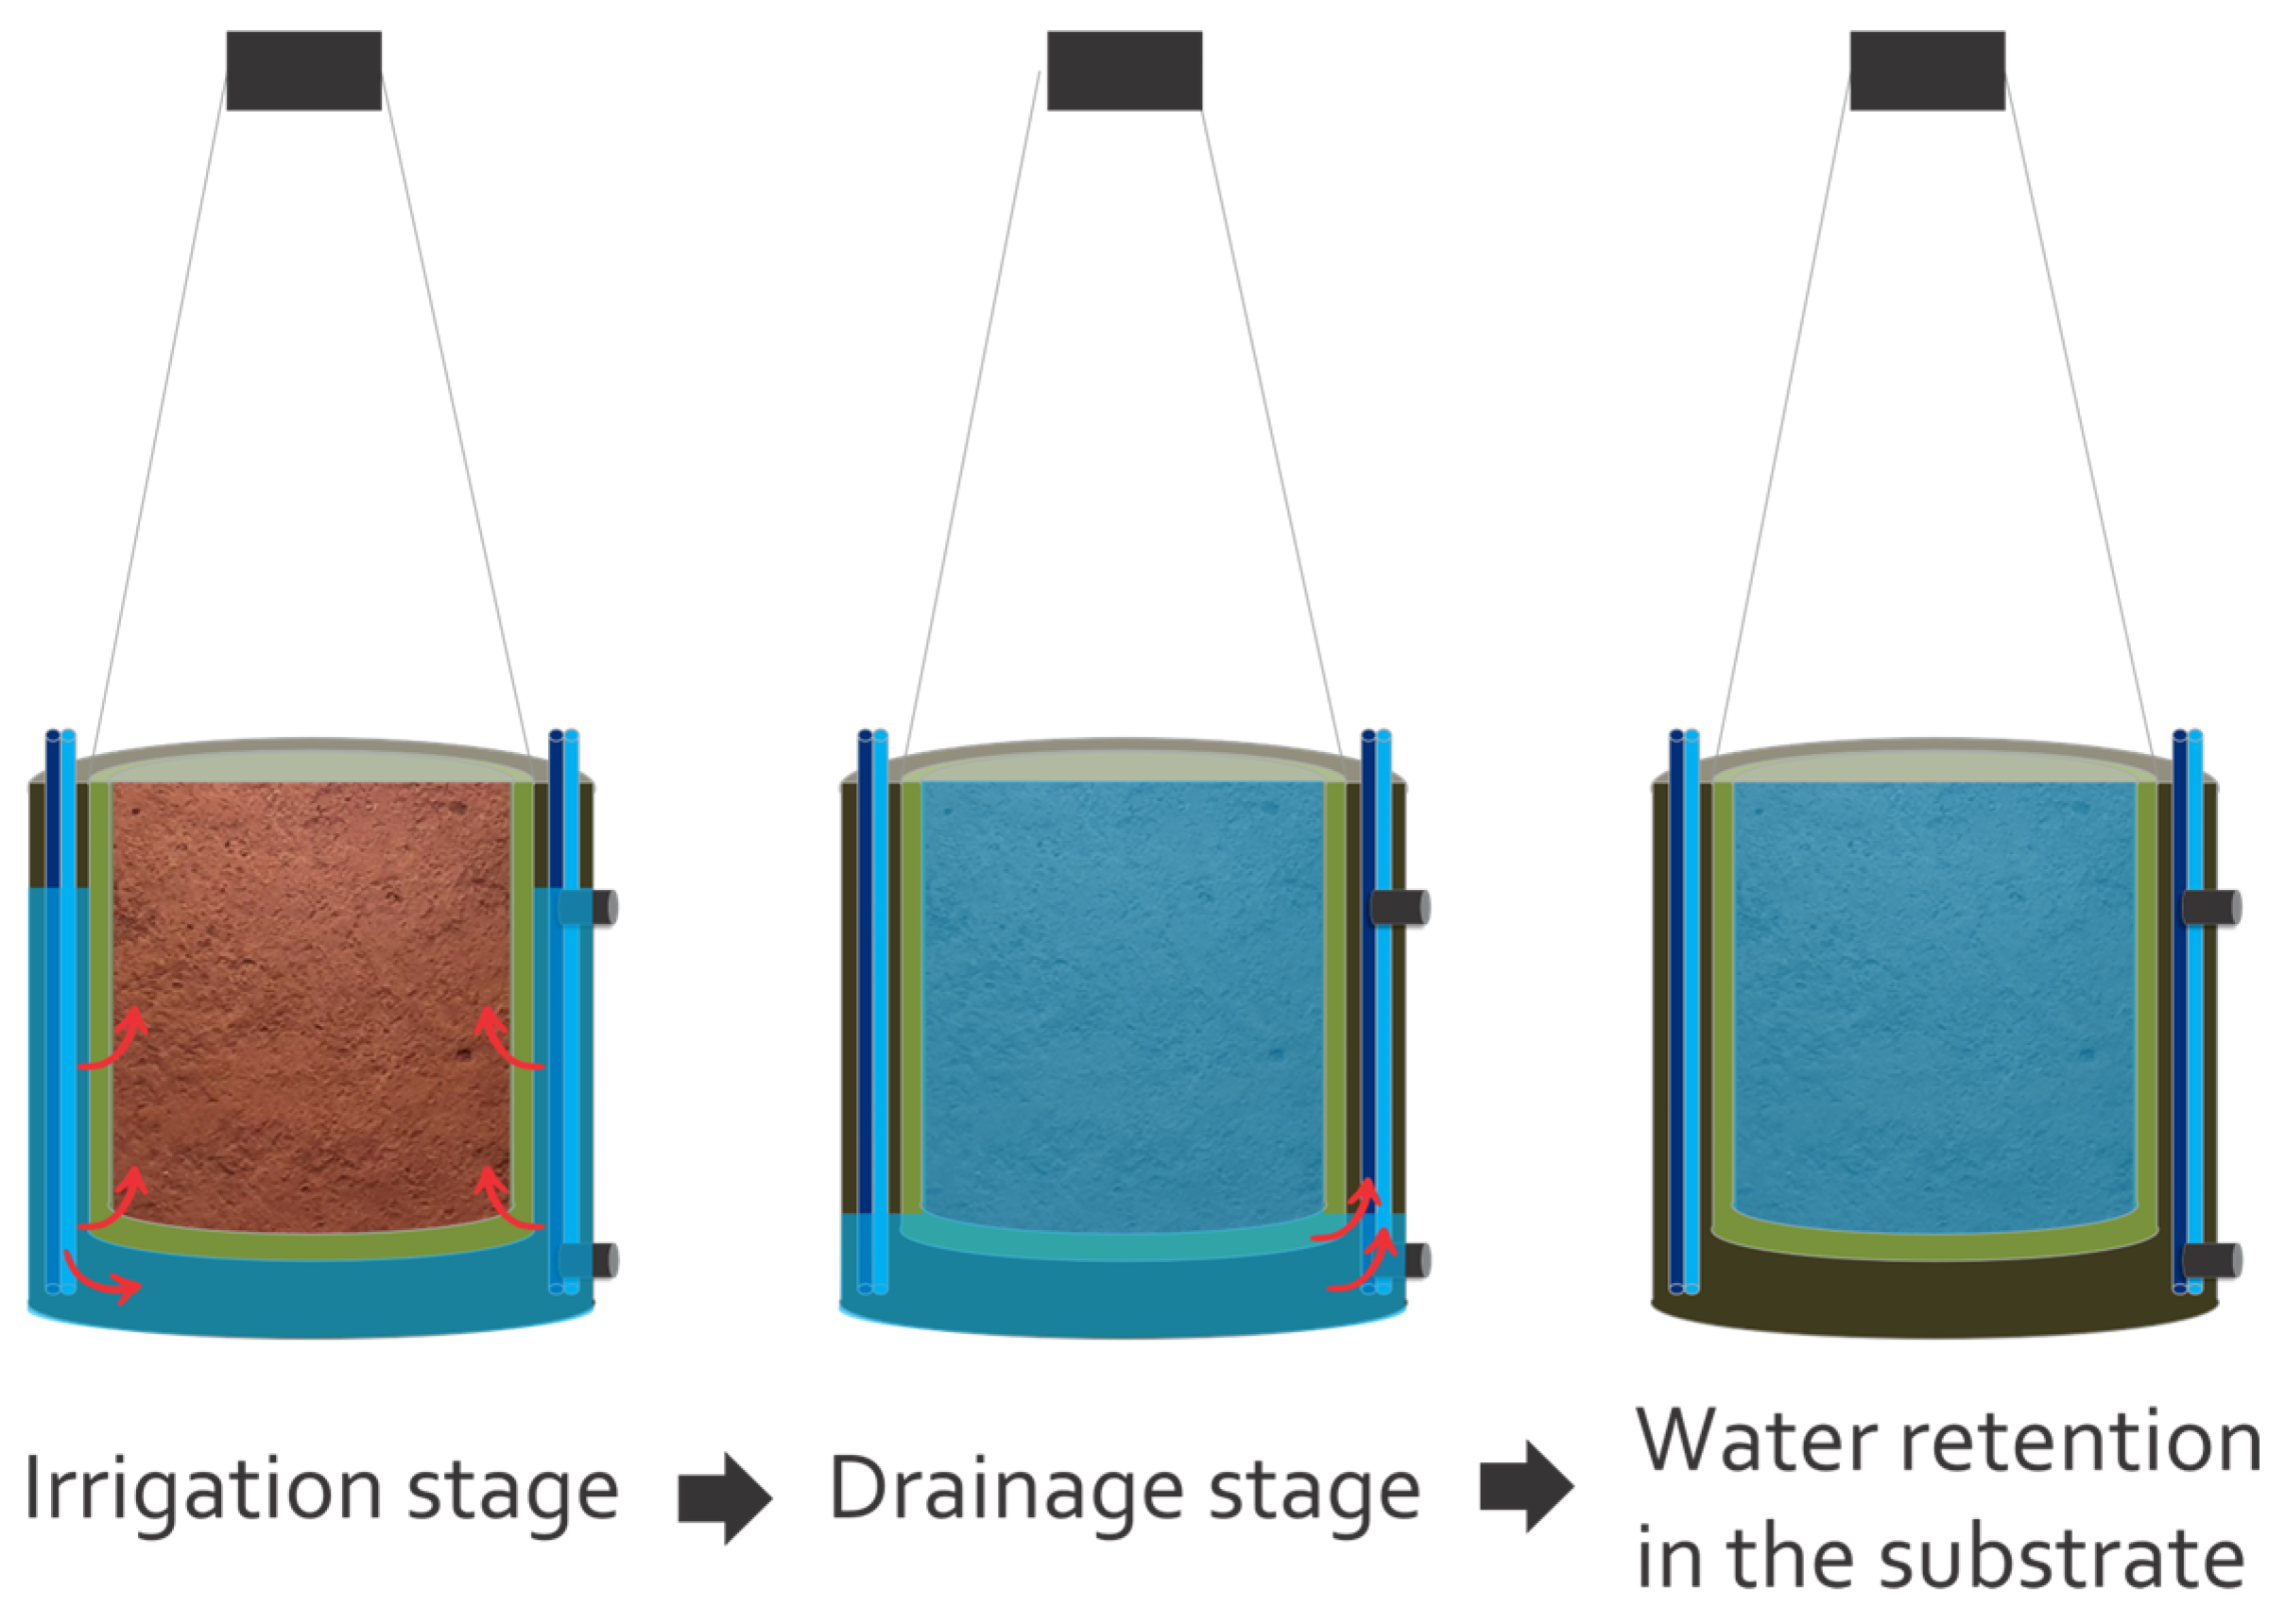
The irrigation cycle consisted of moving the nutrient solution from the storage tank into the container until the pre-set maximum level was reached, with part of the solution being retained by the substrate. The drainage cycle started once the solution reached the minimum level, allowing the excess to return to the storage tank (Figure 3).
The containers belonging to the same experimental treatment were interconnected, which ensured the uniformity of the irrigation and drainage flows.
The first weighing of the system was performed five minutes after the end of the drainage cycle, which allowed sufficient time for the residual gravitational water to drain completely. The second weighing was carried out immediately before the activation of the irrigation in the following cycle, i.e., 55 min after the drainage cycle. The difference between the two weight measurements was considered the volume of water consumed by the plant during that cycle, assuming no water losses due to evaporation or leakage.

2.2. Treatment Definition

The experiment was aimed at evaluating the effect of increasing N concentrations, ranging from deficient levels to values exceeding the optimal rate, in the nutrient solution for hydroponic tomato cultivation during the vegetative growth stage. Five total N concentrations were tested: 85.5, 128.3, 171, 213.8, and 256.1 ppm N, with 171 ppm being the recommended rate according to Snyder (1994) [34]. Therefore, 171 ppm was considered the optimal N level in this study. All other nutrients were kept constant, considering the limitations inherent to the salt mixtures that were required to adjust the N concentrations in the nutrient solution (Table 1).
Using 171 ppm of N as the reference rate (optimal concentration), the treatments of 85.5 and 128.3 ppm were prepared with N concentrations that were approximately 50% and 25% lower, respectively, than the optimal concentration. Conversely, the treatments with 213.8 and 256.1 ppm N were prepared with N concentrations that were approximately 25% and 50% higher, respectively, than the optimal rate.
The combination of salts used to vary the N concentration in the nutrient solution also caused marginal changes in the S-SO4 concentration and electrical conductivity of the solution, an increase in the Cl concentration in T1 and T2, and a higher N-NH4/N-NO3 ratio in T4 and T5 (Table 1). However, in none of the treatments did the nutrient concentrations fall below optimal levels or exceed toxicity thresholds; thus, none of the concentrations affected the experimental results. Additionally, it is important to highlight that, throughout the experiment, the pH of all solutions was within ideal ranges.
Based on the solubility and compatibility of the elements used in the fertigation, two separate nutrient solutions (Solution A and Solution B) were prepared to avoid chemical incompatibility, with each treatment having two stock tanks. The salts used to prepare Solution A are detailed in Table 2 and the salts used in Solution B are detailed in Table 3.
It is important to note that this experiment was conducted exclusively during the vegetative stage of tomato development. No fruit production was assessed, and side shoots (suckers) were not removed during cultivation. Plants were allowed to grow naturally without pruning to avoid any interference with the vegetative physiological responses being evaluated.

2.3. Experimental Design and Statistics

The experimental design was a randomized block with five treatments corresponding to different N concentrations in the nutrient solution (85.5, 128.3, 171, 213.8, or 256.1 ppm) and six replicates, totaling 30 experimental units. All data were tested for a normal distribution using the Shapiro–Wilk test. Data were analyzed by regression and/or the Scott-Knott test at a 5% significance level.

2.4. Measurements

2.4.1. Biomass Production

The mass of each container was measured using load cells and recorded daily. The value measured during the second weighing in the drainage phase, before transplanting and without plants, was considered the weight of the container at its maximum water retention capacity, and was specific for each container. The weight gain of each container after transplanting throughout the cultivation period was considered the increase in the fresh weight of the plant during the experimental period.
At the end of the experiment, 49 days after transplanting (during the vegetative growth stage), plants were carefully removed from the containers, with the roots being separated from the substrate to measure fresh mass using a digital scale. The plants were then dried in a forced-air circulation oven at 65 °C to a constant weight and the dry mass was measured.

2.4.2. Leaf Chlorophyll Index

The leaf chlorophyll index (LCI) content was measured in each plant using a SPAD chlorophyll meter model 501 (Minolta Corporation, Ltd., Osaka, Japan). At the end of the experiment, five measurements were made on the adaxial surface of five fully expanded leaves from the upper third of each plant, and the average of these five measurements was used for statistical analyses.

2.4.3. Chlorophyll Fluorescence

Chlorophyll fluorescence was determined by using a portable fluorometer (Fluorpen FP 100 model, Photon Systems Instruments—PSI, Drásov, Czech Republic) on intact, healthy, fully expanded leaves from the middle third of the canopy. One leaf per plant (the same used for the LCI measurements) was selected 49 days after transplanting and dark-adapted for 30 min before fluorescence was measured on the adaxial leaf surface. From the data that were obtained, the quantum efficiency of photosystem II (Fv/Fm) and non-photochemical quenching (NPQ) were calculated based on Equations (1) and (2), respectively.
Fv/Fm = (Fm − Fo)/Fm
NPQ = (Fm − Fm’)/Fm’
where:
Fo: initial fluorescence;
Fm: maximum fluorescence;
Fv: variable fluorescence;
Fm’: maximum fluorescence yield of chlorophyll after adaptation to light.

2.4.4. Leaf N Content

The leaves were collected, placed in paper bags, and immediately taken to the laboratory where the fresh mass of the aerial portion was measured. The collected plant material was individually washed with distilled water, dried with paper towels, and placed in a forced-air circulation oven at 65 °C until constant weight was reached. The dried material was then ground in a Willey-type knife mill and the N content was determined by titration after digestion in sulfuric acid and hydrogen peroxide and distillation by the Kjeldahl method [35].

2.4.5. Water Consumption and Water Use Efficiency (WUE)

Daily water consumption was estimated based on the daily weight measurements obtained from the load cells prior to irrigation. The water use efficiency (WUE, kg m−3) was calculated as the ratio between the dry biomass (kg) of each plant and its total water consumption (m3) throughout the experimental period.

3. Results

Leaf N Content and Photosynthetic Performance

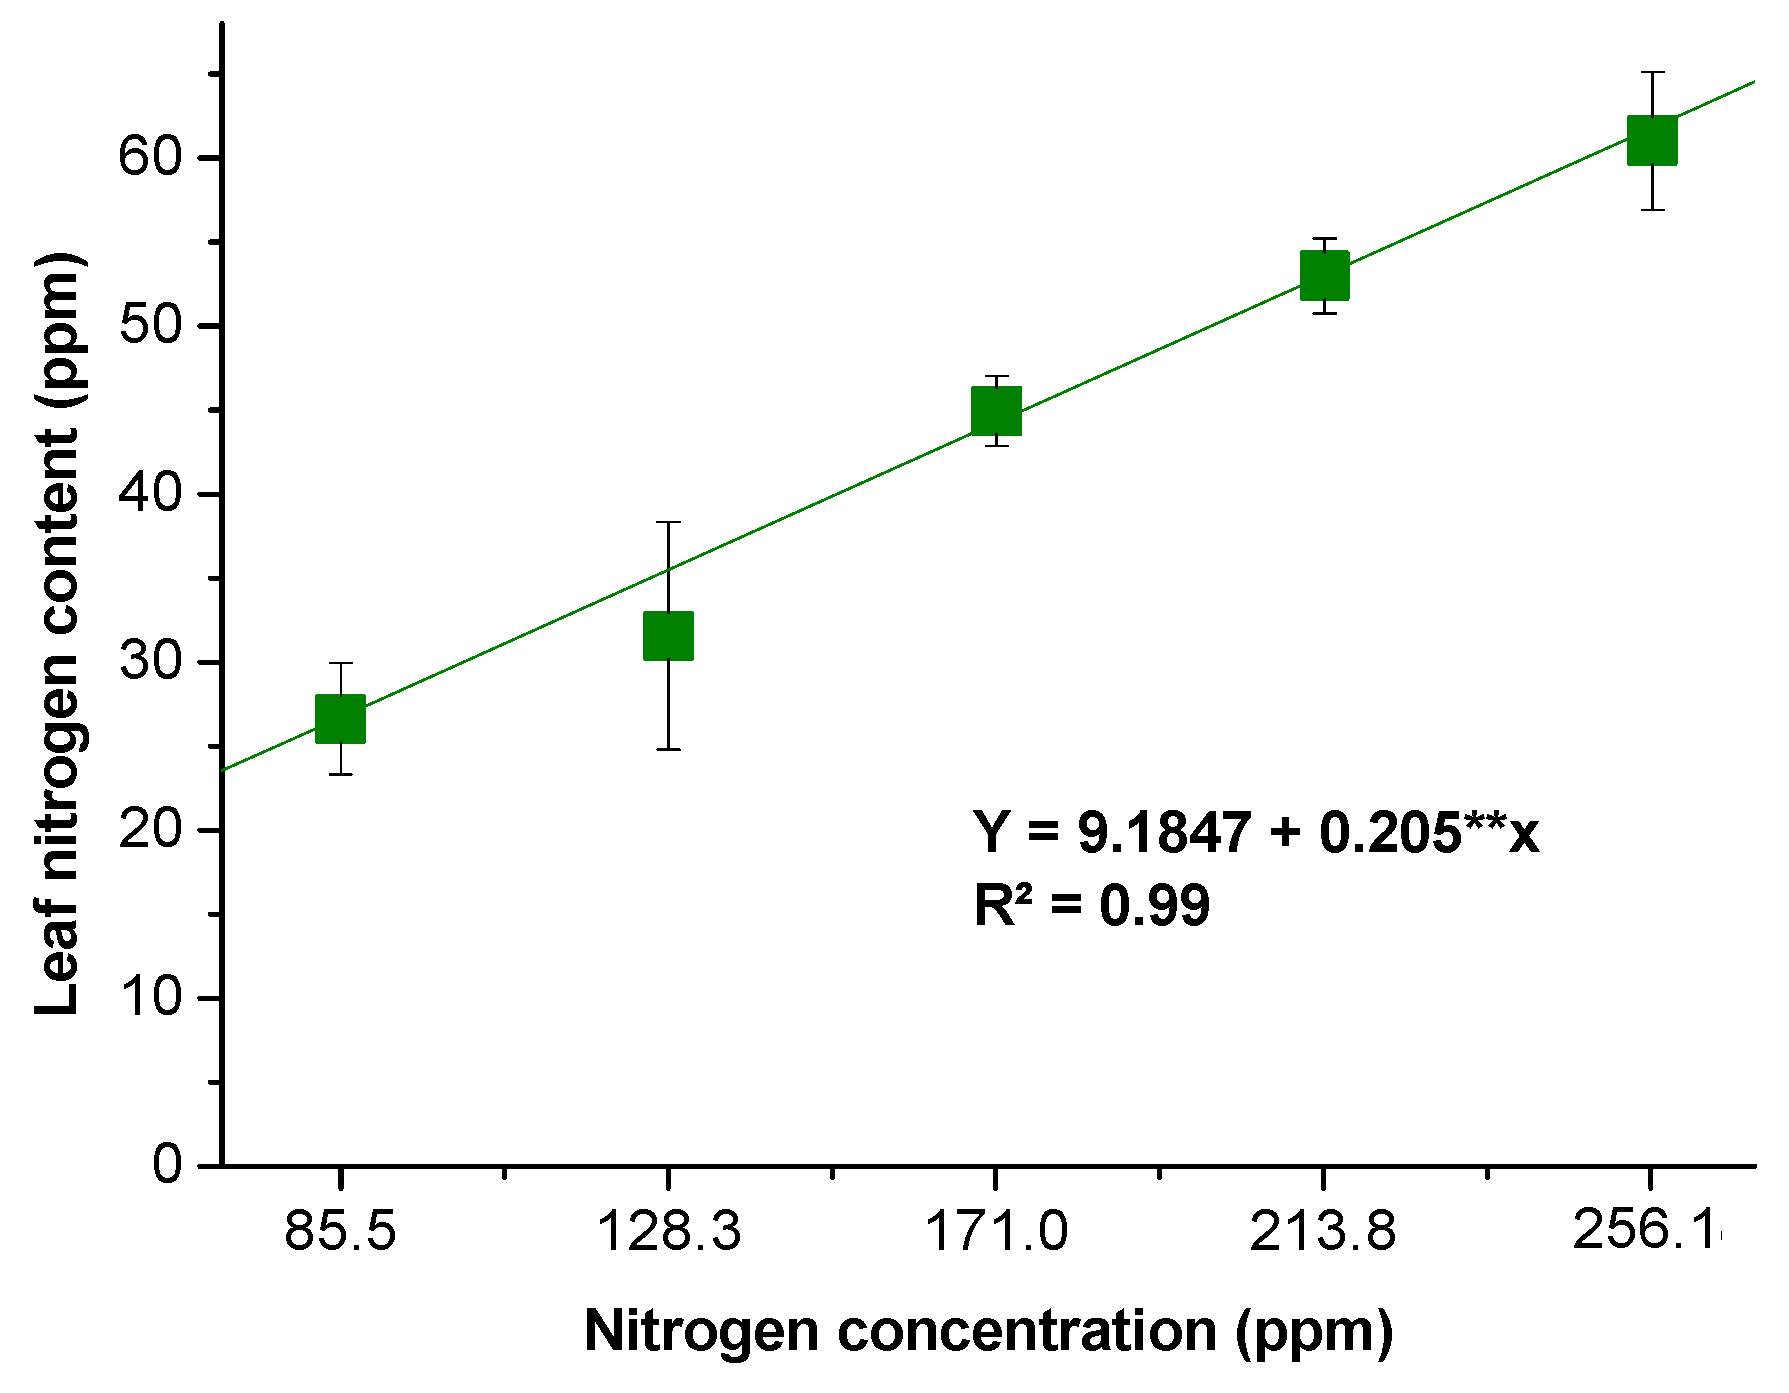
There was a strong positive linear relationship between the N concentration of the nutrient solution and the leaf N content, with the leaf N content reaching a maximum of 61 ppm at the highest N concentration in the nutrient solution (Figure 4).
The LCI and Fv/Fm were significantly higher when the N concentrations in the nutrient solution were 171, 213.8, or 256 ppm compared to N concentrations of 85.5 or 128.3 ppm (Figure 5a,b).
The non-photochemical quenching (NPQ) was lower for the plants that received the nutrient solution with the highest N concentration (256.1 ppm) than for the plants in all other treatments (Figure 5c). The NPQ was significantly lower in the plants that received intermediate N concentrations (128.3 or 171.0 ppm) than in those under the lowest N concentration (85.5 ppm) but significantly higher than in those that received the highest (256.1 ppm) N treatment (Figure 5c).
The daily fresh mass data are presented in Figure 6, where they are organized into four growth phases (I, II, III, IV, and V) based on the similarity of their response patterns.
During Phase I, although the highest fresh mass was recorded at the lowest N concentration (85.5 ppm), daily analysis using the Scott-Knott test revealed that, in Phase II, the fresh mass was reduced in relation to the other treatments and, from day 19 onwards, the two lowest N concentrations (85.5 ppm and 128.3 ppm) differed significantly from the highest concentrations, exhibiting the lowest mean fresh mass—a trend that persisted until the end of the experiment.
In Phase III, plants grown with the intermediate N concentration (171 ppm) showed an increased fresh mass, and were statistically similar to those under higher N levels. However, from day 28 onwards, the plants receiving treatments with 213.8 ppm and 256.1 ppm N began to differ significantly from the others, achieving the highest mean fresh mass, while the 171 ppm treatment plants maintained intermediate values. This pattern remained consistent throughout Phase IV.
Starting from day 43, which marks the onset of Phase V, all treatments differed significantly from one another. The highest N concentrations (213.8 ppm and 256.1 ppm) consistently produced the greatest fresh mass, whereas the lowest concentrations (85.5 ppm and 128.3 ppm) resulted in the smallest values. This hierarchical response pattern remained stable until the conclusion of the experiment.
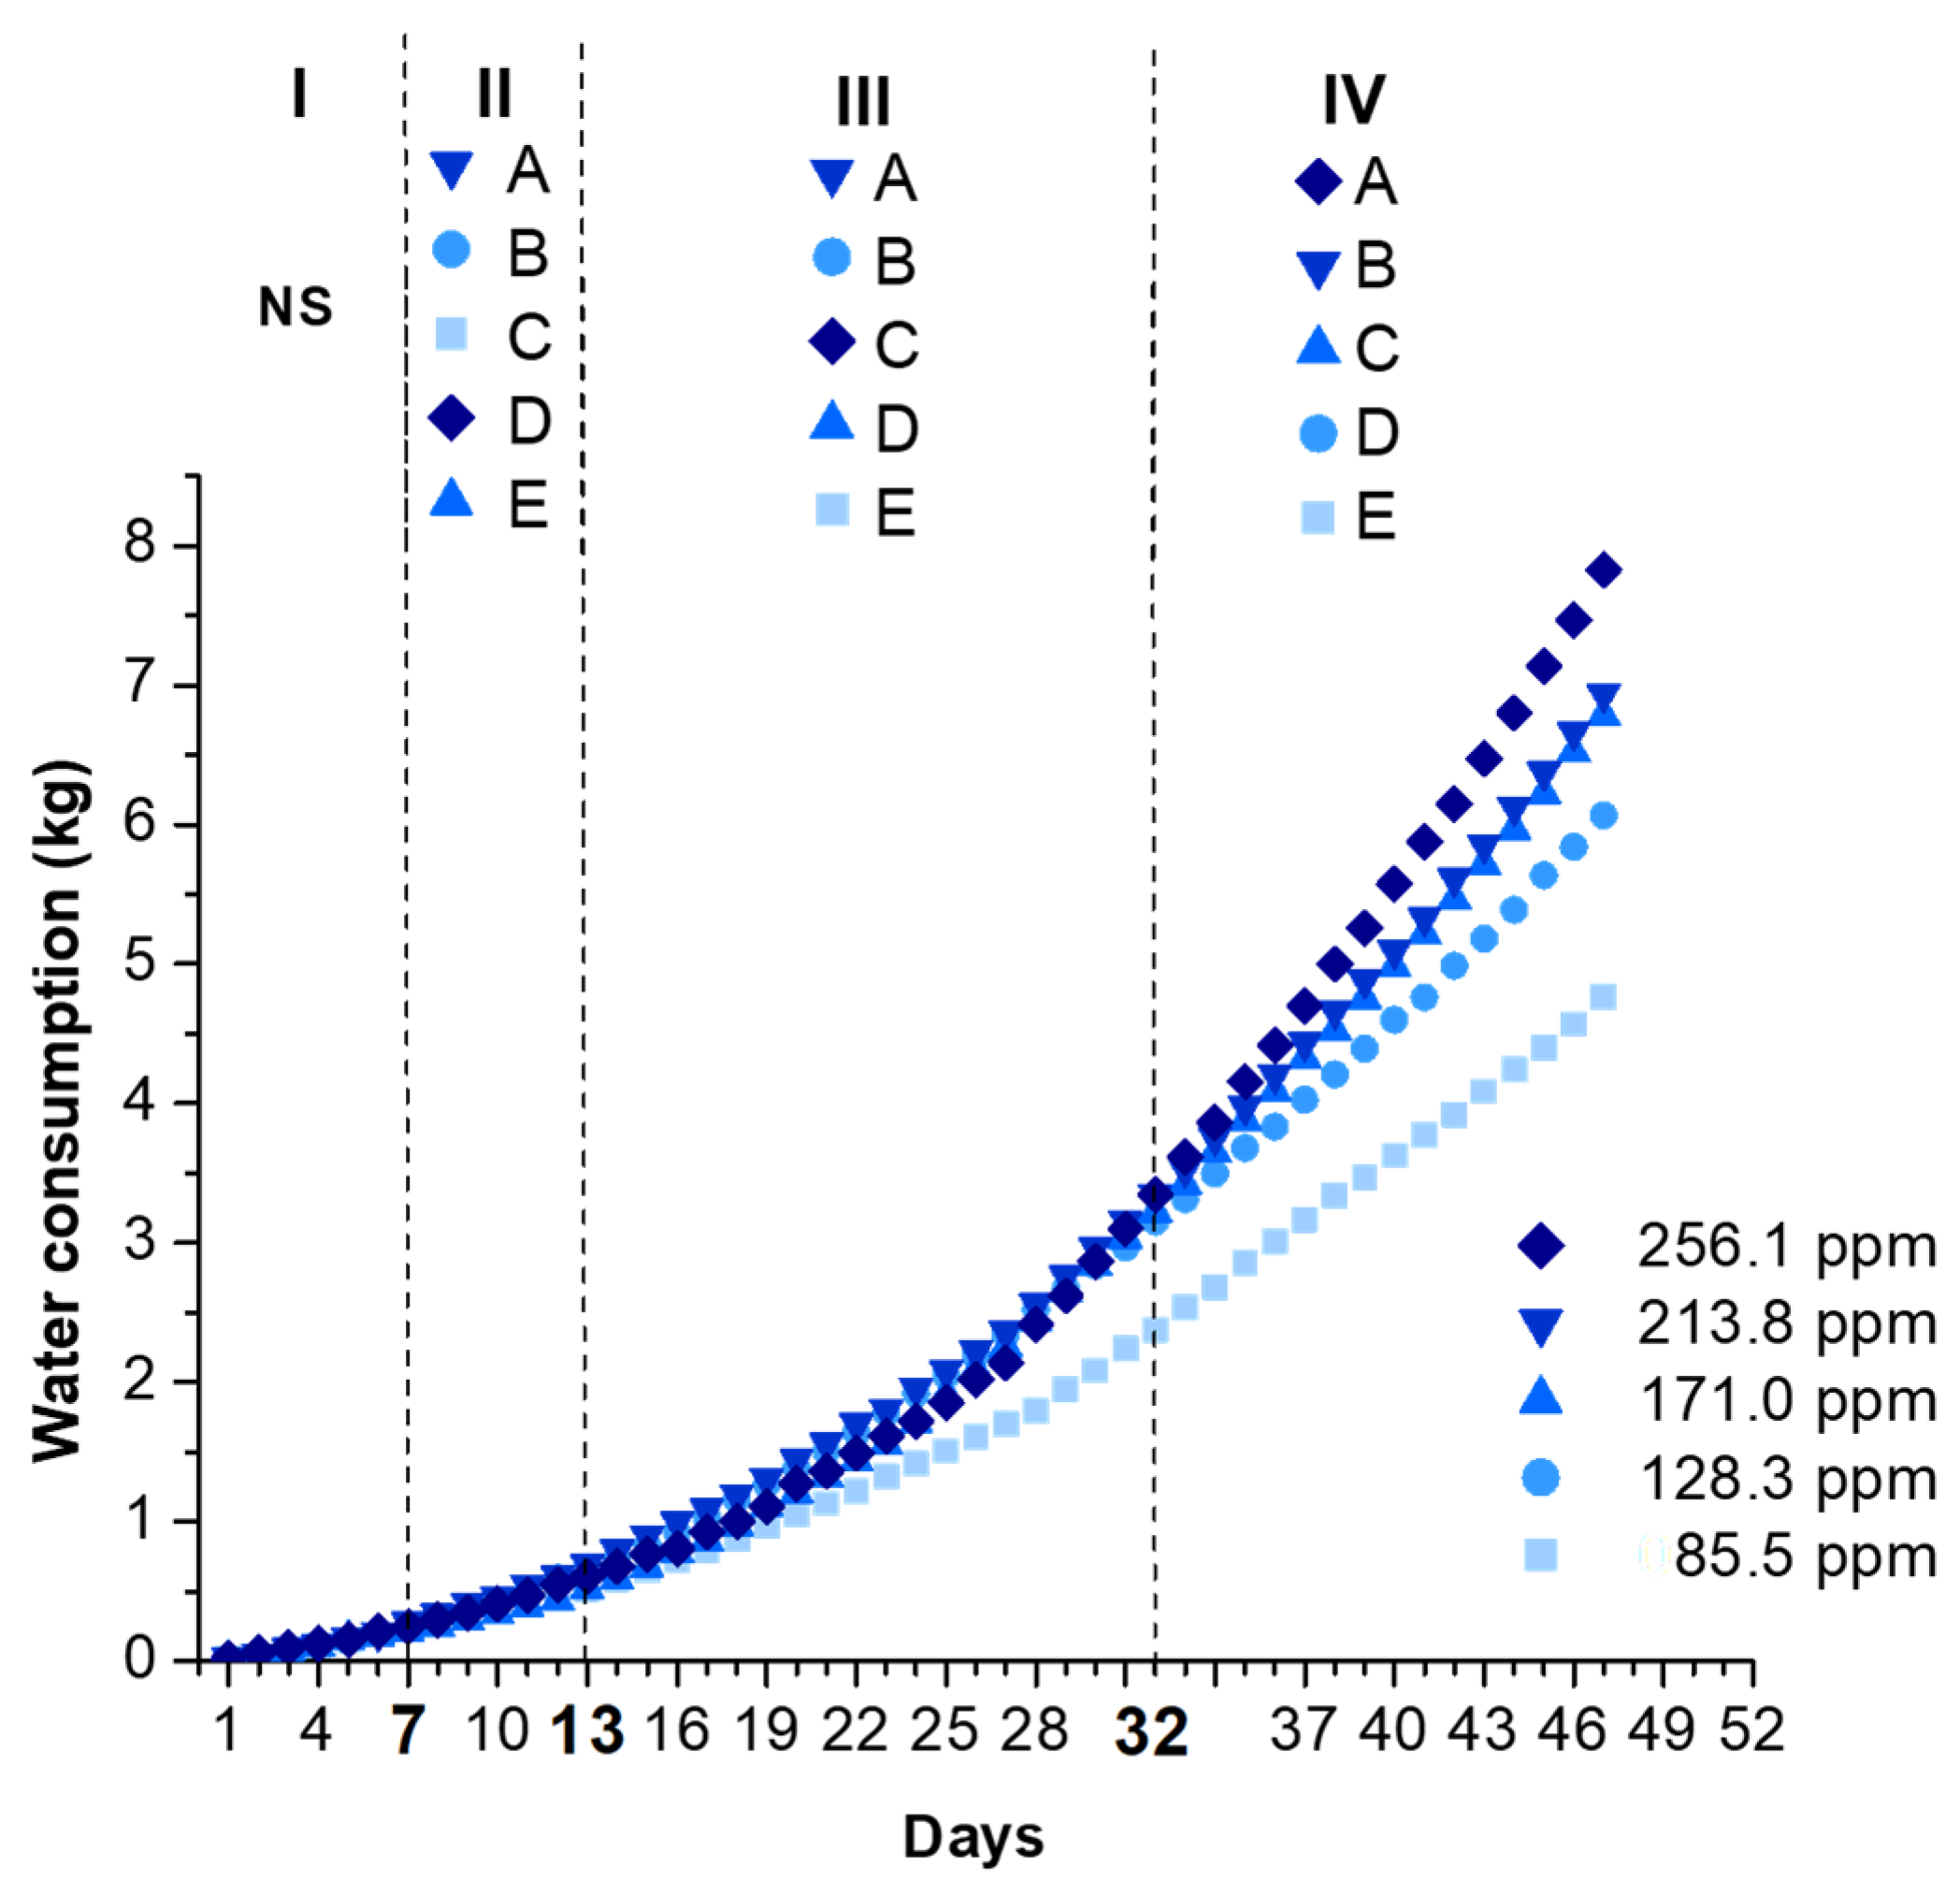
Daily water consumption data are presented below, with three distinct periods with similar behavior, separated into Phases I, II, III, and IV, being highlighted (Figure 7).
During the initial days, variation in the water consumption among the treatments was observed. From day 7, marking the beginning of Phase II and the end of Phase I, the treatment with 213.8 ppm N exhibited the highest water consumption, differing significantly from the others.
In Phase III, starting on day 13, the plants receiving the lowest N concentration (85.5 ppm) showed the lowest average water consumption, a pattern that persisted until the end of the experiment. On day 32, at the onset of Phase IV, the water consumption exhibited an increasing trend that corresponded to the increment in N concentrations, which were ranked as 85.5 < 128.3 < 171 < 213.8 < 256.1 ppm.
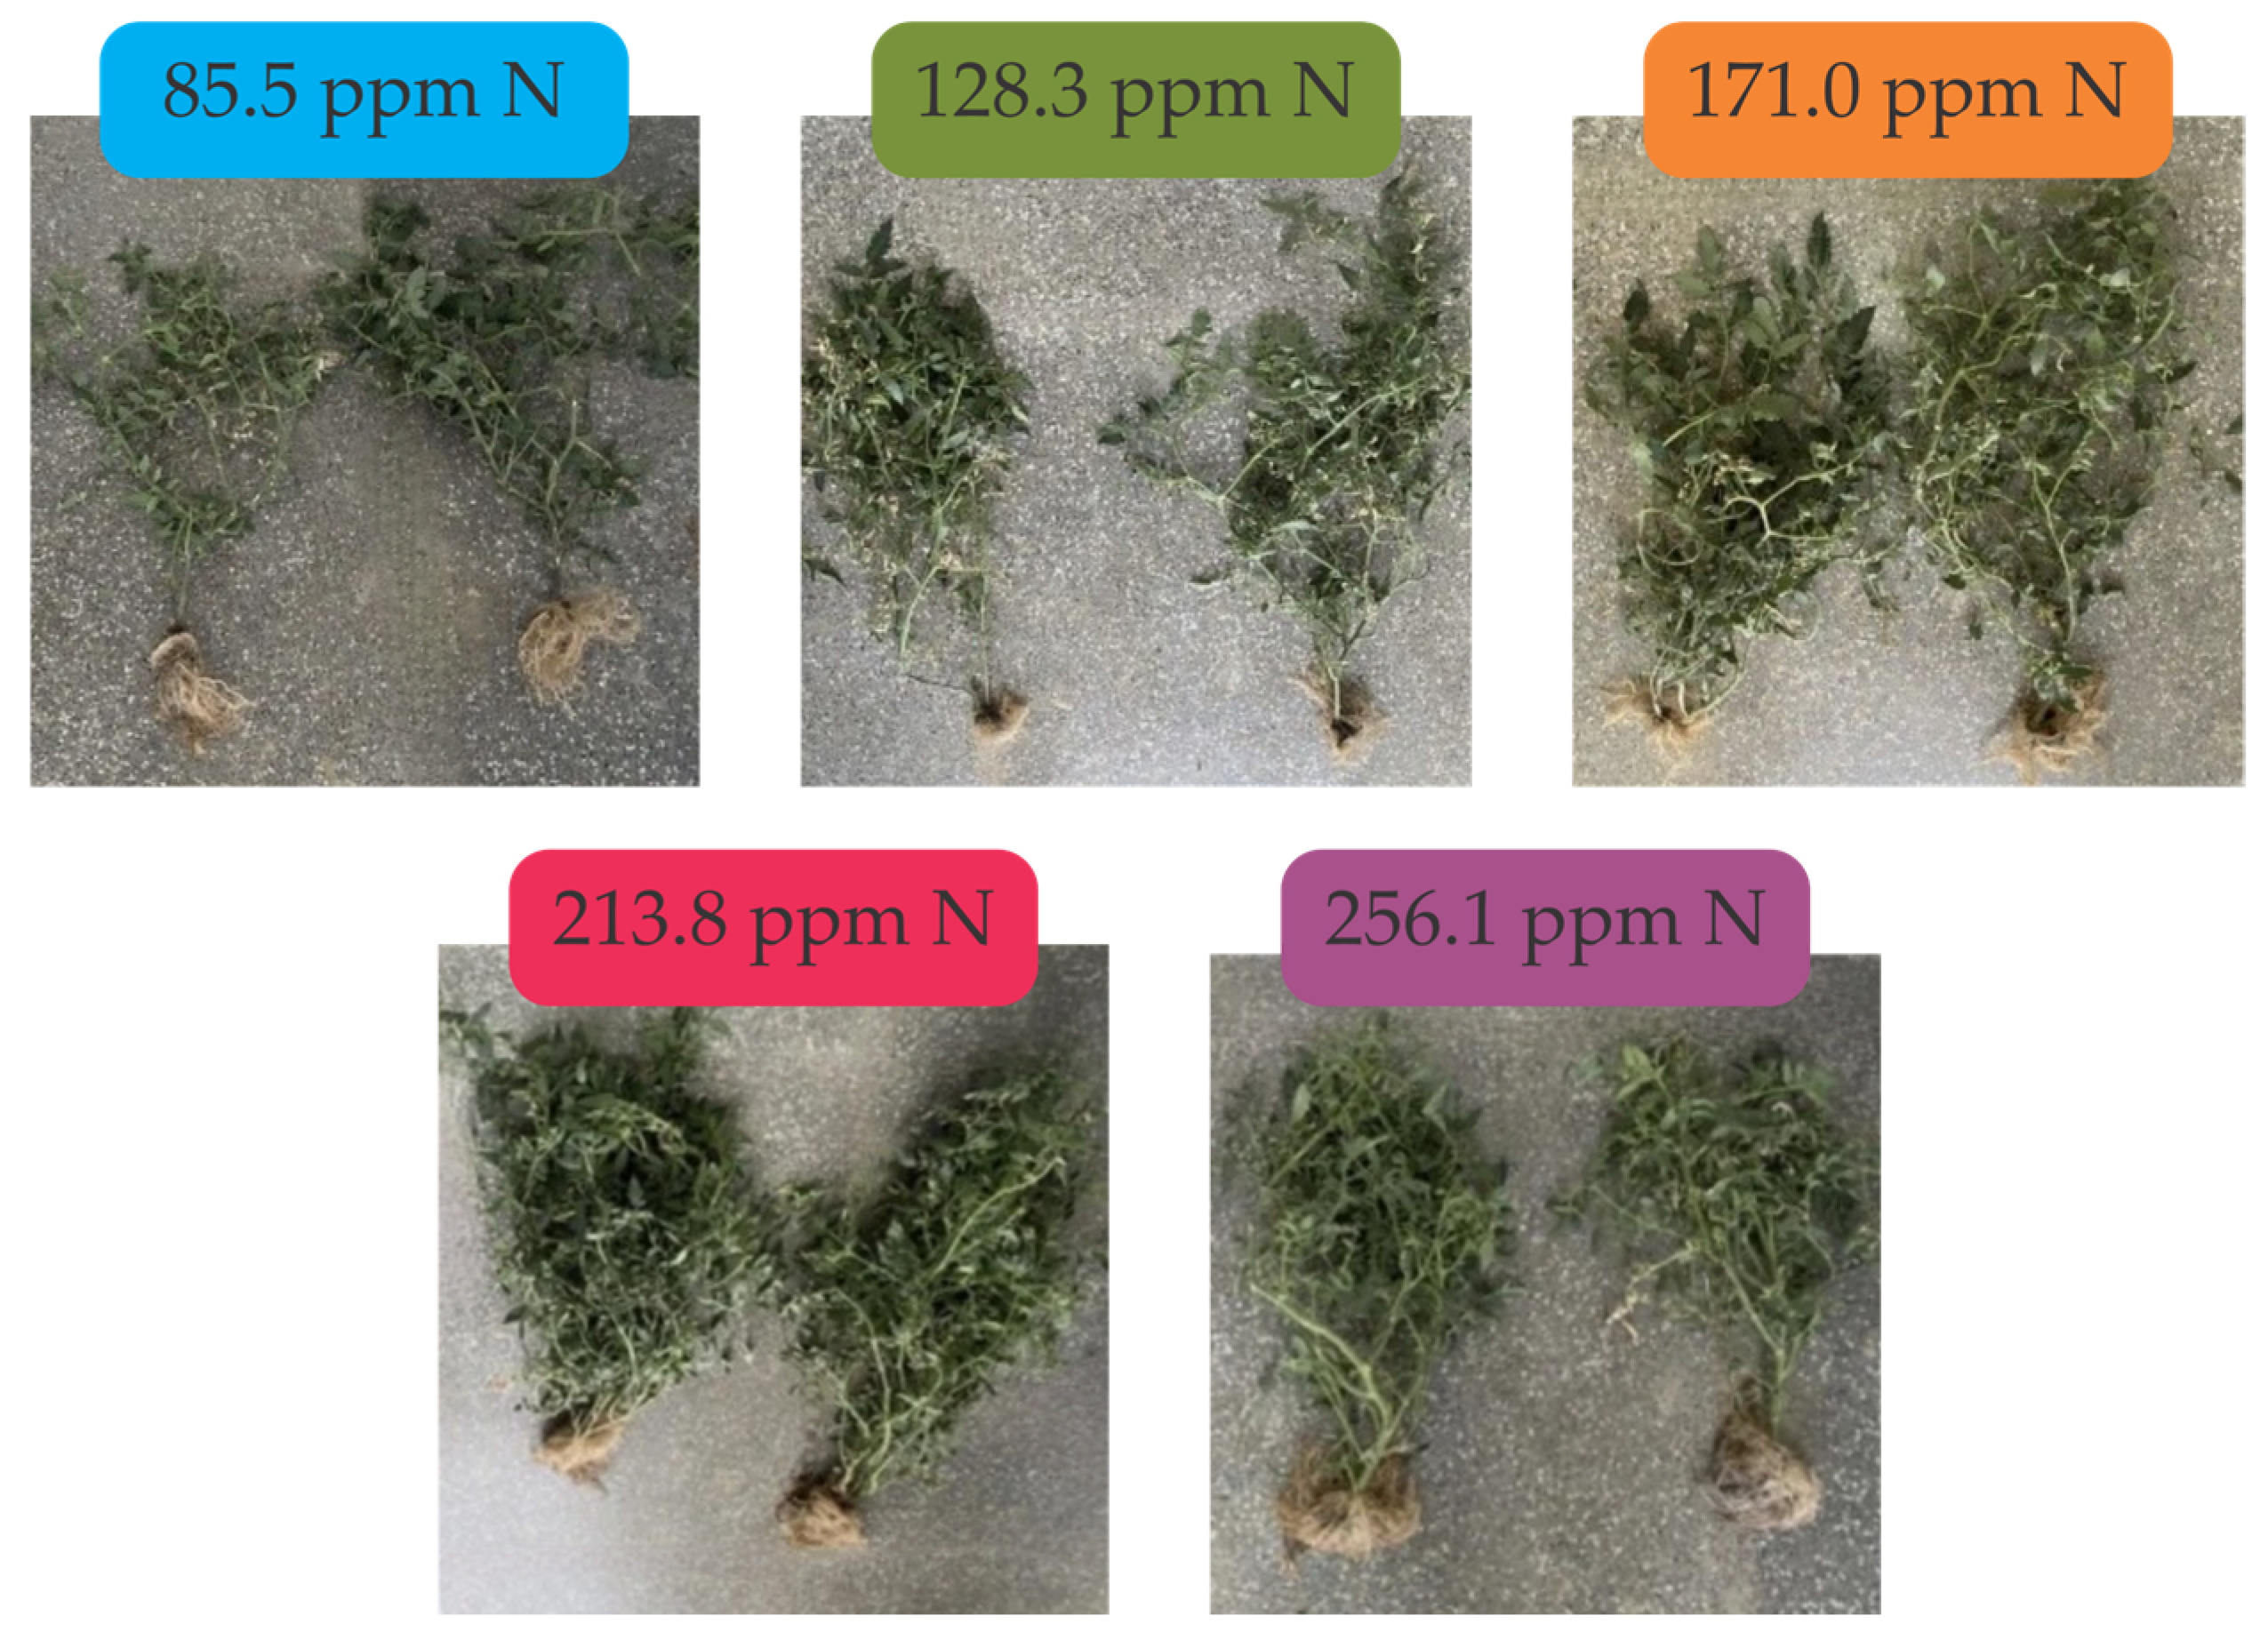
Visual differences in biomass accumulation among treatments were clearly observed at the end of the vegetative stage. As shown in Figure 8, tomato plants grown under increasing nitrogen concentrations exhibited distinct morphological development, with visible increases in their shoot and root biomass as the N availability increased. The most vigorous growth was observed at 213.8 and 256.1 ppm N, while plants grown under 85.5 and 128.3 ppm showed visibly smaller structures.
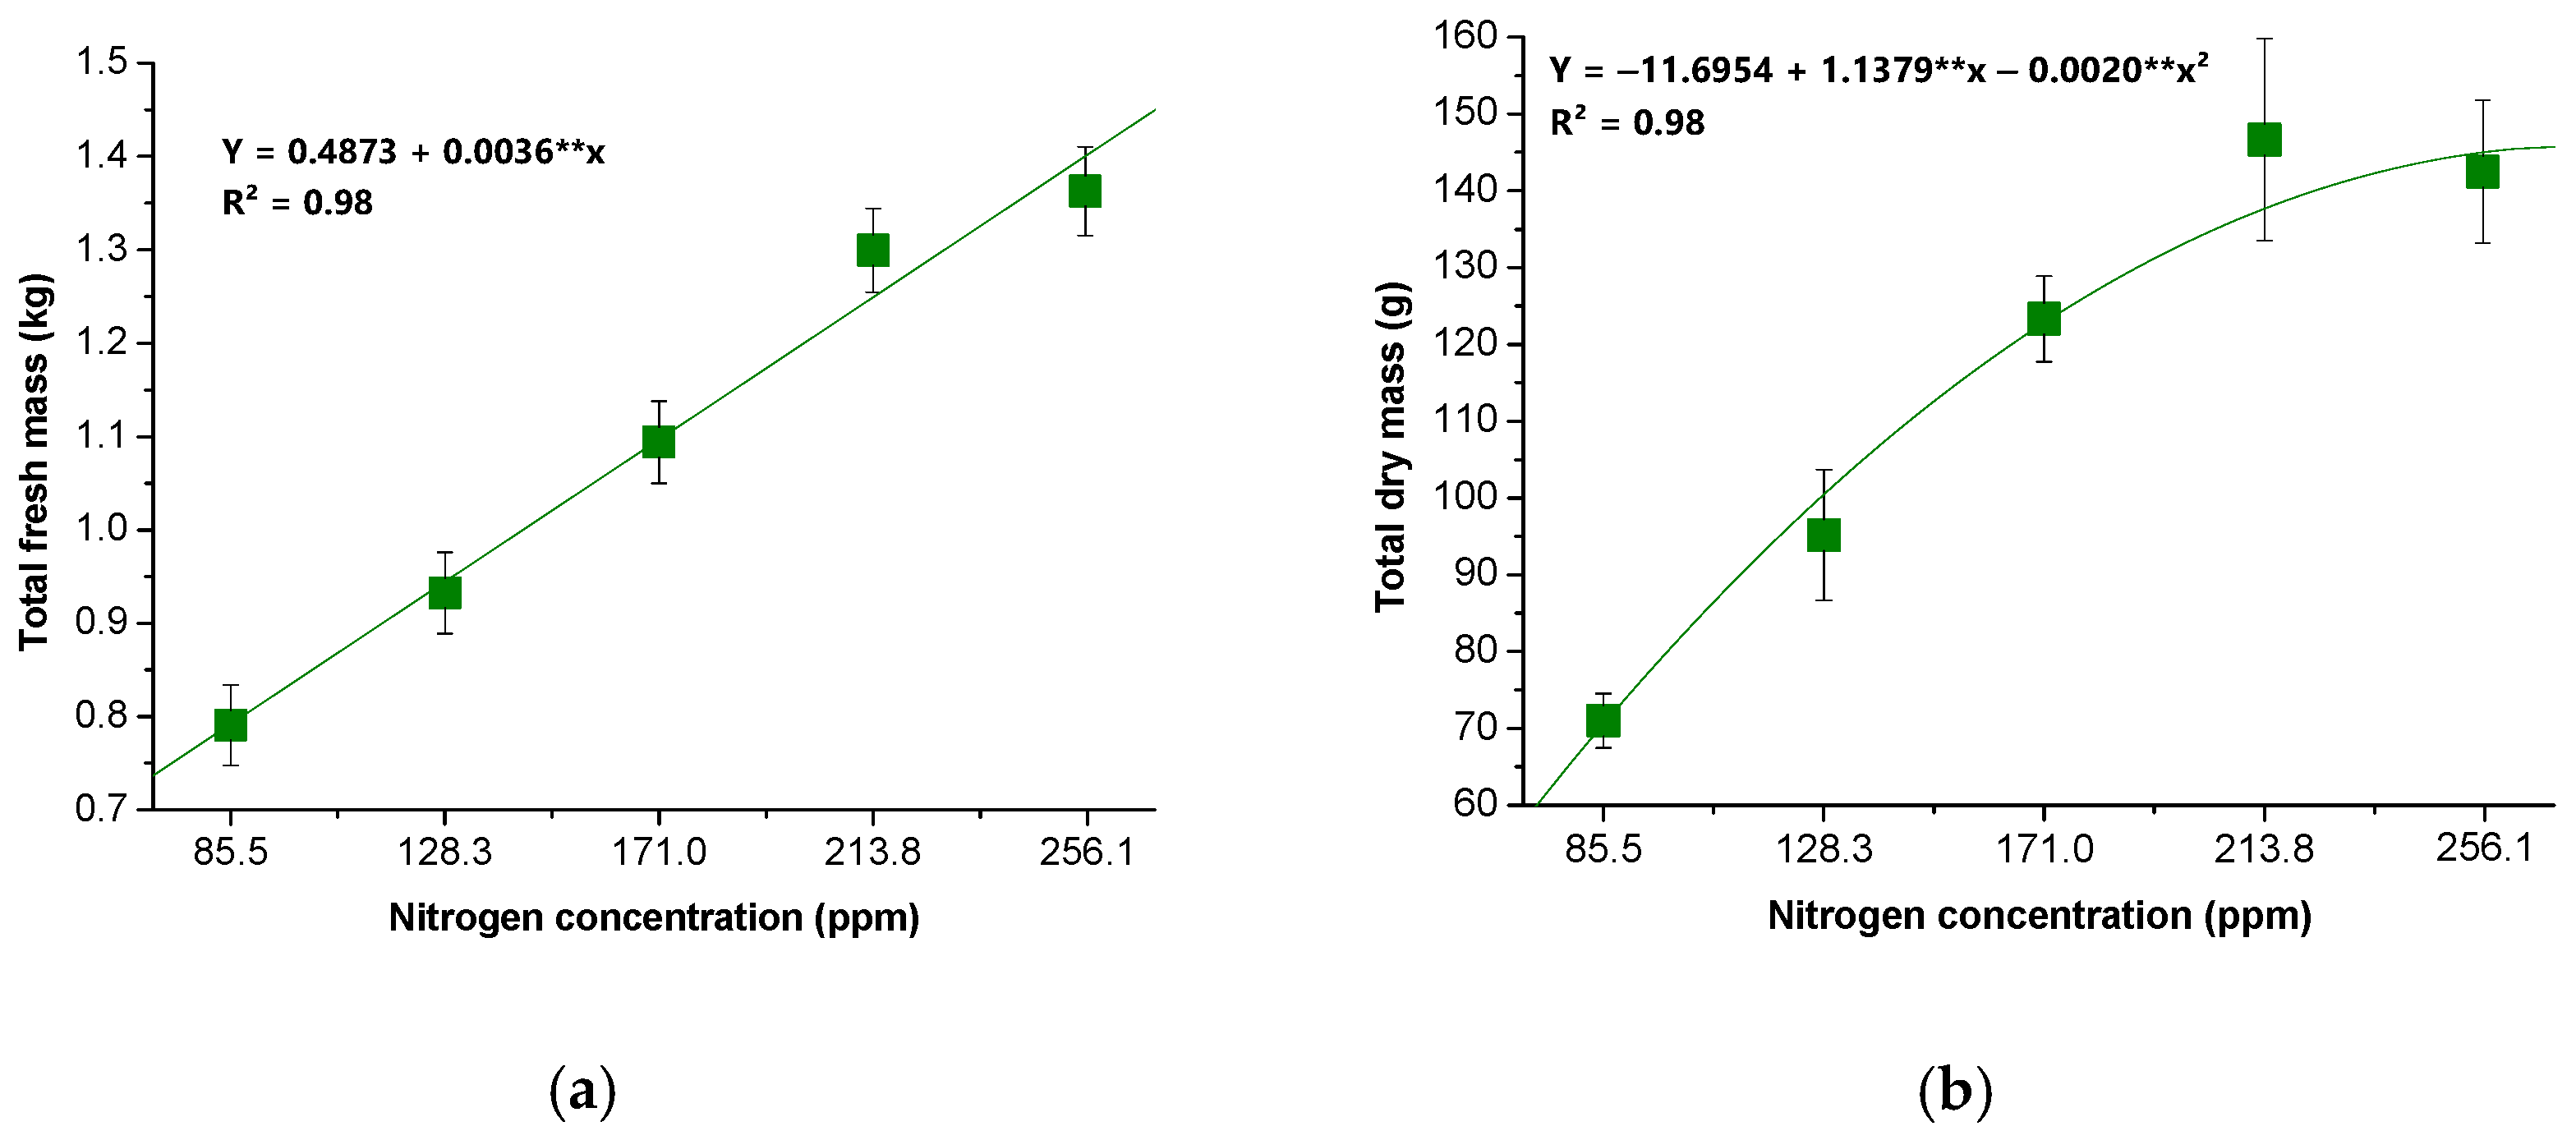
There was a very strong positive linear relationship between the N concentration of the nutrient solution and the total plant fresh mass (Figure 9a).
The plant fresh mass in the highest N treatment (256.1 ppm) averaged 42%, 32%, 20%, and 5% greater than the plant fresh mass in the 85.5, 128.3, 171, and 213.8 ppm N treatments, respectively.
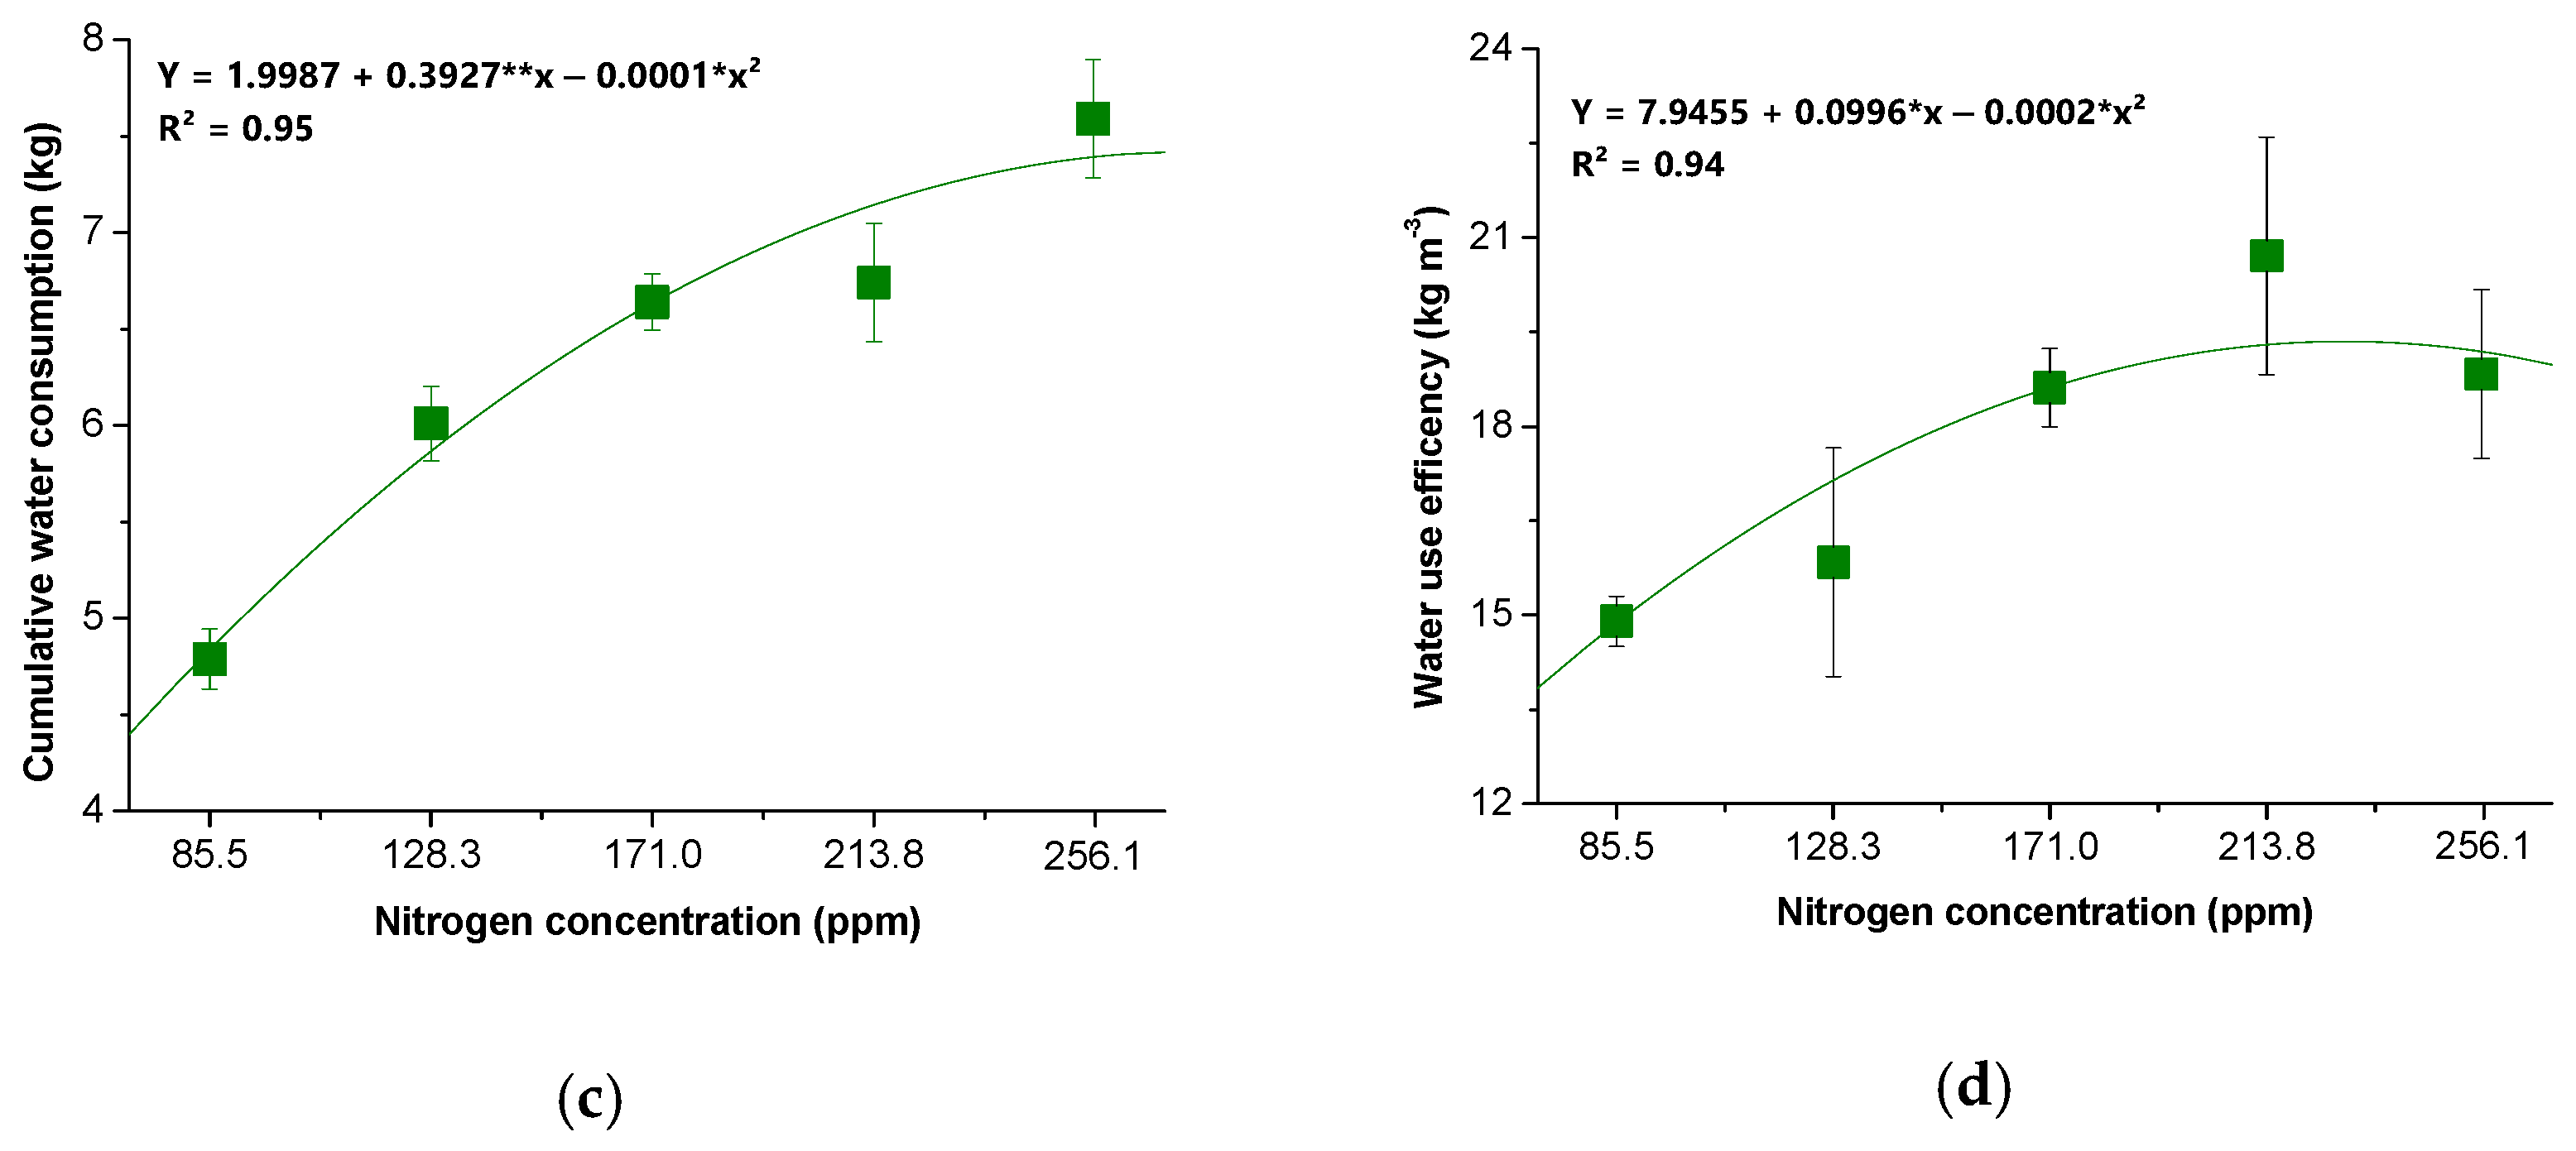
There were strong positive curvilinear relationships between the N concentration of the nutrient solution and the total plant dry mass (Figure 9b), cumulative water consumption (Figure 9c), and water use efficiency (Figure 9d). The greatest plant dry mass and water use efficiency were observed at the second highest N concentration, in the nutrient solution of 213.8 ppm (Figure 9b,d), whereas the maximum response for cumulative water consumption was observed at the highest nutrient solution N concentration of 256 ppm (Figure 9c).

4. Discussion

The higher leaf N contents in the treatments with higher N concentrations in the nutrient solution that were observed in the present study were expected, as N is absorbed and translocated in large quantities by plants, playing a fundamental role in numerous essential physiological processes, such as pigment synthesis and key metabolic activities. These processes are crucial for plant development, particularly under abiotic stress conditions [36].
The increase in the maximum quantum efficiency of photosystem II (Fv/Fm) that was observed in plants with higher leaf N concentrations suggests an enhancement in their photosynthetic performance [37], as the closer the variable fluorescence is to maximum fluorescence, the more efficient the electron transport from photosystem II to photosystem I is, which results from the effective assimilation of light photons by the thylakoid membranes [38]. Moreover, Fv/Fm values ranging from 0.75 to 0.83 are generally expected in most higher plant species under non-stress conditions [39]. The closer the Fv/Fm value is to 1, the smaller the gap between the actual light processing into chemical energy and the species maximum potential, which indicates a higher quantum efficiency of photosystem II [40].
There was a strong correlation (R > 0.8) observed between the Fv/Fm values and the LCI as the N concentrations in the nutrient solution were varied. Although the LCI is a measure of leaf greenness and not a direct measure of leaf chlorophyll content, the LCI has been highly correlated with the leaf chlorophyll content [41]. Thus, the results indicate that the reduced capacity to convert light into energy in tomato plants grown under lower N concentrations is associated with a decrease in photosynthetic pigments, which is likely due to the lower leaf N content in these treatments, since N is a fundamental component of the chlorophyll molecule [42].
The N concentration of 171 ppm was originally proposed by [43], and was subsequently tested and recommended as the optimum dose, since it was the lowest concentration that did not result in a reduction in yield [44]. This was established as the minimum N concentration for hydroponic tomato production without compromising yield. Since then, this concentration has been widely adopted in research and commercial production systems [45]. Similarly, the present study demonstrated that tomato plants grown below this recommended N concentration exhibited a deterioration in their photosynthetic performance during the vegetative growth stage, as indicated by reductions in Fv/Fm and LCI.
The decline in photosynthetic capacity in plants subjected to low N concentrations results in part from the absorbed light energy not being converted into chemical energy during photosynthesis but instead dissipated as heat into the environment [46]. Non-photochemical quenching (NPQ) acts as a photoprotective mechanism that dissipates excess energy absorbed by the chlorophyll–protein complexes. This process prevents excitation beyond the physiological capacity of thylakoid membranes, and thereby reduces the formation of damaging reactive oxygen species by safely releasing the excess energy as heat [47].
The greater a plant’s capacity for photosynthesis, the more energy its light-harvesting complex can absorb and transmit via the electron transport chain to the dark reaction centers in photosystem I. Consequently, less energy is lost as heat [48]. Therefore, plants with a higher photosynthetic capacity dissipate less energy as heat, which is reflected in lower NPQ values in the leaves [38]. However, it is important to note that, although an increase in the NPQ indicates the tgreater dissipation of light energy as heat, this mechanism is essential for plant protection, acting to dissipate excess energy and prevent photoinhibition [49]. Thus, excessively low NPQ values may indicate a reduced capacity for photoprotection under light stress conditions.
There is an interdependence between the N uptake and water consumption in plants, as a lower water uptake generally results in a reduced amount of N being transported via the xylem [50]. Consequently, plants grown under lower N concentrations tend to exhibit reduced growth, lower water consumption, and, subsequently, reduced nutrient uptake [12]. This process further amplifies the disparity in growth rates between well-nourished tomato plants and those subjected to lower N concentrations throughout their vegetative development.
As this study focused solely on the vegetative stage, the reproductive development and fruit yield were not considered. Therefore, the conclusions refer to plant physiological responses prior to flowering, and the results should not be extrapolated to fruit production without further investigation.
The literature reports that, the higher the N concentration in the nutrient solution, the greater the potential for gas exchange, which indicates that this is a response to the increased shoot biomass, which expands the leaf surface area that is exposed to the atmosphere [8,18]. The leaf chlorophyll content is another factor that enhances the photosynthetic capacity of plants, increasing the demand for water to support the conversion of light into chemical energy [51]. Both factors contribute to greater water loss through evapotranspiration.
In this study, N oversupply promoted the highest increases in fresh mass but also resulted in greater water consumption. The efficiency observed in the 213.8 ppm N treatment may be associated with better stomatal control compared to the 256.1 ppm treatment, as excessive N can induce physiological alterations, such as reductions in stomatal density and net photosynthesis, even under increased chlorophyll content [52].
Furthermore, another critical factor is photosynthetic efficiency, as treatments with N concentrations above 171 ppm did not show a significant increase in photosynthetic efficiency. This suggests a possible limitation in CO2 capture, potentially due to stomatal regulation or constraints in carbon (C) allocation toward structural biomass. Under N oversupply, carbon may be redirected toward N metabolism, which could result in the increased synthesis of enzymes such as superoxide dismutase (SOD) and the hormone abscisic acid (ABA), leading to a reduced C/N ratio [16,53]. Consequently, the increase in fresh mass observed in the 256.1 ppm treatment did not translate into a net gain in dry mass, reinforcing the fact that excessive N does not improve WUE [54,55].
These phenomena become particularly evident during the pre-flowering phase, around 40 DAT. At this stage, the 213.8 ppm treatment exhibited lower water consumption compared to the 256.1 ppm treatment, which indicated a more efficient balance between growth and water use.
It is likely that, in the absence of water restrictions during cultivation, there was no stomatal limitation to plant transpiration either [15], which led to greater water loss in the form of vapor. This reduced stomatal control may result from several factors, including the antagonistic relationship between N and potassium—an essential osmotic regulator—as well as increased cell turgor promoted by the N oversupply in the plant tissues [9].
Moreover, as observed under the hydroponic conditions of this experiment, even though the water availability did not limit the plant growth, the N concentration absorbed by the plants directly influenced the amount of water consumed during the vegetative growth stage of the tomato plants.
In this context, understanding how N accumulation in plant tissues affects water consumption allows for the recommendation of an efficient N dose for tomato cultivation. This can translate into lower water costs and higher productivity, supporting more assertive decisions regarding N management in tomato production systems.

5. Conclusions

The oversupply of N did not enhance the photosynthetic efficiency of tomato plants, which suggests a possible physiological threshold at an N concentration of 171 ppm. Furthermore, N concentrations above 213.8 ppm reduced the dissipation of excess energy (NPQ), which indicated a potential compromise in the plant’s protective mechanisms against environmental stress.
During the first week, the lowest N concentration (85.5 ppm) promoted the highest initial fresh mass production, without affecting the water consumption, as compared to the water consumption of the other treatments. However, in the final stage of vegetative growth, the water consumption and fresh mass production were closely related to the N rate, increasing proportionally with higher concentrations.
The increase in fresh mass did not result in a proportional gain in dry biomass at the highest N rate that was evaluated. Therefore, the N concentration of 213.8 ppm is recommended, as it provided greater WUE due to encouraging higher dry mass accumulation and lower water consumption compared to the highest rate. Further studies are recommended to evaluate different N rates applied in different growing seasons to verify their fertilization efficiency.

Author Contributions

Conceptualization, investigation, and methodology: P.R.M.D.; software, validation, and writing—original draft preparation: P.R.M.D., M.K.S.S.P. and L.Y.d.C.L.; formal analysis and data curation: P.R.M.D.; writing—review and editing: M.K.S.S.P., L.Y.d.C.L., C.A.F.A., J.A.N., E.R.d.S., B.S., D.A.H.d.S.L., M.R.N. and A.d.C.S.; supervision and project administration: E.R.d.S., B.S., J.A.S.J. and E.C.d.O.; funding acquisition, P.R.M.D. All authors have read and agreed to the published version of the manuscript.

Funding

This study was financed in part by the Brazilian Federal Agency for Support and Evaluation of Graduate Education (CAPES) and the National Council for Scientific and Technological Development (CNPq) for granting scholarship (001 and 305136/2021-6) and funding the research project. Also, this study was funded by “Instituto Nacional de Ciência e Tecnologia em Agricultura Sustentável no Semiárido Tropical”—INCTAgris (406570/2022–1) and Agrofito company.

Data Availability Statement

The data that support the findings of this study are available from the corresponding author, upon reasonable request.

Conflicts of Interest

The authors declare that this study received funding from Agrofito company. The funder was not involved in the study design, collection, analysis, interpretation of data, the writing of this article or the decision to submit it for publication.

Abbreviations

The following abbreviations are used in this manuscript:
LNCLeaf Nitrogen Content
FMFresh Mass
DMDry Mass
Fv/FmMaximum Quantum Efficiency of Photosystem II
NPQNon-Photochemical Quenching
SPADSoil Plant Analysis Development (Índice relativo de clorofila)
WUEWater Use Efficiency
SODSuperoxide Dismutase
ABAAbscisic Acid

References

  1. Ponsioen, T.; Helmes, R. Environmental Footprint of Tomatoes: Summary of the Representative Product Study; Wageningen Economic Research: Den Haag, The Netherlands, 2020; Report 2020-041b. [Google Scholar]
  2. Hasan, M.; Sabir, N.; Singh, A.K.; Singh, M.C.; Patel, N.; Khanna, M.; Rai, T.; Pragnya, P. Hydroponics Technology for Horticultural Crops; ICAR IARI: New Delhi, India, 2018; Volume 188, p. 30. [Google Scholar]
  3. Singh, A. Salinization of agricultural lands due to poor drainage: A viewpoint. Ecol. Indic. 2018, 95, 127–130. [Google Scholar] [CrossRef]
  4. Singh, A. Salinization and drainage problems of agricultural land. Irrig. Drain. 2020, 69, 844–853. [Google Scholar] [CrossRef]
  5. Chanda, S.; Bhat, M.; Shetty, K.G.; Jayachandran, K. Technology, Policy, and Market Adaptation Mechanisms for Sustainable Fresh Produce Industry: The Case of Tomato Production in Florida, USA. Sustainability 2021, 13, 5933. [Google Scholar] [CrossRef]
  6. Sharma, N.; Acharya, S.; Kumar, K.; Singh, N.; Chaurasia, O.P. Hydroponics as an advanced technique for vegetable production: An overview. J. Soil Water Conserv. 2018, 17, 364–371. [Google Scholar] [CrossRef]
  7. Wang, X.; Yun, J.; Shi, P.; Li, Z.; Li, P.; Xing, Y. Root growth, fruit yield and water use efficiency of greenhouse grown tomato under different irrigation regimes and nitrogen levels. J. Plant Growth Regul. 2019, 38, 400–415. [Google Scholar] [CrossRef]
  8. Du, Y.D.; Cao, H.X.; Liu, S.Q.; Gu, X.B.; Cao, Y.X. Response of yield, quality, water and nitrogen use efficiency of tomato to different levels of water and nitrogen under drip irrigation in Northwestern China. J. Integr. Agric. 2017, 16, 1153–1161. [Google Scholar] [CrossRef]
  9. Wei, Z.; Du, T.; Li, X.; Fang, L.; Liu, F. Interactive effects of CO2 concentration elevation and nitrogen fertilization on water and nitrogen use efficiency of tomato grown under reduced irrigation regimes. Agric. Water Manag. 2018, 202, 174–182. [Google Scholar] [CrossRef]
  10. Zhou, H.; Kang, S.; Li, F.; Du, T.; Shukla, M.K.; Li, X. Nitrogen application modified the effect of deficit irrigation on tomato transpiration, and water use efficiency in different growth stages. Sci. Hortic. 2020, 263, 109112. [Google Scholar] [CrossRef]
  11. Ding, L.; Li, Y.; Gao, L.; Lu, Z.; Wang, M.; Ling, N.; Guo, S. Aquaporin expression and water transport pathways inside leaves are affected by nitrogen supply through transpiration in rice plants. Int. J. Mol. Sci. 2018, 19, 256. [Google Scholar] [CrossRef]
  12. Gloser, V.; Dvorackova, M.; Mota, D.H.; Petrovic, B.; Gonzalez, P.; Geilfus, C.M. Early changes in nitrate uptake and assimilation under drought in relation to transpiration. Front. Plant Sci. 2020, 11, 602065. [Google Scholar] [CrossRef]
  13. Ullah, H.; Santiago-Arenas, R.; Ferdous, Z.; Attia, A.; Datta, A. Improving water use efficiency, nitrogen use efficiency, and radiation use efficiency in field crops under drought stress: A review. Adv. Agron. 2019, 156, 109–157. [Google Scholar] [CrossRef]
  14. Kunrath, T.R.; Lemaire, G.; Sadras, V.O.; Gastal, F. Water use efficiency in perennial forage species: Interactions between nitrogen nutrition and water deficit. Field Crops Res. 2018, 222, 1–11. [Google Scholar] [CrossRef]
  15. Wang, J.; Chadwick, D.R.; Cheng, Y.; Yan, X. Global analysis of agricultural soil denitrification in response to fertilizer nitrogen. Sci. Total Environ. 2018, 616, 908–917. [Google Scholar] [CrossRef]
  16. Cheng, M.; Wang, H.; Fan, J.; Xiang, Y.; Tang, Z.; Pei, S.; Zhang, F. Effects of nitrogen supply on tomato yield, water use efficiency and fruit quality: A global meta-analysis. Sci. Hortic. 2021, 290, 110553. [Google Scholar] [CrossRef]
  17. Qu, Z.; Qi, X.; Shi, R.; Zhao, Y.; Hu, Z.; Chen, Q.; Li, C. Reduced N fertilizer application with optimal blend of controlled-release urea and urea improves tomato yield and quality in greenhouse production system. J. Soil Sci. Plant Nutr. 2020, 20, 1741–1750. [Google Scholar] [CrossRef]
  18. Ronga, D.; Parisi, M.; Pentangelo, A.; Mori, M.; Di Mola, I. Effects of nitrogen management on biomass production and dry matter distribution of processing tomato cropped in southern Italy. Agronomy 2019, 9, 855. [Google Scholar] [CrossRef]
  19. Padilla, F.M.; Farneselli, M.; Gianquinto, G.; Tei, F.; Thompson, R.B. Monitoring nitrogen status of vegetable crops and soils for optimal nitrogen management. Agric. Water Manag. 2020, 241, 106356. [Google Scholar] [CrossRef]
  20. Lins, C.M.T.; de Souza, E.R.; dos Santos Souza, T.E.M.; Paulino, M.K.S.S.; Monteiro, D.R.; de Souza Júnior, V.S.; Schaffer, B. Influence of vegetation cover and rainfall intensity on soil attributes in an area undergoing desertification in Brazil. Catena 2023, 221, 106751. [Google Scholar] [CrossRef]
  21. Kanan, A.; Allahham, A.; Bouleau, C.; Sayara, T.; Qurie, M.; Awad, L. Improving water use efficiency using sensors and communication system for irrigation of greenhouse tomato in Tulkarm, Palestine. Agric. Res. 2021, 11, 728–736. [Google Scholar] [CrossRef]
  22. Mhadhbi, H. Plant Hydroponic cultivation: A support for biology research. In Hydroponics—A Standard Methodology for Plant Biological Researches; Asao, T., Ed.; IntechOpen: London, UK, 2012; Volume 1, 256p. [Google Scholar]
  23. Treftz, C.; Omaye, T. Comparision between hydroponic and soil systems for growing strawberries in a greenhouse. Int. J. Agric. Ext. 2016, 3, 195–200. [Google Scholar]
  24. Cho, W.J.; Kim, H.J.; Jung, D.H.; Kim, D.W.; Ahn, T.I.; Son, J.E. On-site ion monitoring system for precision hydroponic nutrient management. Comput. Electron. Agric. 2018, 146, 51–58. [Google Scholar] [CrossRef]
  25. Pant, T.; Agarwal, A.; Bhoj, A.S.; Joshi, R.P.; Prakash, O.; Dwivedi, S.K. Vegetable cultivation under hydroponics in Himalayas: Challenges and opportunities. Def. Life Sci. J. 2018, 3, 111–119. [Google Scholar] [CrossRef]
  26. Silva, F.J.D.; Santos, J.A.; Silva, M.M.D.; Silva, Ê.F.F.; Souza, E.R.D. Water relations of chives in function of salinity and circulation frequency of nutrient solutions. Rev. Bras. Eng. Agric. Ambient. 2019, 23, 359–365. [Google Scholar] [CrossRef]
  27. Nicola, S.; Pignata, G.; Ferrante, A.; Bulgari, R.; Cocetta, G.; Ertani, A. Water use efficiency in greenhouse systems and its application in horticulture. AgroLife Sci. J 2020, 9, 248–262. [Google Scholar]
  28. Phene, C.J.; Mccormick, R.L.; Davis, K.R.; Pierre, J.D.; Meek, D.W. A lysimeter feedback irrigation controller system for evapotranspiration measurements and real time irrigation scheduling. Trans. ASAE 1989, 32, 477–484. [Google Scholar] [CrossRef]
  29. Medrano, E.; Alonso, F.J.; Sánchez-Guerrero, M.C.; Lorenzo, P.; Marhuenda, A.; Briones, P.A. A Simplified P-M model for improving irrigation management of strawberries in a semi-closed hydroponic system. Int. Hortic. Congr. Sci. Hortic. People 2010, 927, 361–366. [Google Scholar] [CrossRef]
  30. Liang, L.; Ridoutt, B.G.; Lal, R.; Wang, D.; Wu, W.; Peng, P.; Zhao, G. Nitrogen footprint and nitrogen use efficiency of greenhouse tomato production in north China. J. Clean. Prod. 2019, 208, 285–296. [Google Scholar] [CrossRef]
  31. Jones, J.B., Jr. Tomato Plant Culture: In the Field, Greenhouse, and Home Garden, 2nd ed.; CRC Press: Boca Raton, FL, USA, 2007; 420p. [Google Scholar]
  32. Macwan, J.; Pandya, D. Review on soilless method of cultivation: Hydroponics. Int. J. Recent Sci. Res. 2019, 11, 37122–37127. [Google Scholar] [CrossRef]
  33. Yang, T.; Altland, J.E.; Samarakoon, U. Evaluation of organic substrates as an alternative to perlite for cucumber production in the dutch bucket hydroponic system. In International Symposium on Growing Media, Soilless Cultivation, and Compost Utilization in Horticulture; ISHS: Portland, OR, USA, 2021; Volume 1317, pp. 319–326. [Google Scholar] [CrossRef]
  34. Snyder, R.G. Greenhouse Tomato Handbook; Mississippi State University, Cooperative Extension Service (Department of Information Services, Division of Agriculture, Forestry, and Veterinary Medicine): Starkville, MS, USA, 1994; p. 24. [Google Scholar]
  35. Miyazawa, M.; Pavan, M.A.; Muraoka, T.; do Carmo, C.A.F.S.; de Melo, W.J. Análise química de tecido vegetal. In Manual de Análises Químicas de Solos, Plantas e Fertilizantes; da Silva, F.C., Ed.; Embrapa Informação Tecnológica: Brasília, DF, Brasil, 2009; 627p. [Google Scholar]
  36. Luo, J.; Yang, Z.; Zhang, F.; Li, C. Effect of nitrogen application on enhancing high-temperature stress tolerance of tomato plants during the flowering and fruiting stage. Front. Plant Sci. 2023, 14, 1172078. [Google Scholar] [CrossRef]
  37. Pérez-Molina, J.P. Chlorophyll fluorescence and biomass partitioning within light and nitrogen deficiency: An example of the use of the R programming language for teaching. UNED Res. J. 2020, 12, 92–105. [Google Scholar] [CrossRef]
  38. Murchie, E.H.; Lawson, T. Chlorophyll fluorescence analysis: A guide to good practice and understanding some new applications. J. Exp. Bot. 2013, 64, 3983–3998. [Google Scholar] [CrossRef] [PubMed]
  39. Pérez-Jiménez, M.; Piñero, M.C.; Del Amor, F.M. Heat shock, high CO2 and nitrogen fertilization effects in pepper plants submitted to elevated temperatures. Sci. Hortic. 2019, 244, 322–329. [Google Scholar] [CrossRef]
  40. Banks, J.M. Chlorophyll fluorescence as a tool to identify drought stress in Acer genotypes. Environ. Exp. Bot. 2018, 155, 118–127. [Google Scholar] [CrossRef]
  41. Ali, K.A.; Noraldeen, S.S.; Yaseen, A.A. An evaluation study for chlorophyll estimation techniques. Sarhad J. Agric. 2021, 37, 1458–1465. [Google Scholar] [CrossRef]
  42. Song, Y.; Wan, G.Y.; Wang, J.X.; Zhang, Z.S.; Xia, J.Q.; Sun, L.Q.; Lu, J.; Ma, C.X.; Yu, L.H.; Xiang, C.B.; et al. Balanced nitrogen–iron sufficiency boosts grain yield and nitrogen use efficiency by promoting tillering. Mol. Plant 2023, 16, 1661–1677. [Google Scholar] [CrossRef]
  43. Larsen, A.; Dale, K.; Eek, M. Radiographic evaluation of rheumatoid arthritis and related conditions by standard reference films. Acta Radiol. Diagn. 1977, 18, 481–491. [Google Scholar] [CrossRef]
  44. Steiner, I.D. Models for inferring relationships between group size and potential group productivity. Behav. Sci. 1966, 11, 273–283. [Google Scholar] [CrossRef]
  45. Rosa-Rodríguez, R.D.L.; Lara-Herrera, A.; Trejo-Téllez, L.I.; Padilla-Bernal, L.E.; Solis-Sánchez, L.O.; Ortiz-Rodríguez, J.M. Water and fertilizers use efficiency in two hydroponic systems for tomato production. Hortic. Bras. 2020, 38, 47–52. [Google Scholar] [CrossRef]
  46. Yang, X.; Wang, S.; Liu, W.; Huang, S.; Xie, Y.; Meng, X.; Li, Z.; Jin, N.; Jin, L.; Lyu, J.; et al. Different spatial configurations of LED light sources enhance growth in tomato seedlings by influencing photosynthesis, CO2 assimilation, and endogenous hormones. Plants 2025, 14, 1369. [Google Scholar] [CrossRef]
  47. Demmig-Adams, B.; Adams, W.I. Photoprotection and other responses of plants to high light stress. Annu. Rev. Plant Physiol. Plant Mol. Biol. 1992, 43, 599–626. [Google Scholar] [CrossRef]
  48. Tietz, S.; Hall, C.C.; Cruz, J.A.; Kramer, D.M. NPQ (T): A chlorophyll fluorescence parameter for rapid estimation and imaging of non-photochemical quenching of excitons in photosystem-II-associated antenna complexes. Plant Cell Environ. 2017, 40, 1243–1255. [Google Scholar] [CrossRef] [PubMed]
  49. Kang, J.; Chu, Y.; Ma, G.; Zhang, Y.; Zhang, X.; Wang, M.; Lu, H.; Wang, L.; Kang, G.; Ma, D.; et al. Physiological mechanisms underlying reduced photosynthesis in wheat leaves grown in the field under conditions of nitrogen and water deficiency. Crop J. 2023, 11, 638–650. [Google Scholar] [CrossRef]
  50. Niu, J.; Chen, F.; Mi, G.; Li, C.; Zhang, F. Transpiration, and nitrogen uptake and flow in two maize (Zea mays L.) inbred lines as affected by nitrogen supply. Ann. Bot. 2007, 99, 153–160. [Google Scholar] [CrossRef]
  51. Petropoulos, S.A.; Fernandes, Â.; Xyrafis, E.; Polyzos, N.; Antoniadis, V.; Barros, L.; CFR Ferreira, I. The optimization of nitrogen fertilization regulates crop performance and quality of processing tomato (Solanum lycopersicum L. cv. Heinz 3402). Agronomy 2020, 10, 715. [Google Scholar] [CrossRef]
  52. Zhang, Y.; Yu, S.; Li, Z.; Chang, T.; Xu, Q.; Xu, H.; Zhang, J. Effects of excessive nitrogen fertilizer and soil moisture deficiency on antioxidant enzyme system and osmotic adjustment in tomato seedlings. Int. J. Agric. Biol. Eng. 2022, 15, 127–134. [Google Scholar]
  53. Jiao, X.; Yu, X.; Ding, J.; Du, Q.; Zhang, J.; Song, X.; Bai, P.; Li, J. Effects of rising VPD on the nutrient uptake, water status and photosynthetic system of tomato plants at different nitrogen applications under low temperature. Sci. Hortic. 2022, 304, 111335. [Google Scholar] [CrossRef]
  54. Yue, W.; Liu, L.; Chen, S.; Bai, Y.; Li, N. Effects of water and nitrogen coupling on growth, yield and quality of greenhouse tomato. Water 2022, 14, 3665. [Google Scholar] [CrossRef]
  55. Li, H.; Liu, H.; Gong, X.; Li, S.; Pang, J.; Chen, Z.; Sun, J. Optimizing irrigation and nitrogen management strategy to trade off yield, crop water productivity, nitrogen use efficiency and fruit quality of greenhouse grown tomato. Agric. Water Manag. 2021, 245, 106570. [Google Scholar] [CrossRef]
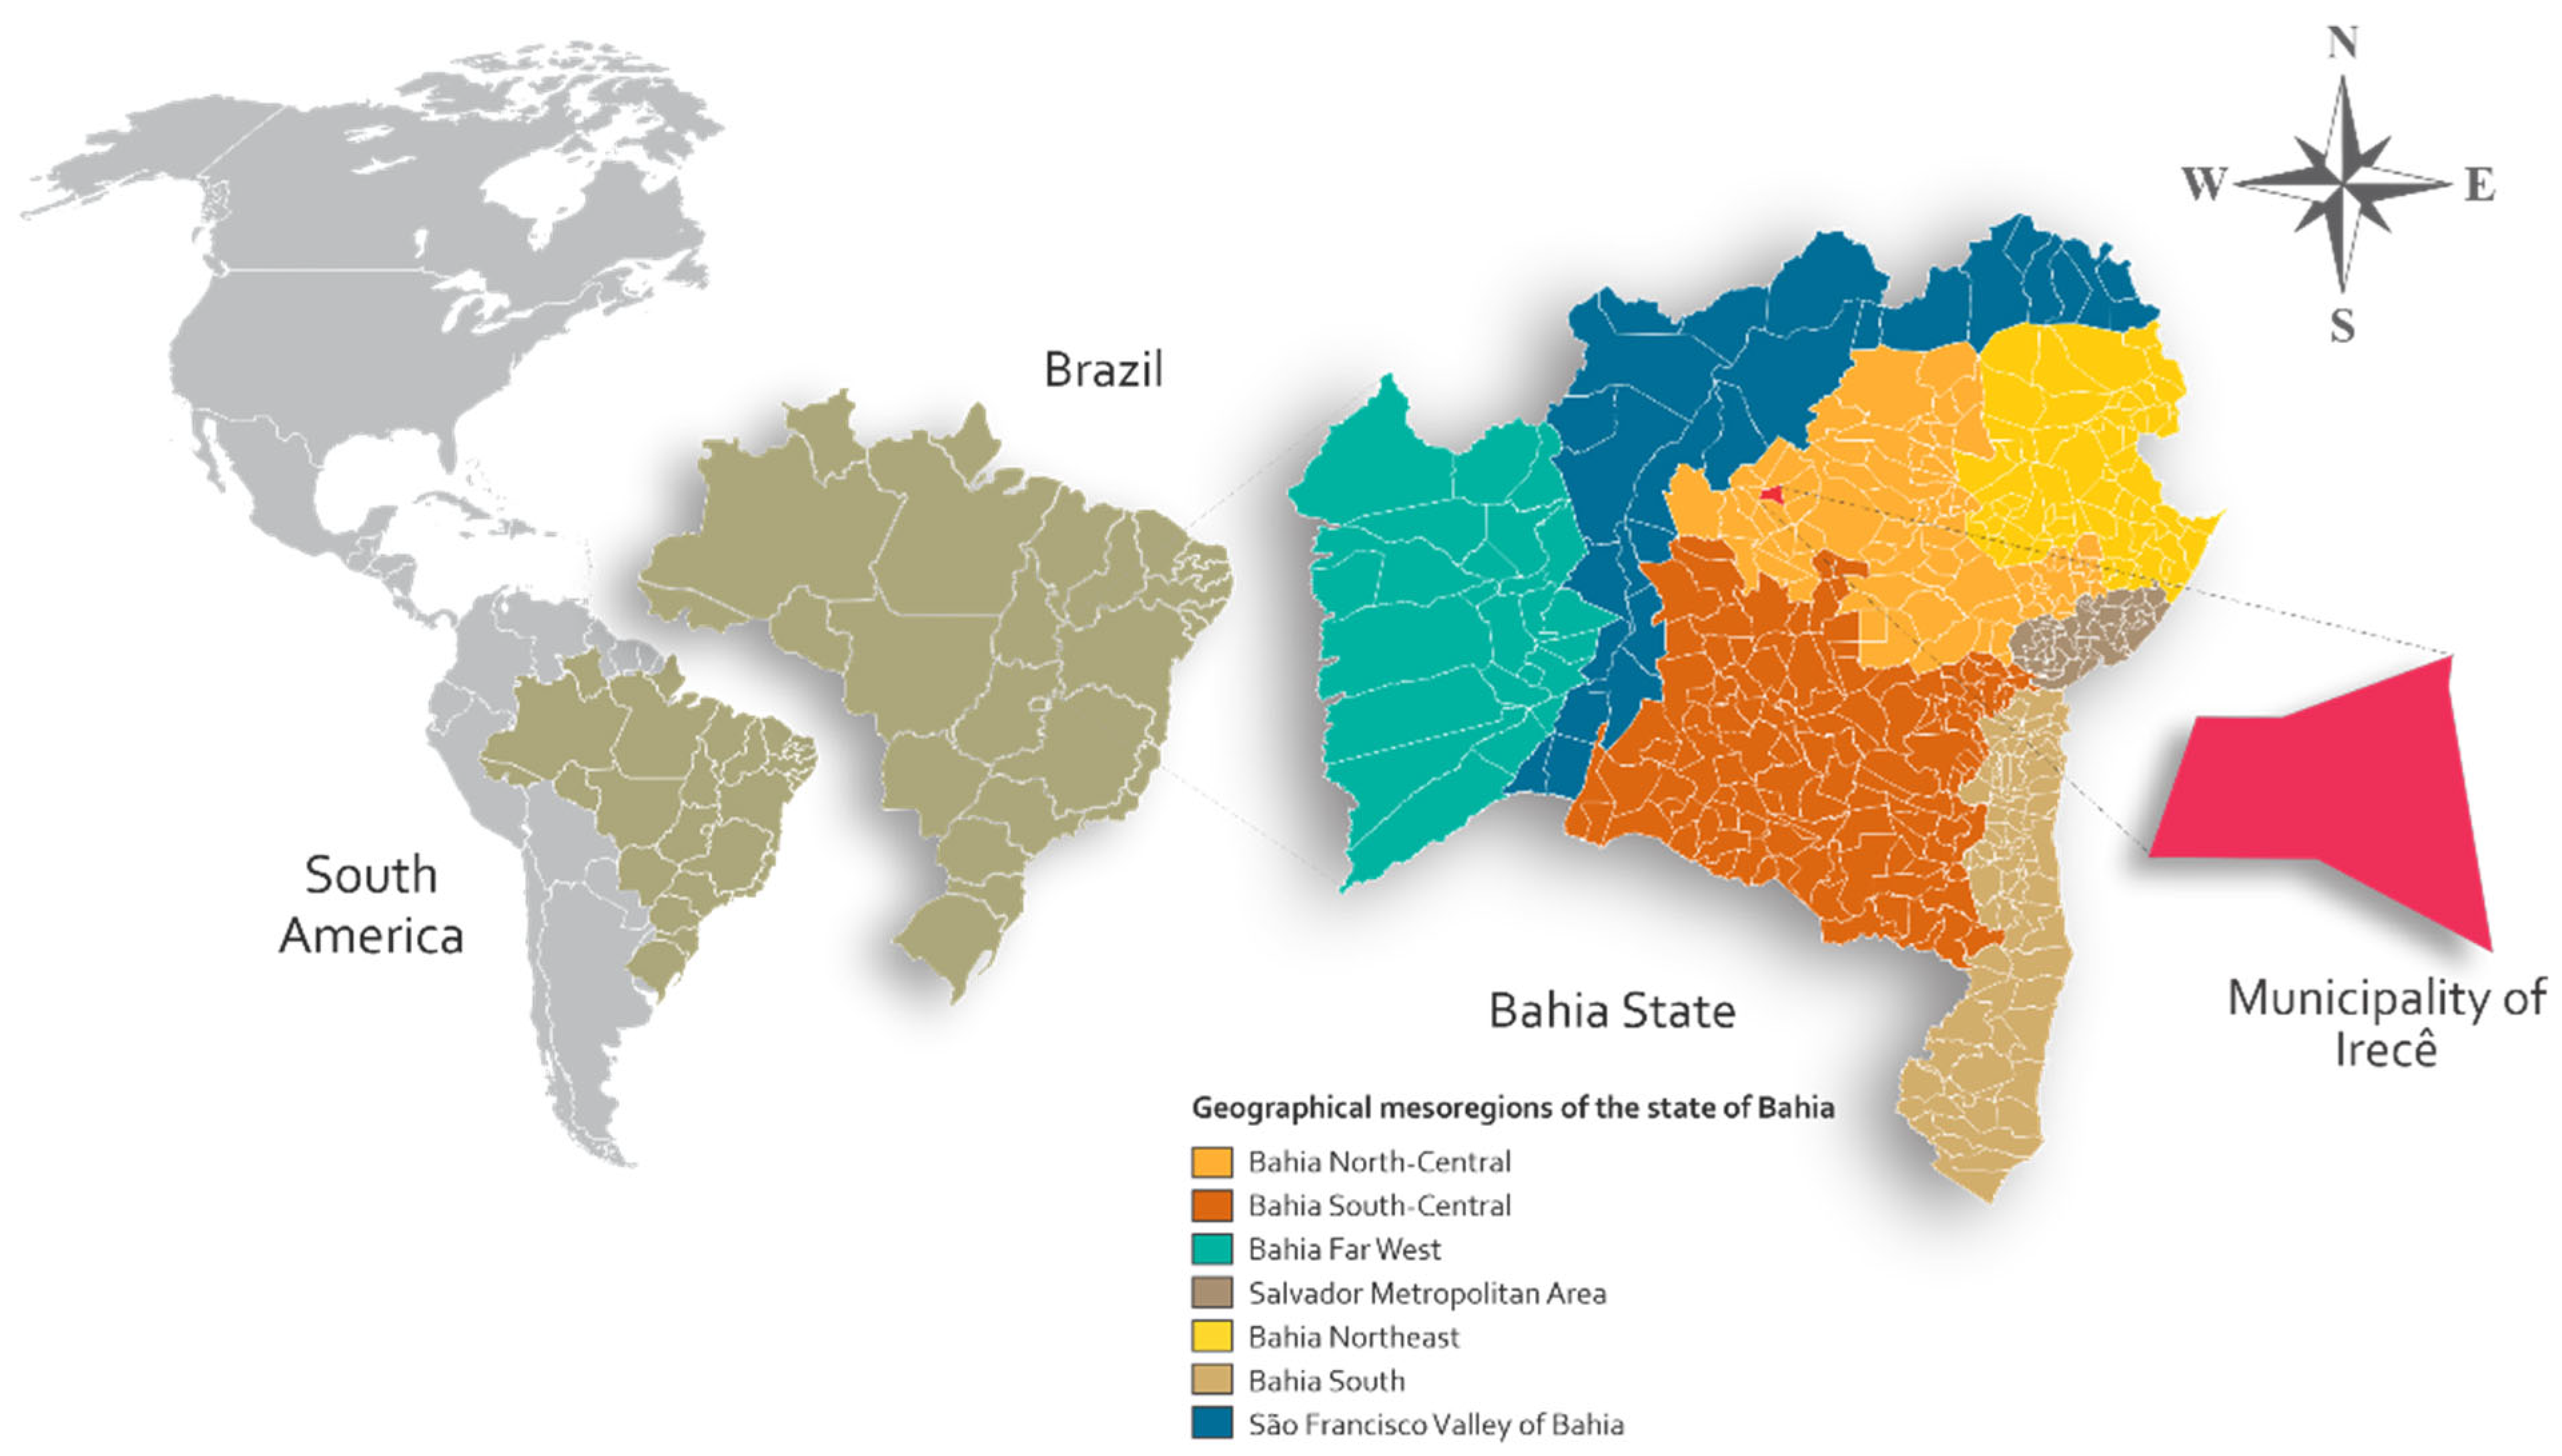
Figure 1. Location of the municipality of Irecê in the northern region of the state of Bahia, Brazil.
Water 17 01951 g001
Figure 2. Schematic diagram of the cultivation containers adapted from the Dutch bucket system.
Water 17 01951 g002
Figure 3. Schematic diagram of the irrigation and drainage cycles. Red arrows indicate the movement of water within the structure. Blue represents water and brown represents the dry substrate.
Water 17 01951 g003
Figure 4. The relationship between the leaf nitrogen content in tomato plants and the nitrogen concentration of the nutrient solution. Bars represent standard deviation (±SD). Asterisks indicate statistically significant differences: p < 0.01 (**).
Water 17 01951 g004
Figure 5. Leaf chlorophyll content (LCI) (a), maximum quantum efficiency of photosystem II (Fv/Fm) (b), and non-photochemical quenching (NPQ) (c) in tomato plants grown under different nitrogen concentrations in the nutrient solution. Bars represent standard deviation (±SD). Means followed by different letters differ significantly according to a Scott-Knott test (p ≤ 0.05).
Water 17 01951 g005
Figure 6. Fresh mass of tomato plants cultivated under nutrient solutions with different nitrogen concentrations during four different growth phases (I–V).
Water 17 01951 g006
Figure 7. Daily water consumption of tomato plants cultivated under different N concentrations in the nutrient solution during four different growth phases (I–IV). NS = not significant.
Water 17 01951 g007
Figure 8. Visual comparison of tomato plants grown under different nitrogen concentrations (85.5, 128.3, 171.0, 213.8, and 256.1 ppm) at the end of the vegetative stage. Representative plants from each treatment are shown, illustrating differences in shoot and root biomass accumulation in response to nitrogen availability.
Water 17 01951 g008
Figure 9. Relationship between nitrogen concentration of the nutrient solution and cumulative fresh mass (a), dry mass (b), cumulative water consumption (c), and water use efficiency (WUE) (d) of tomato plants. Bars represent standard deviation (±SD). Asterisks indicate statistically significant differences: p < 0.05 (*), p < 0.01 (**).
Water 17 01951 g009aWater 17 01951 g009b
Table 1. Nutrient concentrations (ppm) and electrical conductivity (dS cm−1) of the treatments that were applied.
N TreatmentN-NO3N-NH4PKCaMgNaS-SO4ClFeBCuZnMnMoCE
ppmdS m−1
85.578.57.048.0303.8180.047.91.1145.5177.93.001.070.200.401.500.102.22
128.3117.810.548.0303.8180.047.91.1149.079.53.001.070.200.401.500.102.23
171157.014.048.0303.8180.047.91.1144.10.03.001.070.200.401.500.102.26
213.8178.535.348.0303.8180.047.91.1143.90.03.001.070.200.401.500.102.4
256.1200.755.448.0303.8180.047.91.1141.40.03.001.070.200.401.500.102.54
Table 2. Quantities of salts used for the preparation of Solution A.
N TreatmentMgSO4Mg(NO3)2(NH4)2SO4KH2PO4KNO3K2SO4KClBoraxCuS4ZnSO4MnSO4(NH4)6 Mo7O24
ppmg
85.550.00--20.00-50.000.010.950.080.180.460.02
128.350.00--20.00-50.000.010.950.080.180.460.02
17150.00--20.0010.0050.00-0.950.080.180.460.02
213.850.00-10.0020.0010.0030.00-0.950.080.180.460.02
256.140.0010.0010.0020.0010.0040.00-0.950.080.180.460.02
Table 3. Quantities of salts used for the preparation of Solution B.
N ConcentrationsCa(NO3)2CaCl2KNO3NH4NO3Ferro EDTA
ppmg
85.550.0030.00-10.002.31
128.390.0010.00-10.002.31
171110.00-10.0010.002.31
213.8110.00-10.0010.002.31
256.1110.00-10.0020.002.31
Disclaimer/Publisher’s Note: The statements, opinions and data contained in all publications are solely those of the individual author(s) and contributor(s) and not of MDPI and/or the editor(s). MDPI and/or the editor(s) disclaim responsibility for any injury to people or property resulting from any ideas, methods, instructions or products referred to in the content.