Article

Groundwater–River Water Interaction in an Urban Setting (Rome, Italy) Using a Multi-Method Approach (Hydrogeological and Radon Analyses)

1
Dipartimento di Scienze, Università “Roma Tre”, 00146 Roma, Italy
2
Società Italiana di Geologia Ambientale, 00198 Roma, Italy
3
Istituto di Geologia Ambientale e Geoingegneria, Consiglio Nazionale delle Ricerche, 00185 Roma, Italy
*
Author to whom correspondence should be addressed.
Water 2025, 17(10), 1555; https://doi.org/10.3390/w17101555
Submission received: 14 April 2025 / Revised: 16 May 2025 / Accepted: 19 May 2025 / Published: 21 May 2025
(This article belongs to the Special Issue Research on Hydrogeology and Hydrochemistry: Challenges and Prospects)

Abstract

:
The interaction of the Almone River with groundwater in the Caffarella area (Rome, Italy) was investigated using a multi-method approach based on hydrogeological and radon analyses. Eleven measurement stations were established along the river at distances of approximately 270 m from one another. Stream discharge, water physicochemical properties, and radon levels were measured from June 2024 to March 2025. The contribution of two tributaries of the Almone was evaluated, but it was found to be negligible in terms of radon contribution. Except for an average increase of 40 L/s between stations 1A and 2A, the Almone’s discharge (corrected for the streams input) was constant (around 150 L/s) in June and slightly increasing from 6A to 11A in March due to heavier rainfalls. The increased discharge between stations 1A and 2A was interpreted as groundwater overflow from the volcanic aquifer into the alluvial body and in turn into the river due to a change in geometry and volume of the volcanic aquifer. In that part of the river, radon concentration increased only in March, due to the fast transition of the groundwater from a high to a lower radon emanation unit. Radon decreased along the valley due to atmospheric evasion, as confirmed by pH growth due to CO2 degassing.

1. Introduction

Groundwater and surface water are broadly acknowledged as interrelated hydrologic systems [1,2]. The interactions between groundwater and surface water occur in a range of settings from headwater streams to coastlines. These connections sustain groundwater-dependent environments and regulate river temperature [3,4] and biogeochemical cycles [1,5].
In the urban environment, surface water significantly influences groundwater flow and quality. Rivers are likely to impact urban groundwater due to the fact that cities are typically established close to significant river systems, which first supplied drinking water and transport and later fostered industry and trade [6].
The Almone is the third river in Rome (Italy) after the Tevere and the Aniene. It originates from the slopes of the Alban Hills Volcano, and after about 19 km, it flows into the sewer conduit that reaches the water purification plant of southern Rome. Originally, the Almone flowed into the Tevere River, but strong water contamination [7] determined its diversion to the wastewater treatment plant.
The aim of this work is to preliminarily assess the relationship between the Almone River and the Alban Hills aquifer, taking into account the prominent role of the alluvial body. Along the river’s course in the Caffarella Valley, an increase in discharge was reported and interpreted as input from groundwater [8]. Serial measurements of discharge, radon, and chemical–physical parameters, taking into account the contribution of two smaller watercourses flowing into the Almone, will be used to study this phenomenon and its environmental impact. An original 1:5000 scale field survey and the creation of three hydrogeological cross-section and a longitudinal profile validated by borehole data will provide the necessary geological constraints.
222Rn has been widely applied as a groundwater discharge tracer in freshwater and marine environments [9]. Radon is a noble and chemically inert gas and its abundance in natural waters is mostly controlled by its production from 226Ra, its own decay and gas evasion [10].
222Rn is released from the solid phase due to alpha recoil from its parent 226Ra and subsequent diffusion, potentially achieving secular equilibrium in the interstitial pore waters after around 5.5 halflives (~21 days). 222Rn activities in groundwater are naturally two to three orders of magnitude greater than in surface water. This occurs because (i) surface water has less interaction with 226Ra-bearing minerals compared to groundwater, and (ii) 222Rn rapidly escapes into the atmosphere due to higher temperature and turbulence found in surface water rather than in groundwater [9,11,12,13]. A great deal of publications used a box 222Rn mass balance for estimating groundwater discharge into receiving surface waters in marine [14] and freshwater environments [15,16,17,18].
Quantification of groundwater discharge to rivers is commonly based on a one-dimensional 222Rn mass balance [13,19,20] between radon sources (ingrowth by 226Ra decay, input by tributaries, water exchange within the stream bed and banks) and sinks (atmospheric evasion and 222Rn decay). In this opening contribution, radon sources and sinks are examined (though not quantified) to explore the interaction of groundwater with river water and to improve the information obtained from measuring the river discharge along the course of the Almone River. More detailed studies including the quantification of radon sources and sinks will reinforce interpretations in the future.

2. Study Area

The Caffarella Valley is a 190-hectare state-owned park in southeastern Rome, bordered by the Aurelian Walls, Via Latina, and Via dell’Almone. Named after the Caffarelli family, who owned the land, the area was designated as public park in 1965 and is now part of the Appia Antica Regional Park. Formed by the Almone River, the valley is carved into the volcanic plateau of Alban Hills Volcano with steep slopes and a flat valley floor. Historically prone to swamping due to numerous natural springs, it underwent major hydraulic interventions, including the construction of two drainage canals (known as “Marrana destra” and “Marrana sinistra” and referred to as “Marrane” when mentioned together) to direct spring water into the Almone River, which was also subjected to modifications over time.

2.1. Geological Setting

The Caffarella Valley is an alluvial valley located in the southeastern area of Rome, formed by the erosive action of the Almone River. It is part of an articulated and complex tectonic context, defined by the inner sector of the central portion of the Apennine chain, formed during the Neogene. The structuring of the Apennine orogen involves the entire Meso-Cenozoic sedimentary succession from the Upper Miocene onwards, determining the migration of the entire orogenic system of the central Apennines towards the NE, through the setting of thrusts and foreland basins, towards the most external domains of the foreland [21,22]. This first compressional tectonic phase, linked to the structuring of the orogen, was followed by a second phase of extensional tectonics, during the Upper Pliocene–Quaternary, associated with the opening of the Tyrrhenian Retro-Arc Basin and the orogenic collapse of the Apennines [23], which promoted progressive sinking and marine transgression.
During this phase, the formation of “Marne Vaticane” (Zanclean–Gelasian) was deposited, followed by sediments indicating a transition to more superficial marine environments (“Monte Mario” and “Monte delle Piche” Formations) and later by deposits of the continental environment (“Ponte Galeria” Formation), due to the uplift of the Tyrrhenian margin of the Latium Region. This phenomenon determined the complete emersion of the Roman area in the Middle Pleistocene, transforming it into a marshy region crossed by the paleo-Tevere River, with a delta located further south than today.
Around 600,000 years ago, during the Middle Pleistocene, volcanic activity developed along extensional tectonic lineaments due to crustal thinning following the formation of the Apennine chain and the opening of the Tyrrhenian basin. In the first phase, volcanic activity was confined to the area north of present-day Rome, leading to the structuring of the Sabatini volcanic district. Its products reached as far as the current urban area of Rome up to the banks of the right hydrographic side of the Tevere River, covering part of the continental sediments deposited previously. At the same time, volcanic activity began in the Alban Hills district, which emitted large volumes of volcanic products (approximately 300 km3) in three distinct phases.
The stratigraphy of the Caffarella Valley is defined by the following succession, from the oldest to the most recent:
Marne Vaticane (MVA): This formation is at the base of the post-orogenic stratigraphic succession of the Roman sector. It consists of clays, sandy clays, and stratified grey–blue marly clays, from consolidated to highly consolidated. Throughout the urban area up the left bank of the Tevere River, the stratification is dipping 5–20° to the NE (lower Pliocene p.p. (Zanclean, upper part)–Upper Pliocene p.p. (Gelasian, lower part)) [24,25].
Santa Cecilia Formation (CIL): This is made up of alternating gravels, sands, silts with diatomite, and clays of fluvial, fluvial–lacustrine, and marshy environments with volcanic elements and paleosols. It rests directly on the “Monte Vaticano” Formation, from which it is slightly discordant and from which it is separated by an erosional surface, as can be deduced from the correlation of survey data. Three lithofacies can be recognized in the Caffarella Valley (recognizable through survey data, as they do not outcrop): the basal gravelly, the intermediate silty–clayey, and the summit sandy levels. The formation developed between the fluvio-lacustrine sedimentation phase and the beginning of volcanic activity. Overall, the thickness can reach up to 40 m (lower part of the Middle Pleistocene p.p. (approx. 600 ka)) [24,25].
Tufo di Tor de’ Cenci (TDC): This is a greyish–yellowish cineritic pyroclastic deposit, with an organization ranging from massive and chaotic to stratified. The framework is composed of lava lithics, scoria, and crystals. The geometry of the deposit is variable depending on palaeotopography: in palaeovalley areas, the thicknesses reach 15 m, while in topographic palaeohigh areas, they do not exceed 1 m. The formation is the result of a large-volume phreatomagmatic eruption with deposition mechanisms of pyroclastic flows originating from the Alban Hills Volcano (Middle Pleistocene (561 ± 1 ka)) [24].
Tufo del Palatino (PTI): Composed of massive pyroclastic products, this is lithoid and semicoherent. The cineritic matrix is predominant and is composed of slag, leucite crystals and glassy elements altered to zeolitic minerals, giving the formation its partially lithoid character. The skeletal structure is less abundant and is composed of scoriae, holocrystals, and, in some levels, accretionary lapilli with a concentric structure called ‘pisolites’. The maximum thickness of the entire formation is 10 m. This deposit is the result of a phreatomagmatic ignimbritic eruption of the Alban Hills Volcano (Middle Pleistocene (528 ± 1 ka)) [24,25,26].
Tufi Terrosi: This consists of altered and partly pedogenic tuff deposits of uncertain origin between the volcanic complex of the Alban Hills and that of the Sabatini. Overall, this material is present in discontinuous levels of relatively small thickness, interspersed with other volcanic deposits present in the area. The first appearance of the Tufi Terrosi is recorded immediately below the “Tufo di Tor de’ Cenci”, while they end just above the “Pozzolane Nere” Formation.
Pozzolane Rosse (RED): This is made up of massive, chaotic, semicoherent, red to dark-grey pyroclastic deposits. The matrix is made up of coarse ash, within which there are red scoria up to 20 cm in diameter, as well as minor lithics (lava and metamorphosed sediments), also up to 20 cm in diameter. The upper part of the formation has gas pipes (outgassing structures). It presents a scoriaceous matrix with little cineritic fraction, slag, lava lithics, thermo-metamorphosed sediments and abundant crystals of leucite, clinopyroxene, and biotite. Its thickness can reach up to 25 m. It can be traced back to a pre-calderic ignimbrite of the Alban Hills Volcano (Middle Pleistocene p.p.) [24].
Conglomerato Giallo (FTR1): This is part of the “Fosso del Torrino Formation” (FTR) and consists of sandy-gravel volcanoclastic deposits. They usually occur in banks but are poorly stratified. These deposits consist of rounded slags, heterometric volcanic lithics, and crystals. It has erosion surfaces and weak alteration within it. The unit can reach a thickness of 37 m, confined in a depression at the roof of the Pozzolane Rosse in the NW sector of the Alban Hills Volcano. This unit is the result of a succession of lahars with hyperconcentrated flow and debris flow mechanisms, passing laterally to fluvial deposits (Middle Pleistocene p.p.) [24].
Pozzolane Nere (PNR): This is a black pyroclastic unit, exhibiting massive and chaotic facies, local gas pipes, and a scoriaceous–cineritic matrix, in which slag, lava lithic, holocrystalline, and sedimentary deposits are dispersed. At the roof, there is a lithoid zone due to zeolithization or, locally, massive debris-flow-type volcanoclastic deposits deriving from the reworking of the unit. The geometry of the formation is tabular, and its maximum thickness is 20 m. It is referable to a large volume ignimbritic eruption of the Alban Hills Volcano (Middle Pleistocene p.p.) [24].
Formazione di Villa Senni (VSN): This is referable to the last large-volume eruption of the Alban Hills Volcano, which determined the current shape of the volcano caldera. It consists of two ignimbritic units:
Tufo Lionato (VSN 1): This is made up of massive, chaotic, pyroclastic tuffaceous deposits, lithoid due to zeolithization, with a matrix that is both cineritic, at the base, and coarse, on the roof. The maximum thickness is up to 25 m and appears as a rather regular and continuous bank in the subsoil. Flames can be observed locally at the roof of the deposits. In the paleovalleys or distal zones, gas pipes, laminations, and log marks are present.
Pozzolanelle (VSN 2): This is made up of massive pyroclastic deposits with a coarse-lapilli matrix. Rich in crystals, it contains large slag and is incoherent. The maximum thickness is 30 m. Gas pipes may be present (Middle Pleistocene p.p.) [24].
Alluvial Deposits (SFTba): This made up of alluvial materials deposited within the valleys by left-bank tributaries of the Tevere River. They have a grain size ranging from sandy to clayey silt, with lenses of coarser material inside. The base of the deposit is buried within the volcanic material upstream, while downstream, it is buried within the Pliocene clays. The considerable thickness (about 30 m) was due to the intense erosive phase of the Almone River during the Wurm glaciation dated about 20,000 years ago, which caused an impressive lowering of the eustatic level of the sea, modifying the basins of rivers accordingly (Holocene) [24,25].
Anthropogenic Deposits and Archaeological Levels (h): These comprise heterogeneous deposits composed of fragments of masonry, bricks, ceramics, pottery, remains of buildings constructed in the historical age, and materials used for road and railway embankments, earthworks, and fills. The granulometric characteristics, geometry, and thickness can be very variable. They usually have a gravelly–sandy grain size, with a silty–clayey matrix or pozzolanic nature. The thickness can reach up to 30 m but usually in the area of the historical center of Rome, and in general, in many urbanized areas, the thickness of these deposits is 10 m (Holocene).

2.2. Hydrogeological Setting

The Caffarella Valley belongs to the Alban Hills Hydrogeological System (Figure 1, [27]).
The Alban Hills volcanic products rest on a low-permeability sedimentary substrate that acts as a regional-scale aquiclude (Marne Vaticane) for the basal groundwater hosted in the volcanic aquifers [8,28]. Two main groundwater flow systems were identified in the Alban Hills volcanic domain: an upper aquifer (the “upper Alban sector aquifer”) and a lower aquifer (the “regional aquifer”) [8]. In the Caffarella Valley, the deep regional aquifer, hosted within the Pozzolane Rosse Formation, appears to be separated from the upper aquifer by the Tufo Lionato member within the Villa Senni Formation. This layer is characterized by low permeability due to zeolitization processes [28], assuming the role of an aquitard. In specific areas, the presence of paleosols between different formations can give rise to a confined aquifer. The limit of the upper aquifer can be identified near Via dell’ Almone, which represents the upstream limit of the area investigated in this study [8].
Due to the average low elevation of the aquiclude top surface, the volcanic deposits have a considerable thickness, and groundwater is directed toward the Tevere, Aniene, and Fosso di Malafede rivers without encountering significant barriers to their flow [8]. However, the top surface of low-permeability Plio-Pleistocene clays is articulated into depressions and structural reliefs, locally favoring the emergence of groundwater through springs often located along rivers and thus mixing with surface water [8]. This is what occurs along the Caffarella Valley, where “Marrana destra” and “Marrana sinistra”, collecting the contribution of springs located on their hydrographic right and left banks, respectively, feed the course of the Almone River. The occurrence of perennial springs with considerable discharge was already known in Roman times: in the 2nd century AD, in fact, Herod Atticus exploited this resource to build a nymphaeum (e.g., monument consecrated to the nymphs of springs) inside the cave of the nymph Egeria [8].
The following hydrogeological complexes can be recognized in this area, characterized by different variable permeability degrees and by a different groundwater potential [27]:
Sandy–Clayey Basal Complex (Monte Vaticano—MVA): This is made up of over-consolidated, sandy clays; it has an irregular surface due to pre-volcanic tectonics. It acts as an aquiclude due to its considerable thickness and low relative permeability.
St. Cecilia Formation Complex: This is characterized by the St. Cecilia Formation (CIL). Due to the presence of gravel bodies located at the base of the complex, it can be subdivided into the sandy–silty and the gravel lithofacies. The former is composed of silty clay and sandy sediments, while the latter features the conglomeratic deposits. In general, it is possible to attribute a high degree of relative permeability to the basal gravelly facies [8], but due to the greater thickness of the sandy–silty lithofacies, a low degree of relative permeability can be attributed to the “St. Cecilia Formation” Complex.
“Tufi Terrosi” Complex: This is made up of partly pedogenized deposits of uncertain origin between the Alban Hills and Sabatini Volcanic Complexes, linked to a series of fallout products in distal and reworked facies, found from the first phase of pyroclastic activity until the end of it. It first appears immediately below the “Tufo di Tor de’ Cenci”, while they end just above the “Pozzolane Nere”. The complex presents lateral and vertical variations affecting permeability, which is generally low, making it a complicating element for water circulation within the more permeable volcanic deposits.
Alban Basal Volcanic Complex: This includes low-permeability formations such as “Tufo di Tor de’ Cenci” (TDC) and “Tufo del Palatino” (PTI), which act as aquitards supporting the overlying aquifers [8].
Medium–High-Permeability Alban Volcanic Deposit Complex: This includes volcanic deposits with medium–high permeability, such as “Pozzolane Rosse” (RED), “Conglomerato Giallo” (FTR1), “Pozzolane Nere” (PNR), “Pozzolanelle” (VSN2), and deposits with medium-to-low permeability such as the “Tufo Lionato” (VSN1) of the Villa Senni Formation. This complex hosts the regional aquifer and feeds the sources of the left sector of the Tevere River, including the Caffarella Valley, while the zeolitized “Tufo Lionato”, when not fractured or perforated, acts as an aquitard for the upper aquifer of the Albano sector.
Alluvial Deposit Complex: This is represented by the Almone alluvial deposits, in connection with surface water bodies. It is a very heterogeneous complex, made up of different levels of sands, sandy silts and gravels, with high horizontal and vertical heteropies. It has a degree of permeability that can be considered medium, as it is greater than the sandy–clayey basal complex, which, as already mentioned, acts as an aquiclude, but less than the medium–high-permeability Alban volcanic deposit complex, which hosts the aquifer.
Anthropogenic Deposit Complex: This consists of modern fill and archaeological levels, with water circulation of little hydrogeological significance but potential interference with the urban context. Permeability varies among several types of deposits constituting the complex, but on average, it is considered moderate.
The Almone River and the springs that flow in the Caffarella Valley are characterized by almost neutral and oxygenated water with an electrical conductivity of approximately 900 μS/cm [29]. The water is located between the bicarbonate–alkaline earth facies and the bicarbonate–alkaline facies [29].
The radon activity concentration in the groundwater ranges from 53 to 240 Bq L−1 [30,31], but significant levels (11 Bq L−1) were also detected in river water [31] at the location of station 6A (this work).

3. Materials and Methods

To carry out a detailed study of the course of the Almone River, discharge measurements, chemical–physical data and water radon concentrations were collected along the river. Data were recorded during three seasonal campaigns: the summer campaign, between 10 and 12 June 2024; the autumn campaign, on 13 November 2024; and the winter campaign, on 17 and 18 March 2025.

3.1. Flow Measurements with Electromagnetic Induction Current Meters

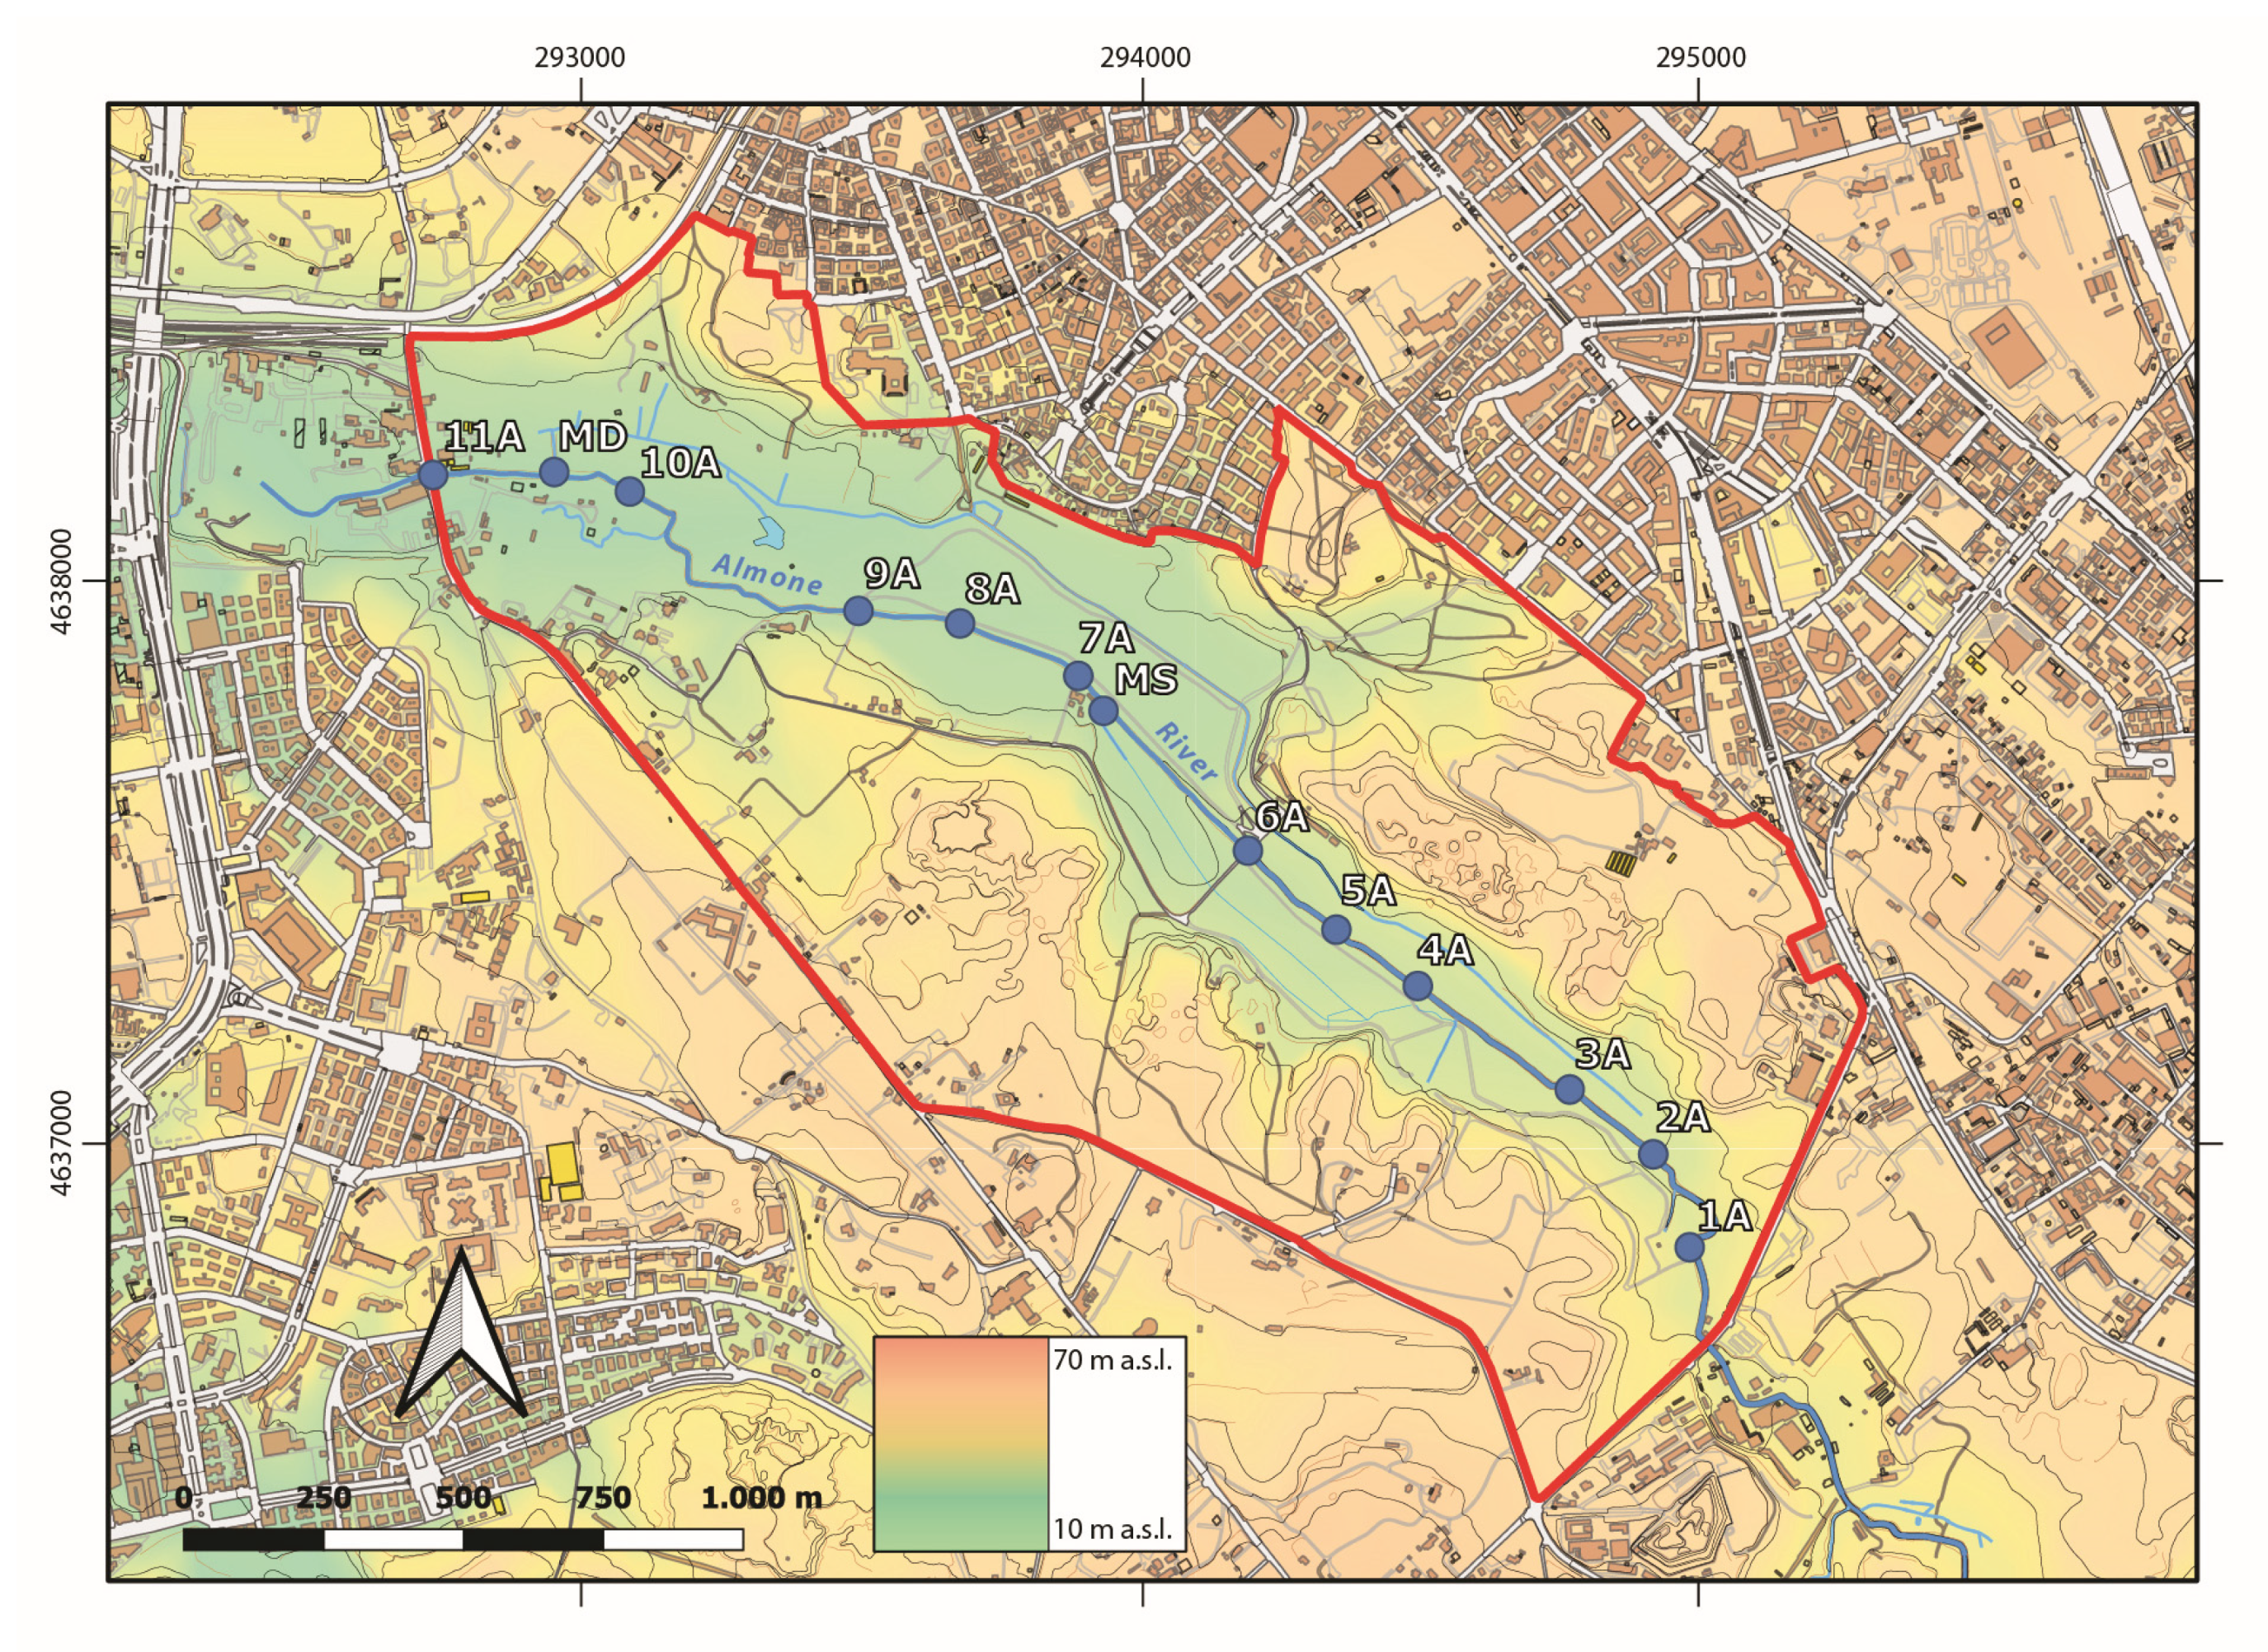
In order to analyze in detail the discharge variation of the Almone River in the Caffarella Valley, 11 discharge measurement sections were identified along the riverbed, approximately 270 m from one another. At these points, serial flow measurements were carried out and geochemical data were collected. Discharge measurements were also taken at the confluence point of two tributaries (“Marrane”) into the Almone river, bringing the total number of survey points to thirteen.
The tributaries (specifically called “Marrana destra” and “Marrana sinistra”) are channels, designed to reclaim the original marshy area. Currently, they convey water from overflow springs (occurring along both their hydrographic right and left bank) directly into the Almone River. Measuring the flow rate of the two “Marrane” just before their confluence makes it possible to estimate the total flow rate of the springs in the valley.
The calculation of the flow rate (Q) of a watercourse was based on the following relation:
Q = Svm
where S is the area of the measurement section and vm is the average current velocity.
To determine these parameters with sufficient accuracy, an electromagnetic induction hydrometric reel (OTT Hydrometrie, Nautilus C2000, Sensa Z 300, Sterling, VA, USA) was used for the first campaign and OTT MF Pro (Sterling, VA, USA) current meter in the second one. The first instrument measures the velocity of water flow both at depth and at the free surface, with a margin of error of about 10%, while the second has one of about 2%.

3.2. Geochemical Determination

The temperature, electrical conductivity, and pH of river water in the October 2024 and March 2025 surveys were measured using a pH/EC/DO multi-parameter probe, model HI 98194, produced by Hanna instruments Italia Srl, Padova, Italy.
River water was sampled for radon analyses using 660 mL Polyethylene Terephthalate (PET) bottles, taking care not to lose gas during sampling. The choice of PET bottles was due to the negligible loss of radon from water during storage compared to other plastic containers.
Radon in river water was analyzed within one or two days from collection, considering the decay that occurred between sampling and measurement. A RAD7 radon monitor (Durridge Company Inc., Billerica, MA, USA) coupled with a Big Bottle RAD H2O device was used for radon determination.
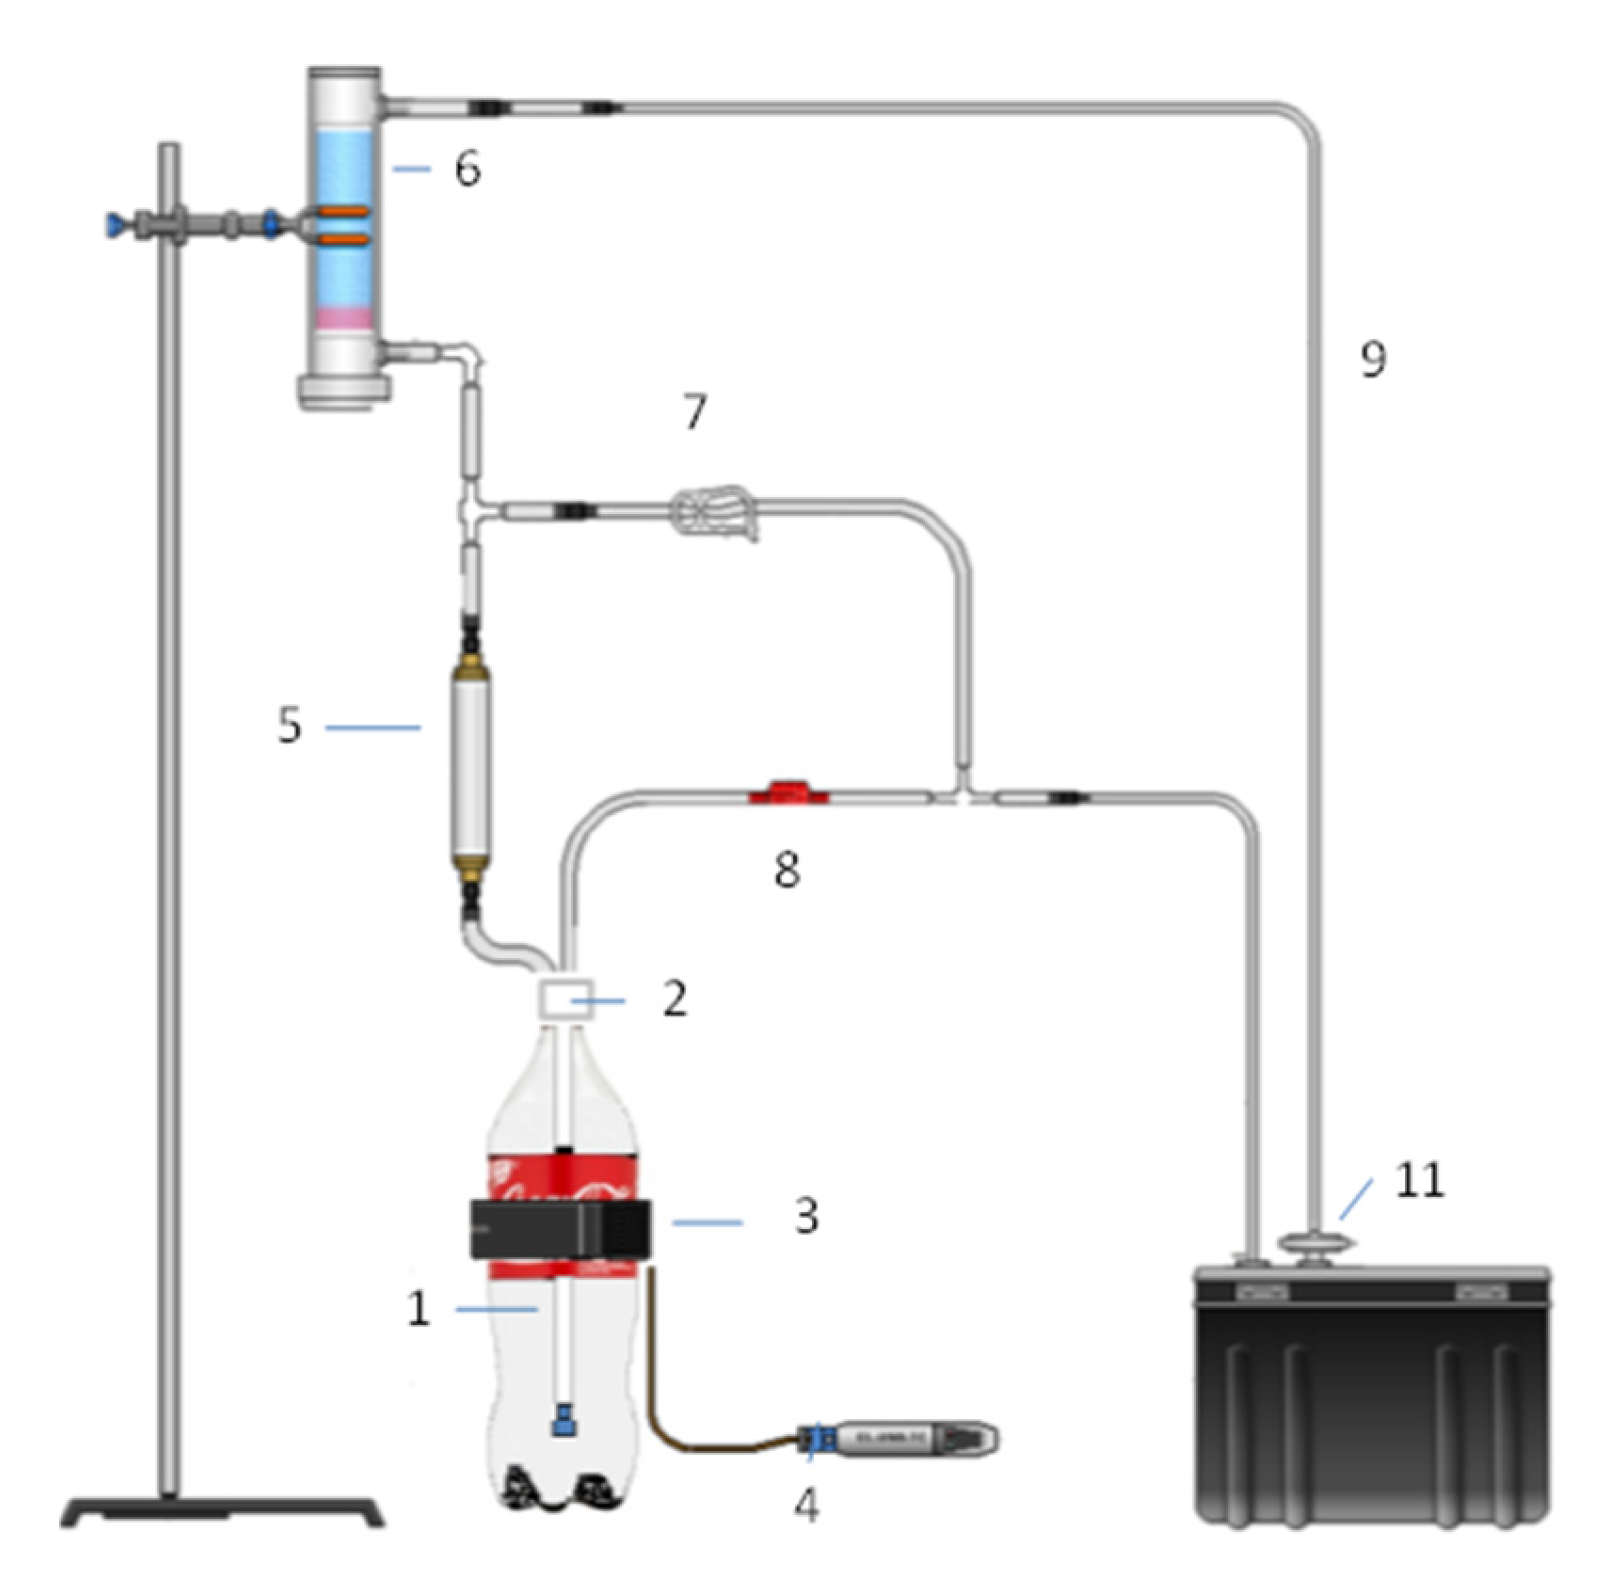
The Big Bottle RAD H2O (Durridge Company Inc., Billerica, MA, USA) consists of several components: a 660 mL glass bottle, an aeration system, a bubble trap, a temperature data logger, vinyl tubings, and a laboratory dryer and RAD7 monitor equipped with a solid-state, silicon electrostatic collector (Figure 2).
This detector measures the energy of radon daughters’ alpha particles (218Po in this case) and converts them into an electric signal. During the measurements, the built-in pump runs continuously, aerating the sample and delivering radon to RAD7. Two 15 min cycles were selected: during the first 15 min, the instrument responds to the growth of radon in the measurement chamber up to equilibrium and is ignored in the calculation; the second cycle is employed for determination.
The radon extraction efficiency was calibrated based on the average temperature of the air–water interface monitored approximately halfway up the bottle using the temperature data logger. Relative humidity and temperature data from probes located in the RAD7’s inner chamber were employed to correct for the influence of water molecules on the electrostatic collection efficiency of the silicon detector. This effect was amended using experimental equations derived from a specific test carried out in the radon chamber of Istituto Nazionale di Geofisica e Vulcanologia (INGV) [32].

4. Results

4.1. Hydrological Data

The location of the 13 river discharge measurement sections is reported in Figure 3. The river discharge data from the June 2024 and March 2025 surveys are reported in Table 1. Discharge values in June 2024 and March 2025 showed an increase between sections 1A and 2A but were approximately constant in sections 3A to 6A; then, discharge increased from sections 6A to 7A and from 10A to 11A, after the confluence of “Marrana Sinistra” (MS) and “Marrana Destra” (MD) streams, respectively. In the March survey, an increasing trend in discharge data is observed between section 6A and 11A.

4.2. Hydrochemical and Radon Data

Three campaigns for radon determination were carried out in June and October 2024 and March 2025 (Table 2). The temperature, electrical conductivity, and pH of the river water, collected only in the October 2024 and March 2025 surveys, are shown in Table 3.
The radon activity concentration ranged from 1.6 Bq L−1 (sites 10A and 11A in June 2024) to 22.9 Bq L−1 (site 1A in June 2024). Higher values were found upstream, while progressively decreasing activity concentrations were recorded downstream. Only in the March 2025 survey was an increase in radon measured at station 2A, in accordance with the river discharge data.
Slightly different radon values and spatial trends were recorded in the three surveys due to expected moderate seasonal variability [31] and gas sampling uncertainties in a shallow river [33], even if the March 2025 data are on average higher within the error range compared to the other two campaigns.
The contribution of the two small streams (MS and MD) flowing into the Almone River was almost negligible in terms of radon supply because average water radon concentration in the streams were 6.2 and 1.6 Bq L−1, respectively, and these values were consistent with radon levels in the main river just upstream and downstream of the confluences within a range of uncertainties due to both analytical and sampling methods.
The water temperature reflected the air temperature with an average of 20 °C in October 2024 and 18 °C in March 2025. Electrical conductivity varied between 817 and 873 μS cm−1 in October 2024 and 800 to 897 μS cm−1 in March 2025, whereas pH ranged from 6.27 to 7.53 in October 2024 and from 6.55 to 7.15 in March 2025. The values of pH gradually increased along the Almone River from stations 1A to 11A in both campaigns (Table 3).

5. Discussion

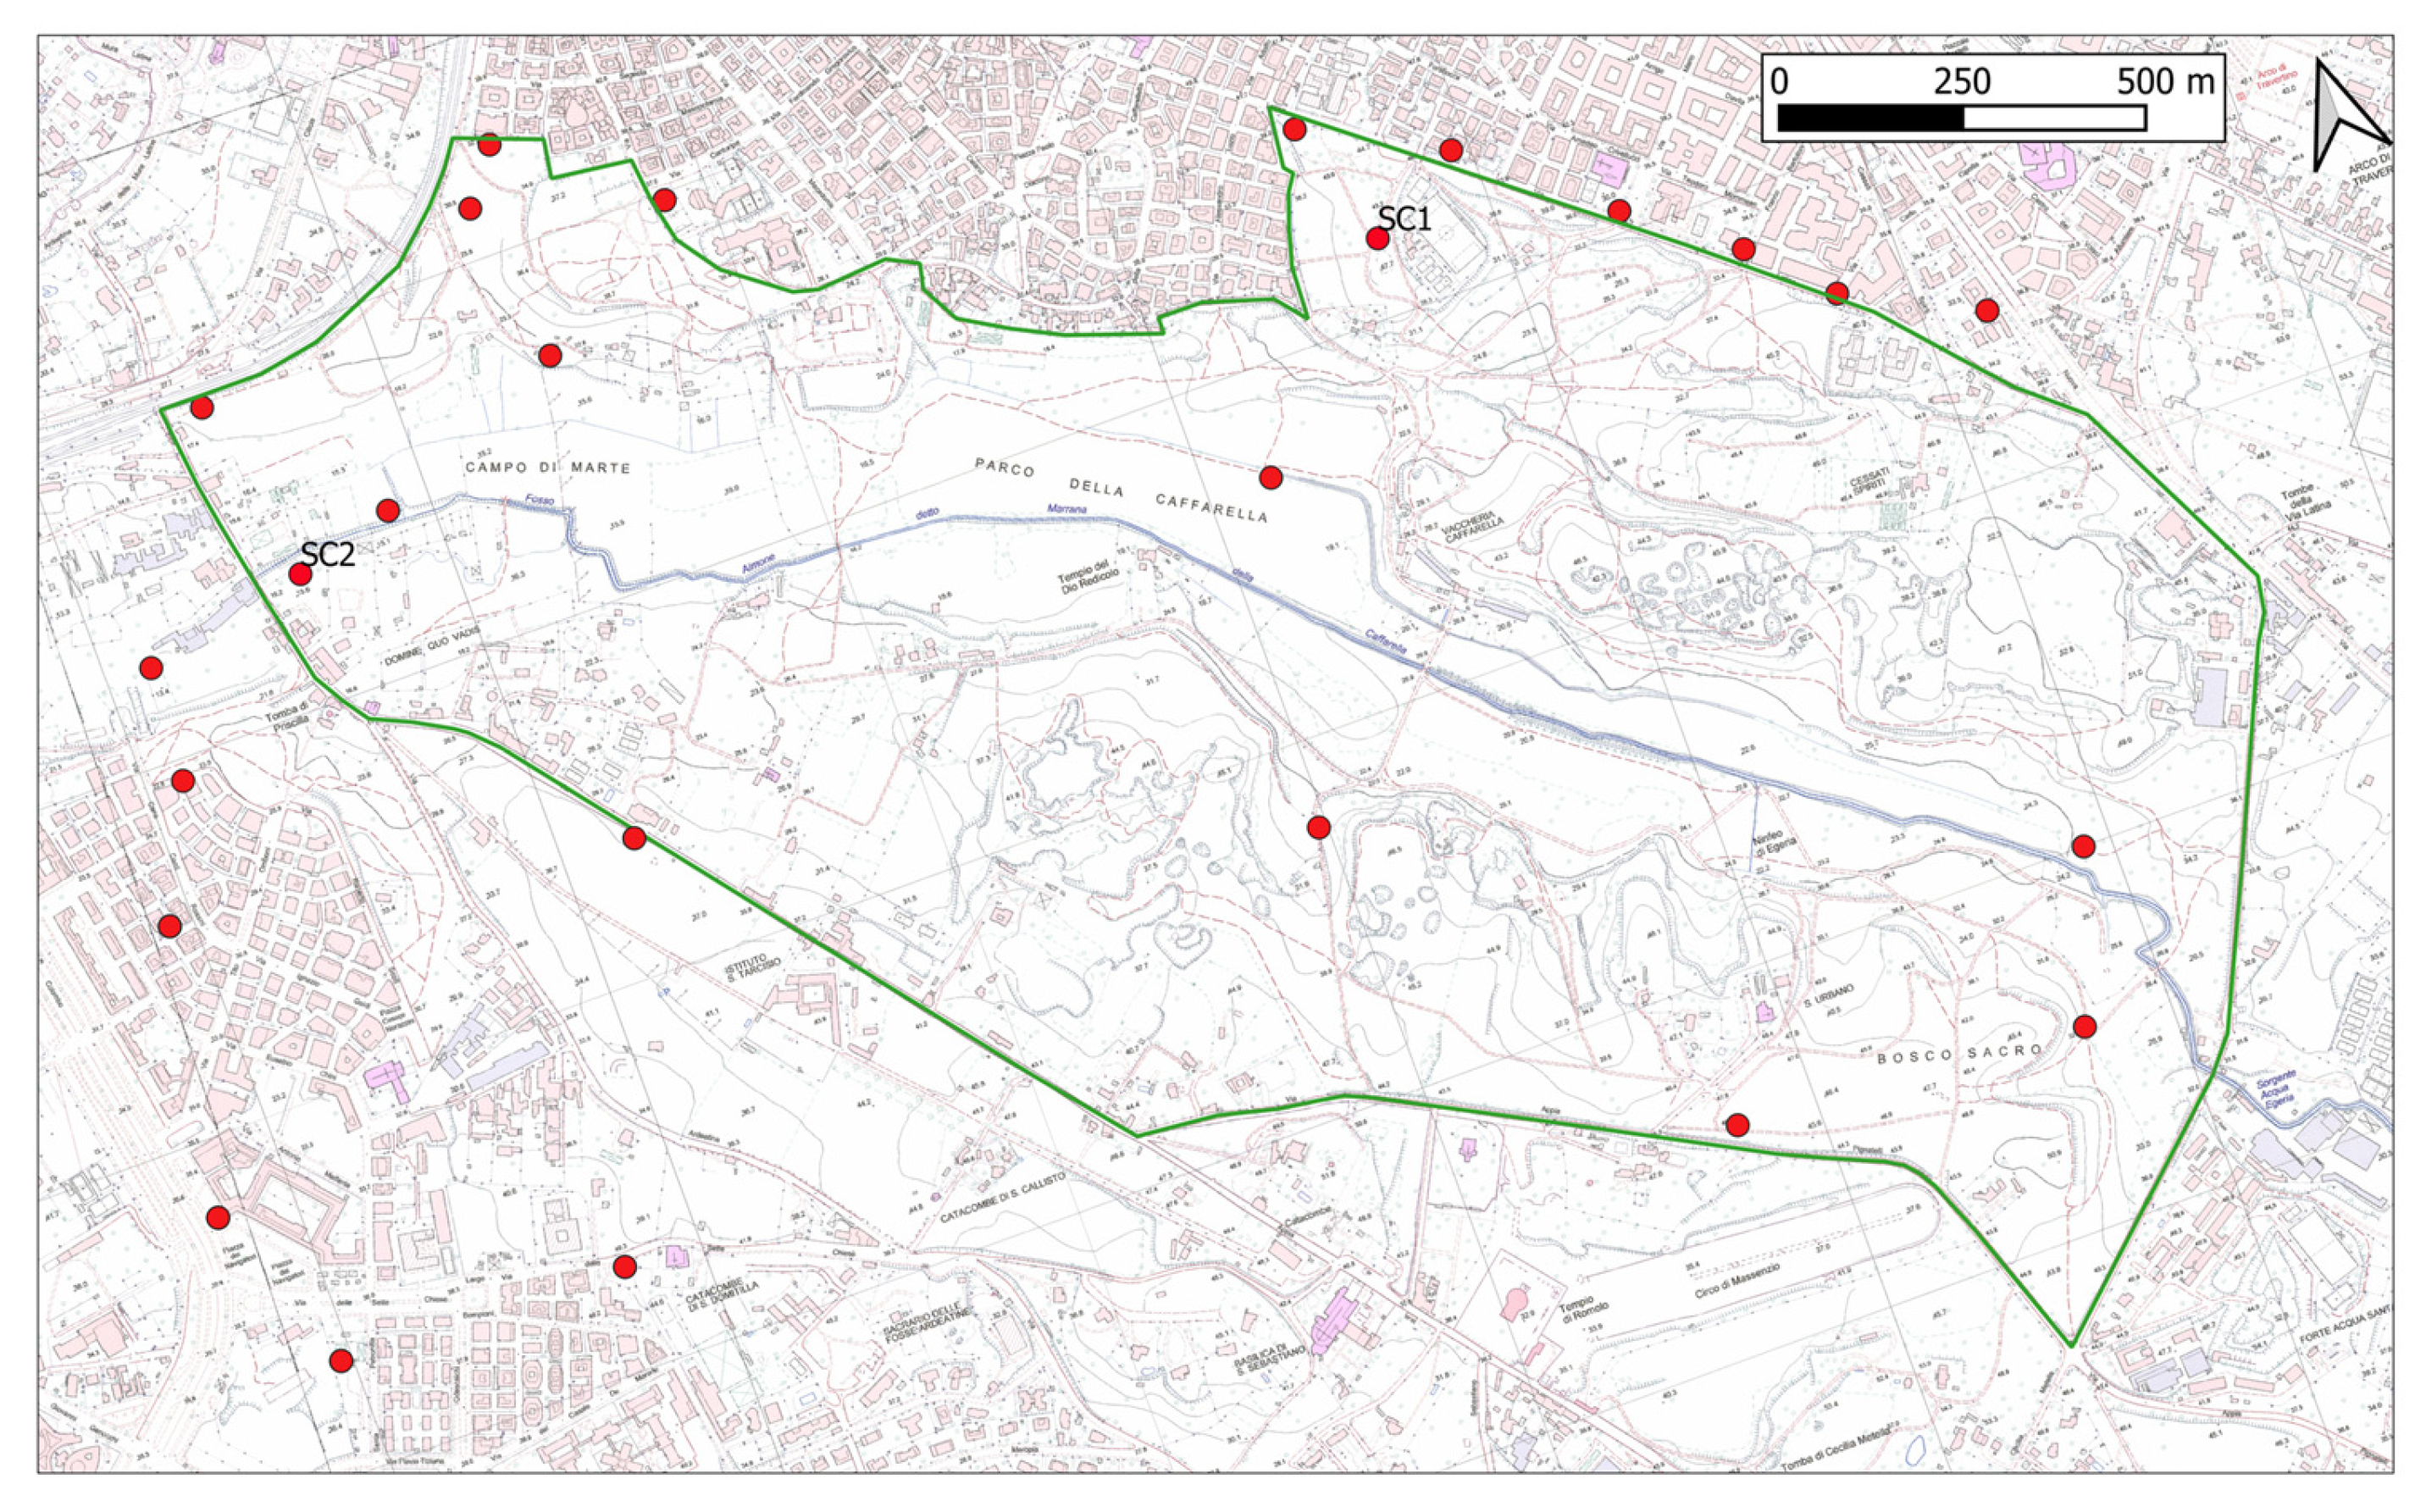
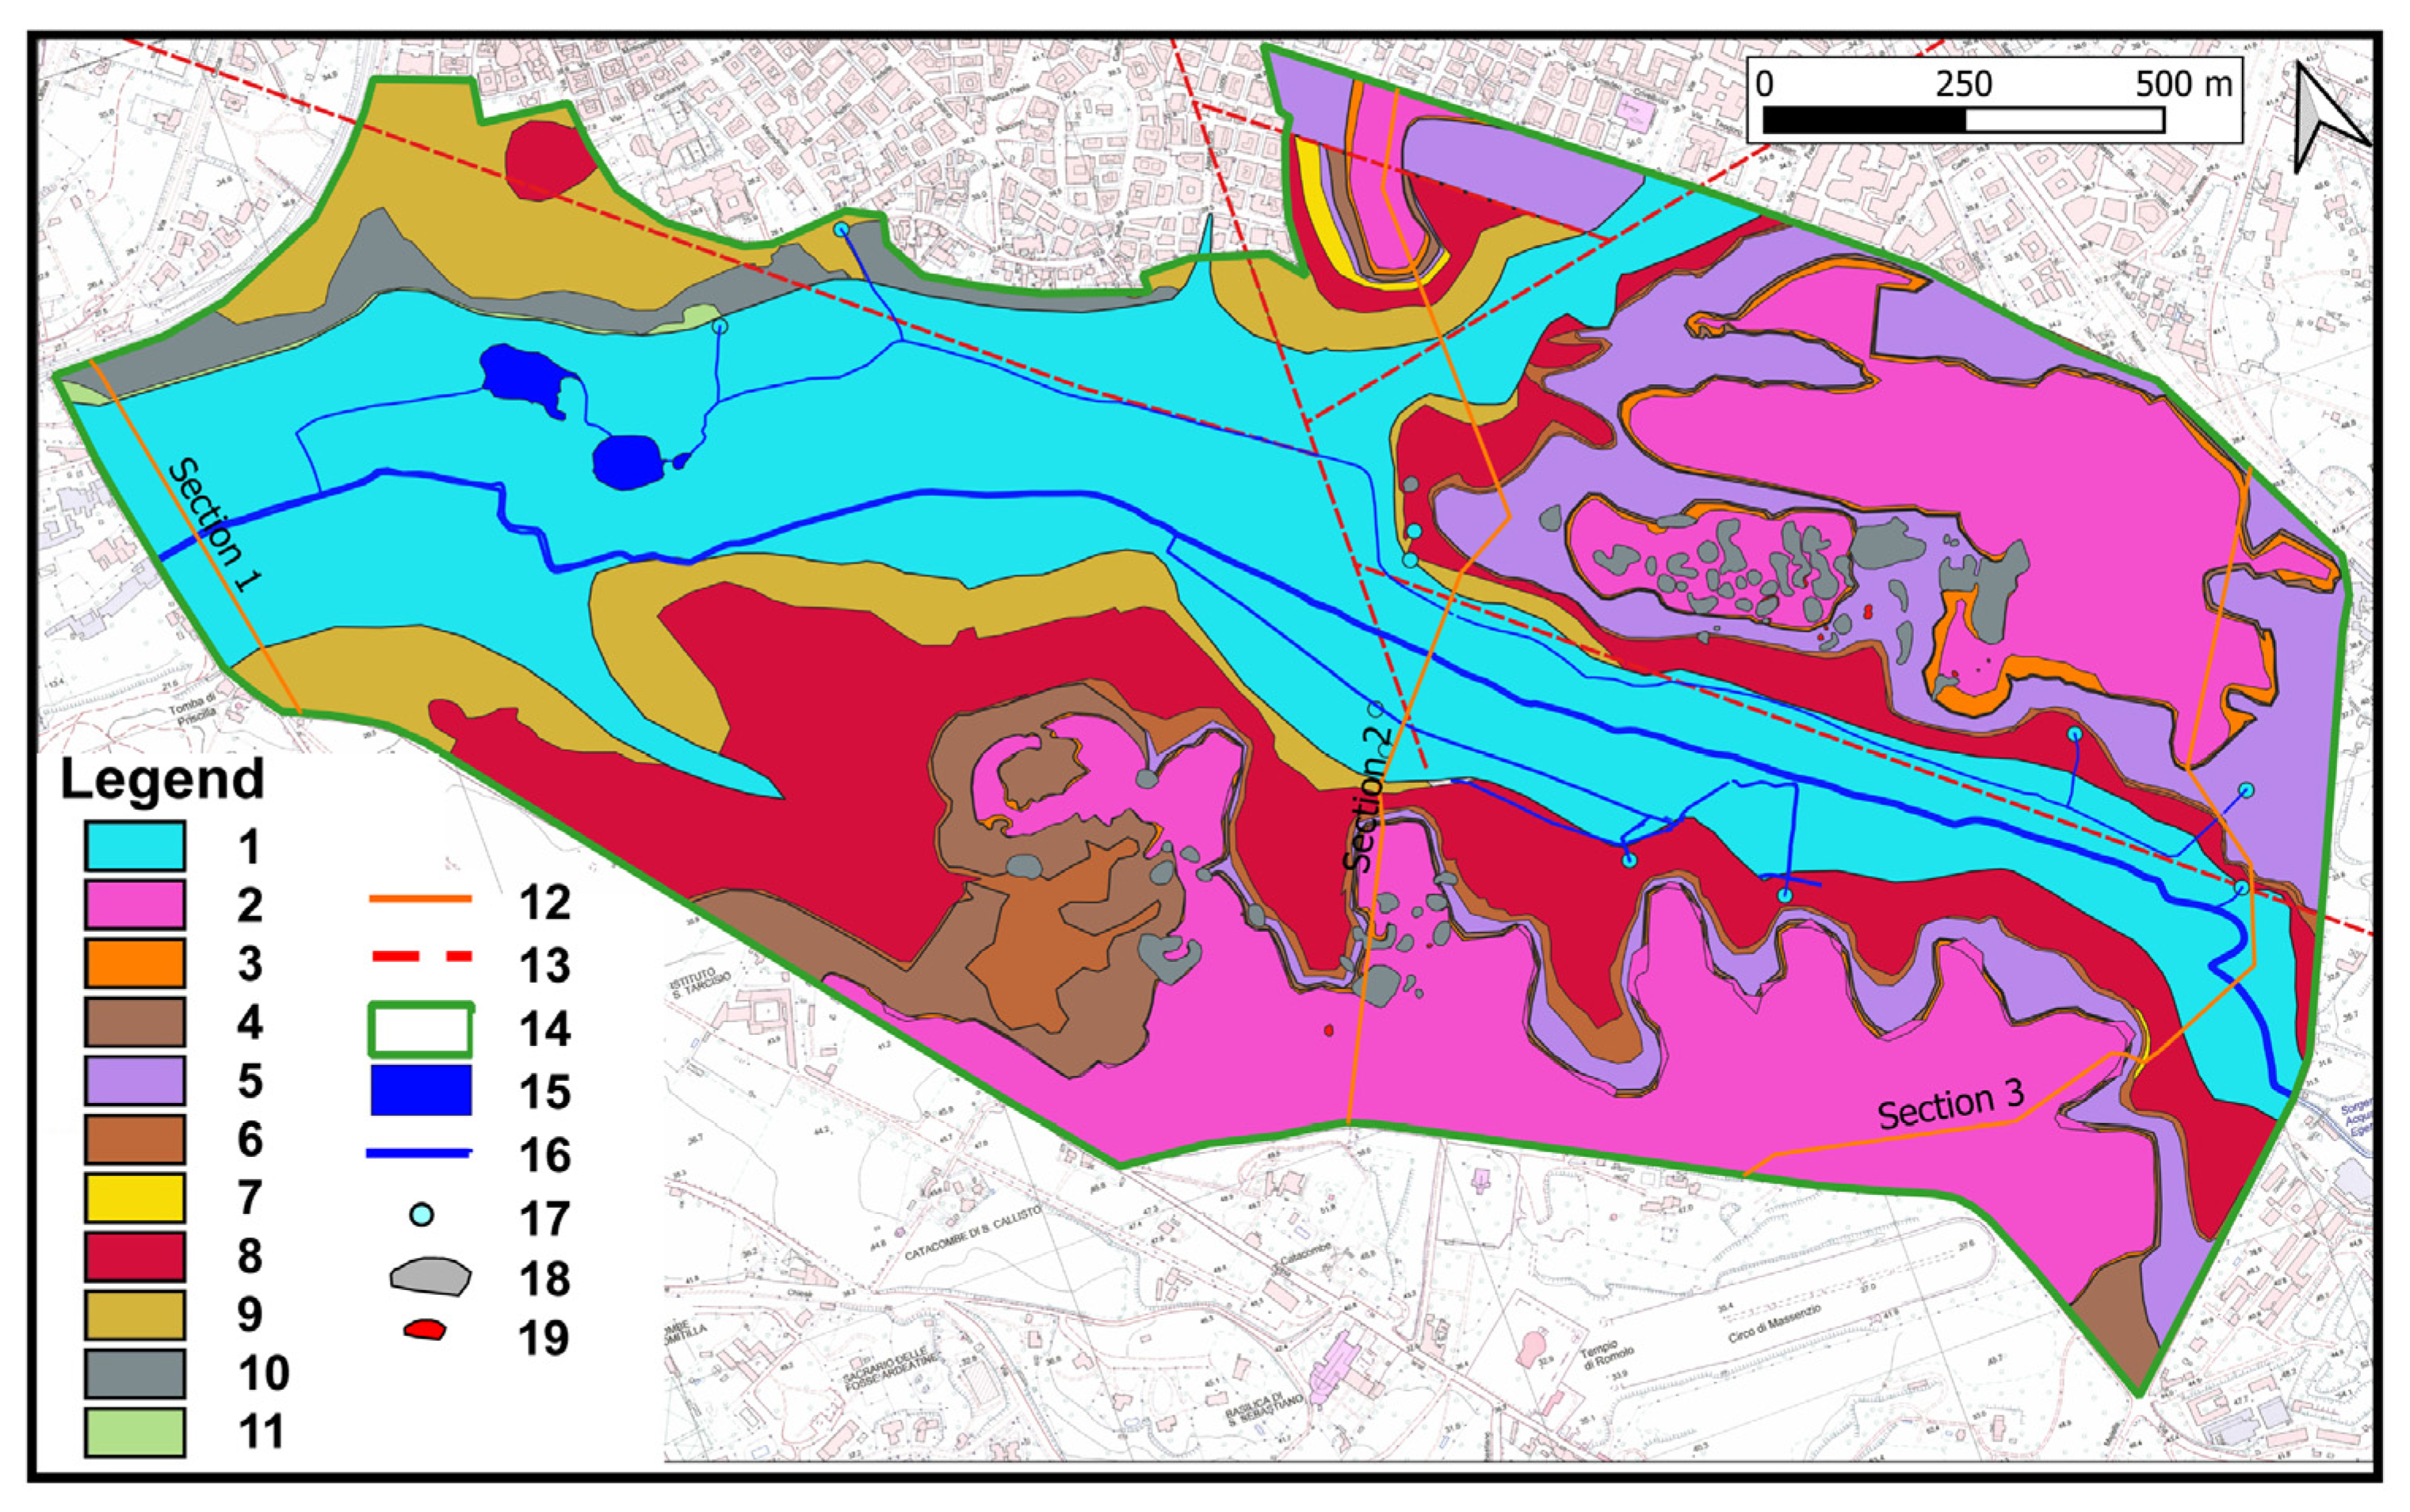
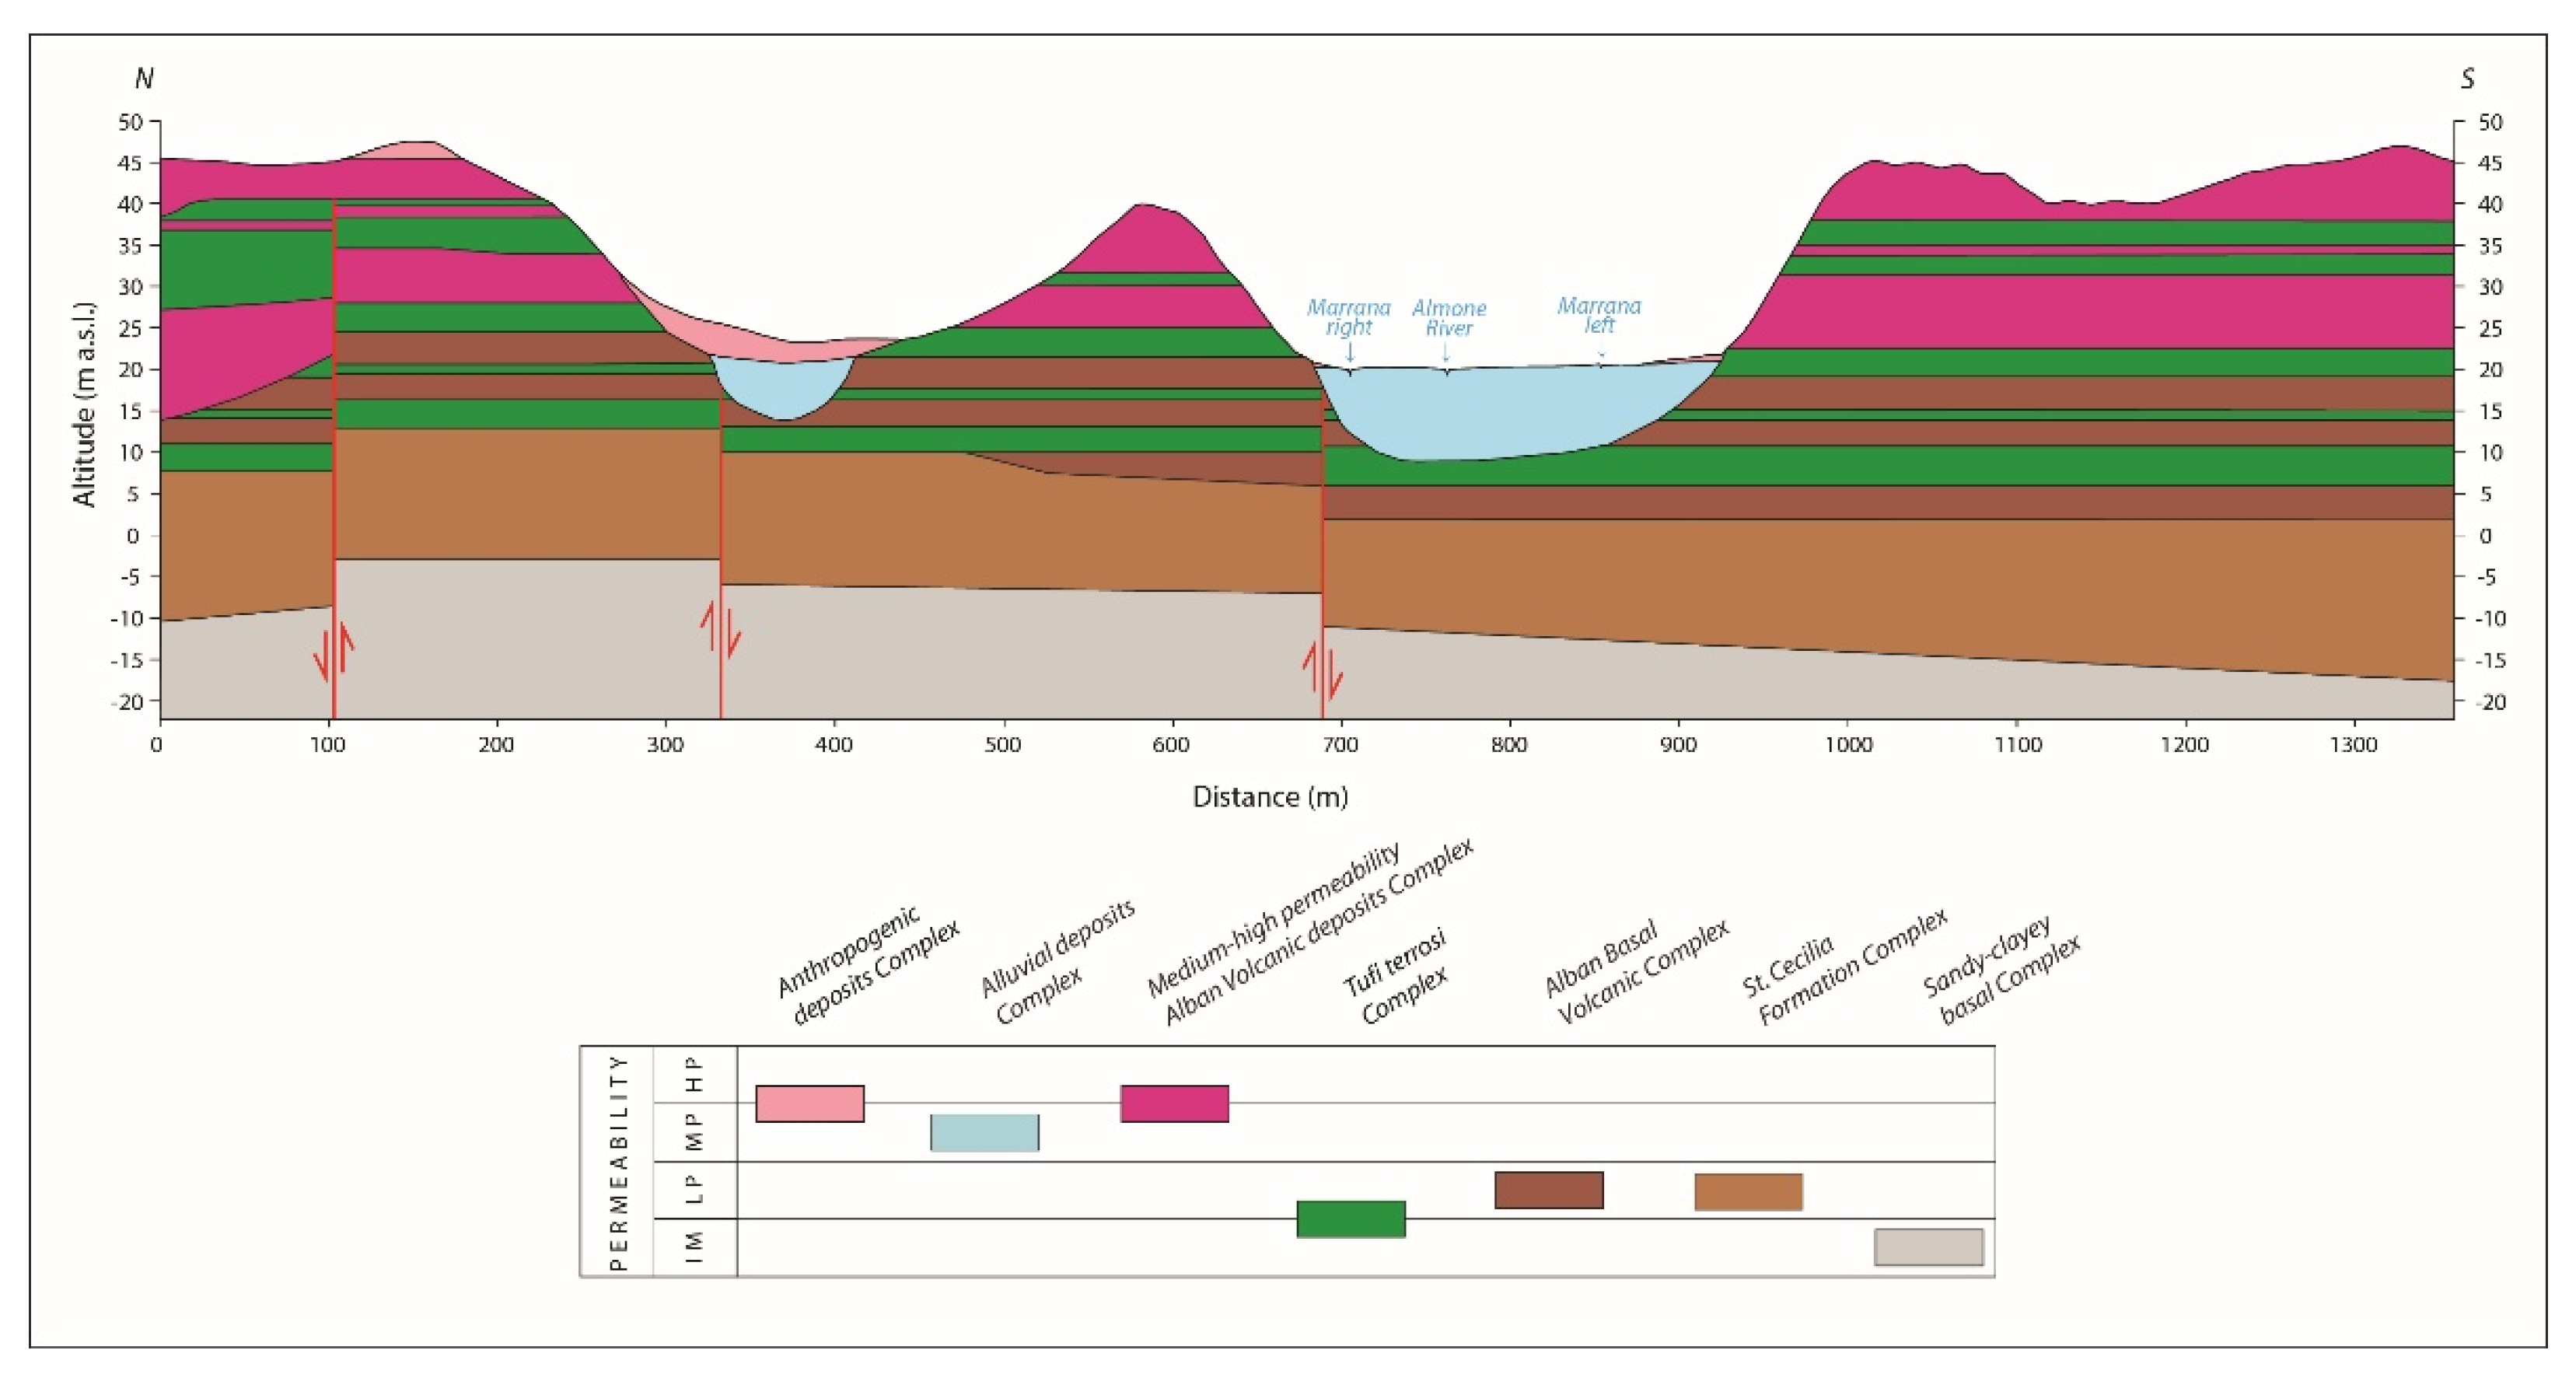
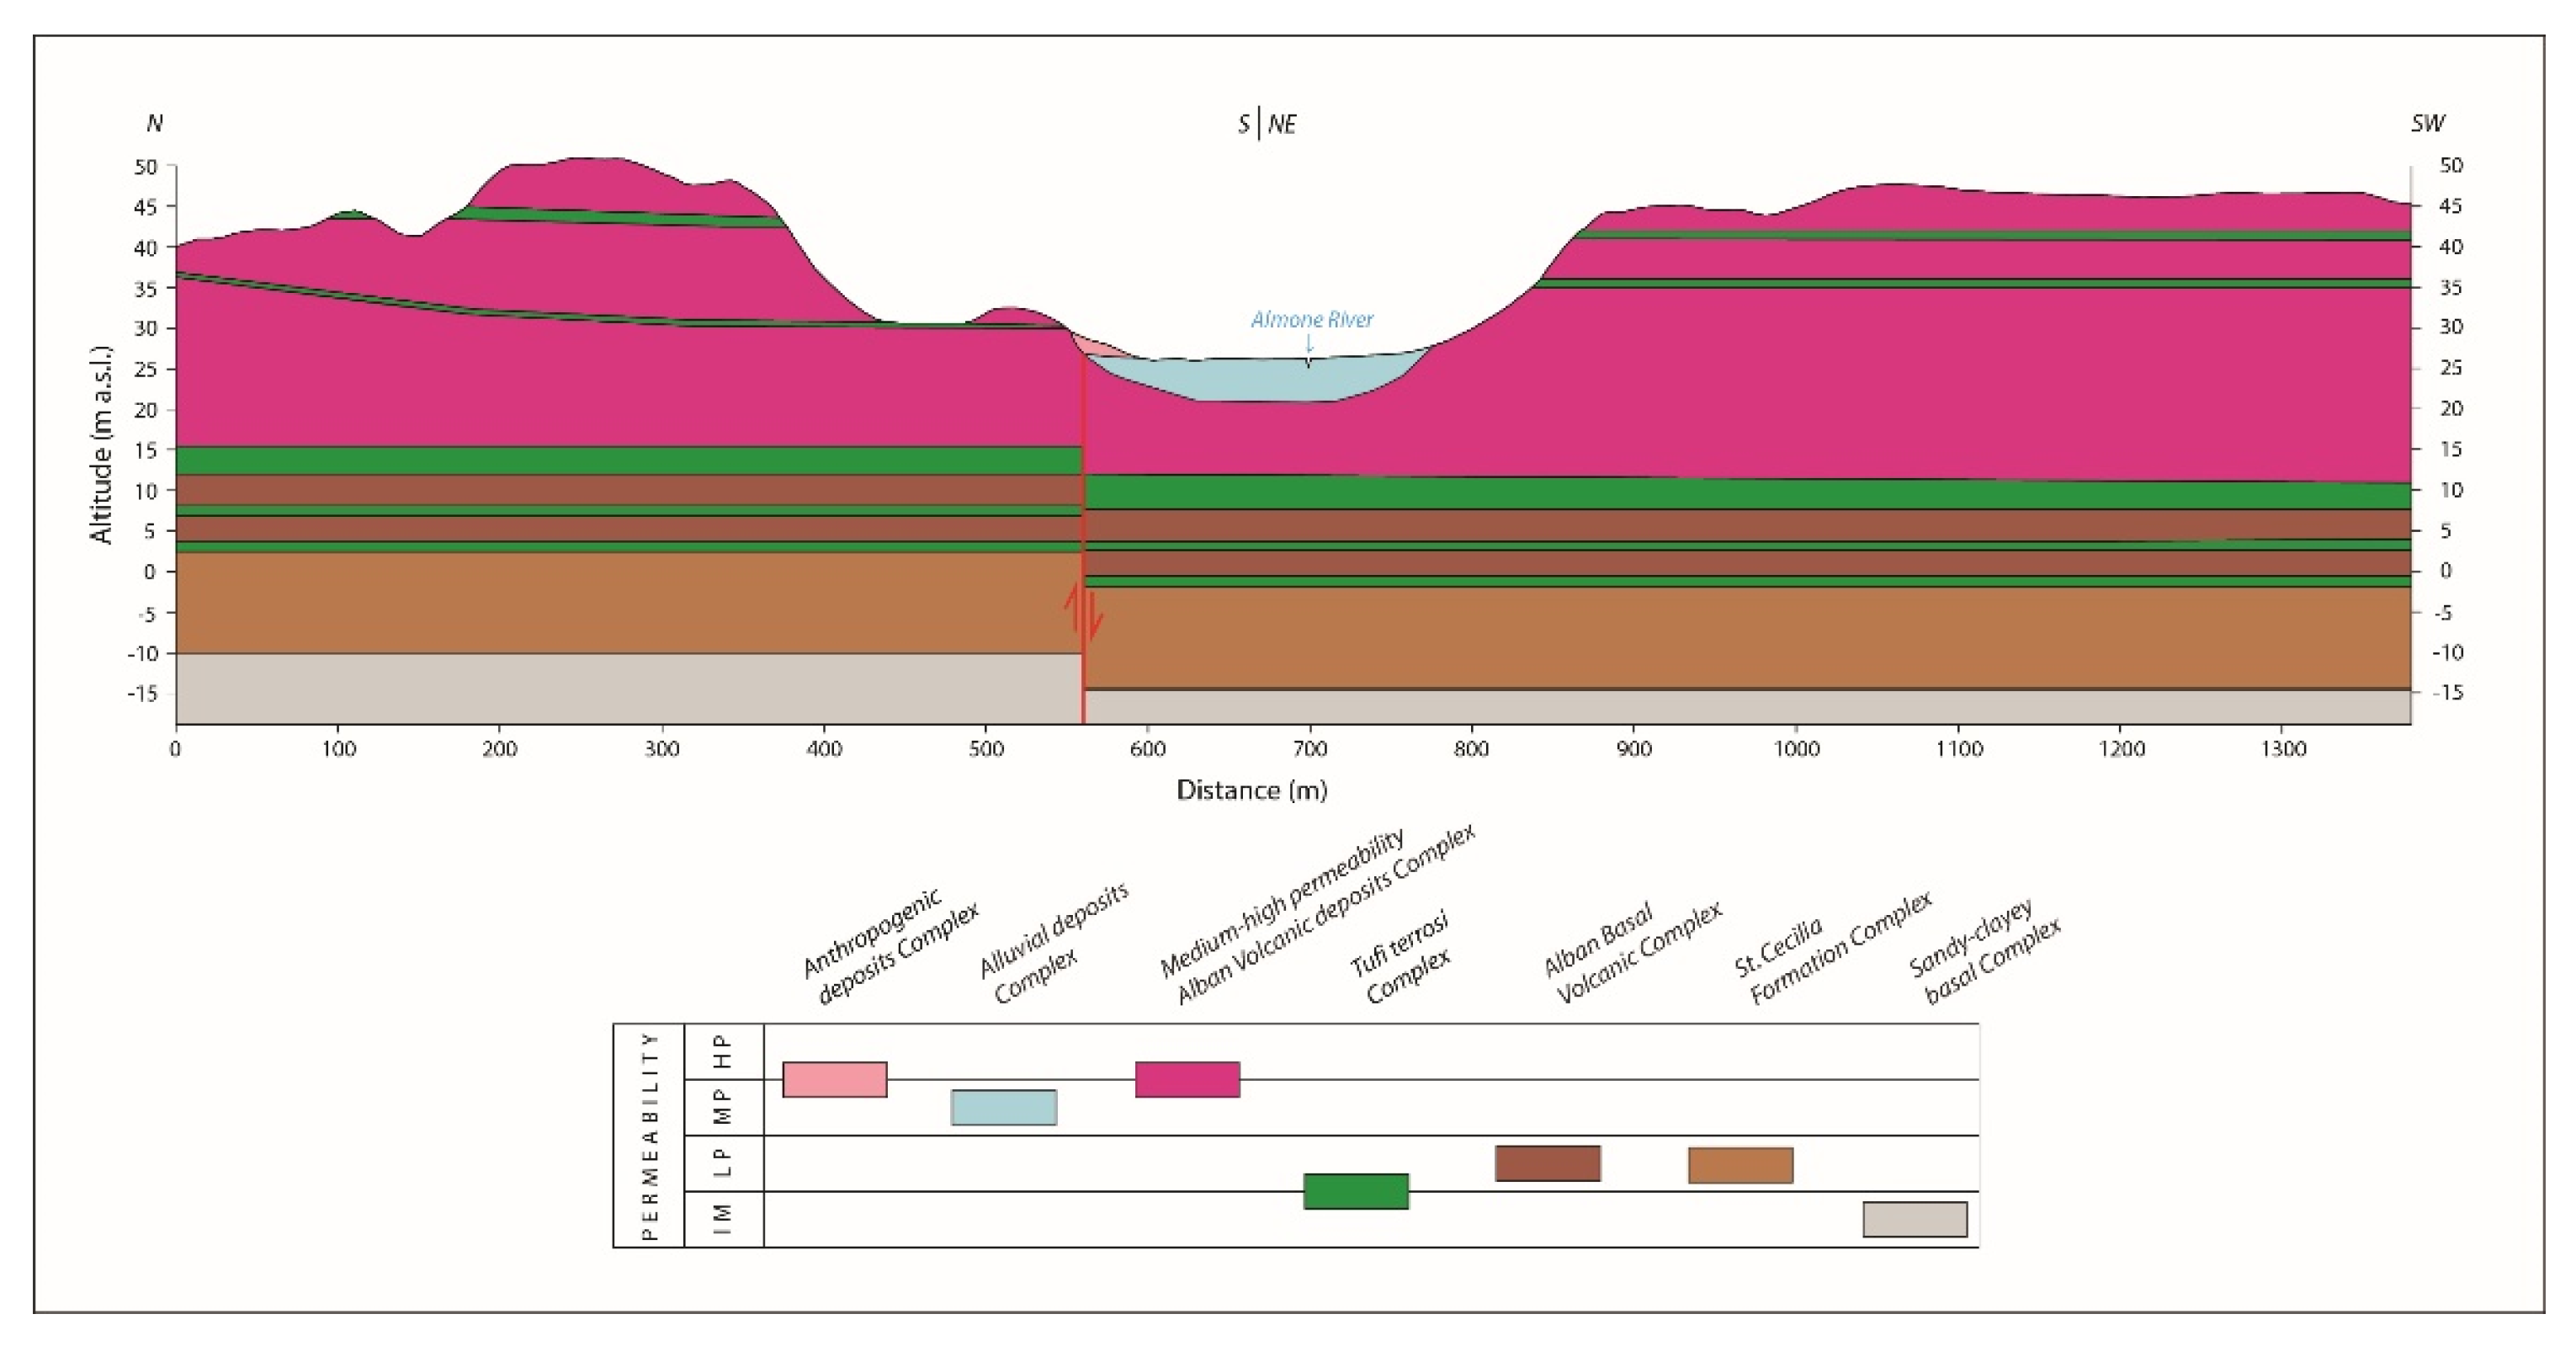
The analysis, focused on the interaction between the water table and the river in the Caffarella Valley, starts with examining the lithologies and stratigraphies of available geognostic surveys [34,35]. Figure A1 in Appendix A reports the location of these surveys. To support the analysis, an original detailed geological map based on a field survey at a 1:5000 scale (Figure 4, this study) and the ‘hydrogeological map of Rome’ [8] were used. These data, together with original hydrogeological cross-sections (Figure 5, Figure 6 and Figure 7), allowed the elaboration of a longitudinal hydrogeological profile along the riverbed of the Almone River (Figure 8).
The hydrogeological complexes in the study area (Figure 5, Figure 6 and Figure 7), above the regional aquiclude (sandy–clayey basal complex) have variable permeability: the S. Cecilia Formation (locally mainly clayey), the “Tufi Terrosi”, “Tufi di Tor de’ Cenci”, and “Tufi del Palatino” complexes act as aquitards, with a permeability higher only than that of the “Monte Vaticano” unit. The “alluvial deposit” complex, completely saturated and connected to the Almone River, has a permeability lower than the “medium–high-permeability Alban volcanic deposit” complex, due to the prevalence of clayey levels.
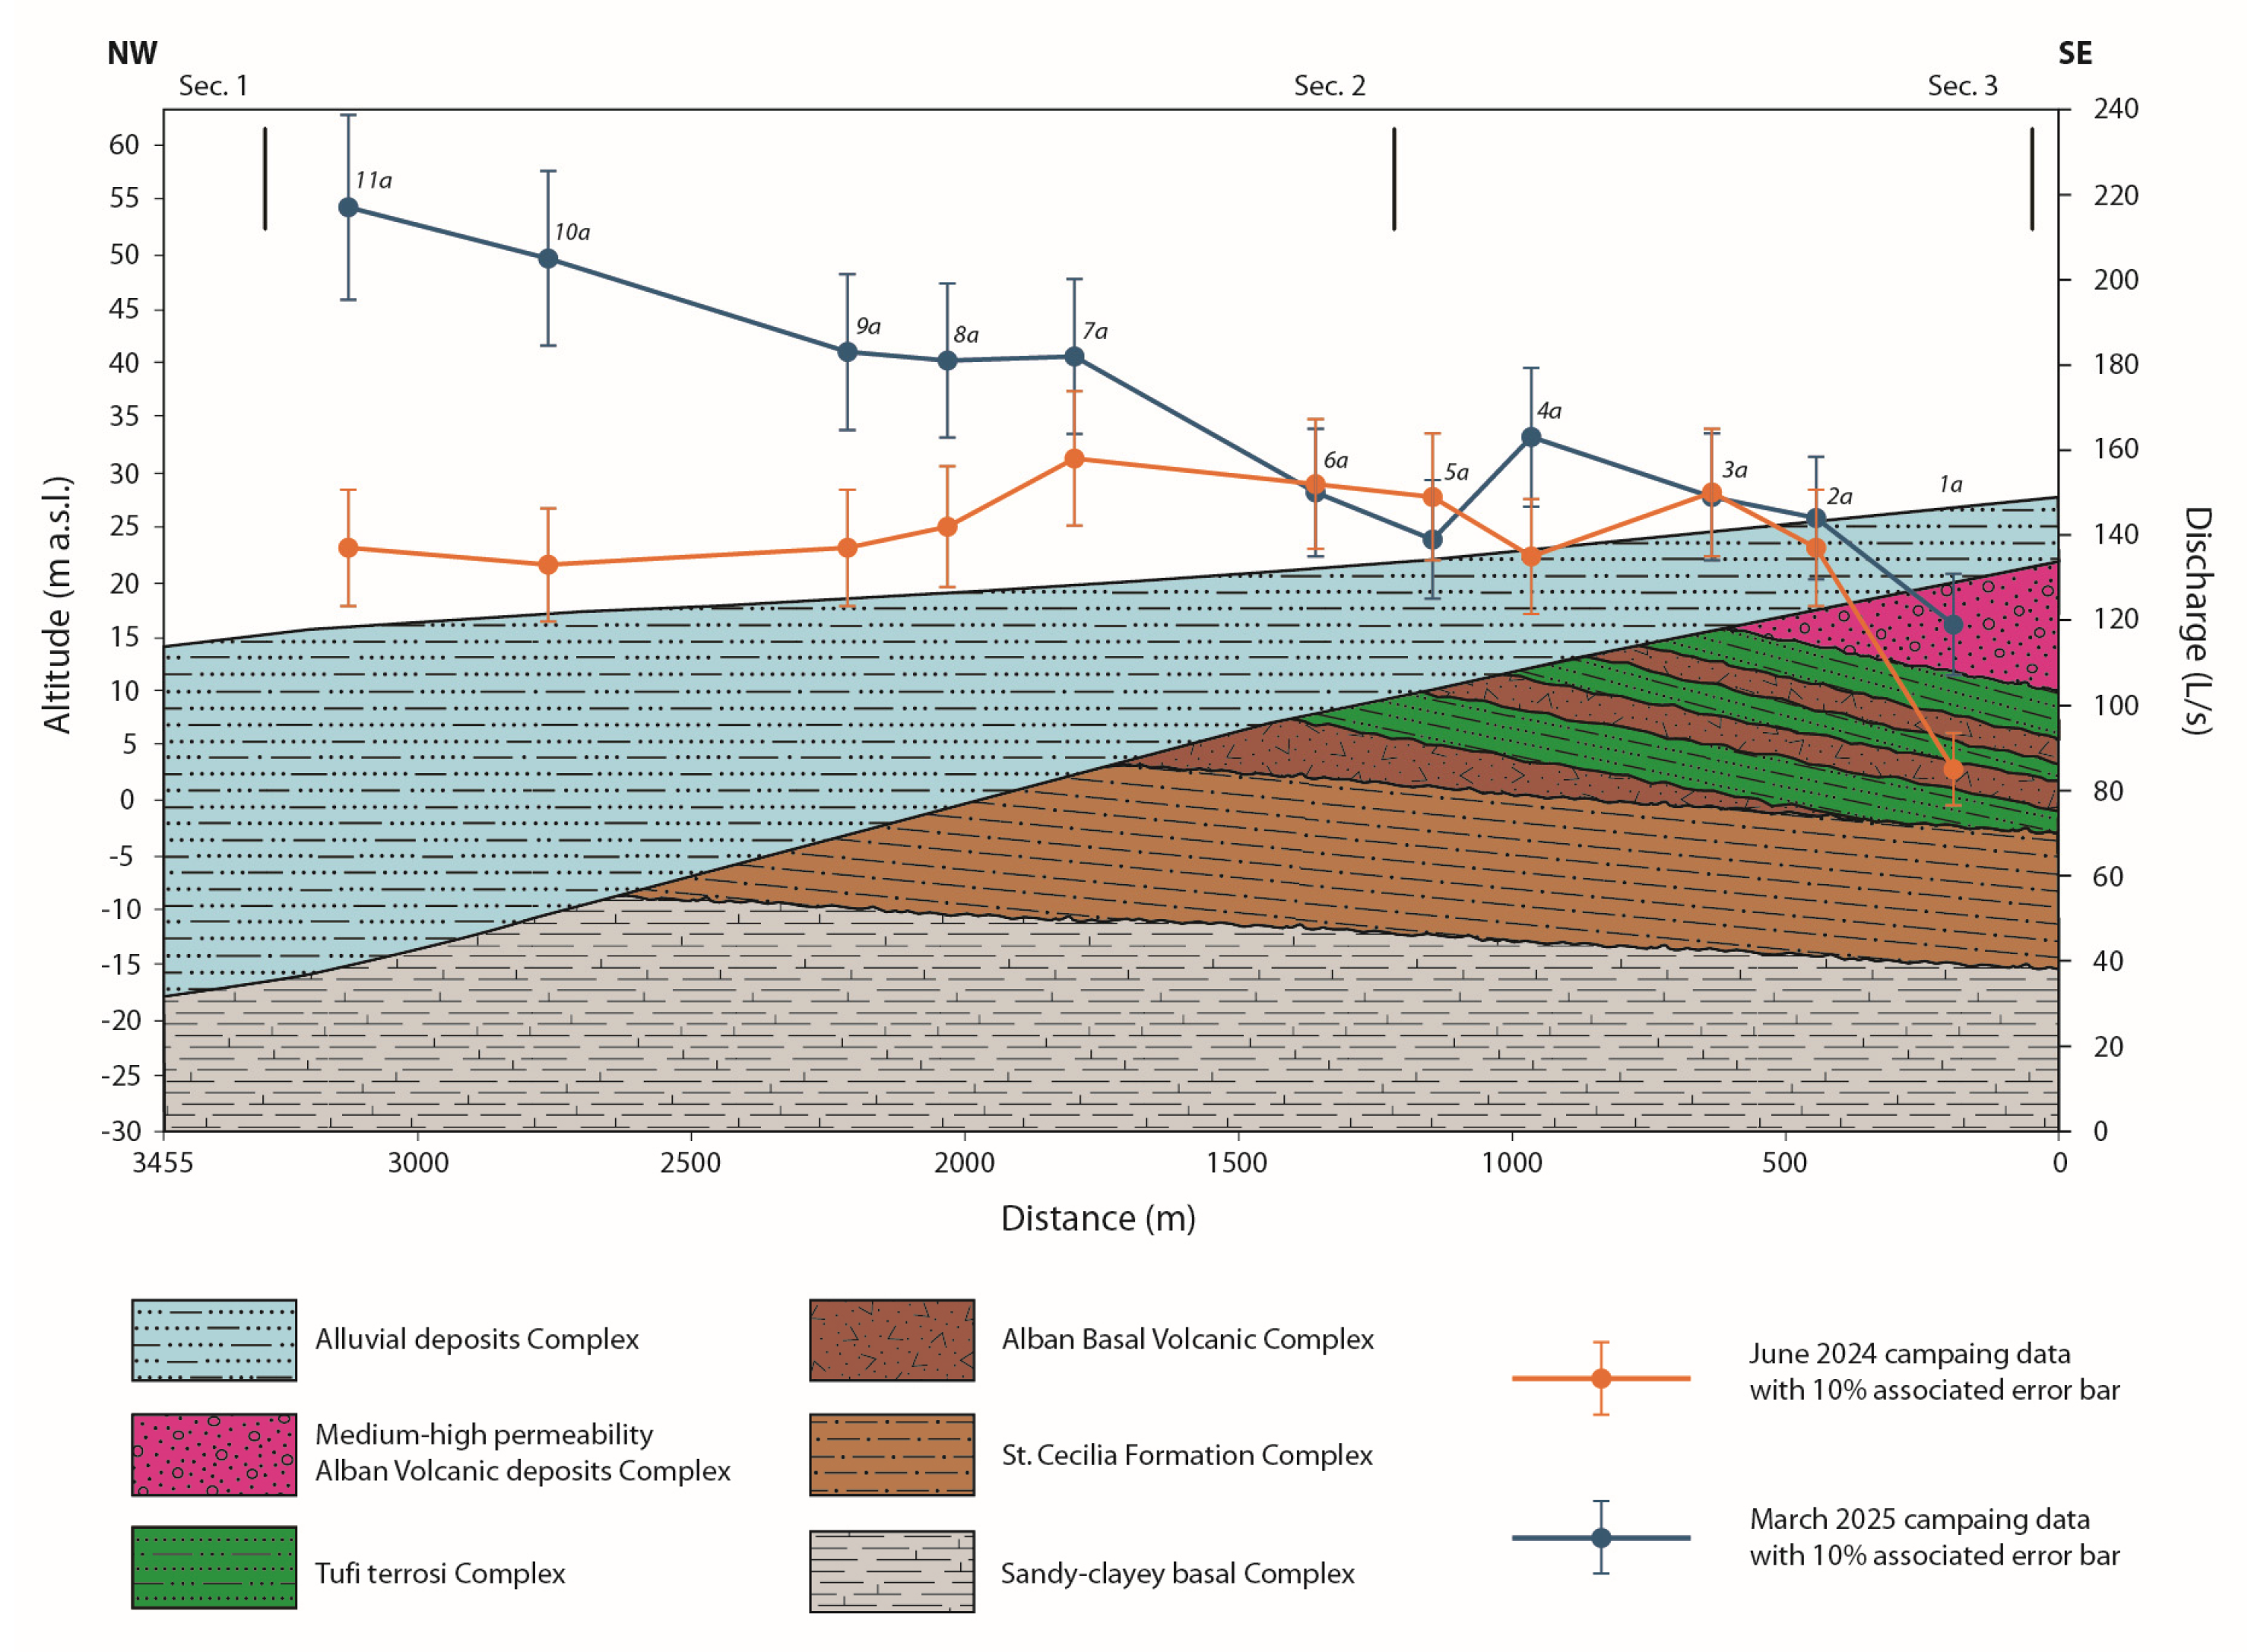
To clarify the hydrogeological relationship between the regional groundwater circulation and the hydrographic network, a longitudinal hydrogeological section along the Almone River was drawn (Figure 8).
The discharge measurement trends, represented together with the longitudinal hydrogeological section, were deprived of the Marrane’s inputs, which represent the contribution of the overflowing springs along both river banks, since the focus is to investigate the interaction between the Almone River and the groundwater circulation. The analysis of the flow measurement trends, from both June 2024 and March 2025 measurement campaigns, shows the following:
  • The increase in discharge observed between stations 1A and 2A during both measurement campaigns is significant because the differences between the discharge data (52 L/s and 25 L/s, respectively, in June 2024 and March 2025) are higher than the relative uncertainties (from 9 to 14 L/s in June 2024 and from 2.4 to 2.9 L/s in March 2025). This could be related to the geometry of the regional aquifer in this specific sector of the valley (Figure 8). A gradual thickness decrease in the regional aquifer, due to the bedding of the underlying less permeable deposits of the Alban basal volcanic complex and the incremental thickness of the alluvial deposits, lead to a groundwater discharge into the surface fluvial network, resulting in a flow rate increase along this segment of the river.
  • The discharge variation between sections 2A and 6A falls in the estimated 10% measurement error; this suggests a nearly constant discharge between these sections and contrasts with [8], which reported a progressive increase in the Almone River discharge in this part of the valley.
  • The contribution of the two tributaries was subtracted from the Almone River discharge data at corresponding confluence points (between 6A and 7A measurement points for “Marrana sinistra” and between 10A and 11A stations for “Marrana destra”). When these contributions were eliminated (Figure 8), an almost constant flow rate trend was observed in June 2024, while increasing discharge data were recorded in March 2025 between measurement points 6A and 11A. This increase is significant because the differences (from 12 to 32 L/s) between consecutive measurements along the river valley are basically higher than relative uncertainties (ranging from 3 to 5 L/s). This increased discharge is most likely due to enhanced runoff or subsurface flow contributions determined by the rainy period preceding the March 2025 survey, as shown by hydrometeorological data in [36]. Tor Marancia station (only 1 km from the Caffarella area) recorded a cumulative rainfall of 413 mm in the months preceding the March 2025 campaign and 246 mm for the period preceding the June 2024 campaign. Similar information was given by the Lago di Albano station (located near the area of Almone’s spring) with 513 mm and 340 mm of rainfall preceding the June 2024 and March 2025 surveys, respectively. It is worth noting that seasonality and seasonal extremes in dry vs. wet years might influence river–groundwater relationships, with rainy periods enhancing the increase in river discharge from station 6a to 11A where the alluvial body is progressively thicker or dry years leading to no significant input of subsurface water downstream. More sampling campaigns repeated over multiple years will enhance the robustness of these preliminary findings.
In addition, the progressive increase in thickness of the saturated alluvial deposits along the valley (from section 3 to 1, Figure 8), no longer in hydraulic contact with the “medium–high-permeability Alban volcanic deposit” complex, could support more efficient water exchange between the surface fluvial reticulum and the subsurface infiltration water contained within the saturated alluvial deposits, resulting in a gradual increase in the river discharge values.
This contribution is probably not attributable to groundwater but to subsurface water that infiltrates within the alluvial infill deposits as a result of rainfall. This is confirmed by radon analyses, which show a gradually decreasing concentration trend along the valley (Figure 9) linked to outgassing phenomena. Furthermore, no local radon increase (or reduced gradients of radon loss along the riverbed) were found, as expected by the input of radon richer groundwater [37].
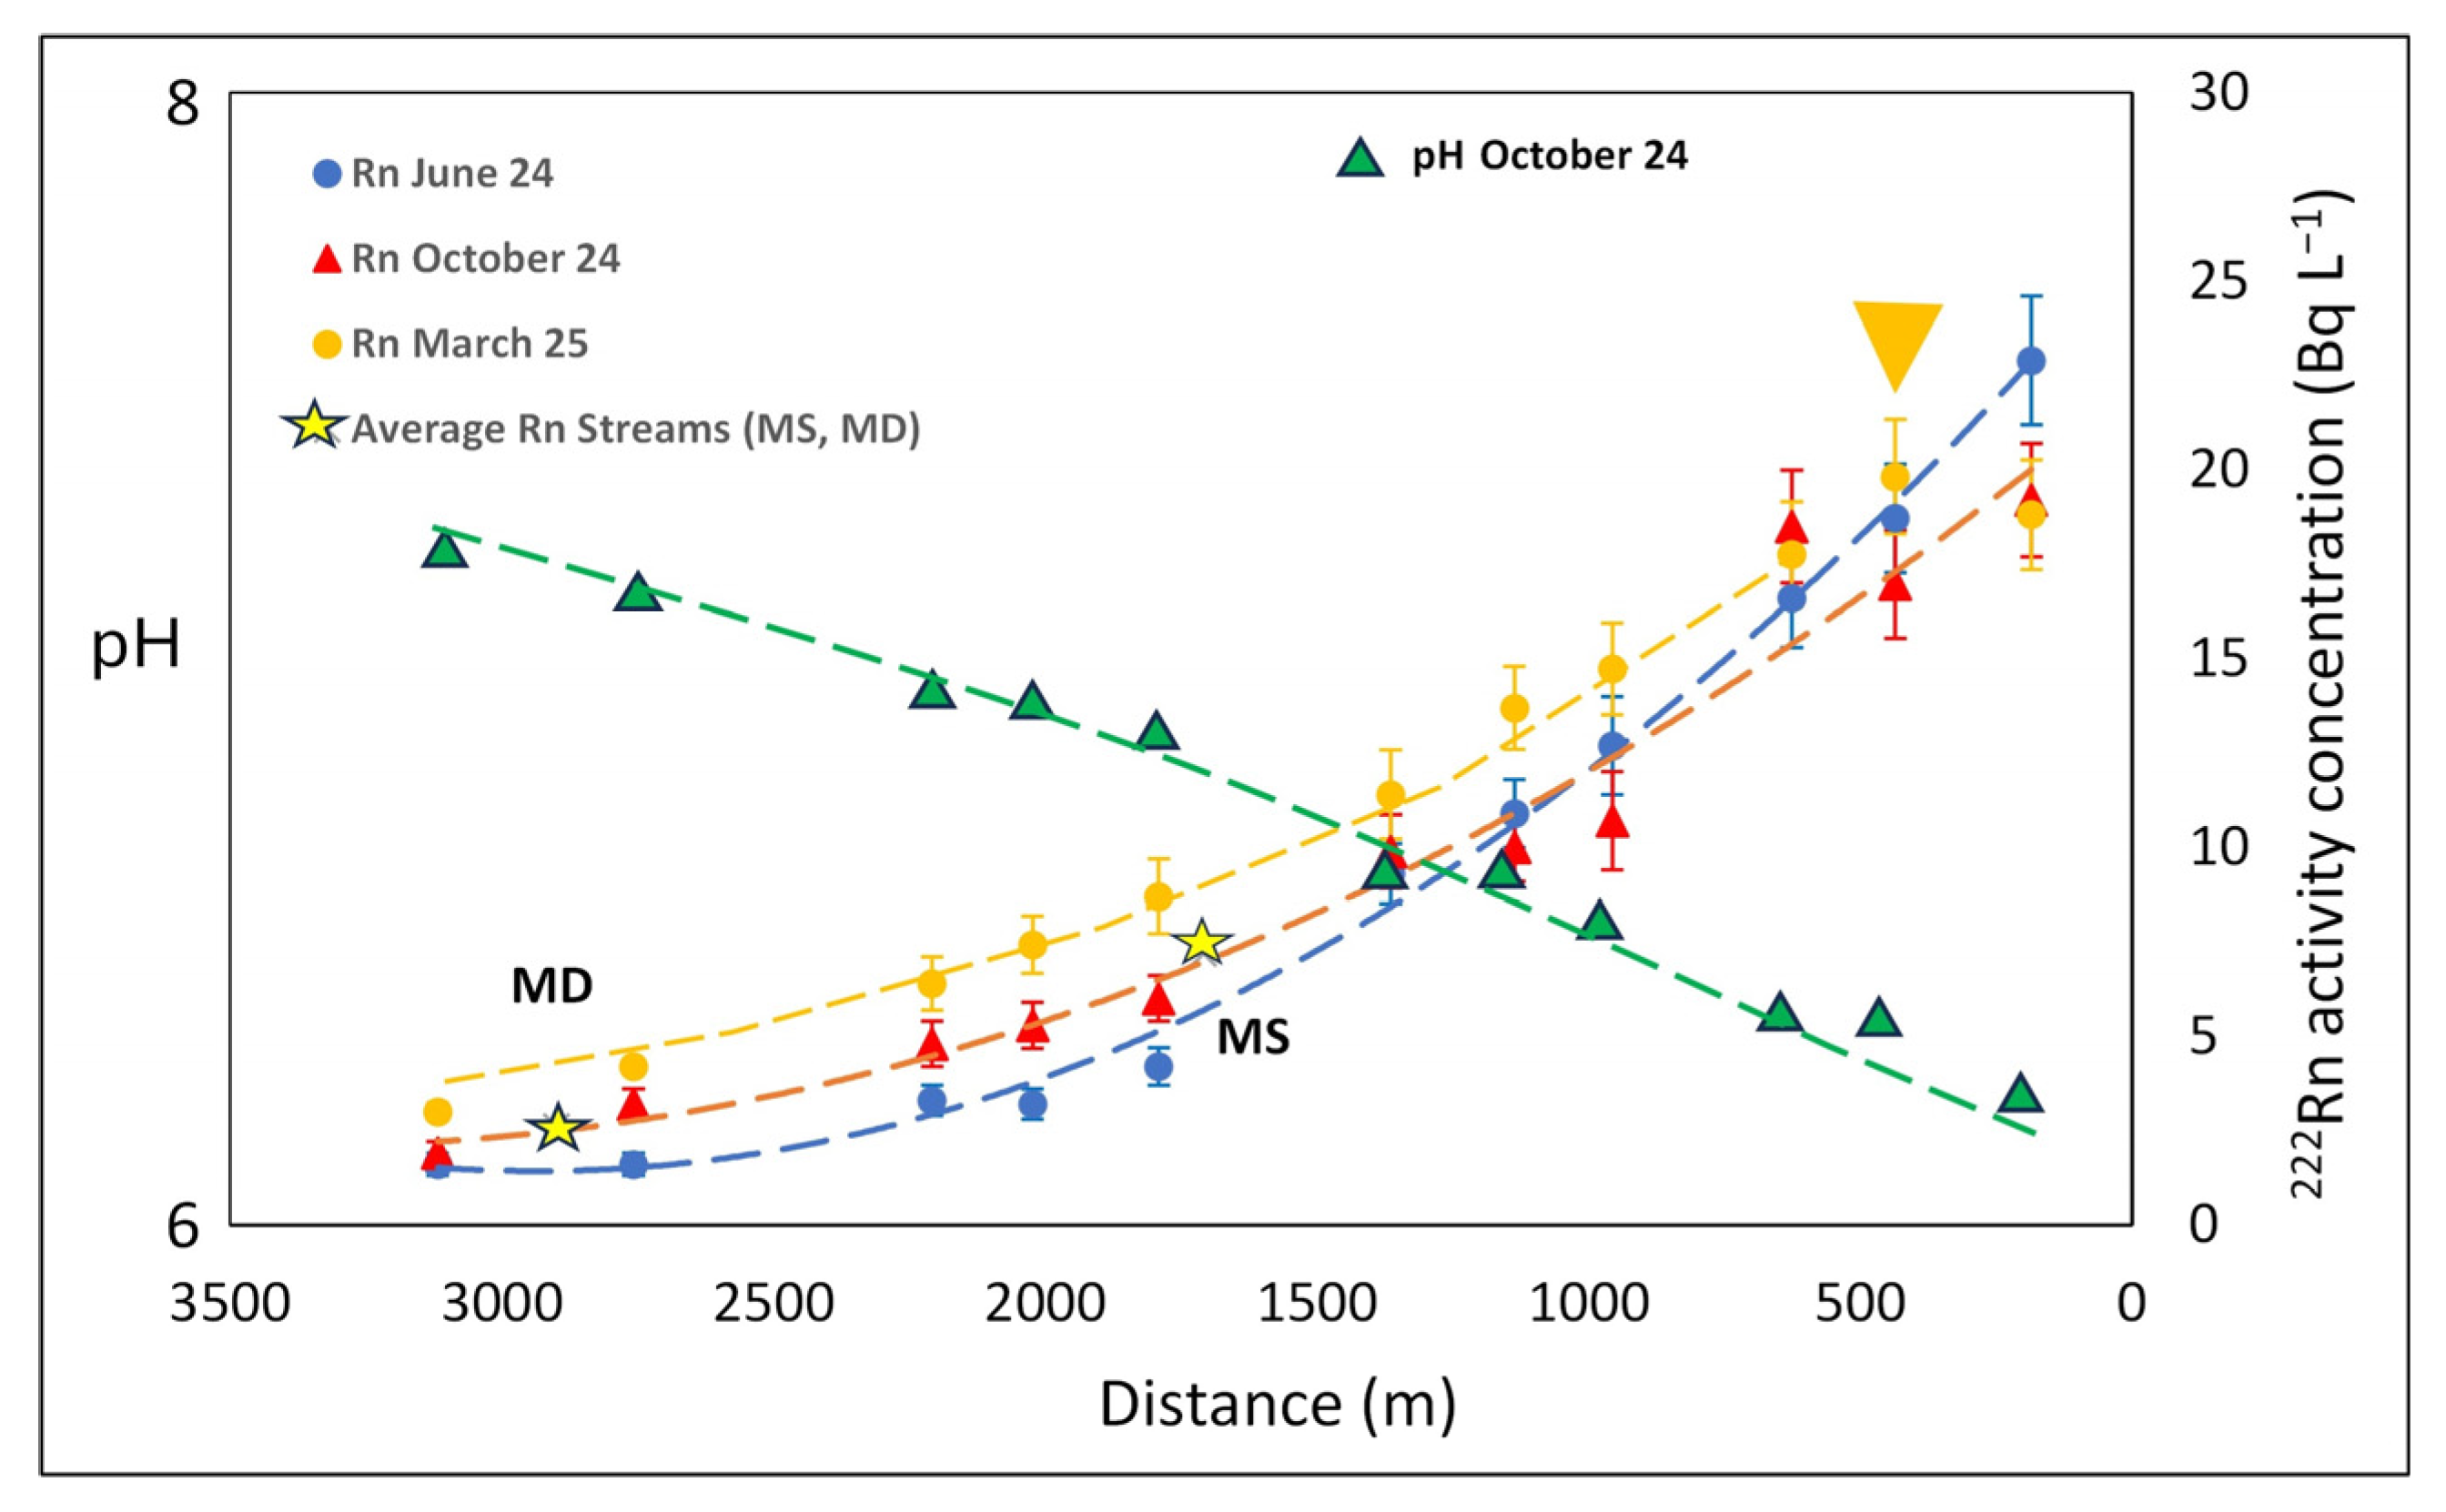
Radon activity concentrations along the Almone River from the June 2024, October 2024, and March 2025 surveys are reported in Figure 9. Station A1 was characterized by a significant radon level of approximately 21 Bq L−1, which is much higher than activity concentrations generally recorded for rivers and streams [9,11,12,13,38] but consistent with rivers interacting with volcanic aquifers where radon is produced via 22⁶Ra decay in 226Ra-enriched materials [39]. In the area of the Caffarella Valley, the radon content of some springs related to the circulation in the volcanites is very high, ranging from 53 to 240 Bq L−1 [30,31,40,41].
Radon activity concentrations progressively decreased along the river course mainly due to atmospheric escape, the decay of radon being almost negligible in a distance of 3 km. With a hydraulic gradient of 0.035, the radon loss was about 19 Bq L−1, following a general exponential trend. The atmospheric evasion of radon along the river is mirrored by a progressive pH increase (Figure 9), very likely due to CO2 degassing. This carbon dioxide loss from the river water supports the idea that the radon escape process is actually responsible for the observed radon decreasing trend. Similar simultaneous radon declines and pH growth with distance was detected along the Acqua Vergine underground aqueduct in Rome (Italy) and similarly interpreted as an evasion of gas from running water [42].
Taking into consideration the average surface input of radon by tributaries (MS and MD in Figure 9), the measured radon concentrations fall on the curves described above, indicating a negligible effect on the radon concentration in the Almone River. Similarly, the effects of other radon sources in the river, the 226Ra decay, the subsurface flux due to hyporheic exchange, and the parafluvial flow of groundwater [39] do not appear significant enough to reverse the observed trend of decreasing radon. Specifically, no radon increase was detected between stations 1A and 2A in June and October 2024, where the river discharge increased by 52 L s−1 (June 2024), since the overflow of groundwater from the volcanites (“Pozzolane Rosse”) into the alluvial beds and then into the river was due to a change in the geometry, volume, and depth of the volcanic aquifer (see Figure 8). It is possible that radon levels in the groundwater discharging into this stretch of the river decreased from a high value towards a lower equilibrium activity related to the transition from a high radon emanation unit (the Pozzolane Rosse) to a unit with a lower radon emanation (the alluvial deposit) [35]. In fact, 226Ra concentrations in the Pozzolane Rosse and alluvium of the Caffarella Valley, equal to 132 Bq kg−1 and 51 Bq kg−1, respectively [43], support this hypothesis. In addition to that, we calculated the maximum expected radon flux from the volcanic and alluvial units in the Caffarella area. Using the approach of [44], we calculated values of 90 Bq m−2 day−1 and 35 Bq m−2 day−1, respectively, for the volcanic and the alluvial units, based on radon emanation coefficients, grain size, porosity, radioactive isotope content, and humidity data [31,40,43]. This parameter is directly correlated with the radon emanation potential and further supports our interpretation.
On the other hand, radon growth was detected between stations 1A and 2A in March 2025 in agreement with the increase in river discharge. This is probably due to a more rapid transit through the alluvial sediments of groundwater from the volcanic aquifer to the Almone River, which reduces the decay degree from the equilibrium radon of the high radon emanation unit to the levels of the low radon emanation body, resulting in higher radon contents at station 2A. The lower and faster transit time through the alluvial deposits is documented by the higher precipitations in the months preceding the March 2025 survey, compared to those of June 2024 [36].
Finally, the March 2025 increase in river discharge from stations 6A to 11A, not mirrored by a radon increase, can be explained as the contribution of subsurface water that infiltrates within the low radon emanation alluvial infill deposits as a result of rainfall, without supplying radon.
The contribution of radon analyses by this study is evidently a preliminary step, and the quantification of all radon sources and sinks in the future will provide more solid evidence and details of the interaction of the Almone river and groundwater in the Caffarella Valley.

6. Conclusions

The application of a multi-method approach based on hydrogeological, lithological, and geochemical data was crucial to preliminarily studying the interactions between the Almone River, the volcanic aquifer, and the alluvial body in the Caffarella Valley (Rome, Italy), relevant for the knowledge and management of a very peculiar and precious naturalistic environment in a vast urban area.
River discharge, radon, and pH trends recorded along the river in different seasons, combined with information on the geometry, volume, and thickness of the hydrogeological complexes were used to identify the input of groundwater or subsurface water into the river. The integration of these data allowed us to recognize the emergence of groundwater between stations 1A and 2A, always (June 2024 and March 2025) associated with an increase in discharge, but only in March with an increase in radon. The reduced radon concentration at station 2A recorded in the summer campaign compared to the March survey could be justified by a slower transition (and thus a slower decay), which occurred in the dry season (June), from a high-radon-emanation unit (the “Pozzolane Rosse”) to a lower-emanation one (the alluvial sediments).
On the other hand, the increased discharge observed from stations 6A to 11A in March was interpreted as the input of infiltrating subsurface water associated with heavier rainfalls in the months preceding this survey. This was confirmed by progressively decreasing radon levels due to degassing and strengthened by increasing pH trends along the river.
The scenario that emerges is that of a river that receives the contribution of groundwater from the Alban Hills aquifer only in the upper part of the Caffarella Valley and is moderately affected by the input of subsurface water in its middle and final part only in the rainy season. Such a finding highlights the importance of seasonality in regulating river–groundwater relationships and suggests the need for further monitoring throughout the year and over multiple years to have a robust and definitive model. Our opening scenario contrasts with previous hydrogeological studies that indicated a progressive increase in discharge along the entire valley as due to groundwater input. It is probable that the confluence of the two tributaries (the “Marrane”) were not evaluated in the discharge measurements. This scenario supports the past need for hydraulic interventions (including the construction of two drainage canals (the “Marrane”) built to convey the spring waters directly into the Almone River, thus avoiding the flooding of the valley.
Recently, two ponds were created, conveying the “Marrana Destra” water in the final part of the valley and exploiting the “winter” runoff that characterizes the thick saturated alluvial deposits of this sector of the Caffarella Valley. These ponds are now a very important naturalistic avifaunal oasis, just a stone’s throw from the historic center of Rome.
Finally, topics and interventions such as the creation of urban gardens, the planting of new trees in rest areas, or the dilution effect of pollutants due to the input of groundwater or subsurface water could benefit from the useful information in this research.

Author Contributions

M.M., R.M., G.M. and P.T. were involved in conceptualization, methodology, formal analysis, investigation, and writing. C.R. and C.D.S. participated in investigation and validation. C.R. made the geological map and sections. C.D.S. was involved in writing—original draft and editing. All authors have read and agreed to the published version of the manuscript.

Funding

This research received no external funding.

Data Availability Statement

No additional data was created. All information is included in this manuscript.

Acknowledgments

Parco Regionale dell’Appia Antica is acknowledged for technical assistance and for sharing documents. We extend our special thanks to Giorgio Della Rosa for field assistance. Our gratitude goes to Comitato per il Parco della Caffarella and to Roberto Federici and Rossana De Stefani for accompanying us in electric cars and saving us the trouble of transporting the equipment.

Conflicts of Interest

The authors declare no conflicts of interest.

Appendix A

Figure A1 reports the location of boreholes [39,40], whose stratigraphy was used to prepare the new geological map at a 1:5000 scale (Figure 4), and the geological sections (Figure 5, Figure 6, Figure 7 and Figure 8).
Figure A1. Location of the boreholes (red circles, [39,40]) used to draw up the geological map and the geological cross-sections. The green line represents the boundaries of the studied area (the Caffarella Valley), as in Figure 3 and Figure 4. SC1 and SC2 are two geognostic surveys carried out specifically in 2023 for the drafting of a new geological map of the Caffarella Valley and the geological monograph of the park, financed by the Amici di Italia Fenice Foundation—ETS (in preparation).
Water 17 01555 g0a1

References

  1. Boano, F.; Camporeale, C.; Revelli, R.; Ridolfi, L. Sinuosity-driven hyporheic exchange in meandering rivers. Geophys. Res. Lett. 2006, 33, L18406. [Google Scholar] [CrossRef]
  2. Irvine, D.J.; Singha, K.; Kurylyk, B.L.; Briggs, M.A.; Sebastian, Y.; Tait, D.R.; Helton, A.M. Groundwater-Surface water interactions research: Past trends and future directions. J. Hydrol. 2024, 644, 132061. [Google Scholar] [CrossRef]
  3. Hare, D.K.; Helton, A.M.; Johnson, Z.C.; Lane, J.W.; Briggs, M.A. Continental-scale analysis of shallow and deep groundwater contributions to streams. Nat. Commun. 2021, 12, 1450. [Google Scholar] [CrossRef]
  4. Benz, S.A.; Irvine, D.J.; Rau, G.C.; Bayer, P.; Menberg, K.; Blum, P.; Jamieson, R.C.; Griebler, C.; Kurylyk, B.L. Global groundwater warming due to climate change. Nat. Geosci. 2024, 17, 545–551. [Google Scholar] [CrossRef]
  5. Del Vecchia, A.G.; Shanafield, M.; Zimmer, M.A.; Busch, M.H.; Krabbenhoft, C.A.; Stubbington, R.; Kaiser, K.E.; Burrows, R.M.; Hosen, J.; Datry, T.; et al. Reconceptualizing the hyporheic zone for nonperennial rivers and streams. Freshw. Sci. 2022, 41, 167–182. [Google Scholar] [CrossRef]
  6. Grischek, T.; Foley, A.; Schoenheinz, D.; Gutt, B. Effects of Interaction between Surface Water and Groundwater on Groundwater Flow and Quality Beneath Urban Areas. In Current Problems of Hydrogeology in Urban Areas, Urban Agglomerates and Industrial Centres; Howard, K.W.F., Israfilov, R.G., Eds.; Nato Science Series; Springer: Dordrecht, The Netherlands, 2002; Volume 8. [Google Scholar]
  7. Chiudioni, F.; Marcheggiani, S.; Puccinelli, C.; Trabace, T.; Mancini, L. Heavy metals in tributaries of Tiber River in the urban area of Rome (Italy). Heliyon 2024, 10, e33964. [Google Scholar] [CrossRef] [PubMed]
  8. La Vigna, F.; Mazza, R.; Amanti, M.; Di Salvo, C.; Petitta, M.; Pizzino, L.; Pietrosante, A.; Martarelli, L.; Bonfà, I.; Capelli, G.; et al. Groundwater of Rome. J. Maps 2016, 12, 88–93. [Google Scholar] [CrossRef]
  9. Adyasari, D.; Dimova, N.T.; Dulai, H.; Gilfedder, B.S.; Cartwright, I.; McKenzie, T.; Fuleky, P. Radon-222 as a groundwater discharge tracer to surface waters. Earth-Sci. Rev. 2023, 238, 104321. [Google Scholar] [CrossRef]
  10. Kendall, C.; McDonnell, J.J. Isotope Tracers in Catchment Hydrology, 1st ed.; Elsevier: Amsterdam, The Netherlands, 1999; ISBN 9780080929156. [Google Scholar]
  11. Cecil, L.D.; Green, J.R. Radon-222. In Environmental Tracers in Subsurface Hydrology; Springer: Berlin/Heidelberg, Germany, 2000; pp. 175–194. [Google Scholar]
  12. Burnett, W.C.; Dulaiova, H. Radon as a tracer of submarine groundwater discharge into a boat basin in Donnalucata. Cont. Shelf Res. 2006, 26, 862–873. [Google Scholar] [CrossRef]
  13. Cook, P.G. Estimating groundwater discharge to rivers from river chemistry surveys. Hydrol. Process. 2013, 27, 3694–3707. [Google Scholar] [CrossRef]
  14. Burnett, W.C.; Bokuniewicz, H.; Huettel, M.; Moore, W.S.; Taniguchi, M. Groundwater and pore water inputs to the coastal zone. Biogeochemistry 2003, 66, 3–33. [Google Scholar] [CrossRef]
  15. Corbett, D.R.; Burnett, W.C.; Cable, P.H.; Clark, S.B. Radon tracing of groundwater input into Par Pond, Savannah River Site. J. Hydrol. 1997, 203, 209–227. [Google Scholar] [CrossRef]
  16. Burnett, W.C.; Chanyotha, S.; Wattayakorn, G.; Taniguchi, M.; Umezawa, Y.; Ishitobi, T. Underground sources of nutrient contamination to surface waters in Bangkok, Thailand. Sci. Total Environ. 2009, 407, 3198–3207. [Google Scholar] [CrossRef]
  17. Partington, D.; Knowling, M.J.; Simmons, C.T.; Cook, P.G.; Xie, Y.; Iwanaga, T.; Bouchez, C. Worth of hydraulic and water chemistry observation data in terms of the reliability of surface water-groundwater exchange flux predictions under varied flow conditions. J. Hydrol. 2020, 590, 125441. [Google Scholar] [CrossRef]
  18. Zhou, Z.; Cartwright, I. Using geochemistry to identify and quantify the sources, distribution, and fluxes of baseflow to an intermittent river impacted by climate change: The upper Wimmera River, Southeast Australia. Sci. Total Environ. 2021, 801, 149725. [Google Scholar] [CrossRef]
  19. Ellins, K.K.; Roman-Mas, A.; Lee, R. Using 222Rn to examine groundwater/surface discharge interaction in the Rio Grande de Manati, Puerto Rico. J. Hydrol. 1990, 115, 319–341. [Google Scholar] [CrossRef]
  20. Genereux, D.P.; Hemond, H.F. Naturally occurring Radon 222 as a tracer for streamflow generation: Steady state methodology and field example. Water Resour. Res. 1990, 26, 3065–3075. [Google Scholar]
  21. Patacca, E.; Scandone, P. Post-Tortonian Mountain building in the Apennines. The role of the passive sinking of a relic lithospheric slab. In The Lithosphere in Italy; Boriani, A., Bonafede, M., Piccardo, G.B., Vai, G.B., Eds.; Atti dei Convegni Lincei; Accademia Nazionale dei Lincei: Rome, Italy, 1989; Volume 80, pp. 157–176. [Google Scholar]
  22. Cipollari, P.; Cosentino, D. Miocene unconformities in the Central Apennines: Geodynamic significance and sedimentary basin evolution. Tectonophysics 1995, 252, 375–389. [Google Scholar] [CrossRef]
  23. Cosentino, D.; Asti, R.; Nocentini, M.; Gliozzi, E.; Kotsakis, T.; Mattei, M.; Esu, D.; Spadi, M.; Tallini, M.; CifellI, F.; et al. New insights into the onset and evolution of the central Apennine extensional intermontane basins based on the tectonically active L’Aquila Basin (central Italy. Geol. Soc. Am. Bull. 2017, 129, 1314–1336. [Google Scholar] [CrossRef]
  24. Funiciello, R.; Giordano, G. La nuova carta geologica di Roma: Litostratigrafia e organizzazione stratigrafica. La geologia di Roma. Dal Cent. Stor. Alla Perif. 2008, 80, 39–85. [Google Scholar]
  25. Moscatelli, M.; Piscitelli, S.; Piro, S.; Stigliano, F.; Giocoli, A.; Zamuner, D.; Marconi, F. Integrated geological and geophysical investigations to characterize the anthropic layer of the Palatine hill and Roman Forum (Rome, Italy). Bull. Earthquake Eng. 2014, 12, 1319–1338. [Google Scholar] [CrossRef]
  26. Karner, D.B.; Marra, F.; Renne, P. The history of Monti Sabatini and Alban Hills volcanoes: Groundwork for Assessing Volcanic-Tectonic Hazards for Rome. J. Volcanol. Geoth. Res. 2001, 107, 185–219. [Google Scholar] [CrossRef]
  27. Capelli, G.; Mastrorillo, L.; Mazza, R.; Petitta, M.; Baldoni, T.; Bonzano, F.; Cascone, D.; Di Salvo, C.; La Vigna, F.; Taviani, S.; et al. Carta Idrogeologica del Territorio della Regione Lazio, Scala 1:100.000, 4 Sheets; Regione Lazio; SELCA Firenze: Firenze, Italy, 2012. [Google Scholar]
  28. Mazzini, I.; Gliozzi, E.; Abati, S.; Callori di Vignale, C.; Capelli, G.; Ceschin, S.; Faranda, C.; Mazza, R.; Piccari, F.; Rossetti, C.; et al. Field-Trip Guide, Proceedings of the 17th International Symposium on Ostracoda “Back to the Future”, Rome, Italy, 22–26 July 2013; Università degli Studi Roma Tre: Rome, Italy, 2013. [Google Scholar]
  29. Pizzino, L.; Cinti, D.; Procesi, M.; Sciarra, A. Preliminary chemical characterization of groundwater in the Rome Municipality. Ital. J. Groundw. 2015, 4, 47–57. [Google Scholar] [CrossRef]
  30. Tuccimei, P.; Lane-Smith, D.; Galli, G.; Lucchetti, C.; De Simone, G.; Simko, J.; Cook, I.; Bond, C.E. Our pet project: An unlimited supply of big and small water sample vials for the assay of radon in water. J. Radioanal. Nucl. Chem. 2015, 307, 2277–2280. [Google Scholar] [CrossRef]
  31. Lucchetti, C.; Briganti, A.; Semenza, D.; Castelluccio, M.; Galli, G.; Soligo, M.; Tuccimei, P. Testing the radon-in-water probe set-up for the measurement of radon in water bodies. Radiat. Meas. 2019, 128, 106179. [Google Scholar]
  32. De Simone, G.; Lucchetti, C.; Galli, G.; Tuccimei, P. Correcting for H2O interference using a RAD7 electrostatic collection-based silicon detector. J. Environ. Radioact. 2016, 162–163, 146–153. [Google Scholar] [CrossRef]
  33. Loughrin, J.; Bolster, C.C.; Lovanh, N.; Sistani, K.R. A Simple Device for the Collection of Water and Dissolved Gases at Defined Depths. Appl. Eng. Agric. 2010, 26, 559–564. [Google Scholar] [CrossRef]
  34. Ventriglia, U. Geologia del Territorio del Comune di Roma; Amministrazione Provinciale di Roma: Roma, Italy, 2002; p. 810. [Google Scholar]
  35. Ente Parco Regionale dell’Appia Antica. Piano del Parco. In Cavità Sotterranee e Stratigrafie, Sondaggi Geognostici; Ente Parco Regionale dell’Appia Antica: Rome, Italy, 2002; p. 244. [Google Scholar]
  36. Available online: https://servizio-nazionale.protezionecivile.gov.it/en/approfondimento/network-functional-centres/ (accessed on 25 March 2025).
  37. Low, R. Radon as a natural groundwater tracer in the chalk aquifer, UK. Environ. Int. 1996, 22, 333–338. [Google Scholar] [CrossRef]
  38. Amin, S.A.; Alani, R.R.; Jassim, A.A. Radon assessment for selected sites in the Tigris River. Water Supply 2019, 19, 1630–1635. [Google Scholar] [CrossRef]
  39. Sukanya, S.; Joseph, S. Radon Distribution in Groundwater and River Water. In Environmental Radon; Springer Nature link: Berlin, Germany, 2023; pp. 53–87. [Google Scholar]
  40. Briganti, A.; Tuccimei, P.; Voltaggio, M.; Carusi, C.; Castelluccio, M.; Galli, G.; Lucchetti, C.; Soligo, M. Assessing MTBE residual contamination in groundwater using radon. Appl. Geochem. 2020, 116, 104583. [Google Scholar] [CrossRef]
  41. Mattia, M.; Tuccimei, P.; Soligo, M.; Carusi, C.; Rainaldi, E.; Amoruso, A.F.; Lepore, D. Radon as a natural tracer for monitoring NAPL groundwater contamination. Water 2020, 12, 3327. [Google Scholar] [CrossRef]
  42. Tuccimei, P.; Castelluccio, M.; De Simone, G.; Lucchetti, C.; Placidi, M.; Prisco, F.; Ursino, V. Indagini geochimiche nell’acquedotto Vergine antico. Archeol. Sotter. 2014, 10, 15–22. [Google Scholar]
  43. Lucchetti, C. Valutazione Dell’influenza di Cavità Sotterranee e Campi di Fratturazione Sulle Concentrazioni di Radon e Thoron nel Suolo in Aree Idrotermali e Perivulcaniche Della Regione Lazio. PhD Thesis, Università degli Studi “Roma Tre”, Roma, Italy, 2014. [Google Scholar]
  44. Voltaggio, M.; Masi, U.; Spadoni, M.; Zampetti, G. A methodology for assessing the maximum expected radon flux from soils in northern Latium (central Italy). Environ. Geochem. Health 2006, 28, 541–551. [Google Scholar] [CrossRef] [PubMed]
Figure 1. Study area on an extract of a hydrogeological map of Rome [8]. (1) Anthropogenic deposit complex; (2) alluvial deposit complex; (4) heterogeneous clastic deposit complex; (5) lava complex; (6) Tufo Lionato complex; (7) high-permeability Alban volcanic deposit complex; (8) low-permeability Alban volcanic deposit complex; (9) Sabatini volcanic complex; (11) Santa Cecilia Formation complex; (13) gravelly–sandy Ponte Galeria complex; (15) coarse sands of Monte Mario and Ponte Galeria complex; (16) sandy–clayey basal complex. (a) Groundwater flow path; (b) spring; (c) thermal mineral spring; (d) regional aquifer well; (e) Alban Hill upper aquifer well; (f) thermo-pluviometric and hydrometric station; (g) regional aquifer water table; (h) Alban Hills upper aquifer water table; (i) linear spring; (j) fault.
Water 17 01555 g001
Figure 2. (1) Plastic PET bottle; (2) screw-on Teflon aerator, with a single air stone; (3) elastic clinching strap; (4) temperature data logger; (5) bubble trap; (6) laboratory dryer; (7) clip; (8) check valve; (9) vinyl tubing; (10) RAD7 radon detector; (11) inlet filter (modified from [32]).
Water 17 01555 g002
Figure 3. The Caffarella Valley with the location of the river discharge measurement sections; MS and MD indicate “Marrana Sinistra” and “Marrana Destra”, respectively.
Water 17 01555 g003
Figure 4. Original geological map of the Caffarella area at a 1:5000 scale (by C.R., this study) with traces of the geological cross-sections. (1) Alluvial deposits; (2) “Pozzolanelle”; (3) “Tufo Lionato”; (4) “Tufi stratificati varicolori de La Sorta”; (5) “Pozzolane Nere”; (6) “Tufi Terrosi” below “Pozzolane Nere”; (7) “Conglomerato Giallo”; (8) “Pozzolane Rosse”; (9) “Tufi Terrosi with pomiceous levels”; (10) “Tufi del Palatino”; (11) “Santa Cecilia” Formation; (12) cross-section trace (sections 1, 2, and 3, respectively, from left to right); (13) faults; (14) boundaries of the study area; (15) marshy ponds; (16) water flow direction; (17) springs; (18) sinkhole from 2002 cartography; (19) sinkhole from Google Earth 4 (2022).
Water 17 01555 g004
Figure 5. Hydrogeological section 1. Crosssection trace is in Figure 4. IM, LP, MP, and HP stand for impermeable, low permeability, medium permeability, and high permeability, respectively.
Water 17 01555 g005
Figure 6. Hydrogeological section 2. Cross-section trace is in Figure 4. For permeability classes, see caption of Figure 5.
Water 17 01555 g006
Figure 7. Hydrogeological section 3. Cross-section trace is in Figure 4. For permeability classes, see caption of Figure 5.
Water 17 01555 g007
Figure 8. Longitudinal hydrogeological section along the Almone riverbed and discharge measurements trends (June 2024 and March 2025). The contribution of the two tributaries was subtracted from the Almone River discharge data at corresponding confluence points (see text for explanation).
Water 17 01555 g008
Figure 9. Water radon concentration and pH along the Almone River from the June 2024, October 2024, and March 2025 surveys. Stars indicate the input of the two tributaries (MS and MD) into the main river with the relative radon levels. The dashed curves are introduced only to indicate the trend of radon and pH variations. The yellow triangle at station 2A in March 2025 shows a radon increase in agreement with the increase in the river discharge.
Water 17 01555 g009
Table 1. Discharge of the Almone River and its tributaries (MS and MD).
SiteDischarge
(L s−1) *
Discharge
(L s−1) *
June 2024March 2025
1A85119
2A137144
3A150149
4A135163
5A149139
6A152150
7A179195
8A163194
9A158196
10A154218
11A193260
MS1613
MD2130
Note: * Uncertainties in the discharge data are approximately 10% for June 2024 and 2% for the March 2025 campaigns when a higher-performing current meter was used (see Section 3.1).
Table 2. Radon in the Almone River and its tributaries labeled as MS and MD.
Site222Rn
(Bq L−1)
222Rn
(Bq L−1)
222Rn
(Bq L−1)
June 2024October 2024March 2025
1A22.9 ± 1.719.2 ± 1.518.8 ± 1.5
2A18.7 ± 1.4 17.0 ± 1.419.8 ± 1.5
3A16.6 ± 1.318.5 ± 1.017.8 ± 1.4
4A12.7 ± 1.310.7 ± 1.314.7 ± 1.2
5A10.9 ± 0.910.0 ± 0.913.7 ± 1.1
6A9.3 ± 0.8 9.9 ± 1.011.4 ± 1.2
7A4.2 ± 0.56.0 ± 0.68.7 ± 1.0
8A3.2 ± 0.45.3 ± 0.67.4 ± 0.8
9A3.3 ± 0.44.8 ± 0.66.4 ± 0.7
10A1.6 ± 0.33.2 ± 0.44.2 ± 0.1
11A1.6 ± 0.3 1.9 ± 0.33.0 ± 0.2
MS5.1 ± 0.67.3 ± 0.1 -
MD1.8 ± 0.31.4 ± 0.3 -
Table 3. Temperature, electrical conductivity (EC), and pH of river water from October 2024 and March 2025 surveys.
StationOctober 2024March 2025
T (°C)EC (μS cm−1)pHT (°C)EC (μS cm−1)pH
1A188486.27178306.55
2A188636.45178426.57
3A198606.45188366.76
4A198636.67178416.60
5A198606.79178386.96
6A208536.79178246.68
7A198557.1168257.01
8A208587.19178247.05
9A208557.2178077.15
10A178567.42158057.16
11A208527.53138007.13
MS178177.06158327.06
MD188387.78148977.80
Disclaimer/Publisher’s Note: The statements, opinions and data contained in all publications are solely those of the individual author(s) and contributor(s) and not of MDPI and/or the editor(s). MDPI and/or the editor(s) disclaim responsibility for any injury to people or property resulting from any ideas, methods, instructions or products referred to in the content.