Article

Comprehensive Evaluation of Water-Saving Ecological Irrigation Districts Based on the Variable-Weight Matter-Element Method

State Key Laboratory of Water Engineering Ecology and Environment in Arid Area, Xi’an University of Technology, Xi’an 710048, China
*
Author to whom correspondence should be addressed.
Water 2025, 17(10), 1556; https://doi.org/10.3390/w17101556
Submission received: 26 March 2025 / Revised: 19 May 2025 / Accepted: 20 May 2025 / Published: 21 May 2025
(This article belongs to the Section Water, Agriculture and Aquaculture)

Abstract

:
The irrational development of traditional irrigation districts has negatively impacted ecosystems, while current evaluation indicators for ecological irrigation districts lack systematic and objective selection. To address this, a new model and multi-indicator optimization approach are urgently needed for sustainable irrigation development. Using the Jiaokou Irrigation District in Guanzhong as a case study, this research applied water-saving ecological irrigation district principles, eight indicator selection criteria, and an optimization screening model. A database with six criteria layers and 19 indicators was constructed, with 52.78% of the indicators capturing 85.57% of the information. The modified weight variation method was employed to determine indicator weights, and a matter-element extension model was established for evaluation. Results classify the ecological health development level as “Passable” and trending toward “Moderate”. Socio-economic and ecological resource indicators were found to exert significant influence, with water-saving irrigation coverage and domestic sewage treatment rates identified as the most sensitive indicators. These factors substantially impact the development level of water-saving ecological irrigation districts, highlighting their importance in guiding sustainable development strategies.

1. Introduction

Amid the growing global ecological and environmental challenges, irrigation districts, as key areas for agricultural production, are increasingly under scrutiny regarding their ecological balance and sustainable development [1]. Traditional irrigation district management and reform have primarily focused on improving water resource utilization efficiency and promoting water-saving irrigation technologies [2,3]. However, this singular focus on enhancing efficiency, while boosting agricultural productivity in the short term, has led to numerous ecological and environmental issues over time, such as soil erosion, soil degradation, and reduced biodiversity [4,5]. In recent years, with the emergence of the concept of ecological civilization, scholars have begun exploring how to achieve ecological balance and sustainable development in irrigation districts based on the efficient utilization of water resources [6,7].
Recent years have witnessed significant advancements in research on ecological irrigation districts, with scholars extensively exploring areas such as the construction of ecological irrigation systems, ecological health assessments, resource utilization efficiency, and operational management models. In terms of ecological irrigation district construction, studies have covered the development of eco-friendly irrigation and drainage systems, ecological treatment of water pollution, ecological restoration of soil salinization, and the creation of irrigation district landscapes [8,9,10]. For instance, Surian and Rinaldi (2003) [11] examined the impact of channel width adjustments on river ecological health, while Mohammed Barznji [12] explored the purifying effects of green plants on water environments. Singh [13] investigated the influence of groundwater and domestic wastewater irrigation on soil physical properties and crop yields. Regarding ecological health assessment and indicator system construction, Zhang et al. [14] developed a health evaluation system for the Helan ecological irrigation district, encompassing the ecological environment, modernization levels, and agricultural benefits. Similarly, Fang et al. [15] proposed an evaluation system for ecological irrigation districts, based on structural attributes, environmental factors, functional elements, and socio-economic aspects. On resource utilization efficiency, Sun et al. [16] applied water footprint and water resource accounting to evaluate agricultural water use in the Hetao irrigation district, analyzing performance, efficiency, and environmental impact. Oad et al. [17] addressed the prominent conflicts among domestic water use, ecological water requirements, and agricultural irrigation in the western United States and employed a decision support system to propose an optimal water supply and allocation scheme for the Rio Grande Conservation Area. Xevi and Khan [18], utilizing multi-objective optimization theory, suggested strategies for optimizing water resource allocation in ecological irrigation districts. These studies provide scientific foundations for the continued development of health assessments and development-level indicator systems for ecological irrigation districts, contributing to the enhancement of indicator scientificity and simplicity and promoting the sustainable development of ecological irrigation districts. Comprehensive health assessment not only focuses on individual indicators of ecosystems but integrates data from multiple dimensions to provide a holistic reflection of ecosystem health [19]. Ecological irrigation districts involve multiple factors spanning resources, economics, and the environment. By establishing a multi-criteria evaluation system that considers ecological, economic, and social impacts, the complexity and dynamic nature of these districts are revealed. This approach enhances the accuracy and reliability of evaluations, better adapting to the variability of ecosystems and providing robust support for informed decision-making. In practical applications, multi-criteria decision-making methods, such as the analytic hierarchy process (AHP), fuzzy comprehensive evaluation, and variable-weight matter-element models, are widely employed in comprehensive assessments [20,21]. These methods assist researchers in weighing the importance of various indicators and deriving comprehensive health evaluation results. The variable-weight matter-element model [22], a flexible and dynamic evaluation approach, can adjust weights in real time, offering a more accurate reflection of system status changes. As such, it holds significant theoretical value and practical relevance in the health assessment of ecological irrigation districts.
In multi-criteria comprehensive evaluation, the weight calculation method is critical to the scientific validity and reliability of the evaluation results [23]. As a complex coupled system, the evaluation of ecological irrigation districts involves multi-dimensional and multi-indicator trade-off analysis, making the selection of a rational weight calculation method essential for accurate assessment. Traditional weight calculation methods include subjective weighting techniques (such as expert scoring) and objective methods (such as the entropy method and the analytic hierarchy process) [24]. Although subjective methods are simple to apply, they are prone to biases influenced by individual expert preferences and experiences [25]. In contrast, objective methods reduce subjectivity but lack flexibility, making them less adaptable to dynamic system changes. To address these limitations, the variable-weight matter-element model combines matter-element analysis with variable-weight theory, offering a new solution for the dynamic evaluation of complex systems. This method allows real-time adjustment of weights based on the status or importance of indicators, adapting to changes in the system and providing a more accurate reflection of the dynamic characteristics of ecological irrigation districts [26]. For instance, during dry seasons, the weight of water resource-related indicators can be dynamically increased, enabling the evaluation to focus more on the current core issues. Furthermore, the variable-weight matter-element model minimizes subjective bias in weight allocation, significantly improving evaluation accuracy [27]. Therefore, this study adopts the variable-weight matter-element model to comprehensively evaluate the health status of ecological irrigation districts, aiming to provide new insights and a basis for the sustainable development of ecological irrigation districts.
This study focuses on the Jiaokou Chouwei Irrigation District in the Guanzhong region of Shaanxi, with the following primary objectives: (1) Based on the water–ecology–economy synergy theory, integrate field monitoring data with model simulations to establish a multi-dimensional evaluation index system for water-saving ecological irrigation districts suitable for arid and semi-arid regions; (2) to address the limitations of traditional weight allocation methods, develop an improved variable-weight model that more accurately reflects the dynamic coupling relationships among evaluation indicators; (3) apply matter-element extension theory to quantitatively assess the comprehensive development level of water-saving ecological construction in the irrigation district; and (4) through a combination of global and local sensitivity analysis methods, identify key driving factors affecting the sustainable development of the irrigation district, thereby providing a basis for formulating differentiated management and control measures.

2. Materials and Methods

2.1. Study Area

The Jiaokou Irrigation District is located in the Guanzhong region of Shaanxi Province (Figure 1) and is one of the largest electric pumping irrigation districts in the province. It covers six counties and 21 townships (villages) in Xi’an and Weinan cities, with a total population of 672,500, of whom 88.25% are agricultural residents. The total land area of the irrigation district is 102.44 square kilometers, primarily dedicated to agricultural production, making it one of the important agricultural production bases in Shaanxi. Initially, the Jiaokou Irrigation District used a traditional pressurized irrigation system, but it is currently transitioning to becoming a water-saving ecological irrigation district. This transformation is achieved through the implementation of modern water-saving technologies, such as drip irrigation and sprinkler irrigation, which enhance the precise scheduling and management of water resources to improve efficiency. At the same time, ecological protection measures, such as soil and water conservation and wetland restoration, are being promoted to restore the ecological environment. The irrigation district has implemented independent management of water resources to ensure reasonable allocation between agricultural irrigation and residential water use. Support from local government policies has provided strong backing for this transformation. In the future, the Jiaokou Irrigation District will further improve water resource management, ecological restoration, and sustainable agricultural development, continuing its progress toward becoming a water-saving ecological irrigation district. It is important to note that the Jiaokou Irrigation District does not rely entirely on pressurized irrigation systems but uses a mixed irrigation method, including traditional water diversion systems as well as pressurized irrigation technologies such as drip irrigation and sprinkler irrigation. Since the water mainly comes from the Wei River, the water supply will be allocated according to irrigation demands and regional water usage. However, agricultural irrigation may lead to water eutrophication, which poses a threat to the quality of drinking water.

2.2. Methods

2.2.1. Indicator Optimization and Screening Method

The indicator optimization and screening model involves three steps: constructing a relationship matrix, developing an inclusion criterion matrix, and optimizing the indicators.
(1)
Constructing the Relationship Matrix
Based on the preliminary selection of the indicator system, a relationship matrix R(j×g) is constructed using the factor rjg. Here, j is the j-th indicator in the (n−1)-th layer, and g represents the g-th indicator in the n-th layer. If the g-th indicator in the n-th layer is associated with the j-th indicator in the (n−1)-th layer, rjg is assigned a value of 1; otherwise, it is assigned a value of 0.
R = r 11 r j 1 r 1 g r j g ,
(2)
Constructing the Inclusion Criterion Matrix
Based on the seven principles of exclusion and integrity, an inclusion criterion matrix C(g×7) is constructed, consisting of g rows and seven columns. This matrix facilitates the optimal selection of indicators. The inclusion criterion matrix is represented as follows:
C = c 11 r g 1 c 17 r g 7 = C 1 , C 2 , , C m , , C g T ,
where g is the number of indicators and 7 is the seven inclusion criteria; when a specific indicator satisfies criterion i, cgi = 1; otherwise, cgi = 0.
(3)
Optimization of Evaluation Indicators
To ensure the completeness and simplicity of the indicator system, the objective function z can be formulated as follows:
min Z = m 1 g c i m ,
In the formula, cim is the m-th indicator; if the indicator meets at least five criteria, then cim = 1, indicating that the indicator is selected. If the indicator meets fewer than five criteria, then cim = 0, and it is excluded from the system.
c i m = 1 , L × C m T 5 0 , L × C m T < 5 ,
To ensure the connectivity between indicator levels, a vector CI = [ci1, ci2, …, cig] is constructed, which must satisfy the following conditions:
C I × R T   >   0 ,
To ensure the completeness of the indicator system, the weighted sum of all indicators must achieve a specified level of accuracy. In this study, a threshold value of 0.85 [28], commonly used in principal component analysis, was chosen to assess the completeness of the indicator system.
C I × W c i T 0.85 ,
In the formula, Wci = [ Wc1, Wc2, …, Wcg] represents the matrix composed of the weights of all indicators.

2.2.2. Variable-Weight Matter-Element Method

(1)
Classical Domain Elements
Based on the constructed indicator system, the development level of ecological irrigation districts is categorized into j evaluation grades, with n factors influencing the development status of ecological irrigation districts. The classical domain matter-element matrix can be expressed as follows:
R j = P j C j V i j = P j c 1 c 2 c n v 1 j v 2 j v n j = P j c 1 c 2 c n a 1 j , b 1 j a 1 j , b 1 j a 1 j , b 1 j ,
In the formula, Pj corresponds to the j-th evaluation grade of Ci, where Ci is the evaluation indicator with specific characteristics under grade Pj. Vij indicates the range of values for grade Pj under the characteristic Ci, expressed as Vij ij, bij).
(2)
Determination of Section Domain Elements
Building upon the classical domain, the section domain matter-element matrix RP can be expressed as follows:
R = P C j V p i = P c 1 c 2 c n v p 1 v p 2 v p n = P c 1 c 2 c n a p 1 , b p 1 a p 2 , b p 2 a p n , b p n ,
Here, P is the overall development level of the ecological irrigation district. Vpj is the range of values for P with respect to the evaluation indicator Ci.
(3)
Determination of the Matter-Element to Be Evaluated
If the parameters influencing the development level of the ecological irrigation district are expressed as matter-elements, the matter-element to be evaluated can be represented as R0:
  R 0 = P 0 C i V i = P c 1 c 2 c n v 1 v 2 v n ,
Here, P0 is the evaluation grade of the ecological irrigation district’s development level. Vi is the measured value of P0 with respect to the evaluation indicator Ci, representing the observed parameter that influences the evaluation grade of the ecological irrigation district’s development level.
(4)
Determination of Weights
The variable-weight theory, based on factor space theory, posits that the weighting of any factor during evaluation should be dynamically adjusted according to different spatial positions and temporal durations. This aligns with the intrinsic nature of weights. The variable-weight theory describes the temporal and spatial effects of weights and proposes that the relationship among weights, time, and space can be quantified through a functional model. The variable-weight comprehensive model constructed in this study is summarized as follows:
Assuming X = (x1, x2, …, xn) represents the factor state variable, W = (w1, w2, , wn) represents the constant weight variable, and S(X) = (S1(X), S2(X), …, Sn(X)) represents the state variable vector, the variable-weight vector W(X) = (W1(X), W2(X), …, Wn(X)) can be expressed as the Hadamard product of W and the normalized S(X), as follows:
W i ( X ) = W i S i ( X ) k = 1 n W k S k ( X ) , i = 1 , 2 , , n ,
In the formula, Si (X) = e a ( x i x ) ¯ , and a is the variable-weight factor. If a > 0, it indicates that the variable-weight vector has a balancing effect on the factor. If a < 0, it signifies that the variable-weight vector imposes constraints on the balancing of the factor. When a = 0, it is referred to as a constant-weight model (Table 1).
To reduce the subjectivity in assigning indicator weights and to ensure the balance among different evaluation indicators, the constant weight variables of each indicator are standardized. Simultaneously, the actual measured values of the indicators and their corresponding section domains are used to jointly determine the state variable vector. The weight calculation for the improved variable-weight vector is as follows:
w i ( X ) = exp a ( d i m a x d i min ) i = 1 n exp a ( d i m a x d i min ) ,
In the formula, dimax = max{|Vi-api|, |bpi-vi|} and dimin = min{|Vi-api|, |bpi-vi|}, and to ensure the balance among evaluation indicators for the development level of ecological irrigation districts, let a = −1.
(5)
Calculating the Proximity Function Value
The maximum membership criterion has certain limitations, as it is only applicable in cases where the evaluation grades are equally spaced, and varying expert preferences may reduce the evaluation’s validity. Proximity measures the closeness between two fuzzy sets, allowing for a more accurate determination of evaluation grades. The basic function for asymmetric proximity is as follows:
N = 1 1 n ( n + 1 ) i = 1 n D w i ,
In the formula, N represents the proximity value, wi denotes the weight of the indicator, and D represents the distance.
The proximity of different matter-elements to various evaluation grades can be expressed as Nj(P0):
N j ( P 0 ) = 1 1 n ( n + 1 ) i = 1 n D j ( v i ) w i ( X ) ,
D j ( V i ) = v i a i j + b i j 2 1 2 ( b i j a i j ) ,
In the formula, Dj(Vi) represents the distance between the classical domain and the matter-element to be evaluated, wi(X) denotes the weight of the indicator, and n represents the number of evaluation indicators.
(6)
Determining the Evaluation Grade
We refer to the existing evaluation standards for the development level of ecological irrigation districts (1—Excellent, 2—Good, 3—Moderate, 4—Passable, 5—Failing) to reflect the changes in irrigation district construction conditions from best to worst (Table 2). The proximity Nj(P0) of the matter-element R0 to each evaluation grade can be calculated using the proximity function model. If Nj(P0) = max {Nj(P0)} and (j = 1, 2, 3, 4, 5), then the matter-element R0 is determined to belong to the j evaluation grade.
N j ¯ p 0 = N j ( P 0 ) min N j ( P 0 ) max N j ( P 0 ) min N j ( P 0 ) ,
The result is as follows:
j = j = 1 m j N j ( P 0 ) j = 1 m N ¯ j ( P 0 ) ,
In the formula, j* represents the grade variable characteristic value of the matter-element R0. Based on j*, the degree to which the development level R0 of the water-saving ecological irrigation district leans toward adjacent grades can be determined.

2.3. Data Collection

In this study, a total of 57 experts and farmers participated in the evaluation of the development level of water-saving ecological irrigation districts, including 15 experts from water conservancy research institutes and universities, 13 managers from regional management organizations, and 29 farmers from the irrigation district.
When evaluating the development level of water-saving ecological irrigation districts, it is essential to establish a grade classification system for indicator samples. The rationality of this classification directly impacts the scientific validity of the evaluation results. However, research on evaluating water-saving ecological irrigation districts is currently limited, and no unified standard has been established. Therefore, the evaluation standards for water-saving ecological irrigation districts primarily include the following: ① Review relevant standards and specifications, such as the Technical Specification for Water-Saving Irrigation Engineering (GB/T 50363-2018), Code for Design of Irrigation and Drainage Engineering (GB 50288-2018), General Principles for the Construction of High-standard Farmland (GB/T 30600-2022), Requirements for Management Systems of Water Conservancy Units (SLZ 503-2016), and Guidelines for the Evaluation of Over-Extracted Groundwater Areas (SL 286-2003), along with national and industry standards. ② International Standards: international research on ecological environment assessment started earlier, providing a foundation for selecting indicators suitable for adaptation to the national context. ③ Scientific Research-Based Standards: these are derived from analyzing existing research results to determine indicator standards [29,30], serving as criteria for evaluation. Taking real-world conditions as a reference, each grade’s range is determined based on the development of ecological irrigation districts, while also considering the relationship and interdependence between the socio-economic conditions of the irrigation district and the indicators. Table 3 provides detailed information on these grades.
Based on the evaluation indicator system, statistical data for the Jiaokou Chouwei Irrigation District in 2020 were collected. The raw data mainly come from the “Feasibility Study Report on the Continuation of Infrastructure Construction and Modernization Transformation of Jiaokou Chouwei Irrigation District during the 14th Five-Year Plan” in Shaanxi Province, the “Shaanxi Provincial Water Resources Statistical Yearbook 2020”, and the “Shaanxi Provincial Water Resources Bulletin 2020”, as well as previous research by scholars [31,32]. Some data were determined based on relevant local statistical yearbooks for 2020, national economic and social development statistical bulletins, and water resources bulletins.

3. Results and Analysis

3.1. Establishment of the Indicator System

3.1.1. Preliminary Selection of Indicators

The characteristics of a water-saving ecological irrigation district include “a good ecological environment, well-integrated engineering facilities, effective resource utilization, scientific district management, and favorable economic benefits” [1]. Starting from the concept and connotation of water-saving ecological irrigation districts, the construction of such districts should follow the principles of scientific accuracy, feasibility, and comprehensiveness. The selected indicators for establishing the evaluation system should be independent, accessible, and quantifiable. Based on the literature research [33,34], expert consultation, and case analysis [15,16], this study divides the evaluation indicators into three levels for a comprehensive evaluation of the irrigation district: first, the goal level of the water-saving ecological irrigation district’s development, which focuses on the rational construction and sustainable development of the irrigation district; and second, the criterion level, which includes indicators related to the water-saving system of the irrigation district, environmental quality, ecological resources, socio-economic effects, service management systems, and the socio-ecological environment (Table 3). To objectively and accurately evaluate the water-saving ecological irrigation districts, this study adopts the system engineering approach and economic theory proposed by Dale et al. [35] to derive eight principles for selecting indicators: Measurability (M), Sensitivity (V), Predictability (P), Representativeness (T), Controllability (C), Integrity (I), Responsiveness (R), and Stability (S). Among these, Integrity refers to the construction of the entire indicator system, which, based on comprehensive statistics, has met the requirements.
In the preliminary indicator screening process, the analytic hierarchy process (AHP) was employed to determine the weights of evaluation indicators, primarily due to its hierarchical structure that effectively addresses the multi-level, multi-dimensional indicator systems commonly encountered in ecological irrigation district assessments, a characteristic not shared by data-driven methods such as the entropy weight method. Secondly, AHP enables the integration of expert judgment with objective data through the construction of judgment matrices, allowing comprehensive consideration of both qualitative and quantitative indicators. This feature makes it particularly suitable for handling indicators in ecological irrigation district evaluations that are difficult to fully quantify. Furthermore, AHP demonstrates excellent flexibility and extensibility, facilitating subsequent integration with variable-weight models for dynamic evaluation, whereas methods like CRITIC (Criteria Importance Through Intercriteria Correlation) struggle to achieve such dynamic adjustments [36].

Optimization Results of the Evaluation Indicator System

Determining the weight of each indicator is a prerequisite for optimal selection. Among the 25 initially screened indicators, the analytic hierarchy process (AHP) was applied to calculate the weights of each indicator. The specific results are shown in Table 1. The findings indicate that indicators related to the irrigation water-saving system, the environmental quality of the irrigation district, and the ecological resources of the irrigation district have the greatest impact on the construction of water-saving ecological irrigation districts. This is followed by indicators related to the human ecological environment, while those related to the service management system have the least impact.
Based on Equations (1) to (2), and incorporating the 25 water-saving ecological irrigation district evaluation indicators from the initial screening, an inclusion criterion matrix C(25×7) and a relationship matrix R(25×6) are shown in Equation (17). From this, it was determined that seven indicators could not be definitively retained, specifically CI = [1, ci2, 1, 1, ci5, ci6, 1, 1, 1, 1, 1, ci12, 1, 1, 1, ci20, ci21, 1, 1, 1, 1].
C = 1 1 1 1 1 1 1 1 1 1 0 1 1 1 1 1 1 1 1 1 1 1 1 1 1 1 1 1 1 0 1 0 1 1 1 1 1 1 0 1 1 1 1 1 1 1 1 1 1 1 1 1 1 1 0 1 1 1 1 1 1 0 1 1 1 1 1 1 1 1 1 1 1 1 1 1 1 1 1 1 1 1 1 0 1 1 0 1 1 1 1 1 1 1 1 1 0 1 1 1 1 1 1 1 1 1 0 1 0 1 1 1 1 1 1 1 1 0 1 1 1 1 1 1 0 1 1 1 1 1 1 1 1 1 0 1 1 1 0 1 1 1 0 0 1 1 1 1 1 0 0 1 1 1 1 1 0 1 1 1 1 1 1 0 1 1 1 1 1 1 0 1 1 1 1 , R T = 1 0 0 0 0 0 0 1 0 0 0 0 0 0 1 0 0 0 0 0 0 1 0 0 0 0 0 0 0 1 0 0 0 0 0 0 1 0 0 0 0 0 0 1 0 0 0 0 0 0 1 0 0 0 0 0 0 0 1 0 0 0 0 0 0 1 0 0 0 0 0 0 1 0 0 0 0 0 0 1 0 0 0 0 0 0 1 0 0 0 0 0 0 0 1 0 0 0 0 0 0 1 0 0 0 0 0 0 1 0 0 0 0 0 0 0 1 0 0 0 0 0 0 1 0 0 0 0 0 0 1 0 0 0 0 0 0 1 0 0 0 0 0 0 0 0 1 0 0 0 0 0 0 1 0 0 0 0 0 0 1 0 0 0 0 0 0 1 0 0 0 0 0 0 1 , L × C T = 5 4 5 5 3 4 5 5 5 5 5 4 5 5 5 3 5 5 5 4 4 5 5 5 5 ,
In this study, the calculation CI×RT = [3 + ci2,2 + ci5 + ci6,4 + ci12,2 + ci16,3 + ci20,4 + ci21] > 0 was conducted. Since cim is either 0 or 1, satisfying the condition CI × RT > 0 indicates that there is a certain degree of correlation among the indicators.
Principal component analysis (PCA) was employed to filter the indicators, based on Equation (6), to ensure the completeness of the indicator system. At this point,
0.8125 + 0.0244 c i 2 + 0.0326 c i 5 + 0.0408 c i 6 + 0.0432 c i 12 + 0.0166 c i 16 + 0.0087 c i 20 + 0.0216 c i 21 > 0.85 ,
0.0244 c i 2 + 0.0326 c i 5 + 0.0408 c i 6 + 0.0432 c i 12 + 0.0166 c i 16 + 0.0087 c i 20 + 0.0216 c i 21 > 0.0375 ,
Since cim=0 or 1, the satisfaction of Equation (20) is required
C I × T W c i > 0.0375 ,
cim cannot be entirely 0. At the same time, the objective function is expressed as follows:
min Z = m = 1 g c i m = 18 + c i 2 + c i 5 + c i 6 + c i 12 + c i 16 + c i 20 + c i 21 ,
To ensure that the objective function has an optimal solution and that cim is not entirely 0, six cim values must simultaneously be 0. Among ci2, ci5, ci6, ci12, ci16, ci20, ci21, the weight coefficient of ci2 is the largest, while the weights of the other six indicators are relatively small and are therefore excluded, leaving only ci2. On this basis, the 36 initial indicators were optimized to 19 indicators, as shown in Table 4. The final calculation of CI × WciT yielded a value of 85.57%, indicating that 52.78% of the indicators accounted for 85.57% of the information. This result effectively reflects the characteristics of water-saving ecological irrigation districts and ensures the simplicity and completeness of the indicator system.

3.2. Calculating the Proximity Degree and Indicator Weights

The evaluation data for the relevant indicators, denoted as the evaluated object R0, is determined using the actual measurement values and survey data of each evaluation indicator for the Jiankou Chouwei Irrigation District in Shaanxi Province in 2020.
R 0 = P 0 C 1 C 5 C 6 C 10 C 11 C 12 C 13 C 14 C 15 C 18 C 19 C 22 C 26 C 27 C 28 C 32 C 33 C 34 C 35 91.1 55 50 0.95 12.3 14.5 3 4 92 13 21.54 1.1 87 74.2 93 50 30 11.98 859.11
We calculated the weight coefficients and distances for each evaluation indicator based on Formulas (13) and (16). Detailed information is provided in Table 5.

Calculating the Membership Function Value

Based on the weight coefficients and distances of each evaluation indicator obtained from Table 4, the proximity of the evaluated elements to different evaluation levels can be further determined by substituting them into Equation (15). Detailed information is provided in Table 6.
By calculating the proximity of the evaluation indicators of the water-saving ecological irrigation district development level to the corresponding levels, it is found that the proximity value N4(P0) = max{Nj(P0)} = 0.9950, and j = 1, 2, 3, 4, 5. Referring to the development level evaluation scale of water-saving ecological irrigation districts (1—Excellent, 2—Good, 3—Moderate, 4—Passable, 5—Failing), it can be concluded that the development level of the Shaanxi Jiaokou water-saving ecological irrigation district is “Passable”. Furthermore, by using Formulas (9) and (10), it is found that j* = 3.57 < 4, indicating that the development level of the Jiaokou water-saving ecological irrigation district tends more towards the “Moderate” level, with a notable trend of development towards the moderate level.
The proximity value of the evaluation indicators corresponding to the development level of the water-saving ecological irrigation district, calculated to be 0.9950, indicates that the Shaanxi Jiaokou Chouwei water-saving ecological irrigation district is close to the “Excellent” level in terms of various indicators. However, according to the evalua-tion level system for the development of water-saving ecological irrigation districts, this district is rated as “Passable”, suggesting that its overall development level has not yet reached the expected high standards. The completion rate of major construction tasks in the Jiaokou irrigation district and the irrigation water use efficiency have both reached a “Good” level, indicating that the district has made certain achievements in the applica-tion of water-saving technologies and water resource utilization. However, the overall evaluation has not reached the “Good” level. In the district, indicators such as the groundwater utilization index, rate of decrease in water usage per hectare, salinization level, water productivity, and surface water quality are all at a moderate level. Indicators such as groundwater quality, sewage treatment rate, and harmless treatment rate of household waste are at or below the “Passable” level, reflecting that there is still room for improvement in areas such as irrigation systems, ecological water resource management, and water quality protection. In particular, there is still a need for further strengthening of technology and management in areas like salinization control and resource recycling.

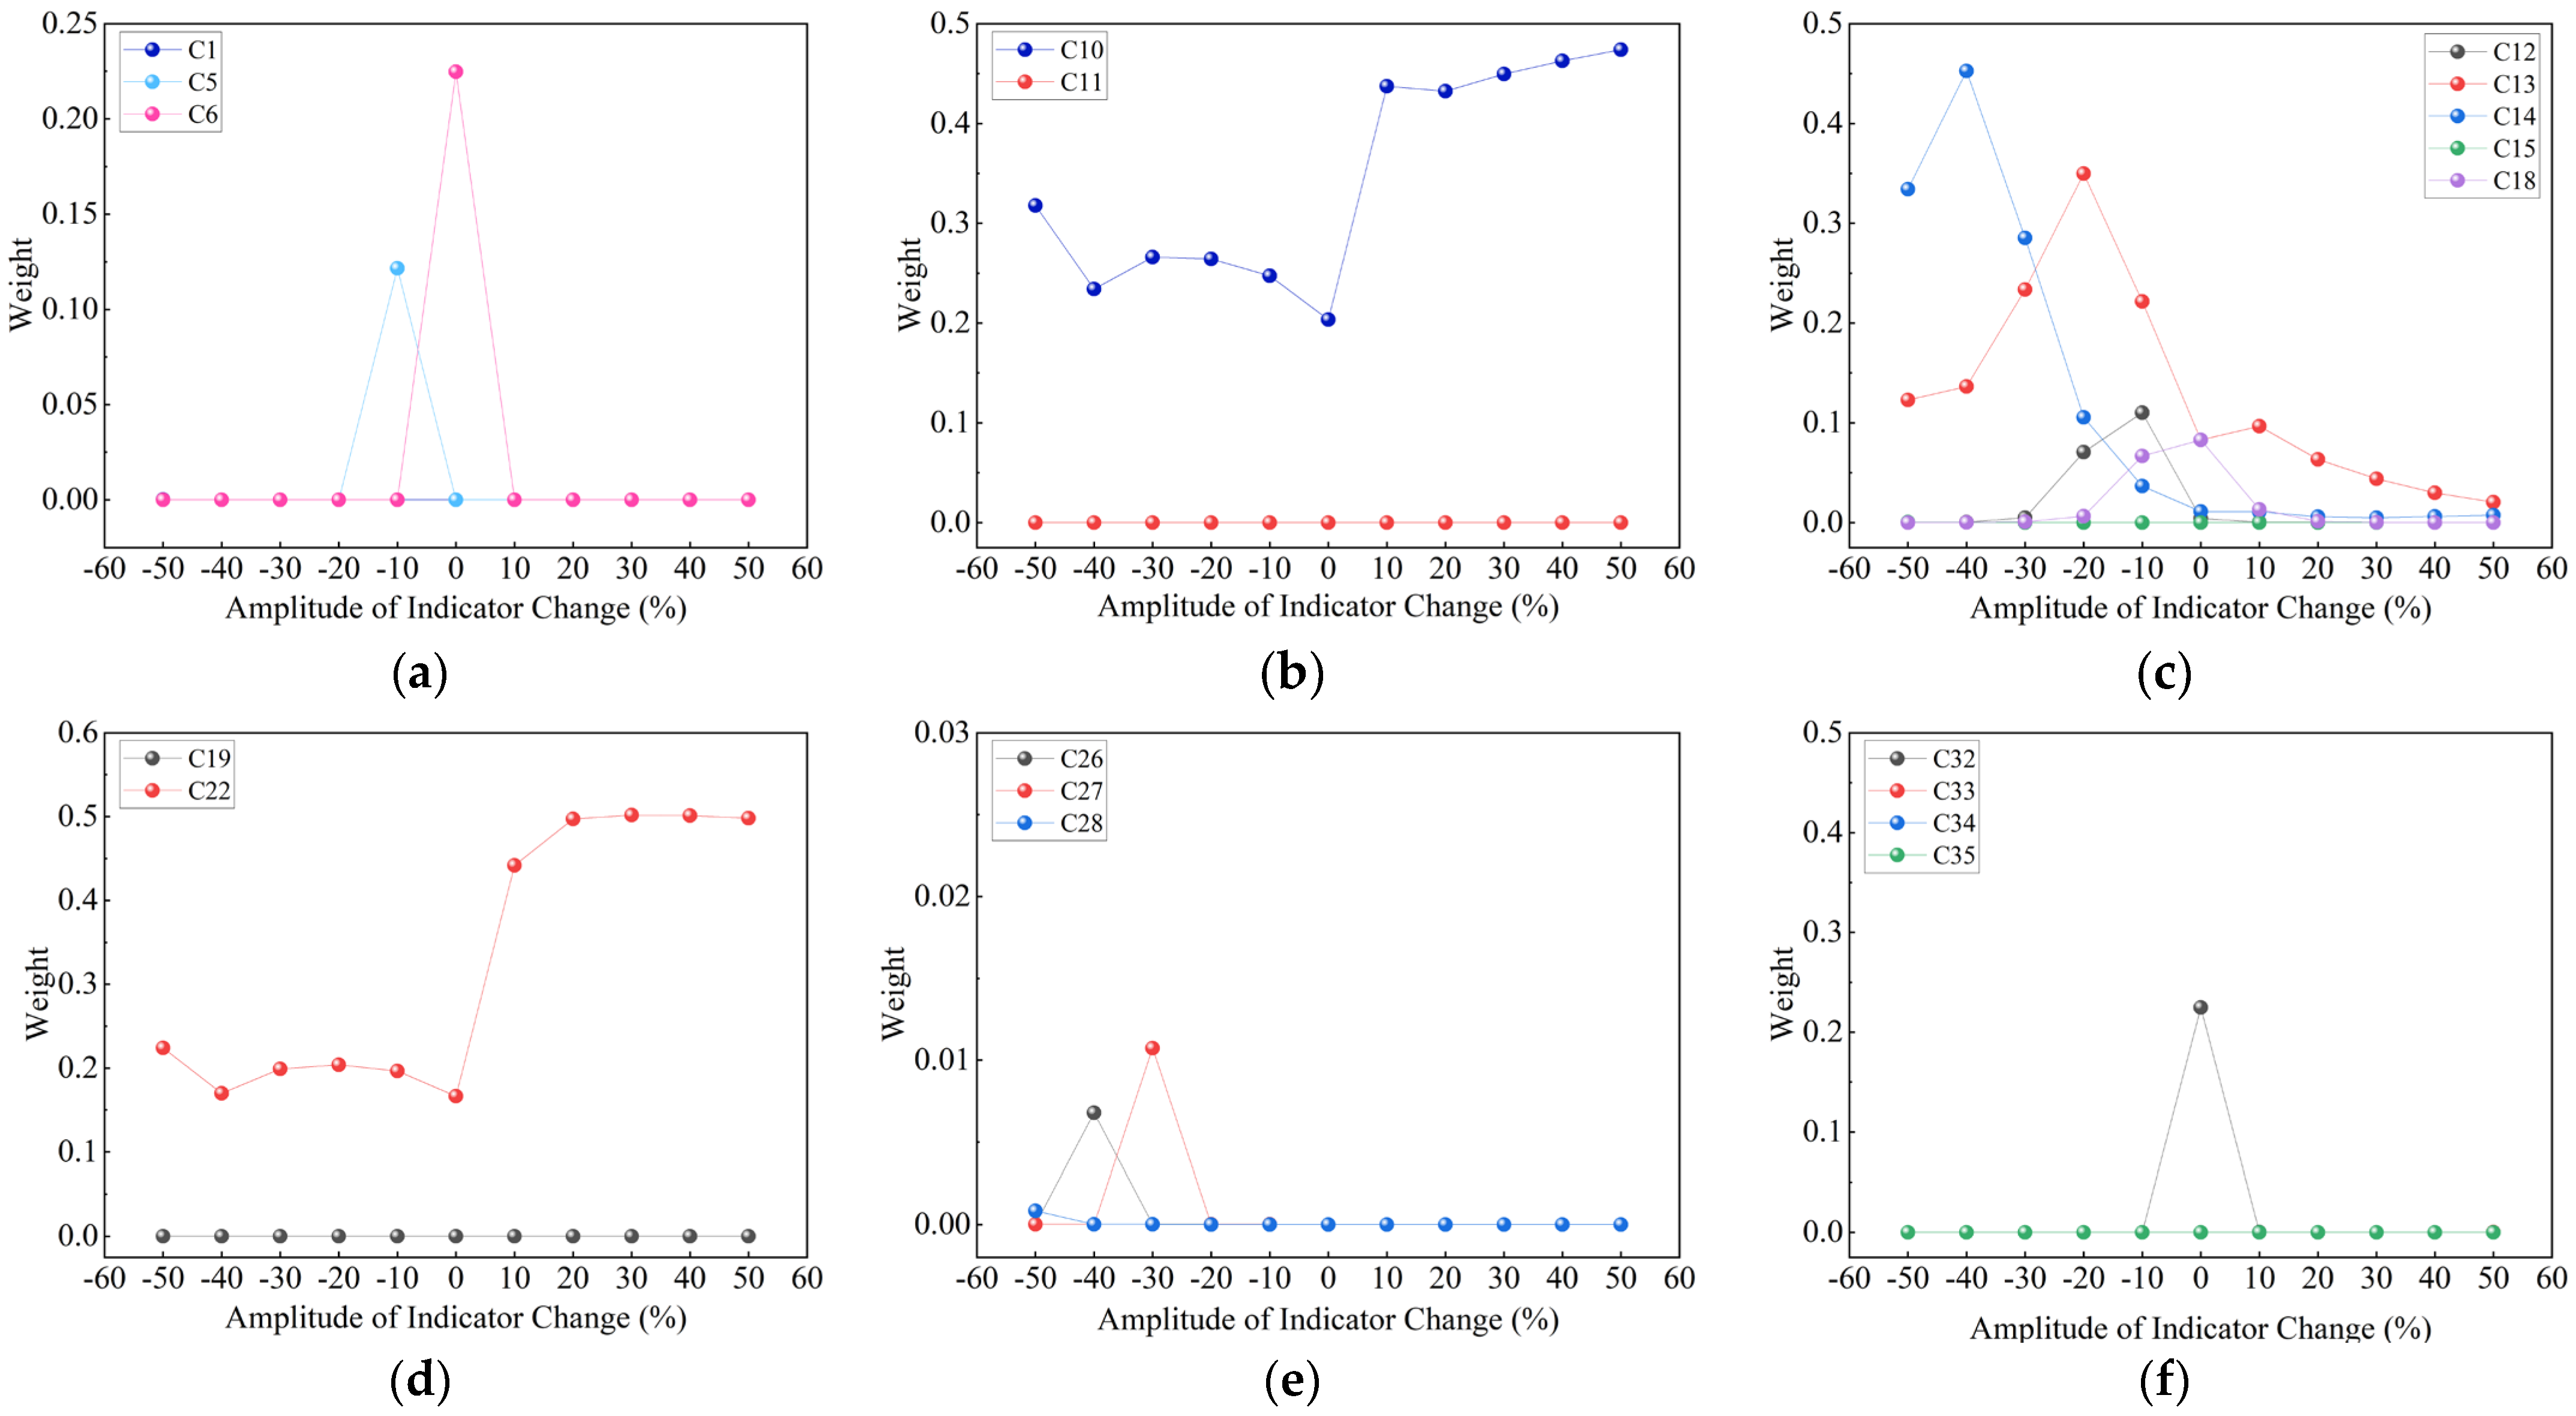
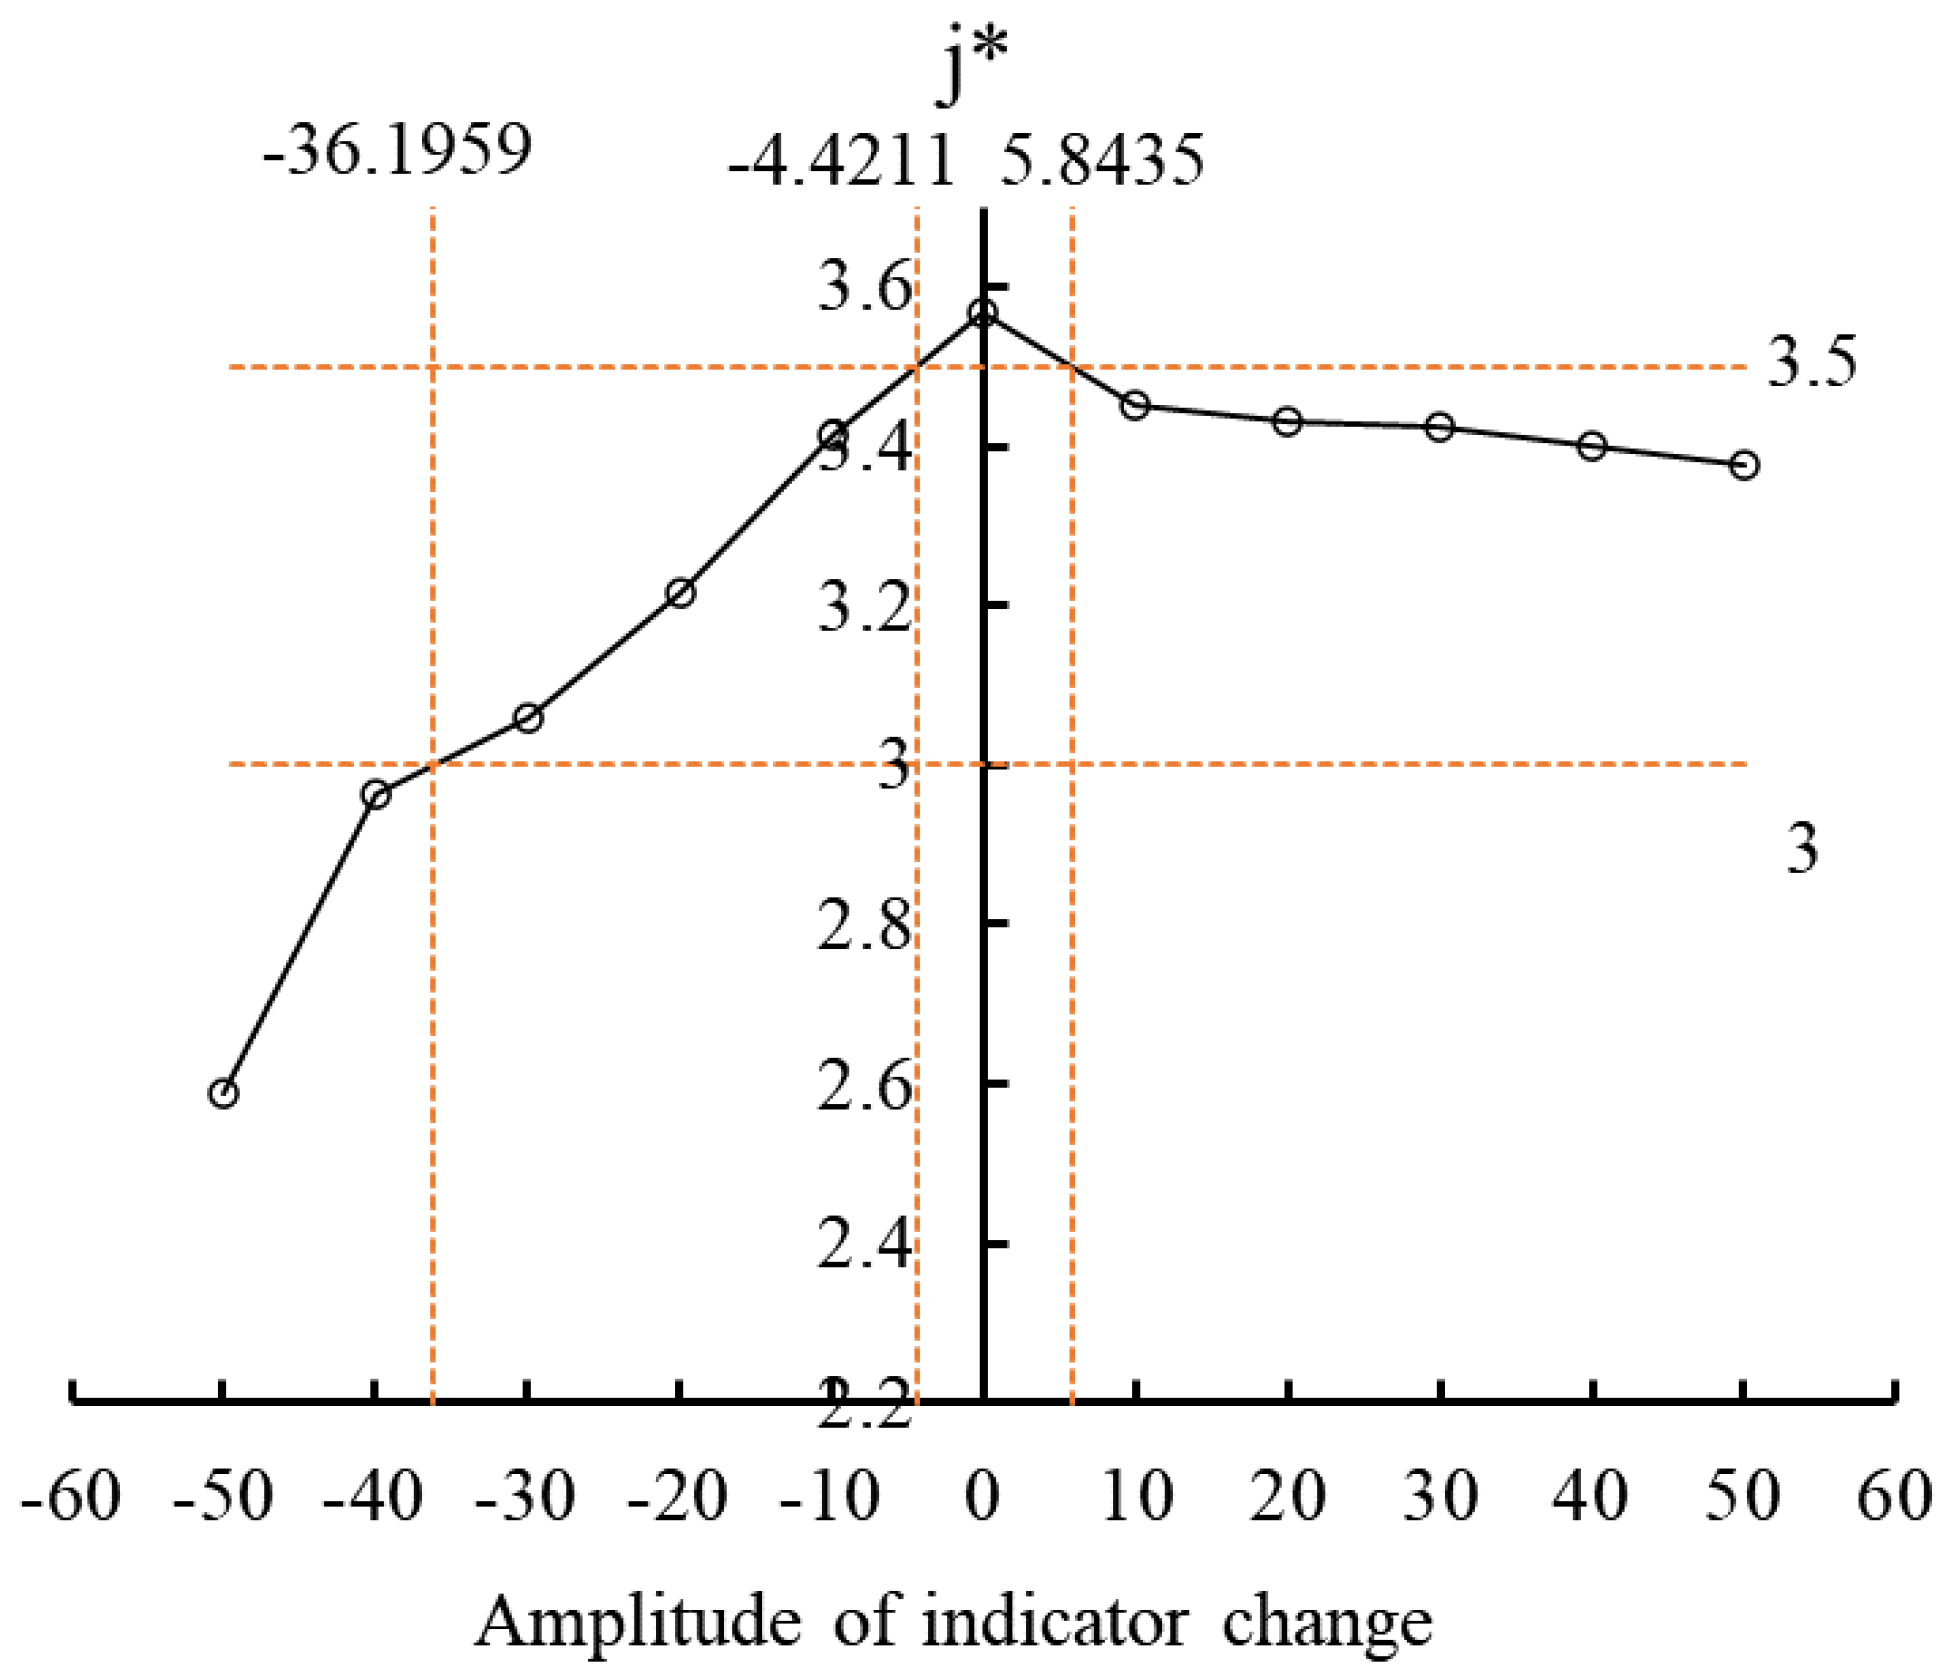
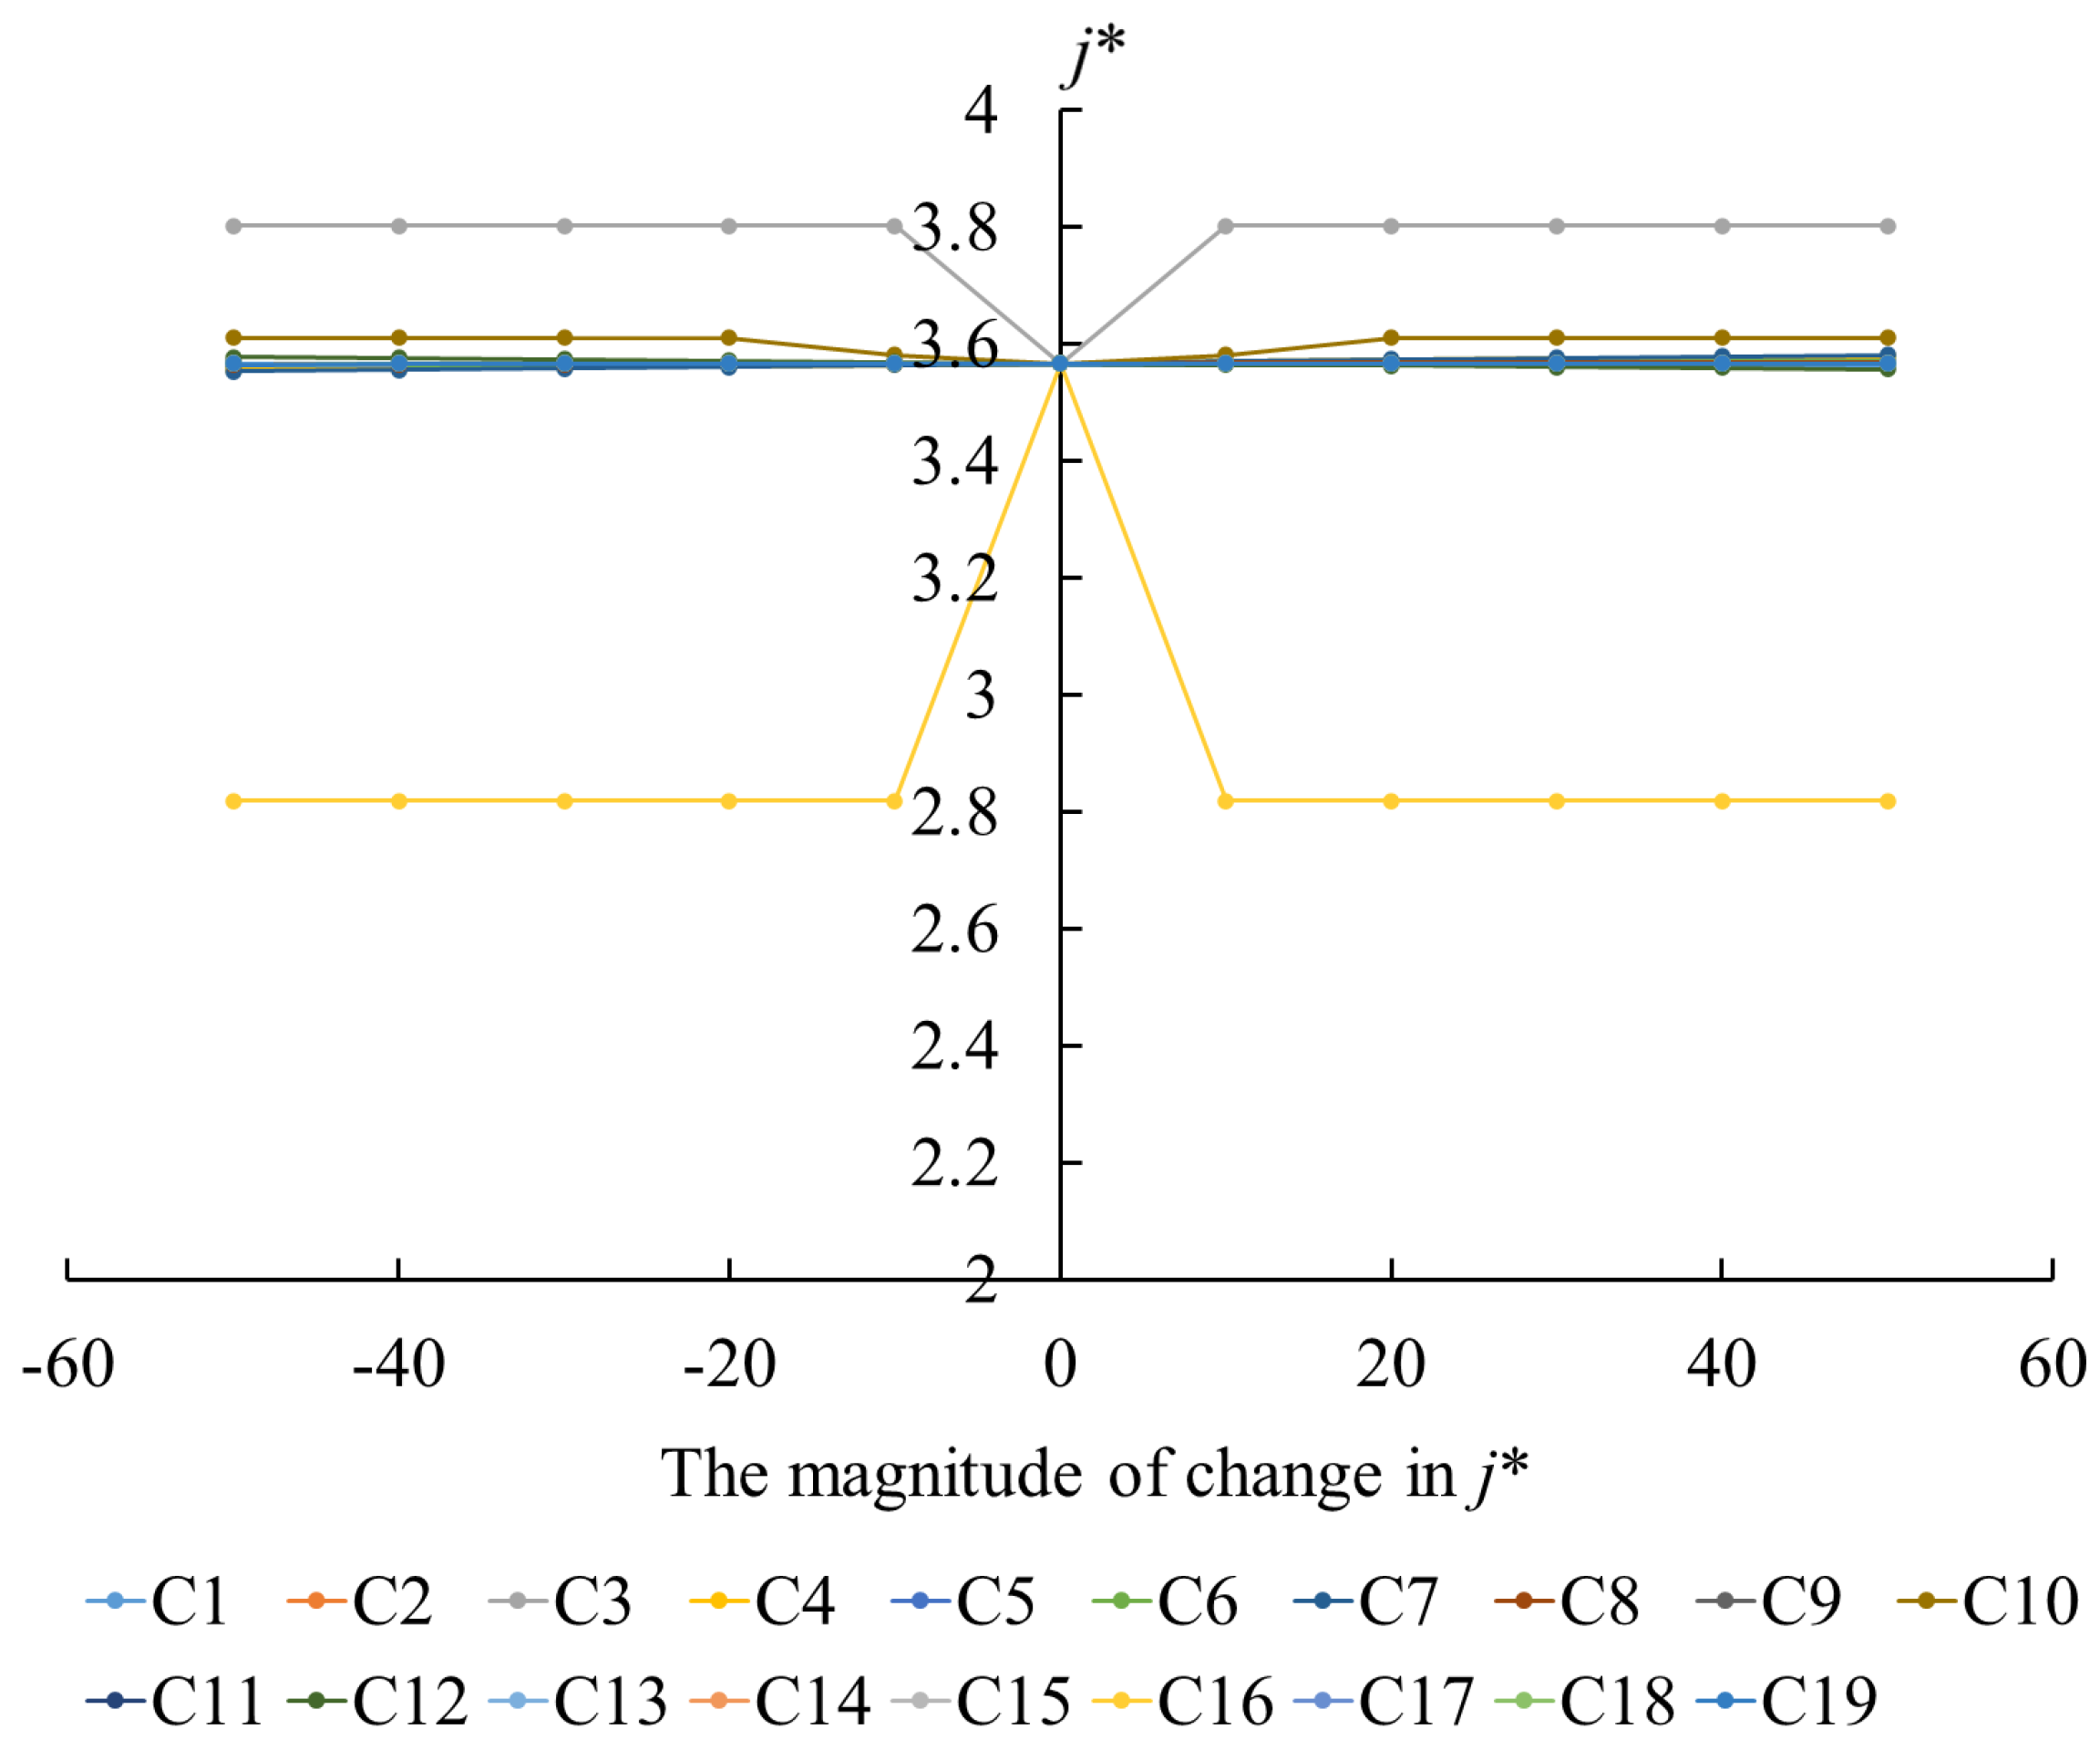
3.3. Sensitivity Analysis

To further understand the impact of each evaluation indicator on the weight and the grade variable characteristic value j*, a sensitivity analysis was conducted on the development level of the water-saving ecological irrigation district. In this analysis, the range of variation for each indicator was set at ±10%, ±20%, ±30%, ±40%, and ±50% [37], in order to observe the changes in both the weights and j*.
From Figure 2, it can be observed that among all the indicators, the weight of the socio-economic effect indicator C22 exhibits the greatest variation. Within the range of increasing values for the indicator, the weight first increases and then decreases, reaching its maximum at a 30% increase, with a weight range from 0.1665 to 0.5018. Within the range of decreasing values for the indicator, the weight first increases, then decreases, and then increases again, with turning points at −20% and −40%, indicating a strong correlation between socio-economic effects and the development level of water-saving ecological irrigation districts. The variation pattern of indicator C10 is almost identical to that of C22, suggesting a close relationship between water quality and economic benefits. Among the ecological resource indicators of the irrigation district, indicator C13 shows that with an increase in its value, the weight first increases and then decreases, reaching a maximum at 10%. As the value decreases, the weight first increases, then decreases, and stabilizes, with a peak at −20% and with a variation range of 0.3657. For indicator C14, the weight remains mostly unchanged within the range of increasing measured values, but in the decreasing range, the weight first increases, then decreases, and reaches its maximum at −40%, with a variation range from 0.0112 to 0.4526. The change trend of indicators C5 and C12 is consistent, both showing an inflection point at −10%. The difference is that the weight of C22 decreases from the trend at −30% to 0, while the weight of C11 decreases to 0 at −20%. Indicator C18 follows a similar pattern to C5 and C12, with the inflection point occurring at 0, and the decrease followed by an increase at −20% and back up to 10%. For the remaining indicators, the weight variation with changes in measured values is relatively small. Through this analysis, the active participation of each indicator in the comprehensive evaluation is highlighted. The weight values change as the indicator values change, with C5, C10, C12, C13, C14, C15, and C22 showing significant changes.
From Figure 3, it can be observed that within the range of increasing values for the indicators, the grade variable characteristic value j* gradually decreases as the values of all indicators increase simultaneously. In the range of decreasing values for the indicators, j* also gradually decreases as the values of all indicators decrease simultaneously, with the range of j* varying from 2.58 to 3.57. When the indicator values increase by more than 8.57%, and the decrease range is between 4.42% and 36.20%, the value of 3 < j* < 3.53 < j* < 3.53 < j* < 3.5 indicates that the quality level is at a medium level, with a greater tendency towards a “Good” rating. When the variation of indicator values is between −4.42% and 5.84% and 3.5 < j* < 3.6 3.5 < j* < 3.6 3.5 < j* < 3.6, it suggests that the quality level remains at a medium level, but with a trend leaning towards “Passable”.
From Figure 4, it can be seen that with the change in the range of indicator values, the range of j* is between 2.80 and 3.81. For indicator C3, when the value changes by ±10%, j* changes from 3.57 to 3.81, with the quality level remaining unchanged but with a greater tendency towards the “Passable” grade. In the other ranges of change, j* stabilizes at 3.81. For indicator C16, when the value changes by ±10%, j* shifts from 3.57 to 2.80. When the indicator change is ±7.40%, j* = 3, which shifts the quality level from medium to good. When the indicator value changes by more than ±7.40%, the quality level of the water-saving ecological irrigation district is classified as good, but with a greater tendency towards a medium level. For the remaining indicators, j* fluctuates between 3.55 and 3.61, all falling within the medium level, with a greater tendency towards the “Passable” grade. This indicates that indicator C3 (water-saving irrigation coverage rate) and indicator C16 (domestic sewage treatment rate) are the main sensitive indicators for the comprehensive evaluation of water-saving ecological irrigation districts, which aligns with the essence of water-saving ecological irrigation districts.

4. Discussion

In the construction of the indicator system, this study innovatively integrates principal component analysis (PCA) and the analytic hierarchy process (AHP), balancing the objectivity of indicator selection with the subjectivity of weight assignment. The final set of 19 core indicators explains 85.57% of the original information, achieving a high degree of structural simplification while retaining key information. Compared to the 25-indicator system proposed by Zhang et al. [14], the system developed in this study is more concise and focused, reducing redundancy and improving practical application efficiency. Moreover, in contrast to the work of Fang et al. [15], this study introduces monitoring indicators such as the “rate of decline in water use per mu”, the “irrigation water use coefficient”, and the “coverage rate of water-saving irrigation”, thereby enhancing the timeliness and adaptability of the evaluation framework to reflect the operational status of ecological irrigation districts. These additions align with the dual management objectives of water conservation and ecological balance in such systems.
The results of this study are highly consistent with findings from related research, both domestically and internationally. Water resource management and ecological environmental quality are widely recognized as core factors influencing the development level of water-saving irrigation districts. Compared with similar studies, this research demonstrates a certain degree of innovation in optimizing the indicator system and integrating multiple evaluation methods, thereby enhancing the comprehensiveness and accuracy of the assessment outcomes. For instance, the study by Wang et al. [38] identified water use efficiency and water quality management as key factors in evaluating the ecological health of irrigation districts, a conclusion that has been validated in the practical case of the Jiaokou Irrigation District in the Guanzhong region. Further sensitivity analysis reveals that the coverage rate of water-saving irrigation (C3) and the domestic wastewater treatment rate (C16) are the two most influential indicators affecting the variability of comprehensive evaluation results, highlighting their central role in the development of ecological irrigation districts. Previous research has indicated that irrigation efficiency is not only directly linked to the performance of water resource utilization but also significantly impacts ecological issues such as soil salinization and degradation, thereby serving as a foundation for maintaining soil quality and ensuring crop production safety [39]. While the primary objective of water-saving irrigation districts is to conserve water and enhance irrigation efficiency, ecological considerations elevate the importance of ecological health to an equal standing with water conservation, an alignment that fully corresponds with the definition of water-saving ecological irrigation districts. Moreover, given the diversity of irrigation water sources across different districts, some irrigation systems still heavily rely on unconventional sources characterized by poor water quality and weak regulatory oversight [40]. This reality further underscores the importance of indicators such as the domestic wastewater treatment rate and the degree of monitoring over irrigation water sources within the evaluation framework.
From the perspective of applicability, the evaluation model constructed in this study—based on the integration of optimized indicators and the variable-weight matter-element method—demonstrates strong transferability and generalizability. Although the research focuses on the Jiaokou Chouwei Irrigation District in the Guanzhong region as a case study, the model exhibits a robust logical framework in terms of indicator selection, weight determination, and dynamic evaluation mechanisms. Firstly, the indicator system established through principal component analysis (PCA) and the analytic hierarchy process (AHP) effectively combines data compression with expert knowledge, enabling adaptation to the characteristic parameters of ecological irrigation districts in different regions. Secondly, the introduction of the variable-weight matter-element model addresses the limitations of static weighting schemes that fail to capture time-varying ecological conditions, making it particularly suitable for areas with fluctuating environmental dynamics. Given that ecological irrigation districts around the world commonly face challenges such as water scarcity, environmental variability, and weak management systems, the methodology presented in this paper can be adapted—through appropriate modification of the indicator structure and weighting mechanisms—to evaluate ecological development levels in other irrigation districts. For instance, applying this model in the Mediterranean region, the rice irrigation areas of Southeast Asia, or the arid zones in Africa could not only provide a solid foundation for quantitative assessment but also support cross-regional comparisons and the formulation of governance policies.

5. Conclusions

An evaluation indicator system for the development level of water-saving ecological irrigation districts was established, consisting of six criterion layers and 19 evaluation indicators.
The development level of the Guanzhong Jiaokou Irrigation District’s ecological irrigation district was assessed using the variable-weight matter-element method. In 2020, the Jiaokou Chouwei water-saving ecological irrigation district was rated as “Passable”, with a trend towards improvement to the “Good” level.
The sensitivity analysis indicates that various evaluation indicators have a significant impact on the weight changes and the level feature value j*. Among them, C3 and C16 are key indicators influencing the quality grade of the irrigation district. Changes in other indicators, such as C5, C10, C12, C13, C14, C18, and C22, also have a considerable effect on the overall evaluation of the irrigation district.
According to the evaluation results, the Jiaokou Chouwei Irrigation District received a comprehensive score of j*= 3.57, placing it in the “Passable” category, with an overall trend toward improvement to a “Moderate” level. Detailed analysis indicates that the district demonstrates certain strengths in water-saving technologies; for instance, the irrigation water use coefficient has reached 55%. However, shortcomings remain in terms of ecological protection indicators, especially groundwater quality, which is still at Class IV. This suggests that the ecological condition of the irrigation district is mainly affected by the following factors: first, the agricultural non-point source pollution control system is not yet fully developed and lacks systematic control measures; second, the construction of ecological water replenishment infrastructure is progressing slowly and cannot adequately meet ecological water demands; and third, the ecological compensation mechanism is underdeveloped, resulting in insufficient incentives for the ecological allocation of water resources.
Based on these findings, the following policy recommendations are proposed: (1) priority should be given to the construction and upgrading of domestic wastewater treatment facilities to improve the water environment within the irrigation district; (2) a dynamic water resource regulation mechanism centered on the comprehensive evaluation value j* should be established to enable efficient and scientific resource allocation; and (3) drawing on the advanced experience of ecological irrigation districts, efforts should be made to localize the implementation of an integrated management model of “intelligent monitoring–precision irrigation–tailwater reuse” in order to enhance the overall intelligence and ecological performance of irrigation district management.

Author Contributions

R.J.: conceptualization, data curation, investigation, visualization, writing—original draft, and writing—review and editing. P.R.: formal analysis, reviewing and editing, and supervision. L.F.: reviewing and editing, and supervision. All authors have read and agreed to the published version of the manuscript.

Funding

This study was supported by the Science and Technology Planning Project of Shaanxi Provincial Department of Water Resources (No. 2024slkj-4) and the National Natural Science Foundation of China (No. 52079105).

Data Availability Statement

The original contributions presented in the research are included in the article; further inquiries can be directed to the corresponding author.

Conflicts of Interest

The authors declare that they have no known competing financial interests or personal relationships that could have appeared to influence the work reported in this paper.

References

  1. Wang, Y.; Zhang, H. The Connotation, Characteristics, Main Contents and Evaluation Research System and Construction of Ecological Irrigation District. IOP Conf. Ser. Earth Environ. Sci. 2021, 643, 12080. [Google Scholar] [CrossRef]
  2. Huo, X.; Shi, H.; Yang, S.; Li, Z.; Gong, X.; Yang, X. Comprehensive assessment on water-saving renovation of large-scale irrigation districts in Inner Mongolia based on hierarchical analysis- ant colony algorithm. Trans. Chin. Soc. Agric. Eng. 2014, 30, 132–140. [Google Scholar]
  3. Girma, M.; Jemal, A. Irrigation system in Israel: A review. Int. J. Water Resour. Environ. Eng. 2015, 7, 29–37. [Google Scholar] [CrossRef]
  4. Riedener, E.; Rusterholz, H.-P.; Baur, B. Effects of different irrigation systems on the biodiversity of species-rich hay meadows. Agric. Ecosyst. Environ. 2013, 164, 62–69. [Google Scholar] [CrossRef]
  5. Agassi, M.; Letey, J.; Farmer, W.J.; Clark, P. Soil Erosion Contribution to Pesticide Transport by Furrow Irrigation. J. Environ. Qual. 1995, 24, 892–895. [Google Scholar] [CrossRef]
  6. Zubair, L. Modernisation of Sri Lanka’s Traditional Irrigation Systems and Sustainability. Sci. Technol. Soc. 2005, 10, 161–195. [Google Scholar] [CrossRef]
  7. Liu, S.; Wu, F.; Li, P.; Wang, D.; Feng, X.; Wang, Z.; Yan, L.; Zhang, Z.; Li, Y.; Ji, M.; et al. An Evaluation on the Effect of Water-Saving Renovation on a Large-Scale Irrigation District: A Case Study in the North China Plain. Agronomy 2024, 14, 1434. [Google Scholar] [CrossRef]
  8. van der Laan, M.; Virtanen, S.; Matsuno, Y.; Castelli, G.; Fayrap, A.; Cresswell, R.; Hsieh, M.K. Ecosystem services of irrigated and controlled drainage agricultural systems: A contemporary global perspective. Irrig. Drain. 2024, 73, 1823–1837. [Google Scholar] [CrossRef]
  9. Dahmouni, M.; Hoermann, G.; Jouzdan, O.; Hachicha, M. Export of salt and heavy metals in an area irrigated with treated wastewater: A case study from Cebala Borj-Touil (Tunisia). Desalin. Water Treat. 2018, 102, 61–70. [Google Scholar] [CrossRef]
  10. Reyes, S.R.C.; Miyazaki, A.; Yiu, E.; Saito, O. Enhancing sustainability in traditional agriculture: Indicators for monitoring the conservation of globally important agricultural heritage systems (GIAHS) in Japan. Sustainability 2020, 12, 5656. [Google Scholar] [CrossRef]
  11. Surian, N.; Rinaldi, M. Morphological response to river engineering and management in alluvial channels in Italy. Geomorphology 2003, 50, 307–326. [Google Scholar] [CrossRef]
  12. Mohammed Barznji, D. Role ff Aquatic Plants in Improving Water Quality. UJPBS 2014, 2, 12–16. [Google Scholar]
  13. Singh, P.K.; Deshbhratar, P.B.; Ramteke, D.S. Effects of sewage wastewater irrigation on soil properties, crop yield and environment. Agric. Water Manage. 2012, 103, 100–104. [Google Scholar] [CrossRef]
  14. Zhang, Q.; Diao, Y.; Yang, G.; Peng, Z.; Wang, G.; Zhang, P.; Pan, J. Study on Health Evaluation of an Ecological Irrigation District in Helan County, China. Water 2021, 13, 3325. [Google Scholar] [CrossRef]
  15. Fang, Y.; Yang, P.; Song, S.; Du, J.; Xue, Y.; Su, Y. Secondary Fuzzy Comprehensive Evaluation Model for Ecosystem Health of Irrigation District and Its Application. Available online: https://www.ingentaconnect.com/content/tcsae/tcsae/2011/00000027/00000011/art00038 (accessed on 28 November 2024).
  16. Sun, S.; Liu, J.; Wu, P.; Wang, Y.; Zhao, X.; Zhang, X. Comprehensive evaluation of water use in agricultural production: A case study in Hetao Irrigation District, China. J. Clean. Prod. 2016, 112, 4569–4575. [Google Scholar] [CrossRef]
  17. Oad, R.; Garcia, L.; Kinzli, K.D.; Patterson, D.; Shafike, N. Decision support systems for efficient irrigation in the middle rio grande valley. J. Irrig. Drain. Eng. 2009, 135, 177–185. [Google Scholar] [CrossRef]
  18. Xevi, E.; Khan, S. A multi-objective optimisation approach to water management. J. Environ. Manage. 2005, 77, 269–277. [Google Scholar] [CrossRef]
  19. Ban, X.; Qi, T.; Wang, H.Z.; Du, H.; Diplas, P.; Xiao, F.; Du, Y.; Gao, W.J.; Guo, W.X.; Shi, X.; et al. Comprehensive Environmental Flows Assessment for Multi-Guilds in the Riparian Habitats of the Yangtze River. Water Resour. Res. 2022, 58, e2021WR030408. [Google Scholar] [CrossRef]
  20. Kaushik, S.; Joshi, L.K.; Pamt, S.; Kumar, A.; Ram, M. Exploring the diverse applications of the analytic hierarchy process: A comprehensive review. Math. Eng. Sci. Aerosp. 2024, 15, 525. [Google Scholar]
  21. Equihua, M.; Aldama, M.E.; Gershenson, C.; López-Corona, O.; Munguía, M.; Pérez-Maqueo, O.; Ramírez-Carrillo, E. Ecosystem antifragility: Beyond integrity and resilience. PeerJ 2020, 8, e8533. [Google Scholar] [CrossRef]
  22. Li, K.; Bai, H.; Yan, X.; Zhao, L.; Wang, X. Cooperative Efficiency Evaluation System for Intelligent Transportation Facilities Based on the Variable Weight Matter Element Extension. Sustainability 2023, 15, 2411. [Google Scholar] [CrossRef]
  23. Zhou, P.; Ang, B.W.; Poh, K.L. Comparing aggregating methods for constructing the composite environmental index: An objective measure. Ecol. Econ. 2006, 59, 305–311. [Google Scholar] [CrossRef]
  24. Pichler, A.; Schlotter, R. Entropy based risk measures. Eur. J. Ofoperational Res. 2020, 285, 223–236. [Google Scholar] [CrossRef]
  25. Sangiorgio, V.; Uva, G.; Fatiguso, F. Optimized AHP to overcome limits in weight calculation: Building performance application. J. Constr. Eng. Manag. 2018, 144, 4017101. [Google Scholar] [CrossRef]
  26. Feng, Y.; Fanghui, Y.; Li, C. Improved Entropy Weighting Model in Water Quality Evaluation. Water Resour. Manage. 2019, 33, 2049–2056. [Google Scholar] [CrossRef]
  27. Chang, T.; Jiang, S.; Peng, W. Evaluation of Land Eco-Security of Sichuan Province Based on Entropy Weight and Matter Element Model. Chin. Agric. Sci. Bull. 2015, 31, 122–127. [Google Scholar]
  28. Li, L.; Zhang, L.; Li, D.; Qin, X.; Liu, X. Indicators selecting model for applicability evaluation of greenhouse intelligentcontrol system. Trans. CSAE 2012, 28, 143–153. [Google Scholar] [CrossRef]
  29. Cui, J.T.; ·Maimaitiming, T.; Zhang, L.; Liu, Y.H.; Ni, Q.; Sun, X.Q.; Zhou, W.T. Comprehensive evaluation for water-saving society construction in Xinjiang based on analytic hierarchy process method. J. Irrig. Drain. 2020, 39, 129–132. [Google Scholar]
  30. Yang, Z.F.; Tian, J.C.; Feng, K.P. Health evaluation of the modern ecological irrigation district using multisource data in Helan County, Ningxia, China. Trans. CSAE 2021, 37, 307–316. [Google Scholar] [CrossRef]
  31. Ding, X.F. Research on Optimization and Benefit Evaluation of Water Transmission and Distribution System; Northwest A&F University: Yangling, China, 2020. [Google Scholar]
  32. Haghnegahdar, A.; Razavi, S. Insights into sensitivity analysis of Earth and environmental systems models: On the impact of parameter perturbation scale. Environ. Model. Softw. 2017, 95, 115–131. [Google Scholar] [CrossRef]
  33. Xu, X.H.; Dong, J.; Peng, Z.G.; Zhang, Q.; Wang, Y.Y.; Zhang, F. Screening and Evaluation on Health indexes in Helan Ecological Irrigation Area. Nat. Sci. Ed. 2020, 51, 1069–1073. [Google Scholar] [CrossRef]
  34. Wang, C.; Wang, P.F.; Hou, J.; Qian, J.; Rao, L.; Ao, Y.H. Main contents and key technologies of constructing ecological water saving irrigation district. Water Resour. Prot. 2015, 31, 1–7. [Google Scholar] [CrossRef]
  35. Dale, V.H.; Beyeler, S.C. Challenges in the development and use of eco-logical indicators. Ecol. Indi. 2001, 1, 3–10. [Google Scholar] [CrossRef]
  36. Alinezhad, A.; Khalili, J. Critic Method. In New Methods and Applications in Multiple Attribute Decision Making (MADM); International Series in Operations Research & Management Science; Springer: Cham, Switzerland, 2019; Volume 277. [Google Scholar] [CrossRef]
  37. Li, Y. Evaluation of Soil Environmental Quality in the Guanzhong Major Grain-Producing Region of Shaanxi Province. J. Agric. Res. Environ. 2008, 0.3, 111–113. [Google Scholar]
  38. Wang, X.H. Ecological Health Evaluation of Pingfangzi Irrigation District in Kazuo County. Water Soil Conserv. Appl. Technol. 2024, 3, 33–35. [Google Scholar] [CrossRef]
  39. Causapé, J.; Quílez, D.; Aragüés, R. Irrigation efficiency and quality of irrigation return flows in the Ebro River Basin: An overview. Environ. Monit. Assess. 2006, 117, 451–461. [Google Scholar] [CrossRef]
  40. Malakar, A.; Snow, D.D.; Ray, C. Irrigation water quality—A contemporary perspective. Water 2019, 11, 1482. [Google Scholar] [CrossRef]
Figure 1. The location of the studied irrigation districts.
Water 17 01556 g001
Figure 2. The change of weight with single indicator values: (a) Irrigation water-saving system; (b) Environmental quality; (c) Ecological resources; (d) Socio-economic effects; (e) service management system; (f) human ecological environment.
Water 17 01556 g002
Figure 3. The case of j* changing with each indicator value at the same time.
Water 17 01556 g003
Figure 4. The case where j* changes with a single indicator value.
Water 17 01556 g004
Table 1. Variable weight factor α type and representation meaning.
α ValueTypeInterpretation
α > 0Incentive typeIndicates low requirements for the balance of factors.
α < 0Punishment typeImplies a certain level of requirement for the balance among factors.
α = 0Constant typeThe model becomes a constant-weight model.
α = −1Equilibrium typeRepresents equal and balanced consideration among all factors.
α ∈ [−1, 0]Punishment typeThe smaller the α value, the greater the emphasis on balanced consideration of factors.
α < −1Extreme typeIndicates that the decision-maker is approaching an extreme situation, which should be avoided.
Table 2. Evaluation criteria division.
Indicator
Level
ExcellentGoodModeratePassableFailing
Completion rate of main
Construction tasks
(90, 100)(80, 90)(70, 80)(60, 70)(0, 60)
Irrigation water utilization coefficient(60, 100)(55, 60)(50, 55)(45, 50)(40, 0)
Coverage rate of water-saving irrigation(60, 100)(52, 60)(44, 52)(35, 44)(35, 0)
Surface water ammonia
Nitrogen concentration
(0, 0.15)(0.15, 0.5)(0.5, 1.0)(1.0, 1.5)(1.5, 2)
Soil heavy metal content(0, 15)(15, 20)(20, 30)(30, 40)(40, 50)
Groundwater utilization
Index
(0, 1)(1, 5)(5, 15)(15, 20)(20, 25)
Surface water quality(0, 1)(1, 2)(2, 3)(3, 4)(4, 5)
Groundwater quality(0, 1)(1, 2)(2, 3)(3, 4)(4, 5)
Ecological water demand satisfaction rate(85, 100)(77, 85)(69, 77)(60, 69)(0, 60)
Salinization index (0, 5)(5, 10)(10, 15)(15, 20)(20, 25)
Reduction rate of water consumption per unit area (40, 100)(30, 40)(20, 30)(3, 20)(0, 3)
Water productivity(2, 2.5)(1.5, 2.0)(1.0, 1.5)(0.5, 1.0)(0.5, 0)
Professional competence of irrigation management staff(80, 100)(70, 80)(60, 70)(50, 60)(0, 50)
Participation rate of farmers’ water user associations(60, 100)(54, 60)(48, 54)(40, 48) (0, 40)
Financial support for irrigation district projects (95, 100)(80, 95)(40, 80)(10, 40)(0, 10)
Domestic sewage treatment rate(80, 100)(70, 80)(60, 70)(50, 60)(0, 50)
Harmless treatment rate of domestic waste(85, 100)(70, 85)(55, 70)(40, 55)(0, 40)
Pesticide use intensity(0, 30)(30, 50)(50, 80)(80, 100)(100, 120)
Fertilizer use intensity(0, 1500)(1500, 2000)(2000, 2500)(2500, 3000)(3000, 3500)
Table 3. Preliminary statistics on indicators for water-saving eco-irrigation zones.
2nd-Level IndicatorWeights3rd-Level IndicatorEffect DirectionStandard
Compliance
Weights
B1: Irrigation
Water-Saving
System
0.2423C1: Completion Rate of Main
Construction Tasks (%)
+MVPTCRS0.0301
C2: Building Integrity Rate (%)+MVPCRS0.0244
C3: Irrigation Design Assurance Rate (%)+MPCS
C4: Proportion of Effective
Irrigated Area (%)
+MPCS
C5: Irrigation Water Utilization Coefficient (%)+MVPTCRS0.1098
C6: Coverage Rate of Water-Saving Irrigation (%)+MVPTCRS0.0780
B2: Environmental Quality of
Irrigation District
0.2423C7: Daily Air Quality Excellence Rate (%)-MPCRS0.0326
C8: Chemical Oxygen Demand (COD) (mg/L)-MVPCRS0.0408
C9: Irrigation Water Quality
Compliance Rate (%)
+MVTR
C10: Surface Water Ammonia Nitrogen Concentration (mg/L)-MVPTCRS0.1117
C11: Soil Heavy Metal Content (mg/kg)-MVPTCS0.0572
B3: Ecological Resources of Irrigation District0.2423C12: Groundwater Utilization
Index (%)
+/-MVPTCS0.0327
C13: Surface Water Quality+MVPTCRS0.0663
C14: Groundwater Quality+MVPTCRS0.0222
C15: Ecological Water Demand Satisfaction Rate (%) MVPTCR0.0432
C16: Water Area Ratio (%)+MPCS
C17: Forest Coverage Rate (%)+MPCS
C18: Salinization Index (%)-MVTCRS0.0780
B4: Socioeconomic Effectiveness0.0829C19: Reduction Rate of Water Consumption per Unit Area (%)+MVPTCS0.0332
C20: Increase Rate of Grain Yield per Unit Area (%)+MPC
C21: Increase Rate of GDP per Unit Water Usage (%)+MPC
C22: Water Productivity (kg/m³)+MVPTCRS0.0432
C23: Agricultural Water Productivity (kg/m³)+MPCRS0.0780
C24: Farmers’ Per Capita Net Income+MVPT
B5: Service Management System0.0534C25: Management of Irrigation Work Systems+VPCS
C26: Professional Competence of Irrigation Management Staff (%)+MVPTCS0.0081
C27: Participation Rate of Farmers’ Water User Associations (%)+MVPTCS0.0280
C28: Financial Support for Irrigation District Projects (%)+MVPTCRS0.0087
C29: Agricultural Water Resource Management Efficiency (%)+MPTCS0.0087
B6: Human and Ecological Environment0.1369C30: Population Coverage Rate of Centralized Water Supply (%)+MPCS
C31: Compliance Rate of Centralized Drinking Water Source Quality (%)+MVCRS0.0216
C32: Domestic Sewage Treatment Rate (%)+MVTCRS0.0472
C33: Harmless Treatment Rate of Domestic Waste (%)+MVTCRS0.0359
C34: Pesticide Use Intensity (kg/hm2)-MVTCRS0.0161
C35: Fertilizer Use Intensity (kg/hm2)-MVTCRS0.0161
C36: Farmers’ Awareness of Ecological Water Saving+VTR
Note: M, V, P, T, C, R, S represent the measurability, vulnerability, predictability, typicality, controllability, responsiveness, and stability of the indexes.
Table 4. Optimization results of the indicator system.
2nd-Level Indicator3rd-Level IndicatorDefinition of IndicatorsValues
B1C1: Completion Rate of Main
Construction Tasks (%)
The ratio of completed main construction tasks to the planned main construction tasks.91.10
C5: Irrigation Water Utilization Coefficient (%)The ratio of field net water demand to the canal inlet water volume.55
C6: Coverage Rate of Water-Saving Irrigation (%)The ratio of the area controlled by water-saving irrigation projects to the effective irrigated area of the irrigation district.50
B2C10: Surface Water Ammonia
Nitrogen Concentration (mg/L)
0.95
C11: Soil Heavy Metal Content (mg/kg) 12.3
B3C12: Groundwater Utilization
Index (%)
The ratio of annual groundwater usage to groundwater replenishment.14.50
C13: Surface Water Quality
C14: Groundwater Quality
C15: Ecological Water Demand Satisfaction Rate (%)The ratio of actual ecological water supply to ecological water demand.92
C18: Salinization Index (%)The ratio of salinized cultivated land area to the total cultivated land area.13
B4C19: Reduction Rate of Water Consumption per Unit Area (%)The ratio of the difference between the average water usage per mu in the irrigation district and the irrigation quota to the irrigation quota.21.54
C22: Water Productivity (kg/m³)The amount of crop yield obtained per unit of water used.1.10
B5C26: Professional Competence of Irrigation Management Staff (%)The ratio of the number of employees with titles above assistant engineer to the total number of management staff in the irrigation district.87
C27: Participation Rate of Farmers’ Water User Associations (%)The ratio of the irrigation area managed by the farmers’ water user association to the effective irrigation area of the irrigation district.74.20
C28: Financial Support for Irrigation District Projects (%)The funding allocation for the maintenance, repair, and management personnel of the irrigation district’s infrastructure.93
B6C32: Domestic Sewage Treatment Rate (%)The amount of treated sewage/total amount of sewage discharged from the irrigation district.50
C33: Harmless Treatment Rate of Domestic Waste (%) 30
C34: Pesticide Use Intensity (kg/hm2)The ratio of pesticide usage to the total sown area of crops.11.98
C35: Fertilizer Use Intensity (kg/hm2)The ratio of fertilizer usage to the total sown area of crops.859.11
Table 5. Weighting and rank distance values of water-saving eco-irrigation district indicators.
IndicatorsD1(vi)D2(vi)D3(vi)D4(vi)D5(vi)Weight
C1−1.10 1.10011.10 21.1031.10 0
C55.00 0.00 0.00 5.00 10.00 0
C610.00 2.00 −2.00 6.00 15.00 0.2792
C100.80 0.45 −0.05 0.05 0.55 0.0103
C11−2.70 2.70 7.70 17.7027.70 0
C1213.50 9.50 −0.50 0.50 5.50 0.0051
C132.00 1.00 0.00 0.00 1.00 0.1027
C143.00 2.00 1.00 0.00 0.00 0.0139
C15−7.00 7.00 15.00 23.0032.00 0
C188.00 3.00 −2.00 2.00 7.00 0.1027
C1918.46 8.46 −1.54 1.54 18.54 0
C220.90 0.40 −0.10 0.10 0.60 0.2068
C26−7.00 7.00 17.00 27.0037.00 0
C27−14.20 14.20 20.20 26.2034.20 0
C282.00 −2.00 13.00 53.0083.00 0
C3230.00 20.00 10.00 0.00 0.00 0.2792
C3355.00 40.00 25.00 10.00 −10.00 0
C34−11.98 18.02 38.02 68.02 88.02 0
C35−640.89 640.89 1140.89 1640.89 0.890
Table 6. The proximity between the evaluated element and different evaluation levels.
N1(P0)N2(P0)N3(P0)N4(P0)N5(P0)
Closeness value0.96710.98230.99470.99500.9864
Disclaimer/Publisher’s Note: The statements, opinions and data contained in all publications are solely those of the individual author(s) and contributor(s) and not of MDPI and/or the editor(s). MDPI and/or the editor(s) disclaim responsibility for any injury to people or property resulting from any ideas, methods, instructions or products referred to in the content.

