Article

Is the Indus Basin Drying? Disparities in the Environmental Flow, Inflow, and Outflow of the Basin

1
The National Key Laboratory of Water Disaster Prevention, College of Hydrology and Water Resources, Hohai University, Nanjing 210098, China
2
College of Hydrology and Water Resources, Hohai University, 1 Xikang Road, Nanjing 210098, China
3
Department of Civil Engineering, University North, 42000 Varaždin, Croatia
4
Department of Geodesy and Geomatics, University North, 48000 Koprivnica, Croatia
5
ARC Centre of Excellence for the Weather of the 21st Century, Fenner School of Environment and Society, The Australian National University, Australian Capital Territory, Canberra 2600, Australia
6
International Water Management Institute, 12 KM Multan Road, Thokar Niaz Baig, Lahore 53700, Pakistan
7
Geological and Geophysical Engineering Department, Faculty of Petroleum and Mining Engineering, Suez University, Suez 43518, Egypt
*
Authors to whom correspondence should be addressed.
Water 2025, 17(10), 1557; https://doi.org/10.3390/w17101557
Submission received: 28 March 2025 / Revised: 9 May 2025 / Accepted: 16 May 2025 / Published: 21 May 2025

Abstract

Under the 1960 Indus Water Treaty, Pakistan owned the Western rivers (Indus, Jhelum, and Chenab) and India the Eastern rivers (Ravi, Suleimanki, and Beas). Pakistan’s per capita water availability will reduce from 5260 m3 to less than 1000 m3 by 2025, causing water stress. The Indus Basin’s water availability was examined at inflow and outflow gauges between 1991 and 2015. The Indus Basin inflow and outflow gauges indicated exceptionally low and high flows before, during, and after floods. Lower flow values vary greatly for the Indus, Chenab, and Jhelum rivers. During Rabi and Kharif, the Indus and Chenab rivers behaved differently. Lower flows (Q90 to Q99) in Western Rivers are more periodic than higher flows (Q90 to Q99) and medium flows (Q90 to Q99). The outflow gauge Kotri reported 35% exceedance with zero flows during pre-flood and post-flood seasons and 50% during flood season, indicating seasonal concerns. Outflow and inflow both fell, particularly after the year 2000, according to data collected over a longer period (1976–2015). Low storage and regulating upstream capacity caused the Indus Basin outflow to reach 28 MAF (million acre feet) between 1976 and 2015, which is 70% more than the permitted 8.6 MAF downstream Kotri gauge. For 65 percent of the year, the Indus Basin does not release any water downstream of Kotri. As a result, the ecosystem relies on an annual influx of at least 123 MAF to sustain itself, and an outflow of 8.6 MAF from the Indus Basin necessitates an inflow of 113.51 MAF. At high-flow seasons, the Indus Basin experiences devastating floods, yet it dries out at a frightening rate before and after floods. The preservation of ecosystems and riparian zones downstream depends on the large environmental flows in eastern rivers. This is achievable only by fully implementing IWT and improving water management practices at western rivers.

1. Introduction

Rivers are a component of the hydrological cycle and provide for biological needs and maintain a healthy ecosystem [1,2]. From a hydrological perspective, a healthy river has an ability to maintain its ecosystem and undergo self-repair due to external influences [3,4]. However, anthropogenic activities, industrialization, urbanization, and extreme climatic events derived from global warming are influencing freshwater availability as well as the ecosystem of the river [5,6]. Global rivers have been much influenced by these activities, causing a significant impact on the river water availability and the ecosystem services of the river [1,4,7,8,9]. These external disturbances exceed the resilience and auto-rehabilitation of the river ecosystem, thus leading to degradation and impaired services [5,6]. However, in the context of climate change, it is not easy to understand the variations in river water availability or its quantification, especially in rapidly varying environments [10,11,12,13]. Many researchers have put their efforts into developing indicators to assess the river’s health [14,15,16,17,18,19]; however, the river’s health can only be assessed based on evaluation indicators [3,6,17].
Rivers are paramount in steering ecosystem functions [16,20]. However, alterations occurring within river channels have substantially disrupted their natural flow patterns [21,22]. The construction of dams, for instance, has directly impacted the connectivity of water between upstream and downstream sections. Refs. [22,23,24], affecting approximately 60% of the world’s rivers [23,25,26,27,28,29]. The relationship between interventions and the flow regime should be carefully balanced [30,31]. The flow regime, comprising aspects like flow duration, frequency, timing, magnitude, and the rate of change, is intrinsically linked to river systems’ environmental, ecological, and hydrological processes [32,33,34]. Climate change has undeniably influenced water resources. In 2020, the United Nations released a report titled “Water and Climate Change”, highlighting the significant impact of climate change on water quality, quantity, and availability. This aspect is crucial in fulfilling the rapidly increasing water needs caused by population increase [35]. Lucinda [36] predicted that with a global population of 9.1 billion by 2050, water consumption would increase by 55%.
Pakistan’s population, ranked sixth globally, is predicted to reach 250 million by 2025 [37], with the Indus Basin accounting for 80 percent of this total [38]. Surprisingly, river water availability has shifted from excess to deficit, falling from 5260 m3 per capita in the early 1950s to 1100 m3 per capita in 2005, and is anticipated to drop to 725 m3 per capita by 2025 under present trends [39]. This represents a 400% decrease in per capita water availability inside Pakistan’s Indus Basin. The World Resource Institute has highlighted the increasing demand for water resources worldwide, naming Pakistan as a country suffering water shortage, with a reported 1017 m3 per capita water availability [40]. According to the forecast, Pakistan will be one of the top 33 countries suffering severe water stress by 2030 [41]. These data highlight the urgent need for a systematic strategy to address the country’s growing water shortage.
The Indus Basin, which contains seven major rivers, including the Indus, Jhelum, Chenab (i.e., western rivers), the Ravi, Sutlej, and Bias (eastern rivers), is divided geographically between Pakistan and India [42], while the seventh river is the Kabul, which originates from the Hindukush mountainous ranges. Pakistan did not have any legal or policy documents regarding using water from the Kabul River, which flows between Afghanistan and Pakistan. This basin is an agricultural hub primarily reliant on irrigated farming, with cash and food crops covering almost 100% and 90% of the region, respectively [43,44]. Concerns have been expressed about the basin’s diminishing water supplies, indicating a crisis in Pakistan’s water economy [45]. Several studies concentrate on the management of water resources in the Indus Basin. Ahmed [38] and Watto examined the overall status of water resources and the challenges involved within the basin. Ahmad and Ahmad [46] discussed the enhancement of agricultural water supply and demand through the reduction of conveyance losses in the basin, whereas Dars et al. [47] examined the effects of climate change on the basin’s water resources. Experts from the World Bank highlighted the country’s diminishing water economy [45]. The discourse on water governance and adaptation was conducted by Yang et al. [48]. Drought fluctuations at the watershed scale were examined by Ur Rahman et al. [49]. None of them evaluated the river water at the inflow and outflow gauges of the Indus Basin, including its seasonal variations and the implications of environmental flows. Given these conditions, we evaluated the difference in water inflow and outflow within the Indus Basin. We examined the temporal changes in river flows, focusing on many variables. First, we examined seasonal flow duration curves based on flow and cropping seasons, focusing on low flow (Q90 and Q99) and high flow (Q5 and Q10) and their temporal fluctuations. Secondly, we investigated changes in ecological fluxes into and out of the basin. Finally, we examined the periodic changes in the environmental flow components entering and exiting the basin. Through this study, we aim to provide thorough insights into past variations in river water levels, offer strategies to alleviate the basin’s concerns, and assess whether the Indus Basin is experiencing drought by examining the imbalances in inflow and outflow dynamics within the basin.

2. Materials and Methods

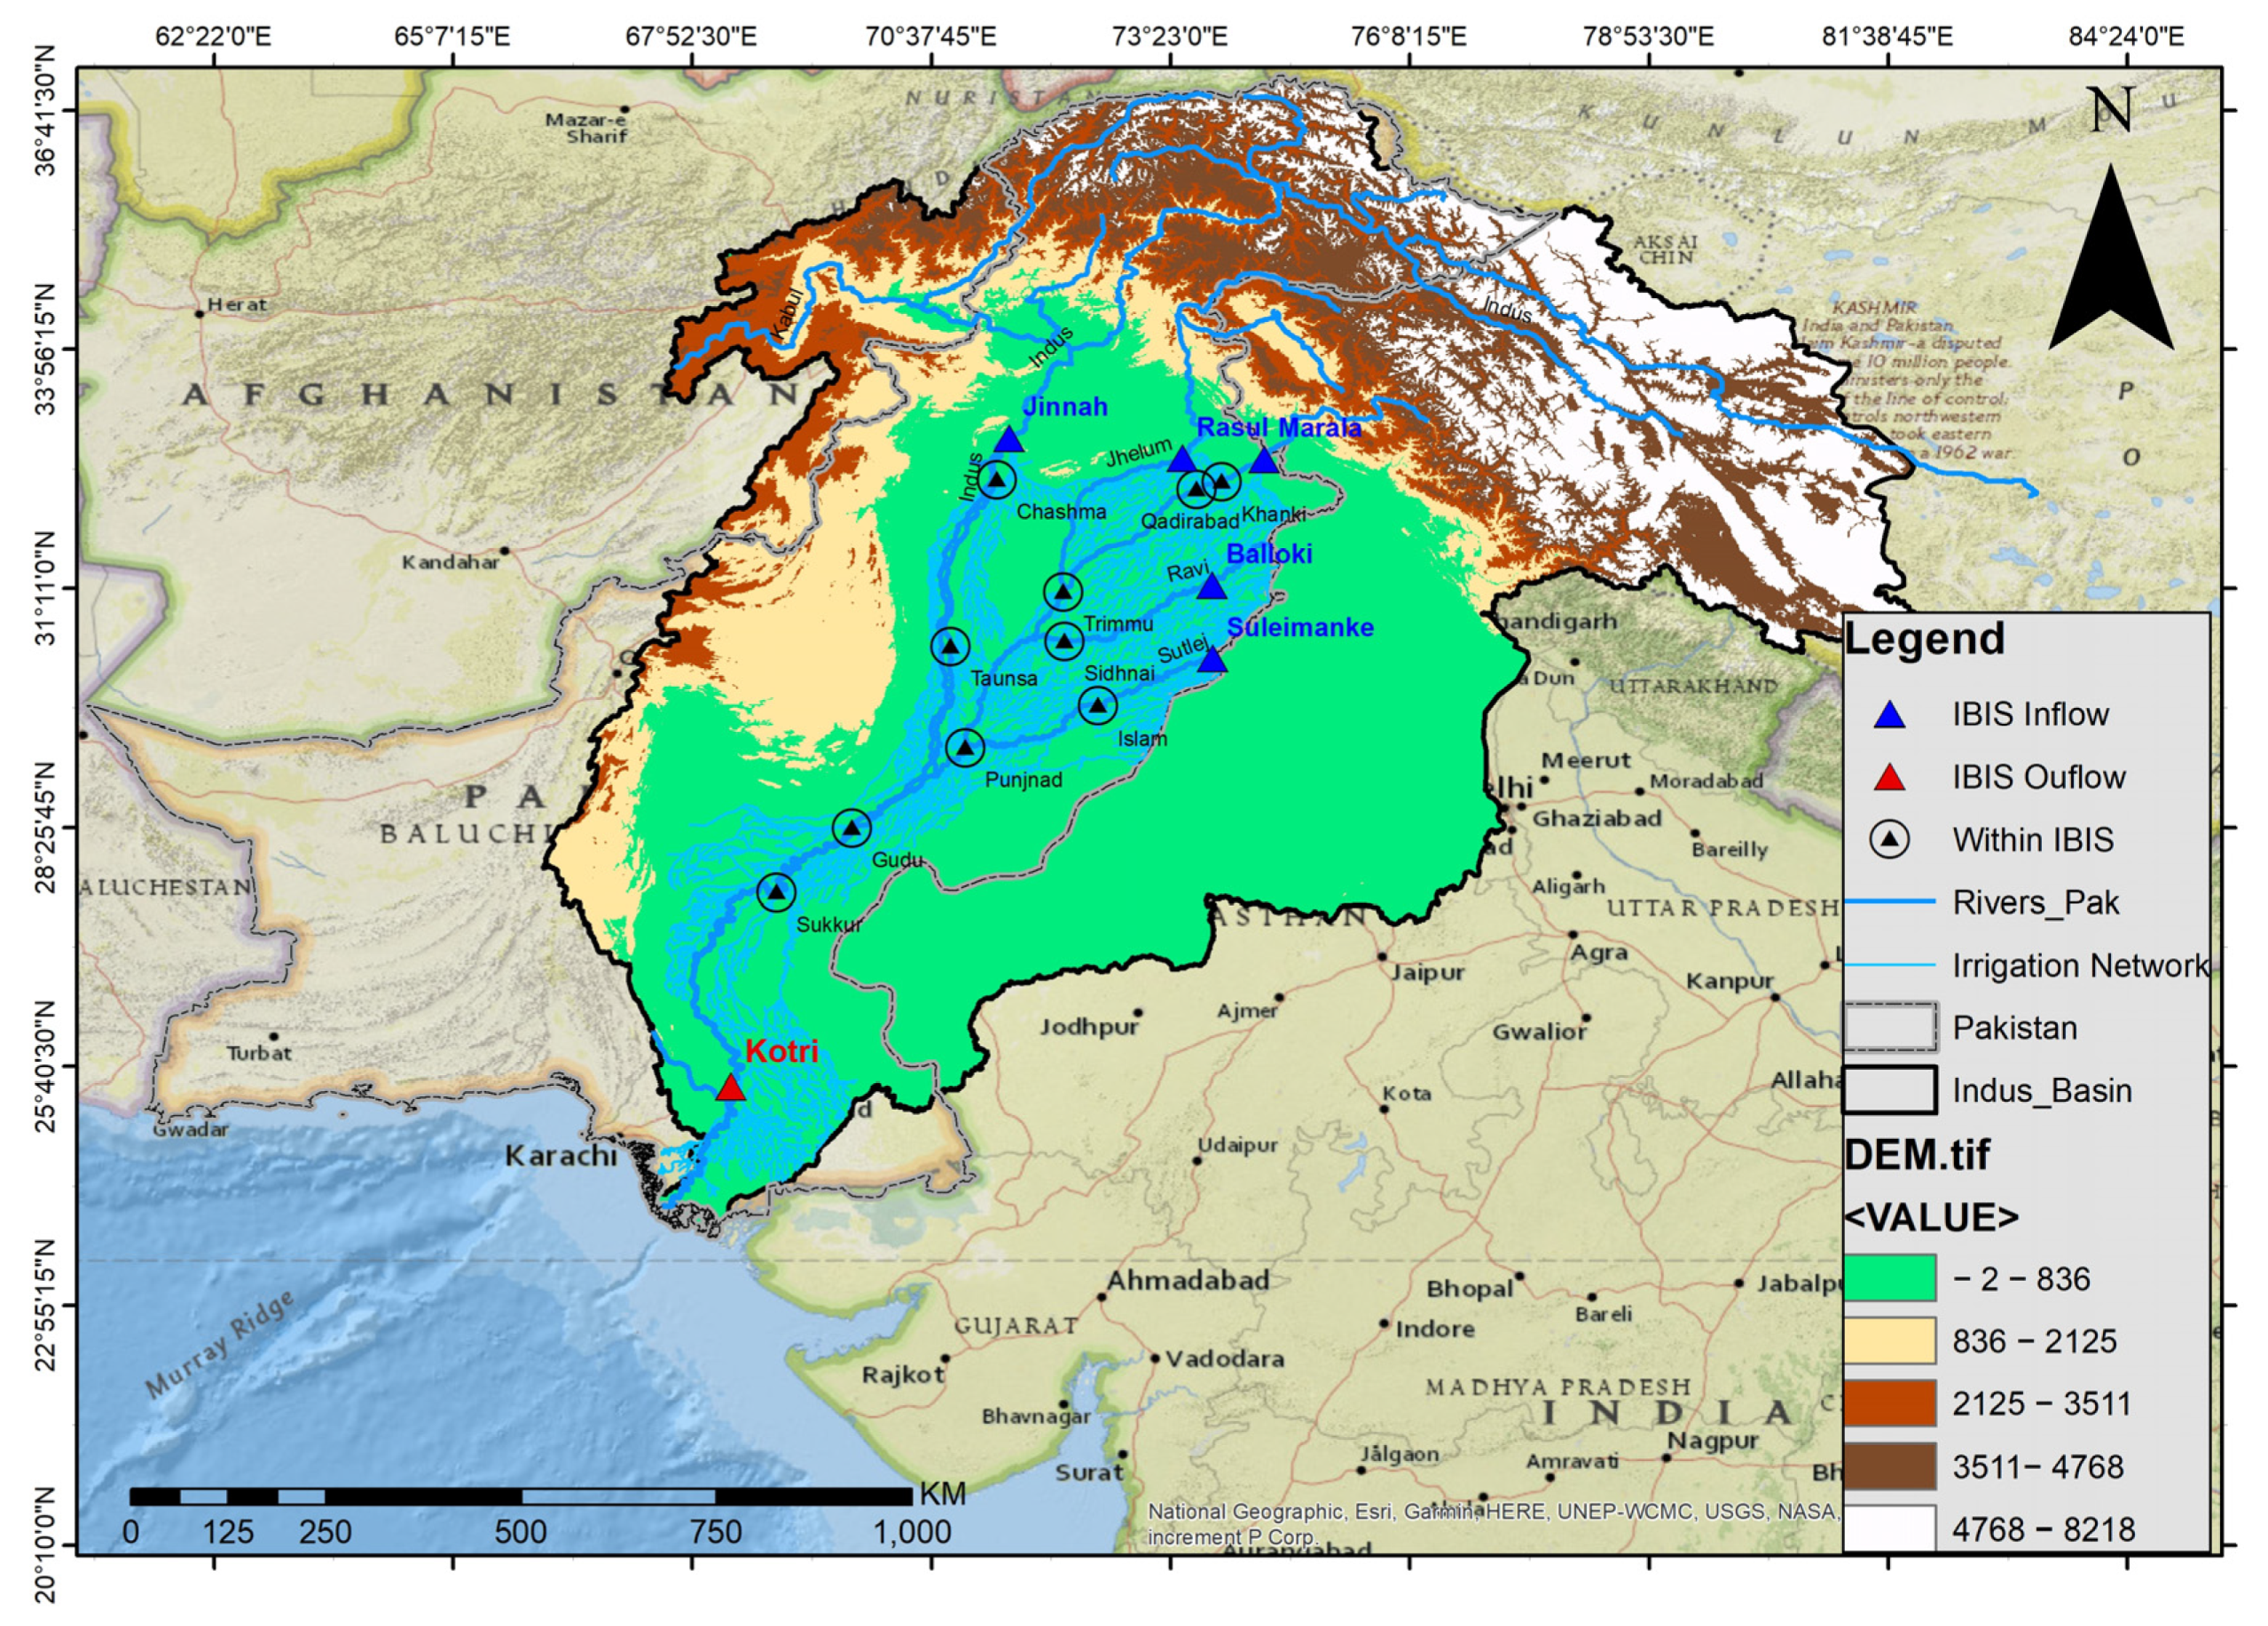
2.1. Study Area and Dataset
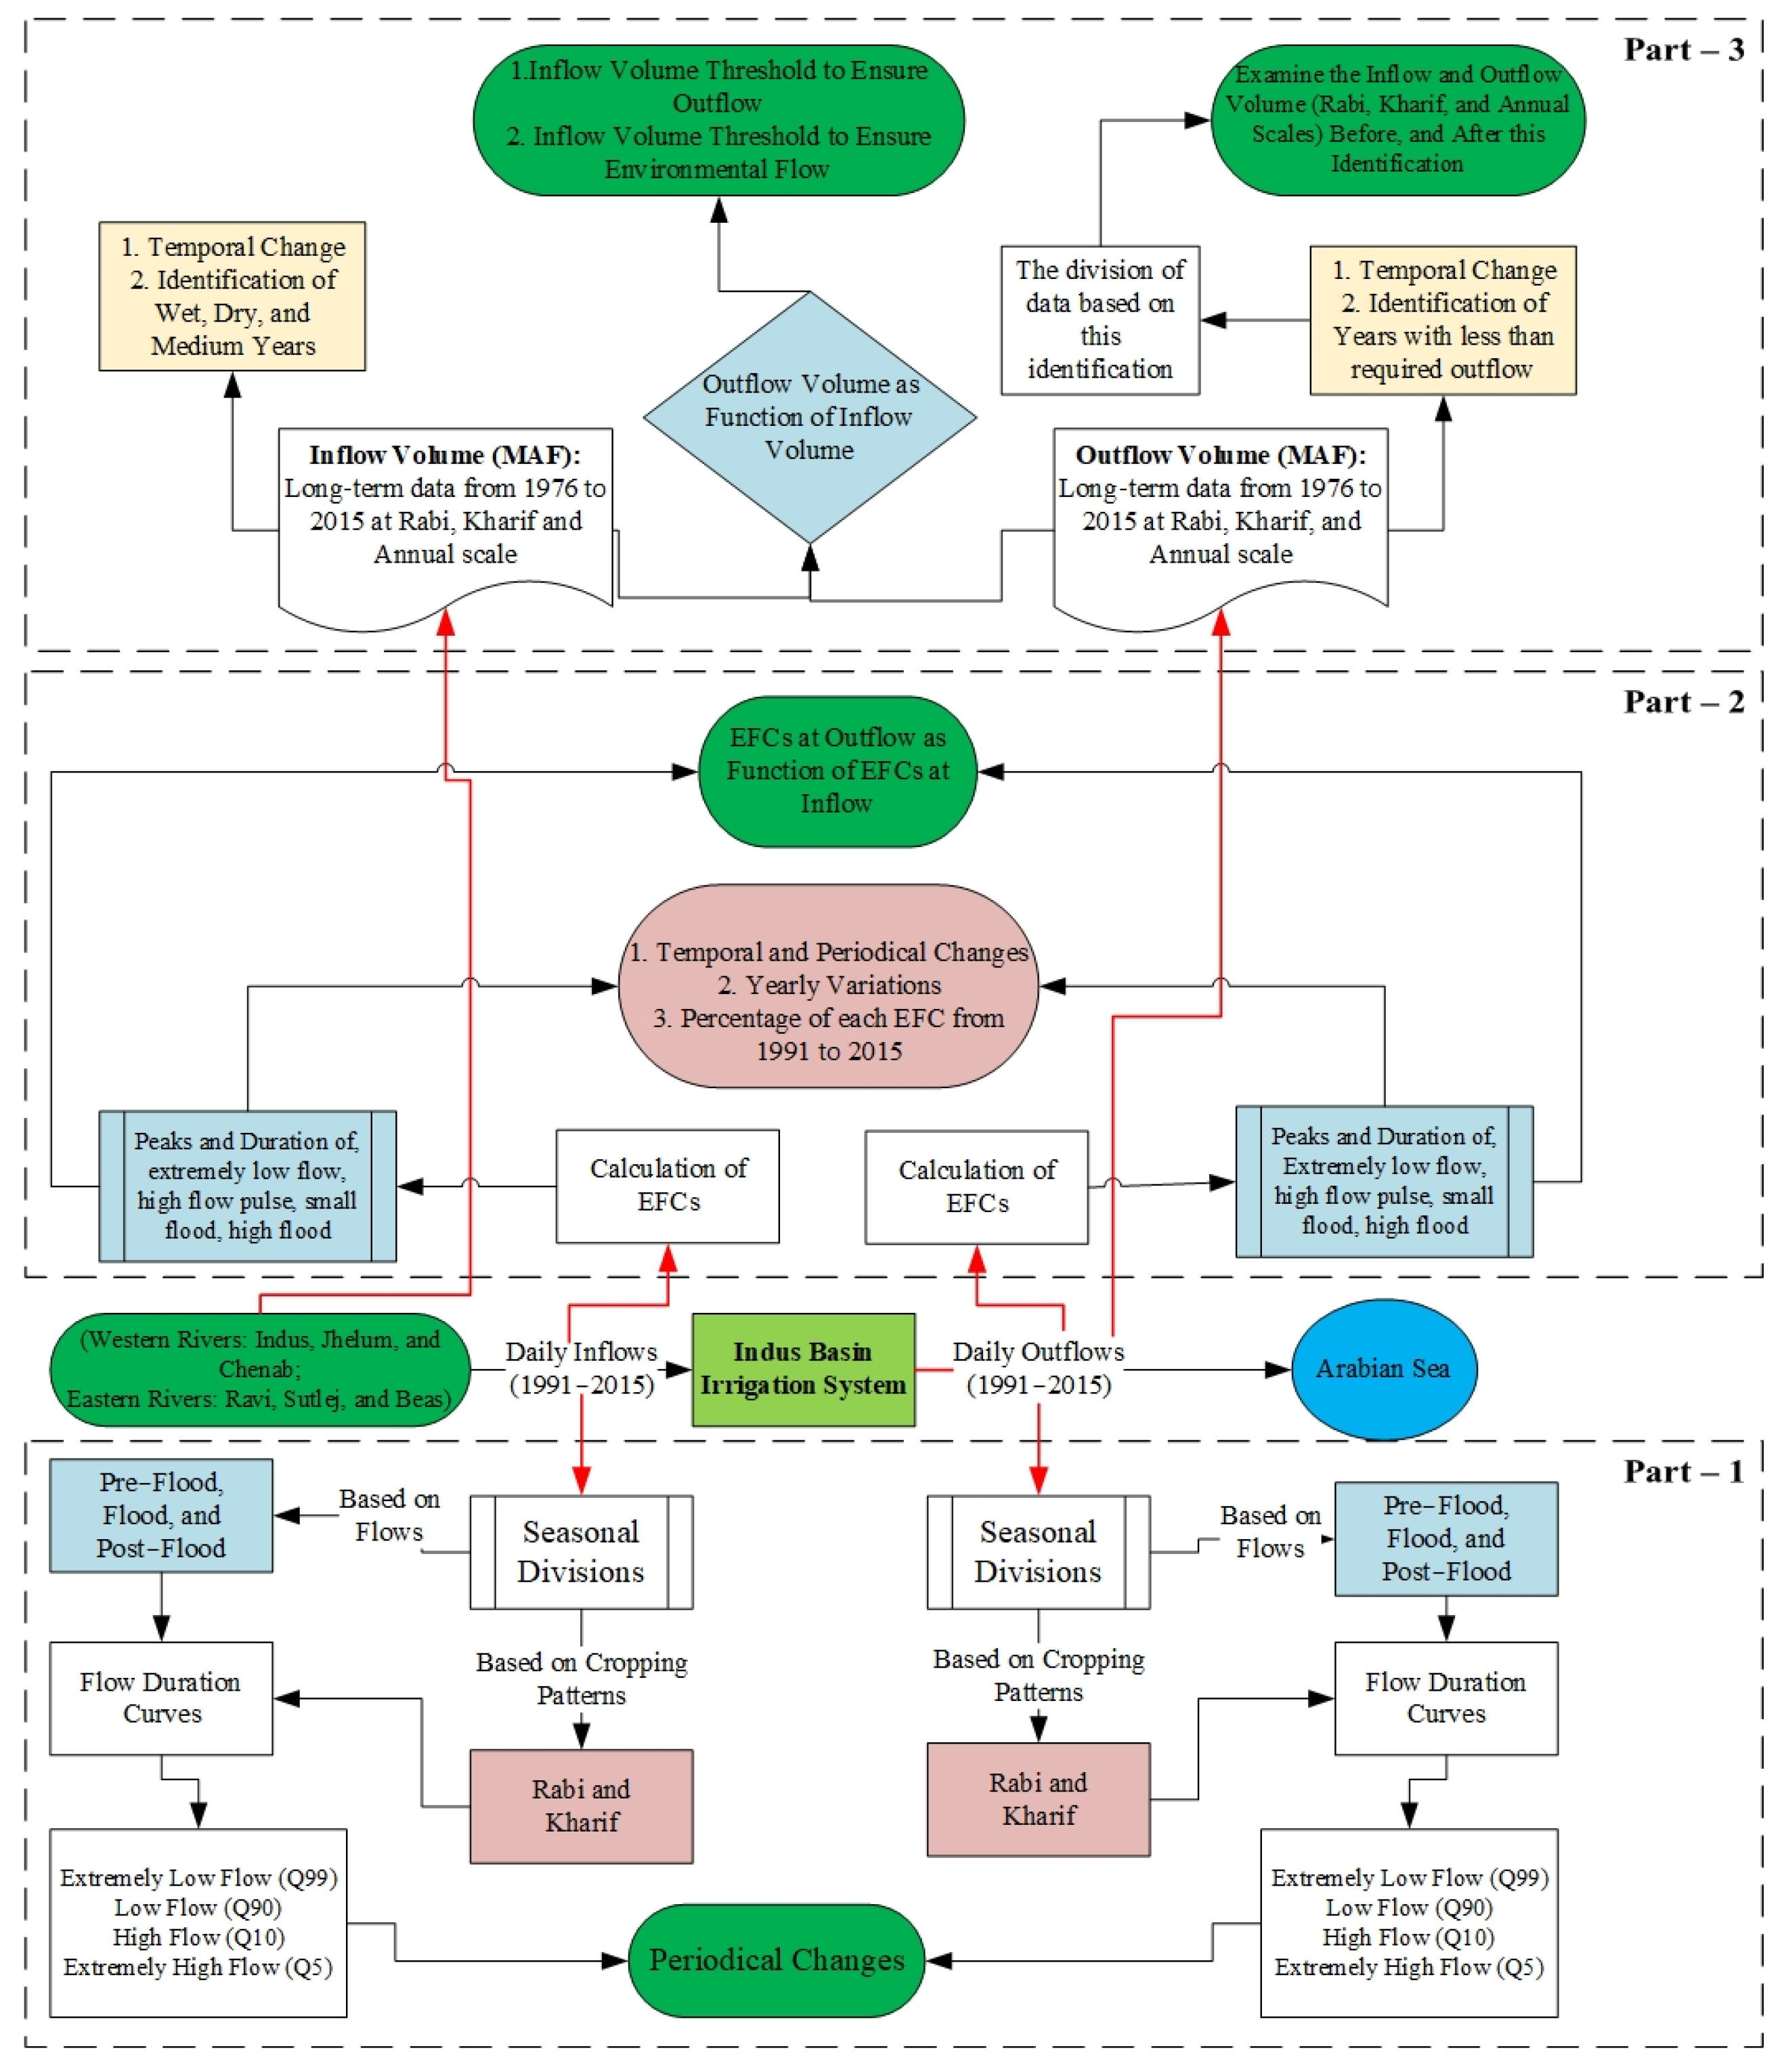
The total drainage area of the Indus Basin is 1.12 million km2, with different geographical coverage in Afghanistan, China, India, and Pakistan—6%, 8%, 39%, and 47%, respectively [50]. The Jhelum, Chenab, Ravi, and Sutlej Rivers of Pakistan join the Indus River in Panjnad before emptying into the Arabian Sea. The Indus Basin (IB) is arid to semi-arid, with an average annual rainfall ranging from 200 to 400 mm to 2000 to 2500 mm [51]. Surface water flows in the IB are fed by glaciers, snowmelt, and monsoon rainfall [52]. The annual potential evapotranspiration (PET) varies from 60 mm to 1800 mm across the basin [53]. Global warming due to climate change will alter the functioning of the water cycle in Pakistan and increase the frequency and intensity of extreme events [54]. The Indus Basin (IB) is one of the world’s most sensitive regions to the impacts of climate change, being highly dependent on glacial and snowmelt water supplies from the Upper Indus Basin [51]. The northern parts of the basin experience harsh winters, with temperatures dipping well below freezing and significant snowfall, whereas the middle and southern parts have mild winters but very hot summers, with temperatures rising above 35 °C [55]. The lower reaches of the IB are most vulnerable to flooding during the monsoon season, resulting in significant casualties and economic losses [47].
The signing of the Indus Water Treaty in 1960 marked a significant milestone in Pakistan–India relations, as noted by the World Bank [56]. The purpose of the pact was to divide the rivers of the Indus Basin between India and Pakistan. The eastern rivers, the Ravi, Sutlej, and Bias, were assigned to India, while the western rivers, the Indus, Jhelum, and Chenab, were assigned to Pakistan. The Indus and Sutlej rivers originate in China’s Tibetan Plateau, whereas the origins of other rivers are located within India [57]. Furthermore, the Kabul River originates in Afghanistan and joins the Indus River near the Nowshera District in Pakistan’s Khyber Pakhtunkhwa Province. Despite this, no legal agreement addresses the transboundary river between Pakistan and Afghanistan.
Daily flow data from 1991–2015 for the Indus, Jhelum, Chenab, Ravi, and Sutlej Rivers were retrieved for this study, with an additional outflow gauge at Kotri measuring the discharge before the Indus River flows into the Arabian Sea (Figure 1). The daily time series, including mean, maximum, and minimum values, is shown in Figure S1. The gauges were chosen so that no lateral inflow or major tributary entered the Indus River System. The Indus River System Authority (IRSA) is the regulatory organization responsible for equitable river water allocation across provinces under the Water Apportionment Accord 1991 (Accord 1991) [58]. The allocation of the Indus River water among Pakistan’s four provinces is outlined in Accord 1991, a fundamental document in this regard. Our research is conducted during a period that coincides with the implementation of the Accord to ensure its direct relevance to the existing water allocation mechanism. Any evaluation of water resources must consider the availability of reliable and consistent hydrological data. A sufficient amount of high-quality data was obtained at the critical gauging stations (Rim Stations) over the generally consistent period from 1991 to 2015. With this information, we can examine river flows, seasonal changes, and possible trends in detail. While Accord 1991 outlines specific ground rules for regulation, effective management relies on understanding how water has evolved. To evaluate the basin’s response to various hydrological conditions, the reference period encompasses a temporal span that includes both years with relatively high and low precipitation. The western rivers receive approximately 88 percent of the total inflow into the basin [53], with 91.6 percent of this inflow being used for agriculture through an extensive canal network.

2.2. Methods

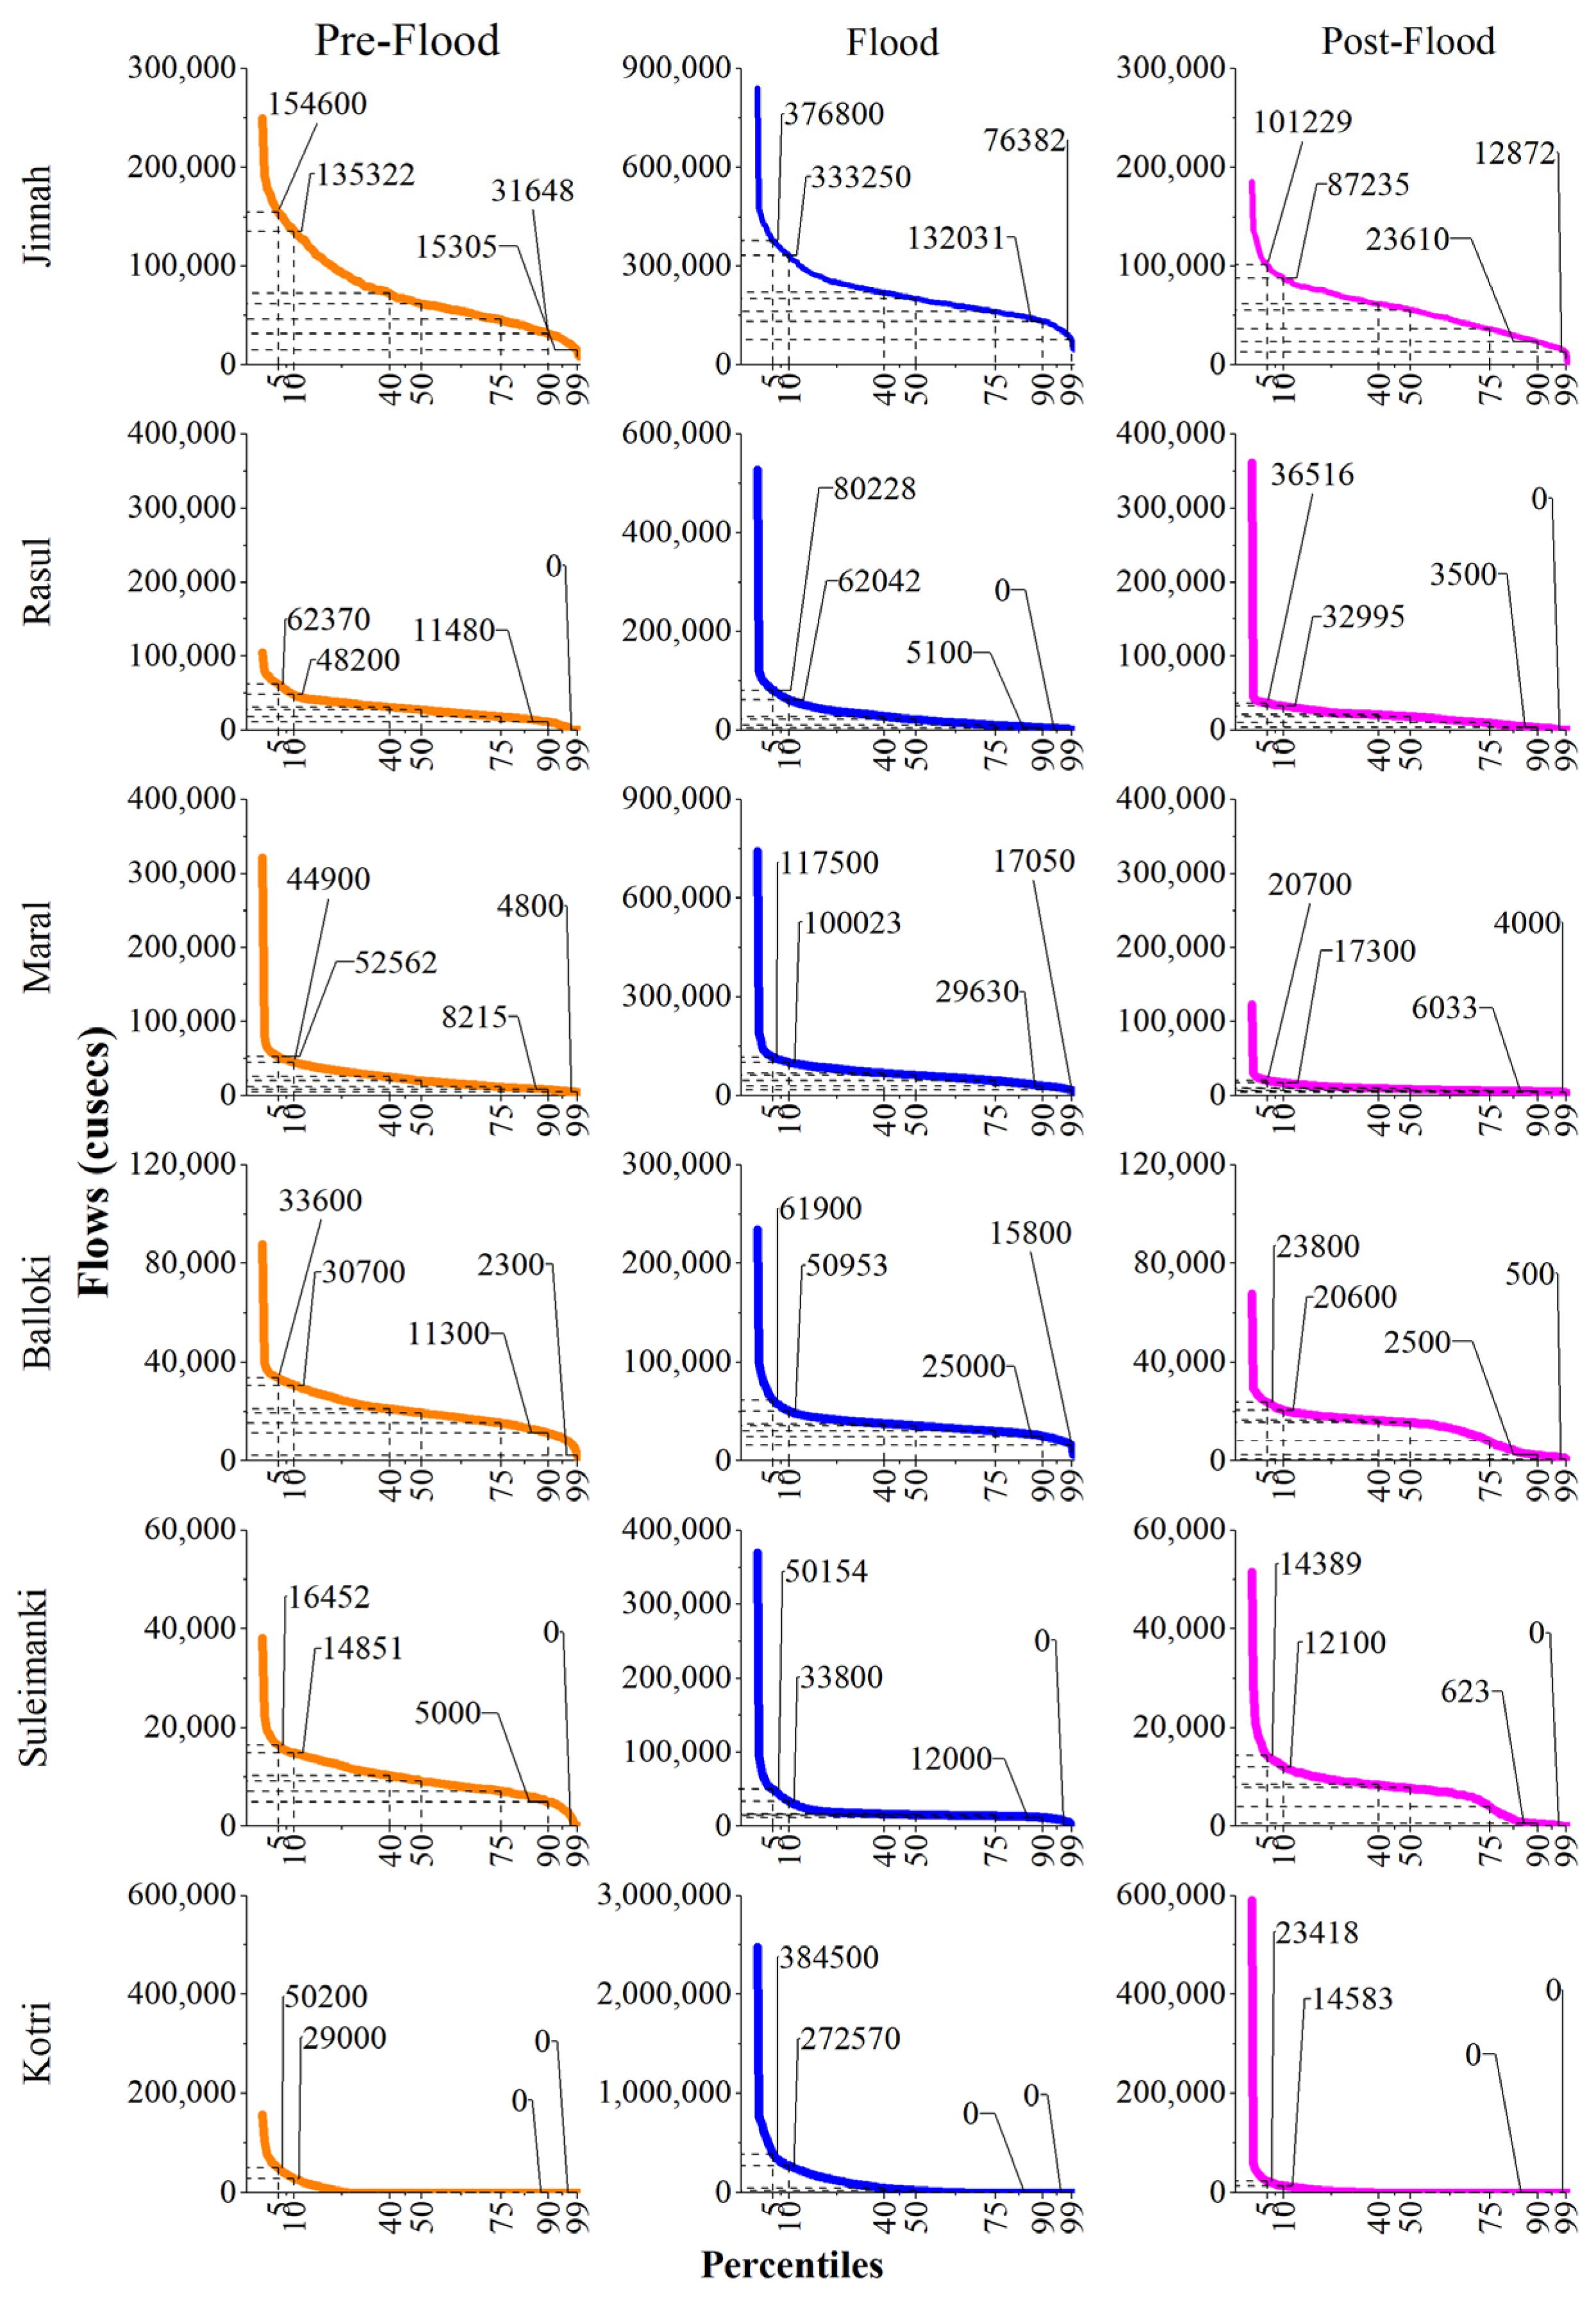
2.2.1. Seasonal Flow Duration Curve

Flood Seasons
Based on the three unique meteorological seasons within the Indus Basin’s river flow dynamics, pre-flood, flood, and post-flood [59], scenarios were examined in our study from 1991 to 2015. The pre-flood season lasts from February to May, the flood season lasts from June to September, and the post-flood season lasts from October to January. We used the flow duration curve (FDC) to calculate the proportion of available water throughout specific periods at individual gauging stations [60,61,62]. FDCs, which are widely employed in numerous river basins worldwide—whether alpine, hilly, desert, semi-arid, humid, or cold regions—plot flow versus the number of days it takes to surpass a given percentage flow rate [59,62]. Within the Indus Basin, we estimated the Flood Control Dam (FCD) for each flood season’s inflow and outflow. We also predicted the extremely low-flow (Q99), low-flow (Q90), high-flow (Q10), and extremely high-flow (Q5) conditions for both inflow and outflow, revealing the range of low and high flow circumstances (Figure 2).
Cropping Seasons
In the Indus Basin Irrigation System (IBIS), two distinct cropping seasons, Rabi and Kharif, hold significant importance [59]. Kharif promotes extensive rice and cotton cultivation, while Rabi predominantly features the extensive sowing of wheat within the IBIS [63]. Notably, the agricultural yields in the Indus Basin heavily rely on irrigation, with cash crops being entirely dependent on it and food crops depending up to 90% on controlled water supply % [44,64]. To gain further insight into the inflow and outflow from the Indus Basin, we present the flow duration curve (FDS) analysis, which encompasses the calculation of critical flow values, including extremely low flow (Q99), low flow (Q90), high flow (Q10), and extremely high flow (Q5) for each cropping season (Figure 2).

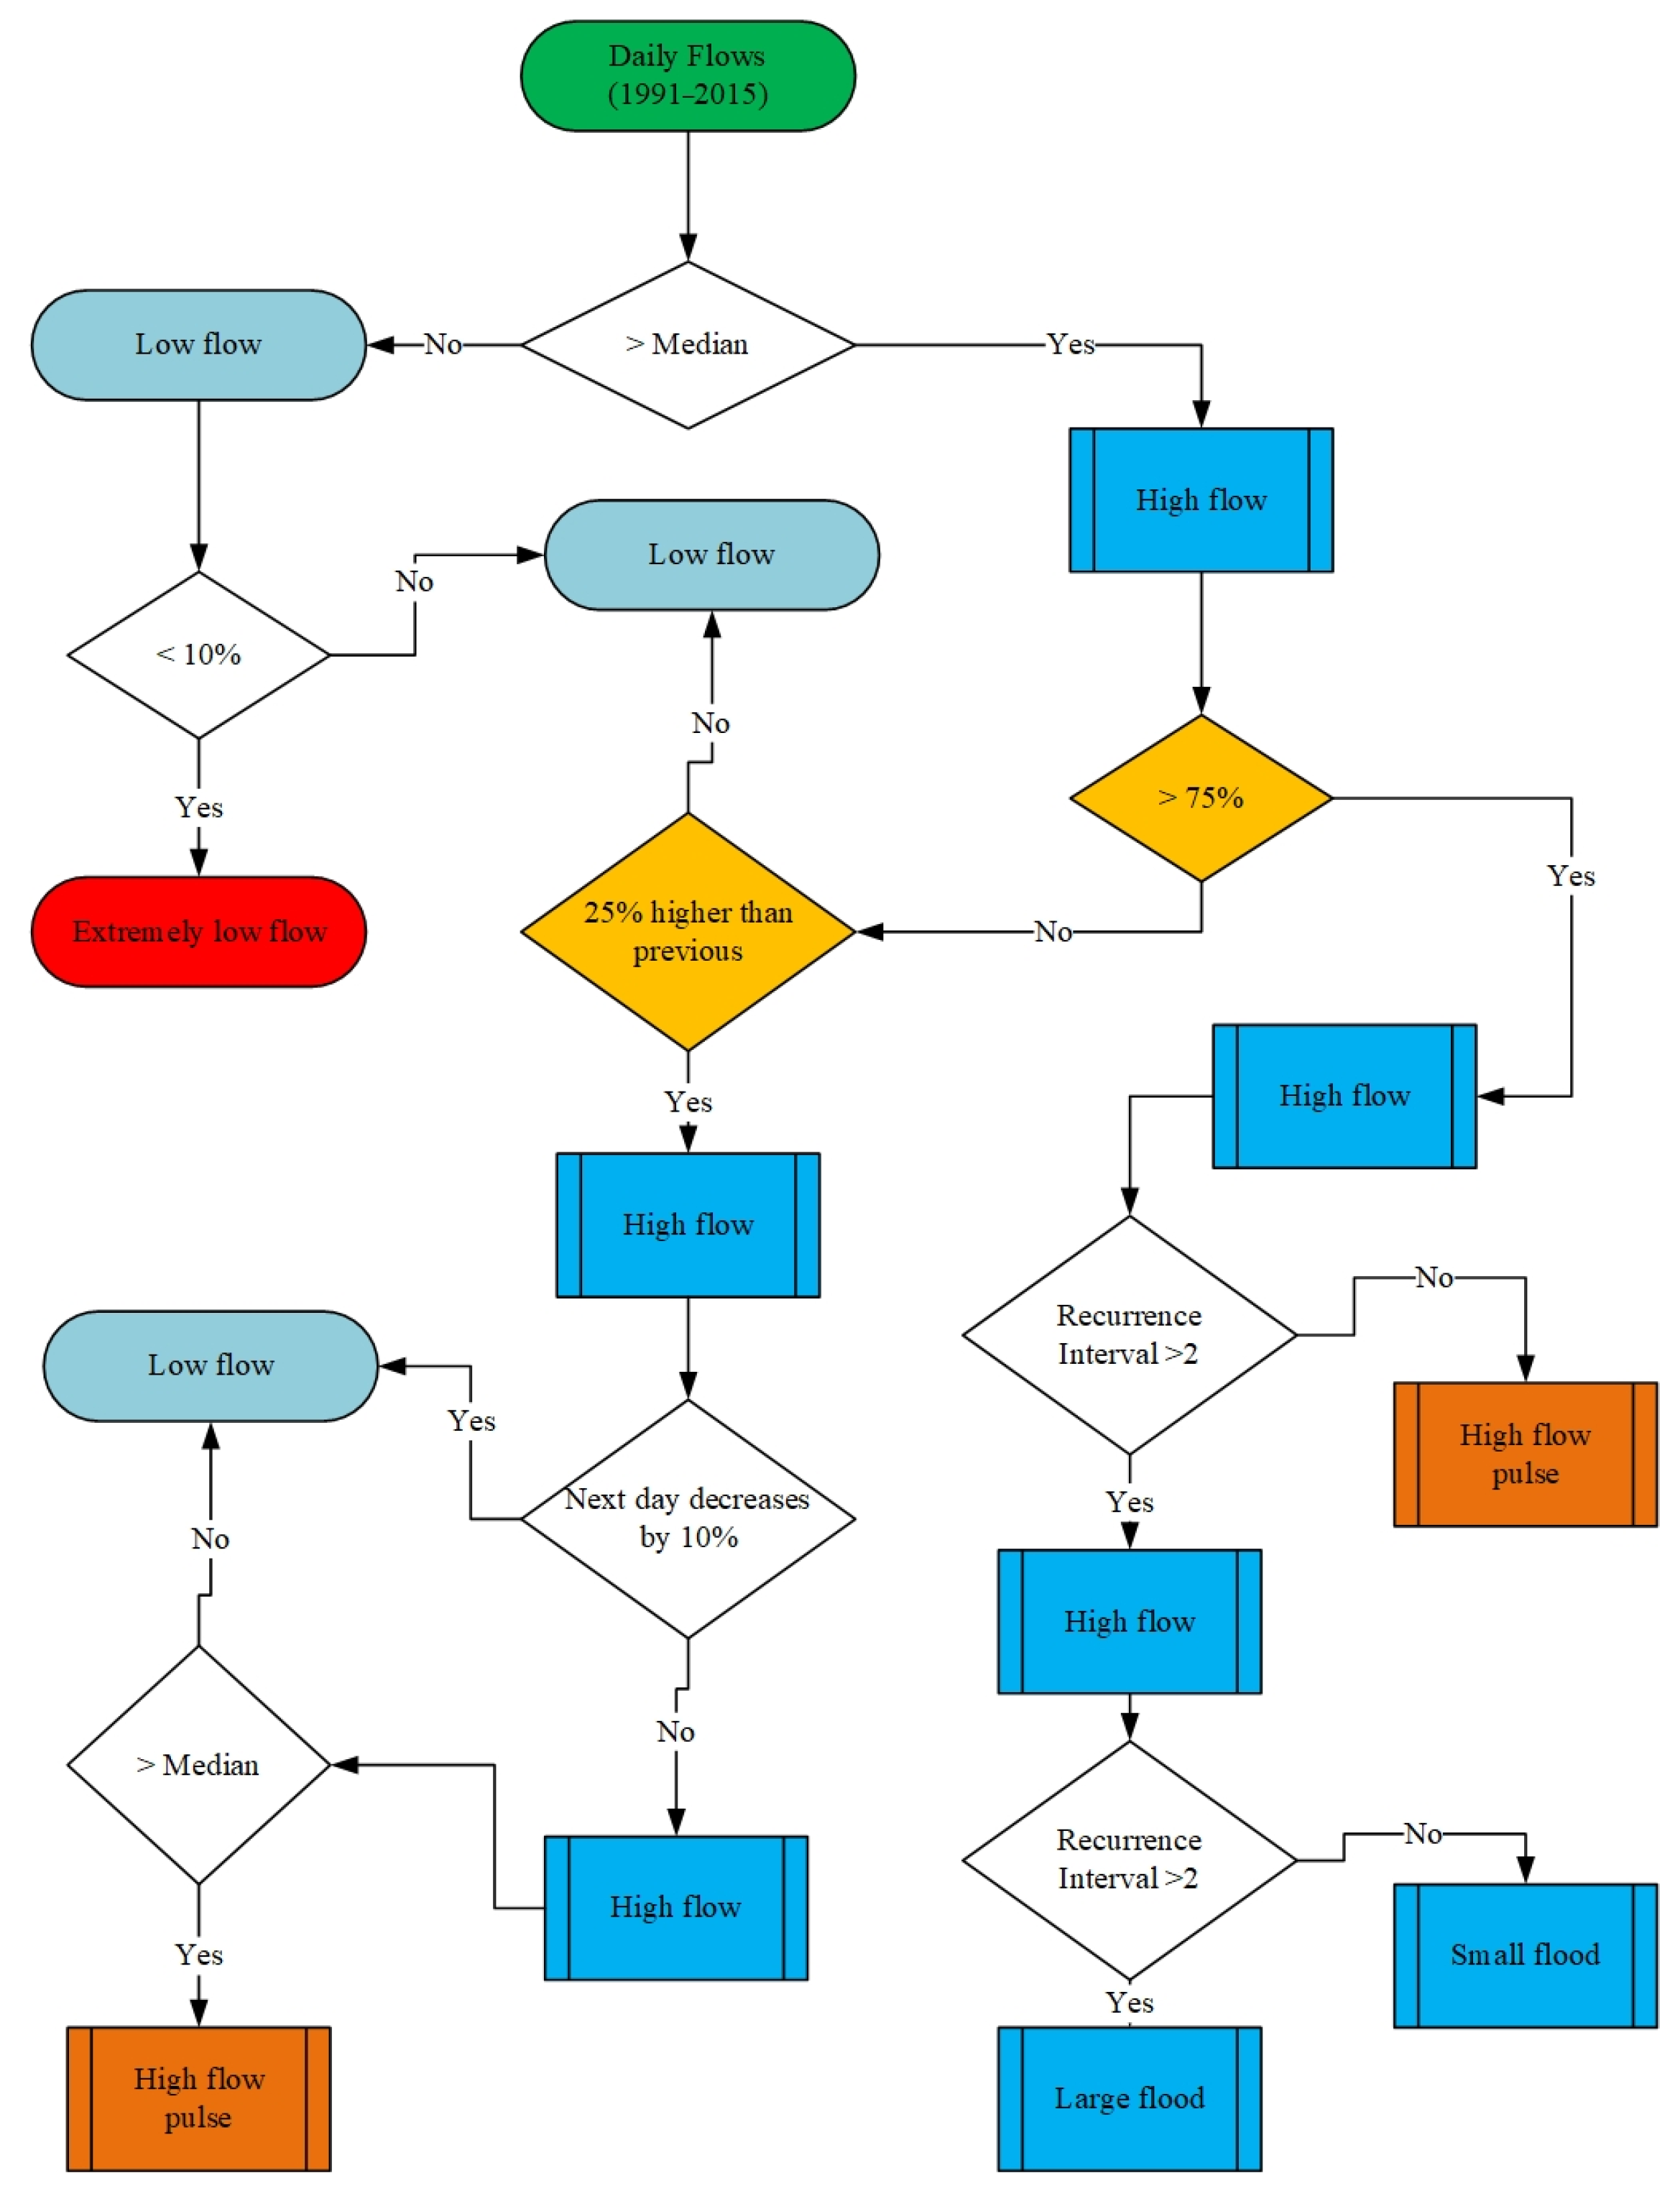
2.2.2. Calculations of Environmental Flow Components

The environmental flow components (EFCs) were evaluated using the methodology outlined in Figure 3 for the inflow and outflow of the Indus Basin during the entire study period. The EFCs were classified into five main categories: extremely low flow, low flow, high-flow pulse, small flood, and extensive flood [65]. Low flow, prevailing in most rivers, is crucial for groundwater recharge [2,11,13]. The extremely low flow significantly threatens aquatic species [33]. The high-flow pulse signifies the transition from low to high flows, while small floods are pivotal for the ecological recovery of aquatic life and maintain the river’s lateral connectivity [14,31,66]. Enormous floods, though occasionally catastrophic in inadequately managed floodplains [67], play a critical role in the river’s biological and physical integrity [68]. In this study, the peak of extremely low flow and its duration, the peak of the high-flow pulse and its duration, the peak of the small flood and its duration, and the peak of the high flood and its duration were calculated. Moreover, trends were determined for the inflow and outflow at each gauging station within the Indus Basin.

2.2.3. Wavelet Analysis

We utilized a combined time-frequency wavelet decomposition approach, explicitly employing the Morlet continuous wavelet transform to analyze the periodic fluctuation of flow properties—such as extremely low flow (Q99), low flow (Q90), high flow (Q10), and extremely high flow (Q5)—during flood and cropping seasons. This method has proven valuable in many hydro-climatology studies [69,70,71,72,73]. This method enables the disassembly of signals, providing insights into signal patterns and specifics over various time scales.
In this transformation, a two-parameter basis ψ a , τ t , a , τ ϵ ( R + * × R ) replaces the Fourier basis where ‘τ’ is the shift in time and ‘a’ is the scale. The Fourier basis depicts a signal in terms of the power and frequency of its decomposed sine waves, but disregards its time [74]. However, this modification aids in time frame discrimination during analysis [69,70]. The continuous-time signal x(t) in the transformation has coefficients that a linear integral operator defines [74].
C x a , τ = + x t ψ a , τ * t d t
where ψ_(a,τ)^* (t) = 1/√a ψ((tτ)/a), * is the complex conjugate, and ψ(t) is the wavelet. The wavelet power spectrum of the variables’ local covariances is generated by the wavelet energy stress of the time series across multiple scales. The transformative approach efficiently breaks down complex signals into fundamental signals of finite bandwidth, preserving the primary signal’s phases [69], making it efficient and robust for signal processing. Moreover, the EFC time series was also analyzed to ensure the periodic propagation of the EFCs at the inflow and outflow of the Indus Basin.

3. Results

3.1. Availability and Variations of Flows in Flood Seasons

3.1.1. Pre-Flood Season

Figure 4 illustrates the flow duration curve (FDC) plots for the inflow and outflow gauges during the pre-flood, flood, and post-flood seasons during 1991–2015. Additionally, the extremely low flow (Q99), low flow (Q90), high flow (Q10), and extremely high flow (Q5) for the 99%, 90%, 10%, and 5% exceedance of the time of the year are also presented on each plot.
In the pre-flood season, the Indus River at the Jinnah gauging station demonstrates an extremely low flow (Q99) of 15305 ft3/s, persisting for 99% of the year, followed by low flow Q90 at 31,648 ft3/s, high flow Q10 reaching 135,322 ft3/s, and an extremely high flow Q5 reaching 154,600 ft3/s. At the Jhelum River in Rasul, the data indicate minimal to zero flows for 97–99% of the year, with a low flow Q90 of 11,480 ft3/s, a high flow Q10 of 48,200 ft3/s, and an extremely high flow Q5 of 62,370 ft3/s during the pre-flood season. Similarly, the Chenab River at the Marala gauge exhibits exceedance flows of 99%, 90%, 10%, and 5% at 4800 ft3/s, 8215 ft3/s, 52,562 ft3/s, and 44,900 ft3/s, respectively. For the eastern rivers’ inflow, the Balloki gauge at Ravi River recorded various flow metrics during the pre-flood scenario: 2300 ft3/s (99% extremely low flow), 11,300 ft3/s (90% low flow), 30,700 ft3/s (10% high flow), and 33,600 ft3/s (5% extremely high flow). At the Suleimanki gauge for the Sutlej River inflow, the measurements were 5000 ft3/s (90% exceedance), 14,851 ft3/s (10% exceedance), and 16,452 ft3/s (5% exceedance). Regarding outflows from the Indus Basin at the Kotri gauge, during the pre-flood season, the minimum flow was 100 ft3/s (32% exceedance of the annual average). Beyond Q32, no outflows were observed from the Indus Basin (Figure 4).

3.1.2. Flood Season

Figure 4 presents the flow duration curve (FDC) for the flood season, derived from daily flow records from 1991 to 2015. The FDC showcases various extremes in inflow and outflow from the Indus Basin. The figure illustrates the frequency distribution of extremely low, low, high, and extremely high flows. The analysis at the Jinnah gauging station along the Indus River indicated exceptional floods of 376,800 ft3/s, observed only during the fifth percentile of the time of exceedance. Following this, high flows of 333,250 ft3/s were detected at the 10th percentile. Contrastingly, low flows of 132,031 ft3/s characterize the 90th percentile, while extremely low flows of 76,382 ft3/s were confined to the 99th percentile. Moving to the Rasul gauge, the observed flow dynamics include 80,228 ft3/s (extremely high flow), 62,042 ft3/s (high flood), 5100 ft3/s (low flow), and zero flows (extremely low flow) for the 5%, 10%, 90%, and 99% of the time of exceedance, respectively. The Maral gauge at the Chenab River showcased relatively higher flow magnitudes than the Rasul gauge along the Jhelum River.
Further analysis of the western rivers, the Ravi and Sutlej, indicates extremely high flows of 61,900 ft3/s and 50,154 ft3/s at the fifth percentile. Moreover, 50,953 ft3/s and 33,800 ft3/s denote high flows only available for the 10th percentile. For these rivers, low flows of 25,000 ft3/s and 1200 ft3/s were commonly observed throughout the year (Figure 4). Examining the outflow from the Indus Basin at the Kotri gauge reveals extreme and high flows during the flood season, with measurements of 384,500 ft3/s and 272,570 ft3/s, respectively, occurring at the fifth and tenth percentiles of the annual exceedance.

3.1.3. Post-Flood Season

The post-flood season FDCs for the inflow and outflow gauges of the Indus Basin are presented in Figure 4. The flow magnitudes for each flow type (extremely low flow to extremely high flow) against the corresponding time of exceedance showed the same behavior as in the pre-flood season. However, the magnitudes of the flow metrics are considerably lower than those of the pre-flood season for all of the inflow and outflow gauges (Figure 4).

3.2. Periodical Changes in Low and High Flows

3.2.1. Pre-Flood Season

To gain further insights into the extremely low flow (Q99), low flow (Q90), high flow (Q10), and extremely high flow (Q5), the daily discharge for each year from 1991 to 2015 and the percentage of exceedance of these flow types were calculated and their periodical changes during the period of 1991–2015 are presented in Figure 5, Figures S1 and S2 for the pre-flood, flood and post-flood seasons, respectively, for the inflow and outflow gauges of Indus Basin.
Figure 5 shows the pre-flood season wavelet results for the inflow and outflow gauges of the Indus Basin. The wavelet coefficient estimates are only reliable in areas within the cone of influence, i.e., the solid black lines representing the 95% confidence level. There were 1–3 years of significant periodicity for high signals (3–4) from 1995–2002 and 2008–2012 of extremely low flow (Q99) at the Jinnah gauge of the Indus River. Simultaneously, the 5–8 periodicity of extremely low flow (Q99) was observed in conjunction with signals of 2–3 during 1998–2004 for the same river. For the Rasul gauge at the Jhelum River, the extremely low flow had lower periodicities of 2–3 years for the higher signals (≥3) from 1996 to 2005. The Marala gauge at the Chenab River indicated that the extremely low flows observed exhibited a significant 3–5-year periodicity from 1998 to 2008, with discharge signals of 2–4. The extremely low flows to the eastern rivers (Ravi at Balloki and Sutlej at Suleimanki) were observed to have higher single values before 2002, and lower signals were more frequent in the later years (Figure 5). The outflow from the Indus showed that extremely low flows were observed in the higher signals (≥4) from 1995 to 2001, and lower signals were more frequent in the later years. The low flows (Q90) also observed a similar behavior to extremely low flows at the inflow and outflow gauges of the Indus Basin (Figure 5).
The high flows (Q10) during the pre-flood season recorded single peaks of higher magnitudes (≥4) from 1994 to 1999 and 2006 to 2008, with periodicities of 2–4 years and less than 2 years, respectively, at the Jinnah gauge on the Indus River. In addition to the above, there were another 6–8 years with medium signals (2–4) recorded at the Rasul gauge on the Jhelum River. The Marala gauge at the Chenab River exhibited more periodicities for signals 2–8 from 1996 to 2007 (Figure 5). The Balloki gauge at Ravi River showed higher periodical behavior (6–8 years) during 2000–2004, and the Suleimanki gauge at Sutlej River showed a lower periodicity of 3–4 years of high signals (≥3) from 1995 to 2005. There were very low Q10 signals at the outflow gauge of the Indus basin at the Kotri gauge (Figure S2). The extremely high flows (Q5) were frequent, with higher signals observed for the western rivers, which exhibited higher periodicities, whereas the situation was vice versa for the eastern rivers (Figure 5). Generally, similarities and disparities were noted in the behaviors of low flows (Q90), high flows (Q10), and extremely high flows (Q5) across the inflow and outflow gauges of the Indus Basin during the pre-flood season, providing valuable insights into the dynamic nature of the basin’s hydrology. The results highlighted the significant impact of human interventions and environmental alterations on the flow patterns within the Indus Basin, underscoring the need for a more detailed understanding of these dynamics to inform policy and management decisions [57,59].

3.2.2. Flood Season

During the flood season, the behavior of extremely low flows (Q99) and low flows (Q90) in the western river gauges (Jinnah, Rasul, and Marala) exhibited varying periodicities and substantial signals (>3) for Jinnah from 2006 to 2011, signals > 1.4 for the Rasul gauge during 2007–2010, and signals ≥2 for the Marala gauge from 2005 to 2010. These patterns persisted at ≤6 years, 4–6 years, and 3–6 years (Figure S2). For the eastern river gauges, lower periodicity (≤3 years) appeared more frequently with lower magnitudes at the Balloki gauge from 1996 to 2001. However, higher signals (≥4) were observed during 2009–2010 at the Sutlej River at the Suleimanki gauge, within the ≤3-year periodicity. Notably, the outflow from the Indus Basin exhibited higher pulses (≥6) from 2007 to 2011, with a periodicity of <3 years for Q99 and Q90 during the flood season over the study period from 1991 to 2015. At the Jinnah gauge, the higher flows (Q10) and significantly higher flows (Q5) exhibited a substantially higher periodicity of 6–8 years from 1998 to 2004/5, while lower signals were more frequently recorded. Lower signals primarily characterized the Rasul gauge at the Jhelum River. Similarly, the Chenab River at the Maral gauge exhibited higher signals between 1995 and 2010 for Q5, with a periodicity of ≤5 years, and between 1998 and 2006 for Q10, with a periodicity of 4–6 years. The behavior of Q10 and Q5 at the Balloki gauge on the Ravi River was similar, with periodicities of ≤4 years from 1996 to 2008, maintaining signals of ≥4 during the flood seasons from 1991 to 2015. The Sutlej River at Suleimanki gauge exhibited higher pulses from 1996 to 1998, followed by lower pulses from 1998 to 2008, with periodicities of 2–3 years and 3–4 years. Notably, the outflow from the Indus Basin at the Kotri gauge showed higher signals in 1997–1999 for Q10 and Q5 (Figure S2).

3.2.3. Post-Flood Season

The fluctuating patterns in Q99, Q90, Q10, and Q5 are illustrated in Figure S3, depicting the post-flood season and its corresponding inflow and outflow gauges from 1991 to 2015. This figure captures distinct periodicities in flow signals across various gauges. At the Jinnah gauge, both Q99 and Q90 exhibited similar, recurring patterns (≤4 years), showcasing high-flow signals (>6) between 1995 and 2009. Similarly, the Rasul gauge demonstrated parallel periodicities for Q99 and Q90, highlighting higher signals (≥4) from 2000 to 2010. The Chenab River at the Marala gauge reflected noticeable signals (≥4) every 1–3 years in Q99 from 2005 to 2008, subsequently converging with Q90 signals between 2008 and 2010. High occurrences of Q99 and Q90 are frequent at the Balloki gauge, with the Suleimanki gauge mirroring similar results for Q99 and Q90 from 1996 to 1999. Between 2000 and 2003, the Suleimanki gauge exhibited lower signals; from 2003 to 2006, it showed a return to high signals. Conversely, the outflow of the Kotri gauge shows more prominently lower signals for Q99 and Q90 from 1995 to 2012 during the post-flood season. The flow category Q10 revealed fluctuations at various periodicities, from 1995 to 2000 and 2001 to 2004, demonstrating 1–3 years and 6–8 years, respectively. The Rasul gauge exhibited lower signals (1–3) only in 1996 and 1997, with periodicities of 3–4 years for Q10 and 3–6 years for Q5. The Marala gauge depicted high flows of >4 signals between 1995 and 2005 at 1–3-year intervals, while Q5 signals showed extremely high flows from 2002 to 2004 with a 6–8-year periodicity. The Balloki and Suleimanki gauges exhibited diverse patterns across different years, indicating high signals of various flows within 1–3 years and lower periodicity observed in specific periods marked by high and extremely high flows. The outflow at the Kotri gauge during 1994–1995 exhibited significant fluctuations, with high signals (>15) indicating high and extremely high flows, and most of the region experiencing minimal flows.

3.3. Discrepancies of Flows in Cropping Seasons

Figure S4 illustrates the flow duration curves (FDCs) for the Rabi and Kharif seasons within the Indus Basin Irrigation System (IBIS). The Rabi crops—such as wheat, barley, peas, gram, linseed, and sesame—are predominantly sown during the Rabi season, while the Kharif crops, including rice, cotton, maize, and sugarcane, are cultivated during the Kharif season. Figure S4 demonstrates the varying flows observed at specific percentiles of time exceedance at various gauges within the IBIS. In the Rabi season, the Jinnah gauge recorded flows of 95,900 ft3/s (Q5), 85,100 ft3/s (Q10), 24,215 ft3/s (Q90), and 13,600 ft3/s (Q99). At the Rasul gauge, the corresponding flows were 40,225 ft3/s (Q5), 35,500 ft3/s (Q10), 4500 ft3/s (Q90), and 0 ft3/s (Q99). The Chenab River at Marala gauge exhibited further declined inflows at Q5, Q10, Q90, and Q99, measuring 27,249 ft3/s, 21,300 ft3/s, 6100 ft3/s, and 4300 ft3/s, respectively. The Balloki and Suleimanki gauges in the eastern river showed decreased river inflows due to dam construction and diversion canals by India, resulting in a substantial water deficit during low-flow seasons. Notably, the Kotri gauge exhibited no flows for approximately 65% of the year. In the Kharif season, the Jinnah gauge observed flows of 27,100 ft3/s (99%) and 64237 ft3/s (90%), while higher flows measured 291,100 ft3/s (10%) and 350,300 ft3/s (5%). The Rasul gauge recorded no flow for the 99th percentile and 6300 ft3/s for the 90th percentile. The Marala gauge documented flows of 11,100 ft3/s (Q99), 20,475 ft3/s (Q90), 92,900 ft3/s (Q10), and 10,800 ft3/s (Q5). The eastern river’s gauge at Balloki recorded extremely low flow at 9700 ft3/s and low flow at 18300 ft3/s, corresponding to 99% and 90% exceedance times, respectively. Notably, there are no flows for 99% and 8200 ft3/s for 90% of the time of exceedance at the Suleimanki gauge. The outflow from the Indus Basin ranged between 208,100 ft3/s (Q10) and 304,600 ft3/s (Q5), with no flow for approximately 65% of the time (Akhtar et al., 2021) [75].

3.4. Periodical Changes of Flows in Flood Seasons

3.4.1. Rabi Season

Figure S5 provides a comprehensive analysis of wavelet spectra for different flow conditions (extremely low flow, low flow, high flow, and extremely high flow) during the Rabi season at both the inflow and outflow gauges in the Indus Basin. The findings revealed notable patterns: extremely low flows (Q99) exhibited high signals (2–4) with periodicities of 1–3 years and 6–8 years between 1995 and 2001, and 1998 and 2005, respectively (Figure S5). Similarly, low flows exhibited high signals from 2000 to 2004 with a periodicity of 6–8 years at the Jinnah gauge (Figure S5). The Rasul gauge demonstrated comparable periodic changes in extremely low flows and low flows, with signals (4–16) spanning from 1994 to 2006, covering various periodicities. The Marala gauge exhibited similar periodic behavior for extremely low and low flows. At the Balloki gauge, Q99 shows a broader range of signals (4–8) during 1994–1999, while Q90 exhibited high signals (>4) with a 1–3-year periodicity from 1995 to 1997. The Suleimanki gauge revealed more signal coverage for Q90 than Q99, with high signals (≥8) occurring for 1–5- and 1–3-year periodicities, respectively. Periodical changes of 4–8 years are recorded more frequently but with lower signal coverage. The outflow gauge at Kotri shows minimal flows or signals, indicating reduced periodical coverage.
High flows (Q10) were more frequent, occurring with a periodicity of less than three years and high signals (≥8) during 1992–1996. Signals of ≥2 with a periodicity of 3.5–4.5 years were observed from 1996 to 2000. Extremely high flows (Q5) had the lowest periodicity of 1–4 years, with higher signals (≥8) from 1995 to 1999, followed by the fewest signals of 1–2 from 2001 to 2004 and a higher periodicity of 7–8 years at the Jinnah gauge (Figure S5). The Rasul gauge displayed similar periodicities and signals for both Q10 and Q5. The Maral gauge exhibited lower periodicities of 2–3 years from 1994 to 2009, with flows indicating signals of 1–2 and higher signals (≥4) having a high periodicity of 7–8 years from 2001 to 2005. At the Balloki gauge, Q10 flows exhibited high signals (≥2) during the early years of 1996–1999, alongside extremely high flows (Q5) with signals ≥15 (Figure S5). The higher signals of ≥15 were associated with high flows during the early years of 1995–1999, with a periodicity of 1–3 years for Q10 flows. Q5 flows exhibited signals of four or greater from 1996 to 2001, with a periodic change of 1–4 years. The outflow from the Indus Basin at Kotri exhibited minimal periodic coverage for Q10 and Q5 flows, with a predominance of lower rather than high flows during the Rabi season from 1991 to 2015.

3.4.2. Kharif Season

Figure S6 illustrates the wavelet spectra for extremely low flow (Q99), low flow (Q90), high flow (Q10), and extremely high flow (Q5) during the Kharif season from 1991 to 2015 at the inflow and outflow gauges of the Indus Basin. The analysis reveals several notable patterns. At the Jinnah gauge, the Q99 flows exhibit a periodicity of 3–6 years from 2004 to 2009, with lower signals (1–3) and a period of high signals (four) from 2008 to 2012. Similar behavior is observed for Q90 flows at the same gauge. The Rasul gauge showed Q99 flows with a periodicity of less than three years and lower signals from 2000 to 2010. In contrast, higher signals (>2) were recorded from 2008 to 2010, with a periodicity of 4 to 6 years. Q90 flows at this gauge have higher signals (>2) from 1992 to 2000, with a periodicity of 1–3 years. The Marala gauge exhibited the least periodicity for higher signals (greater than four) from 1993 to 1996 and 2008 to 2010. Signals of discharge ranging from 2 to 3 are captured from 2005 to 2008 with a periodicity of 4–6 years. Similar behavior is observed for Q90 flows, but the duration extends from 2004 to 2012 with a periodicity of 1–3 years. At the Balloki gauge, Q99 flows show discharge signals (1–1.2) with a periodicity of 3–4 years from 1997 to 2000 and 2009 to 2011. For Q90 flows, high signals (>3) are observed from 1996 to 1998 with a periodicity of 3–4 years. The Suleimanki gauge displays Q99 flows from 2009 to 2012 with a periodicity of 1–3 years, and Q90 flows with high signals (>4) for 1–5 years of periodicity from 1995 to 1997 and 2009 to 2011. The outflows from the Indus Basin at the Kotri gauge indicated Q99 flows available from 2007 to 2010, with a periodicity of 1–3 years for high-flow signals (≥7). Signals (2–4) are observed from 2007 to 2009 with a periodicity of 4–6 years. Q90 flows are significant from 2009 to 2011, with a periodicity of 1–3 years during the Kharif season from 1991 to 2015. In terms of high flows (Q10), periods of 1–3 years are observed, with high signals (>4) from 2003 to 2008. Extremely high flows (Q5) also exhibited the same periodicity with higher signals (6–8). Another periodicity of 2–4 discharge signals was captured from 1996 to 1999, with a periodicity of 4–5 years at the Jinnah gauge. The Rasul gauge exhibited a similar trend for Q10 and Q5 flows, with high signals (≥6) observed during 1996–1998 and 1996–1999, respectively. At the Marala gauge, Q10 flows with high signals (≥4) had a periodicity of 1–2 years from 1996 to 1998 and 2001 to 2005. Q5 flows exhibited a periodicity of 1–3 years from 1999 to 2008 at the same gauge.
The Balloki gauge displayed a periodicity of 3–4 years for low-flow signals from 1996 to 1999, and high signals (>2) had a periodicity of 1–2 years from 2003 to 2007 for Q10 flows. For Q5 flows, a periodicity of 1–2 years was observed from 2001 to 2010, with higher signals exceeding four. The Suleimanki gauge indicated a periodicity of 1–4 years from 1995 to 2000 for higher signals (6–8) of Q10 flows, with a similar periodicity observed for Q5 flows. The outflow gauge at Kotri showed predominantly higher flows of Q10, with a periodicity of 2–4 years, from 1996 to 2000, during the Kharif season, and from 1991 to 2015.

3.5. Environmental Flow Components

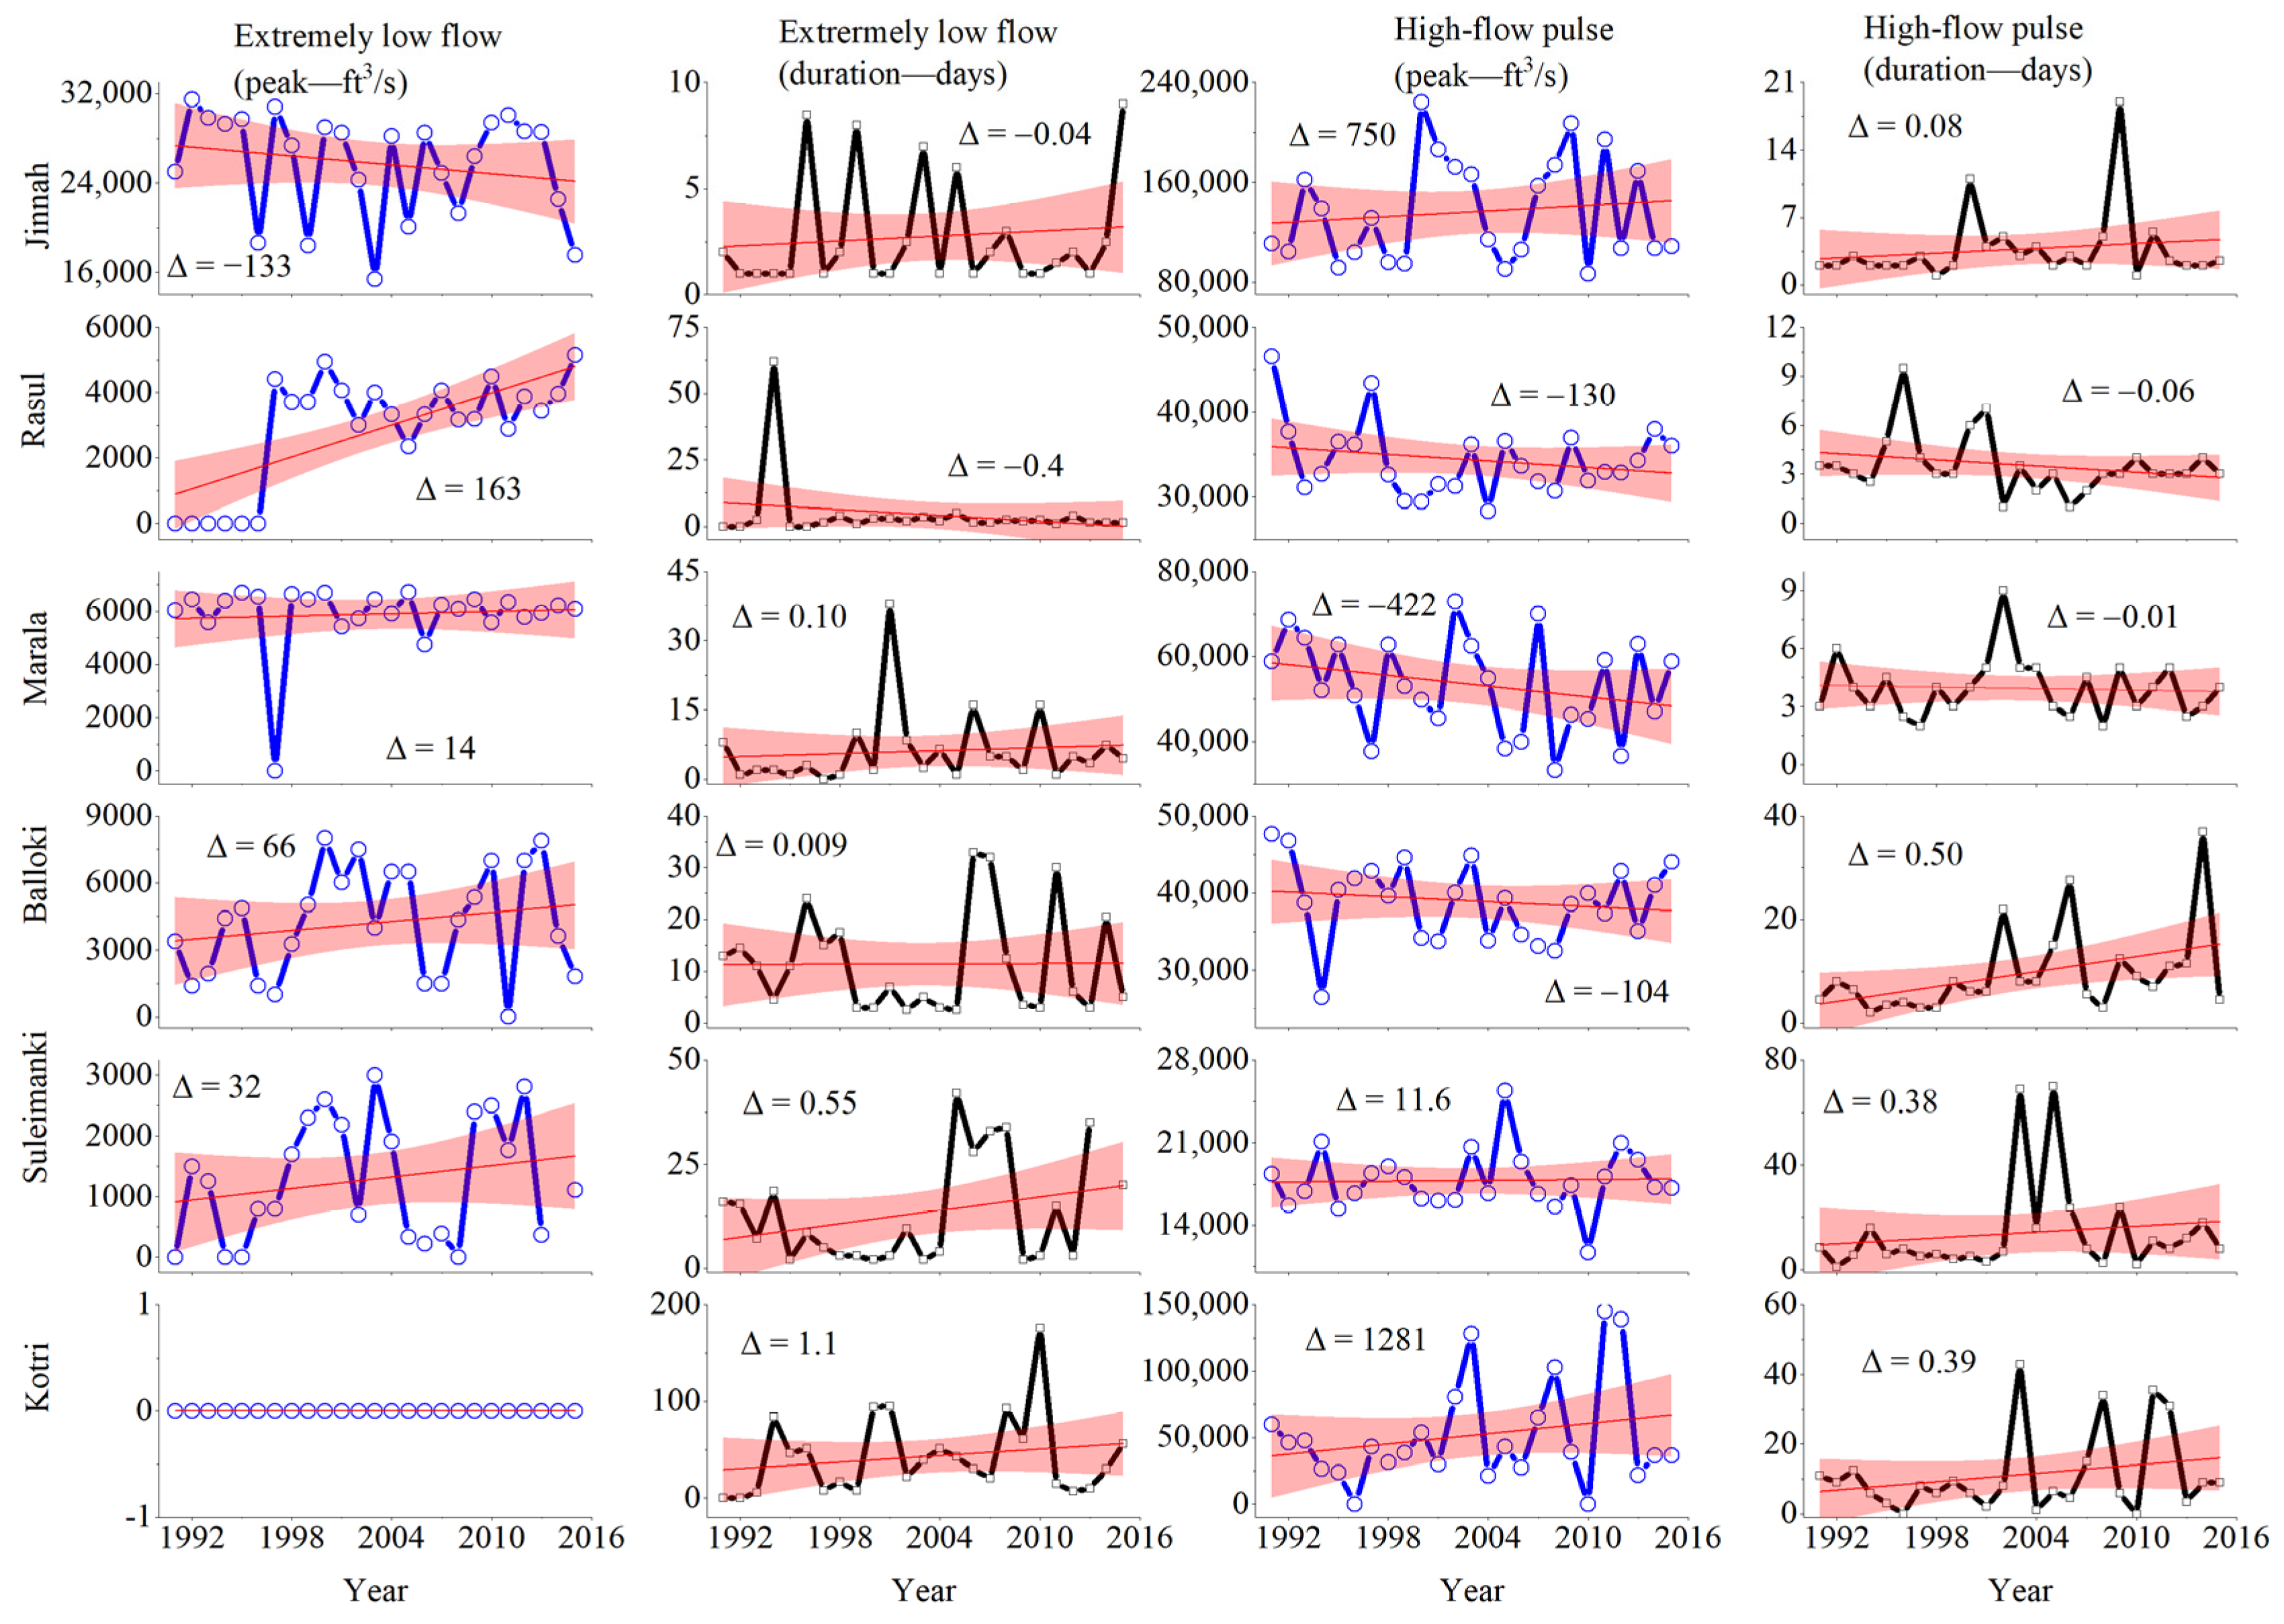
3.5.1. Variations in Extremely Low Flows and High-Flow Pulses

Figure 6 presents the analysis of trends in extremely low-flow peaks, their duration, and the peak and duration of the high-flow pulse, as calculated in Figure 3. At the Jinnah gauge, a decreasing trend was observed in the extremely low-flow peaks, with a magnitude of −133 ft3/s per year. The duration associated with these flows also decreased by 0.04 days per year. For the Rasul, Marala, Balloki, and Suleimanki gauges, there was an increasing trend in the extremely low-flow peaks. The slopes for these gauges were 163 ft3/s/year, 14 ft3/s/year, 66 ft3/s/year, and 32 ft3/s/year, respectively. However, the only gauge that showed a decreasing trend in the duration of these peaks was the Rasul gauge, with a rate of −0.4 days per year. No extremely low-flow peaks were observed at the outflow Kotri gauge. Regarding the high-flow pulse, the peaks and duration increased at the Jinnah gauge, with slopes of 750 ft3/s/year and 0.08 days/year, respectively. Conversely, the Rasul, Marala, and Balloki gauges exhibited decreasing trends in both the peaks and duration of the high-flow pulse. The magnitudes for these gauges were −130 ft3/s/year (−0.06 days/year), −422 ft3/s/year (0.01 days/year), and −104 ft3/s/year (0.05 days/year), respectively. At the Suleimanki gauge, there was an increasing trend of 11.6 ft3/s/year in the peaks of the high-flow pulse. The outflow gauge at Kotri exhibited a growing trend, with peaks of 1281 ft3/s/year, accompanied by an increasing duration of 0.39 days/year (Figure 6).

3.5.2. Periodical Changes in the Low Flows and High Pulses

To gain further insights into the periodic fluctuations in low-flow and high-pulse occurrences, we employed the Morlet wavelet model to plot and analyze these dynamics. The findings in Figure S7 shed light on the temporal characteristics associated with these fluctuations across various gauges. Our analysis of the low-flow peaks with high signals revealed that at Jinnah, these peaks exhibited less periodicity, spanning 2–4 years from 1995 to 2003 and 1–2 years from 2004 to 2006. Interestingly, the days corresponding to these peaks exhibited only periodicity from 1995 to 2003. Similarly, the extremely low-flow peaks at Rasul demonstrated a periodicity of 2–4 years, with high signals observed between 1996 and 2000. Low signals appeared uniformly spread throughout the years, maintaining a periodicity of 2–3 years. At the Marala gauge, higher signals of extremely low-flow peaks were concentrated from 1996 to 1999, showing a periodicity of 1–5 years. In contrast, the durations of these flows exhibited periodicities of 1–3 years from 2000 to 2004 and 4–8 years from 1998 to 2007. Notably, the Balloki gauge displayed higher periodicities for low signals until 2003, transitioning to higher periodicities from 2004 to 2011. This transition was gradual, with the periodicity shifting from higher to lower years. The Suleimanki gauge exhibited periodicities of 2–4 years from 2002 to 2010, corresponding to higher signals of extremely low-flow peaks. Intriguingly, no peak associated with extremely low flows was noted at the outflow gauge of the Indus Basin. For high-flow pulses, the Marla gauge, inflows of the eastern rivers (i.e., Balloki and Suleiman), and the outflow gauge at Kotri demonstrated more prominent high-flow pulse peaks. The Jinnah gauge observed high-flow pulse peaks with signals of 2–4 from 1996 to 2000 and 3–4 years from 2001 to 2006. Conversely, the Rasul gauge recorded a high-flow pulse peak of 5–7 years only for 1999–2001, with varying periodicities for the associated flow durations from 1995 to 2005. Higher signals showed lesser periodicity at the outflow gauge in Kotri, while an opposite pattern was observed during 1999–2006 for both flows and days (Figure S7).

3.5.3. Magnitude in the Small and High Floods

The trends and magnitudes for the peaks of small-flood and high-flood events recorded from 1991 to 2015, based on the Figure 3 algorithms and the duration of these flood events, are presented in Figure S8. All of the inflow and outflow gauges showed a decreasing trend in peak values for both small and high floods; moreover, the duration associated with these flood events is also decreasing. The trend magnitudes for the small flood peaks at the Jinnah, Marala, and Balloki gauges are higher, with slopes of −7811 ft3/s/year, −5496 ft3/s/year, and 3097 ft3/s/year, respectively. In contrast, the Rasul Suleimanki gauges have a decreasing trend magnitude with relatively less slope, at −373 ft3/s/year and −848 ft3/s/year, respectively. The outflow gauge also observed a decreasing trend in magnitude at the peak of small flood events, with a rate of −10,988 ft3/s/year. Two high-flood events were reported in the Indus Basin for 1992 and 2010 (Figure S8).

3.5.4. Periodical Changes in the Small and High Floods

Figure S9 demonstrates the peaks associated with small and large floods and their durations, employing the Morlet wavelet model. Small flood peaks at the Jinnah gauge exhibited periodicities of 7–8 years from 2001 to 2004 and 3–4 years from 2004 to 2007. Notably, the duration associated with these peaks was significantly recorded between 1996 and 2006, revealing high signals with a 3–4-year periodicity and lower signals spanning 6–8 years from 2004 to 2005. The Rasul gauge indicated a significant periodicity of 3–5 years from 2007 to 2009, while the associated duration showed a significant periodicity of 1–5 years between 1995 and 2000. Furthermore, the Marala gauge displayed periodicities of 1–3 years from 1995 to 2002 for small-flood peaks, with their associated durations showing varying periodicity, ranging from 3 to 5 years from 1998 to 2010. The Balloki and Suleimanki gauges exhibited comparable behaviors regarding small-flood peaks and durations. Notably, the outflow of the Kotri gauge did not manifest any significant signals for the small-flood events. On the other hand, the large-flood peaks at the Jinnah gauge presented a solitary event in 2010 with a periodicity of 1–6 years, coupled with medium-to-high flood signals. At the Rasul gauge, large-flood peaks were observed from 1994 to 1999, revealing a lesser periodicity for lower signals and vice versa. Similarly, the Marala gauge depicted 3–6 years periodicities for higher signals (6–8) during 1995–1999, corresponding to the large-flood peak and its duration. The Balloki gauge displayed behavior akin to the Marla gauge. The Suleimanki gauge observed a periodicity of 1–4 years from 1994 to 1996, characterized by higher signals for large-flood peaks and their corresponding durations. However, the Kotri gauge showed no significant large-flood peaks or durations (Figure S9).

3.6. Discrepancies in the EFC Inflow and Outflow of the Indus Basin

Figure 7 displays the intricate dependencies among the environmental flow components (EFCs) at the Kotri outflow gauge within the Indus Basin from 1991 to 2015. Notably, the absence of an extremely low-flow peak at the Kotri gauge (refer to Figure 6) leads to its exclusion from Figure 7. From the presented data, it is evident that the high-flow pulse peak at the Kotri outflow gauge exhibited a robust reliance on the flow patterns of the Indus River, notably from the Jinnah gauge, followed by the Suleimanki gauge along the Sutlej River. Furthermore, a negative correlation was observed between the Kotri and Rasul gauges regarding the high-flow pulse peak and its duration (see Figure 7a,b). Conversely, the small-flood peak and its duration at the Kotri gauge demonstrated a positive correlation with all inflow gauges, except for Suleimanki, which exhibited a weaker negative correlation in duration (Figure 7c,d). When examining the large-flood peaks and their duration at the Kotri gauge, a robust positive correlation was observed in the Jinnah gauge within the Indus River. Conversely, all other gauges were negatively correlated (as depicted in Figure 7e,f). These findings underscore the complex and varied relationships between different flow peaks and durations across the gauges within the Indus Basin.
The percentage of each environmental flow component (EFC) for each year from 1991 to 2015 was calculated from daily EFC data (Figure 8). Our findings for the Jinnah gauge at the Indus River revealed that low flows constituted the dominant EFC, surpassing other components such as high-flow pulses and extremely low flows, as depicted in Figure 8a. This pattern was consistent across all inflow gauges, showing the same order of EFC prevalence. Interestingly, the Kotri outflow gauge exhibited a distinct trend, with extremely low flows predominating, followed by a high pulse and subsequent low flows. Notably, the period from 1998 to 2002 witnessed a significant increase in extremely low flows at the Kotri gauge, as shown in Figure 8f. An intriguing observation was the tendency to shift towards low flows following minor flood events across all inflow gauges (Figure 8). Throughout our study’s duration, we noted that low flows accounted for approximately 57%, 54%, 56%, and 57% of the coverage for the Jinnah at Indus, Rasul at Jhelum, Marala at Chenab, Ravi at Balloki, and Sutlej at Suleimanki inflow gauges, respectively (Table 1). Remarkably, the percentage of extremely low flow remained consistent at 10% for all inflow gauges, highlighting an interesting consistency. Conversely, the Kotri outflow gauge exhibited variations in EFC percentages over the years. Extremely low flows accounted for 49% of the coverage, followed by high-flow pulses (21%), low flows (14%), small floods (12%), and large floods (3.5%) from 1991 to 2015, as summarized in Table 1.

3.7. Drying of the Indus Basin Due to Declining and Variable Inflows and Outflows from the Indus Basin

We further gathered long-term data from 1976 to 2015 for the Annul, Rabi, and Kharif scales, examining inflow and outflow gauges within the Indus Basin. Our analysis, presented in Figure 9a, elucidates the linear trends of the total volume of water entering and exiting the Indus Basin. The Indus River System Authority (IRSA) delineates the terms ‘dry’, ‘wet’, and ‘medium’ years based on inflow volumes—less than 102.4 MAF is deemed dry, exceeding 114 MAF qualifies as a wet year, and inflow volumes ranging from 102.4 to 114 MAF fall under the category of medium years. Notably, we observed a discernible decline in inflows, characterized by a 0.6 MAF/year rate, with an average volume of 144 MAF at the inflow gauges. The majority of the years were classified as wet, except for 2000 and 2001. Furthermore, a notable decline in inflow volumes was observed after 2000, marked by specific peaks highlighted within yellow circles.
Examining the outflow gauge at Kotri, we identified a decline in outflow volume at a rate of 0.9 million acre feet per year. It is worth mentioning that, to prevent seawater intrusion and ecosystem revival, 8.6 MAF of water is required from the Kotri gauge. However, an average volume of 28 MAF from the Indus Basin was discharged into the Arabian Sea, exceeding the requirement by 70% from 1976 to 2015.
Figure 9b illustrates the relationship between outflow from the Indus Basin and inflow to the Indus Basin, emphasizing that outflow is only feasible when the inflow exceeds 113.51 MAF. Moreover, this figure underscores that the minimum required flow of 8.6 MAF can only be met with an inflow of at least 123 MAF. To further examine the inflow and outflow volumes in light of the significant shift in outflow patterns after 2000, we partitioned the dataset into two distinct periods: 1976–2000 and 2000–2015. The results in Table 2 offer insights into the average water volumes for Kharif, Rabi, and annual seasons at both inflow and outflow gauges. Notably, the Kharif season, known for its high flow and flood potential, substantially reduced inflow volumes into the Indus Basin after 2000, predominantly influenced by the eastern rivers (Ravi and Sutlej). Furthermore, the absence of controlled structures and dams in the Upper Indus region has resulted in significant water discharge into the Arabian Sea, particularly during low-flow seasons, such as the Rabi season, where minimal to no outflows were recorded.

4. Discussion

4.1. Low and High Flows

The Indus Basin is the primary water source, and it is considered the lifeline of the Pakistani people [75,76]. The Indus Basin has seven major rivers, namely the Indus, the Jhelum, and the Chenab (also referred to as the western rivers), and the Ravi, the Sutlej, and the Beas (which are collectively known as the eastern rivers). The western rivers’ water is allocated to Pakistan, whereas the eastern rivers are allocated to India as per the Indus Water Treaty in 1960 [56]. The Kabul River is not part of IWT as it flows between Afghanistan and Pakistan and joins the Indus River at Nowshera City in Pakistan. In this study, we evaluated water availability in the river at the inflow to the Indus Basin and the outflow from the Indus Basin from 1991 to 2015. We have focused on the low and high flow availability, its variations, and periodical changes at the inflow and outflow gauges of the Indus Basin. The analysis showed that extremely low and low flow varies during the pre-flood, flood, and post-flood seasons for the gauges installed at western rivers. In contrast, the magnitude of these low metrics is higher for Indus, followed by Jhelum and Chenab. This is based on the quantum of water entering Pakistan [76]. The average volume of water measured at the western rivers’ gauges is 89.79 MAF (the Indus at Jinnah), 22.54 MAF (the Jhelum at Rasul), and 25.69 MAF (the Chenab at Marala); however, there is substantial variability observed in the flows because of the construction of the several dams and hydropower projects at the Indus, and Chenab Rivers by India in the last two decades [57]. There are uneven flow variations at the Chenab River, as the Marala is the first gauging structure in Pakistan, as the river enters Pakistan territory. Therefore, on the upstream side, there is a planned operation of sluice opening to release water downstream [77]. This will result in floods or hydrological droughts in the Indus Basin, although the floods and droughts are also driven by climatic changes in the Upper Indus Basin (UIB) [42,54,78].
There is a rapid decline in the water volume contributed by the eastern rivers, especially after 2001, which is because of the construction of large hydropower dams on these rivers by India, as reported by Ahmed, Lü, Ahmed, Adeyeri, Ali, Hussain and Shah [59], Sattar and Azeem Shah [79], and Nabeel and Cheema [57]. It is worth noting that the outflow gauge Kotri showed that there is an availability of flows in the high-flow season, and most of the time in a year, there is no flow [58,80]. Moreover, the Morlet wavelet model also suggests that higher flow signals for high and extremely high floods exhibit less periodicity in the western rivers. At the same time, the situation is vice versa for eastern rivers. The dominant flows and duration are low to extremely low in the Indian-administrated rivers. Overall, low flows are dominant for most of the year, and high floods follow during the flood and Kharif seasons in western rivers, which lead to higher outflows from the Indus Basin from April to August, while the low to extremely low flows occur during the rest of the period. This will ultimately shift the country, Pakistan, into the water scarcity list if more reservoirs and the proper implementation of IWT, as well as the water governance issues, cannot be addressed [50,79,81].
The Indus Basin, often referred to as the lifeline of the Pakistani people, plays a pivotal role in the country’s water resources [46,76]. Comprising six major rivers, the basin includes the Indus, the Jhelum, and the Chenab, categorized as western rivers, as well as the Ravi, the Sutlej, and the Beas, known as the eastern rivers. The Indus Water Treaty of 1960 stipulated that western rivers’ water would be allocated to Pakistan and eastern rivers’ water would be allocated to India [56]. Our study examined the availability of river water at the Indus Basin’s inflow and outflow from 1991 to 2015, specifically focusing on variations in low and high flows and their periodic fluctuations at various gauging points within the basin. Our analysis revealed that the western rivers exhibited significant variations in extremely low and low flows during different seasons, including pre-flood, flood, and post-flood periods. The magnitude of these variations was notably higher for the Indus River, followed by the Jhelum and the Chenab [76]. Quantitatively, the average volume of water recorded at the western rivers’ gauging points was 89.79 MAF (the Indus at Jinnah), 22.54 MAF (the Jhelum at Rasul), and 25.69 MAF (the Chenab at Marala). However, these data showed substantial variability due to India’s construction of dams and hydropower projects along the Indus and Chenab Rivers over the past two decades [57]. Notably, the flow variations in the Chenab River were uneven, with the Marala gauging point marking the river’s entry into Pakistan territory [77]. Here, planned sluice operations for downstream water release led to the possibility of floods or hydrological droughts within the Indus Basin. These fluctuations were also influenced by climatic changes in the Upper Indus Basin (UIB) [42,54,78].
Furthermore, a significant decline in water volume contributed by the eastern rivers, especially after 2001, was observed due to India’s construction of large hydropower dams [82]. This observation was in line with the findings of [57,59,79]. It is essential to highlight that the Kotri outflow gauge indicated fluctuations in flow availability, with high flows prevalent during certain seasons, while at other times there was no flow [58,80]. Our analysis, incorporating the Morlet wavelet model, illustrated that higher flow signals for high and extremely high floods displayed less periodicity in the western rivers. In contrast, the situation was the opposite for the eastern rivers. In summary, our findings demonstrate the prevalence of dominant low flows for a significant portion of the year, with high floods occurring during the flood and Kharif seasons in western rivers, leading to increased outflows from the Indus Basin from April to August, and low to extremely low flows throughout the rest of the year. These trends underscore the urgent need for additional reservoirs and the genuine implementation of the Indus Water Treaty, as well as adequate water governance, to address the impending water scarcity challenges [50,79,81].

4.2. Climate Change Linkages with the Waters of the Indus Basin

Numerous writers have utilized CMIP5 models to investigate the Indus Basin’s climate in recent years [83,84,85]. The model was able to replicate characteristics of temperature and precipitation variations over the seasons [85]. However, reproducing the amount proved challenging, and we found that the situation is significantly worse at higher elevations. Using a statistical downscaling method, Kazmi et al. [86] examined data from 44 meteorological stations in Pakistan and projected temperatures for 1961–2099; they found that minimum and maximum temperatures, especially in the north, were higher than in the base period of 1961–1990. Other writers have also discovered that higher elevations are experiencing more warming [87,88,89]. Several additional studies have also found that temperatures rise with increasing elevation. Lutz et al. [90] and Kraaijenbrink et al. [91] both point to several potential future causes, including changes in snow albedo, water vapor, latent heat release, temperature, and aerosols.
According to Gebre and Ludwig [84], when comparing the base period 1971–2005 to both the 2030s and the 2070s emission scenarios, summer precipitation increases, and winter precipitation decreases. Under both emission scenarios for the 2030s and 2070s, as compared to the base period 1971–2005, Gebre and Ludwig [84] found that summer precipitation increased, and winter precipitation decreased. Winter precipitation decreased and dry days increased due to westerly disturbance over the Karakorum [92]. As compared to the baseline period of 1986–2005, Huang et al. [93] found that annual precipitation decreased across the entire basin for the periods 2046–66 and 2081–2100 under three different emission scenarios (RCP2.6, RCP4.5, and RCP8.5). The only exceptions to this tendency were the basin’s extreme northern and southern parts. Monsoon precipitation decreases seasonally, especially in lower-altitude central and southern plains. The flash and extreme floods occur near the Upper and Lower Indus Basin border. Consequently, this region of the basin is particularly vulnerable to floods and flash floods, and the predicted shifts in extreme occurrences are just going to make the situation worse [87]. Droughts and floods are becoming the norm due to the monsoon season’s shrinking duration and increasing intensity, affecting the Indus Basin’s flows [94]. Severe drought from 2000 to 2003 [95] and record-breaking monsoon rainfall in 2010 [96] are examples of the remarkable unpredictability in the Indus Basin’s hydrological response in the recent past.

4.3. Environmental Flows

We also calculated the peak of extremely low flows, high-flow pulses, small floods, and large floods, along with their durations in days, for the inflow and outflow gauges of the Indus Basin. The results indicated a noteworthy trend: while the peaks of extremely low flows at the Indus River’s Jinnah gauge are decreasing, there is a concurrent increase in the high-flow pulses. This shift suggests a heightened occurrence of low flows and a consistent occupation of the Jinnah gauge by such reduced flows (refer to Figure 8a and Table 1). This shift in flow patterns can be attributed to multiple factors, primarily climate change within the Upper Indus Basin (UIB) and irregular flows from the Kabul River, a principal tributary contributing a significant portion—24% of the Indus River’s water and 16% of the overall Indus Basin’s volume. Notably, the Kabul River’s confluence with the Indus at Nowshera, situated upstream of the Jinnah gauge, significantly influences the latter’s flow patterns [57,82]. Moreover, the other two western rivers experienced a similar prominence of low-flow peaks (refer to Table 1).
Furthermore, the investigation revealed a consistent decrease in small-flood peaks across all inflow gauges, indicating a sustained presence of flows within the extremely low- to low-flow range. A notable correlation was observed between high-flow pulse peaks and small floods at Kotri, followed by the Indus, Chenab, and Jhelum (see Figure 7). The declining water volume entering the Indus Basin at the Kotri gauge has emerged as a critical concern, attributed to massive construction projects in Indian territory and climate change. These alterations result in floods during high-flow seasons and extremes, such as minimal or zero flows during winter. Notably, there is a dire need for 8.6 MAF around the year at the Kotri gauge to maintain essential environmental flow conditions, which is crucial for reviving local flora, fauna, and the overall ecosystem [58,80]. Unfortunately, the volume of water drained from the Indus Basin surpasses this critical environmental flow requirement, with an average drainage of 28 MAF recorded from 1976 to 2015. This figure is an alarming 70% higher than the recommended environmental flow, leading to severe implications for the ecosystem’s vitality. The analysis further revealed that post-2000 flows at the Kotri gauge consistently remained below the requisite 8.6 MAF. This highlights the significant variations in water availability within the Indus Basin, notably before and after 2000 (refer to Table 2). One crucial contributing factor to this substantial water loss is the inadequacy of water reservoirs, compounded by the declining capacity of existing reservoirs due to sedimentation within the UIB [97]. Another pertinent concern is the absence of environmental flow regulations for downstream riparians in the eastern rivers in the Indus Waters Treaty (IWT). Moreover, the Figure 9b analysis revealed that outflows are only feasible if the inflow exceeds 113.51 MAF. In comparison, the required environmental flow demands a higher inflow of 123 MAF at the gauges of the Indus Basin. Regardless of the season, low flow is always the most fundamental requirement for water flow. The aquatic ecosystem is vulnerable to the potentially devastating effects of extremely low flow. Water creatures spawn and reproduce during the flood season. The most fundamental need is low flow, but high-flow pulse and high flow are acceptable alternatives. For the river to remain horizontally connected and for material sources to be provided, at least one flood event must occur. However, thinking about how the flow process will continue is also essential. Therefore, this investigation highlights a pressing need for comprehensive strategies to manage water resources, mitigate environmental impacts, and preserve the integrity of the Indus Basin’s ecosystem in the face of evolving flow patterns and ensuing challenges.

4.4. Indus Water Treaty and Environmental Flows

There have been multiple confrontations between competing countries in the Indus Basin over water distribution on the rivers. The reasons for these conflicts include political differences, mistrust, growing tensions concerning surface boundaries, and disagreements about water use. Because of its position as an upper riparian, India has redirected all flows of the three eastern rivers to satisfy its increasing demand for irrigation [82]. As a result, the area receiving water from these rivers, primarily in Pakistan’s eastern regions, is now facing water scarcity and environmental concerns. By 2010, there had been a noticeable 92% drop in the average flow of eastern rivers that entered Pakistan [57,59,80]. Because of this, these rivers run during the flood period, yet they are dry for over 335 days total during the year [80]. The ecological systems of the river and the livelihoods of the people who live there are both negatively impacted due to this adverse influence. This circumstance also led to a decrease in the amount of water flowing into the Lower Indus Basin. For water to flow constantly below the Kotri barrage, which is the last gauge location on the Indus River, approximately 8.6 MAF’s worth of water is necessary [58]. However, because of the upstream flows, it is impossible to attain this threshold flow. Because there are no storage facilities located upstream of Kotri, it is theoretically impossible to guarantee that the minimum needed flows will be followed [57]. Particularly in the Lower Indus Basin, the decreased surface flows provide a persistent environmental risk to the flora, wildlife, and aquatic life that inhabit the area. The circumstance has resulted in the establishment of an ongoing obstacle to the process of normalizing relations between India and Pakistan. Due to a combination of factors, including dwindling supplies and increasing population, the basin is now considered a water-scarce region. The food security of the region can be negatively impacted by a decrease in crop production due to a reduction in water availability [50].
Climate change concerns, new knowledge about how to best manage water for irrigation, food production, and energy production, and other recent developments all call for a reevaluation of the treaty. The development of new dams and hydroelectric projects by India, for instance, is not something that Pakistan considers to be acceptable activities.

4.5. Limitations of This Study

The dataset length, methodology, and quality of the hydrological time series are all potential confounding variables that could affect the findings. Since we have limited our sampling to the inflow and outflow points of the river, we have concentrated on their dynamics in the Indus Basin. Runoff from glaciers and snowmelt affects the flow monitored at the basin’s inflow gauges [98]. Moreover, the temperature and precipitation ultimately contributed to the flow recorded at these inflow gauges. Hence, the effects of climate change in the upstream source regions of these chosen inflow gauges were disregarded entirely in the current study.

5. Conclusions

The Indus Basin, which spans Afghanistan, China, India, and Pakistan, is crucial for effective water management. According to the Indus Water Treaty, Pakistan controls the western rivers (Indus, Jhelum, and Chenab), while India manages the eastern rivers (Ravi, Sutlej, and Beas). The Kabul River’s allocation remains disputed between Afghanistan and Pakistan. Over the past 25 years, water availability in the basin has decreased dramatically, with per capita water usage dropping from 5260 m3 to less than 1000 m3, resulting in extreme water stress in Pakistan. Key findings of this study are as follows:
Flow patterns: High and extremely high flows are most common during the flood season in the western rivers, whereas the eastern rivers exhibit lower flows. The Kotri gauge often experiences zero flows during the pre-flood and post-flood seasons.
Periodic behavior: Western rivers exhibit higher periodicity for lower flows (Q90 and Q99), whereas the eastern rivers show higher periodicity during low-flow months.
Flow trends: The Indus River has experienced a decrease in extremely low flows and an increase in high-flow pulses. Long-term data (1976–2015) indicate a decline in inflow and outflow volumes, particularly after 2000, which is attributed to interventions and reduced consideration of environmental flows.
Environmental requirements: To meet ecological needs and prevent seawater intrusion, a minimum of 8.6 MAF of outflow is necessary at the Kotri gauge. However, excess outflows averaging 28 MAF were observed due to inadequate reservoirs.
Inflow-required outflow: To achieve the necessary outflows of 8.6 MAF, inflows must exceed 123 MAF. The findings presented in this study represent a significant advancement in our understanding of declining water resources, their seasonal variations, periodic changes in inflow and outflow, and the implications for the entire Indus Basin. Moreover, these insights can inform decision-makers, facilitate dialogue with neighboring countries, and ensure the effective and smooth implementation of the IWT, which is essential in light of climate change and environmental flow requirements. Nevertheless, the IWT did not propose any minimum environmental flows to be allocated. The Indus Water Treaty (IWT) must be re-examined because of the staggering increase in the human population. Climate change is the most significant threat to the water resources of the Indus Basin compared to any other factor. The melting of glaciers due to high temperatures is the primary cause of the dangers, which can restrict the flow of water into the Indus Basin by as much as fifty percent in the worst-case scenario for the future. The image becomes more unsettling when this facet is paired with the fact that the region’s population is growing at an alarming rate.

Supplementary Materials

The following supporting information can be downloaded at: https://www.mdpi.com/article/10.3390/w17101557/s1. Figure S1 The daily time series with mean, maximum and minimum values from 1991 to 2015 at the inflow and out flow gauges of Indus Basin in Pakistan; Figure S2. The wavelet power spectra during the Flood season for the extremely low flow (Q99), low flow (Q90), high flow (Q10), and extremely high flow (Q5) at the inflow and outflow gauges of the Indus Basin; Figure S3. The wavelet power spectra during the Post-Flood season for the extremely low flow (Q99), low flow (Q90), high flow (Q10), and extremely high flow (Q5) at the inflow and outflow gauges of the Indus Basin; Figure S4. Flow Duration Curve for the Rabi and Kharif seasons at the inflow (Jinnah, Rasul, Maral, Balloki, and Suleiman) and outflow (Kotri) gauges of the Indus Basin. The extremely low flow (Q99), low flow (Q90), high flow (Q10), and extremely high flow (Q5) are also presented for each graph; Figure S5. The wavelet power spectra during the Rabi season for the extremely low flow (Q99), low flow (Q90), high flow (Q10), and extremely high flow (Q5) at the inflow and outflow gauges of the Indus Basin Rabi season; Figure S6. The wavelet power spectra during the Kharif season for the extremely low flow (Q99), low flow (Q90), high flow (Q10), and extremely high flow (Q5) at the inflow and outflow gauges of the Indus Basin; Figure S7. Periodical changes in peak for the extremely low flow and high flow pulse and their durations from 1991-2015 for inflow and outflow gauges of the Indus Basin; Figure S8. Small flood and high flood magnitudes Yearly variations in the Peaks of small and high floods along with their duration at the inflow and outflow gauges of the Indus Basin during 1991–2015. The pink shade shows the 95% confidence band; Figure S9. Periodical changes in peak for the small and large floods and their durations from 1991–2015 for inflow and outflow gauges of the Indus Basin.

Author Contributions

N.A.: Conceptualization, Methodology, Software, Investigation, Writing—original draft, Formal analysis, Resources, Data curation, and Project administration. H.L. and M.S.I.: Investigation, Visualization, Supervision, and Writing—review and editing. B.Đ. and N.A.: Validation and Fund Acquisition. O.E.A., B.Đ. and Y.M.Y.: Data curation, Formal analysis, Investigation, and Visualization. H.L. and M.S.I.: Investigation, Visualization, Supervision, and Writing—review and editing. N.A., B.Đ., Y.M.Y., N.K. and H.L.: Software, Investigation, Visualization, Supervision, and Writing—review and editing. All authors have read and agreed to the published version of the manuscript.

Funding

The funding was partially provided by University North, Croatia, within the scientific project “Hydrological and geodetic analysis of the watercourse-second part”, UNIN-TEH-25-1-3, from 2025.

Data Availability Statement

The data are available to the corresponding authors upon reasonable request.

Acknowledgments

The first author thanks the College of Hydrology and Water Resources of Hohai University for providing technical support and resources. The authors thank the Provincial Irrigation Departments of Pakistan for providing the flow data used in this research. The authors would also like to thank University North for their support. We would also like to thank the anonymous reviewers for their review of this article.

Conflicts of Interest

The authors declare no conflicts of interest.

References

  1. Guo, W.; Yang, H.; Ma, Y.; Hong, F.; Wang, H. Comprehensive evaluation of the hydrological health evolution and its driving forces in the river-lake system. Ecol. Inform. 2023, 75, 102117. [Google Scholar] [CrossRef]
  2. Wen, C.; Zhen, Z.; Zhang, L.; Yan, C. A bibliometric analysis of river health based on publications in the last three decades. Environ. Sci. Pollut. Res. 2023, 30, 15400–15413. [Google Scholar] [CrossRef] [PubMed]
  3. Shan, C.; Dong, Z.; Lu, D.; Xu, C.; Wang, H.; Ling, Z.; Liu, Q. Study on river health assessment based on a fuzzy matter-element extension model. Ecol. Indic. 2021, 127, 107742. [Google Scholar] [CrossRef]
  4. Jiao, H.; Guo, W.; Jiao, X. Evaluation of hydrological regime alteration and ecological effects in the upper reaches of the Yangtze River, China. Water Supply 2023, 23, 1827–1842. [Google Scholar] [CrossRef]
  5. Cheng, X.; Chen, L.; Sun, R.; Kong, P. Land use changes and socio-economic development strongly deteriorate river ecosystem health in one of the largest basins in China. Sci. Total Environ. 2018, 616, 376–385. [Google Scholar] [CrossRef] [PubMed]
  6. Zhao, C.; Yang, Y.; Yang, S.; Xiang, H.; Zhang, Y.; Wang, Z.; Chen, X.; Mitrovic, S. Predicting future river health in a minimally influenced mountainous area under climate change. Sci. Total Environ. 2019, 656, 1373–1385. [Google Scholar] [CrossRef]
  7. Castellanos-Osorio, G.; Lopez-Ballesteros, A.; Perez-Sanchez, J.; Senent-Aparicio, J. Disaggregated monthly SWAT plus model versus daily SWAT plus model for estimating environmental flows in Peninsular Spain. J. Hydrol. 2023, 623, 129837. [Google Scholar] [CrossRef]
  8. de Sousa, L.F.; Ferraz, L.L.; Santos, C.A.S.; Rocha, F.A.; de Jesus, R.M. Assessment of hydrological trends and changes in hydroclimatic and land use parameters in a river basin in northeast Brazil. J. South Am. Earth Sci. 2023, 128, 104464. [Google Scholar] [CrossRef]
  9. El Jeitany, J.; Pacetti, T.; Caporali, E. Evaluating climate change effects on hydrological functionality and water-related ecosystem services. Ecohydrology 2023, 17, e2557. [Google Scholar] [CrossRef]
  10. Peng, F.; Shi, X.; Li, K.; Wang, Y.; Feng, J.; Li, R.; Liang, R. How to comprehensively evaluate river discharge under the influence of a dam. Ecol. Inform. 2022, 69, 101637. [Google Scholar] [CrossRef]
  11. Ramesh, V.V.S.; Thampi, S.G. Application of hydrologic and hydraulic methods to calculate the environmental flow requirements of the Chaliyar river. Environ. Earth Sci. 2023, 82, 166. [Google Scholar] [CrossRef]
  12. Reyes-Cedeno, I.G.; Hernandez-Marin, M.; Pacheco-Guerrero, A.I.; Gannon, J.P. Comprehensive Methodology and Analysis to Determine the Environmental Flow Regime in the Temporary Stream “La Yerbabuena” in Aguascalientes, Mexico. Water 2023, 15, 879. [Google Scholar] [CrossRef]
  13. Wang, H.X.; Cheng, S.Y.; He, N.; Huang, L.T.; Yang, H.; Hong, F.T.; Ma, Y.C.; Chen, W.X.; Guo, W.X. Multi-scale flow regimes and driving forces analysis based on different models: A case study of the Wu river basin. Water Supply 2023, 23, 3978–3996. [Google Scholar] [CrossRef]
  14. Gates, K.K.; Vaughn, C.C.; Julian, J.P. Developing environmental flow recommendations for freshwater mussels using the biological traits of species guilds. Freshw. Biol. 2015, 60, 620–635. [Google Scholar] [CrossRef]
  15. Akter, A.; Tanim, A. A modeling approach to establish environmental flow threshold in ungauged semidiurnal tidal river. J. Hydrol. 2018, 558, 442–459. [Google Scholar] [CrossRef]
  16. Horne, A.C.; Nathan, R.; Poff, N.L.; Bond, N.R.; Webb, J.A.; Wang, J.; John, A. Modeling flow-ecology responses in the anthropocene: Challenges for sustainable riverine management. BioScience 2019, 69, 789–799. [Google Scholar] [CrossRef]
  17. Su, Y.; Li, W.; Liu, L.; Hu, W.; Li, J.; Sun, X.; Li, Y. Health assessment of small-to-medium sized rivers: Comparison between comprehensive indicator method and biological monitoring method. Ecol. Indic. 2021, 126, 107686. [Google Scholar] [CrossRef]
  18. Zhang, Z.; Li, Y.; Wang, X.; Li, H.; Zheng, F.; Liao, Y.; Tang, N.; Chen, G.; Yang, C. Assessment of river health based on a novel multidimensional similarity cloud model in the Lhasa River, Qinghai-Tibet Plateau. J. Hydrol. 2021, 603, 127100. [Google Scholar] [CrossRef]
  19. Chen, H.; Li, W.; Zuo, Q.; Zhang, Y.; Liang, S. Evaluation of aquatic ecological health of sluice-controlled rivers in Huai River Basin (China) using evaluation index system. Environ. Sci. Pollut. Res. 2022, 29, 65128–65143. [Google Scholar] [CrossRef]
  20. Tsai, W.-P.; Chang, F.-J.; Chang, L.-C.; Herricks, E.E. AI techniques for optimizing multi-objective reservoir operation upon human and riverine ecosystem demands. J. Hydrol. 2015, 530, 634–644. [Google Scholar] [CrossRef]
  21. Ezzeldin, R.; Abd-Elmaboud, M. Modeling flow resistance and geometry of dunes bed form in alluvial channels using hybrid RANN–AHA and GEP models. Int. J. Sediment Res. 2024, 39, 885–902. [Google Scholar] [CrossRef]
  22. Fang, G.; Yan, M.; Dai, L.; Huang, X.; Zhang, X.; Lu, Y. Improved indicators of hydrological alteration for quantifying the dam-induced impacts on flow regimes in small and medium-sized rivers. Sci. Total Environ. 2023, 867, 161499. [Google Scholar] [CrossRef]
  23. Black, A.; Rowan, J.; Duck, R.; Bragg, O.; Clelland, B. DHRAM: A method for classifying river flow regime alterations for the EC Water Framework Directive. Aquat. Conserv. Mar. Freshw. Ecosyst. 2005, 15, 427–446. [Google Scholar] [CrossRef]
  24. Bello, C.; Suarez, W.; Drenkhan, F.; Vega-Jácome, F. Hydrological impacts of dam regulation for hydropower production: The case of Lake Sibinacocha, Southern Peru. J. Hydrol. Reg. Stud. 2023, 46, 101319. [Google Scholar] [CrossRef]
  25. Nilsson, C.; Reidy, C.A.; Dynesius, M.; Revenga, C. Fragmentation and flow regulation of the world’s large river systems. Science 2005, 308, 405–408. [Google Scholar] [CrossRef] [PubMed]
  26. Lehner, B.; Liermann, C.R.; Revenga, C.; Vörösmarty, C.; Fekete, B.; Crouzet, P.; Döll, P.; Endejan, M.; Frenken, K.; Magome, J. High-resolution mapping of the world’s reservoirs and dams for sustainable river-flow management. Front. Ecol. Environ. 2011, 9, 494–502. [Google Scholar] [CrossRef]
  27. Timpe, K.; Kaplan, D. The changing hydrology of a dammed Amazon. Sci. Adv. 2017, 3, e1700611. [Google Scholar] [CrossRef]
  28. Cui, T.; Tian, F.; Yang, T.; Wen, J.; Khan, M.Y.A. Development of a comprehensive framework for assessing the impacts of climate change and dam construction on flow regimes. J. Hydrol. 2020, 590, 125358. [Google Scholar] [CrossRef]
  29. Mezger, G.; del Tánago, M.G.; De Stefano, L. Environmental flows and the mitigation of hydrological alteration downstream from dams: The Spanish case. J. Hydrol. 2021, 598, 125732. [Google Scholar] [CrossRef]
  30. Gao, Y.; Vogel, R.M.; Kroll, C.N.; Poff, N.L.; Olden, J.D. Development of representative indicators of hydrologic alteration. J. Hydrol. 2009, 374, 136–147. [Google Scholar] [CrossRef]
  31. Mims, M.C.; Olden, J.D. Fish assemblages respond to altered flow regimes via ecological filtering of life history strategies. Freshw. Biol. 2013, 58, 50–62. [Google Scholar] [CrossRef]
  32. Bunn, S.E.; Arthington, A.H. Basic Principles and Ecological Consequences of Altered Flow Regimes for Aquatic Biodiversity. Environ. Manag. 2002, 30, 492–507. [Google Scholar] [CrossRef] [PubMed]
  33. Arthington, A.H.; Naiman, R.J.; McClain, M.E.; Nilsson, C. Preserving the biodiversity and ecological services of rivers: New challenges and research opportunities. Freshw. Biol. 2010, 55, 1–16. [Google Scholar] [CrossRef]
  34. Wang, W.; Zhang, Y.; Geng, X.; Tang, Q. Impact Classification of Future Land Use and Climate Changes on Flow Regimes in the Yellow River Source Region, China. J. Geophys. Res. Atmos. 2021, 126, e2020JD034064. [Google Scholar] [CrossRef]
  35. UN-Water. Water and Climate Change. The United Nations World Water Development Report 2020; UN-Water: Geneva, Switzerland, 2020. [Google Scholar]
  36. Lucinda, J. The United Nations World Water Development Report 2015: Water for a Sustainable World; UN-Water: Geneva, Switzerland, 2016; pp. 64–65. [Google Scholar]
  37. Hafeez, M.; Awan, U.K. Water Resource Potential: Status and Overview. In Water Policy in Pakistan: Issues and Options; Ahmad, M., Ed.; Springer International Publishing: Cham, Switzerland, 2023; pp. 73–90. [Google Scholar]
  38. Janjua, S.; Hassan, I.; Muhammad, S.; Ahmed, S.; Ahmed, A. Water management in Pakistan’s Indus Basin: Challenges and opportunities. Water Policy 2021, 23, 1329–1343. [Google Scholar] [CrossRef]
  39. Archer, D.R.; Forsythe, N.; Fowler, H.J.; Shah, S.M. Sustainability of water resources management in the Indus Basin under changing climatic and socio economic conditions. Hydrol. Earth Syst. Sci. 2010, 14, 1669–1680. [Google Scholar] [CrossRef]
  40. Luo, T.; Young, R.; Reig, P. Aqueduct Projected Water Stress Country Rankings; World Resources Institute: Washington, DC, USA, 2015. [Google Scholar]
  41. SBP. State Bank of Pakistan’s Annual Report 2016–17; State Bank of Pakistan: Karachi, Pakistan, 2017. [Google Scholar]
  42. Ahmed, N.; Wang, G.; Booij, M.J.; Ceribasi, G.; Bhat, M.S.; Ceyhunlu, A.I.; Ahmed, A. Changes in monthly streamflow in the Hindukush–Karakoram–Himalaya Region of Pakistan using innovative polygon trend analysis. Stoch. Environ. Res. Risk Assess. 2021, 36, 811–830. [Google Scholar] [CrossRef]
  43. Bandaragoda, D.J.; ur Rehman, S. Warabandi in Pakistan’s Canal Irrigation Systems: Widening Gap Between Theory and Practice; IWMI: Colombo, Sri Lanka, 1995. [Google Scholar]
  44. Ringler, C.; Anwar, A. Water for food security: Challenges for Pakistan. Water Int. 2013, 38, 505–514. [Google Scholar] [CrossRef]
  45. Reinsch, M.; Pearce, D. Pakistan: Country Water Resources Assistance Strategy, Water Economy: Running Dry; 0821337793; World Bank: Washington, DC, USA, 2005. [Google Scholar]
  46. Ahmad, S.; Ahmad, G. Water Supply and Demand: National and Regional Trends. In Water Policy in Pakistan: Issues and Options; Ahmad, M., Ed.; Springer International Publishing: Cham, Switzerland, 2023; pp. 91–121. [Google Scholar]
  47. Dars, G.H.; Lashari, B.K.; Soomro, M.S.; Strong, C.; Ansari, K. Pakistan’s Water Resources in the Era of Climate Change. In Water Resources of Pakistan: Issues and Impacts; Watto, M.A., Mitchell, M., Bashir, S., Eds.; Springer International Publishing: Cham, Switzerland, 2021; pp. 95–108. [Google Scholar]
  48. Yang, Y.-C.E.; Brown, C.; Yu, W.; Wescoat, J.; Ringler, C. Water governance and adaptation to climate change in the Indus River Basin. J. Hydrol. 2014, 519, 2527–2537. [Google Scholar] [CrossRef]
  49. Ur Rahman, K.; Shang, S.; Balkhair, K.; Nusrat, A. Catchment-Scale Drought Propagation Assessment in the Indus Basin of Pakistan Using a Combined Approach of Principal Components and Wavelet Analyses. J. Hydrometeorol. 2023, 24, 601–624. [Google Scholar] [CrossRef]
  50. FAO. AQUASTAT Transboundary River Basins—Indus River Basin; Food and Agriculture Organization of the United Nations (FAO): Rome, Italy, 2011. [Google Scholar]
  51. Immerzeel, W.W.; Van Beek, L.P.; Bierkens, M.F. Climate change will affect the Asian water towers. Science 2010, 328, 1382–1385. [Google Scholar] [CrossRef] [PubMed]
  52. Dars, G.H.; Najafi, M.R.; Qureshi, A.L. Assessing the impacts of climate change on future precipitation trends based on downscaled CMIP5 simulations data. Mehran Univ. Res. J. Eng. Technol. 2017, 36, 385–394. [Google Scholar] [CrossRef]
  53. Adams, T.E. Chapter 12—Water Resources Forecasting Within the Indus River Basin: A Call for Comprehensive Modeling. In Indus River Basin; Khan, S.I., Adams, T.E., Eds.; Elsevier: Amsterdam, The Netherlands, 2019; pp. 267–308. [Google Scholar]
  54. Eckstein, D.; Künzel, V.; Schäfer, L. Risk Index 2018. Who Suffers Most from Extreme Weather Events? Weather-Related Loss Events in 2016 and 1997 to 2016; Germanwatch: Bonn, Germany, 2017. [Google Scholar]
  55. Khan, A.; Idrees, M.H. The Impact of Climate Change on the Indus Basin: Challenges and Constraints. In Water Policy in Pakistan: Issues and Options; Ahmad, M., Ed.; Springer International Publishing: Cham, Switzerland, 2023; pp. 225–248. [Google Scholar]
  56. United Nations. The Indus Waters Treaty 1960 between the Government of India, the Government of Pakistan and the International Bank for Reconstruction and Development; United Nations: New York, NY, USA, 1960; Volume 19, pp. 300–365. [Google Scholar]
  57. Nabeel, F.; Cheema, M.J.M. Pakistan’s Transboundary Water Challenge. In Water Resources of Pakistan: Issues and Impacts; Watto, M.A., Mitchell, M., Bashir, S., Eds.; Springer International Publishing: Cham, Switzerland, 2021; pp. 37–55. [Google Scholar]
  58. Anwar, A.A.; Bhatti, M.T. Pakistan’s Water Apportionment Accord of 1991: 25 Years and Beyond. J. Water Resour. Plan. Manag. 2018, 144, 05017015. [Google Scholar] [CrossRef]
  59. Ahmed, N.; Lü, H.; Ahmed, S.; Adeyeri, O.E.; Ali, S.; Hussain, R.; Shah, S. Transboundary River Water Availability to Ravi Riverfront under Changing Climate: A Step towards Sustainable Development. Sustainability 2023, 15, 3526. [Google Scholar] [CrossRef]
  60. Searcy, J.K. Flow-Duration Curves; US Government Printing Office: Washington, DC, USA, 1959.
  61. Chouaib, W.; Caissie, D. Regional disparities in water availability and low flow conditions in rivers across Canada. J. Hydrol. 2021, 598, 126195. [Google Scholar] [CrossRef]
  62. Wang, Z.; Sun, S.; Song, C.; Wang, G.; Lin, S.; Ye, S. Variation characteristics of high flows and their responses to climate change in permafrost regions on the Qinghai-Tibet Plateau, China. J. Clean. Prod. 2022, 376, 134369. [Google Scholar] [CrossRef]
  63. Davies, S.; Young, W. Unlocking Economic Growth Under a Changing Climate: Agricultural Water Reforms in Pakistan. In Water Resources of Pakistan: Issues and Impacts; Watto, M.A., Mitchell, M., Bashir, S., Eds.; Springer International Publishing: Cham, Switzerland, 2021; pp. 109–131. [Google Scholar]
  64. Yang, Y.C.E.; Ringler, C.; Brown, C.; Mondal, M.A.H. Modeling the Agricultural Water–Energy–Food Nexus in the Indus River Basin, Pakistan. J. Water Resour. Plan. Manag. 2016, 142, 04016062. [Google Scholar] [CrossRef]
  65. Richter, B.; Baumgartner, J.; Wigington, R.; Braun, D. How much water does a river need? Freshw. Biol. 1997, 37, 231–249. [Google Scholar] [CrossRef]
  66. Guan, X.; Zhang, Y.; Meng, Y.; Liu, Y.; Yan, D. Study on the theories and methods of ecological flow guarantee rate index under different time scales. Sci. Total Environ. 2021, 771, 145378. [Google Scholar] [CrossRef]
  67. Fair, C.C.; Kuhn, P.; Malhotra, N.A.; Shapiro, J. Natural disasters and political engagement: Evidence from the 2010–11 Pakistani floods. Q. J. Political Sci. 2017, 12, 99–141. [Google Scholar] [CrossRef]
  68. Meadows, A.; Meadows, P.S. The Indus River: Biodiversity, Resources, Humankind; Oxford University Press: Karachi, Pakistan, 1999. [Google Scholar]
  69. Adeyeri, O.E.; Laux, P.; Arnault, J.; Lawin, A.E.; Kunstmann, H. Conceptual hydrological model calibration using multi-objective optimization techniques over the transboundary Komadugu-Yobe basin, Lake Chad Area, West Africa. J. Hydrol. Reg. Stud. 2020, 27, 100655. [Google Scholar] [CrossRef]
  70. Ahmed, N.; Wang, G.; Booij, M.J.; Oluwafemi, A.; Hashmi, M.Z.-u.-R.; Ali, S.; Munir, S. Climatic Variability and Periodicity for Upstream Sub-Basins of the Yangtze River, China. Water 2020, 12, 842. [Google Scholar] [CrossRef]
  71. Adeyeri, O.E.; Ishola, K.A. Variability and Trends of Actual Evapotranspiration over West Africa: The Role of Environmental Drivers. Agric. For. Meteorol. 2021, 308–309, 108574. [Google Scholar] [CrossRef]
  72. Yerdelen, C.; Abdelkader, M.; Eris, E. Assessment of drought in SPI series using continuous wavelet analysis for Gediz Basin, Turkey. Atmos. Res. 2021, 260, 105687. [Google Scholar] [CrossRef]
  73. Ndehedehe, C.E.; Adeyeri, O.E.; Onojeghuo, A.O.; Ferreira, V.G.; Kalu, I.; Okwuashi, O. Understanding global groundwater-climate interactions. Sci. Total Environ. 2023, 904, 166571. [Google Scholar] [CrossRef]
  74. Adeyeri, O.E.; Zhou, W.; Ndehedehe, C.E.; Wang, X. Global vegetation, moisture, thermal and climate interactions intensify compound extreme events. Sci. Total Environ. 2024, 912, 169261. [Google Scholar] [CrossRef]
  75. Watto, M.A.; Mitchell, M.; Akhtar, T. Pakistan’s Water Resources: Overview and Challenges. In Water Resources of Pakistan: Issues and Impacts; Watto, M.A., Mitchell, M., Bashir, S., Eds.; Springer International Publishing: Cham, Switzerland, 2021; pp. 1–12. [Google Scholar]
  76. Kamal, S. Pakistan’s Water: Changing the Narrative, Changing the Outcomes. In Water Policy in Pakistan: Issues and Options; Ahmad, M., Ed.; Springer International Publishing: Cham, Switzerland, 2023; pp. 5–31. [Google Scholar]
  77. Abbas, Y.; Khan, N.M.; Mughal, H.-U.-R.; Mahmood, K. Assessing inflow variability at rim stations of the Indus Basin Irrigation System*. Irrig. Drain. 2020, 69, 997–1011. [Google Scholar] [CrossRef]
  78. Immerzeel, W.W.; Lutz, A.; Andrade, M.; Bahl, A.; Biemans, H.; Bolch, T.; Hyde, S.; Brumby, S.; Davies, B.; Elmore, A. Importance and vulnerability of the world’s water towers. Nature 2020, 577, 364–369. [Google Scholar] [CrossRef]
  79. Sattar, E.; Azeem Shah, S. Pakistan’s Transboundary Water Governance Mechanisms and Challenges. In Water Policy in Pakistan: Issues and Options; Ahmad, M., Ed.; Springer International Publishing: Cham, Switzerland, 2023; pp. 369–397. [Google Scholar]
  80. Akhtar, T.; Khan, H.F.; Mustafa, D. Water Security in Pakistan: Availability, Accessibility and Utilisation. In Water Resources of Pakistan: Issues and Impacts; Watto, M.A., Mitchell, M., Bashir, S., Eds.; Springer International Publishing: Cham, Switzerland, 2021; pp. 57–78. [Google Scholar]
  81. Young, W.J.; Anwar, A.; Bhatti, T.; Borgomeo, E.; Davies, S.; Garthwaite, W.R., III; Gilmont, E.M.; Leb, C.; Lytton, L.; Makin, I. Pakistan: Getting More from Water; World Bank: Washington, DC, USA, 2019. [Google Scholar]
  82. Cheema, M.J.M.; Qamar, M.U. Chapter 8—Transboundary Indus River Basin: Potential Threats to Its Integrity. In Indus River Basin; Khan, S.I., Adams, T.E., Eds.; Elsevier: Amsterdam, The Netherlands, 2019; pp. 183–201. [Google Scholar]
  83. Hasson, S.u.; Pascale, S.; Lucarini, V.; Böhner, J. Seasonal cycle of precipitation over major river basins in South and Southeast Asia: A review of the CMIP5 climate models data for present climate and future climate projections. Atmos. Res. 2016, 180, 42–63. [Google Scholar] [CrossRef]
  84. Gebre, S.; Ludwig, F. Spatial and temporal variation of impacts of climate change on the hydrometeorology of Indus River Basin using RCPs scenarios, South East Asia. J. Earth Sci. Clim. Change 2014, 5, 1–7. [Google Scholar]
  85. Su, B.; Huang, J.; Gemmer, M.; Jian, D.; Tao, H.; Jiang, T.; Zhao, C. Statistical downscaling of CMIP5 multi-model ensemble for projected changes of climate in the Indus River Basin. Atmos. Res. 2016, 178–179, 138–149. [Google Scholar] [CrossRef]
  86. Kazmi, D.H.; Li, J.; Rasul, G.; Tong, J.; Ali, G.; Cheema, S.B.; Liu, L.; Gemmer, M.; Fischer, T. Statistical downscaling and future scenario generation of temperatures for Pakistan Region. Theor. Appl. Climatol. 2015, 120, 341–350. [Google Scholar] [CrossRef]
  87. Rajbhandari, R.; Shrestha, A.B.; Kulkarni, A.; Patwardhan, S.K.; Bajracharya, S.R. Projected changes in climate over the Indus river basin using a high resolution regional climate model (PRECIS). Clim. Dyn. 2015, 44, 339–357. [Google Scholar] [CrossRef]
  88. Forsythe, N.; Fowler, H.J.; Blenkinsop, S.; Burton, A.; Kilsby, C.G.; Archer, D.R.; Harpham, C.; Hashmi, M.Z. Application of a stochastic weather generator to assess climate change impacts in a semi-arid climate: The Upper Indus Basin. J. Hydrol. 2014, 517, 1019–1034. [Google Scholar] [CrossRef]
  89. Chaudhry, Q.; Mahmood, A.; Rasul, G.; Afzaal, M. Climate Change Indicators of Pakistan; Technical Report No. PMD 22/2009; Pakistan Meteorological Department: Islamabad, Pakistan, 2009. [Google Scholar]
  90. Lutz, A.F.; ter Maat, H.W.; Biemans, H.; Shrestha, A.B.; Wester, P.; Immerzeel, W.W. Selecting representative climate models for climate change impact studies: An advanced envelope-based selection approach. Int. J. Climatol. 2016, 36, 3988–4005. [Google Scholar] [CrossRef]
  91. Kraaijenbrink, P.D.A.; Bierkens, M.F.P.; Lutz, A.F.; Immerzeel, W.W. Impact of a global temperature rise of 1.5 degrees Celsius on Asia’s glaciers. Nature 2017, 549, 257–260. [Google Scholar] [CrossRef]
  92. Ahmed, N.; Lu, H.; Booij, M.J.; Wang, G.; Marhaento, H.; Bhat, M.S.; Adnan, S. Innovative polygon trend analysis of monthly precipitation (1952–2015) in the Hindukush-Karakoram-Himalaya river basins of Pakistan. Int. J. Climatol. 2022, 42, 9967–9993. [Google Scholar] [CrossRef]
  93. Huang, J.; Wang, Y.; Fischer, T.; Su, B.; Li, X.; Jiang, T. Simulation and projection of climatic changes in the Indus River Basin, using the regional climate model COSMO-CLM. Int. J. Climatol. 2017, 37, 2545–2562. [Google Scholar] [CrossRef]
  94. Turner, A.G.; Annamalai, H. Climate change and the South Asian summer monsoon. Nat. Clim. Change 2012, 2, 587–595. [Google Scholar] [CrossRef]
  95. Ahmad, S.; Hussain, Z.; Qureshi, A.S.; Majeed, R.; Saleem, M. Drought Mitigation in Pakistan: Current Status and Options for Future Strategies; IWMI: Colombo, Sri Lanka, 2004; Volume 85. [Google Scholar]
  96. Houze, R.; Rasmussen, K.; Medina, S.; Brodzik, S.; Romatschke, U. Anomalous atmospheric events leading to the summer 2010 floods in Pakistan. Bull. Am. Meteorol. Soc. 2011, 92, 291–298. [Google Scholar] [CrossRef]
  97. Podger, G.M.; Ahmad, M.-u.-D.; Yu, Y.; Stewart, J.P.; Shah, S.M.M.A.; Khero, Z.I. Development of the Indus River System Model to Evaluate Reservoir Sedimentation Impacts on Water Security in Pakistan. Water 2021, 13, 895. [Google Scholar] [CrossRef]
  98. Subbarayan, S.; Youssef, Y.M.; Singh, L.; Dąbrowska, D.; Alarifi, N.; Ramsankaran, R.; Visweshwaran, R.; Saqr, A.M. Soil and Water Assessment Tool-Based Prediction of Runoff Under Scenarios of Land Use/Land Cover and Climate Change Across Indian Agro-Climatic Zones: Implications for Sustainable Development Goals. Water 2025, 17, 458. [Google Scholar] [CrossRef]
Figure 1. The Indus Basin Irrigation System (IBIS) features flow gauges (blue triangles) installed at the inflow and outflow points. In contrast, the black triangles within the basin represent the utilization of water and the canal irrigation network.
Water 17 01557 g001
Figure 2. Flow chart of the methodology adopted in this research.
Water 17 01557 g002
Figure 3. The algorithm used for calculating environmental flow components (EFCs).
Water 17 01557 g003
Figure 4. Flow duration curve for the pre-flood, flood, and post-flood seasons at the inflow (Jinnah, Rasul, Maral, Balloki, and Suleimanki) and outflow (Kotri) gauges of the Indus Basin. The extremely low flow (Q99), low flow (Q90), high flow (Q10), and extremely high flow (Q5) are also presented for each graph.
Water 17 01557 g004
Figure 5. The wavelet power spectra during the pre-flood season for the extremely low flow (Q99), low flow (Q90), high flow (Q10), and extremely high flow (Q5) at the inflow and outflow gauges of the Indus Basin.
Water 17 01557 g005
Figure 6. Yearly variations in the peaks of extremely low flows and high-flow pulses along with their duration at the inflow and outflow gauges of the Indus Basin during 1991–2015. The pink shade shows the 95% confidence band.
Water 17 01557 g006
Figure 7. Correlation plots for the EFCs at the outflow gauge (Kotri) with the inflow gauges at the western and eastern rivers of the Indus Basin during 1991–2015.
Water 17 01557 g007
Figure 8. Yearly coverage of each type of EFC (percentage) at the inflow and outflow gauges of the Indus Basin during 1991–2015: (a) Jinnah, (b) Rasul, (c) Marala, (d) Balloki, (e) Suleimanki, and (f) Kotri. The Y-axis presents the types of EFCs while the numbers present the percentage of each EFC coverage in each year from 1991 to 2015.
Water 17 01557 g008
Figure 9. (a) Volume of water (MAF) at the inflow and outflow gauges of the Indus Basin and its trends. The wet, dry, and medium water years are also marked. (b) The volume of water out of the basin as a function of the inflow volume during 1976–2015.
Water 17 01557 g009
Table 1. Discrepancies in the EFCs for the inflow and outflow gauges of the Indus Basin from 1991–2015 (units in percentage).
GaugesType of EFCPercentage
JinnahLow Flow57
High-Flow Pulse20.87
Extreme Low Flow10
Small Flood9.8
Large Flood2.32
RasulLow Flow54.01
High-Flow Pulse26.4
Extreme Low Flow10.01
Small Flood9.17
Large Flood0.41
MaralaLow Flow56.49
High-Flow Pulse26.19
Extreme Low Flow10.24
Small Flood5.23
Large Flood1.85
BallokiLow Flow57.56
High-Flow Pulse21.45
Small Flood10.03
Extreme Low Flow10
Large Flood0.95
SuleimankiLow Flow57.51
High-Flow Pulse22.03
Extreme Low Flow10
Small Flood8.89
Large Flood1.57
KotriExtreme Low Flow49.63
Low Flow25.38
High-Flow Pulse11.86
Small Flood10.72
Large Flood2.41
Table 2. Average inflows and outflows from the Indus Basin during 1976–2015 for Kharif, Rabi, and annual scales.
Kharif
(1976–2000)
MAF
Rabi (1976–2000)
MAF
Annual (1976–2000)
MAF
Kharif (2000–2015)
MAF
Rabi (2000–2015)
MAF
Annual (2000–2015)
MAF
Kharif (1976–2015)
MAF
Rabi (1976–2015)
MAF
Annual (1976–2015)
MAF
Western Rivers Inflow119.126.04145.14105.1323.43128.56113.1124.91138.03
Eastern Rivers Inflow7.141.939.072.150.652.84.991.386.38
Total Inflow126.2427.97154.2107.2824.08131.36118.1126.3144.41
Downstream Kotri36.922.4839.413.450.6514.126.851.6928.55
Required Downstream Kotri8.68.68.68.68.68.68.68.68.6
Disclaimer/Publisher’s Note: The statements, opinions and data contained in all publications are solely those of the individual author(s) and contributor(s) and not of MDPI and/or the editor(s). MDPI and/or the editor(s) disclaim responsibility for any injury to people or property resulting from any ideas, methods, instructions or products referred to in the content.

