Article

A Numerical Study on the Pullback Process of a Submarine Cable Based on Trenchless Directional Drilling Technology

1
Zhoushan Power Supply Company, State Grid Zhejiang Electric Power Co., Ltd., Zhoushan 316000, China
2
Shandong Provincial Key Laboratory of Ocean Engineering, Ocean University of China, Qingdao 266100, China
*
Author to whom correspondence should be addressed.
Water 2025, 17(10), 1517; https://doi.org/10.3390/w17101517 (registering DOI)
Submission received: 27 March 2025 / Revised: 14 May 2025 / Accepted: 15 May 2025 / Published: 17 May 2025
(This article belongs to the Special Issue Coastal Engineering and Fluid–Structure Interactions)

Abstract

:
Horizontal directional drilling (HDD) can be utilized in a submarine cable landing operation to solve the problems of a deficient buried depth and a limited route. In this study, a numerical model of the pullback process of a submarine cable using HDD technology is established based on the commercial finite element method platform OrcaFlex 11.3, which is validated using the in situ measured data of an HDD operation project for a pipeline. The effects of the crossing length, incident angle, and pullback velocity of the cable on the effective tension in the cable are investigated and analyzed. The results indicate that an increase in the crossing length and incident angle can significantly enhance the tension in the cable. Under the specific conditions in the Zhoushan islands, the maximum crossing length and incident angle are 1700 m and 35°, respectively. The pullback velocity has a minor influence on the tension in the cable, and an extremely large velocity might lock the cable during its pullback operation. The permissible values derived in this study can provide valuable information to similar engineering cases and projects.

1. Introduction

During the landing processes of submarine cable laying constructions, the traditional methodology is to trench the underwater groove on the seabed, locate the cable routing, release the supporting floaters, and bury the cable in the groove [1,2]. The contradictions between the increased construction volume during cable laying and the space limitations at the landing points have recently become more significant [3]. The cable landing route plan and construction are more difficult because space resources are becoming more limited, and the ecological conservation redline proposes more requirements [4]. On the other hand, the trenching construction and protection methodology during cable landing always causes an insufficient burying depth and inadequate protection, resulting in the exposure of buried cables on the shoaling beach [5,6,7]. In addition, submarine cables are always damaged by external impacts, such as ship anchors, in shallow water [8,9]. Therefore, the landing section has been the weak point of the entire submarine cable.
Horizontal directional drilling (HDD) is a popular non-trenching methodology for cable laying, which can drill and expand the pipeline following the planned route, connect the drawing head at the endpoint, and drag the cable to the starting point to accomplish the cable laying [10]. Compared to the traditional trenching methodology, HDD has significant advantages, including fewer environmental impacts [11], a large construction range, good adaptability, and a sufficient burying depth and length [12,13]. HDD has been employed in different projects, such as the pipeline landing construction project in Yacheng [14], the pipeline landing project in the South China Sea [15], the cable landing project in San Nicolas Island in California [16], and the cable landing project in Biscayne Bay [17].
During the landing process, the submarine cables can be affected by many factors, resulting in different varying trends of the cable profile and tension distribution. These trends might cause the drags to exceed the permissible stress and possible mechanical damage, which will affect the serviceability of the cable [18]. Yoshizawa and Yabuta studied the cable variation during the laying process [19] and found that the bottom tension of the cable was determined mainly by the laying vessel and the water depth. The bottom tension increases as the water depth decreases and the vessel speed increases. Nagatomi et al. used the concentrated mass method to calculate the motion and force of the submarine cable and compared the computational results with the on-site measuring data [20]. Prpić-Oršić and Nabergoj reported a numerical model for predicting the motion and tension of the cable during the laying process under rough sea conditions [21] and found that significant tension variations could be observed at the deployment point under the conditions of higher wave frequencies, heavier cables, and deeper waters. Zhang and Hu proposed that the tension should be the control variable during the laying operation of the submarine cable [22].
Yang et al. investigated tensions in the cable during the laying operation and found that the tension varies linearly with the water depth and reaches its peak at the laying wheel point [23]. Feng et al. established a three-dimensional (3D) finite element method (FEM) cable model and studied the dynamic properties of the submarine cable under the wave impacts [24]. Zhang et al. simplified the submarine cable and employed a lumped mass method to analyze the dynamic characteristics of the cable during its laying process, validated using experimental data [25]. Chang et al. conducted numerical simulations on the dynamic responses of a submarine cable under coupled tensile, torsional, and compressive loads and found that coupled loads acting on the cable could be reduced to 40% of the total when the water depth was greater than 4000 m [26]. Sun et al. reported that the moving velocity of the cable-laying vessel, the releasing velocity of the cable, and the cross-sectional diameter of the cable significantly influenced the tension distributions in the cable [27]. Okkerstrøm established a numerical model using the commercial software OrcaFlex based on the finite element method and found that the cable weight had a significant effect on the peak tension, which should be considered during the design of the cable armor [28]. Kuang et al. studied the influences of the cable length, current velocity, incident waves, and wind direction on the tensions in a cable during the laying process and reported that the floating cable with floaters for smaller lengths could be considered a mooring line for the vessel, which could significantly enhance the tension in the cable [29]. Shen et al. analyzed the effects of the burial depth on the tension in a submarine cable [30]. The results indicated that the peak tension in the submarine cable, appearing at the laying wheel point of the cable-laying vessel, increases linearly with an increase in the burial depth. Peres et al. analyzed the influences of the cable mass, laying length, and environmental conditions on the kinematic and dynamic responses of a submarine cable and found that the cable mass plays a dominant role [31]. In addition, a strong correlation between the chute vertical downward velocity and compression on the touchdown point can be observed.
For HDD applications in cable installation, Li et al. proposed that the trade-off between the friction resistance and allowable traction force remains a key constraint in long-distance laying [32]. Khasanov et al. reported a modified calculation method to analyze the tension in the pipeline during HDD operations and enhanced the calculation precision for practical applications [33]. Faghih et al. found the height variation of the downhole has significant influences on the stress and strain in the pipeline by analyzing the field-measured tensions in the pipeline during HDD operation [34]. Guo and Liang numerically investigated cable tension dynamics during pullback operations [35], identifying linear tension variation patterns along the curved borehole trajectory and peak tension occurrences during the final pullback phases. Based on the domestic codes and previous engineering cases, Tang et al. systematically evaluated cable pull force safety parameters through regulatory compliance analysis and empirical case studies [36], demonstrating that an enhanced conductor cross-sectional area correlates with elevated safety factors under equivalent weight conditions. Utilizing ANSYS Workbench simulations, Vasilescu and Dinu conducted a parametric analysis of pipeline pullback mechanics [37], establishing a parametric sensitivity hierarchy (descending order) for pipeline stress: diameter, wall thickness, internal pressure, drilling fluid density, and burial depth. Through multi-phase analysis of stepped borehole crossing projects, Liang et al. characterized tension evolution patterns during various installation stages, subsequently refining the computational model for the HDD pullback force [38]. Zheng numerically examined force distributions in HDD pipelines using field monitoring data, verifying an inverse proportionality between the bend section tensions and curvature radii [39].
The literature review indicates that previous studies predominantly concentrated on cable tension mechanics and cable–vessel interactions in conventional laying configurations. For HDD-assisted cable installations, the existing findings primarily stem from analytical and numerical approaches assuming elevation parity between pullback termini. In contrast, HDD-enabled submarine cable landing operations involve complicated engineering challenges during extended pullback processes with significant elevation differentials, including pull force optimization, cable–pipe friction management, and tension distribution across variable curved segments. These operational complexities underscore persistent challenges in ensuring cable integrity during pipeline transitions. This study employed a representative Chinese HDD case study to establish numerical simulation parameters for cable pullback dynamics with particular emphasis on tension fluctuations at critical connection nodes. A comparative analysis of the curvature gradients, crossing distances, and pullback velocities against submarine cable specifications provides a systematic evaluation of the tension development mechanisms, delivering crucial insights for engineering design optimization.

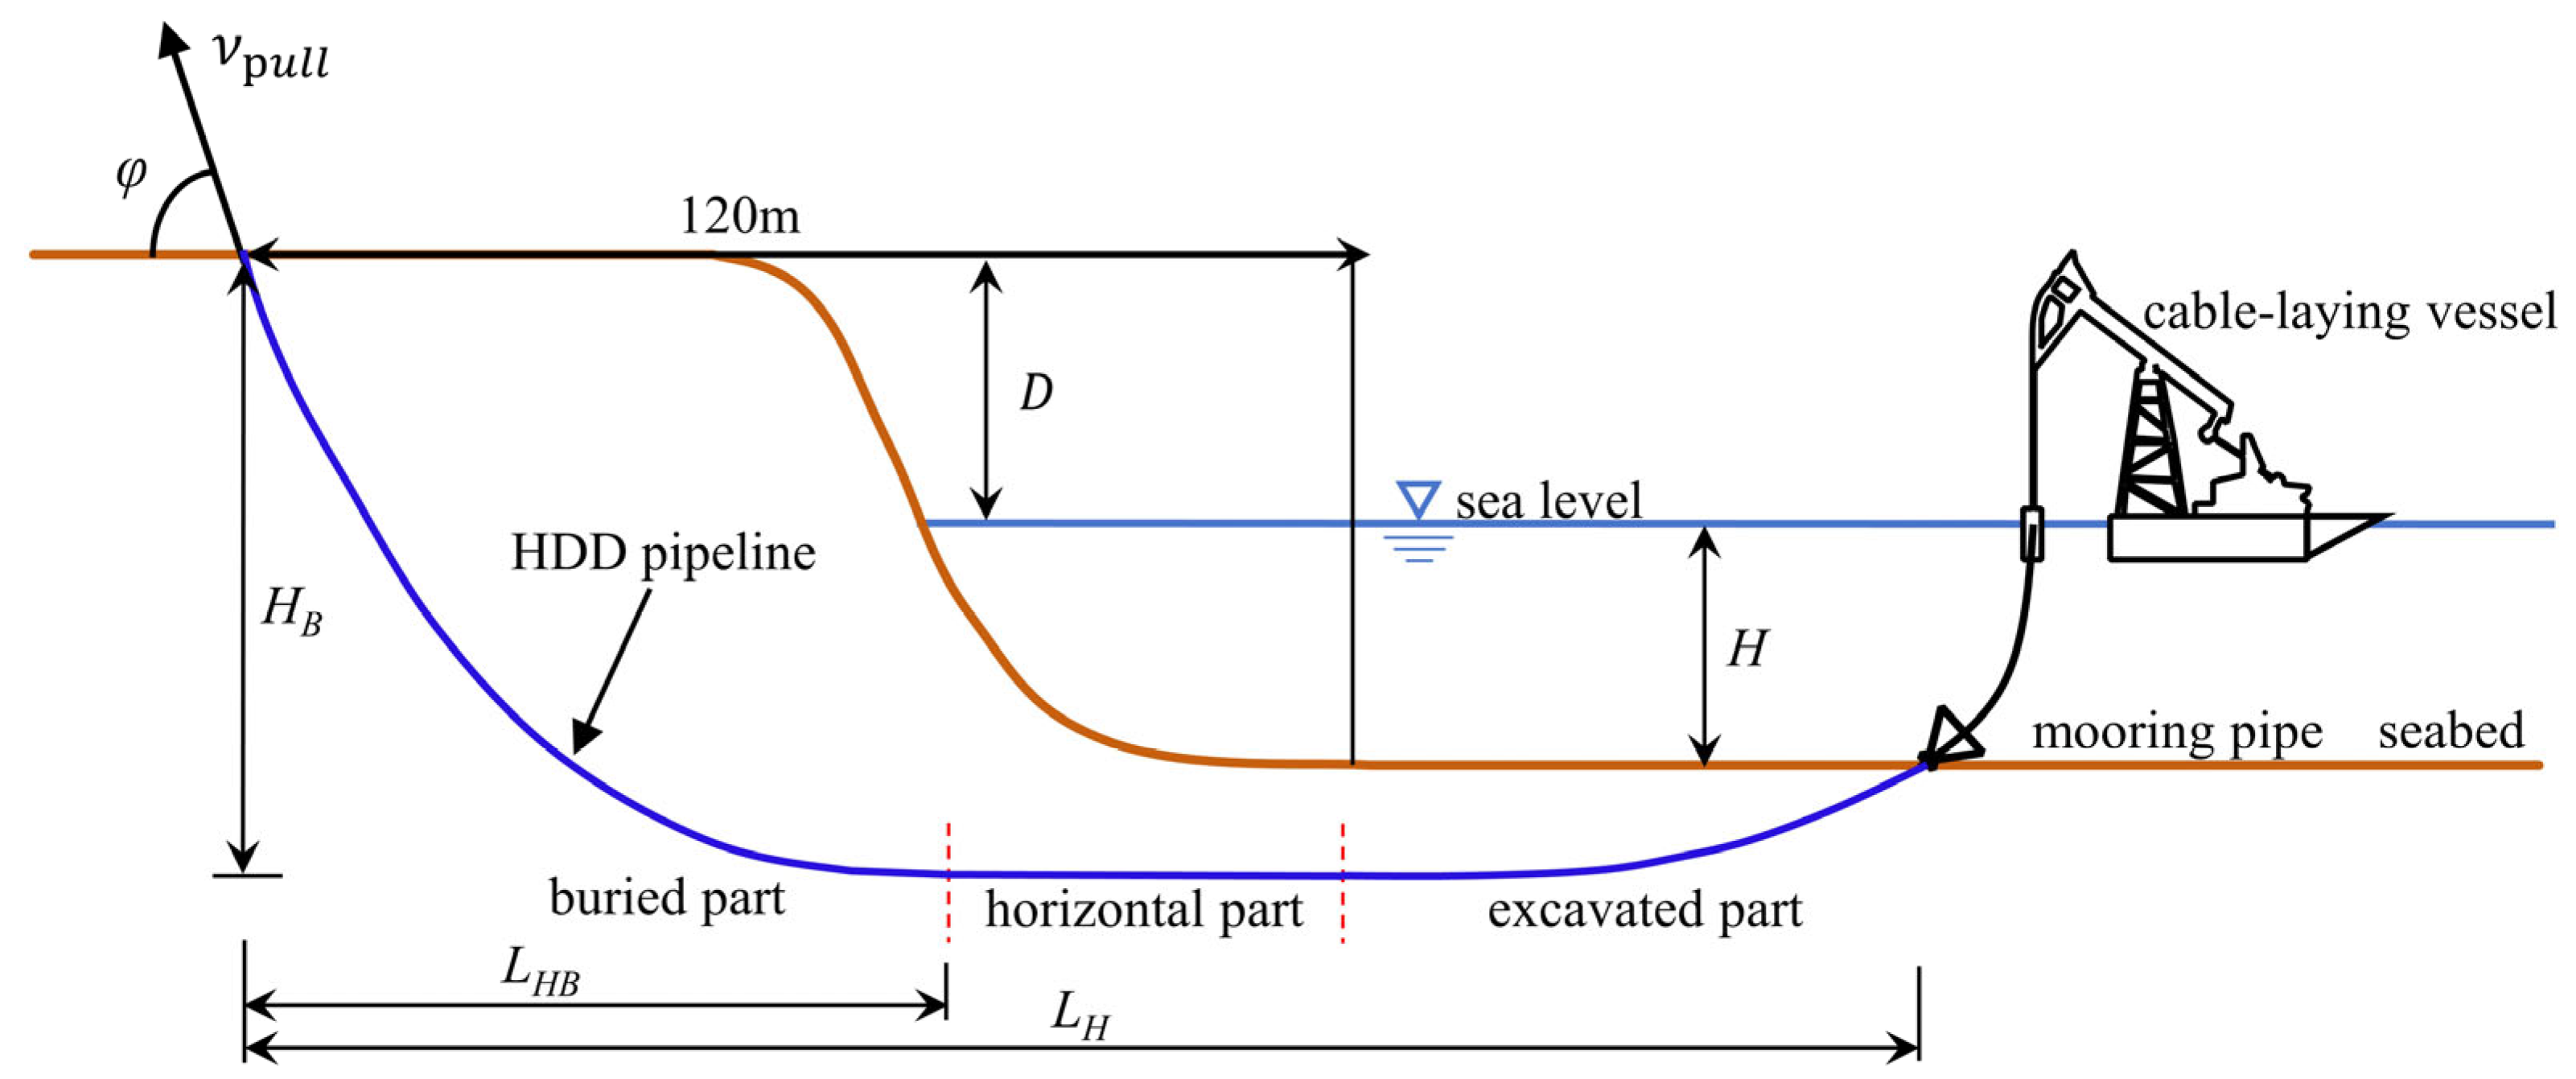
2. Problem Description

This investigation derives from an actual offshore construction project implemented in the Zhoushan Archipelago, Zhejiang, China. The submarine cable installation was completed using HDD methodology. The pullback operation of the cable through the HDD pipeline is depicted in Figure 1. The analysis presumes that the HDD pipeline was successfully constructed for submarine cable landing, with its geometric configuration remaining unchanged. The entry point was situated onshore at 120.0 m from the initiation point of the pipeline horizontal segment, elevated 10.0 m above the mean water level. The seabed topography exhibited a planar configuration with a constant water depth of 10.0 m. The horizontal span between the entry and exit points is designated as LH, termed the crossing length. The vertical elevation and horizontal span of the burial pipeline segment are defined as HB and LHB, respectively. The entry angle of the pipeline at the terrestrial interface is denoted by φ.
The guidance wire entered the pre-drilled pipeline from the entry point, traversed the pipeline, and emerged at the exit point for integration with the cable through a dedicated coupling mechanism. The synchronized retrieval of both the guidance wire and cable maintained a constant velocity throughout the pipeline. During initial deployment, the cable-laying vessel dispensed the cable via the sheave assembly at a velocity marginally exceeding the pulling velocity νpull, ensuring the controlled accumulation of cable slack beyond the exit point. In subsequent phases, the dispensing rate achieved parity with the pulling velocity. The ambient hydrodynamic conditions in the operational zone exhibited minimal wave–current activity, exerting negligible influence on the cable installation. Given sufficient residual cable length beyond the exit point, vessel maneuvering dynamics also demonstrated an insignificant impact on the traction process. Consequently, this study excluded analytical consideration of environmental hydrodynamic forces and vessel operational kinematics.
The submarine transmission line implemented in this investigation constitutes a standard tri-axial optoelectronic composite cable, with material specifications as systematically tabulated in Table 1. The predominant materials for protective conduit systems comprise seamless steel tubing and high-density polyethylene (HDPE). Steel conduits exhibit superior structural rigidity and deep-water operational capability, albeit necessitating advanced welding methodologies. HDPE systems provide enhanced hermetic sealing and corrosion resilience, combined with cost-efficient installation and accelerated project timelines. Notable constraints of HDPE include the reduced tensile capacity and compromised load-bearing stability. Following cost–benefit analysis, the HDPE configuration was selected as the optimal solution. The material characteristics compliant with the domestic national code are comprehensively detailed in Table 2 [40].

3. Numerical Model

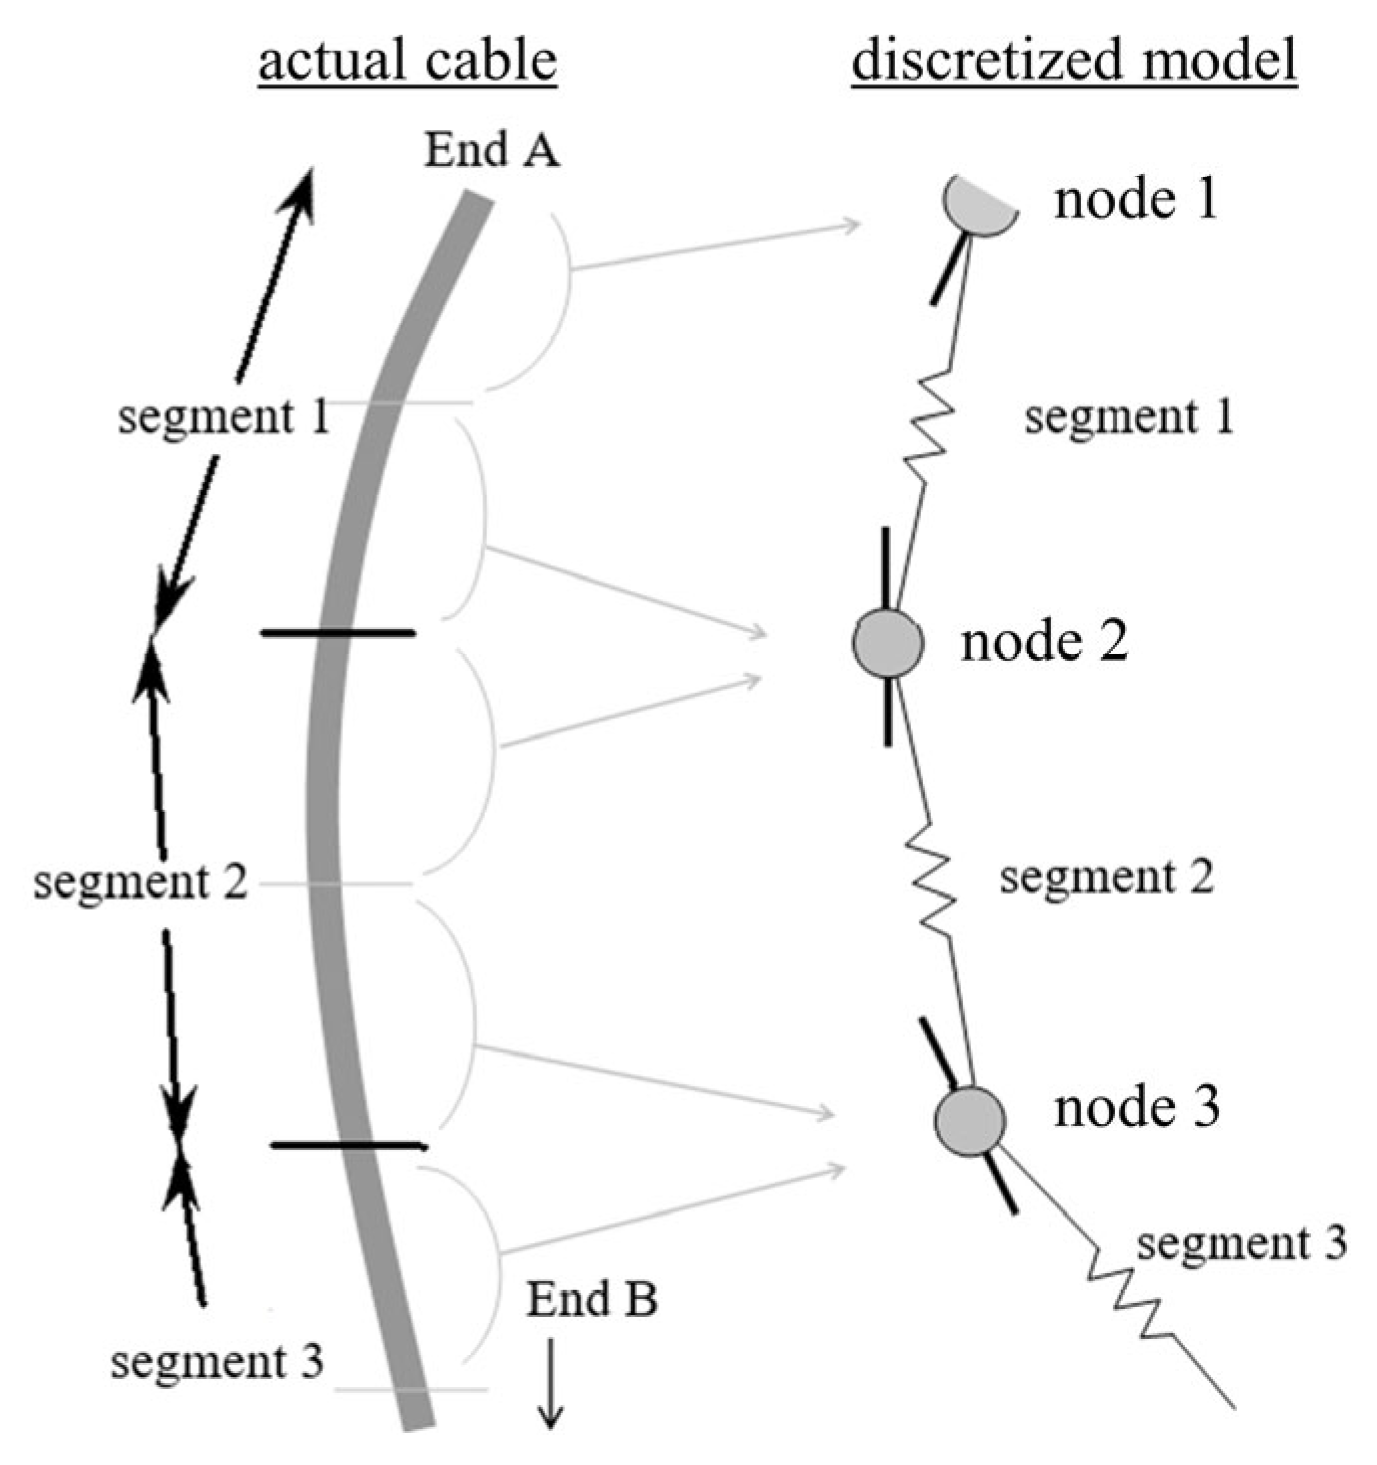
3.1. Fundamental Theory of FEM Cable Modeling

The frictional force computation in the numerical model was systematically formulated using the modified Coulomb friction model [41], as graphically represented in Figure 2. A comparative analysis, as shown in Figure 2a, reveals that the standard Coulomb friction model exhibits discontinuity in friction transition, whereas the modified formulation, shown in Figure 2b, demonstrates a linear friction variation from −μR to +μR within the critical displacement range [–Dcrit, +Dcrit]. The critical displacement threshold Dcrit is mathematically expressed as follows:
D crit = μ R k s a ,
where μ denotes the friction coefficient and R the normal contact force; ks and a correspond to the shear strength and contact surface area, respectively.
In the finite element formulation, the submarine cable is discretized into a series of massless linear elements, as schematically illustrated in Figure 3. Each element configuration comprises dual nodal components at its extremities, with dynamic properties (mass, gravitational force, buoyancy, etc.) lumped at nodal points. This discretization scheme effectively represents the cable as interconnected nodal masses bridged by quasi-static beam segments. The geometric configuration features half-beam segments adjoining each nodal element, with terminal segments positioned at cable extremities. Mechanical connectivity is achieved through coaxial elastic bars integrated with axial damping mechanisms and torsional spring–damper assemblies, thereby enabling comprehensive characterization of the torsional behavior.
Stress distributions across discrete elements require systematic computation to derive the global cable tension. Fundamental kinematic parameters must be preliminarily determined, including the inter-nodal displacement within linear elements, their temporal derivatives, and the orientation unit vector Sz along the inter-nodal axis. The mid-element tensile force manifests as vectorial stress aligned with Sz, quantified by the effective tension Te, mathematically defined as follows:
T e = T w + p 0 a 0 p i a i ,
where p0 and pi denote the external and internal hydrostatic pressures, respectively; a0 and ai represent the external and internal stress-bearing areas, respectively; and Tw signifies the circumferential wall tension. Given the linear axial stiffness characteristics, Tw is formulated as follows:
T w = E A ε 2 ν p 0 a 0 p i a i + k t t τ l 0 + E A c d l d t 1 l 0 ,
where E indicates the effective Young’s modulus and A the cross-sectional area, constituting the axial rigidity EA; l0 denotes the undeformed segment length; ν is the Poisson’s ratio; ktt characterizes the tension–torsion coupling; τ quantifies the segment twist angle (in radians); c embodies the viscous damping coefficient (s); dl/dt signifies the change rate of the length; and ε expresses the total mean axial strain, operationally defined as follows:
ε = l λ l 0 λ l 0 ,
where l corresponds to the instantaneous segment length; λ indicates the expansion factor of the segment.
In addition, the pullback force acting on the cable T is governed by the following:
T = T 1 + W k 0 L
where T is subject to the mechanical constraint: T ≤ min {Fq, Ft}/γ0, where Fq denotes the maximum tensile capacity at the cable termination, Ft the permissible operational stress, and γ0 the safety factor; W represents the volumetric weight; k0 signifies the cable–PE conduit friction coefficient; L indicates the safe pullback distance; and T1 corresponds to the initial pre-tension in the cable. Given the presence of cable redundancy in this study, T1 was excluded from the pullback force computation.

3.2. Numerical Model Setup

The numerical model was established using the commercial FEM software OrcaFlex 11.3. The seabed profile was configured through the Seabed module, with the free sea surface positioned at z = 0.0 m in the global coordinate system. Within this coordinate framework, the onshore terrain and seabed elevation were, respectively, defined at z = +10.0 m and z = −10.0 m. The initial positioning of the model components on the seabed interface employed global coordinates, while the rope assemblies, connectors, and articulated cable system were parameterized using local coordinate systems. The pipeline geometry was specifically defined within the nodal references.
The pipeline system was modeled through the Homogeneous Pipeline Type module, with PE material characteristics implemented via the dimensional parameters (diameter), mass density, and stiffness properties. The Mid-line Connections module incorporates a lumped mass formulation to specify critical physical attributes at discrete pipeline nodes, including spatial coordinates, angular orientation, and arc-length parameters. These definitions collectively characterize the burial depth, curvature profile, and horizontal span, ensuring numerical representation fidelity to actual pipeline behavior. The rope, connector, and cable elements were simulated using the General Line Type module with appropriate diameter specifications, stiffness parameters, and material definitions. Hinged joint elements model the mechanical interaction during cable-pulling operations. The section division and mesh generation were primarily determined by the curved section of the pipeline. The section division should ensure the curved section is as smooth as possible to avoid any penetration and non-physical oscillation during simulation. On the other hand, the straight section can be set as long as possible to accelerate the simulation process. Following the criterion ruled by the OrcaFlex, the straight section length was set at 10.0 m and the curved section length at 5.0 m, ranging from 1/10 to 1/5 of the curvature radius. From the trial simulations, it was found that the present section length setup balanced calculation precision and cost.
For the contact mechanics between the PE pipeline and cable during the pullback phases, the Penetration Contact algorithm within the Line Contact module was implemented. The computational efficiency was optimized by abstracting the soil–pipeline friction and mud viscous resistance into equivalent friction coefficients. The pullback velocity was parameterized through the Payout Rate specification in the Feeding module. A ramp function generator (Apply Ramp module) ensured smooth transition from static equilibrium to dynamic operation, preventing numerical discontinuities during the initial motion phases.

3.3. Numerical Model Validation

The Lanzhou–Zhengzhou–Changsha pipeline crossing project served as an engineering case study to validate the numerical model’s capability in predicting the cable tension during pullback operations [42]. The simulation results of the pipeline forces were benchmarked against field measurements at representative monitoring locations. Key engineering parameters for this validation are documented in Table 3.
Figure 4 presents a comparative analysis between the numerically predicted pullback forces and the field-measured values. The data demonstrate satisfactory agreement between the simulations and measurements, with a maximum deviation of 9.8% observed at monitoring point C. Notably, significant under-prediction occurs at point A near the entry location. This discrepancy primarily stems from the geometric simplifications in the numerical representation: the simulation modeled the pipeline as an idealized Line module directly pulled through the channel, whereas the field conditions involved non-negligible pipe–floor friction from seabed deployment. Despite these simplifications, the developed model successfully replicated the directional drilling channel configurations and achieved reasonable friction prediction accuracy during pullback simulation. This validation confirmed the model’s applicability for simulating submarine cable retrieval operations in HDD channels.

4. Results and Discussion

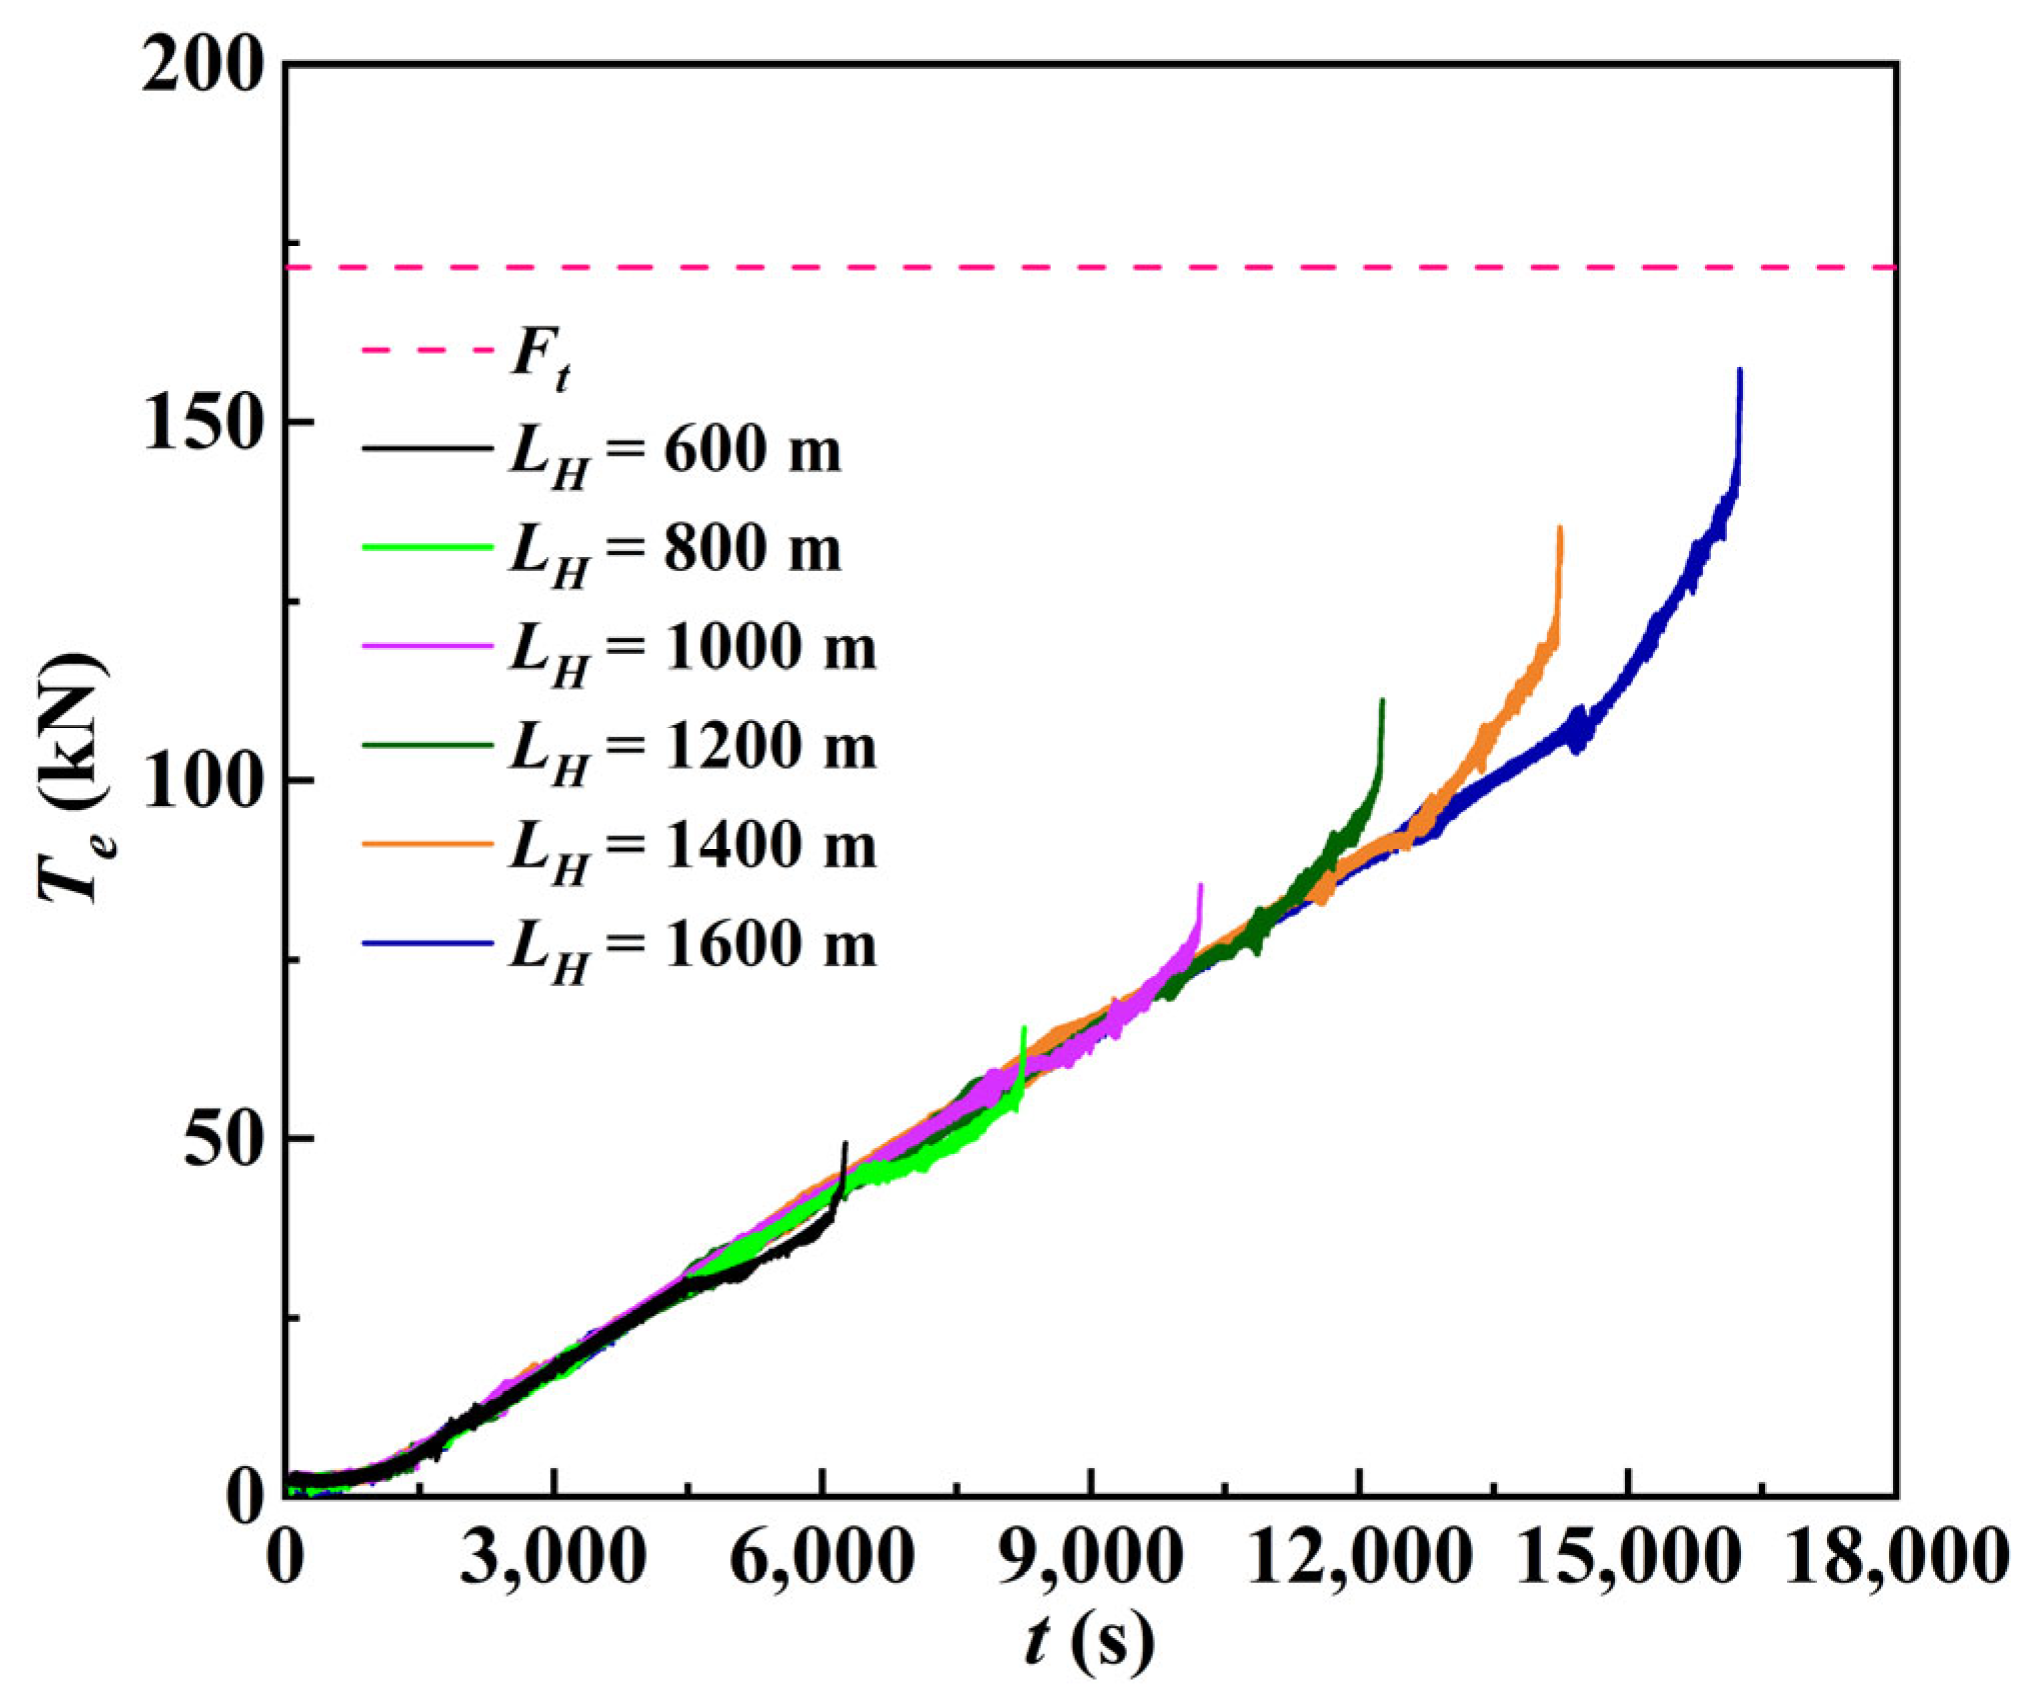
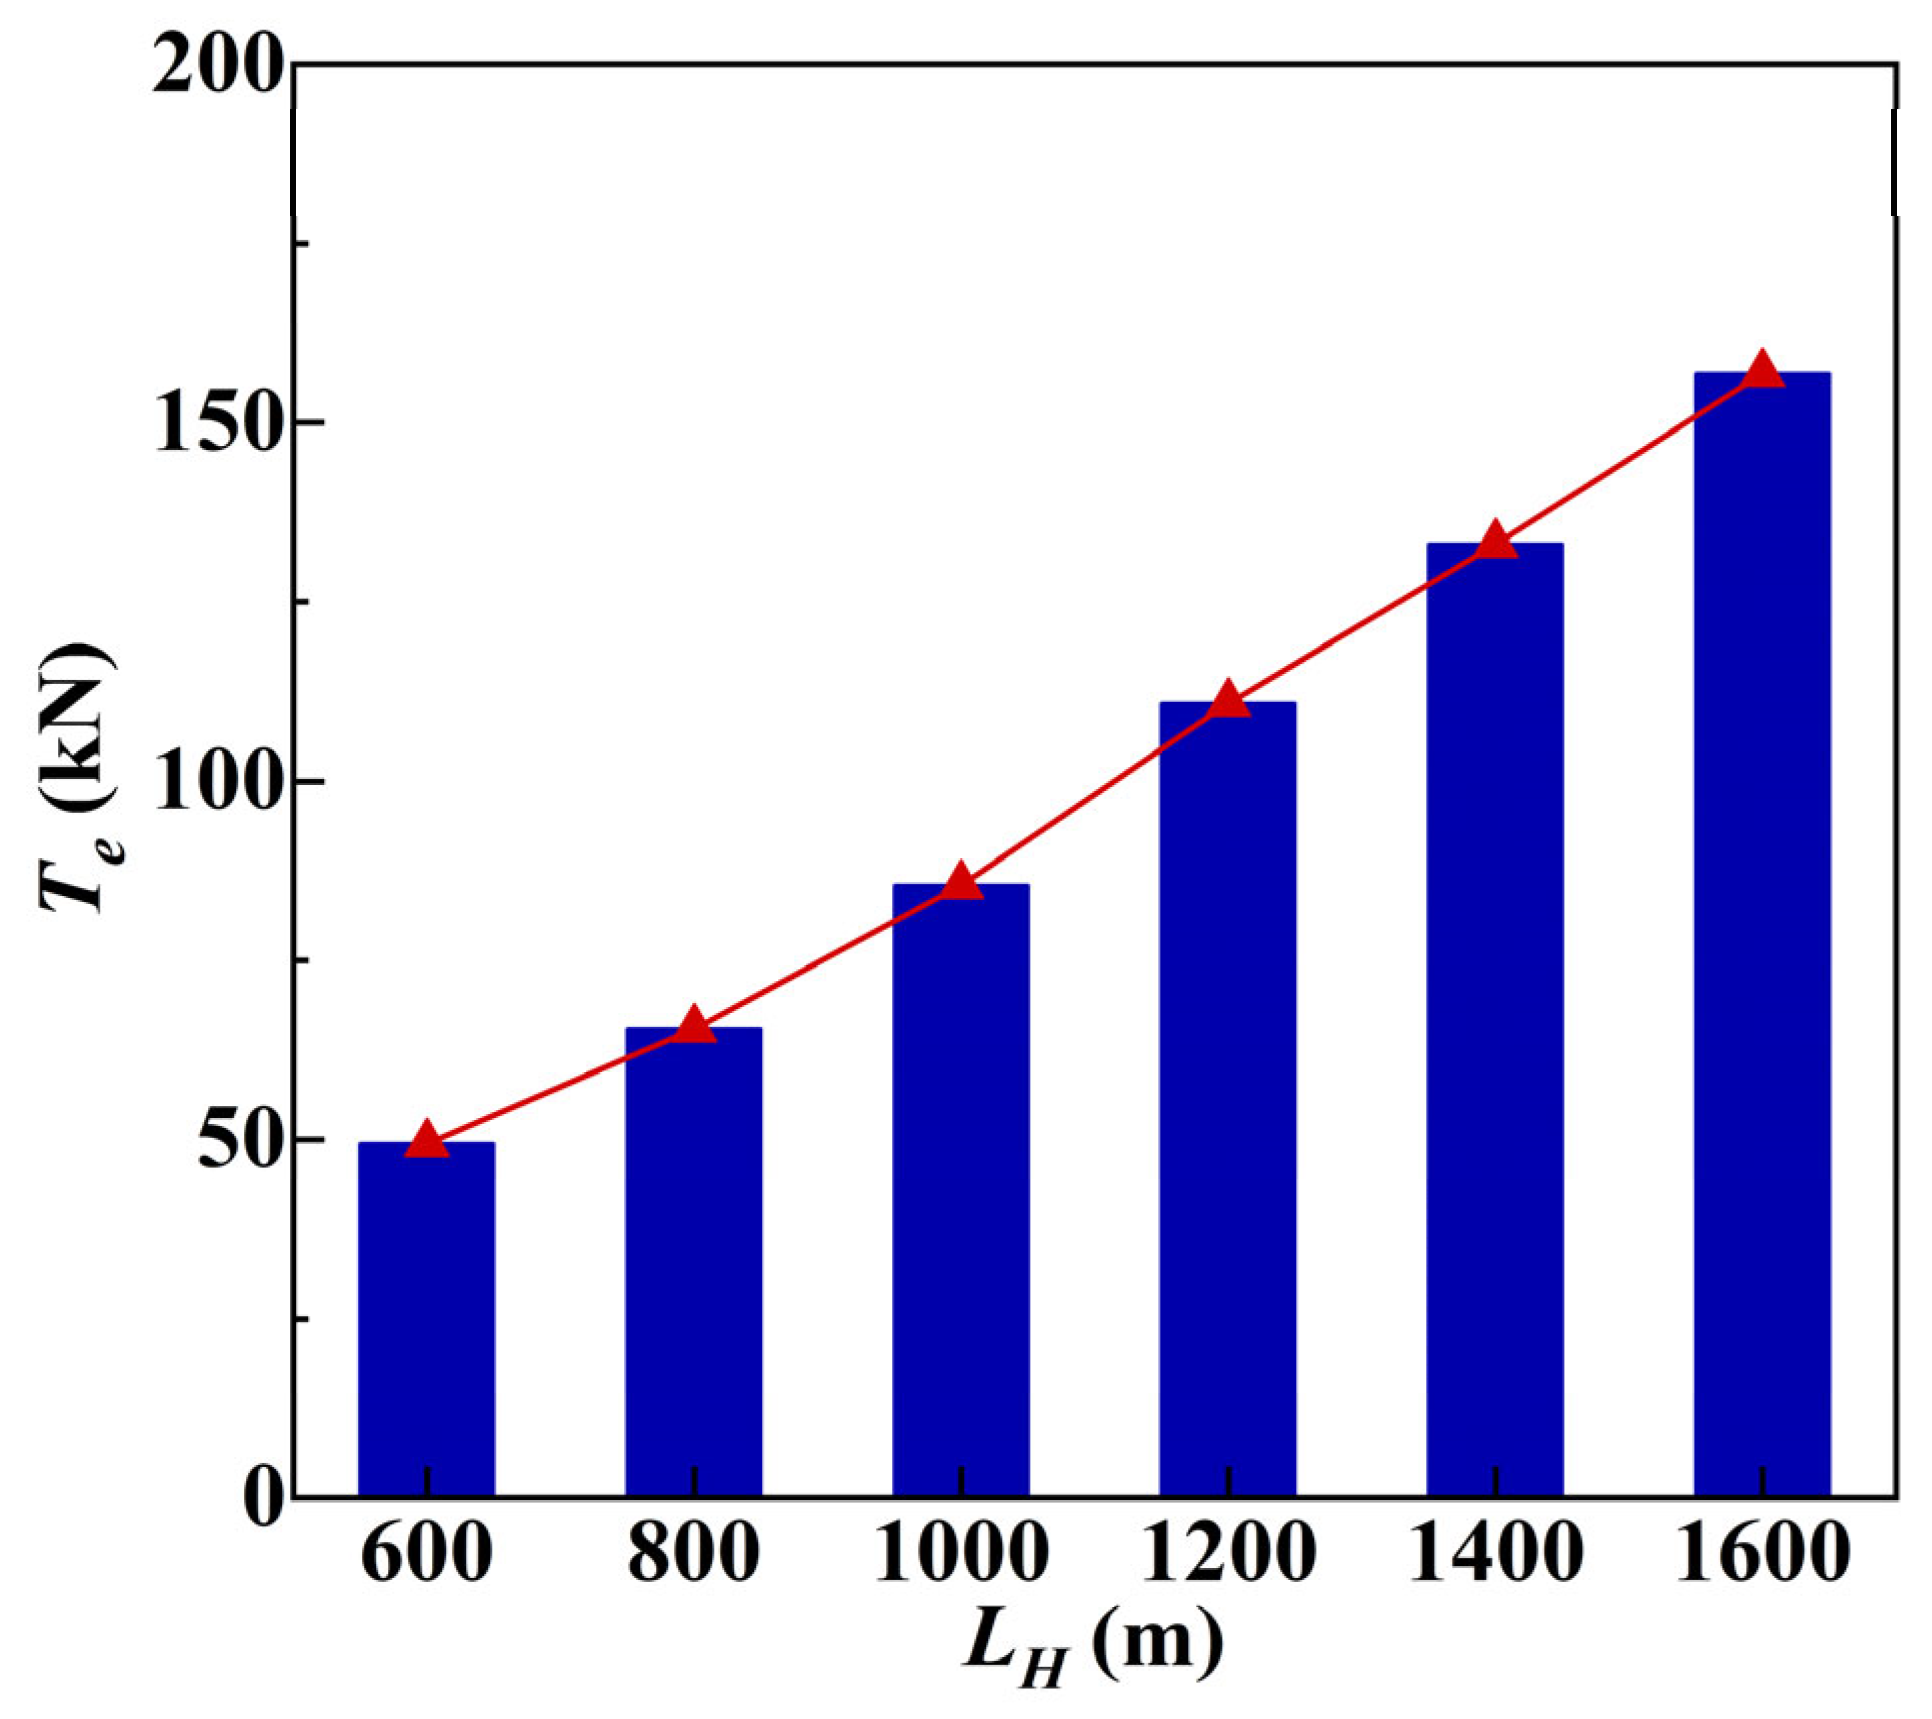
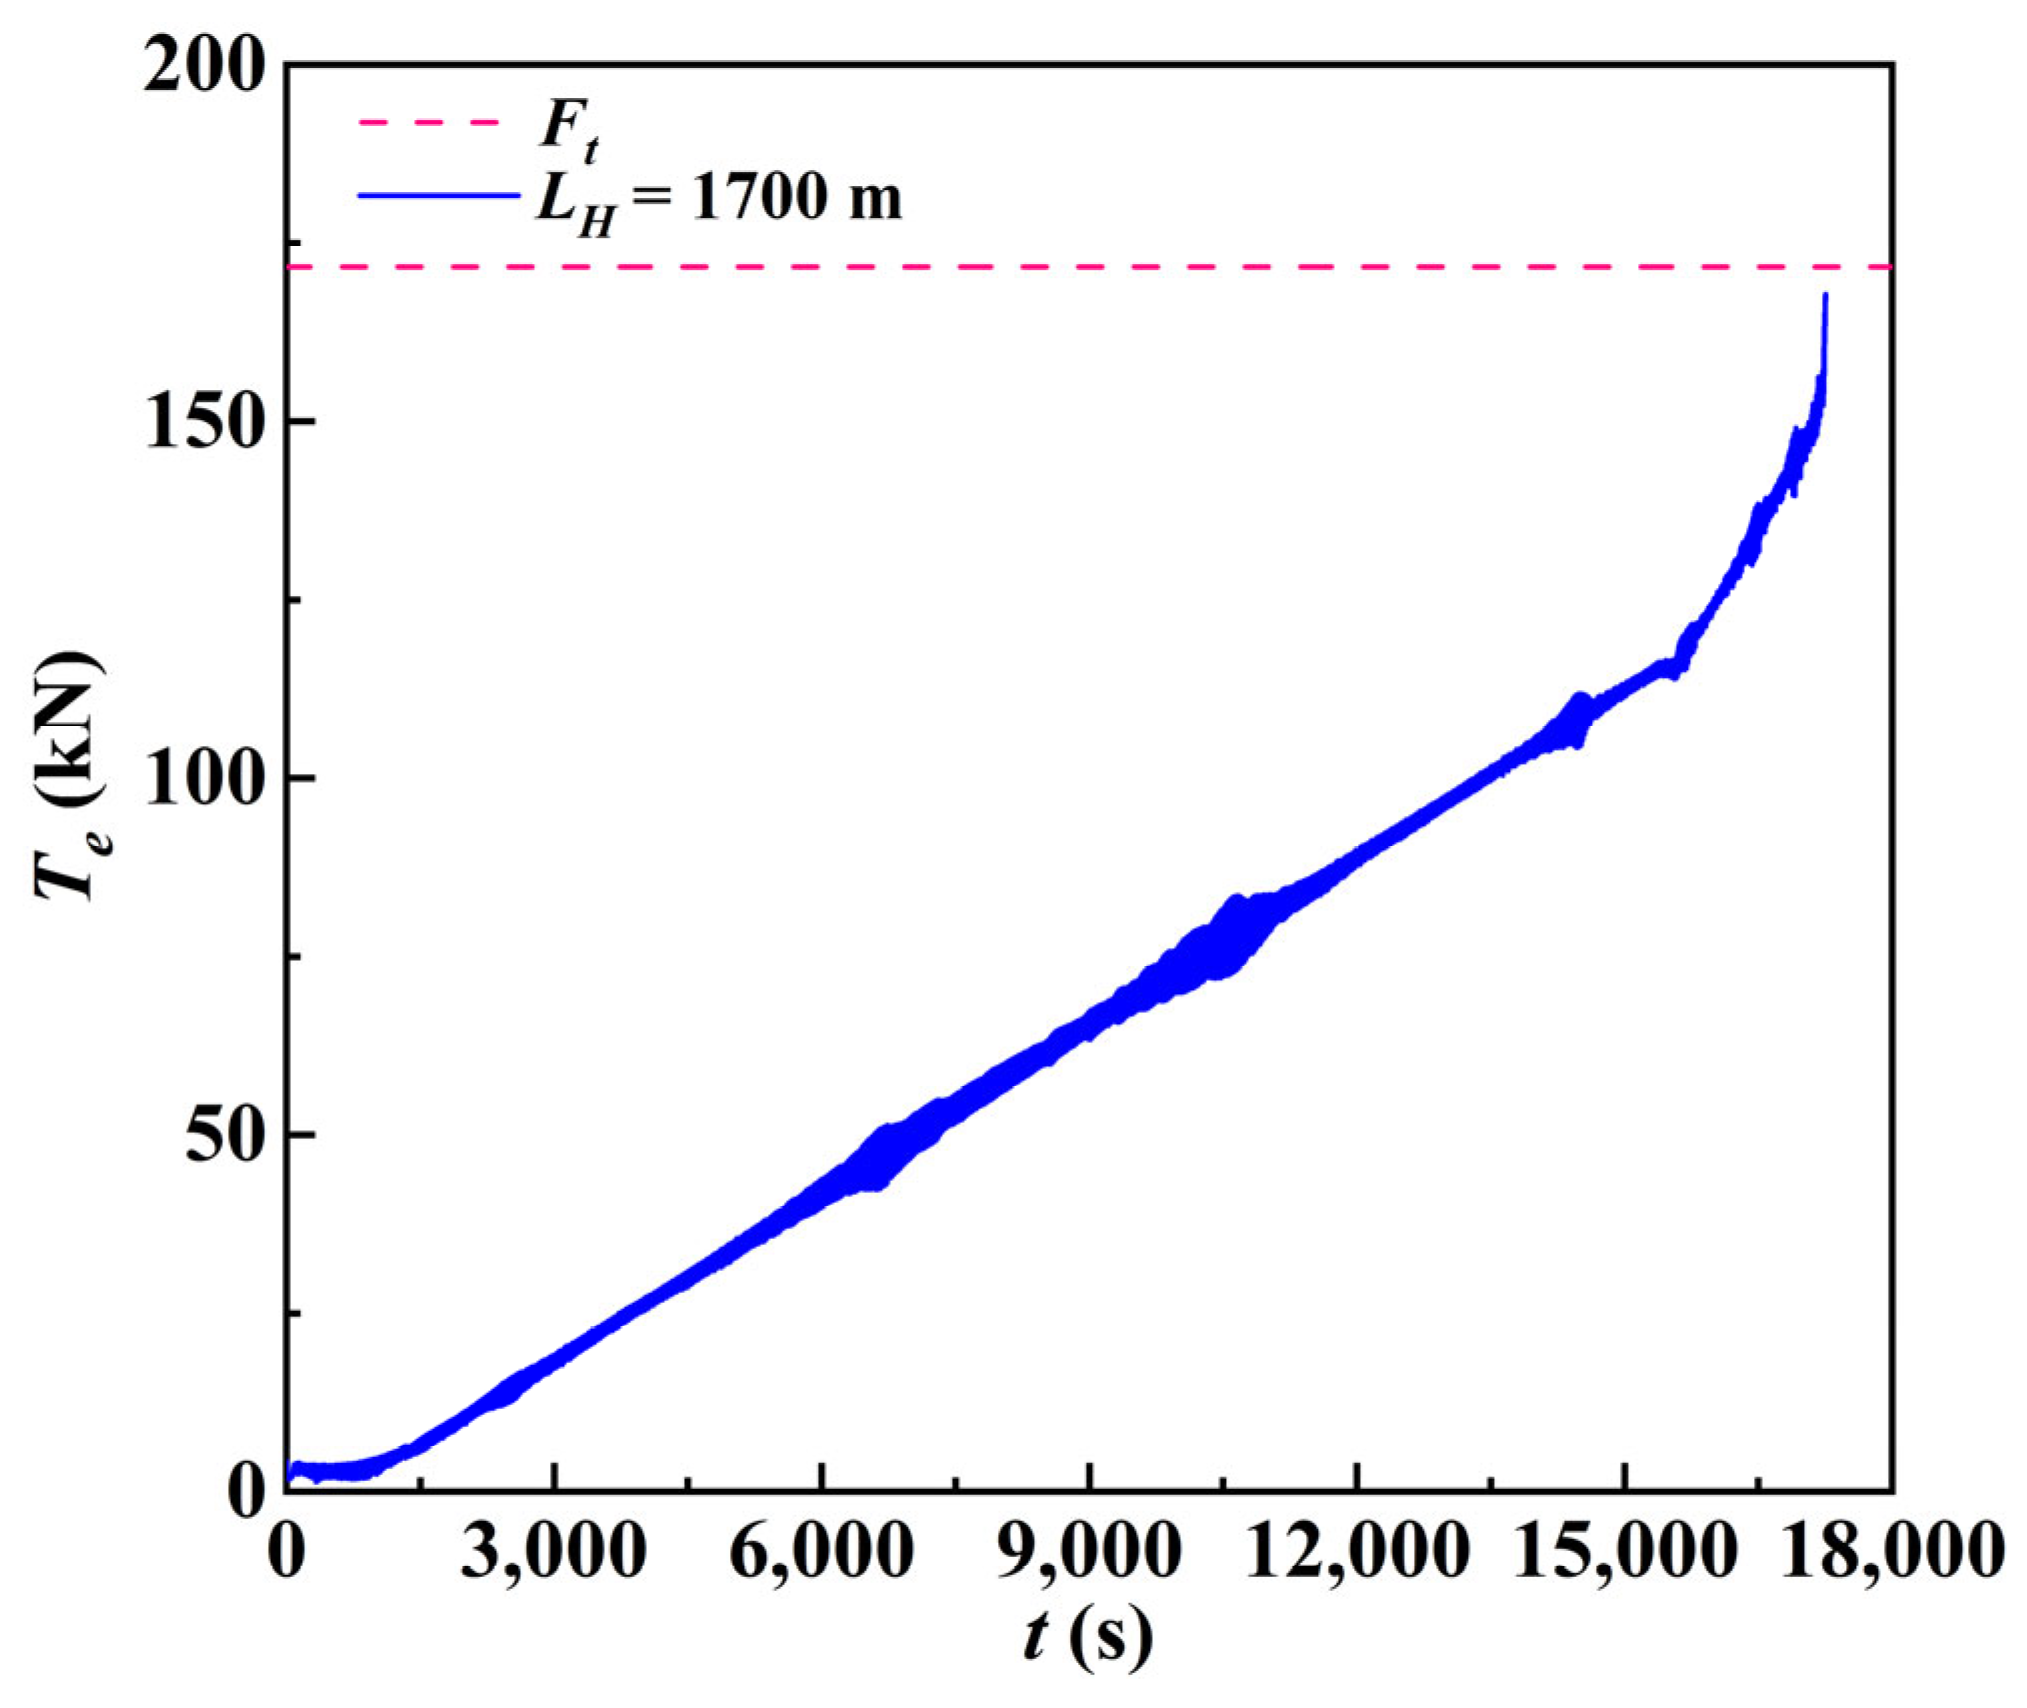
4.1. Effects of the Crossing Length on the Tension in the Cable

During pullback operations, the progressive increase in the crossing length LH extends the contact interface between the cable and pipeline, consequently amplifying the frictional resistance and modulating the tension dynamics. To systematically evaluate this relationship, six LH values (600, 800, 1000, 1200, 1400, and 1600 m) were simulated under fixed parameters: φ = 35° and νpull = 0.1 m/s. Figure 5 presents the temporal evolution of the effective cable tension across varying LH. For any given LH, the pullback tension exhibits a triphasic evolution.
Taking LH = 1600 m as an example, a non-zero tension manifests during the initial stage (0–1000 s) due to pre-existing stress in the semi-submerged cable prior to pipeline entry. This baseline tension undergoes gradual accumulation as the cable transitions from a vessel-deployed suspended configuration to a seabed-contacting relaxed state via the chock, a process accompanied by continuous marine deployment, as shown in Figure 6. The tension increment arises from the geometric reconfiguration during this transitional phase.
During the intermediate stage (1000–14,000 s), the effective tension exhibits linear escalation proportional to the cumulative frictional resistance along the straight pipeline segment, arising from the uniformly distributed sliding contact between the cable and conduit. The terminal phase (>14,000 s) demonstrates accelerated tension amplification attributable to intensified curvature-derived friction, as the cable navigates the ascending bend. Here, enhanced geometric constraints induce circumferential cable–pipe wall interactions governed by material stiffness, superimposing the bending resistance onto the baseline sliding friction. A tensile discontinuity occurs upon extraction completion, reflecting the instantaneous constraint of removal at disengagement. Crucially, passage through the curved segment introduces two supplementary mechanisms: (1) the gravitational alignment effects modify the interfacial pressure distribution under non-planar geometries, and (2) the localized armor-layer deformation induces hysteresis through stiffness-mediated contact with the conduit wall. Engineering analysis confirms that pipeline diameter upscaling reduces the contact stress concentration, effectively mitigating the armor fatigue risks during high-curvature transits. Furthermore, empirical validation reveals a strict linear proportionality between the crossing length and duration (ΔLH =200 m/Δt =2000 s), enabling precise schedule optimization through parametric extrapolation.
Figure 7 illustrates the effective tension versus crossing length. The maximum effective tension demonstrates monotonic escalation with increasing LH, rising from 49.4 kN to 156.8 kN (217% amplification ratio), governed by progressive frictional accumulation between the submarine cable and pipeline during axial pullback. A linear proportionality between the peak tension and LH is established, with an average incremental rate of 21.5 kN of 200 m. This quantized growth coefficient serves as a deterministic parameter for selecting a tension control system and defining the safety margins in an engineering operation.
To evaluate the permissible crossing length under current construction constraints, a supplementary simulation was executed for LH = 1700 m, as shown in Figure 8. The tension evolution mirrors the triphasic profile observed at LH = 1600 m in Figure 5, with a peak effective tension of 169.7 kN, approaching the cable’s permissible threshold. Consequently, the critical crossing length under operational limits was validated as 1700 m, as exceeding this induces closeness to the structural tolerance boundary.

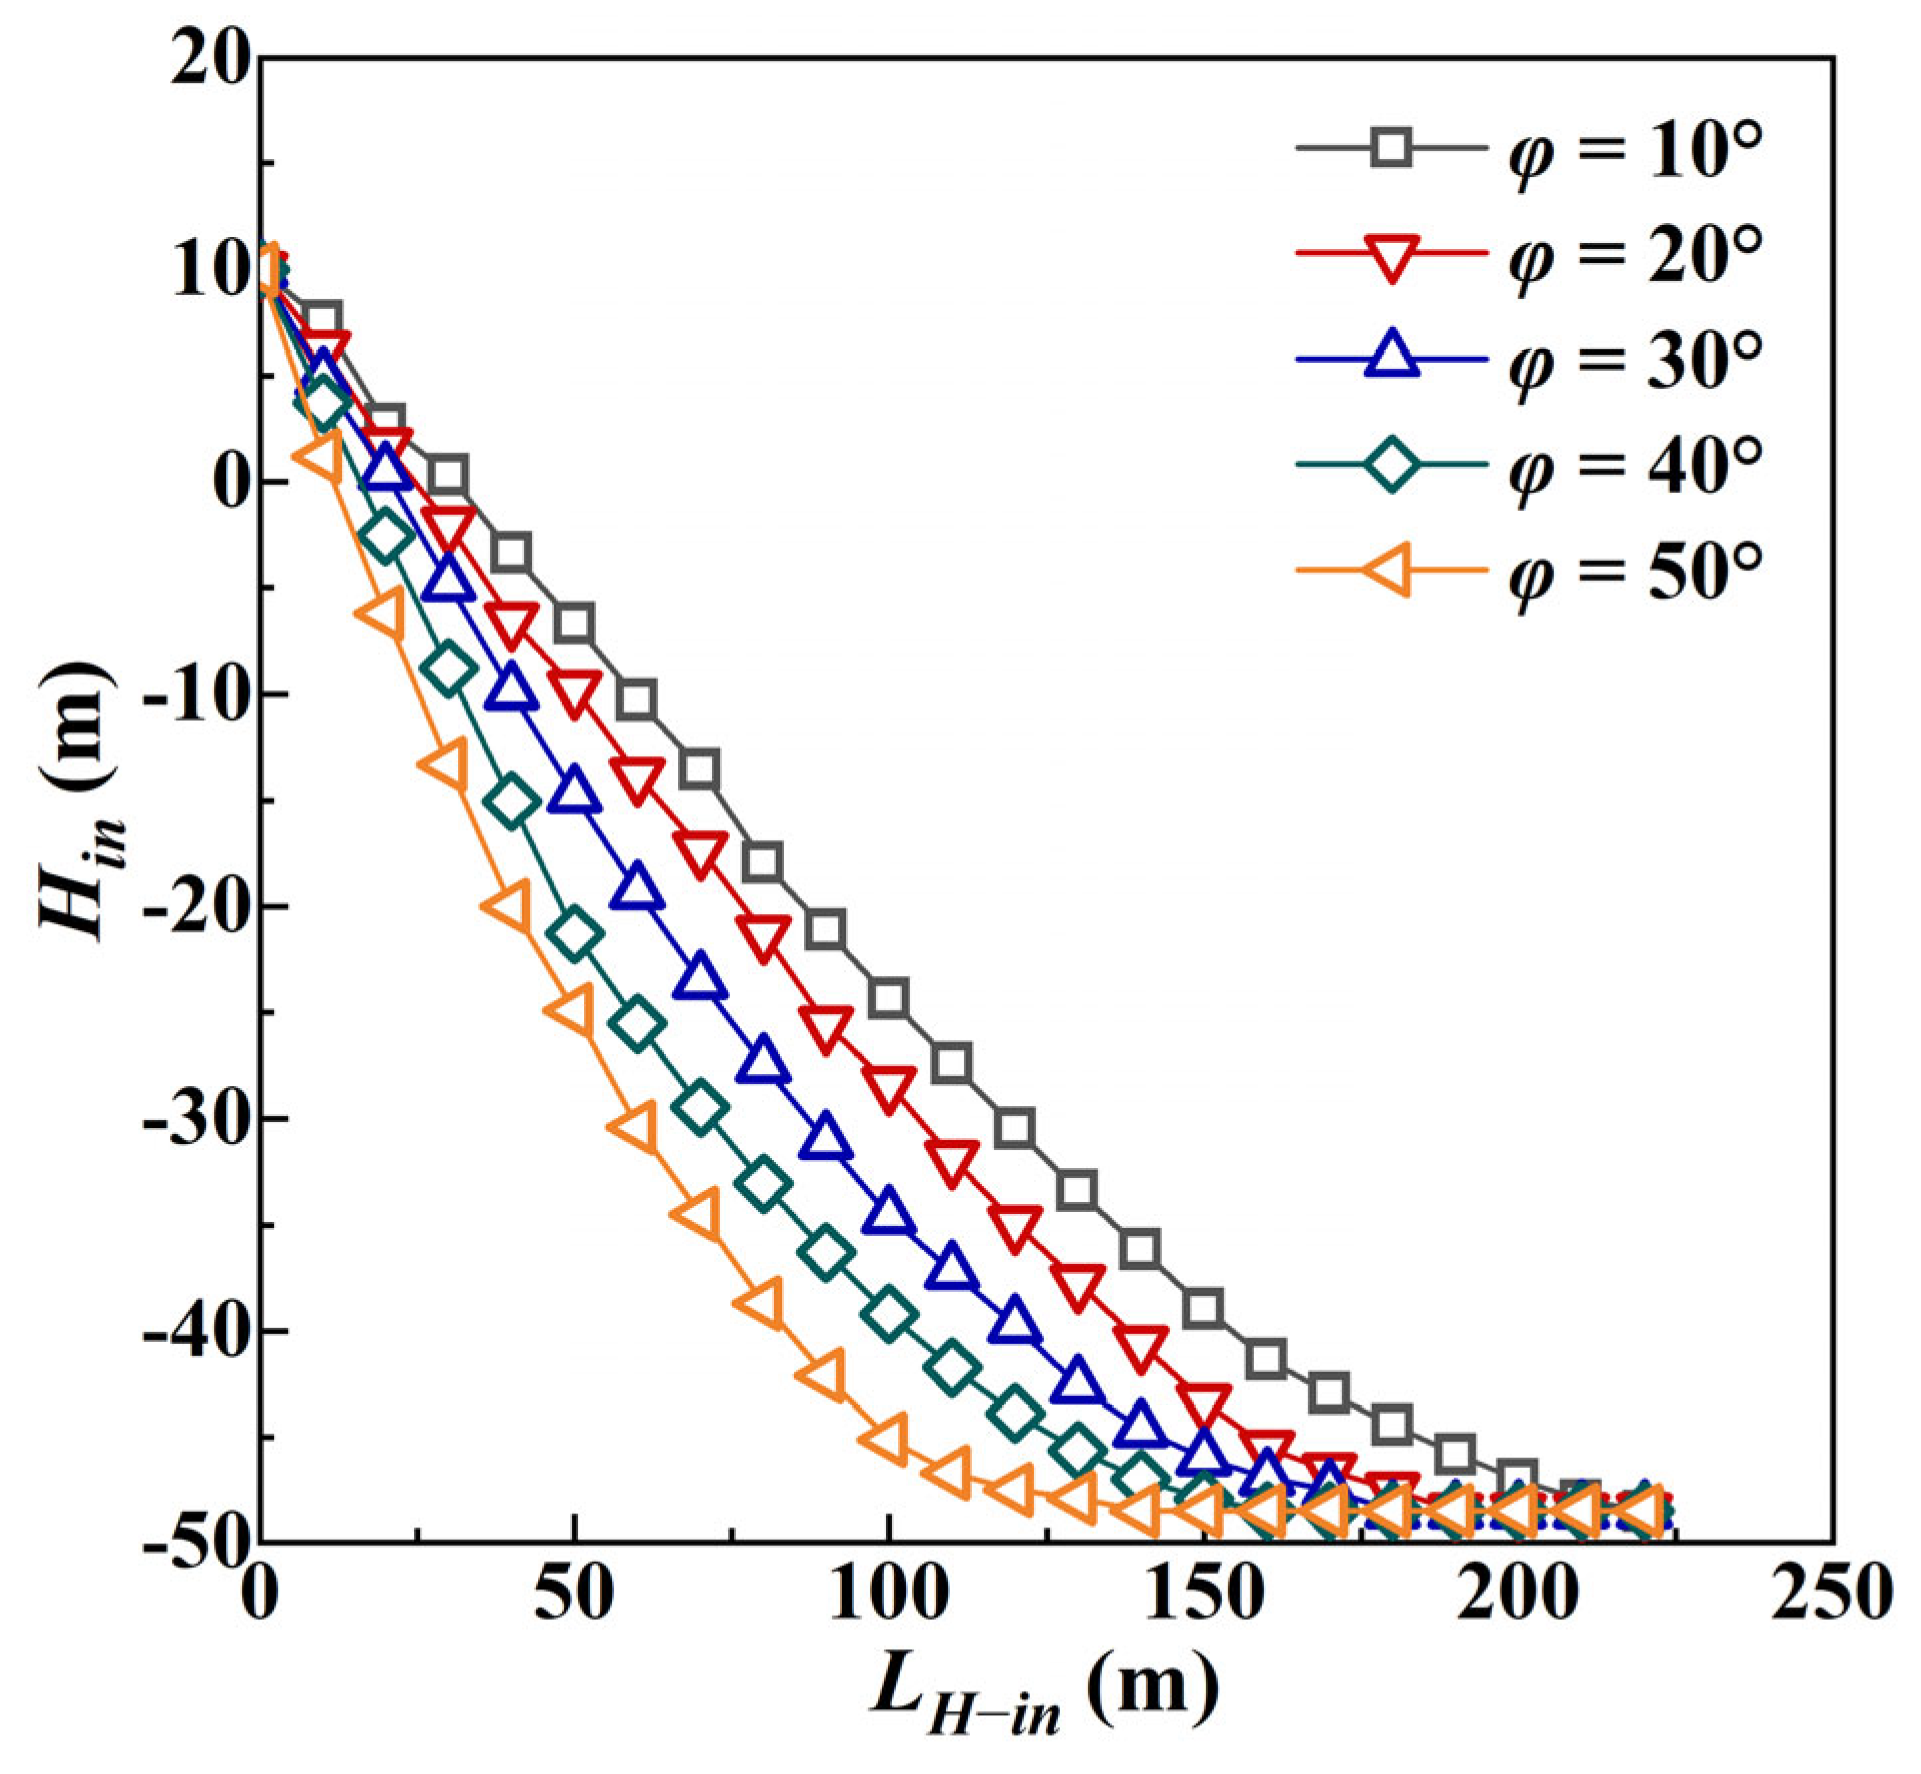
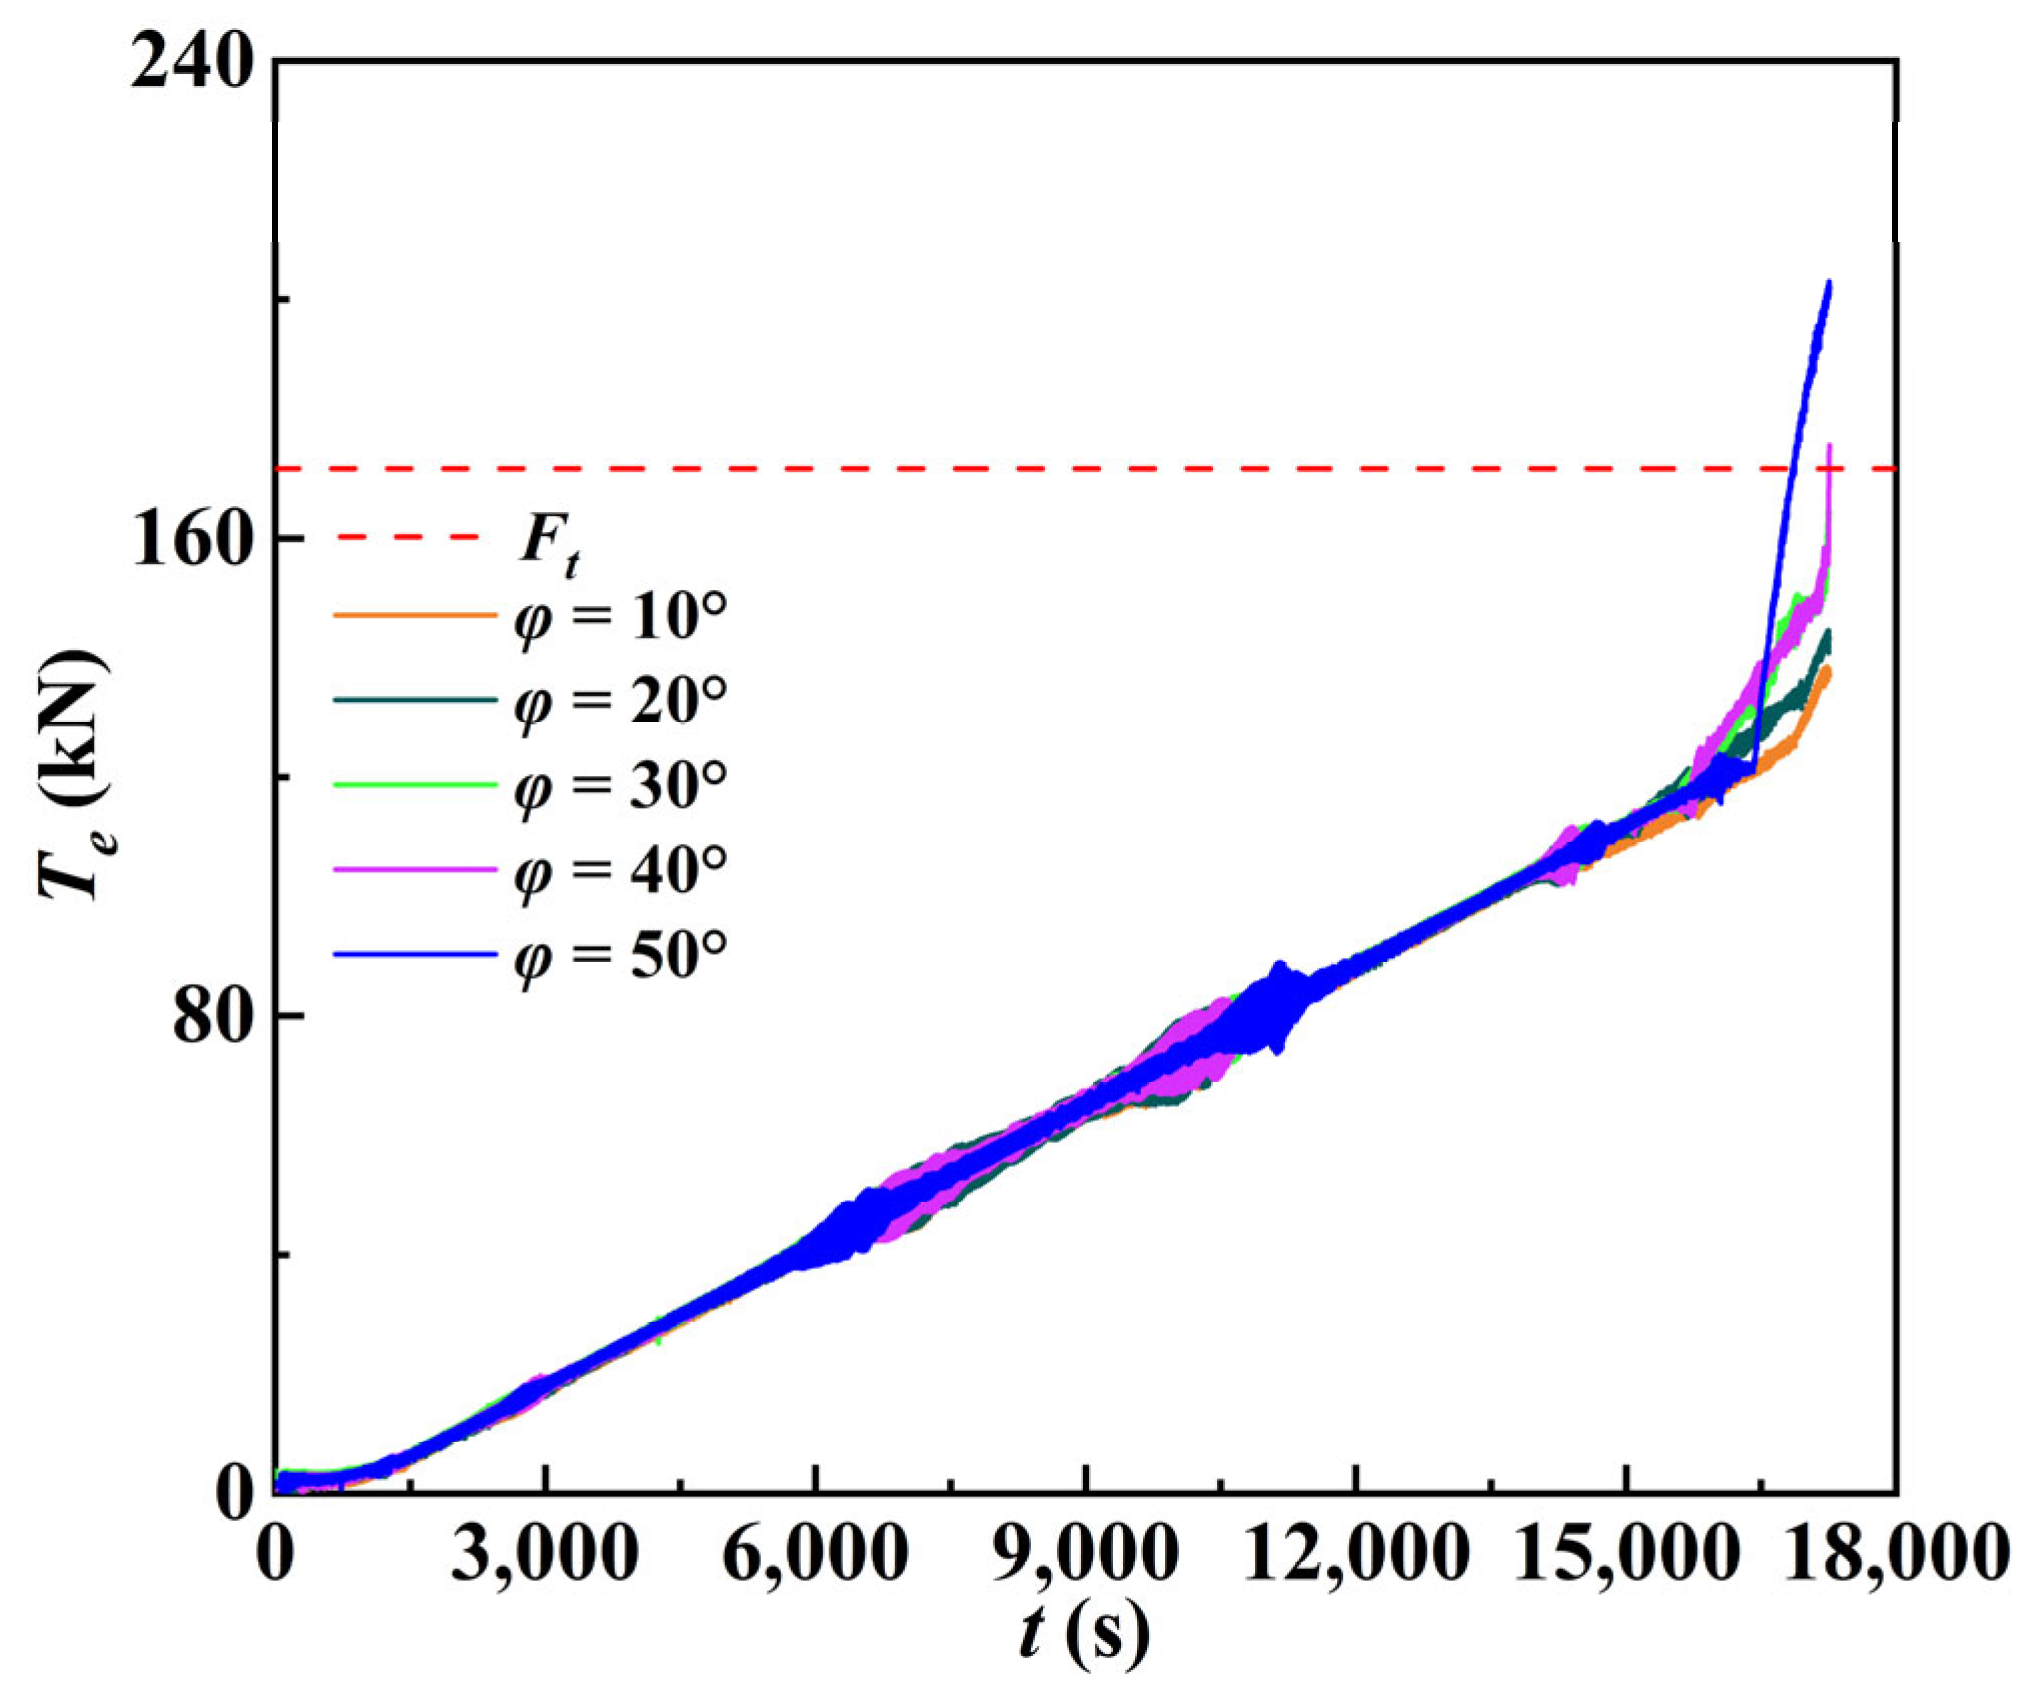
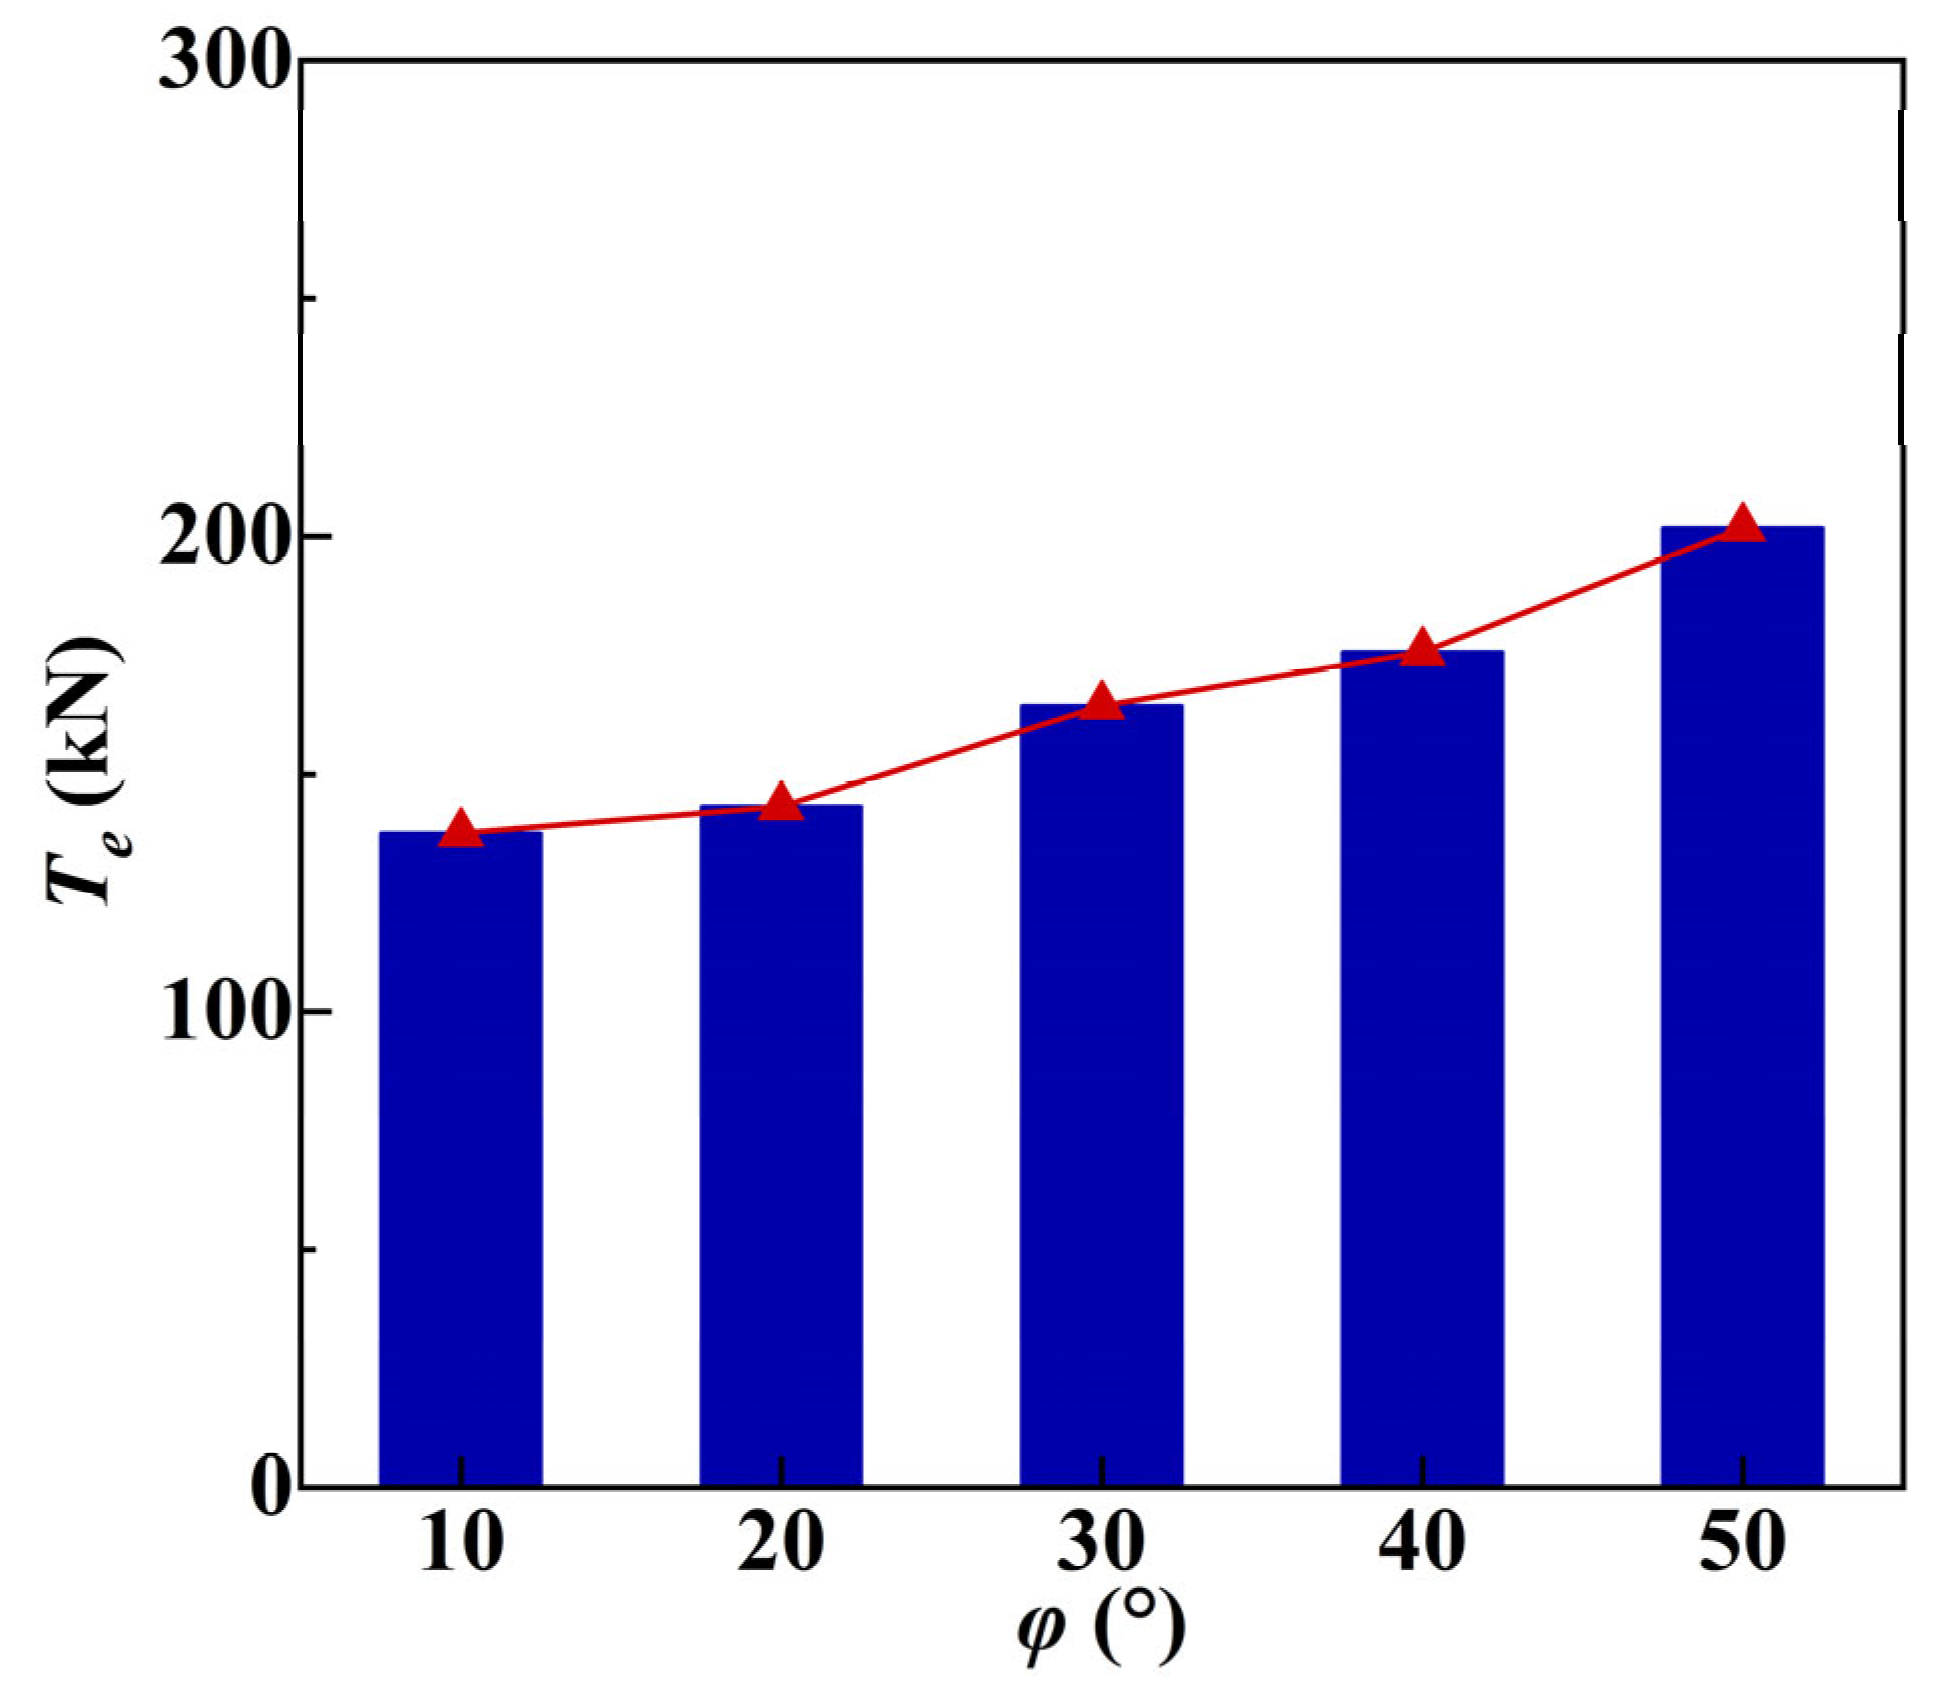
4.2. Effects of the Incident Angle on the Tension in the Cable

Diverging from terrestrial horizontal HDD, submarine cable installations operate under spatially constrained marine environments, necessitating strategic incident angle adjustments to accommodate infrastructural boundaries. The frictional resistance at the cable–pipeline interface is governed by the incident angle variation, a critical operational parameter examined here under the fixed crossing length (LH = 1700 m) and the pullback velocity (νpull = 0.1 m/s). Five values of the incident angle were parametrically examined: φ = 10°, φ = 20°, φ = 30°, φ = 40°, and φ = 50°.
To isolate the φ-dependent effects, the numerical framework preserved the following geometric invariants: the horizontal and excavated pipeline segment remained static, with terminal points rigidly anchored. This protocol enabled automated trajectory generation for the buried pipeline section as φ varied while maintaining kinematic consistency. Figure 9 quantifies the resultant mechanical responses through the comparative analysis of the horizontal bending displacement (HB) and the lateral horizontal bending length (LHB), elucidating their parametric dependencies on φ.
Figure 10 delineates the temporal evolution of the effective tension Te in the cable under distinct pipeline incident angles. While Te exhibits phase-dependent convergence during the initial and intermediate pullback stages, divergent dynamics emerge in the terminal phase, governed by the acute sensitivity to φ-modulated geometrical constraints. This triphasic behavior arises from invariant pipeline routing in excavated/horizontal segments (nullifying φ-dependent frictional variations) versus critical geometry, the tribology coupling in the buried region. During final pullback, curvature-induced contact transitions to low-φ regimes (φ ≤ 30°), sustaining unidirectional sliding friction, whereas φ > 30° instigates multi-axial contact regimes due to helix-like cable–pipeline interactions. Such geometric locking amplifies the frictional resistance by synchronizing the contact area enlargement and static friction coefficient elevation, directly manifested as steepened Te: temporal gradients and heightened peak tensions. Crucially, the threshold at φ = 30° demarcates the friction regimes dominated by kinematic linearity versus nonlinear geometric coupling.
Meanwhile, as the incident angle increases from 10° to 40°, the crossing period remains constant. However, at φ = 50°, the cable tension surges abruptly at t = 16,400 s and exceeds the permissible threshold by 171.7 kN at t = 16,858 s. This nonlinear escalation stems from the intensified geometric constraints at elevated angles, which amplify the cable–pipeline contact pressure and shift the interfacial friction from dynamic to static dominance. The resultant kinematic lock forces the pulling system to generate excessive driving power, inevitably breaching the safe tension limits. For fields where tension constraints cannot be mitigated, establishing an operational platform to reduce φ becomes imperative to ensure safety compliance.
Figure 11 illustrates the maximum effective cable tensions across varying incident angles φ. The amplification ratio exhibits a linear proportionality to φ, confirming enhanced tensile forces at larger angles. Upon pullback completion, the peak tensions measure 137.6 kN, 143.2 kN, 175.7 kN, and 201.8 kN for the respective φ values. For φ < 50°, the average tension amplification (12.7 kN) remains marginal compared to the crossing length effects, indicating limited φ-dependency in cable–pipeline contact mechanics. Notable tension escalation occurs exclusively under geometric locking at φ = 50°. At φ = 35°, the peak tension of 169.7 kN suggests that the optimal incident angle for 1700 m crossings should be maintained within the 35–40° range to balance the operational feasibility and safety thresholds.

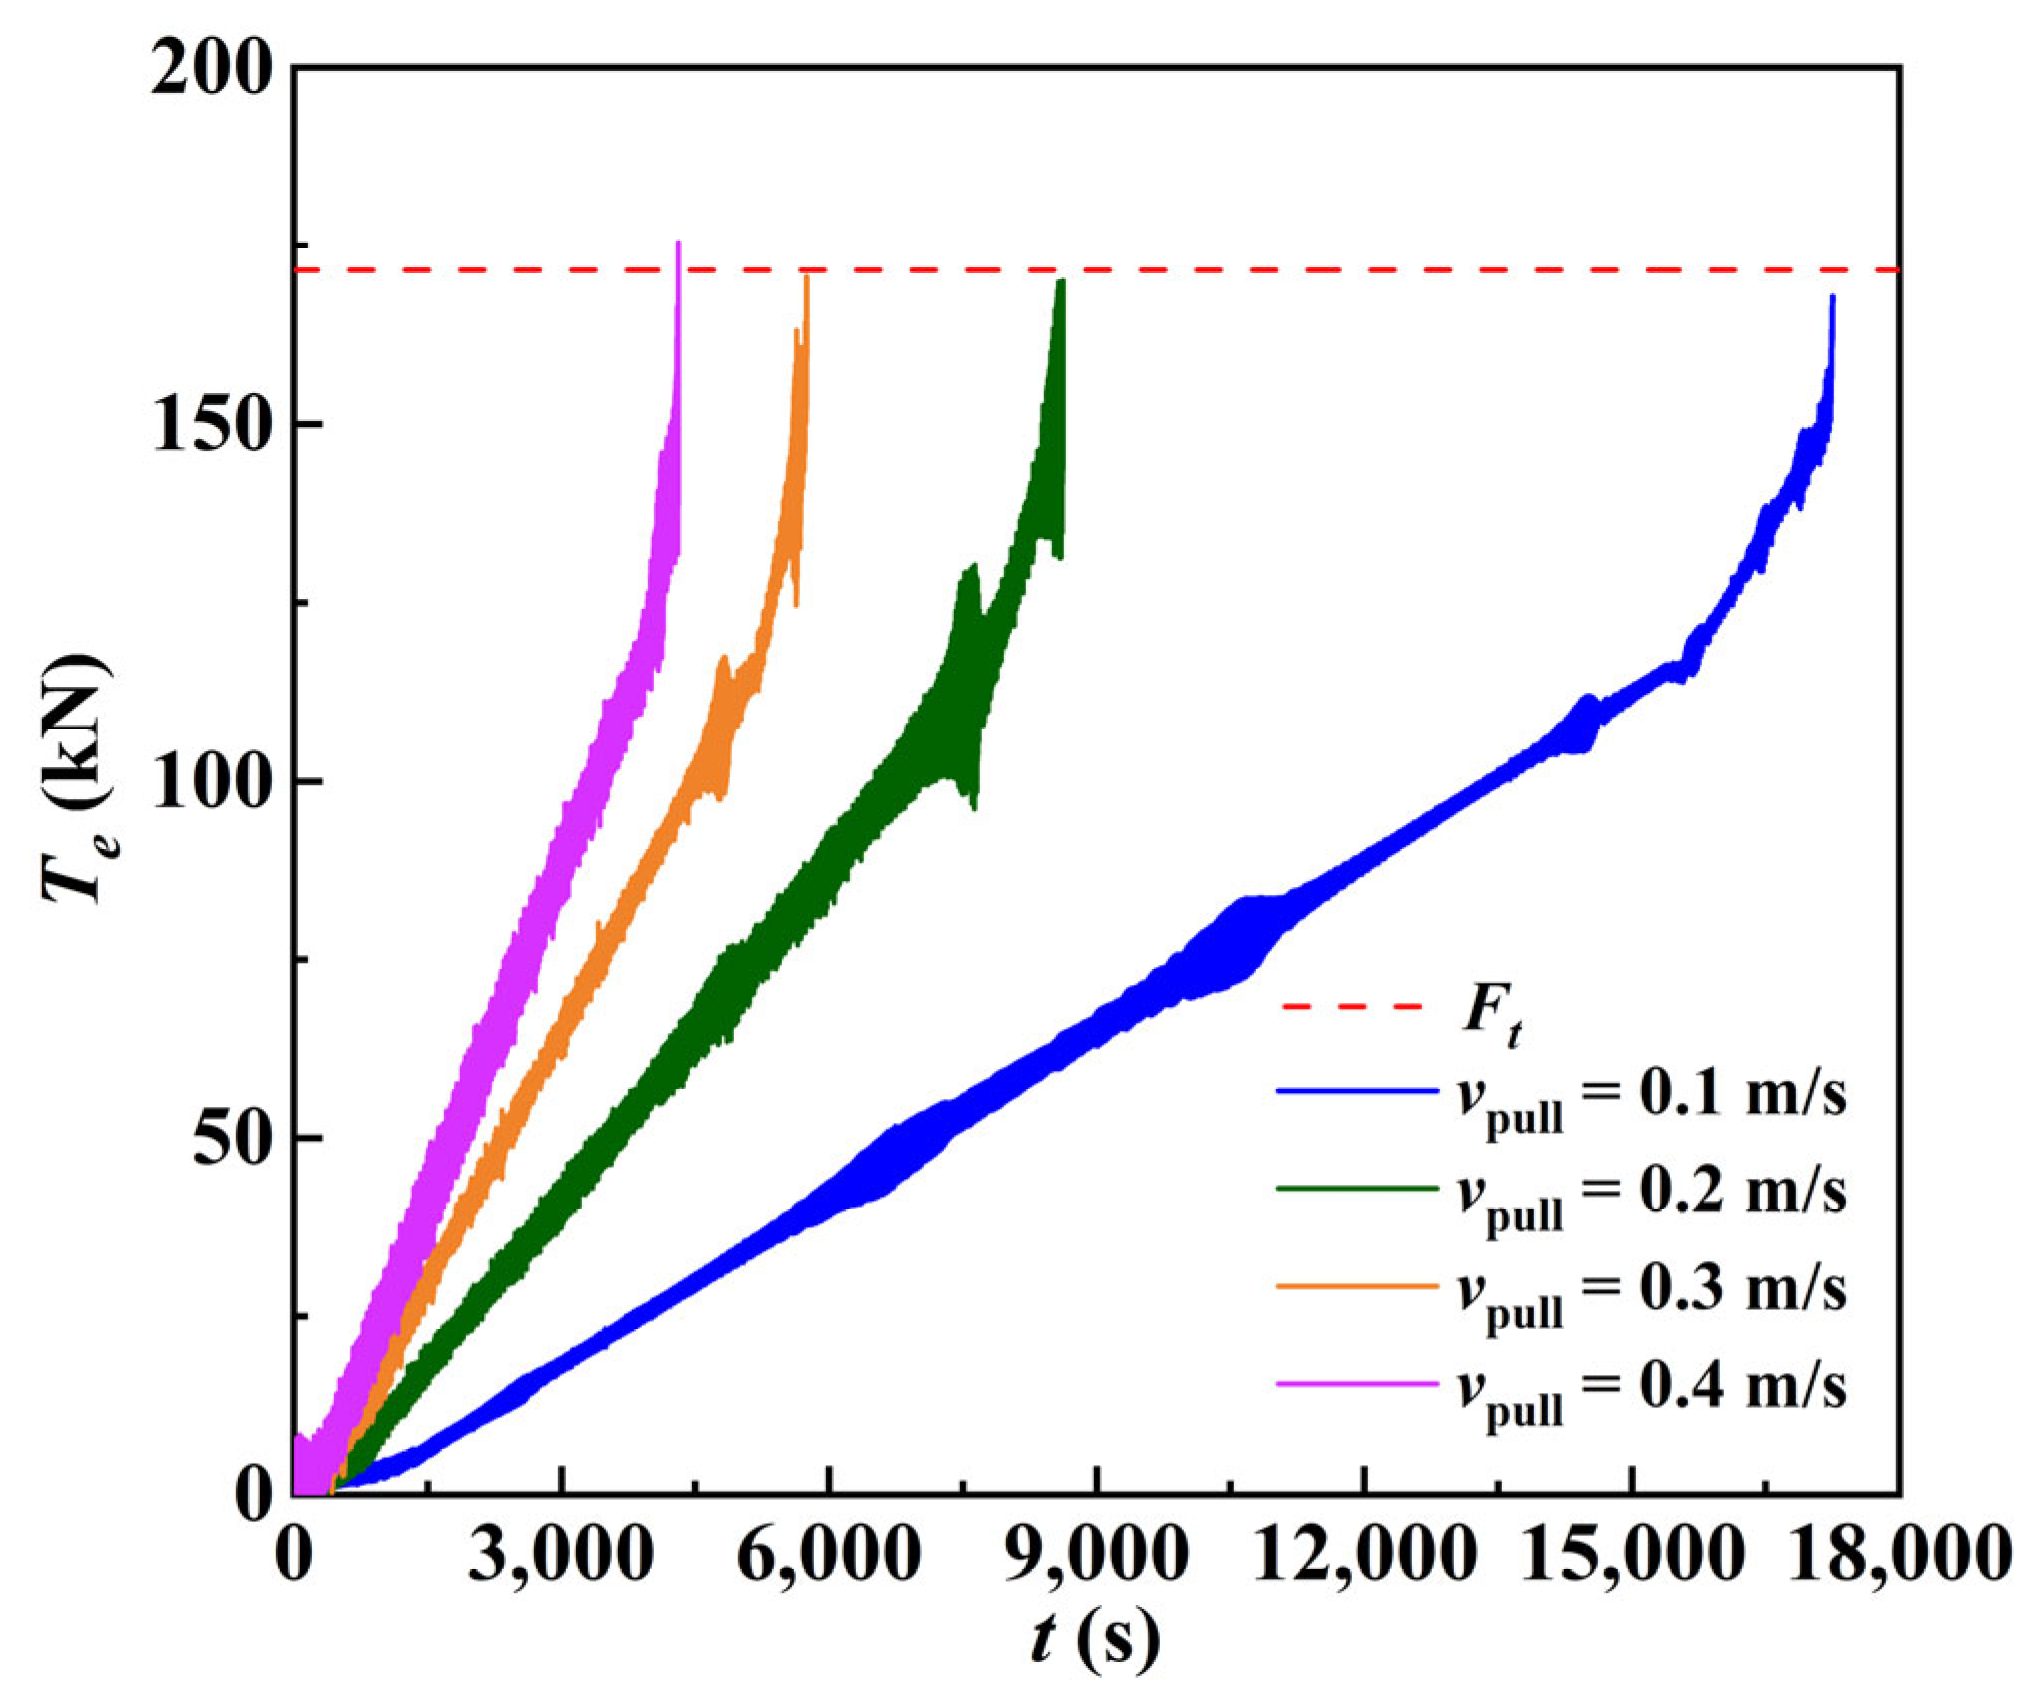
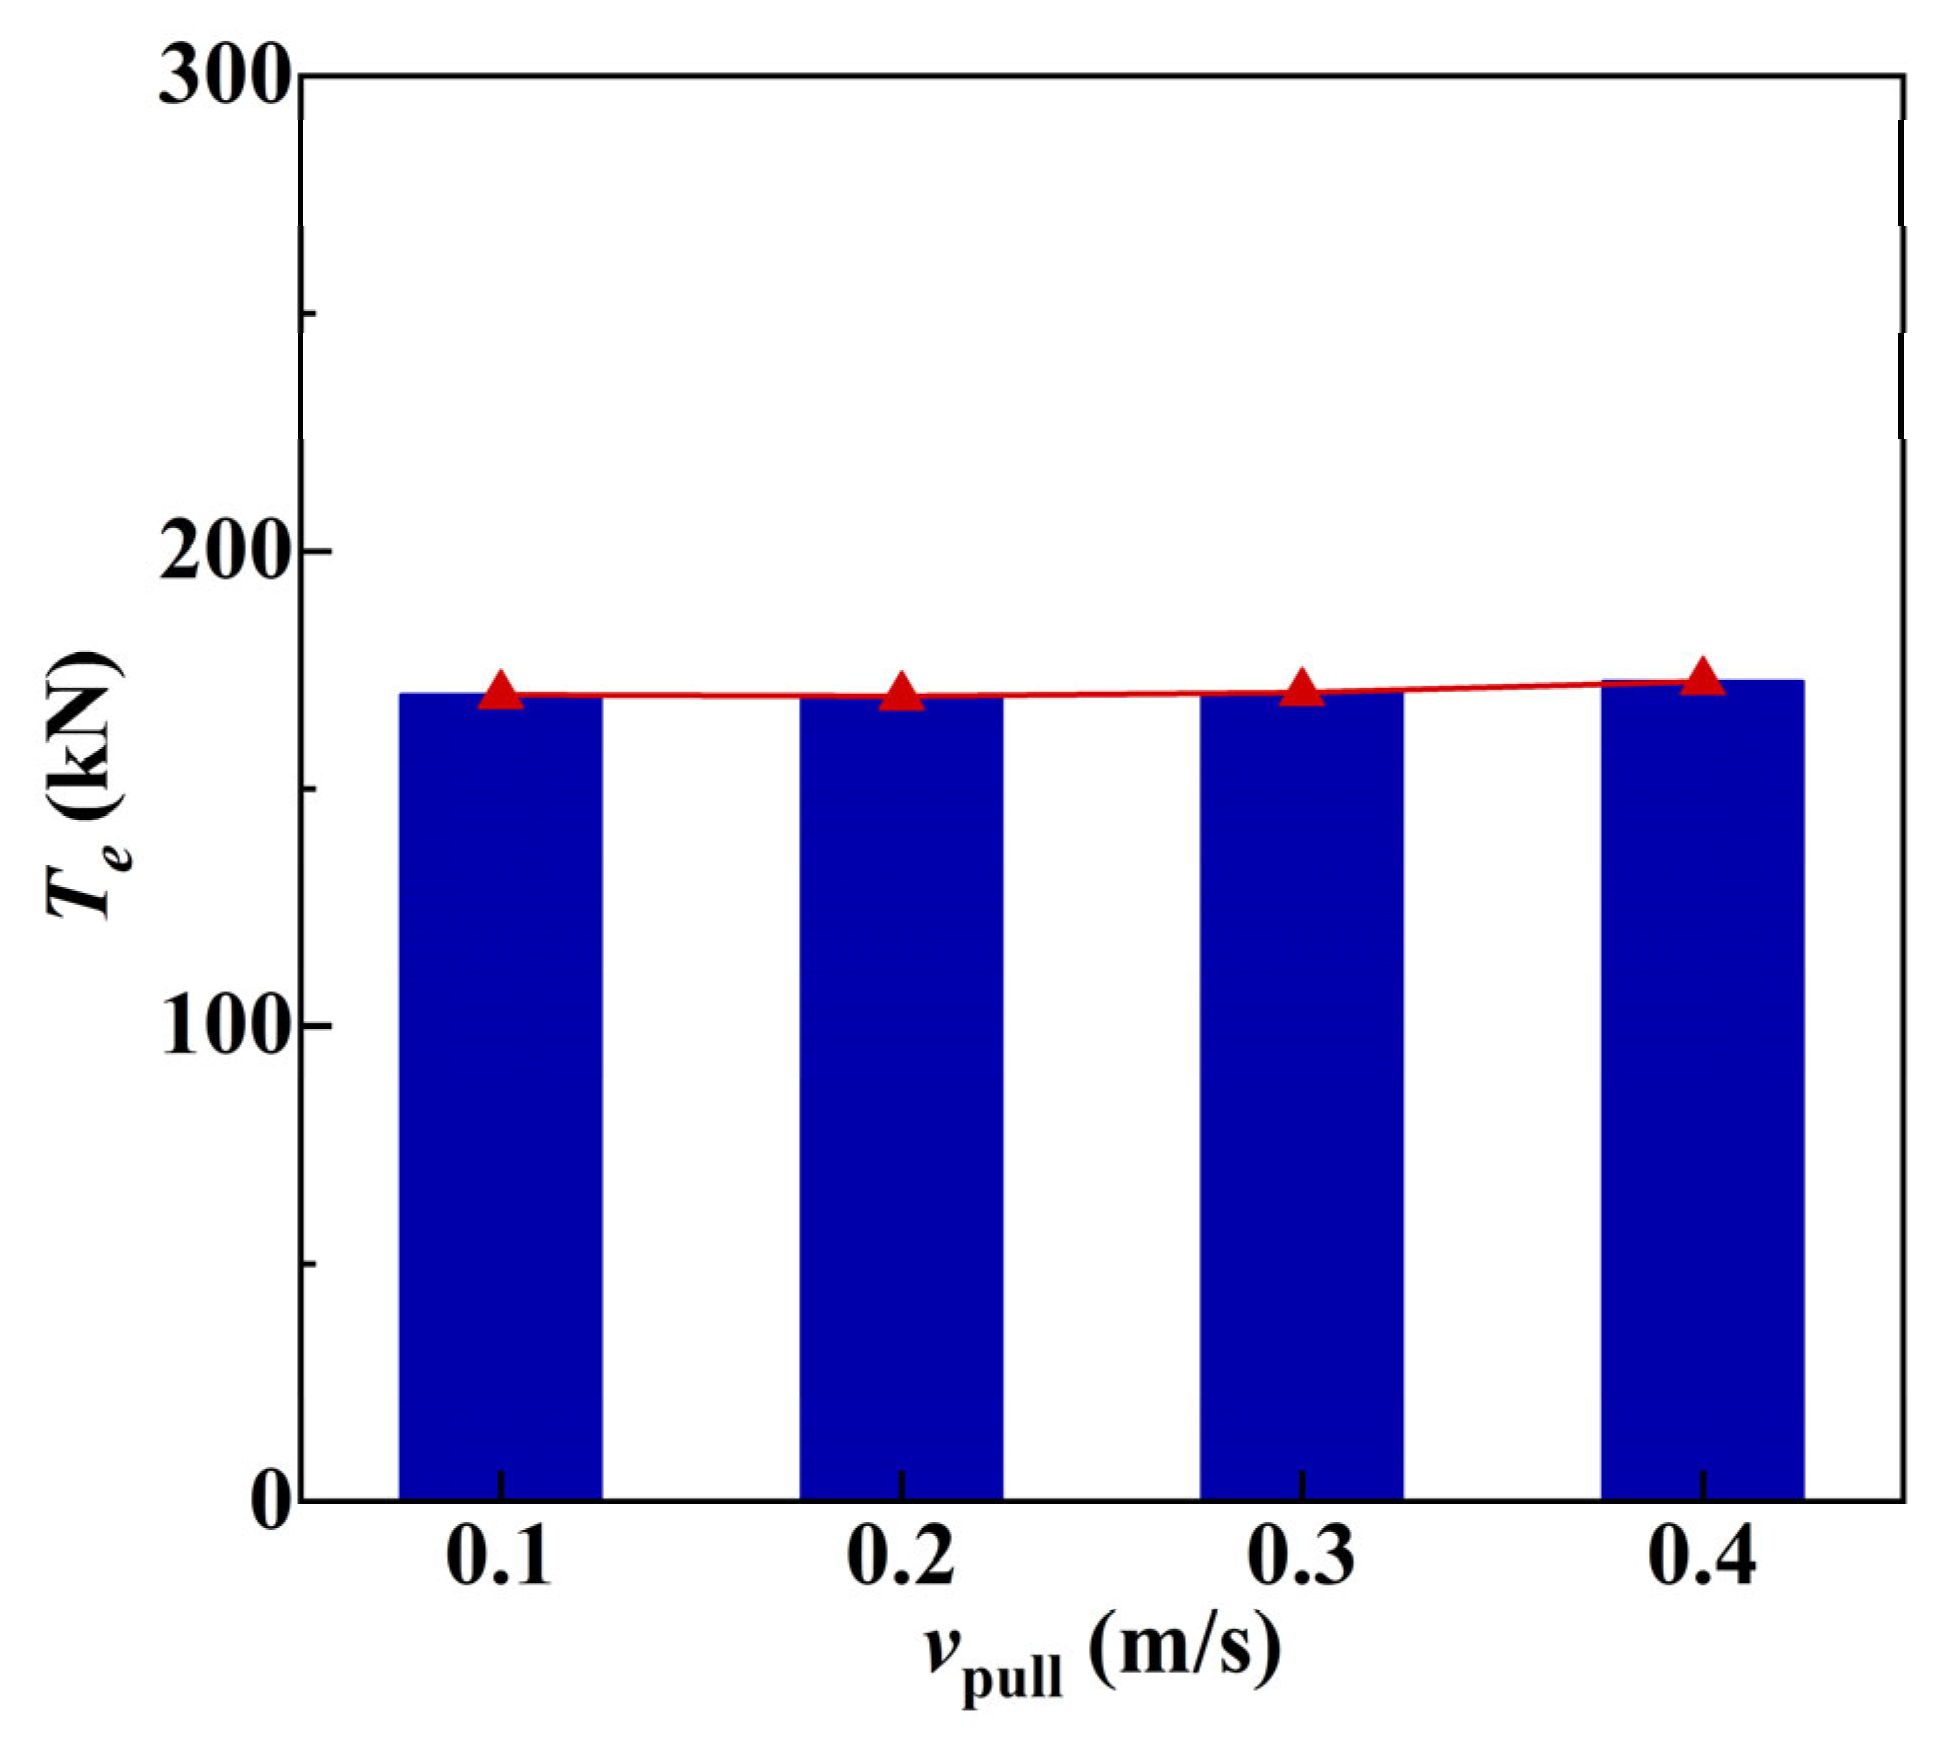
4.3. Effects of the Pullback Velocity on the Tension in the Cable

The pullback velocity of the submarine cable is another critical factor for the tension in the cable. Enhancing the velocity requires higher power with higher costs and causes tension variation in the cable. Therefore, it is necessary to investigate the effects of the pullback velocity on the tension in the cable. Here, we set the crossing length and the incident angle at LH = 1700 m and φ = 35°. Four pullback velocities νpull were employed in the comparison: 0.1 m/s, 0.2 m/s, 0.3 m/s, and 0.4 m/s.
Figure 12 illustrates the temporal evolutions of the effective cable tensions for various pullback velocities. The three varying phases still exist as the pullback velocity increases. Furthermore, the pulling out period decreases significantly as the pullback velocity increases. As νpull increases from 0.1 m/s to 0.4 m/s, the pulling out period shortens nonlinearly. For νpull = 0.1 m/s, the period measures 17, 250 s, decreasing to 4, 309 s at 0.4 m/s, while the extreme case (0.4 m/s) shortens the period to <25% of the baseline (0.1 m/s). This inverse proportionality between the velocity and duration is attributed to the kinematic friction stabilization at elevated speeds, which attenuates the rate of temporal reduction. The results suggest a saturation effect in period reduction at higher velocities, aligning with quasi-steady friction behavior under dynamic cable–pipeline interactions.
Figure 13 illustrates the peak effective cable tensions under varying pullback velocities. As the pullback velocity νpull increases from 0.1 m/s to 0.3 m/s, the peak effective tension fluctuates between 169.7 kN, 169.4 kN, and 170.2 kN, with deviations remaining below 0.5%, and all values are under the permissible threshold of 171.7 kN. However, at νpull = 0.4 m/s, the peak effective cable tension rises to 172.5 kN, exceeding the permissible limit. Compared to the crossing length and incident angle, the pullback velocity has a limited influence on the peak effective cable tension. The peak effective tension exceeds the permissible value only when νpull = 0.4 m/s. As the crossing length and incident angle are fixed, the tension in the cable is primarily determined by the cable mass and the friction between the cable and pipeline, with limited influence from the pullback velocity. Consequently, the peak effective cable tension remains small. The cable stiffness, however, reduces the deformation period at the curvature zones as νpull increases, enlarging the contact area with the upper pipeline wall and amplifying the frictional resistance, thereby elevating the tension. To mitigate the risks of cable locking and structural failure, νpull must be maintained below 0.4 m/s.

5. Conclusions

Based on the HDD project for submarine cable laying in the Zhoushan islands, China, a numerical model using the commercial FEM platform OrcaFlex 11.3 was established to simulate the pullback process of the submarine cable in the pipeline, which was validated using the in situ measured data. The effects of the crossing length, incident angle, and pullback velocity on the effective tension in the cable were investigated and analyzed.
The numerical predictions indicate that the maximum tension in the cable increases gradually as the crossing length of the pipeline increases. Under the investigated project conditions, the peak tension in the cable was close to the permissible value of 171.7 kN when the crossing length was 1700 m. As the incident angle increased, the maximum tension in the cable also increased gradually. When the incident angle was too large, the cable contacted the pipe, causing the tension to be close to the permissible value. The numerical results suggest that the incident angle of the pipeline should be less than 35°. The pullback velocity of the system had a minor influence on the effective tension in the cable, and a gradual increase in the pullback velocity might lock the cable in the pipeline, resulting in damage to the cable.
Future work should address the cable burial depth and emergence angle to expand the tension mitigation strategies. Additionally, while this study assumed a uniform friction coefficient, practical engineering requires sectional distinctions (e.g., excavated vs. seawater-submerged pipeline segments). Buoyancy effects, which reduce the submerged cable weight and alter the friction dynamics, should also be incorporated in simulations for enhanced field application. The environmental loadings, ignored in this study, will be included in the related numerical simulations, and their influences on the pullback process of the submarine cable will be evaluated.

Author Contributions

Conceptualization, Z.L. and G.Q.; methodology, W.K.; software, Y.C.; validation, Y.C.; formal analysis, G.Q. and W.K.; writing—original draft preparation, Z.L.; writing—review and editing, Z.L. and G.Q.; visualization, Y.C. All authors have read and agreed to the published version of the manuscript.

Funding

The research comes from the science and technology project fully supported by the State Grid Zhejiang electric power Co., Ltd. of China (grant no.: 5211ZS230003).

Data Availability Statement

The original contributions presented in this study are included in the article. Further inquiries can be directed to the corresponding author.

Conflicts of Interest

Authors Gang Qian, Wei Kang and Yun Cong were employed by the Zhoushan Power Supply Company, State Grid Zhejiang Electric Power Co., Ltd. The remaining authors declare that the research was conducted in the absence of any commercial or financial relationships that could be construed as a potential conflict of interest.

Nomenclature

SymbolDefinition
aContact area
a0External stress area
aiInternal stress area
ACross-sectional area of the cable
cDamping coefficient
dl/dtChange rate of the length
DHeight from the excavation point to the water surface
DcritDeflection
EEffective Young’s modulus
EAAxial stiffness of the cable
FqMaximum pulling force in the drawing head of the cable
FtPermissible tension in the cable
HWater depth
HBHeight of the buried part of the pipeline
k0Friction coefficient between the PE pipe and the cable
ksShear strength
kttTension/torque coupling
lInstantaneous length of the segment
l0Unstretched length of the segment
LPulling safety distance of the cable
LHHorizontal distance between the entry and exit points
LHBHorizontal length of the buried part of the pipeline
p0External pressure
piInternal pressure
RContact reaction force
SzUnit vector
tTime
TPullback force
T1Initial tension in the cable
TeEffective tension
TwWall tension
νPoisson ratio
νpullPullback velocity
WVolume weight of the cable
φIncident angle
τTwist angle of the segment
εTotal mean axial strain
λExpansion factor of the segment
γ0Safety coefficient of the cable load
μFriction coefficient

References

  1. Worzyk, T. Submarine Power Cables: Design, Installation, Repair, Environmental Aspects; Springer Science & Business Media: Berlin/Heidelberg, Germany, 2009; pp. 136–139. [Google Scholar]
  2. Bao, S.; Zhang, Z.; Yuan, Z.; Wang, J.; Yu, Q.; Liu, Z. Effects of Floating Airbag on Cable Hydrodynamic Behaviors: An Experimental Study. J. Mar. Sci. Eng. 2022, 10, 402. [Google Scholar] [CrossRef]
  3. Taormina, B.; Bald, J.; Want, A.; Thouzeau, G.; Lejart, M.; Desroy, N.; Carlier, A. A review of potential impacts of submarine power cables on the marine environment: Knowledge gaps, recommendations and future directions. Renew. Sustain. Energy Rev. 2018, 96, 380–391. [Google Scholar] [CrossRef]
  4. Tian, Z. The Policy About Submarine Cable Pipeline Project in China. Master’s Thesis, Harbin Engineering University, Harbin, China, 2021. (In Chinese). [Google Scholar]
  5. Wu, A.; Yuan, Z.; Gong, Y. Overview of construction technology for deep-buried laying of submarine cables in China. Zhejiang Electr. Power 2015, 3, 57–62. (In Chinese) [Google Scholar] [CrossRef]
  6. Zou, D.; Hu, J. Study on local sediment scour and stress state of submarine cables in offshore wind farms. In Proceedings of the IOP Conference Series: Earth and Environmental Science, 2021 8th International Conference on Coastal and Ocean Engineering, Tokyo, Japan, 3–5 April 2021. [Google Scholar] [CrossRef]
  7. The Cables Buried in the Seabed Run Out for “Breathability”! Consultation with All Parties to Ensure Winter Electricity Consumption on Chongming Island. Available online: https://baijiahao.baidu.com/s?id=1654575915573352837&wfr=spider&for=pc (accessed on 1 April 2024).
  8. Osthoff, D.; Heins, E.; Grabe, J. Impact on submarine cables due to ship anchor—Soil interaction. Geotechnik 2017, 40, 265–270. [Google Scholar] [CrossRef]
  9. Vandals Cut San Francisco Area Fiber Optic Lines for 11th Time in a Year. Available online: https://edition.cnn.com/2015/07/01/tech/california-fiber-optic-cable-cuts/index.html (accessed on 10 April 2024).
  10. Yan, X.; Ariaratnam, S.T.; Dong, S.; Zeng, C. Horizontal directional drilling: State-of-the-art review of theory and applications. Tunn. Undergr. Space Technol. 2018, 72, 162–173. [Google Scholar] [CrossRef]
  11. The Distinct Advantages of Horizontal Directional Drilling. Available online: https://www.powrmole.com/blog/the-distinct-advantages-of-horizontal-directional-drilling/ (accessed on 12 April 2024).
  12. Syms, E.I.B. Horizontal Directional Drilling; Butterworth-Heinemann: Oxford, UK, 2004; pp. 297–326. [Google Scholar]
  13. Sun, P.; Liu, W.; Yang, H.; Wei, B.; Xia, Y. Progress in research and applications of trenchless horizontal directional drilling equipment and technology in China. Chin. J. Eng. 2022, 44, 122–130. (In Chinese) [Google Scholar] [CrossRef]
  14. Li, D.; Wang, W.; Lin, Y.; Zhang, Z.; Zhang, X. Exploration and Practice of Land to Sea Directional Drilling and Crossing Technology in Marine Engineering. J. Ocean Technol. 2020, 39, 95–100. (In Chinese) [Google Scholar]
  15. Tang, P.; Chen, C.; Huang, S.; Huang, D.; Yang, X.; Wei, J.; Jin, L. Research of Land-to-sea Horizontal Directional Drilling Crossing Technology. Pipeline Tech. Equip. 2022, 2, 31–34. (In Chinese) [Google Scholar]
  16. Black, S.; Cable, B.; Fredrickson, B.; Warren, D. Horizontal directional drilling cable shorelanding at san nicolas island, California. In Proceedings of the Oceans’ 04 MTS/IEEE Techno-Ocean’04 (IEEE Cat. No. 04CH37600), Kobe, Japan, 9–12 November 2004; pp. 2104–2111. [Google Scholar] [CrossRef]
  17. Bascom, E.C.R.; Rezutko, J. Novel installation of a 138kv pipe-type cable system under water using horizontal directional drilling. In Proceedings of the 2014 IEEE PES T&D Conference and Exposition, Chicago, IL, USA, 14–17 April 2014. [Google Scholar] [CrossRef]
  18. Jiao, Y.; Meng, J.; Pan, L.; Zhang, Q.; Ku, M. Laying Construction Techniques of 35 kV Submarine Cable in Offshore Wind Farm. Hydropower New Energy 2022, 36, 44–47. (In Chinese) [Google Scholar] [CrossRef]
  19. Yoshizawa, N.; Yabuta, T. Study on submarine cable tension during laying. IEEE J. Ocean. Eng. 1983, 8, 293–299. [Google Scholar] [CrossRef]
  20. Nagatomi, O.; Nakamura, M.; Wataru, K. Dynamic simulation and field experiment of submarine cable during laying and recovery. In Proceedings of the International Ocean and Polar Engineering Conference, Kitakyushu, Japan, 26–31 May 2002. [Google Scholar]
  21. Prpić-Oršić, J.; Nabergoj, R. Nonlinear dynamics of an elastic cable during laying operations in rough sea. Appl. Ocean Res. 2005, 27, 255–264. [Google Scholar] [CrossRef]
  22. Zhang, T.; Hu, X. Tension analysis in submarine cable laying. Ship Boat 2009, 20, 15–20. (In Chinese) [Google Scholar]
  23. Yang, N. Tension Analysis of Submarine Cables During Laying Operations. Master’s Thesis, Shanghai Jiao Tong University, Shanghai, China, 2015. (In Chinese). [Google Scholar]
  24. Feng, Y.; Shang, Q.; Lv, A. Dynamic Finite Element Analysis of Fiber-Optic Composite Submarine Cable Under Wave. Study On. Opt. Commun. 2017, 4, 30–34. (In Chinese) [Google Scholar] [CrossRef]
  25. Zhang, D.; Bai, Y.; Zhao, W.; Zhu, K. Dynamic analysis of submarine cable during the process of laying back to the seabed. Ships Offshore Struct. 2019, 15, 153–161. [Google Scholar] [CrossRef]
  26. Chang, H.-C.; Chen, B.-F. Mechanical behavior of submarine cable under coupled tension, torsion and compressive loads. Ocean Eng. 2019, 189, 106272. [Google Scholar] [CrossRef]
  27. Sun, Y.; Shu, C.; Gao, Z. Analysis of Influencing Factors in the Process of Laying Submarine Optical Cable. In Proceedings of the 2020 IEEE 9th Joint International Information Technology and Artificial Intelligence Conference (ITAIC), Chongqing, China, 11–13 December 2020. [Google Scholar] [CrossRef]
  28. Okkerstrøm, L. Sensitivity Analysis of Peak Tension Loads on Subsea Power Cables During Laying Operations. Master’s Thesis, Western Norway University of Applied Sciences, Haugesund, Norway, 2021. [Google Scholar]
  29. Kuang, J.; Chen, G.; Yuan, Z.; Qi, X.; Yu, Q.; Liu, Z. Dynamic Interactions of a Cable-Laying Vessel with a Submarine Cable during Its Landing Process. J. Mar. Sci. Eng. 2022, 10, 774. [Google Scholar] [CrossRef]
  30. Shen, J.; Liang, Y.; Hong, H.; Chen, J. Numerical Investigation of Burial Depth Effects on Tension of Submarine Power Cables. J. Mar. Sci. Eng. 2024, 12, 1972. [Google Scholar] [CrossRef]
  31. Peres, M.; Wang, S.; Soares, C.G. Sensitivity analysis of loads on subsea power cables during installation. In Advances in Maritime Technology and Engineering; CRC Press: Boca Raton, FL, USA, 2024; pp. 477–487. [Google Scholar]
  32. Li, Y.; Jiang, L.; Xie, M.; Yu, J.; Qian, L.; Xu, K.; Chen, M.; Wang, Y. Advancements and Challenges in Power Cable Laying. Energies 2024, 17, 2905. [Google Scholar] [CrossRef]
  33. Khasanov, R.R.; Pascal, M.A.; Sultanmagomedov, T.; Magomedtagirovich, S.S. Improving the methodology for calculating the thrust force during underwater crossing by directional drilling method. J. Integr. Sci. Technol. 2024, 12, 823. [Google Scholar] [CrossRef]
  34. Faghih, A.; Goerz, B.; Bayat, A. Stress analysis of steel pipe installation in horizontal directional drilling based on strain monitoring. Tunn. Undergr. Space Technol. 2024, 147, 105673. [Google Scholar] [CrossRef]
  35. Guo, Z.; Liang, Z. Analysis of the pipeline pull-back load for horizontal directional drilling. KSCE J. Civ. Eng. 2018, 22, 5133–5142. [Google Scholar] [CrossRef]
  36. Tang, J.; Qin, T.; Zhang, H. Research on influencing factors of cable traction force in horizontal directional drilling. In Proceedings of the IOP Conference Series: Earth and Environmental Science, Sanya, China, 16–18 November 2021. [Google Scholar] [CrossRef]
  37. Vasilescu, V.-F.; Dinu, D. Installation of submarine cables and pipes in shallow waters and connecting them to the shore by the method of horizontal directional drilling. In Proceedings of the 10th International Conference on Thermal Equipments, Renewable Energy and Rural Development, Bucharest, Romania, 26–27 June 2020. [Google Scholar] [CrossRef]
  38. Liang, X.-Q.; Hu, D.; Li, Y.-S.; Yang, X.; Jiang, L.; Zhang, Y.-Y. An Improved Model to Calculate Pullback Force of Trenchless Horizontal Directional Drilling Pipeline. Adv. Civ. Eng. 2022, 2022, 1–13. [Google Scholar] [CrossRef]
  39. Zheng, H. Mechanical response analysis on pipeline during horizontal directional drilling construction and service period. I 2025, 56, 198–204. (In Chinese) [Google Scholar] [CrossRef]
  40. GB/T 13663.2-2018; Polyethylene (PE) Piping Systems for Water Supple—Part 2 Pipes. General Administration of Quality Supervision, Inspection and Quarantine of the People’s Republic of China: Beijing, China, 2018.
  41. Orcaflex11.3b User’s Manual. Available online: https://www.orcina.com/author/heff/page/2/ (accessed on 22 May 2024).
  42. Liu, X. Mechanics Analysis of Pipeline in Back-Dragging Process of Horizontal Directional Drilling. Doctoral Thesis, Southwest Petroleum University, Chengdu, China, 2017. (In Chinese). [Google Scholar]
Figure 1. Schematic of the submarine cable in the HDD pipeline.
Water 17 01517 g001
Figure 2. Variation mode change in the modified Coulomb friction model [36]. (a) Sudden change mode; (b) linear change mode.
Water 17 01517 g002
Figure 3. Submarine cable in the FEM model [36].
Water 17 01517 g003
Figure 4. Comparison of the predicted and measured forces in the engineering project [42].
Water 17 01517 g004
Figure 5. Time histories of the effective tension in the cable for various crossing lengths.
Water 17 01517 g005
Figure 6. Different states of the cable during its pullback process. (a) Suspension state; (b) relaxed state.
Water 17 01517 g006
Figure 7. The maximum values of the effective tension for different crossing lengths.
Water 17 01517 g007
Figure 8. Time histories of the effective tension in the cable for LH = 1700 m.
Water 17 01517 g008
Figure 9. Shape variations in the buried part of the pipeline for various incident angles.
Water 17 01517 g009
Figure 10. Time histories of the effective tension in the cable for various incident angles.
Water 17 01517 g010
Figure 11. Maximum effective tensions in the cable for various incident angles.
Water 17 01517 g011
Figure 12. Time histories of the effective tension in the cable for various pullback velocities.
Water 17 01517 g012
Figure 13. Maximum effective tensions in the cable for various pullback velocities.
Water 17 01517 g013
Table 1. Detailed parameters of the submarine cable.
ItemValue (Unit)ItemValue (Unit)
Outer diameter199.2 mmMass in the water47.9 kg/m
Mass in the air79.8 kg/mPermissible tension171.7 kN
Axial stiffness7.0 × 105 N/mmBending stiffness1.0 × 108 N/mm
Table 2. Detailed parameters of the PE pipe.
ItemValue (Unit)ItemValue (Unit)
ClassificationPE 100Density910.0 kg/m3
Outer diameter355.0 mmSingle section length12.0 m
Thickness13.6 mmFriction coefficient with the cable0.35
Axial stiffness1.3 × 104 N/mmBending stiffness2.6 × 1011 N·mm2
Table 3. Detailed parameters of the engineering [42].
ItemValue (Unit)ItemValue (Unit)
Crossing length1970.0 mPipe specificationΦ610 × 12.7 mm
Pipe length2129.0 mPipe material density7850 kg/m3
Crossing depth73.5 mMud density1200 kg/m3
Incident angle16.0°Unearthed angle14°
Friction coefficient0.3Pipeline radius0.65 m
Disclaimer/Publisher’s Note: The statements, opinions and data contained in all publications are solely those of the individual author(s) and contributor(s) and not of MDPI and/or the editor(s). MDPI and/or the editor(s) disclaim responsibility for any injury to people or property resulting from any ideas, methods, instructions or products referred to in the content.

