1. Introduction
The typhoon is the most intense weather system resulting from atmosphere–ocean interactions [
1]. The South China Sea, as the largest marginal sea of the western North Pacific in China, is also one of the most active regions for typhoons, where typhoons play a crucial role in driving oceanic variability. Wind stress-induced vertical mixing and upwelling can effectively uplift nutrient-rich subsurface cold waters to the sea surface [
2,
3,
4]. This process not only leads to a decrease in sea surface temperature (SST) [
5,
6,
7,
8,
9] but also enhances primary productivity and increases chlorophyll-
a (chl-
a) concentration through the input of nutrients [
4,
10,
11,
12,
13,
14]. Wang et al. [
15] investigated the changes in chl-
a concentration before and after typhoon transit and found that chl-
a concentration increased from 0.74 mg/m
3 to 1.29 mg/m
3. Jung et al. [
16] studied the environmental and ecological impacts of summer typhoons entering the East China Sea and found that summer typhoons typically increase surface chl-
a concentrations by 65.4%. Lin et al. [
17] studied Typhoon Kai-tak, which passed through the South China Sea, and revealed a dramatic 30-fold increase in the average sea surface chl-
a concentration, from 0.1 mg/m
3 before to 3.2 mg/m
3 after the typhoon. Babin et al. [
3] conducted a study on 13 tropical cyclones in the North Atlantic and found that these cyclones triggered a significant 5–91% increase in chl-
a concentrations for 2–3 weeks, which then gradually returned to pre-cyclone levels. Pan et al. [
18] investigated the phytoplankton biomass response to typhoons in the South China Sea using a physical–biogeochemical coupled model. Their results demonstrated that among all 79 typhoon events affecting the region between 2000 and 2009, 43 typhoons triggered surface phytoplankton blooms, while 5 cases only induced subsurface blooms without surface blooms. Overall, more than half of the typhoons impacting the South China Sea were found to stimulate phytoplankton blooms and enhance marine primary productivity. Ma et al. [
19] examined the phytoplankton response to the successive Typhoons Barijat and Mangkhut in the northern South China Sea during summer 2018. Observations revealed an average 63% increase in chl-
a concentration following the passage of typhoons.
While the upper ocean’s physical and biogeochemical responses to a single typhoon event have been well characterized, the impact of successive typhoons on the ocean remains understudied. Previous studies have primarily focused on SST responses after the passages of typhoons, and the results showed that the SST cooling is significantly modulated when two typhoons consecutively pass through the same region [
20,
21]. Han et al. [
20] conducted a comprehensive study on the SST response to the successive Typhoons Nesat and Nalgae in the South China Sea during summer 2011. Their research revealed that Typhoon Nesat generated a pronounced right-of-track cooling of up to 4.4 °C, whereas the subsequent Typhoon Nalgae produced a comparatively weaker cooling of only 2.2 °C. The analysis further demonstrated that vertical mixing served as the dominant mechanism for SST reduction in areas near the typhoon tracks. Zhang et al. [
21] analyzed SST following the passage of the successive Typhoons Sarika and Haima. Their results demonstrated distinct oceanic responses: the first Typhoon Sarika induced approximately 4 °C SST cooling, while the subsequent Typhoon Haima produced relatively weaker effects with a 2 °C SST decrease. Baranowski et al. [
22] employed numerical modeling to investigate the successive typhoons Hagupit and Jangmi in September–October 2008. Their simulations revealed that without the preconditioning effect of Typhoon Hagupit, Typhoon Jangmi would have generated more pronounced ocean cooling. Specifically, the cold wake following Jangmi’s passage and the left-track temperature anomalies would have been approximately 0.4 °C greater in the absence of prior oceanic disturbance by Hagupit. In addition to SST, the preceding typhoon in a successive event also has an impact on the chl-
a response processes generated by the subsequent typhoon. Huang et al. [
23] analyzed phytoplankton blooms induced by the successive Typhoon Sinlaku and Typhoon Jangmi in the Northwestern Pacific Ocean found that the pre-existing cyclonic eddy provided a relatively unstable thermodynamic structure for Typhoon Sinlaku and facilitated more efficient upwelling of nutrient-rich cold subsurface water to the surface, whereas the deepening of the mixed layer caused by Typhoon Sinlaku prevented deeper nutrient-rich cold water from being carried into the upper ocean mixed layer, resulting in weaker phytoplankton blooms and creating unfavorable preconditions for the chl-
a response triggered by Typhoon Jangmi. Although the chl-
a response mechanism of individual typhoons in the South China Sea has been theoretically framed, the mechanism of successive typhoons induced chl-
a response in the South China Sea is not comprehensive. This paper takes Typhoon Durian and Typhoon Utor in 2006 as examples to analyze the effects of successive typhoons on chl-
a concentration by multi-source satellite data.
2. Materials and Methods
The typhoon data were derived from the Joint Typhoon Warning Center (JTWC) and included key information such as typhoon location, track, and intensity with a time resolution of 6 h. This study focused on Typhoons Durian and Utor in December 2006, with the investigation area 107 E–118 E and 8 N–19 N in the South China Sea. Typhoon Durian crossed the study area from 2 to 4 December 2006, and Typhoon Utor crossed from 11 to 13 December 2006. The chl-a concentration data were acquired using the Moderate-Resolution Imaging Spectroradiometer (MODIS) Level-3 product with a spatial resolution of 4 km and a daily temporal resolution. The SST data were obtained from the Group for High-Resolution Sea Surface Temperature (GHRSST) Level 4 product with a daily temporal resolution and a spatial resolution of 0.0879. The 10 m wind field data () were obtained from the Quick Scatterometer (QuikSCAT; NASA/JPL, USA) satellite mission, which makes observations twice a day with a spatial resolution of 0.25. The current data and temperature profiles were obtained from the Hybrid Coordinate Ocean Model (HYCOM) global reanalysis product with a daily temporal resolution and 0.08 spatial resolution.
Using 16 years of typhoon data from the South China Sea, Wang [
24] performed a time series of SST and chl-
a concentration before and after typhoon passages. The analysis revealed that chl-
a concentrations fluctuated in two days before the typhoon arrival and remained relatively stable with minimal changes in the 3–8 days before the typhoon. Chl-
a concentration maintained at a high level for 2–7 days after the typhoon. Combined with the results of this paper, the average chl-
a concentration of the 3–8 days before the typhoon is defined as the initial condition, the average chl-
a concentration for 3 to 8 days after the typhoon is defined as the post-typhoon chl-
a concentration, and the difference between them is the chl-
a response. According to the results of Wang (2020) [
24], SST began to decline after the passage of typhoon, and the maximum decline occurred within 3 days after the pass of the typhoon. Combined with the results of this paper, the SST response was defined as the difference between the average of the SST from t
0 to t
3 after the typhoon and the SST background, and the SST background is defined as the 3–8 days before the typhoon.
The kinetic energy (KE) is calculated using the following formula:
where
and
are the east–west and north–south current speed, respectively, and
is the density of sea water.
The Ekman Pumping Velocity (EPV) is calculated as
where
is the Coriolis parameter, and
is the wind stress, calculated according to the following formula:
is the density of air, and
is the wind drag coefficient. The chl-
a response shows regional variability under the influence of successive typhoons. The overlap area 111
E–115
E, 13
N–14.5
N is defined as Region A based on the strong chl-
a response, and the area to the right of Typhoon Utor, 114
E–116.2
E, 14.3
N–17
N, where the chl-
a response is strong, is defined as Region B. Regions A and B are labeled with black boxes in
Figure 1.
3. Chlorophyll-a Response Induced by Typhoon Durian and Typhoon Utor
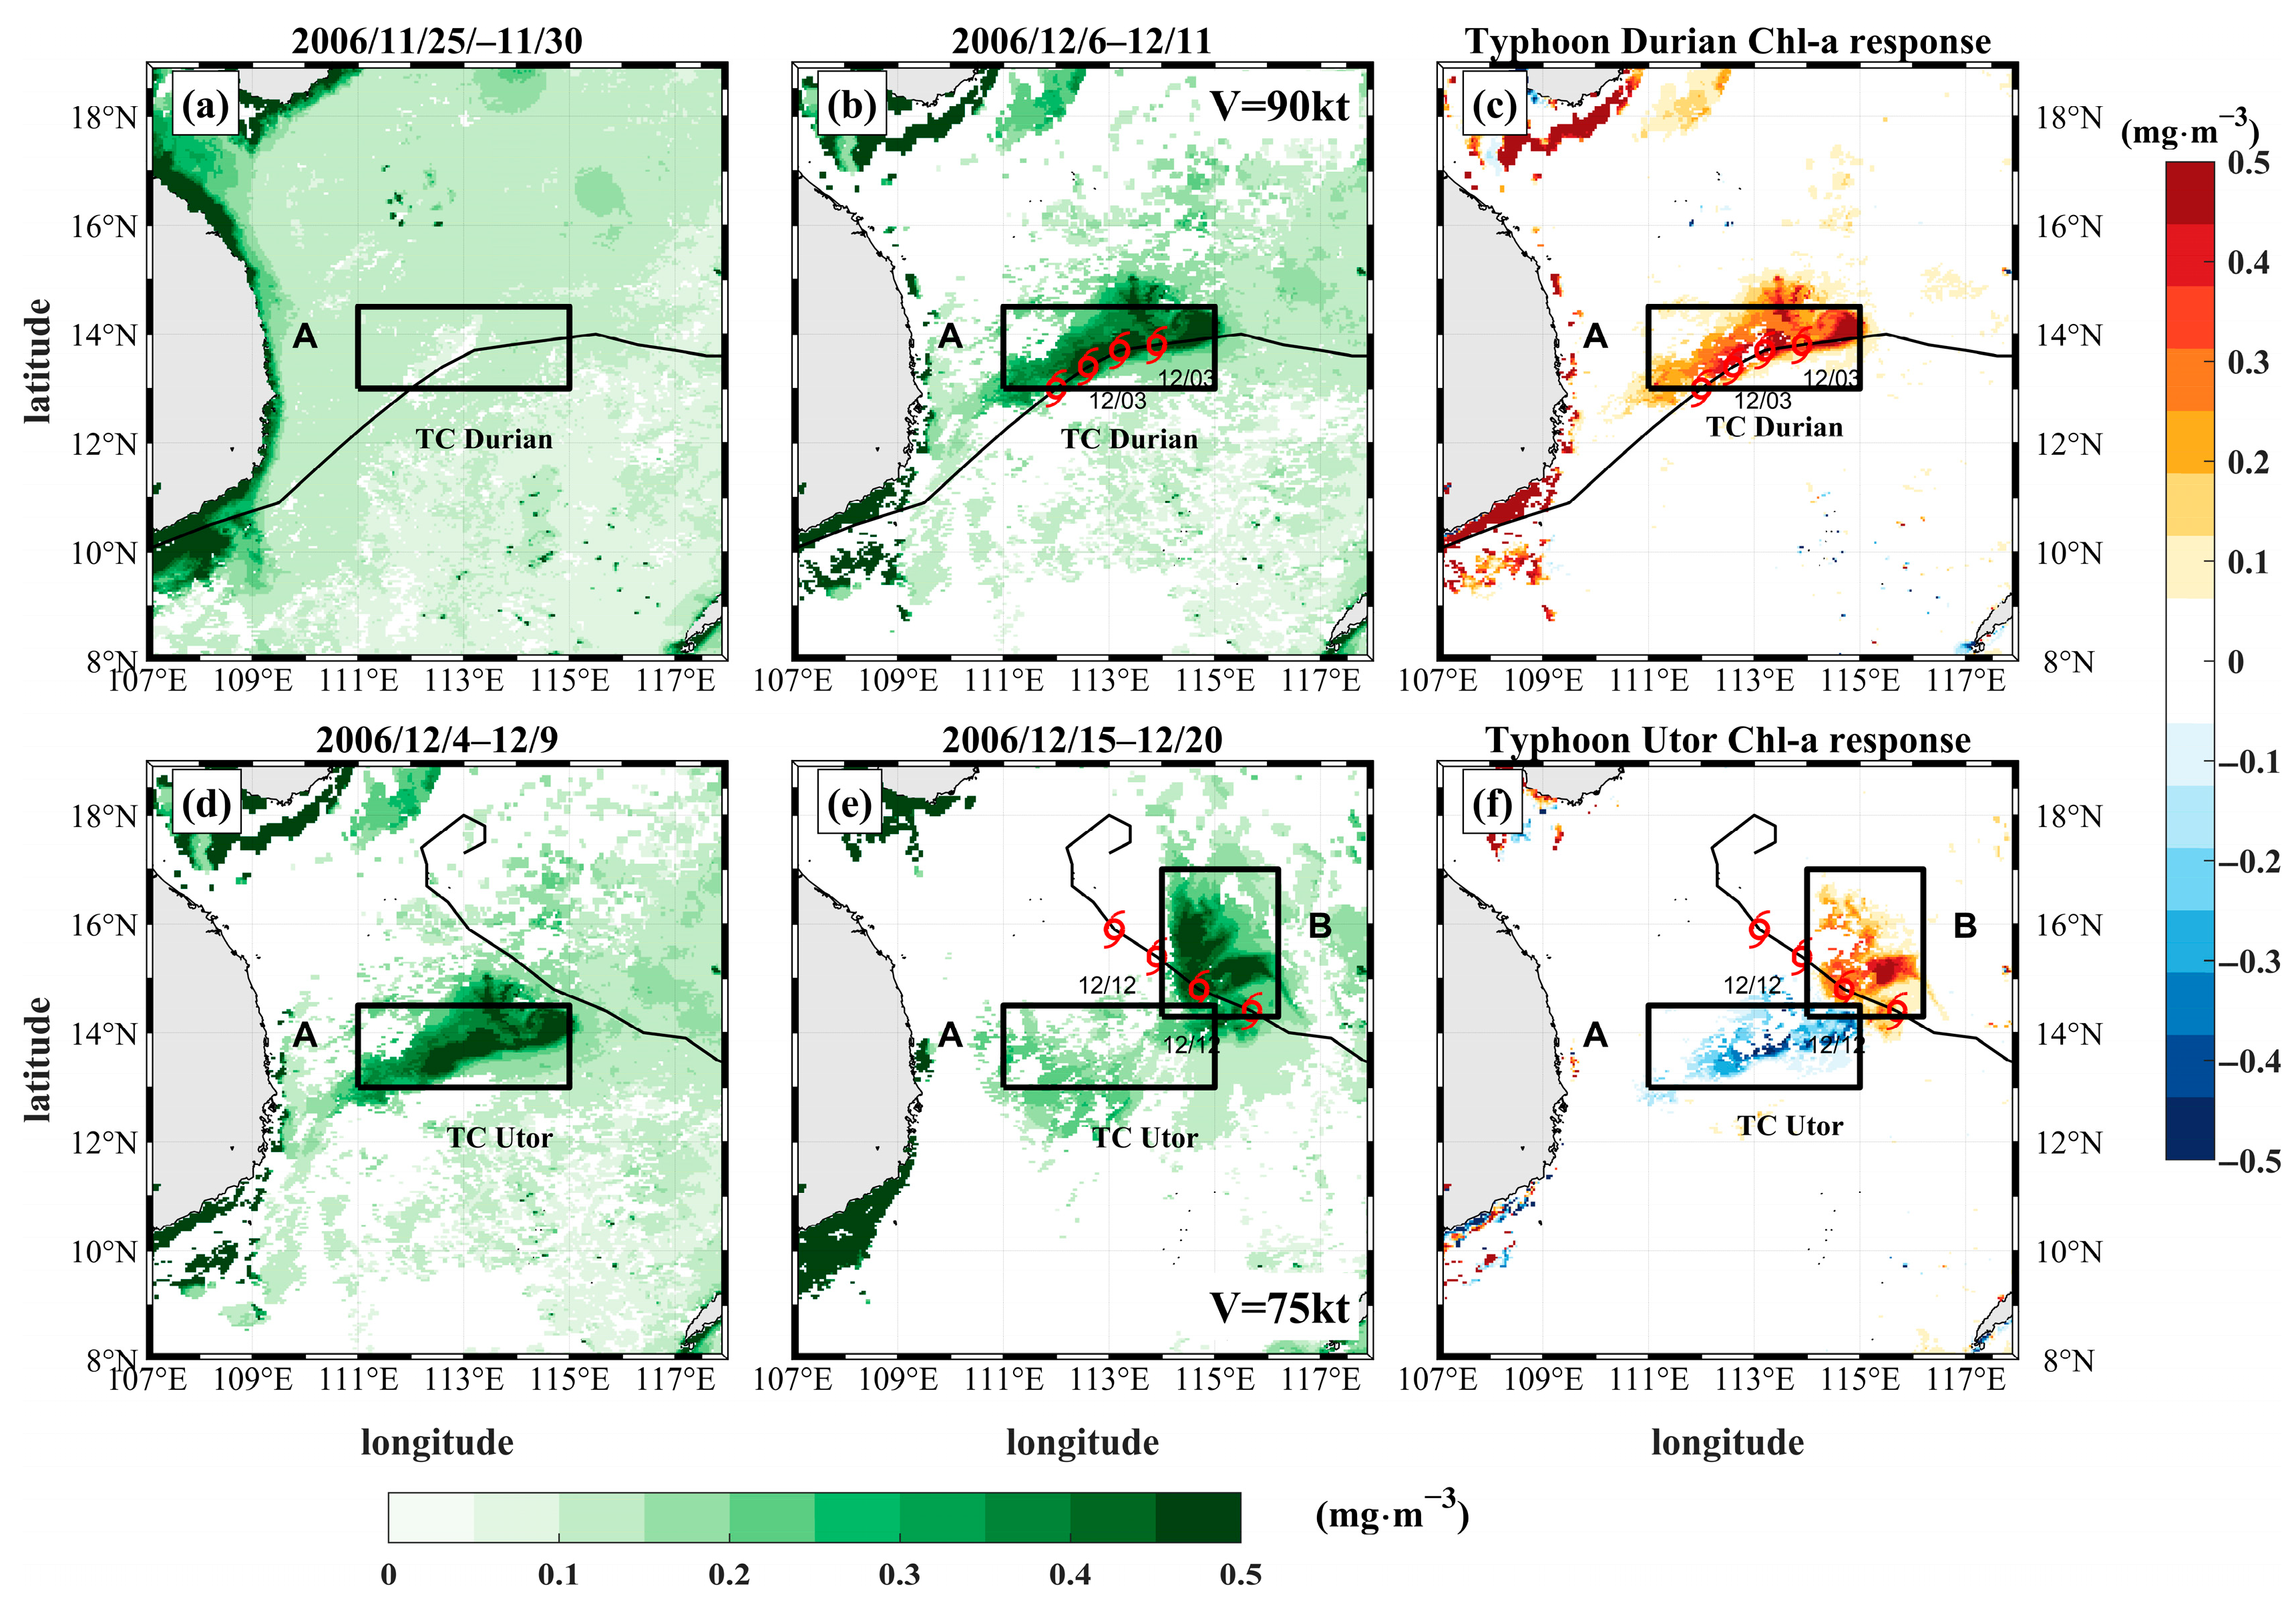
Figure 1 illustrates the distribution of chl-
a response before, during, and after the passage of Typhoon Durian and Typhoon Utor. The results showed that the chl-
a concentration in the study area was small before the passage of Typhoon Durian, which was about 0.2 mg/m
3. On December 3, the typhoon intensity was 90 knots and caused a rapid increase in chl-
a (
Figure 1b). The difference in
Figure 1c shows that the strongest increase in chl-
a in Region A was over 0.3 mg/m
3. The strong response was mainly distributed on the right side of the typhoon, which is consistent with previous results that found a rightward bias in the typhoon-induced ocean response [
6]. Typhoon Utor affected Region A on December 12, eight days after Typhoon Durian passed, when Typhoon Utor was 75 knots strong and triggered a decrease in chl-
a concentration of more than 0.2 mg/m
3. Typhoon Utor induced an increase in chl-
a of 0.3 mg/m
3 in Region B, which was on the right side of the Typhoon Utor path and was not affected by Typhoon Durian.
The time series of chl-
a in Region A and Region B are presented in
Figure 2, and the results show that the chl-
a concentrations in both Region A ang Region B were low from 3 to 8 days before the passage of Typhoon Durian. The chl-
a concentration in Region A increased rapidly from after the passage of Typhoon Durian and peaked at about 0.5 mg/m
3 on the 7th day after the passage of the typhoon and then started to decline. Typhoon Utor impacted Region A on December 12 and did not cause an increase in chl-
a in Region A. At this time, Region A was still in the relaxation stage of Typhoon Durian, which led to the decrease in chl-
a caused by Typhoon Utor in Region A. In Region B, chl-
a concentrations remained persistently low before the Typhoon Utor pass and started to increase rapidly after the typhoon, peaking at approximately 0.36 mg/m
3 on the 6th day, which was an increase of 0.2 mg/m
3 in chl-
a compared with that before the typhoon. This is consistent with the results in
Figure 1, where there is a significant difference between the chl-
a response induced by Typhoon Utor in Region A and Region B.
4. Discussion
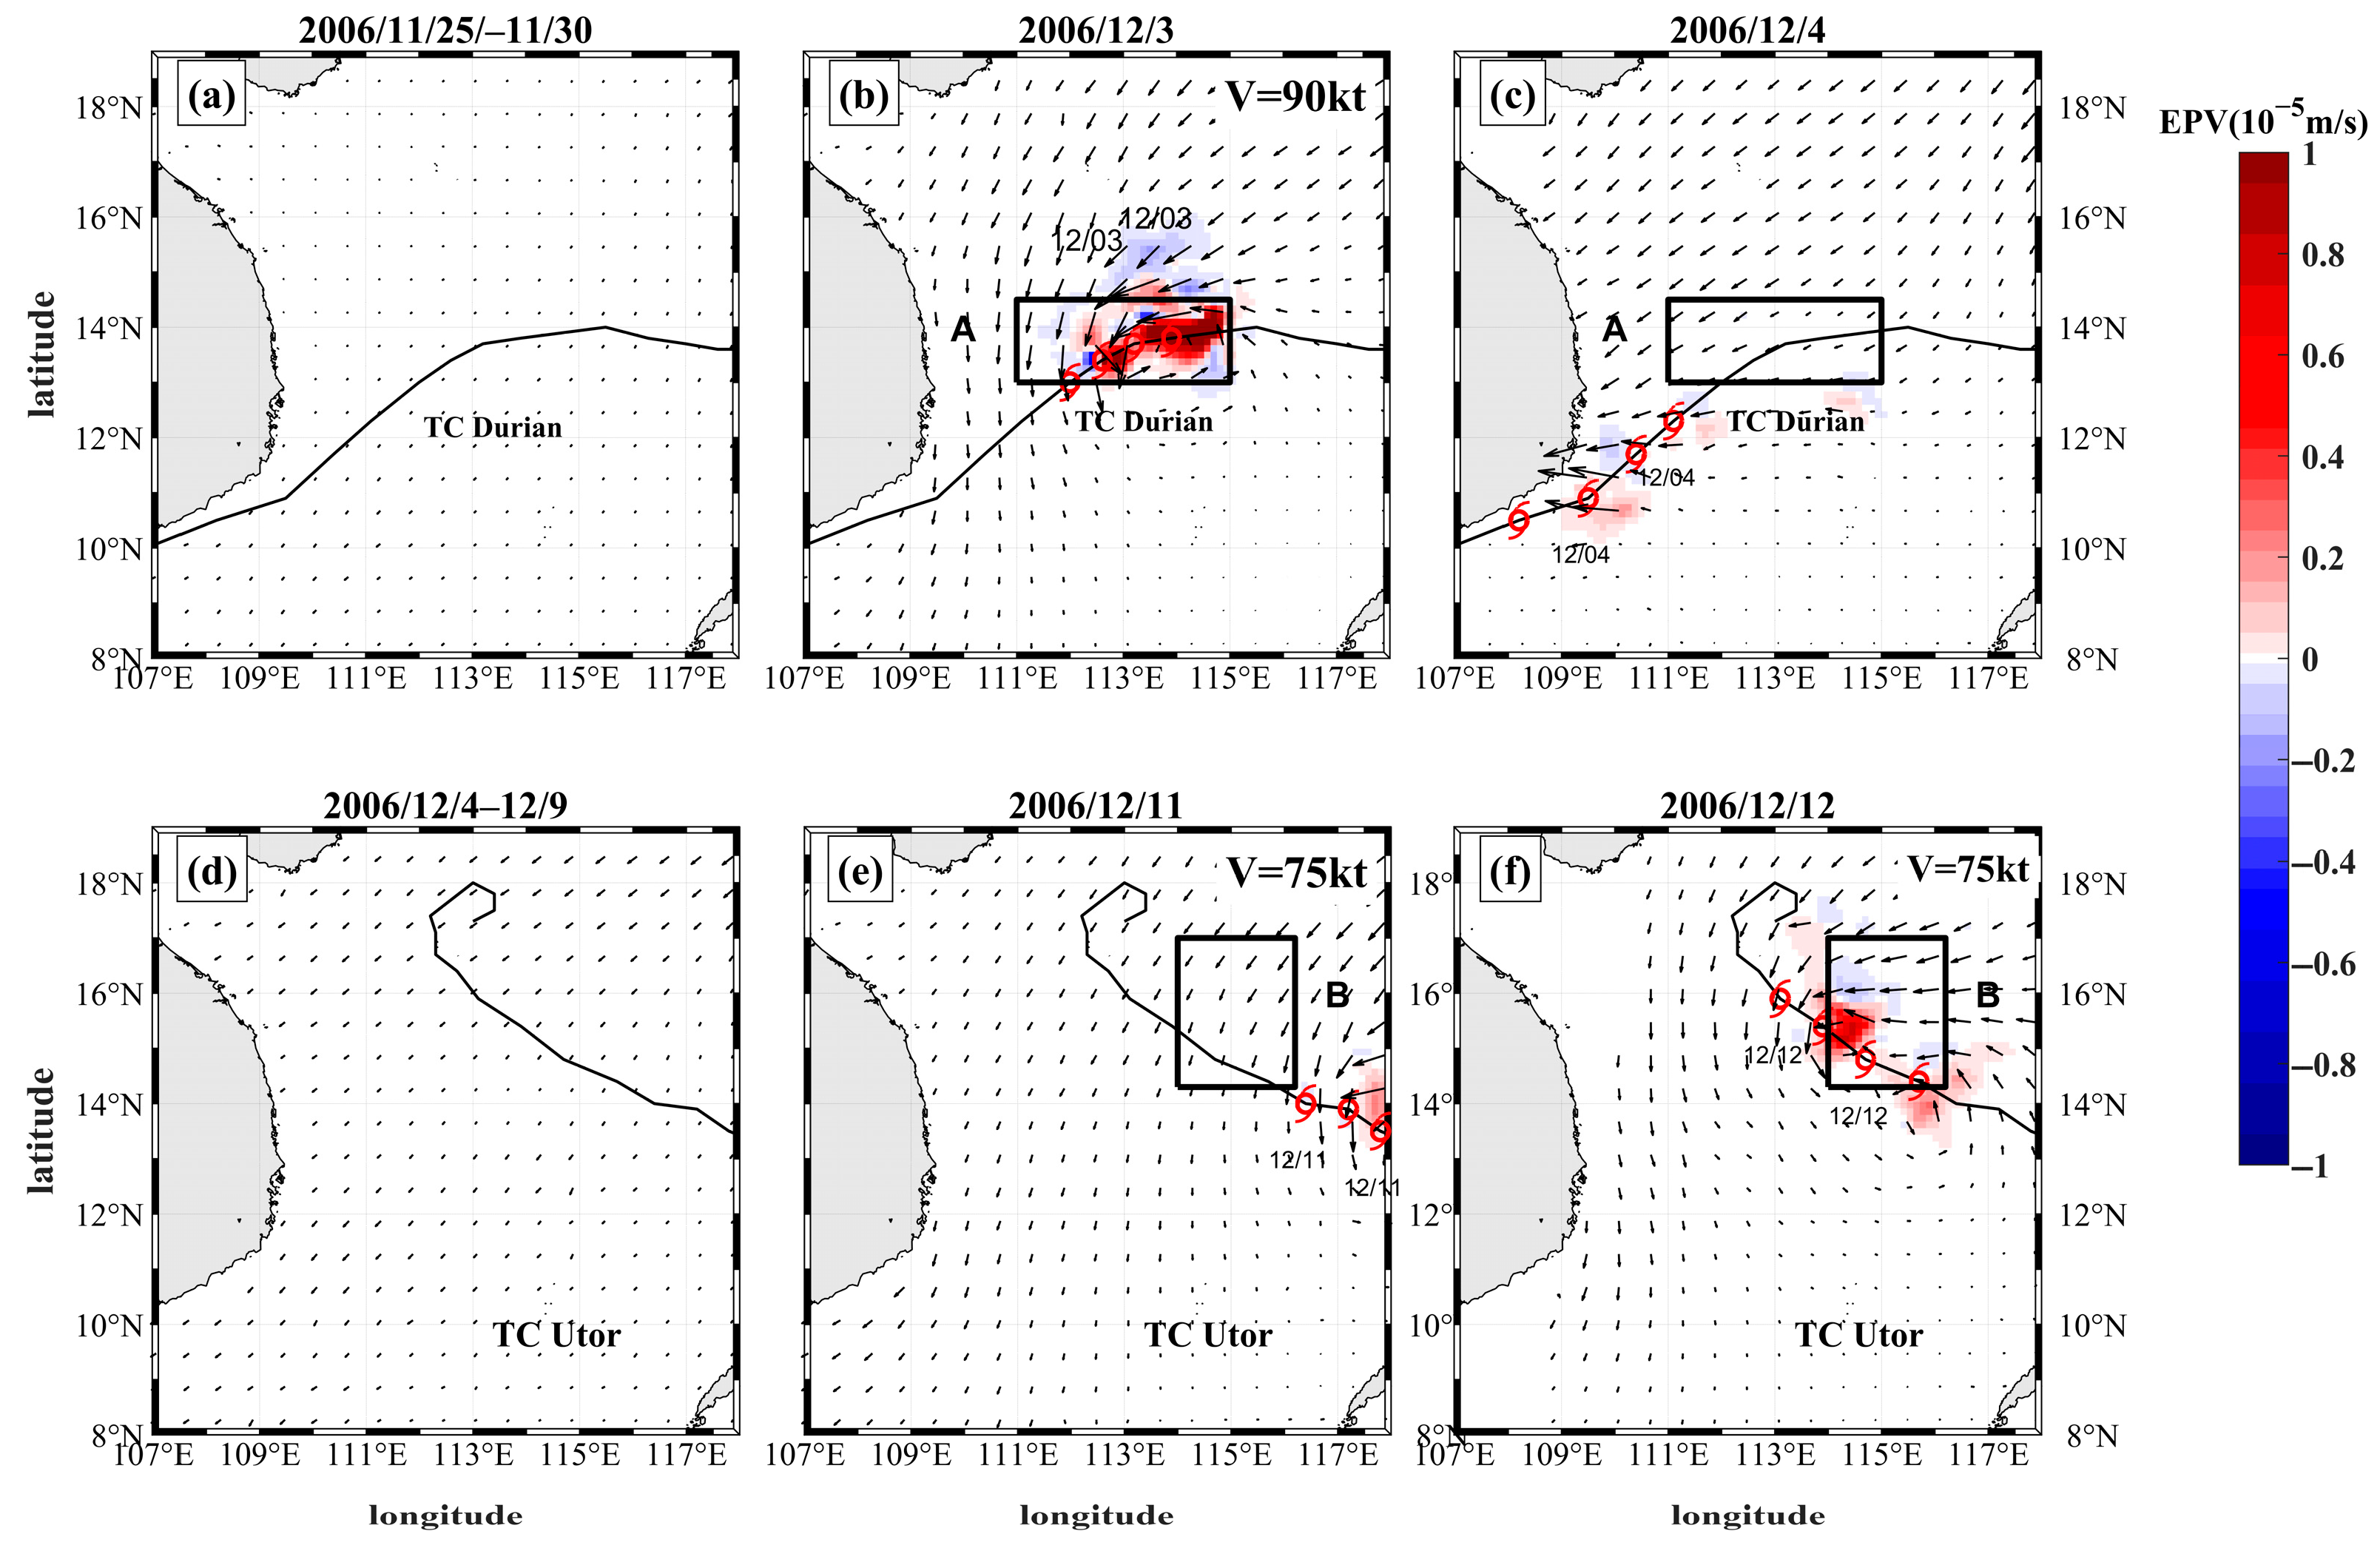
To explore how Typhoon Durian affected the chl-
a response of the succeeding Typhoon Utor, the wind field distributions of the two typhoons as well as the induced EPV responses were analyzed, and the results are shown in
Figure 3. The moments that caused a strong chl-
a response (3 December and 12 December) were taken as the typhoon transit times, and the spatial distribution of the mean EPV superimposed wind field before and after the typhoon passage was mapped.
Figure 3 presents the spatial distributions of EPV induced by Typhoon Durian and Utor during their respective pre-transit and post-transit periods. The results show low wind speeds and no upwelling areas in the study area prior to the passage of Typhoon Durian. On December 3, the typhoon had an intensity of 90 knots and induced a strong upwelling of about 1 × 10
−5 m/s or more in Region A (
Figure 3b).
Figure 3c shows that by 4 December (one day after the typhoon’s passage), the storm had moved out of Region A, resulting in no significant upwelling. Typhoon Utor affected the study area on December 12, following an 8-day interval after Typhoon Durian’s transit. In this stage, Typhoon Utor maintained an intensity of 75 knots, generating strong upwelling in Region B (
Figure 3f) with EPV exceeding 0.8 × 10
−5 m/s. Prior to Typhoon Utor’s passage, including on December 11 (one day before transit), no significant upwelling was observed in the study region (
Figure 3d,e). Typhoons Durian and Utor generated upwelling through wind vorticity in Region A and B, respectively, transporting nutrient-rich subsurface waters to the sea surface and leading to an increase in chl-
a.
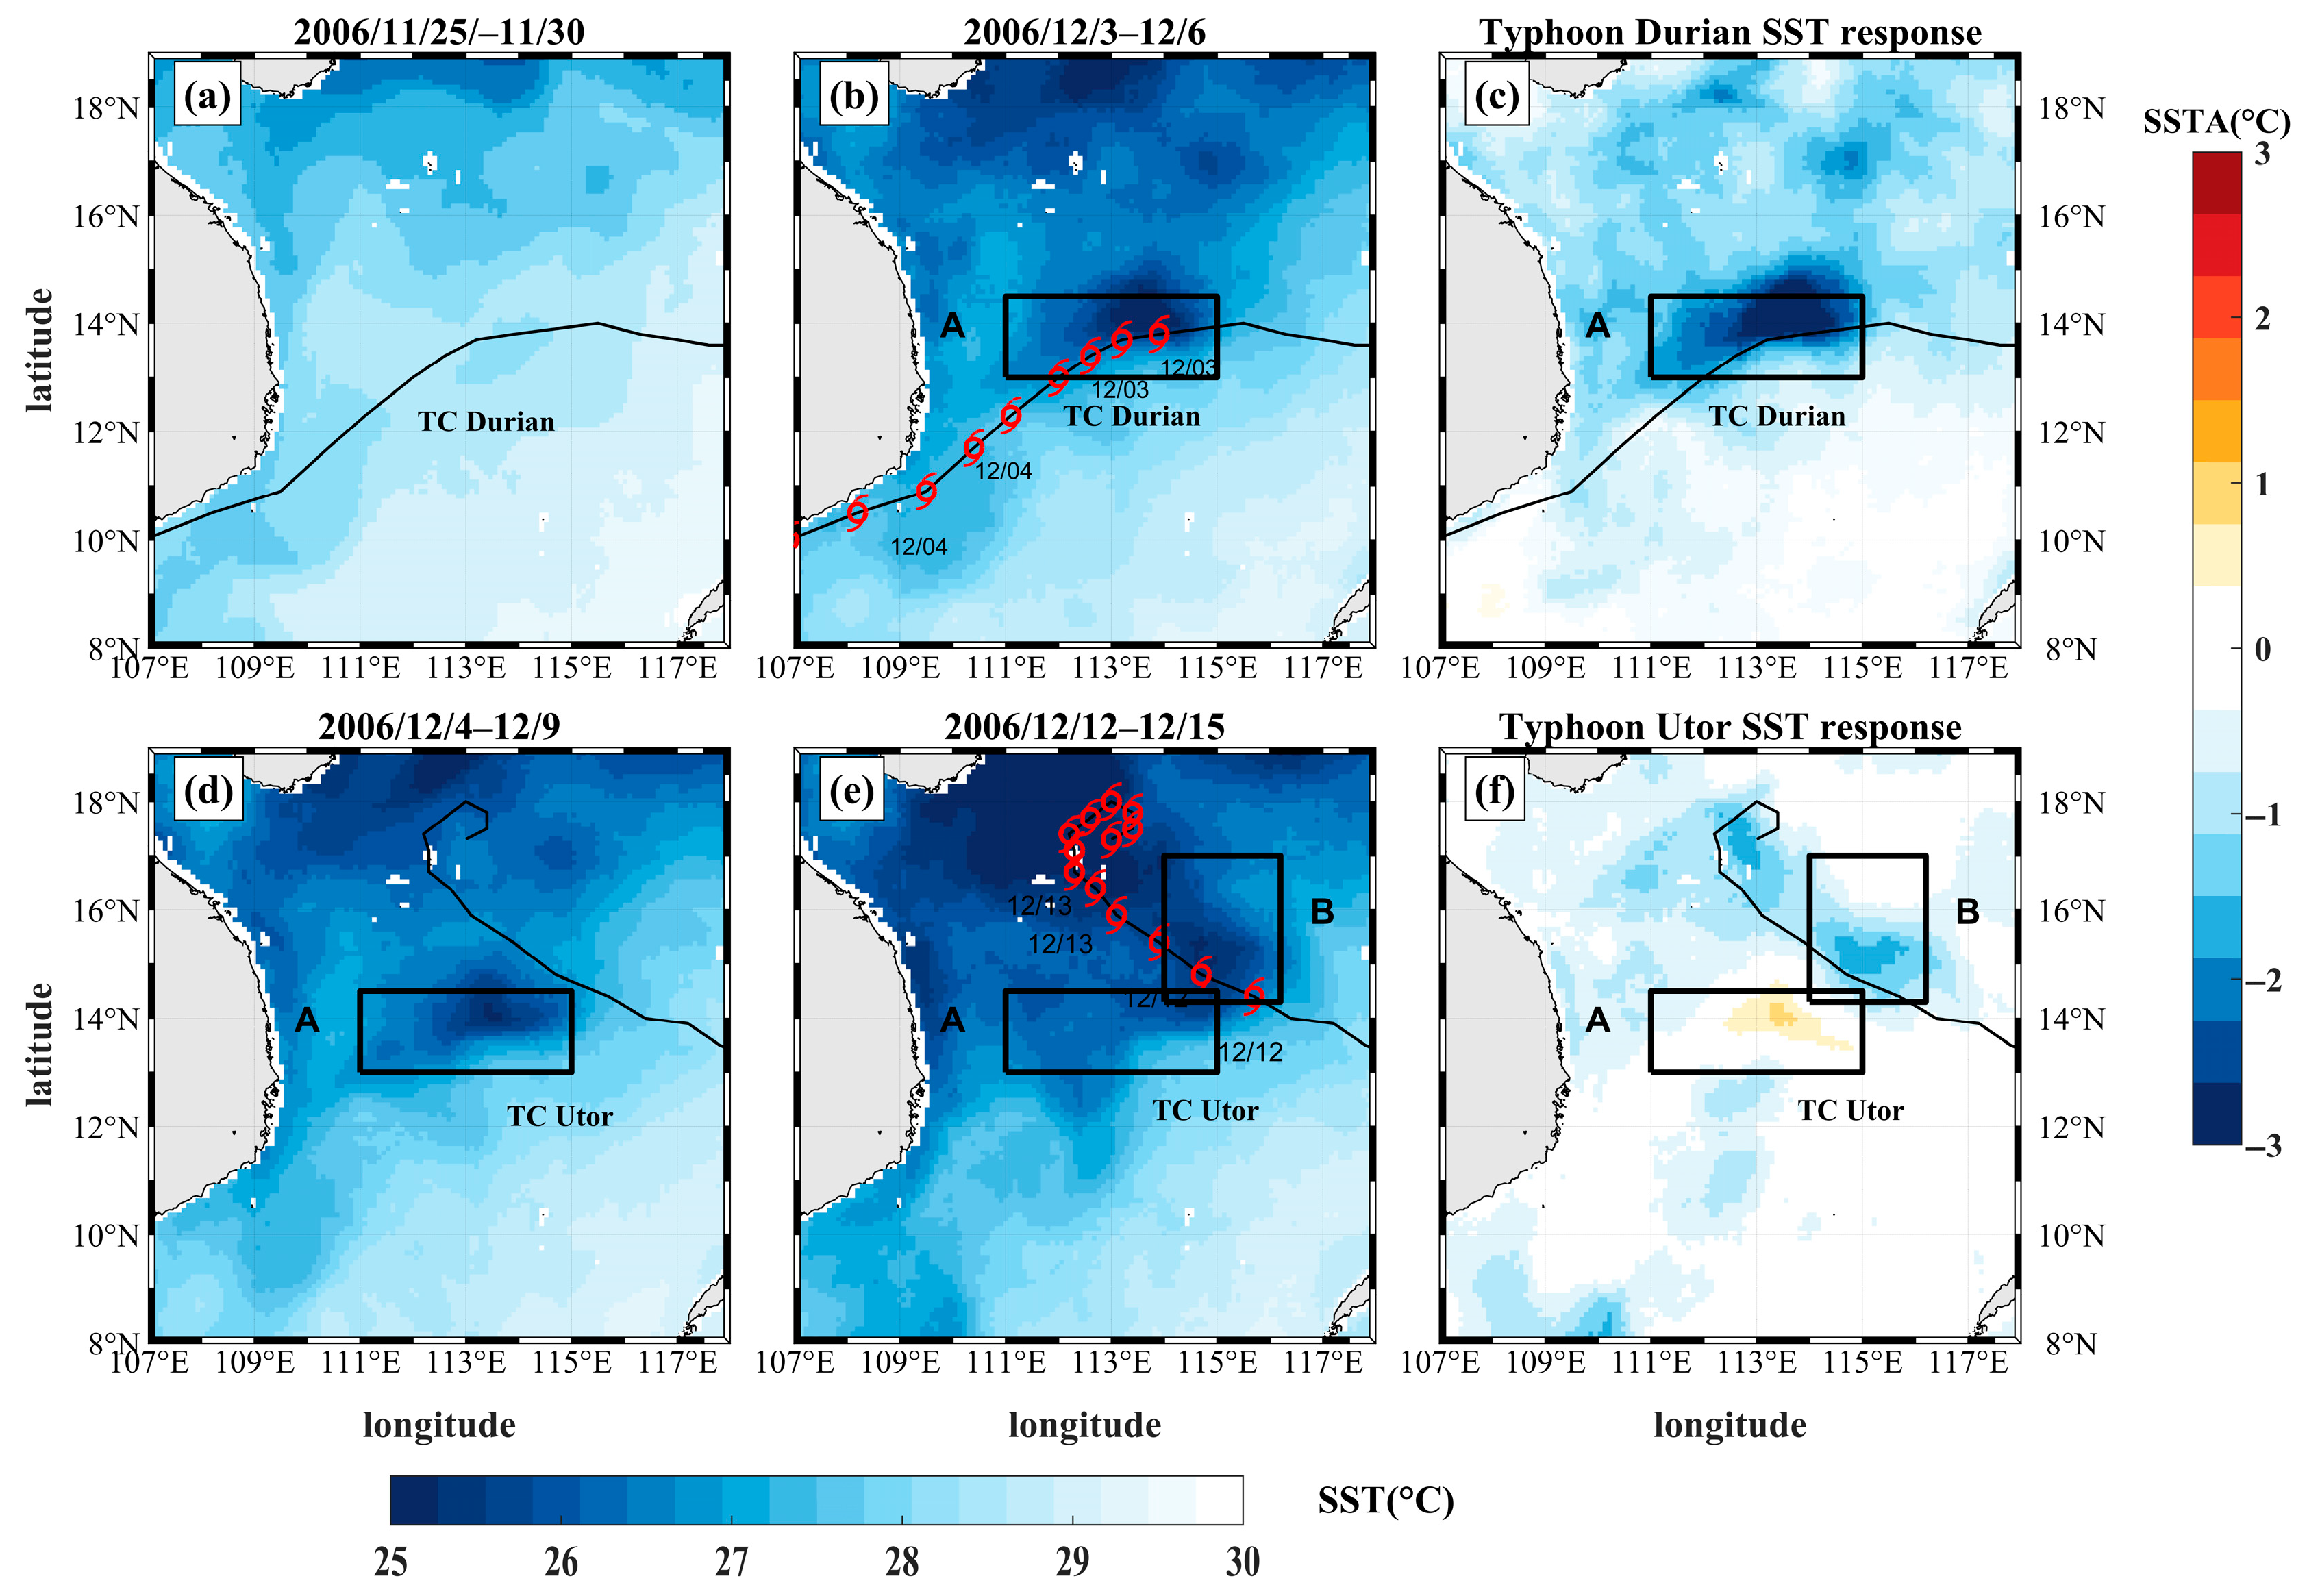
In addition to Ekman pumping, the strong winds of typhoons can cause strong vertical mixing.
Figure 4 presents the SST distributions and SST responses induced by Typhoons Durian and Utor. The results demonstrate that temperatures near the typhoon track averaging approximately 28 °C. After Typhoon Durian’s passage, the central region experienced substantial SST cooling exceeding 2 °C (
Figure 4c). Notably, the region to the right of the track showed stronger cooling than the left side, with the most pronounced SST reductions spatially coinciding with areas of significant chl-
a response and elevated EPV. Prior to Typhoon Utor’s passage, a low-SST anomaly persisted in the region to the left of the track (Region A) during the relaxation stage of Typhoon Durian and resulted in an SST increase of approximately 0.6 °C after the Typhoon Utor pass. Conversely, in Region B, an SST decrease of approximately 1.5 °C occurred, accompanied by increased chl-
a concentrations. The SST response patterns following the successive typhoon transits reveal that the ocean response to Typhoon Utor was modulated by the previous Typhoon Durian.
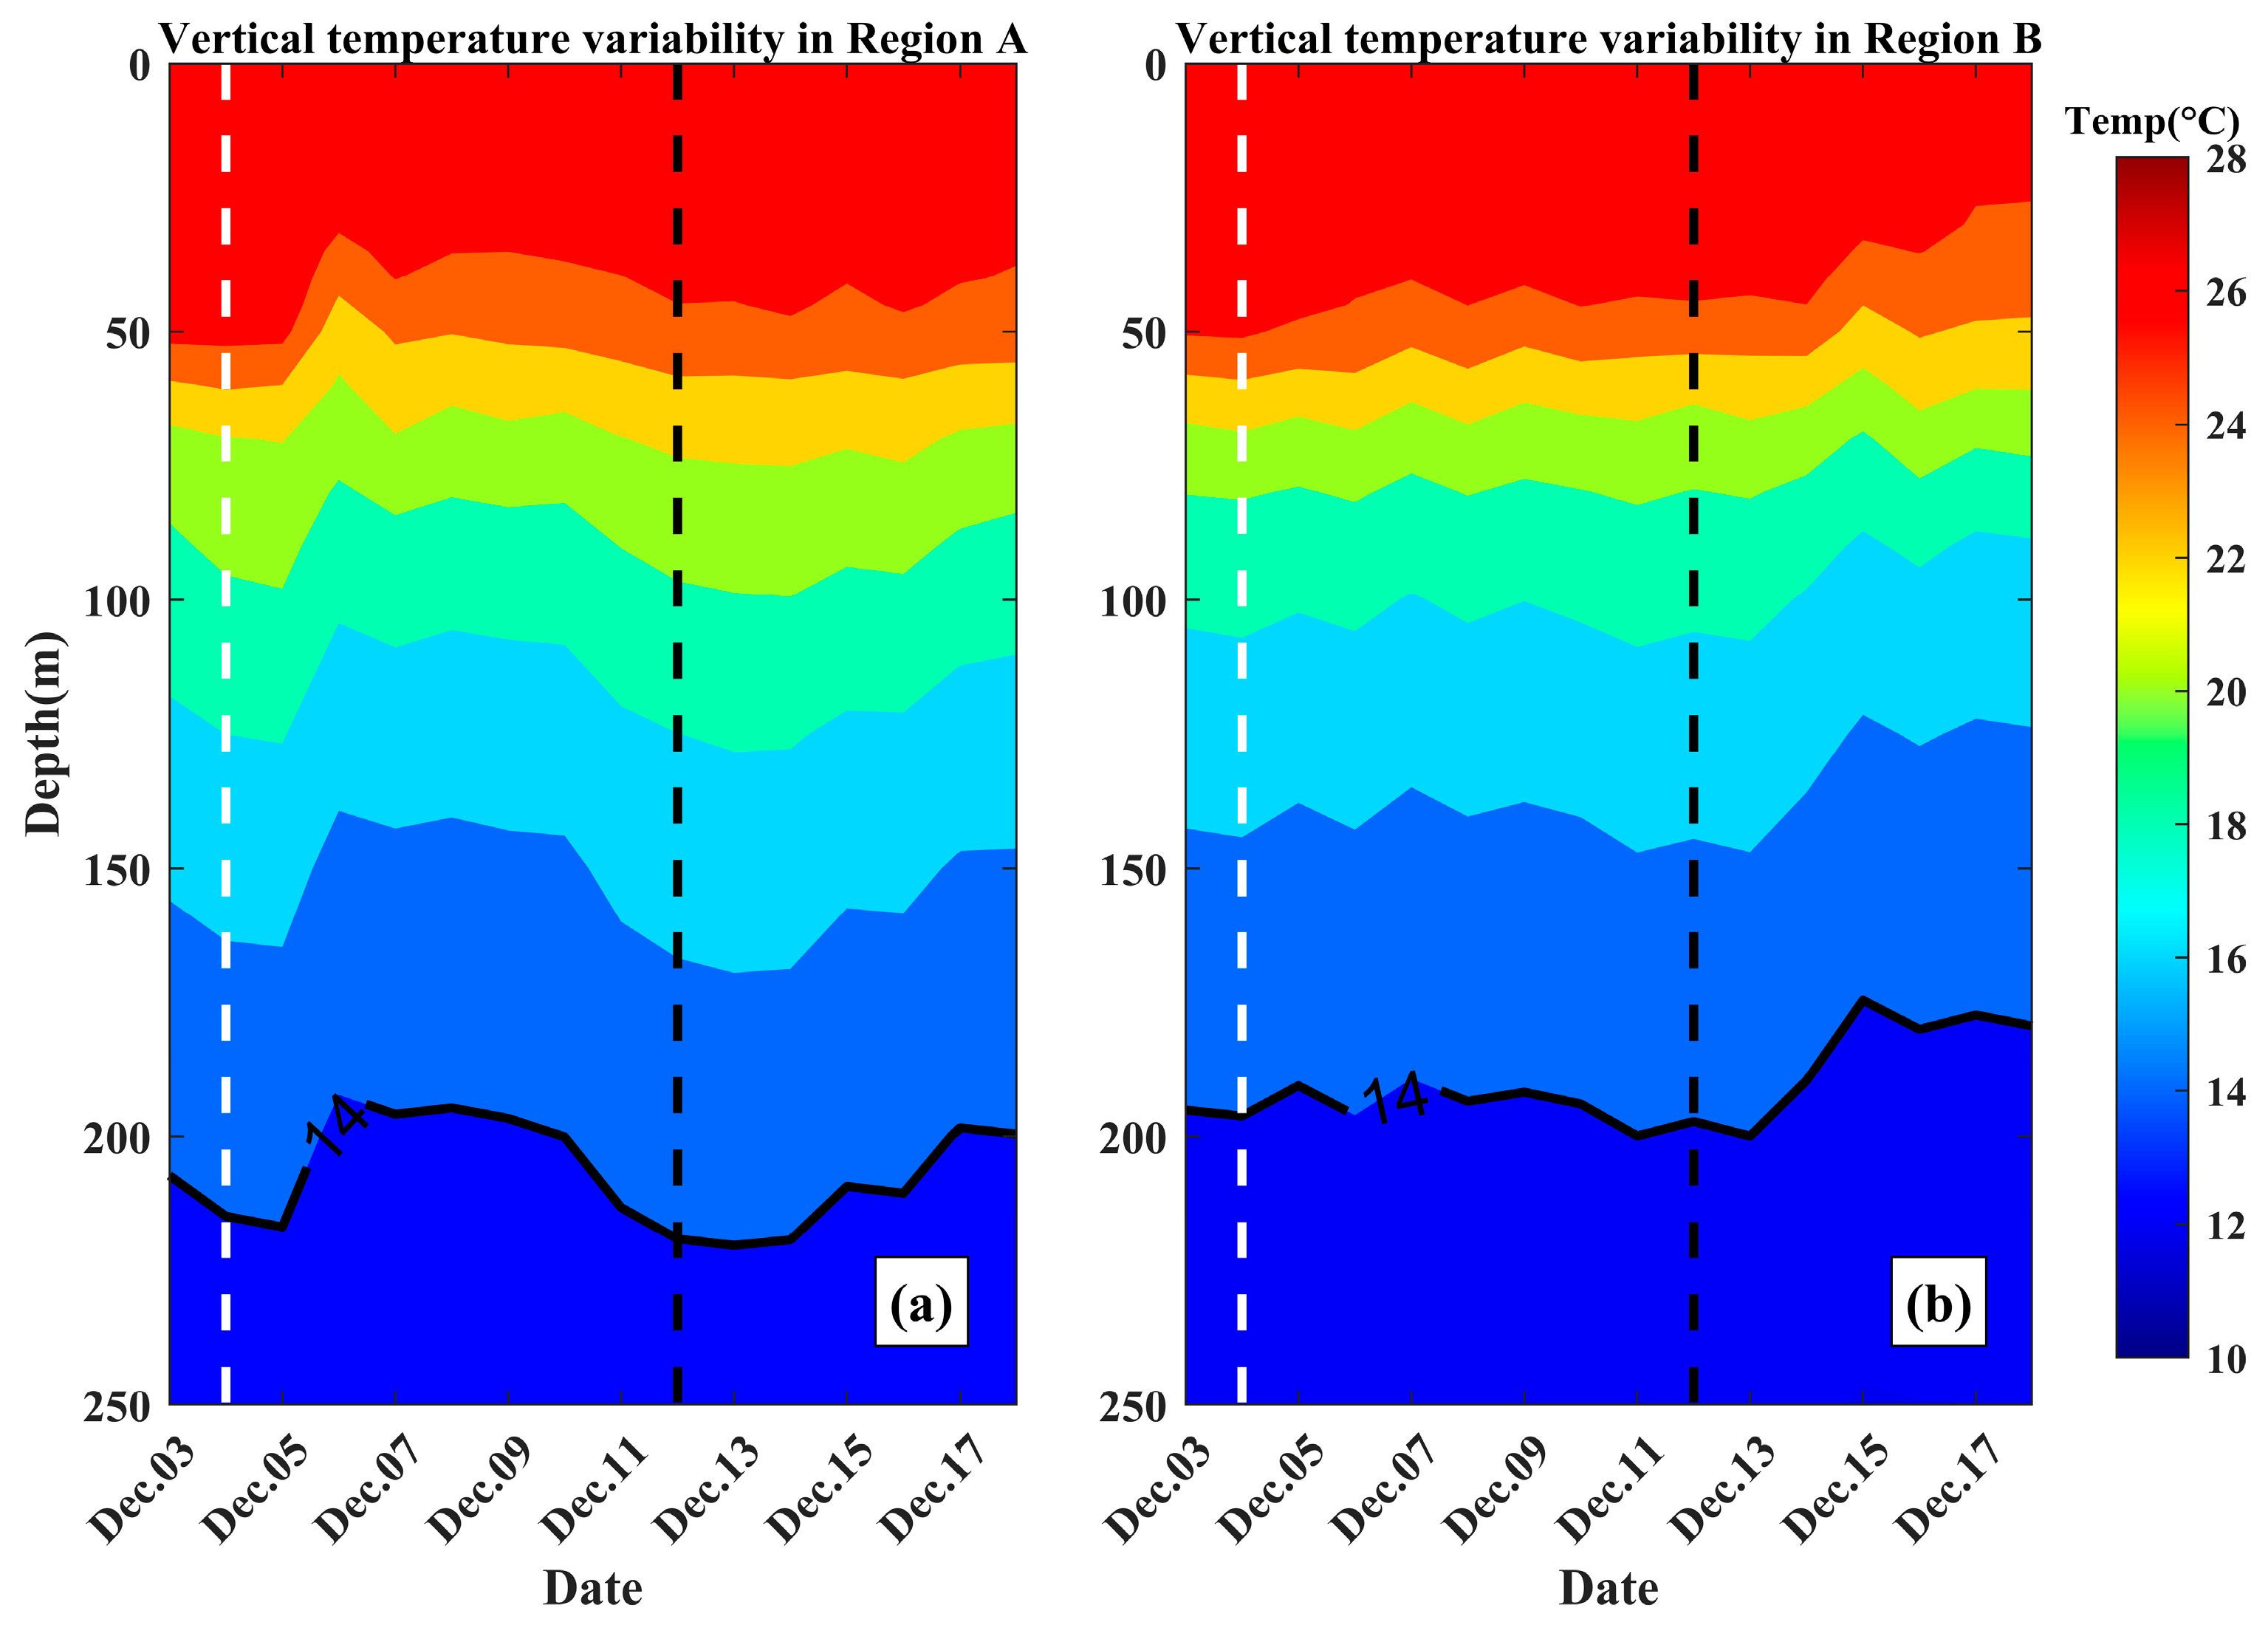
Figure 5 displays the temporal evolution of depth-averaged temperature in Regions A and B from December 3 to December 18. Following Typhoon Durian’s passage, the 14 °C isotherm lifted from 220 m to 200 m, indicating a strong upwelling. The uplift of colder deep waters induced by Durian’s wind forcing caused pronounced Ekman pumping on December 5 (
Figure 5a). During the Typhoon Utor pass, there was no significant change in the 14 °C isotherm, which means that no intense upwelling was observed in Region A. However, in Region B, Typhoon Utor induced the significant uplift of the 14 °C isotherm from 200 m to 175 m, indicating intense upwelling activity. Overall, Typhoon Durian triggered strong upwelling in Region A, whereas Typhoon Utor failed to generate significant upwelling in Region A but induced intense upwelling in Region B, which also coincided with the chl-
a responses induced by the two typhoons in Regions A and B.
Figure 6 displays the temporal evolution of depth-averaged KE in Regions A and B from 4 to 18 December 2006. From December 4 to 6, following Typhoon Durian’s passage, KE in both Regions A and B reached maximum values exceeding 0.3
J/m
3. Significant KE increases occurred in the surface layers (0–54 m depth). The strong vertical gradient of KE indicates strong vertical mixing in these layers. After the Typhoon Utor pass on 12 December, KE in the surface of Region A remained nearly unchanged, which means that no vertical mixing was triggered by Typhoon Utor in Region A. There was no mixing and no significant upwelling, which explains why Typhoon Utor did not induce a significant chl-
a response in Region A. Differently to Region A, the typhoon caused significant KE increases in Region B. Although Typhoon Durian, due to its extensive wind field (the radius of 34 knots was 91.2 nmi) also induced a surface KE response in Region B, it did not trigger significant chl-
a enhancement in this region because it failed to generate Ekman pumping there.
Analysis of EPV, SST, and KE responses to successive typhoons reveal that during Typhoon Durian’s impact on Region A, upwelling and vertical mixing drove SST cooling and may have caused an increase in chl-
a concentrations by bringing nutrients to the surface layer. As Typhoon Durian moved away, when Typhoon Utor affected the same sea area eight days later, the SST and chl-
a concentration responses induced by Typhoon Durian had not recovered yet. Consequently, Typhoon Utor ultimately caused an increase in SST and a decrease in chl-
a concentration in Region A. In Region B, which was not affected by Typhoon Durian, a cooling in SST and a rise in chl-
a concentration were triggered by Typhoon Utor. This was probably due to the change in the ocean environment in the overlapping region caused by the previous typhoon. In a study of successive typhoons, Huang et al. [
23] found that the deepening of the mixed layer caused by the previous typhoon prevented deeper nutrient-rich cold water from entering into the upper mixed layer, which created an unfavorable preconditions for the chl-
a response triggered by next typhoon. Due to the modulation of the oceanic environment by the preceding Typhoon Durian, Typhoon Utor induced significantly different SST and chl-
a responses on its left and right sides.


