Article

A Tombolo Alternating Between a Double Tombolo and a Salient on the West Coast of Honghai Bay, Guangdong, China, Driven by Dynamic Fluvial and Coastal Interactions

1
School of Ocean Engineering and Technology, Sun Yat-sen University, Zhuhai 519082, China
2
Geographic School, South China Normal University, Guangzhou 510631, China
*
Author to whom correspondence should be addressed.
Water 2025, 17(10), 1510; https://doi.org/10.3390/w17101510
Submission received: 3 March 2025 / Revised: 24 April 2025 / Accepted: 13 May 2025 / Published: 16 May 2025

Abstract

:
A small tombolo on the west coast of Guangdong’s Honghai Bay was investigated using over a decade of satellite imagery. Occasionally, this stream forms a lagoon behind the island, giving the appearance of a double tombolo. However, analysis of satellite imagery reveals that the double tombolo was not consistently formed and that the tombolo tip was not always attached to the leeward side of the island. This suggests that the tombolo was in a transitional state between the formation of a tombolo and a salient. The beaches on both sides of the tombolo are headland-bay beaches. Therefore, MEPBAY and XBeach, coupled with grain size analysis, were utilized to investigate the dynamic geomorphological processes of the tombolo. This study shows that the headlands at both ends of the beaches, along with waves approaching perpendicular to the shore, inhibit longshore drift on either side of the tombolo. The sediment sustaining the tombolo originates from the stream sands and offshore sands transported onshore by waves. When wave-driven sediment transport exceeds stream sediment supply, a tombolo forms. Conversely, only a salient develops. This specific case study reveals previously undocumented phenomena, thereby offering valuable insights into the mechanisms of double tombolo formation.

1. Introduction

The term “tombolo(s)” originates from the Latin word *tumulus*, which means “pillow” or “cushion”. Other synonyms for the term “tombolo” include “tied island”, “tie bars”, and “tying bars” [1]. There are various tombolo types. The most common type of tombolo is the one that connects the mainland to an island. Tombolos can also connect two or more islands (island-to-island) [2,3]. When a lagoon exists between two tombolos, these complex structures are referred to as double tombolos. Even more complex configurations exist, such as triple tombolos. The Giens tombolo in France, the Calpe rock tombolo on the Levant coast [4], and the Gibraltar isthmus tombolo [5,6] serve as typical examples of double tombolos [7,8], while the Orbetello tombolo in Italy represents a typical example of a triple tombolo [9]. Although tombolos are relatively less common compared to other classical forms of coastal deposition, the processes underlying their formation are analogous to those observed in the development of spits, bars, and barrier islands [10,11,12].
Tombolos, formed by wave refraction or diffraction [13,14], create a convergence of opposing sediment transport currents through a wave shadow area behind an island, resulting in sand accumulation, which eventually leads to a connection between the mainland and the lee side of the island [15,16,17]. It is evident that longshore drift plays a crucial role in the formation of tombolos extending from long shelving beaches. However, it is likely that many tombolos attributed to local winds blowing from either side are instead the result of onshore swell being refracted and/or diffracted around an island, with or without the influence of longshore drift [18]. Double tombolos are much less common than single tombolos, and also much less studied [19]. A double tombola is generally thought to form in areas where waves approach the flanks of an island at different angles of incidence in different seasons, resulting in seasonal changes in littoral drift [8,12,20], but they have also been reported to form by regressive barrier widening due to sea level change [8,19]. Some tombolos that formed earlier than or during the Holocene have remained stable over long periods in terms of their evolution [21], but the majority of natural tombolos are active (ephemeral) features formed, modified, and destroyed within a short time period, ranging from less than a year to a few centuries [22,23].
In the academic literature, the focus is on the formative and process-related aspects of singular tombolo geomorphology, including the complex interactions between underwater and terrestrial morphology [24]; the shape, dimensions, and proximity of the island relative to the mainland [1,14]; the availability and grain size distribution of sediments [25]; and the sea state, encompassing wave diffraction, sea level rise, and tsunamis [1,18,23,26,27]. This mechanism has a wide range of applications in coastal engineering, including the growth of a tombolo or a sandy salient behind a breakwater [15,28,29].
Tombolos along the coasts of China, including both natural tombolos and those formed behind man-made structures, have been well studied [30,31,32,33]. Nevertheless, only a limited number of previous studies have provided a detailed examination of the formation process of double tombolos in China. This paper investigates a small tombolo that alternates between forming a double tombolo and a salient on the west coast of Honghai Bay in eastern Guangdong, China. The aim of this paper is to interpret this specific case by utilizing multi-year satellite imagery, sediment grain size analysis, and two computer software programs (MEPBAY 3.0 and XBeach 1.24.6057), thereby revealing previously unrecorded phenomena and providing valuable insights into the formation mechanism of tombolo coasts.

2. Study Area

2.1. Location of the Study Site

The study area is situated along the eastern coastal margin of the Huizhou Peninsula, to the west of Honghai Bay (Figure 1). The Huarongshu tombolo (22°37′53.24′′ N, 114°55′19.07′′ E) connects Huarongshu Island to the eastern coast of the peninsula, which is situated between Honghai Bay to the east and Daya Bay to the west. Huarongshu Island is an elongated island oriented in an east–west direction, whereas the mainland’s coastline extends in a northeast–southwest direction. The northern and southern beaches of the tombolo surround a stream that flows through the tombolo from the hinterland of the peninsula, forming a lagoon behind the island (Figure 1). However, this is not always the case (see later).

2.2. Climate and Ocean Hydrology of the Study Site

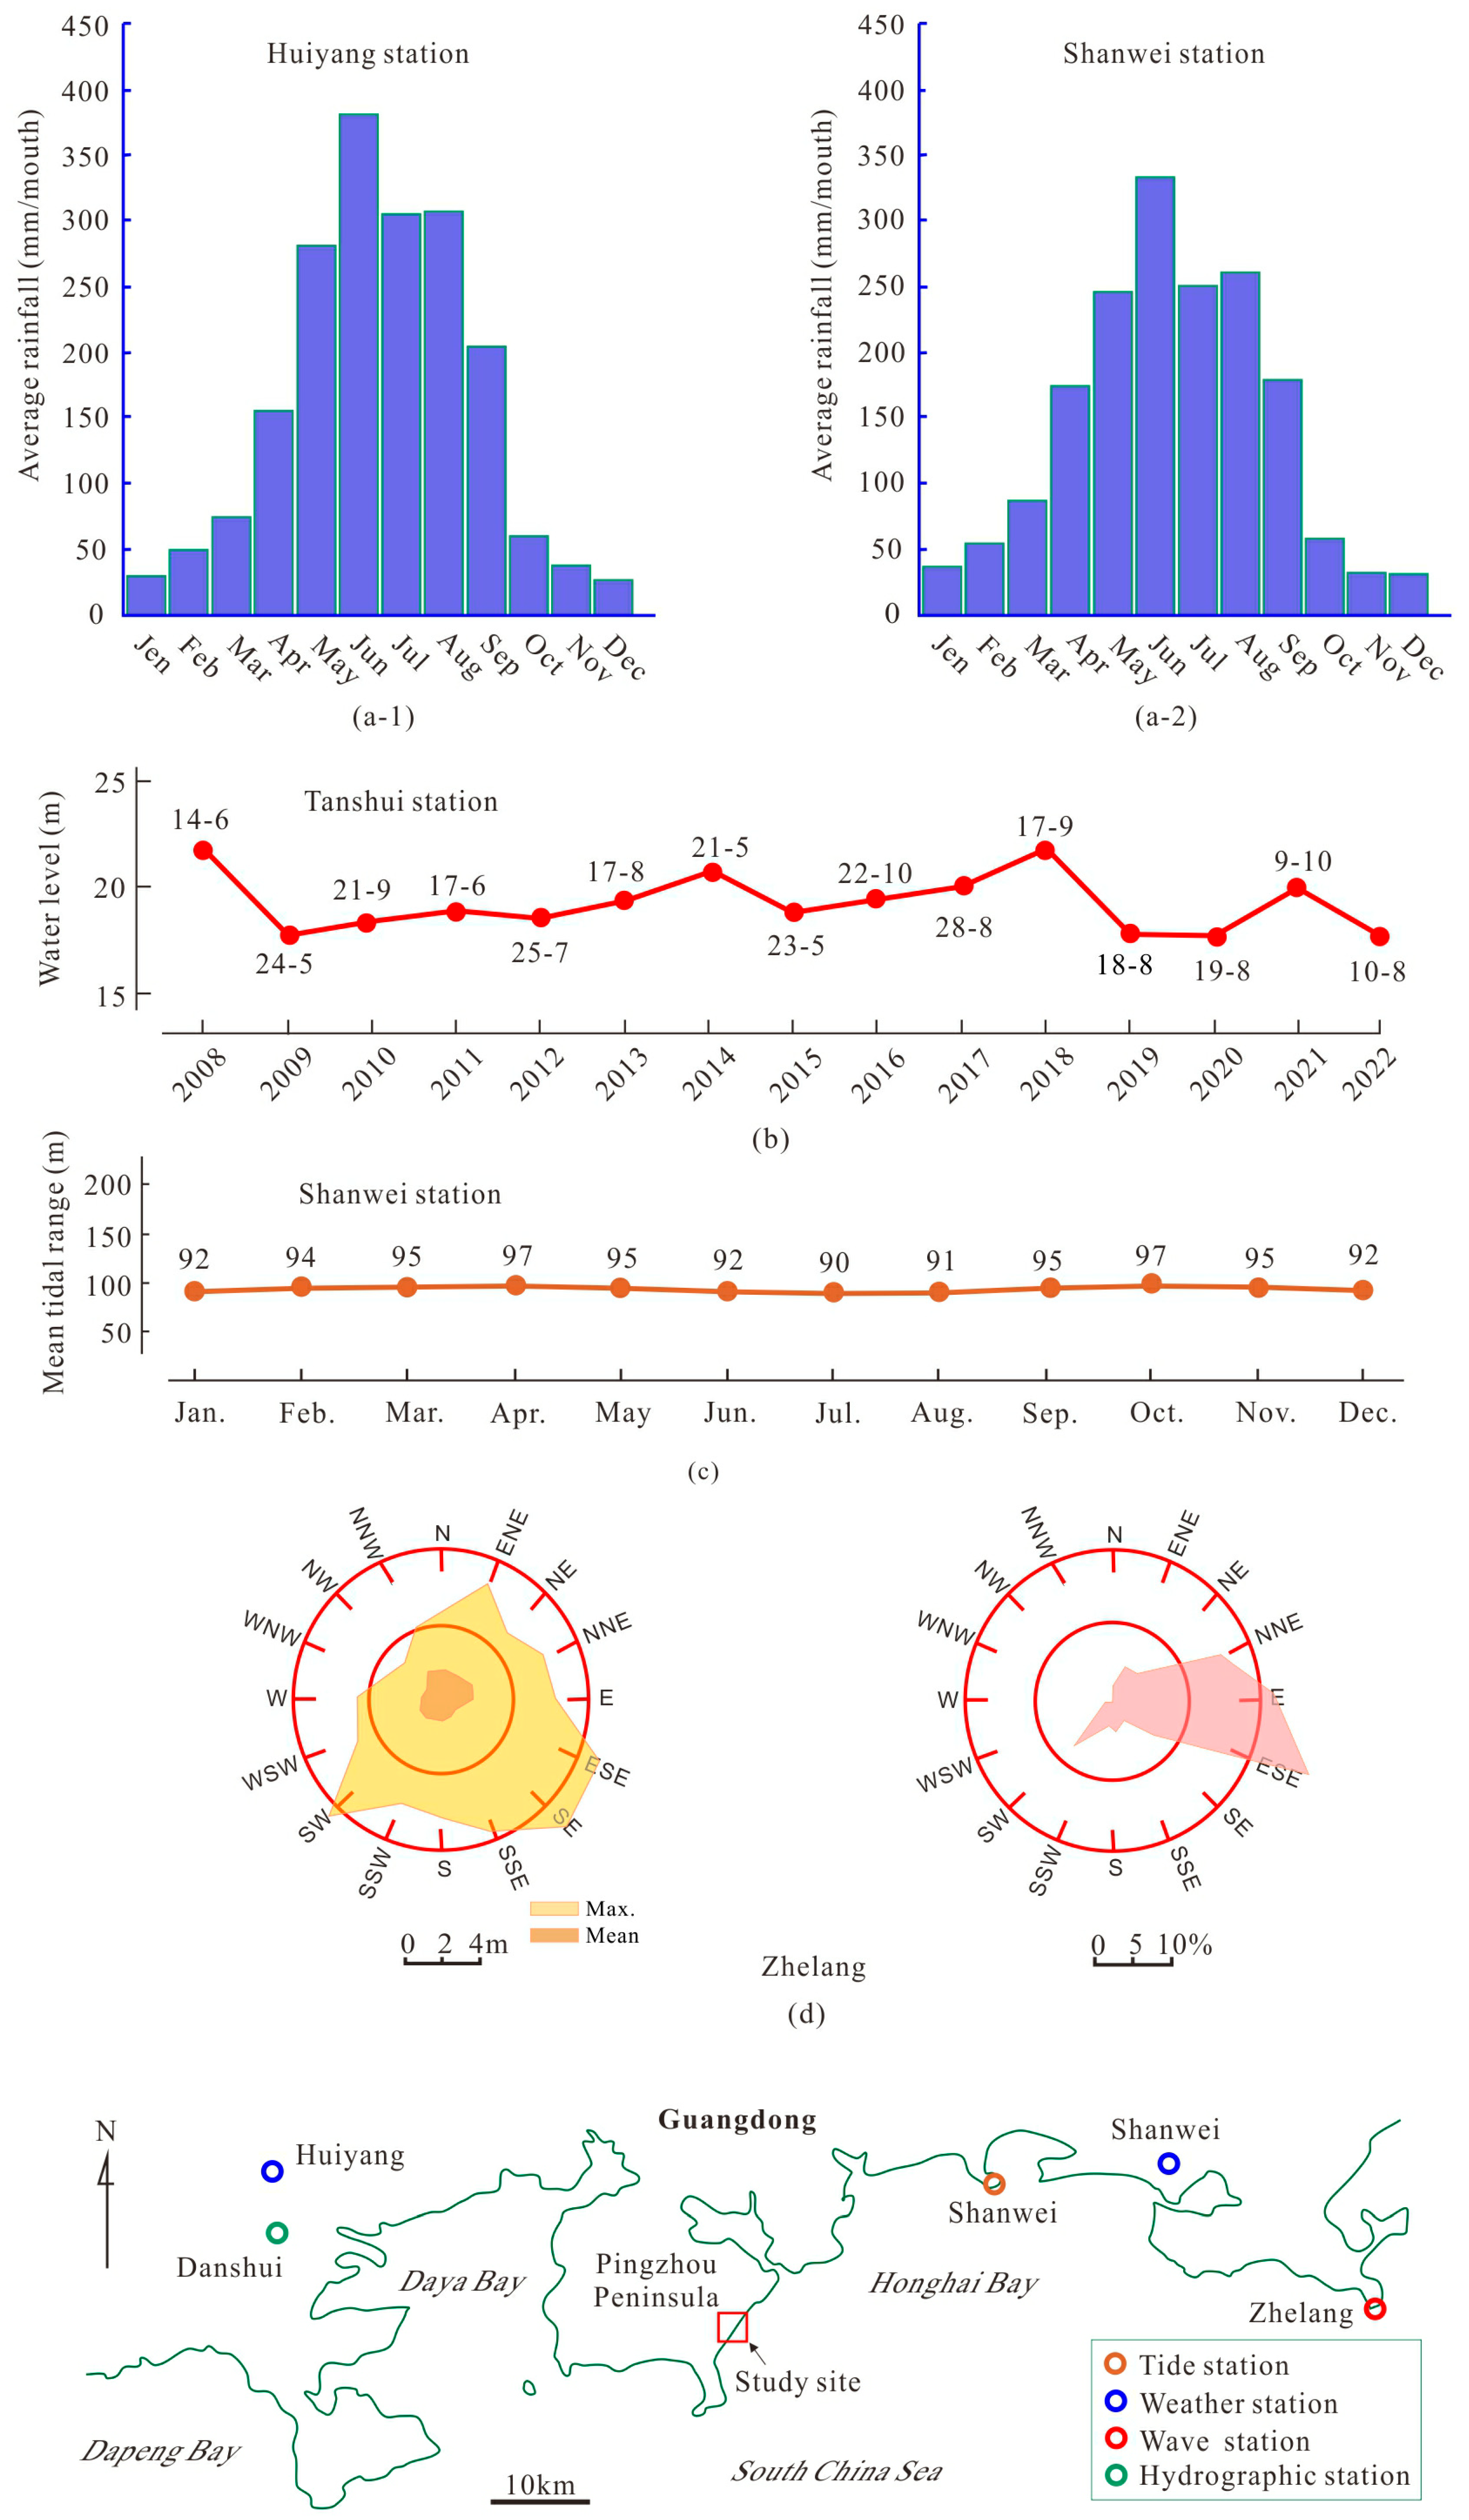
Honghai Bay, where the Huarongshu tombolo is located, has a subtropical monsoon climate with an annual rainfall of approximately 2000 mm. Eighty percent of this rainfall occurs between April and September, with the highest monthly rainfall recorded in June [34]. Figure 2(a-1,a-2) presents the monthly mean precipitation data between 1952 and 2016 for two meteorological stations located on either side of the study site. The data from both stations indicate that the highest monthly rainfall occurs in June. Runoff in these areas exhibits a consistent temporal distribution that corresponds to the precipitation patterns [34]. Figure 2b shows the annual maximum water levels recorded from 2004 to 2022 at the hydrological station closest to the study site (Danshui Station) [35]. No discharge data are available for this station.
The tide in Honghai Bay is characterized as an irregular diurnal tide. Records from Shangwei Station indicate that the average tidal range is 0.94 m (Figure 2c), the maximum tidal range is 2.58 m, and the tidal datum is 1.31 m below the local multi-year mean sea level, which is, in turn, 2.6 m lower than the Pearl River Datum [36].
The measured maximum sediment content of the water body (bottom layer) in Honghai Bay was 0.251 kg/m3, the minimum was 0.0005 kg/m3, and the average was 0.0125 kg/m3. The sediment content in April was higher than in September. The average content of the former is 0.0141 kg/m3, while that of the latter is 0.0108 kg/m3. The net sediment transport direction in April is westward (284°), while in September it is southeastward (134°).
Wave data collected from a wave station at Zhelang on the eastern coast of Honghai Bay (Figure 2d) indicate that wind waves predominate throughout the year. Specifically, NEN-ESE waves account for 63.4% of the annual wave frequency, with ESE waves comprising 27.2% and E waves comprising 20.6%. Notably, most of these waves occur during the winter months [37]. In summer, however, SW waves occur with a frequency of 7.9% due to the influence of the SW monsoon [37]. Honghai Bay has an annual average wave height of 1.3 m, which is higher than the summer half-year average (1.1 m) but lower than the winter half-year average (1.4 m). The highest recorded wave height in the bay over the years (1960–1992) was 9.5 m, typically occurring in September as a result of typhoons [37].

2.3. Geological and Geomorphological Setting

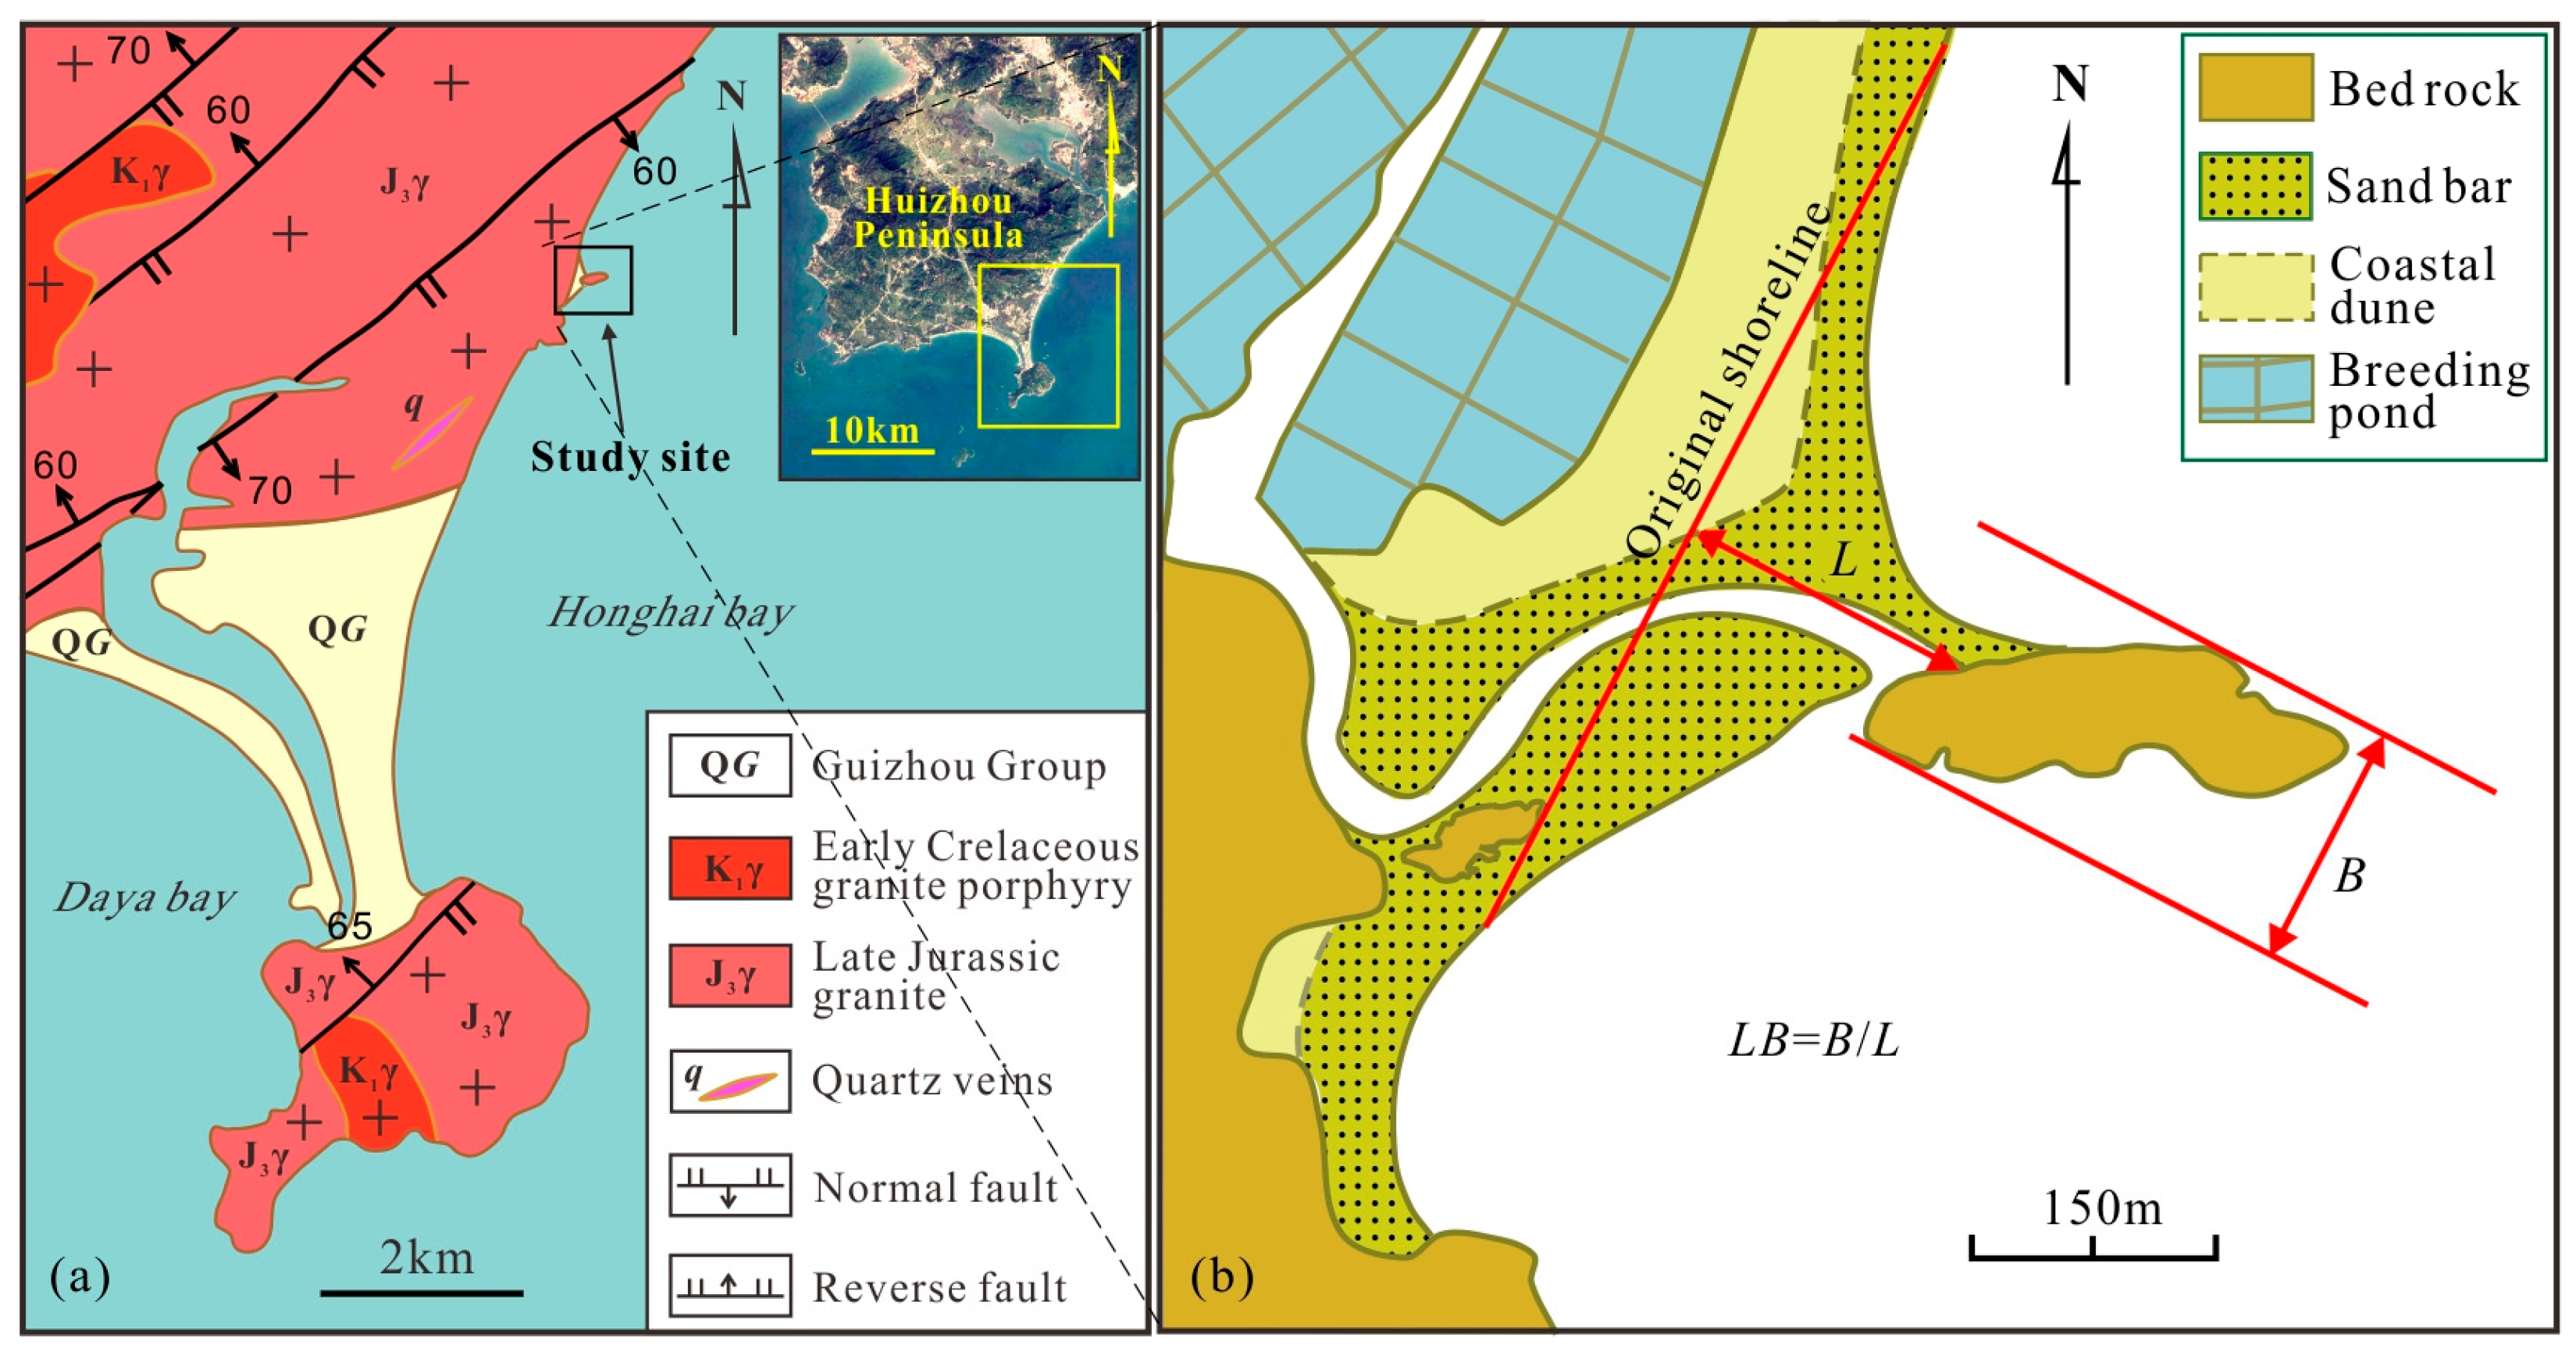
The study area is located along the eastern coastal margin of the Huizhou Peninsula, to the west of Honghai Bay (Figure 3a). The region’s geological composition predominantly consists of Lower Jurassic granites. Additionally, the northeast-trending Xiaomo-Sixingshan fracture group, which plays a critical role in controlling the distribution of islands along the peninsula’s coastline [38], is exposed north of the study area (Figure 3a).
The sediments in Honghai Bay primarily consist of clay silt, characterized by a mean grain size (Mz) ranging from 6.22 to 7.95ɸ and a sorting coefficient (σ1) ranging from 1.21 to 2.05ɸ. The sediments exhibit a coarsening trend towards the eastern and western directions. In the intertidal zones along the eastern and western coasts, the sediments are predominantly fine sand, with a mean grain size (Mz) of 2.76 to 3.5ɸ and a sorting coefficient (σ1) of 0.48 to 2.05ɸ [36].
From a geomorphological perspective, the beaches on the southern and northern coasts of the tombolo are pocket beaches located between headlands. The southern beach is approximately 400 m long and features a small rocky outcrop in the middle, which divides it into two segments (Figure 1a). The north coast of the tombolo comprises a much longer beach situated between two headlands: one being Huarongshu Island itself and the other a reef known as Heibaijiao, located approximately 1.5 km north of Huarongshu Island (Figure 1b).
The morphological limiting parameters of the Huarongshu tombolo (B, L, and LB) were determined based on a map derived from a Google Earth satellite image (Figure 3). According to Mangor et al. [15], the dimensionless parameter (LB) represents the ratio of the projected length of the detached obstacle (B) to the distance from the obstacle to the shoreline (L). Consequently, LB can be calculated using the following formula:
LB = B/L
LB determines the geometrical proportions of sand bodies in plane form formed in the lee of detached obstructions. Depending on the value of LB, two basic accumulation forms can be created on the shoreline: A salient form when LB < ~0.6–0.7 and a tombolo form when LB > ~0.9–1.0 [15].

2.4. MEPBAY Model

To analyze the tombolo’s morphological changes over time, historical Google Earth satellite images from 2009 to 2022 were used. The MEPBAY model proposed by [39] was employed to determine the equilibrium shorelines of beaches on either side of the tombolo in the satellite images. Beach erosion or accretion can be determined by comparing the equilibrium shoreline with the actual beach shoreline [39].
The shorelines in the satellite imagery are datum-based lines derived from the satellite-observed waterline and referenced to a consistent water level, typically a local tidal datum [40]. Water level data were obtained from the local tide gauge station (Shanwei Station) (Figure 2) [36]. If the time of satellite image acquisition is known, the corresponding water level height can be determined.
A number of empirical equations, such as the logarithmic spiral [41], the parabolic model [42], and the hyperbolic tangent [43], have been proposed to determine the planform of the shoreline of a headland-bay beach in equilibrium. The parabolic model is the most widely used equation [44]. Three software tools (MEPBAY, MeePaSoL, and SMC) are available to facilitate the application of the parabolic model. In general, MEPBAY [39] and MeePaSoL [45] can be applied directly using a satellite image and with knowledge of wave propagation. MEPBAY is chosen in this study.
The parabolic bay shape equation for the headland-bay beach in static equilibrium, developed by Hsu and Evans [42] is in the form of:
R/R0 = C0 + C1(β/θ) + C2(β/θ),
where β is the reference wave obliquity angle, R is a polar radius with a polar angle θ, and R0 is the control line length between the headland upcoast diffraction point and the downcoast control point (Figure 4). The model connects shoreline changes to the upcoast diffraction point. This enables the relocation of the diffraction point for man-made structures easily [46]. The control line is aligned with the reference wave obliquity angle to the tangent at the downcoast beach end [39]. Any point on or near the straight downcoast segment of the beach in Figure 4 can be chosen as a downcoast control point, any of which can have the corresponding polar radius, and is insensitive to calculation [39,47]. The three constants (C0, C1, and C2) in Equation (2) are related to the reference wave’s obliquity angle. Hsu and Evans [39] found the three constants that differ from the reference wave obliquity angle by fitting the peripheries of the 27 prototypes and model bays with regression analysis.
The procedure using the parabolic model is repetitive and tedious, especially when the results of several alternative options have to be compared [48]. Fortunately, the efficiency in the application of the parabolic bay shape model has been improved and computerized by a software package, MEPBAY (model of equilibrium plane form of bayed beaches), which is developed as an educational software at the University of Vale at Itajaí, Brazil, and can be downloaded from http://siaiacad17.univali.br/mepbay/?pagina=homehttp://siaiacad17.univali.br/mepbay/?pagina=home (accessed on 1 January 2022). MEPBAY 3.0 was used in this study to analyze the equilibrium of beaches on both sides of the tombolo.
The headland-bay beach planform may exist in three states: static equilibrium, dynamic equilibrium, and unstable or natural reshaping [48]. Static equilibrium is reached when the dominant waves break along the entire bay perimeter simultaneously. At this stage, net longshore sediment transport along the entire bay periphery is close to zero, and the beach is stable without long-term erosion or deposition, except during storm periods. The shoreline of a headland-bay beach may advance or degrade as the net sediment supply increases or decreases. A beach may be in dynamic equilibrium when sediment is still passing through it, and the shoreline of the beach is classified as unstable when natural beach reshaping occurs due to a lack of sediment [48].

2.5. XBeach Simulation

The XBeach model is an open-source program, and its source code can be freely downloaded from the XBeach platform website. The model includes formulations for short-wave envelope propagation, non-linear shallow water equations, sediment transport, and morphological bed updates [49]. The effects of wave refraction and diffraction, as well as the associated deposition on the lee side of a breakwater caused by obliquely and normally incident waves, are critical for understanding tombolo formation in this study. Therefore, the XBeach model was employed to simulate deposition on the leeward side of an obstruction (e.g., a breakwater) under oblique wave incidence conditions.
In this study, the case study described in [49] was adopted as a reference for research modeling. Simulations of the XBeach application in 2D mode were conducted based on the model configuration detailed in [49]. The bed profile for the model setup featured an initial slope of 1:50, with a linear profile shape maintained across all varying offshore distances from the breakwater to the shoreline, consistent with the case study presented in [49]. In this study, the breakwater dimensions were fixed at a length of 300 m, a width of 20 m, and a height of 3.61 m within a domain area measuring 2100 m by 790 m. An equidistant grid size of 10 m was employed in both the x- and y-directions to cover the entire domain area. The wave incidence angle was varied from perpendicular (0°) to oblique (55°) relative to the shoreline, as shown in Figure 5. Figure 5 illustrates the two-dimensional view of the contour patches and the cross-shore bed profile utilized in all simulations conducted in this study. A detailed description of the XBeach model and its formulations can be found in [49].

2.6. Grain Size Analysis

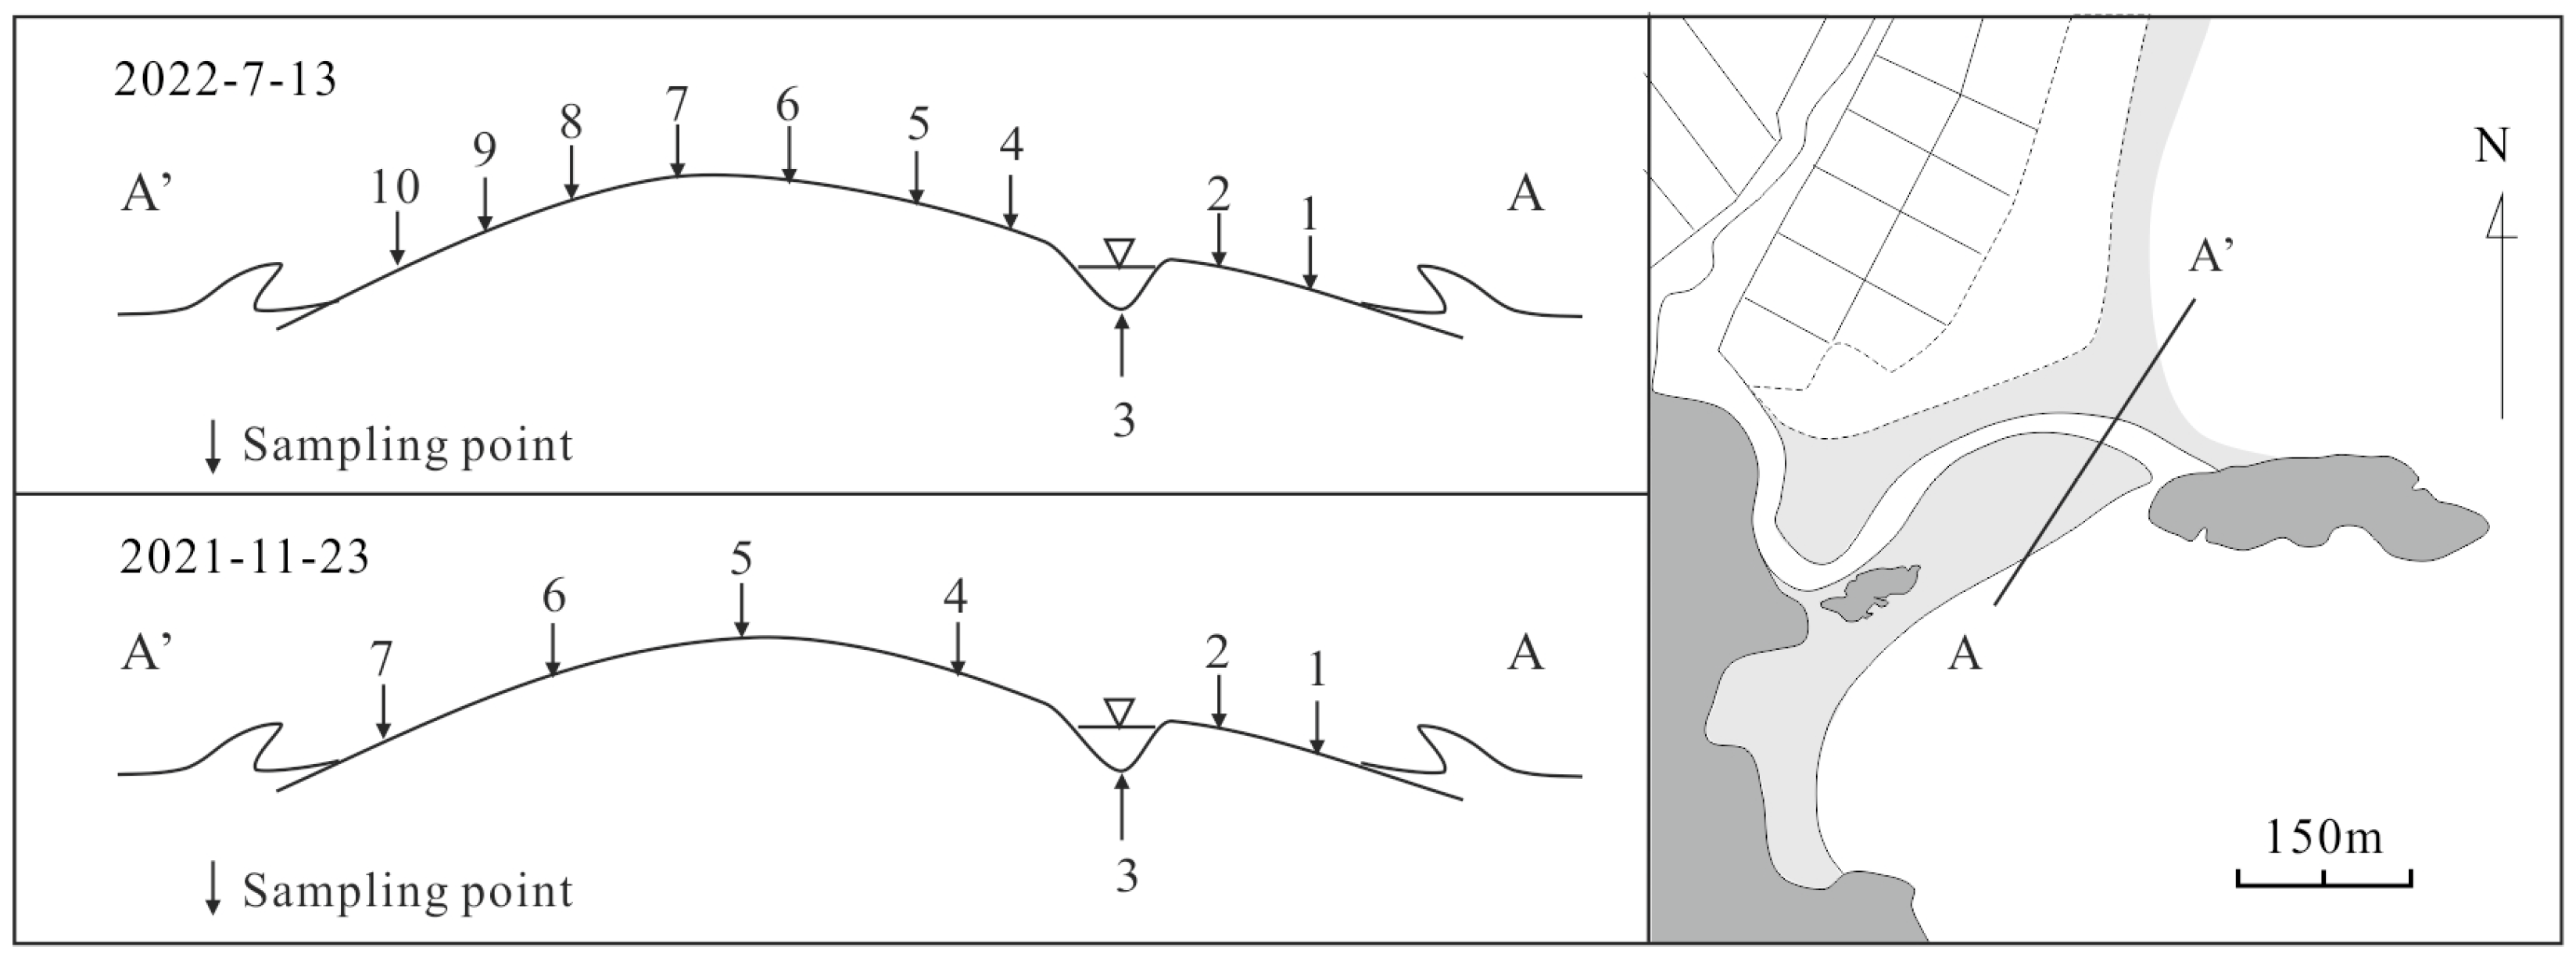
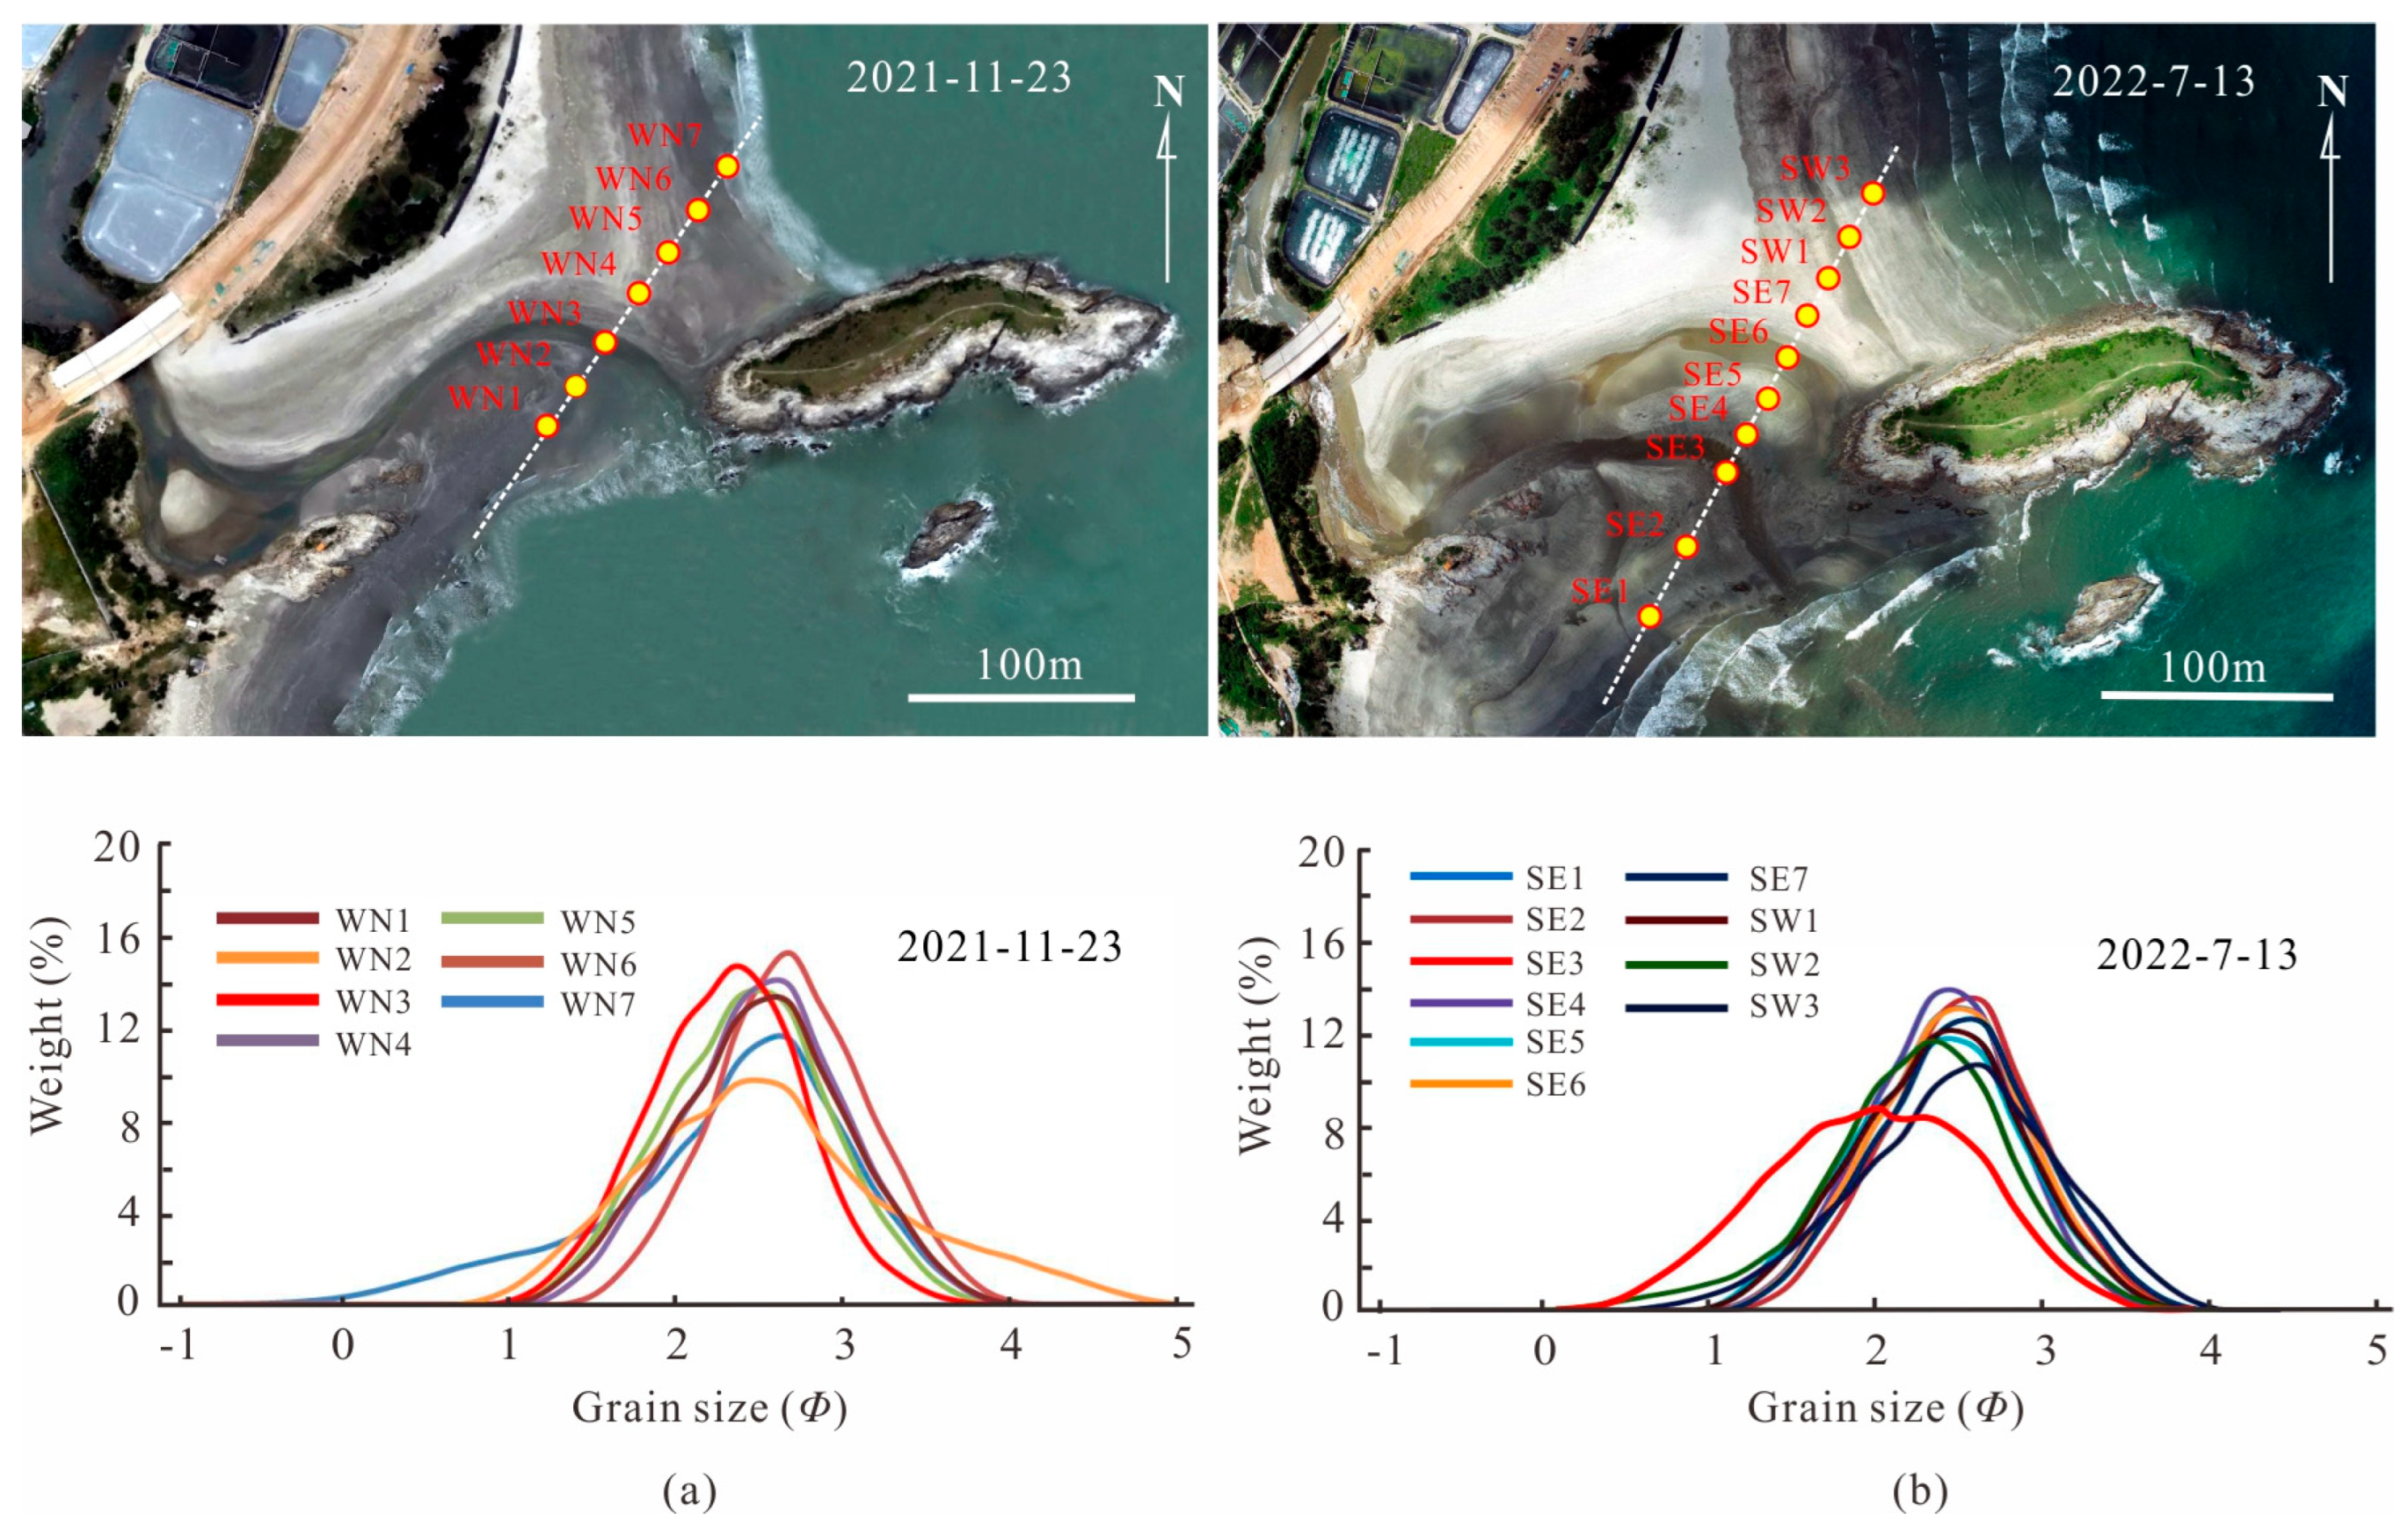
A total of 17 tombolo surface samples were collected on 23 November 2021 (winter) and 13 July 2022 (summer). In each season, samples were collected along the same transect across the tombolo, with one additional sample taken from the bed of the stream that flows into the tombolo from the mainland (Figure 6). During sampling, an unmanned aerial vehicle (UAV), DJI Phantom 4 RTK, was employed to capture images of the planar shape of the tombolo.
The samples were analyzed at the School of Geosciences, South China Normal University, using a Malvern Masterizer 2000 particle size analyzer (Malvern Instruments, Malvern, UK). This has a measurement range of 0.02–2000 μm. The pre-sample processing and testing methods proposed by Konert and Vandenberghe [50] were used in the analysis. The output particle size was classified into 10 categories, ranging from 0.1 to 2 mm. The size of particles < 0.10 mm was determined according to the method described in [51]. The metric grain sizes were transformed to logarithmic Φ value according to Φ = −log2d (d is the diameter in mm) [52]. By plotting on a semi-log scale, the grain size curve becomes more evenly distributed, which helps in analyzing and interpreting the data. The statistical parameters, mean (Mz), sorting value (σ1), skewness (SK1), and kurtosis (KG) of the samples were calculated using a graphical method proposed by Folk and Ward [53]:
Mz = (Φ16 + Φ50 + Φ84)/3
σ1 = (Φ84Φ16)/4 + (Φ95Φ5)/6.6
SK1= [(Φ16 + Φ84 − 2Φ50)/2(Φ84Φ16)] + [((Φ5 + Φ95 − 2Φ50)/(Φ5Φ95))
KG = (Φ95Φ5)/2.44(Φ75Φ25)
The parameters were calculated using a Matlab 7.5.0 (R2007b) program that employs a graphical approach for parameter calculation [54].

3. Results

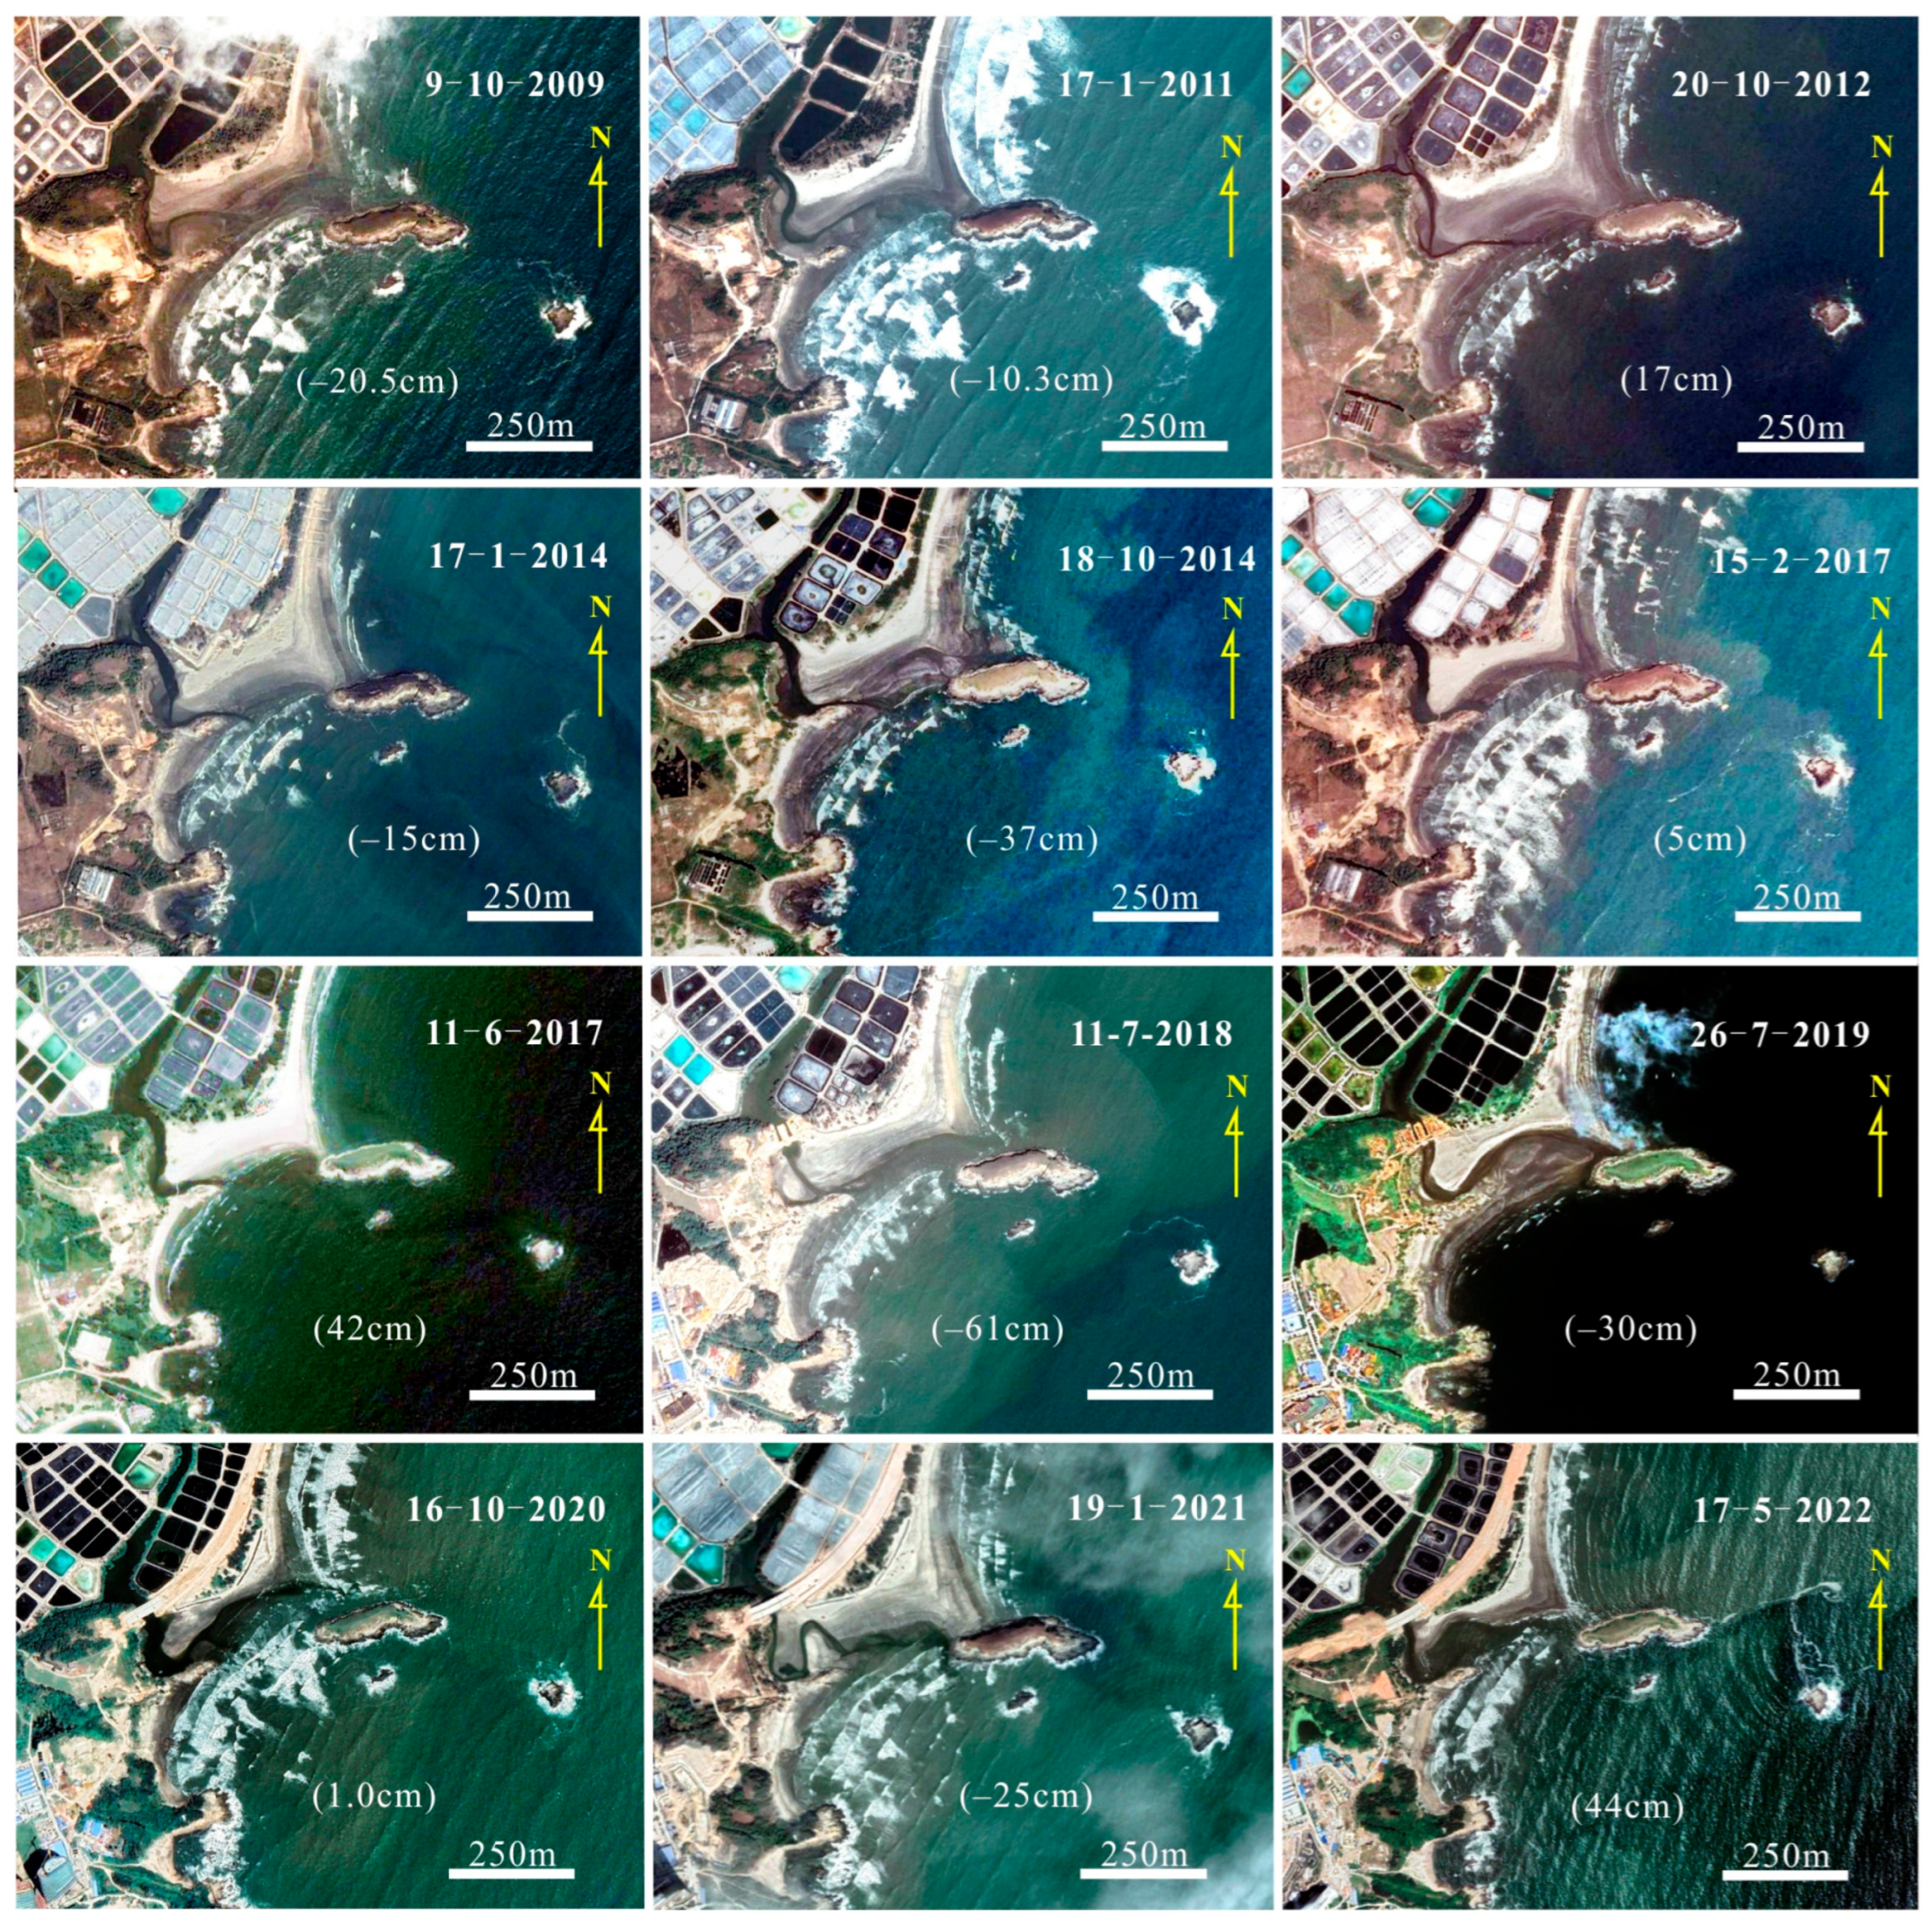
Based on Equation (1), the ratio LB (B to L) was calculated to be 0.76, indicating that this value lies within a range where neither a tombolo nor a salient is formed [15]. Over time, changes in the tombolo’s morphology were analyzed using 12 Google Earth satellite images acquired between 2009 and 2022 (as shown in Figure 7, Figure 8 and Figure 9).
In 2009, 2012, 2014, 2017, and 2018, the stream flowed directly into the sea through the central part of the southern beach, which hindered the formation of a double tombolo. In contrast, in 2011 and 2019, the southern beach pushed the stream back, redirecting its flow eastward into the sea at the eastern tip of the southern beach and forming a lagoon between the southern and northern beaches. In 2020 and 2022, particularly in 2022, a significant portion of the sediment on the southern beach between the outcrop and the tied island was lost (Figure 7).
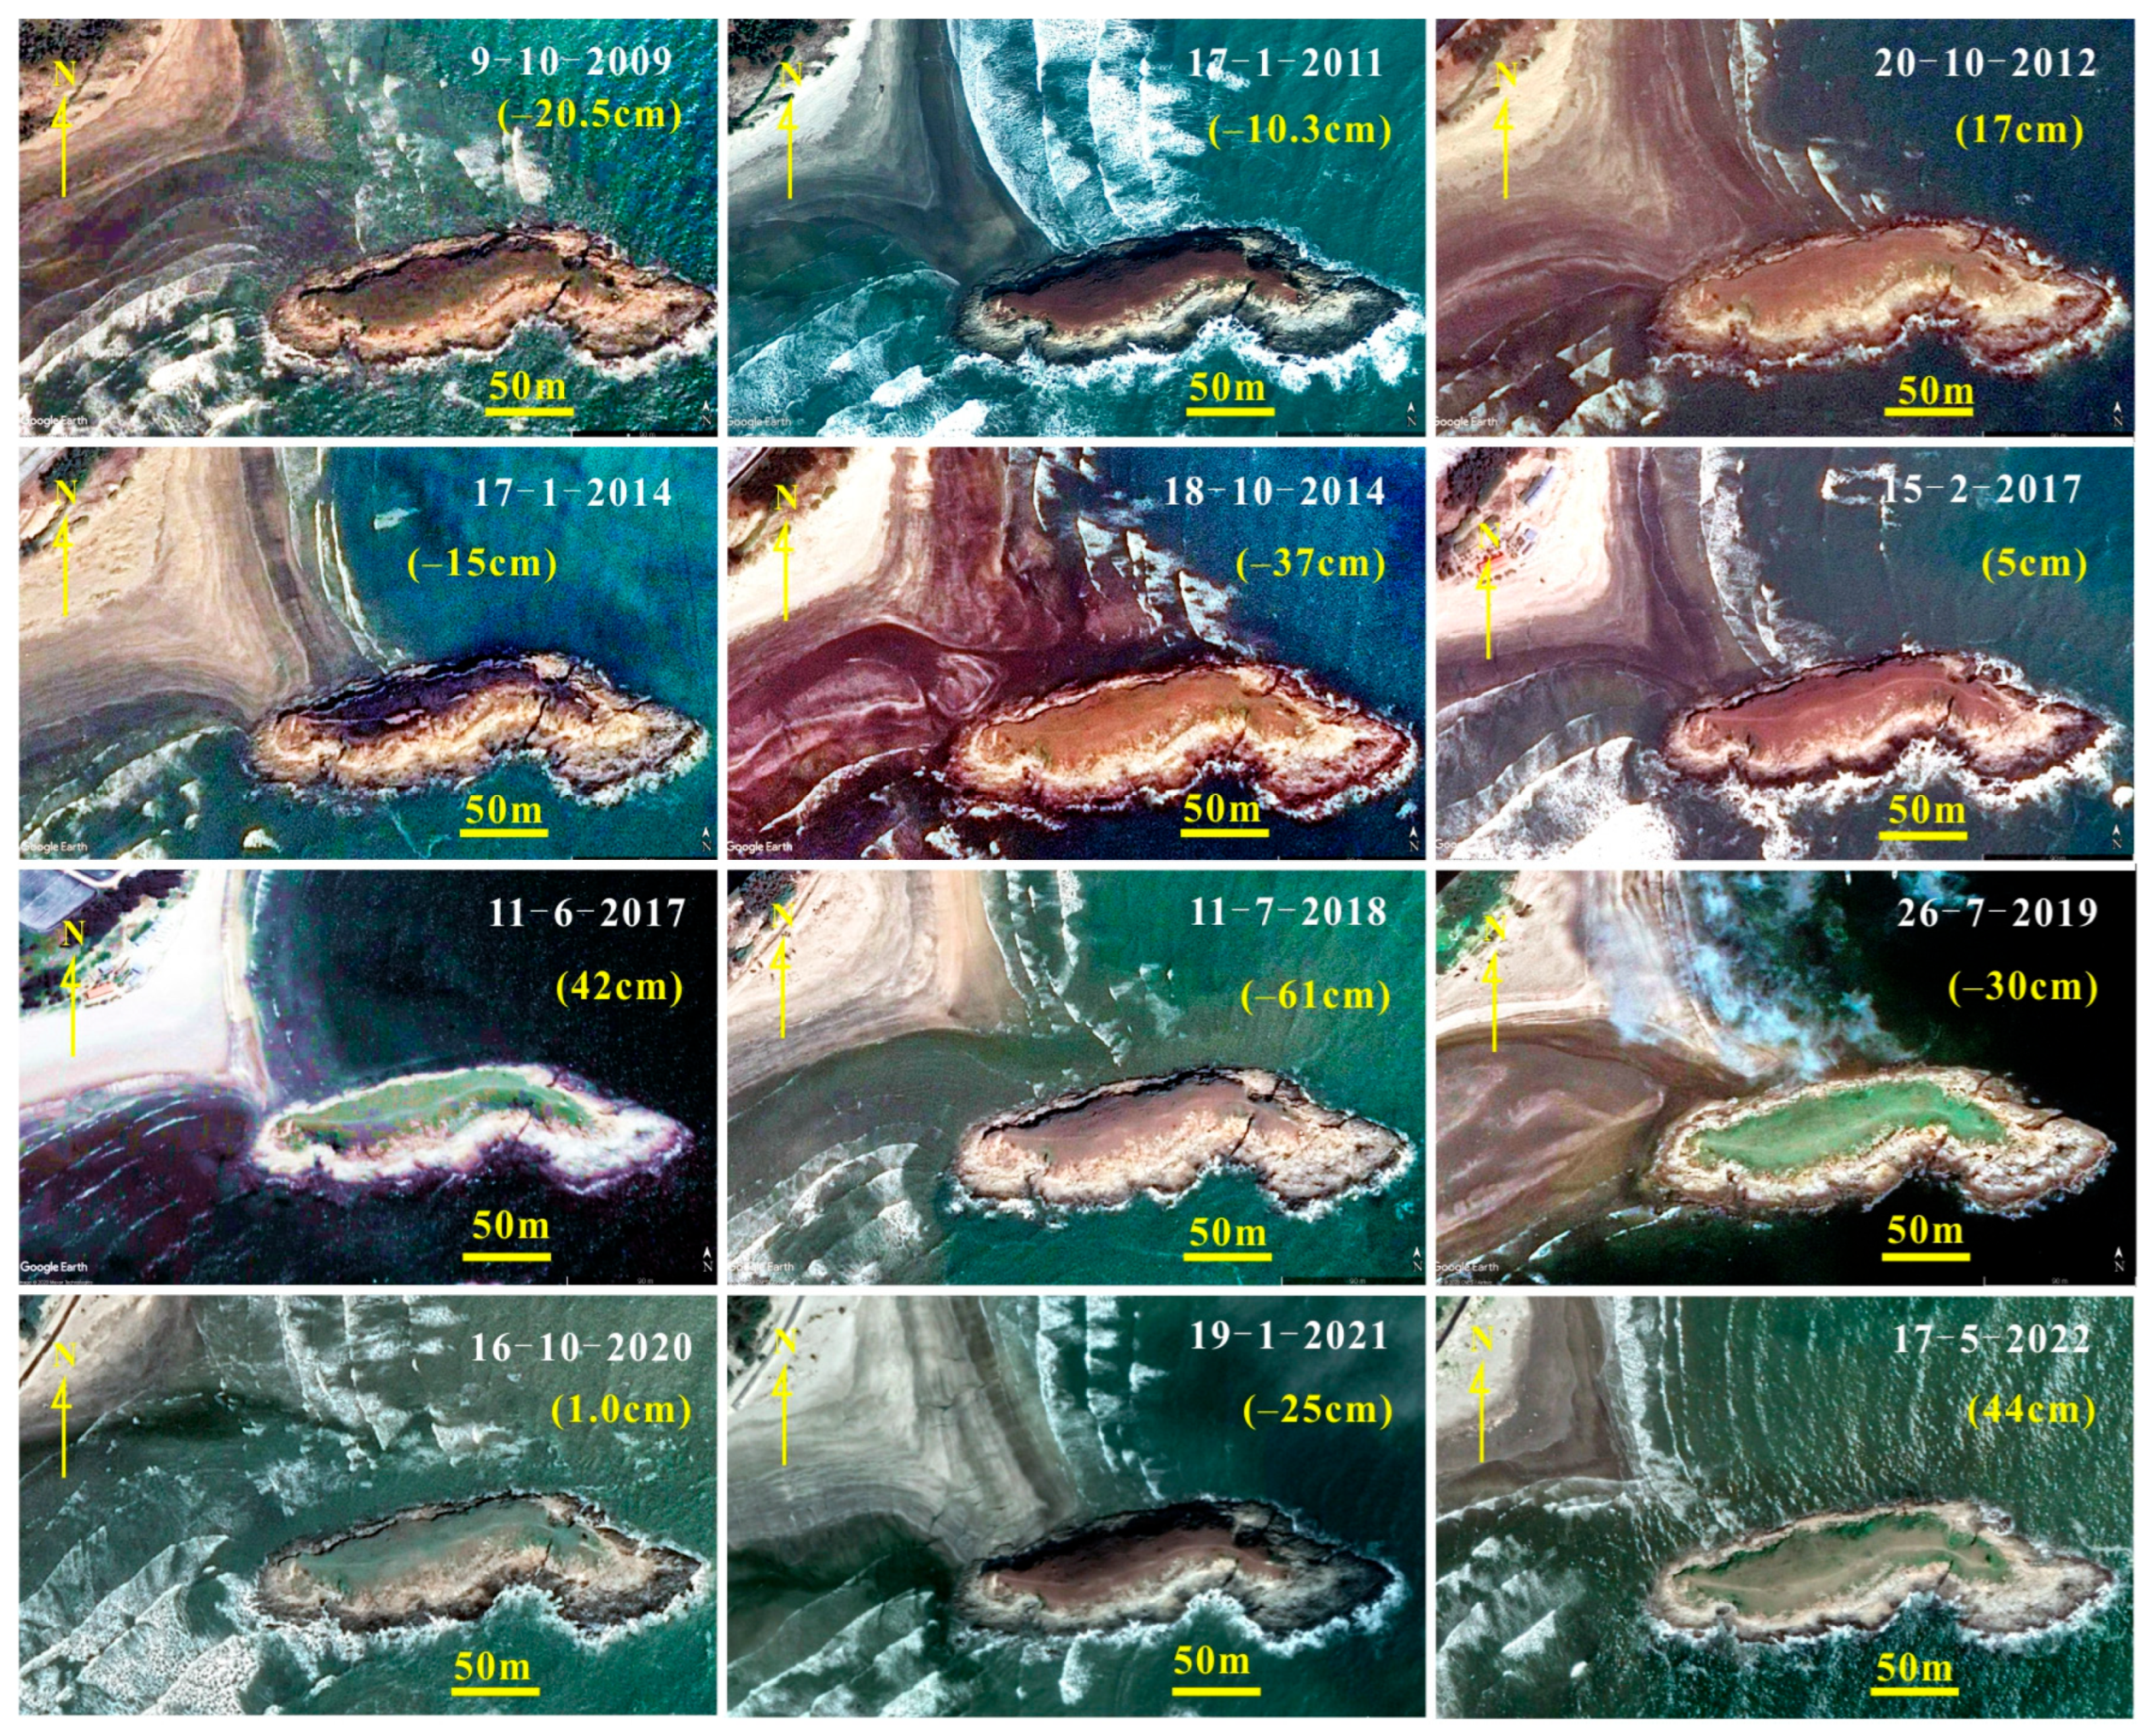
The Huarongshu Island was not always connected to the tombolo. The tombolo was connected to the sheltered side of the island only in 2011, 2012, 2014, 2017, 2019, and 2021. At other times, there was a noticeable gap between the tip of the tombolo and the sheltered side of the island. Figure 8 displays detailed and specific characteristics.
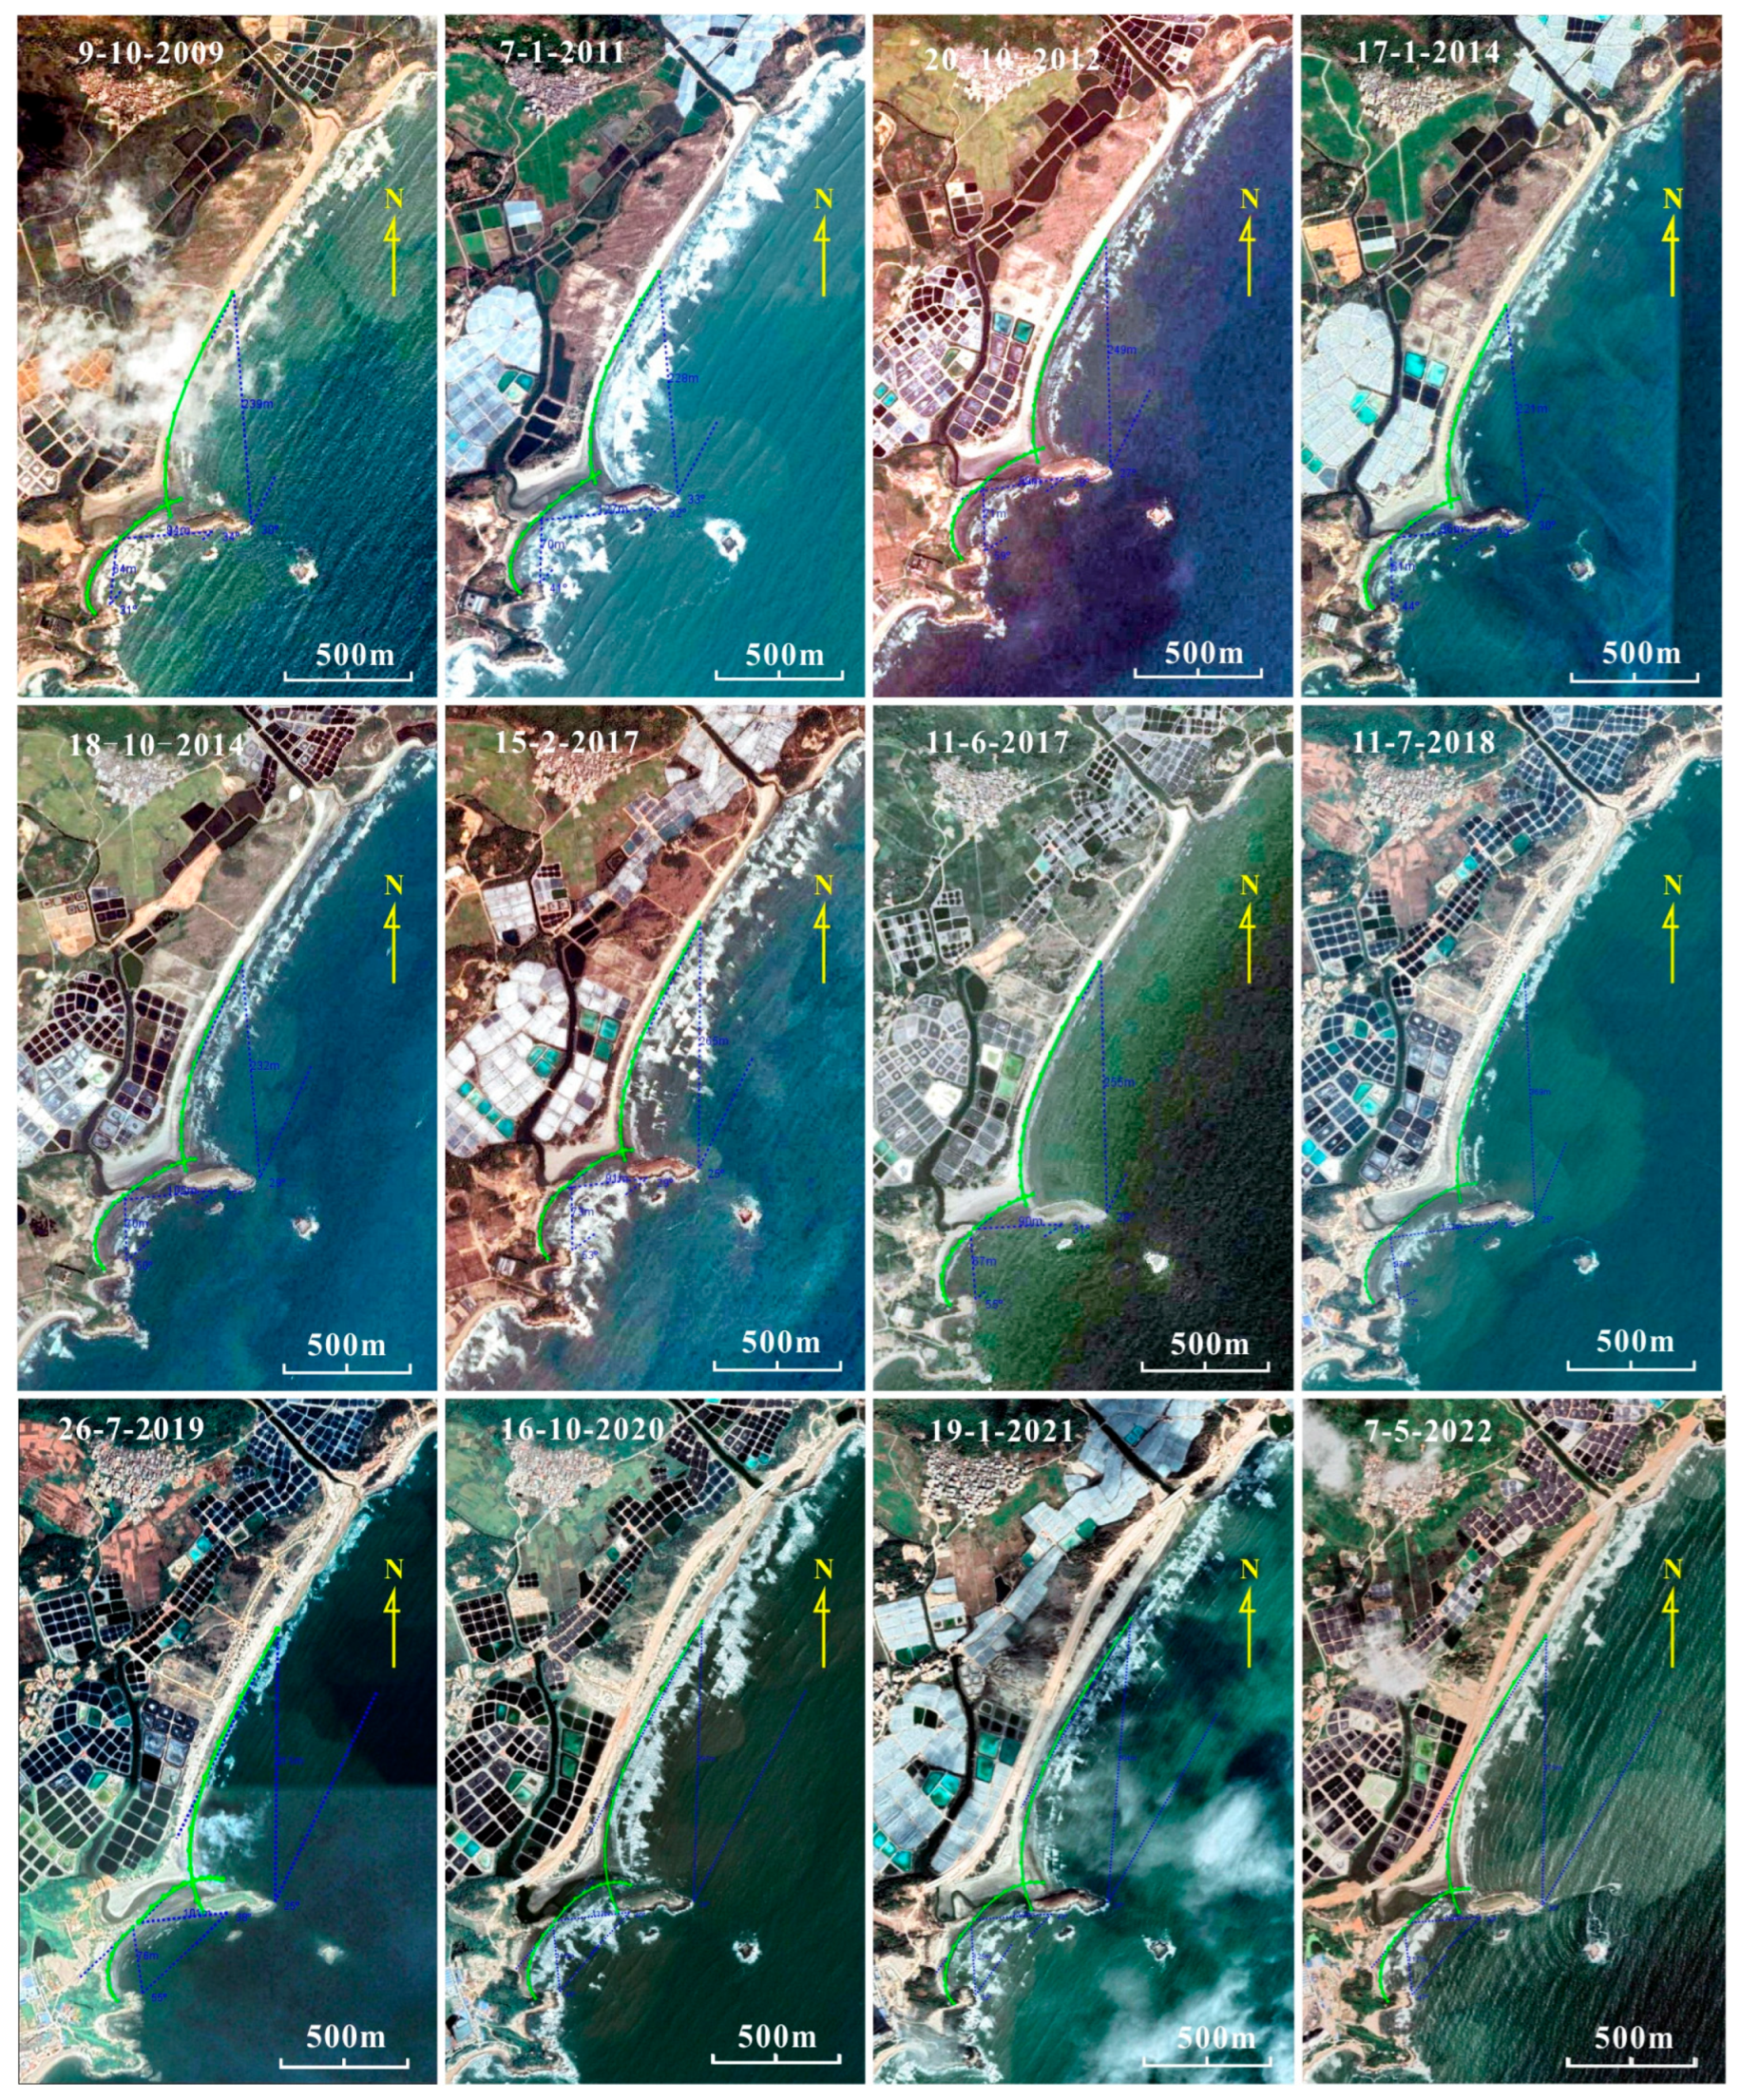
Three MEPBAY equilibrium shorelines were constructed for the beaches on both sides of the tombolo in different years. One equilibrium shoreline was built along the northern shore of the tombolo. The up-coast diffraction control point of the equilibrium shoreline was located at the seaward tip of Huarongshu Island (Figure 9). The other two equilibrium shorelines were established on the southern beach. One was located between Huarongshu Island and a small rocky outcrop in the middle of the southern beach. The other was located between the middle small rocky outcrop and the southern beach headland. The southern side of Huarongshu Island and the southern headland of the southern beach served as the upcoast diffraction control points for both the northern and southern sections of the southern beach (Figure 9).
As shown in Figure 9, the equilibrium shorelines forming the northern and southern coasts of the tombolo intersect behind Huarongshu Island, forming a salient. The intersection point, which is supposed to be the tip of the salient in an equilibrium state, never touches the lee side of the island. However, the real tip of the tombolo is always located seaward of the equilibrium tip (i.e., the intersection point) (Figure 8).
Figure 10 illustrates the wave refraction and diffraction effects caused by oblique and normal incident waves. When waves approach the coastline at an angle, erosion occurs in the lee area on the side where the waves strike, whereas deposition occurs on the opposite side (Figure 10a,c) When incident waves are perpendicular to the coastline, deposition occurs in the lee area behind the breakwater, while erosion occurs on both sides behind the breakwater (Figure 10b,d).
Table 1 summarizes the grain size parameters of the tombolo beach sediment samples collected on 23 November 2021 and 13 July 2022. Figure 11 presents photos captured by a UAV. These photos depict the sediment sampling points on the tombolo and the in situ morphological features during the sampling periods (see Figure 11 for details). Figure 11 also illustrates the grain size distribution of beach deposits collected on 23 November 2021 and 13 July 2022. The grain size distributions of all samples collected on 23 November 2021, during the winter season, exhibited no significant differences. Although the sample (WN3) from the stream bed was slightly coarser than those from other areas of the tombolo, the difference was minimal. In contrast, on 13 July 2022, during the summer season, the sample from the stream bed (SE3) was markedly coarser than those collected from other parts of the tombolo (see Figure 11 and Table 1).

4. Discussion

4.1. The Morphological Significance of the Value of LB

The conditions for forming a tombolo are: (i) a high sediment supply, (ii) a physical barrier against swell, and (iii) coastal processes conducive to the development of a sand bank [11]. Previous studies used the values of B, L, and B/L to determine the geometrical proportions of sand bodies forming on the lee side of an island. According to Shoreline Management Guide [15], a salient forms when LB < ~0.6–0.7, and a tombolo is created when LB > ~0.9–1.0. In the case of the Huarongshu tombolo, the dimensionless parameter LB is calculated to be 0.76 according to Equation (1); hence, it is likely to be in a division state between the formation of a salient and a tombolo. On the other hand, the equilibrium shoreline simulated with MEPBAY shows that the intersection point of the simulated shorelines of the northern and southern beaches never reaches the lee side of Huarongshu Island (Figure 9). This means that a salient should form when the beaches on both sides of the tombolo reach a static equilibrium state. Therefore, a tombolo cannot be formed behind Huarongshu Island based on the limited planform parameters (B, L, and LB). However, the ratio between B and L only determines wave refraction and diffraction behind the offshore island, where waves slow down in shallow water around the island [15,18]. In addition to wave refraction and diffraction, sand supply through the nearshore and longshore sediment circulation system that feeds the tombolo is critical to the tombolo’s existence. Previous research has demonstrated that sediment sources contributing to tombolo formation originate from nearby littoral drifts, streams, and the adjacent sea floor [15,18,20,55,56]

4.2. Sediment Sources for the Tombolo Interpreted with Equilibrium Shorelines

Balance in the sediment budget is the key factor in maintaining the shoreline in its existing position [21,39]. As shown in Figure 9, the predicted equilibrium shoreline closely matches the entire beach north of Hualongsu Island, except for the portion in the wave shadow zone behind the island. This indicates that the northern section of the northern beach has always been in a state of static equilibrium. When a beach is in a static equilibrium state, a net longshore sediment transport along the beach is close to zero without long-term erosion or deposition, except during a storm period [48]. If the shoreline in the wave shadow area is in a state of static equilibrium, the actual shoreline here should coincide with the equilibrium shoreline; only a salient is formed, which cannot touch the island, resulting in a gap between the tip of the salient and the lee side of the island. When there is an additional supply of sediment to this area, the shoreline here is in a state of dynamic equilibrium and the salient tip extends seawards to connect with the lee side of the island to form a tombolo that closes the gap. The actual shoreline of the southern beach often differs from the predicted equilibrium shoreline, being more seaward or landward than the equilibrium shoreline. This is particularly evident in the section of the southern beach between the central rock outcrop and the island, suggesting that this frequent variation is more dependent on changes in the amount of fluvial sediment (Figure 9).
Figure 8 shows that on 20 October 2012 and 17 January 2014, the tip of the salient connected to the island when water levels were 17 cm and −15 cm above the Pearl River datum, respectively. On 10 September 2009, a gap existed between the salient and the island at −25.5 cm, while on 19 January 2021, the salient connected to the island at a similar water level (−25 cm). This indicates that whether the tip of the salient is connected to the island is not caused by the change in tidal level.
As previously mentioned, Honghai Bay’s NEN-ESE waves during winter account for 63.4% of the total, with ESE waves comprising 27.2% and E waves comprising 20.6% [37]. The tombolo is not affected by SW waves in summer due to its low frequency (7.9%) [37] and the orientation of the coastline (Figure 1). This wave climate causes changes in longshore drift direction due to winter southeasterly and northeasterly wind events, rather than seasonal wave direction changes. On the other hand, both the northern and southern beaches of the tombolo are headland-bay beaches. The headlands at each end block sediment supply from longshore drift outside the beach. The fact that there was enough additional sediment to maintain the formation of a tombolo without the help of sediment from the littoral drifts is the result of the diffraction and refraction of vertically approaching waves, which carry sediment from the adjacent seabed to the area where the waves meet behind the island [18].
In addition to coastal sediments, sediments from streams also play a role in tombolo formation [15]. As shown in Figure 2, the area around Honghai Bay has an annual rainfall of about 2000 mm, with the highest monthly rainfall in June, and the runoff in the area, where the tombolo forms, varies with monthly rainfall [34,35]. Peak discharge is the peak rate of runoff (volume per unit time, typically cubic feet per second, cfs), from a drainage area for a given rainfall, and rainfall intensity affects peak discharge such that the greater the intensity, the higher the peak discharge [57]. Therefore, higher summer rainfall intensity compared to winter (Figure 2(a-1,a-2)) leads to coarser stream sediments entering the tombolo in summer than in winter (Figure 11). As illustrated in Figure 11b and Table 1, during the summer months (e.g., June 2022), the grain size of sediments on the riverbed is notably coarser compared to those in other sections of the tombolo. In contrast, during winter (e.g., November 2021), the particle size distribution of the riverbed sediments exhibits minimal variation relative to the sediments in other parts of the tombolo (Figure 11a).
The sediments in the intertidal zones along the eastern and western coasts of Honghai Bay are primarily composed of fine sand, with a mean grain size ranging from 2.76 to 3.5ɸ [36]. The coarser fraction of these sediments exhibits a grain size range similar to the grain size of the tombolo sediments, which are also fine sand with a mean grain size ranging from 2.21 to 2.59ɸ (Table 1). Notably, the sediments collected from the stream bed consist predominantly of medium sand, with a mean grain size of 1.91ɸ (Table 1). The variation in grain size of local sediments indicates that fluvial sediment constitutes one of the key sediment sources contributing to tombolo formation
In summer (e.g., June 2023), the stream enters the sea directly in the middle of the southern beach due to high river discharges, while in winter (e.g., November 2021), nearshore sediments, driven by waves, force the stream to flow eastward and enter the sea at the eastern end of the southern beach (Figure 11). As a result, the seasonal variations in tombolo stream deposits and tombolo morphology are closely correlated with fluctuations in monthly rainfall and annual ocean wave activity (Figure 2 and Figure 11). This suggests that modifications in tombolo morphology are predominantly influenced by variations in sediment transport, erosion, and deposition dynamics occurring at the interface between fluvial and coastal environments. A specific example is depicted in the image of 26 July 2019 (Figure 7), in which the tombolo displayed a typical winter plane form, similar to the photo taken by a UAV on 23 November 2021, despite being in the middle of summer (Figure 11a). The hydrologic station closest to the tombolo shows that the highest water level of the year (2019) occurred in August and was much lower than the level of the previous year (2018) (Figure 2b). This indicates that peak runoff had not yet occurred before July 2019, even though it was summer [35]. As a result, the stream water flowing into the tombolo was still weak. Therefore, the tombolo’s plane morphology at that time was similar to that in winter (e.g., 23 November 2021). The difference in grain size between the sediment transported by the stream flowing through the tombolo and the sediments in the remaining parts of the tombolo further substantiates the role of streams in tombolo formation, as evidenced by Figure 11 and Table 1. Since the stream flows exclusively through the southern portion of the tombolo, it transports sediment solely to the southern beach of the tombolo, thereby maintaining shoreline equilibrium in this area without influencing the northern beach of the tombolo (Figure 11). This further implies that any variations in the quantity of sediment transported by the river will directly result in morphological alterations of the southern beach.

4.3. Formation of the Double Tombolo

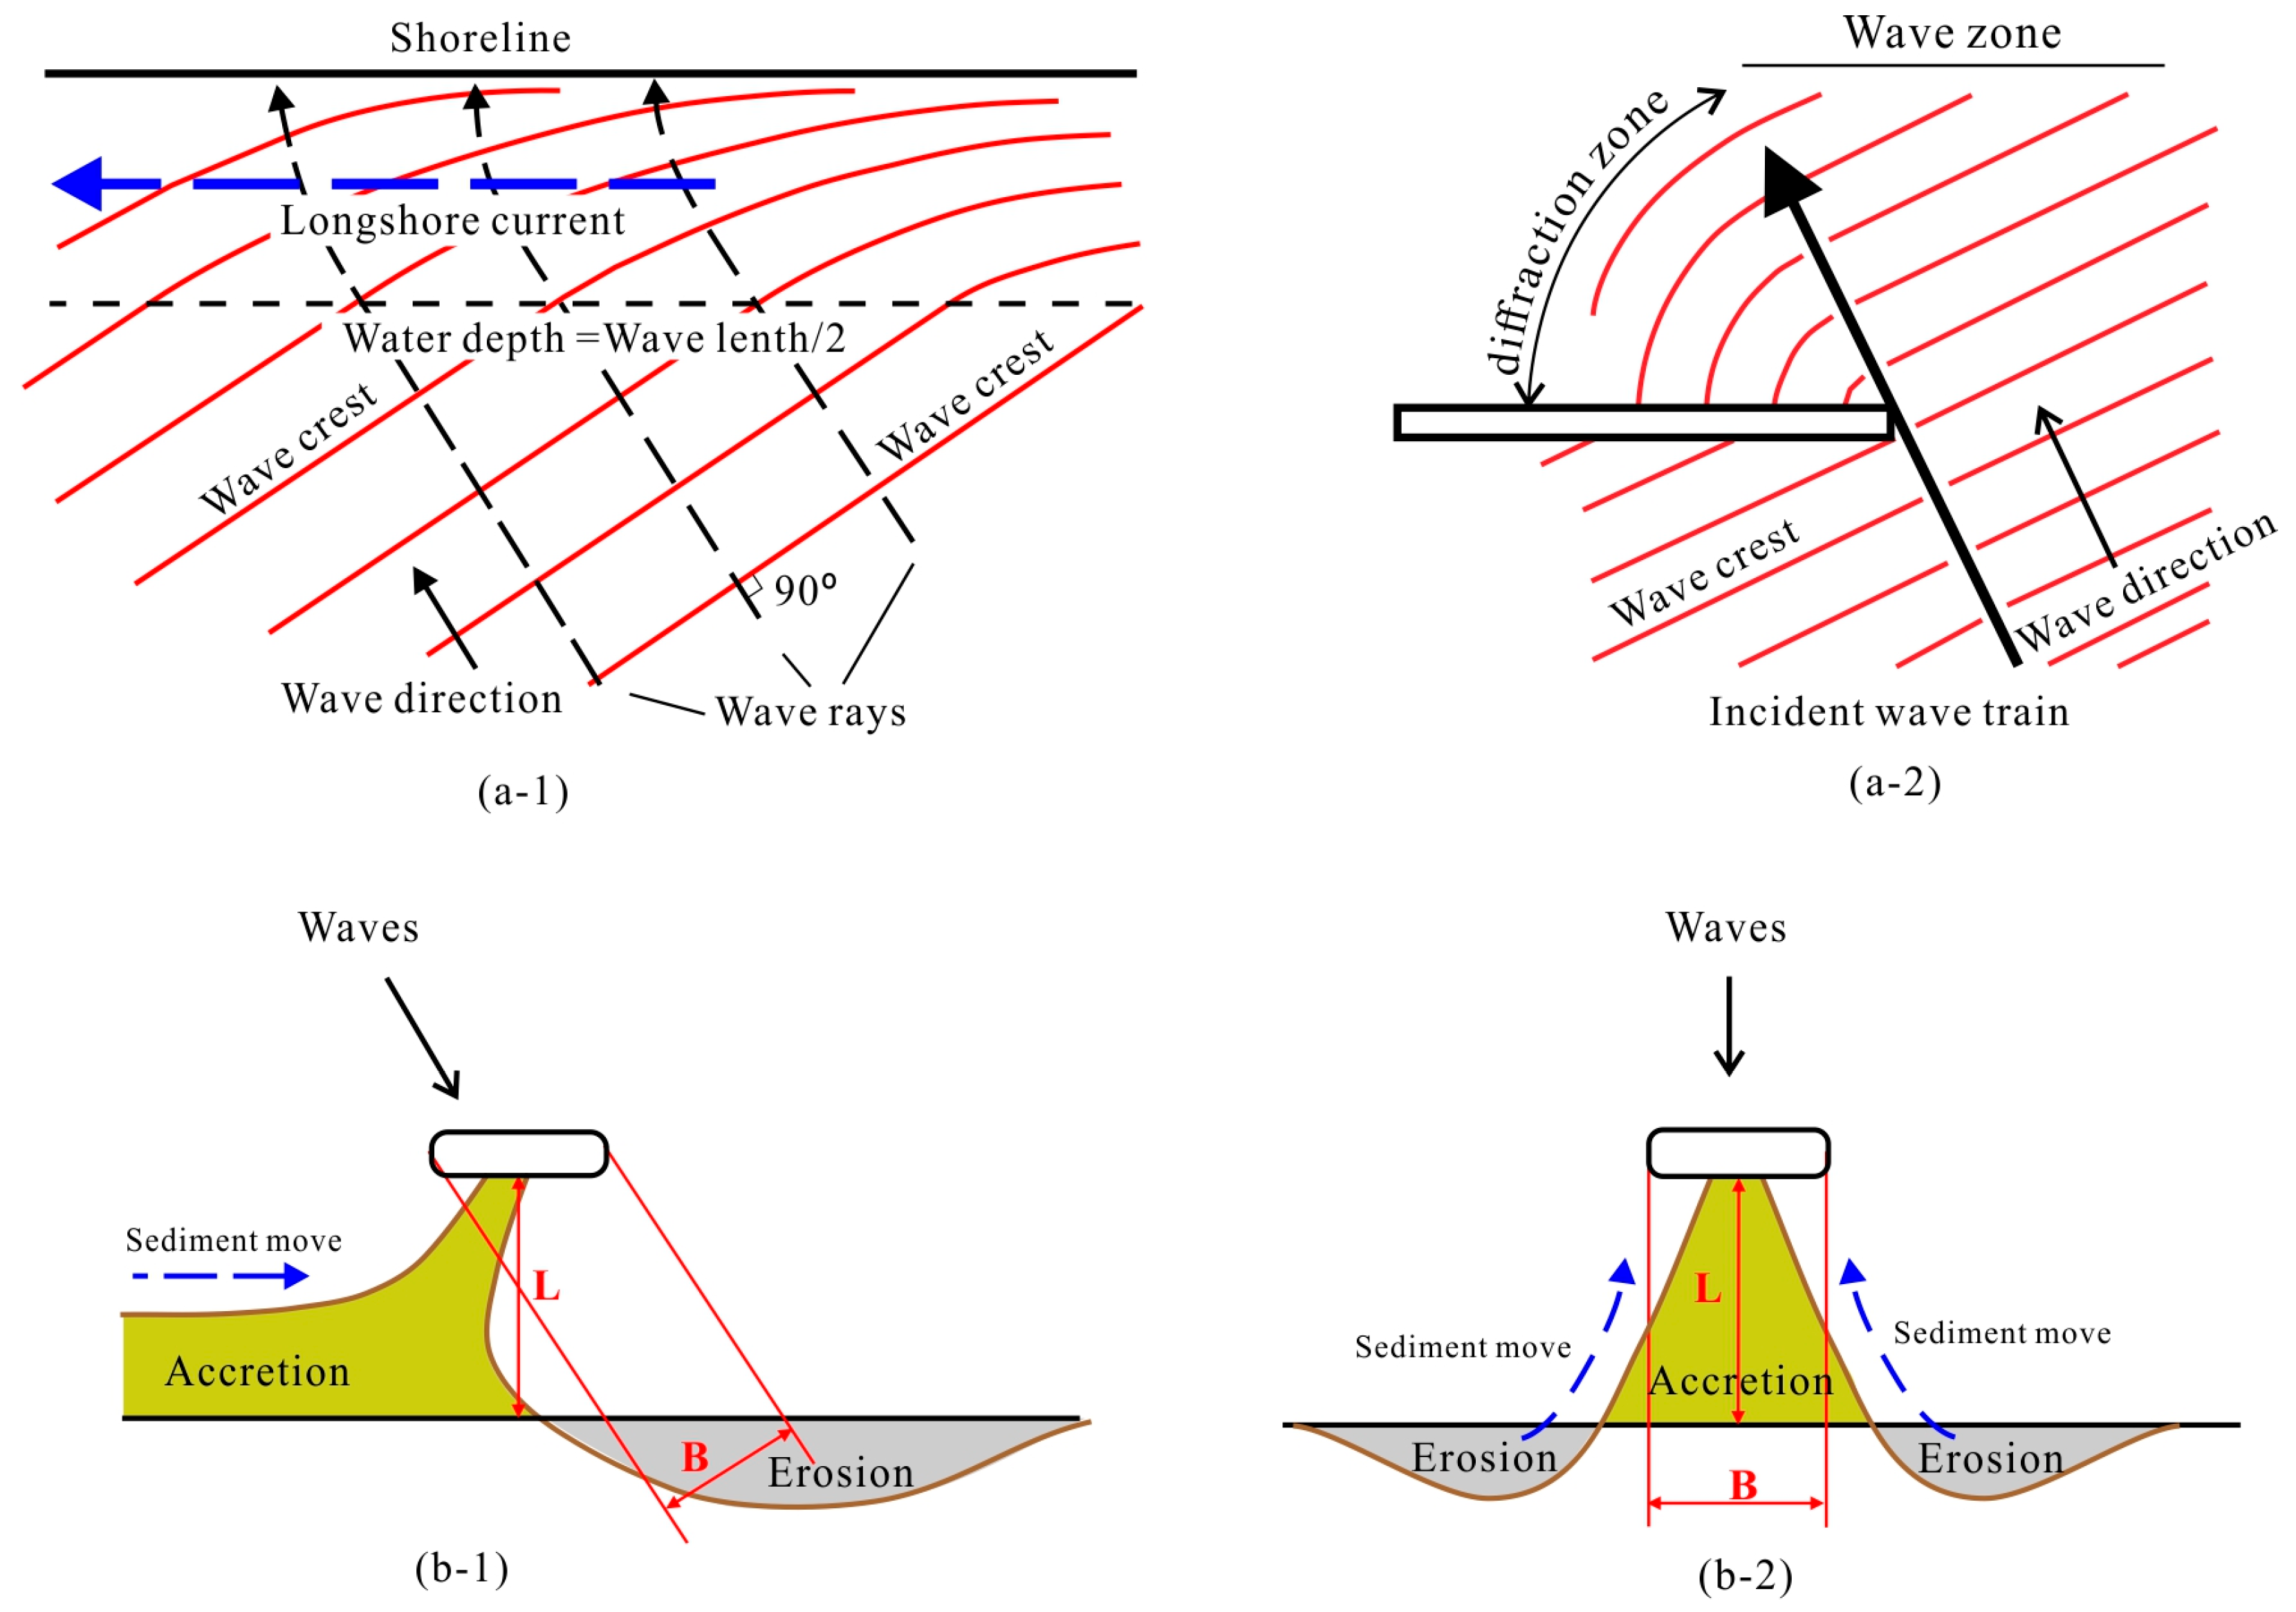
XBeach simulations demonstrate that oblique and normal incident waves result in distinct wave refraction and diffraction patterns (Figure 10a,b). When a coast has a detached obstacle, such as a breakwater, oblique waves diffract on one side of the obstacle’s lee, causing deposition on this side and erosion on the opposite side (Figure 10c). The deposited sediment is transported by longshore currents, while erosion occurs as a result of sediment starvation. Finally, the tombolo forms behind the breakwater with an asymmetrical form (Figure 12(b-2)). In the study area, NEN-ESE waves are predominant throughout the year [38], reaching the shore either perpendicularly or at an oblique angle. The oblique incident waves will cause deposition on the north side of the island’s lee, forcing the stream that initially flows from the peninsula into the sea to flow southward. As a result, the sediments transported by the stream partially infill the erosion zones on the southern side of the tombolo. Evidently, when there is insufficient sediment supply from the stream, the southern beach of the tombolo becomes susceptible to erosion.
As depicted in Figure 10b,d, when incident waves approach perpendicular to the shoreline with a detached breakwater, wave diffraction occurs at both ends of the breakwater, resulting in accretion behind the breakwater and erosion on either side of it. This indicates that when (ESE) wind waves approach the shore perpendicularly in the study area, normal incident waves undergo diffraction behind the island, causing sediment to build up on both sides of the tombolo.
Both the southern and northern beaches of the tombolo are headland-bay beaches (Figure 1), and the plan shape of the beaches depends on the shoreline orientation with respect to the offshore wave incidence direction, wave refraction, and wave diffraction. Headland-bay beaches tend toward an equilibrium form under a prevailing wave climate. When static equilibrium is reached, no longshore sediment transport occurs along the entire bay periphery [48]. If the headland is sufficiently long (at least 150 m [58]), it will obstruct littoral transport, thereby inhibiting sediment exchange with the neighboring shoreline, and sediment can only bypass the headland during strong storms [59]. Alongshore sediment flux will be negligible on an equilibrium coastline when there are no external sediment inputs. This suggests that the tombolo in the study area does not receive sediment supply from the nearby shoreline.
The local geological conditions that determine the distribution of islands along the east coast of the peninsula [36] result in a local LB value of only 0.76, which is insufficient for tombolo formation [15]. However, the formation and process-related characteristics of tombolo geomorphology are influenced not only by the interactions between underwater and terrestrial morphology and the distance between the island and the mainland but also by the availability of sediment sources [25] and sea state conditions [1,18,23]. The southern beach exhibits greater dynamism, whereas the northern beach demonstrates higher stability. This is because, as discussed above, the sediment supply for the southern beach originates from both wave activity and fluvial input, whereas the sediments on the northern beach are derived exclusively from wave action. The relative contribution of nearshore versus fluvial sediment sources plays a decisive role in determining whether a double tombolo or a salient is formed.
The process of alternating with a double tombolo or a salient on the lee side of the island can be described as follows:
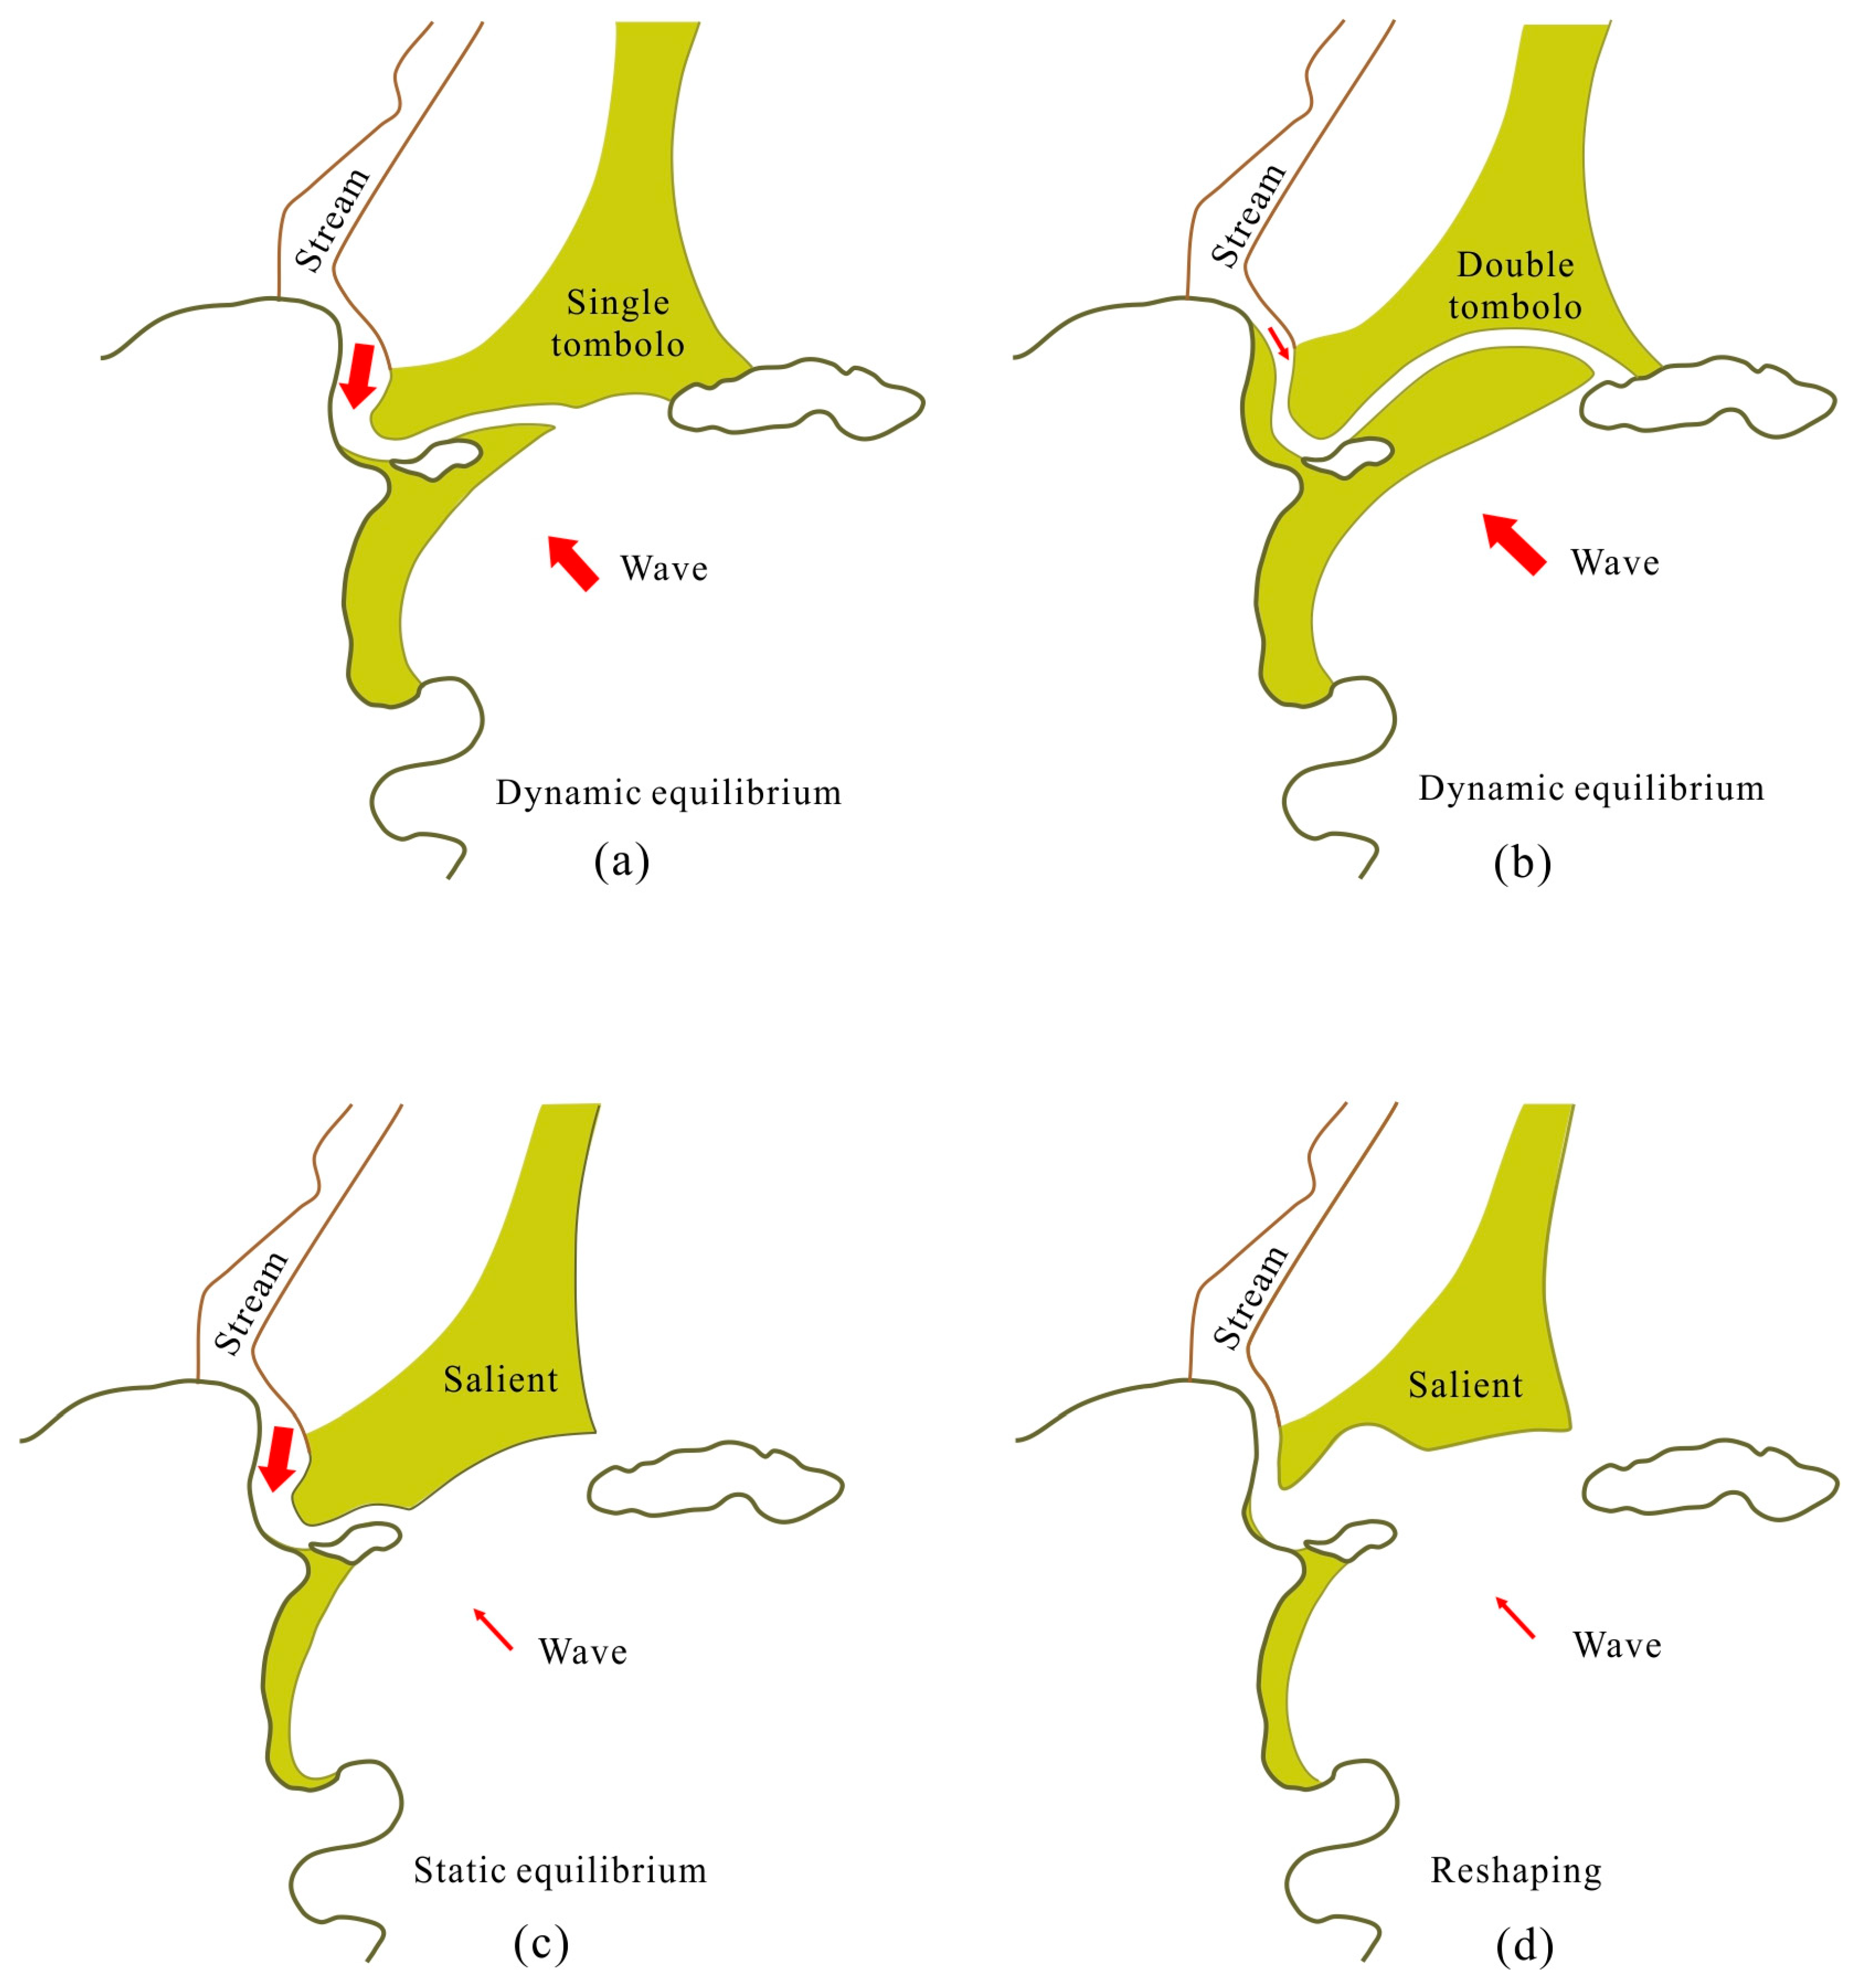
As discussed above, the Huarongshu tombolo is formed by offshore sand migrating to the coast, as well as stream sediments. A single tombolo forms when the stream discharge is sufficient to force the stream to flow directly into the sea in the middle of the beach section between the small rocky outcrop and the tied islands (Figure 13a). When the discharge is relatively weak, the waves are strong enough to transport offshore sands onshore and redirect the stream to flow continuously eastward toward the eastern end of the southern beach. As a result, the stream can only flow out to sea at the back of the island, creating a lagoon enclosed by the southern and northern beaches, forming a double tombolo (Figure 13b). In both cases, the shoreline of the tombolo is in a state of dynamic equilibrium, regardless of whether the additional sediment comes from offshore or inland sources. This is evidenced by the observation that whenever the tip of the island-linking sandbar connects to an island, the southern beach shoreline is positioned seaward of the rocky outcrop in the middle of the beach, maintaining a dynamic equilibrium state (Figure 13a,b). However, this is not always the case. If neither the stream nor the offshore seabed can provide enough sediments to allow the shoreline behind the island to extend outwards beyond the intersection of the south and north equilibrium shorelines to connect the island, the tombolo will exist only as a salient (Figure 13c). At this point, the actual shoreline of the southern beach passes through the rock outcrop in the middle of the southern beach (Figure 13c,d). When there is a lack of sediment from both the river and the ocean to maintain the southern beach, the southern beach shoreline is eroded to be reshaped and becomes unstable (Figure 13d). The main reason for this is the lack of fluvial sediments, as evidenced by the fact that sediments still remain on the beach between the rocky outcrop in the center of the southern beach and the southern headland, while the section between the outcrop and the tied island is completely eroded (Figure 13d).

5. Conclusions

A tombolo that has alternated between a double tombolo and a salient formation over more than a decade is analyzed in this article using satellite imagery. Despite the limitations of the available data (e.g., sediment sample data spanning only one year), the following key findings were obtained:
(1)
The tombolo behind Huarongshu Island demonstrates a transitional morphology between salient and tombolo formations, primarily influenced by local geological conditions that define the limiting parameter (LB).
(2)
A tombolo forms when the natural shoreline on the lee side of the island extends further seaward than the equilibrium shoreline. This occurs because refracted and/or diffracted onshore waves behind Huarongshu Island, along with sediment transported by a stream flowing into the lee side of the island, contribute additional sediment to the area. Longshore drift is not a necessary condition for the formation of the Huarongshu tombolo.
(3)
The existence of a stream originating from the hinterland of the Huizhou Peninsula and discharging into the sheltered region behind Huarongshu Island constitutes the primary factor enabling the formation of the double tombolo behind Huarongshu Island.
(4)
The formation of either a tombolo or a salient depends on the relative contributions of wave-transported sediment and inland river-derived sediment, and is independent of sea level fluctuations caused by tidal variations.

Author Contributions

Conceptualization, W.W.; methodology, W.W. and M.Q.; software, M.Q. and W.W.; validation, W.W.; formal analysis, M.Q. and W.W.; investigation, M.Q. and W.W.; resources, W.W.; data curation, M.Q.; writing—original draft preparation, M.Q.; writing—review and editing, W.W.; supervision, W.W.; funding acquisition, W.W. All authors have read and agreed to the published version of the manuscript.

Funding

This research was funded by the National Natural Science Foundation of China (42171007).

Data Availability Statement

The data used in this paper can be accessed by contacting the corresponding author directly.

Acknowledgments

We would like to give a special thanks to Min Chen for her assistance in laboratory and fieldwork.

Conflicts of Interest

The authors declare no conflicts of interest.

References

  1. Maroukian, H.; Spyrou, E.; Tsiatoura, S.; Tzouxanioti, M.; Evelpidou, N. Sea Level Rise and the Future of Tombolos: The Case of Greece. J. Mar. Sci. Eng. 2024, 12, 1578. [Google Scholar] [CrossRef]
  2. Sanderson, P.G.; Eliot, I. Shoreline Salients, Cuspate Forelands and Tombolos on the Coast of Western Australia. J. Coast. Res. 1996, 12, 761–773. [Google Scholar]
  3. Johnson, D.W. Shore Processes and Shoreline Development; Wiley: New York, NY, USA, 1919. [Google Scholar]
  4. Morales, J.A.; Pérez-Alberti, A. Introducing the Spanish Coast. In The Spanish Coastal Systems: Dynamic Processes, Sediments and Management; Morales, J.A., Ed.; Springer: Cham, Switzerland, 2019; pp. 1–23. [Google Scholar] [CrossRef]
  5. Rodríguez-Vidal, J.; Finlayson, G.; Finlayson, C.; Negro, J.J.; Cáceres, L.M.; Fa, D.A.; Carrión, J.S. Undrowning a Lost World—The Marine Isotope Stage 3 Landscape of Gibraltar. Geomorphology 2013, 203, 105–114. [Google Scholar] [CrossRef]
  6. Gracia, F.J.; Del Río, L.; Aranda, M.; Anfuso, G.; Talavera, L.; Montes, J.B.; Benavente, J. Dunes in the Gibraltar Strait Realm. In The Spanish Coastal Systems; Morales, J.A., Ed.; Springer: Berlin/Heidelberg, Germany, 2018; pp. 661–680. [Google Scholar]
  7. Courtaud, J. Dynamiques Géomorphologiques et Risques Littoraux. Cas Du Tombolo de Giens (Var, France Méridionale); Université deProvence: Aix-en-Provence, France, 2000. [Google Scholar]
  8. Blanc, J.J. Recherches Sédimentologiques Littorales et Sous-Marines en Provence Occidentale. Ph.D. Thesis, Masson, Paris, France, 1959. [Google Scholar]
  9. Gosseaume, E. Le Tombolo Triple d’Orbetello (Toscane). Bull. Soc. Languedoc. Geogr. 1973, 7, 3–11. [Google Scholar]
  10. Anthony, E.J.; Blivi, A.B. Morphosedimentary evolution of a delta-sourced, drift-aligned sand barrier-lagoon complex, western Bight of Benin. Mar. Geol. 1999, 158, 161–176. [Google Scholar] [CrossRef]
  11. Blivi, A.; Anthony, E.J.; Oyede, L.M. Sand barrier development in the bight of Benin, West Africa. Ocean Coast. Manag. 2002, 45, 185–200. [Google Scholar] [CrossRef]
  12. Marriner, N.; Goiran, J.P.; Morhange, C. Alexander the Great’s tombolos at Tyre and Alexandria, eastern Mediterranean. Geomorphology 2008, 100, 377–400. [Google Scholar] [CrossRef]
  13. Zenkovich, V.P. Processes of Coastal Development; Oliver and Boyd: Edinburgh, UK, 1967. [Google Scholar]
  14. Specht, C.; Lewicka, O.; Specht, M.; Zblewski, S. Impact of Hydrotechnical Structures on Forming the Tombolo Oceanographic Phenomenon in Kołobrzeg and Sopot. TransNav Int. J. Mar. Navig. Saf. Sea Transp. 2021, 15, 687–694. [Google Scholar] [CrossRef]
  15. Mangor, K.; Dronen, N.K.; Kærgaard, K.H.; Kristensen, N. Shoreline Management Guide. Available online: https://www.dhigroup.com/marine-water/ebook-shoreline-management-guidelines (accessed on 1 January 2025).
  16. Davies, J.L. Geographical Variation in Coastal Development; Longman: London, UK, 1980. [Google Scholar]
  17. Goiran, J.P. Recherches Géomorphologiques Dans la Région Littorale d’Alexandrie en Egypte; Université de Provence-Aix-Marseille: Marseille, France, 2001. [Google Scholar]
  18. Flinn, D. The Role of Wave Diffraction in the Formation of St. Ninian’s Ayre (Tombolo) in Shetland, Scotland. J. Coast. Res 1997, 13, 202–208. [Google Scholar]
  19. Brocard, G.; Jean-Philippe Goiran, J.P.; Conforti, A.; Preusser, F.; Vitale, Q.; Jouvee, G.; Darrasa, L.; Benecha, C.; Vittoria, C.; Oberlinf, C.; et al. Double tombolo formation by regressive barrier widening and landside submergence: The case of Orbetello, Italy. Mar. Geol. 2024, 477, 107415. [Google Scholar] [CrossRef]
  20. Ward, S. Tombolo. In Encyclopedia of Geomorphology; Goudie, A.S., Ed.; Rutledge: London, UK; New York, NY, USA, 2004. [Google Scholar]
  21. Hansom, J.D. St Ninian’s Tombolo, Shetland. In Coastal Geomorphology of Great Britain; May, V.J., Hansom, J.D., Eds.; Geological Conservation Review Series No. 28; Joint Nature Conservation Committee: Peterborough, UK, 2003; pp. 458–462. [Google Scholar]
  22. Pirazzoli, P.A.; Stiros, S.C.; Arnold, M.; Laborel, J.; Laborel-Deguen, F.; Papageorgiou, S. Episodic uplift deduced from Holocene shorelines in the Perachora Peninsula, Corinth area, Greece. Tectonophysics 1994, 229, 201–209. [Google Scholar] [CrossRef]
  23. Malliouri, D.I.; Petrakis, S.; Vandarakis, D.; Kikaki, K.; Hatiris, G.-A.; Gad, F.-K.; Panagiotopoulos, I.P.; Kapsimalis, V. The Role of Sea State to the Morphological Changes of Prasonisi Tombolo, Rhodes Island, Greece. Water 2022, 14, 2016. [Google Scholar] [CrossRef]
  24. Da Fontoura Klein, A.H.; Junior, N.A.; De Menezes, J.T. Shoreline Salients and Tombolos on the Santa Catarina coast (Brazil): Description and analysis of the morphological relationships. J. Coast. Res. 2002, 36, 425–440. [Google Scholar] [CrossRef]
  25. Shigemura, T.; Takasugi, J.; Komiya, Y. Formation of tombolo at the west coast of Iwo-Jima. In Proceedings of the 19th International Conference on Coastal Engineering, Houston, TX, USA, 17–21 September 1984; pp. 1403–1419. [Google Scholar]
  26. Suh, K.D.; Hardaway, C.S. Calculation of Tombolo in shoreline numerical model. Proc. Coast. Eng. 1995, 3, 2653–2667. [Google Scholar] [CrossRef]
  27. Setyawan, W.B. Meulaboh Tombolo Response to Large Tsunami, West Coast of Sumatra Island, Indonesia. IOP Conf. Ser. Earth Environ. Sci. 2021, 750, 012019. [Google Scholar] [CrossRef]
  28. Ntafloukas, C.; Savvidis, Y. Climate-DrivenWave Analysis Reveals Changes in Alongshore Sediment Transport: The Case of the Coastal Zone of a Harbor in Thermaikos Bay (NW Aegean Sea). Water 2024, 16, 1703. [Google Scholar] [CrossRef]
  29. Baykal, C.; Özsoy, C. Quasi-2DH Modeling of the Shoreline Evolution Around an Offshore Breakwater. J. ETA Mar. Sci. 2024, 12, 238–252. [Google Scholar] [CrossRef]
  30. Chen, Z.; Xu, F.; Lin, P. Formation law of tombolos and its application in port construction. Acta Oceanol. Sin. 1984, 6, 117–127. (In Chinese) [Google Scholar]
  31. Cai, A.; Cai, Y. Formation of Gongqian Tombolo in Dongshan Island. Mar. Geol. Quat. Geol. 1990, 10, 81–92. (In Chinese) [Google Scholar]
  32. Zhang, H.; Zhu, E. The formation and evolution of the Chudao Island Tombolo. Period. Ocean Univ. China 1993, 23, 81–90. (In Chinese) [Google Scholar]
  33. Wang, Y.D. Morphological analysis of a tombolo associated with a wrecked ship. Port Eng. Technol 1989, 2, 31–39. (In Chinese) [Google Scholar]
  34. Yan, B. Hydrological characterization of Huizhou City. Guangdong Water Res. Hydropower 2004, 5, 73–76. (In Chinese) [Google Scholar]
  35. Huizhou Mucipal Bureau of Statistics and National Bureau of Statistics Huizhou Survey Team. In Huizhou Statistical Yearbook; China Statistics Press: Beijing, China, 2023.
  36. China Gulf Records Compilation Committee. China Gulf Records, V. 9; China Ocean Press: Beijing, China, 1998. (In Chinese) [Google Scholar]
  37. Huang, F.; Ye, C. Ocean Hydrology of Islands off the Coast of Guangdong; Guangdong Science and Technology Press: Guangzhou, 1995. (In Chinese) [Google Scholar]
  38. Zhou, G.Q.; Chen, P.Q. Geology of Islands off the Coast of Guangdong; Guangdong Science and Technology Press: Guangzhou, China, 1994. (In Chinese) [Google Scholar]
  39. Ahd, K.; Vargas, A.; Ala, R.; Hsu, J.R.C. Visual assessment of bayed beach stability with computer software. Comput. Geosci. 2003, 29, 1249–1257. [Google Scholar] [CrossRef]
  40. da Silva, P.G.; Sánchez, J.M.; Medina, R.; Beck, A.L.; Taji, M.A. On the use of satellite information to detect coastal change: Demonstration case on the coast of Spain. Coast. Eng. 2024, 191, 104517. [Google Scholar] [CrossRef]
  41. Yasso, W.E. Plan geometry of headland-bay beaches. J. Geol. 1965, 73, 702–714. [Google Scholar] [CrossRef]
  42. Hsu, J.R.C.; Evans, C. Parabolic bay shapes and applications. Inst. Civ. Eng. 1989, 87, 557–570. [Google Scholar] [CrossRef]
  43. Moreno, L.J.; Kraus, N.C.; Equilibrium Shape of Headland-Bay Beaches for Engineering Design. Coastal Defense Program Madrid (Spain). 1999. Available online: https://apps.dtic.mil/sti/pdfs/ADA483142.pdf (accessed on 20 April 2025).
  44. Manakul, C.; Mohanasundaram, S.; Weesakul, S.; Shrestha, S.; Ninsawat, S.; Chonwattana, S. Classifying Headland-Bay Beaches and Dynamic Coastal Stabilization. J. Mar. Sci. Eng. 2022, 10, 1363. [Google Scholar] [CrossRef]
  45. Lee, J.L. MeePaSoL: MATLAB-GUI Based Software Package; SKKU Copyright No. C-2015-02461; Sungkyunkwan University: Seoul, Republic of Korea, 2015. [Google Scholar]
  46. Hsu, J.R.C.; Benedet, L.; Klein, A.H.F.; Raabe, A.L.A. Appreciation of static bay beach concept for coastal management and protection. J. Coast. Res. 2008, 24, 198–215. [Google Scholar] [CrossRef]
  47. Silvester, R.; Hsu, J.R.C. Coastal Stabilization: Innovative Concepts; Prentice-Hall: Sudbury, NJ, USA, 1993. [Google Scholar]
  48. Hsu, J.R.C.; Yu, M.J.; Lee, F.C.; Benedet, L. Static bay beach concept for scientists and engineers: A review. Coast. Eng. 2010, 57, 76–91. [Google Scholar] [CrossRef]
  49. Ab Razak, M.S.; Nor, N.A.Z.M. XBeach process-based modelling of coastal morphological features near breakwater. EDP Sci. 2018, 203, 01007. [Google Scholar] [CrossRef]
  50. Konert, M.; Vandenberghe, J.E.F. Comparison of laser grain size analysis with pipette and sieve analysis—A solution for the underestimation of the clay fraction. Sedimentology 1997, 44, 523–535. [Google Scholar] [CrossRef]
  51. Fournier-Sowinski, J. Practical Handbook of Grain Size Analysis. Principles and Methods; Zenodo: Station Marine, France, 2024; p. 75. [Google Scholar] [CrossRef]
  52. Krumbein, W.C.; Pettijohn, F.J. Manual of Sedimentary Petrography; Appleton-Century: New York, NY, USA, 1938. [Google Scholar] [CrossRef]
  53. Folk, R.L.; Ward, W.C. Brazos River bar [Texas]; a study in the significance of grain size parameters. J. Sediment. Res. 1957, 27, 3–26. [Google Scholar] [CrossRef]
  54. Wang, W.; Wu, Z. A Matlab method of graphical calculation for grain size parameters. Trop. Geogr. 2006, 26, 239–242. (In Chinese) [Google Scholar]
  55. Carmona, P.; Ruiz, J.M. Geomorphological and geoarchaeological evolution of the coastline of the Tyre tombolo: Preliminary results. Bull. Archéol. Archit. Libanaises Hors-Série 2004, 1, 207–219. [Google Scholar]
  56. Coghlan, I.; Carley, J.T.; Harrison, A.J.; Vos, K.; Lenehan, N.; Wiecek, D. Broulee: An Island No More? In Proceedings of the 27th NSW Coastal Conference 2018, Merimbula, NSW, Australia, 7–9 November 2018. [Google Scholar] [CrossRef]
  57. United States Department of Agriculture. Engineering Field Handbook, Chapter 2—Estimating Runoff Volume and Peak Discharge. 2021. Available online: https://directives.nrcs.usda.gov/sites/default/files2/1712930818/31754.pdf (accessed on 20 April 2025).
  58. Castelle, B.; Robinet, A.; Idier, D.; D’Anna, M. Modelling of embayed beach equilibrium planform and rotation signal. Geomorphology 2020, 369, 107367. [Google Scholar] [CrossRef]
  59. Valiente, N.G.; Masselink, G.; Scott, T.; Conley, D.; McCarroll, R.J. Role of waves and tides on depth of closure and potential for headland bypassing. Mar. Geol. 2019, 407, 60–75. [Google Scholar] [CrossRef]
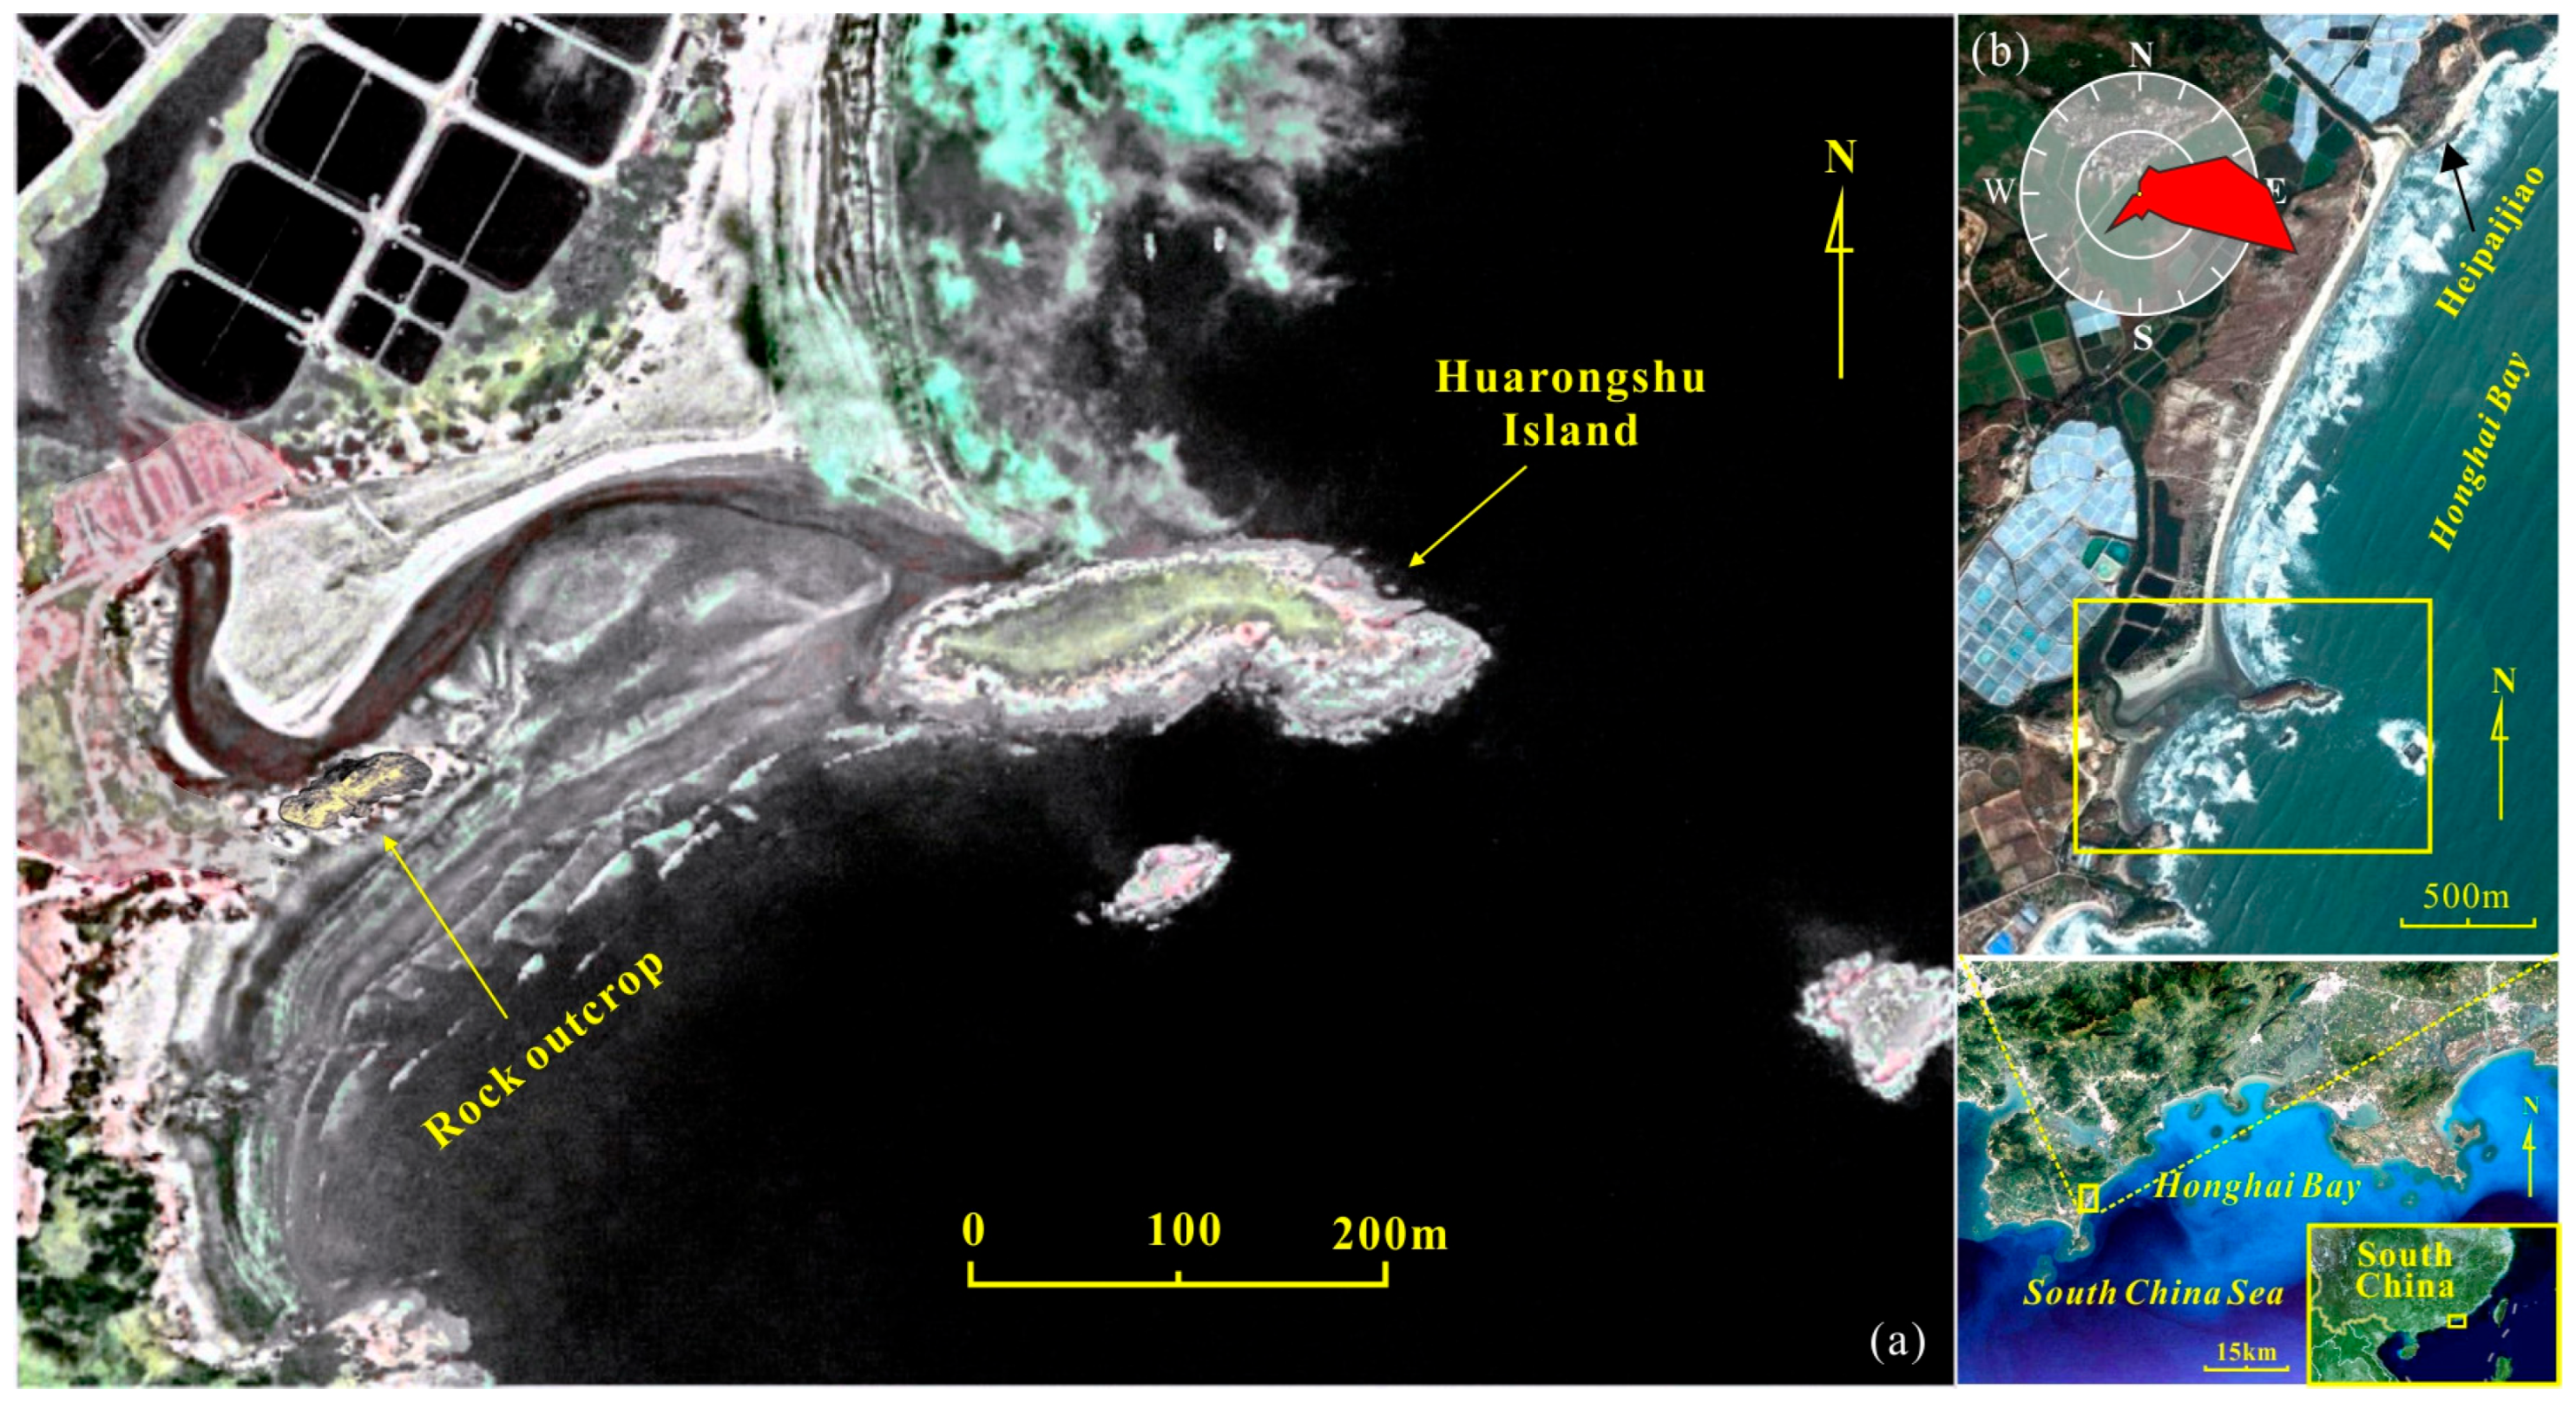
Figure 1. Location of the Huarongshu tombolo. (a) The Huarongshu tombolo, Huarongshu Island, and the rock outcrop situated in the middle of the southern beach. (b) A comprehensive view of the Huarongshu tombolo, showing its southern and northern beaches. The rose diagram at the top quantifies the annual average wave climates based on data from Zhelang Station.
Water 17 01510 g001
Figure 2. Data from meteorological stations, hydrological stations, tidal stations, and wave observatories around the study site. (a-1) Monthly average rainfall at Huiyang Station between 1953 and 2016; (a-2) Monthly average rainfall at Shanwei Station between 1953 and 2016. (b) The highest water level recorded at Danshui Station between 2008 and 2022. (c) Monthly mean tidal range at Shanwei Station (data duration: 1970–1990); (d) Maximum and average wave heights, as well as wave frequencies, at Zhelang from 1960 to 1992.
Water 17 01510 g002
Figure 3. Geological and geomorphological background of the study area. (a) Geology of the study area. (b) Geomorphology of the Huarongshu tombolo and its geomorphological limiting parameters.
Water 17 01510 g003
Figure 4. The definition sketch for calculating the parabolic bay shape equation (Equation (2)).
Water 17 01510 g004
Figure 5. Plan view (left) and schematized cross-shore bed level (right) of model bathymetry setting. (Tp: peak wave period; θ: spectral direction; Hrms: Initial wave height; Hs: wave height; D50: median grain size; D90: grain size where 90% of the particles are smaller).
Water 17 01510 g005
Figure 6. Sampling sites for the surface samples of Huarongshu tombolo on 23 November 2021 and 13 July 2022.
Water 17 01510 g006
Figure 7. The geomorphological variations of the Huarongshu tombolo from 2009 to 2022. Numbers in brackets are real-time water levels relative to the Pearl River Datum.
Water 17 01510 g007
Figure 8. The morphological variations of the Huarongshu tombolo tip from 2009 to 2022. Numbers in brackets are real-time water levels relative to the Pearl River Datum.
Water 17 01510 g008
Figure 9. Variations in equilibrium shoreline of beaches on both sides of the Huarongshu tombolo from 2009 to 2022.
Water 17 01510 g009
Figure 10. XBeach simulation: (a) Wave refraction and diffraction induced by oblique incident waves. (b) Wave diffraction occurring when incident waves approach the shoreline perpendicularly. (c) Deposition on one side and erosion on the other side behind the breakwater due to oblique incident waves. (d) Deposition behind the breakwater and erosion on both sides caused by normally incident waves. The yellow thick arrows indicate the direction of wave incidence, the red dashed lines represent the original depth contours, and the initial seabed slope is 1:50.
Water 17 01510 g010
Figure 11. The grain size distributions of beach deposits and sampling points in winter and summer. (a) Particle size distribution and sampling points on the beach in winter 2021; (b) Particle size distribution and sampling points on the beach in summer 2022.
Water 17 01510 g011
Figure 12. Schematic diagram illustrating the formation process of a tombolo behind a breakwater as a result of wave diffraction and refraction. (a-1) Wave refraction caused by oblique waves generates longshore currents. (a-2) Wave diffraction occurs in the breakwater’s shadow zone. (b-1) Waves approaching from the left lead to deposition on the left side and erosion on the right side behind the breakwater. (b-2) Incident waves approaching the shoreline perpendicularly result in deposition on both sides of the breakwater’s lee zone.
Water 17 01510 g012
Figure 13. A brief summary of a tombolo alternating with a double tombolo or a salient due to variations in sediment supply (the size of the red arrows indicates the amount of sediment). (a) Sediment transported by the combined effects of strong river flows and strong waves; (b) Sediment transported by the combined effects of strong waves and weak river flows; (c) Sediment transported by the combined effects of strong river flows and weak waves; (d) Sediment trans-ported by the combined effects of weak river flows and weak waves.
Water 17 01510 g013
Table 1. Statistics of grain samples from tombolo surface sediments.
Sample
Location
Mean Size
(Mz Φ)
Sorting
(σ1)
Asymmetry
(Sk1)
Kurtosis
(KG)
SE-12.350.47−0.031.00
SE-22.430.46−0.000.98
SE-31.910.65−0.061.03
SE-42.310.45−0.020.96
SE-52.280.52−0.030.93
SE-62.360.47−0.030.95
SE-72.410.50−0.011.00
SW-12.300.51−0.030.98
SW-22.080.57−0.081.09
SW-32.410.60−0.061.03
WN-12.390.53−0.021.00
WN-22.450.790.141.10
WN-32.200.48−0.010.99
WN-42.420.50−0.010.98
WN-52.310.51−0.030.94
WN-62.59047−0.010.99
WN-72.210.74−0.251.10
Disclaimer/Publisher’s Note: The statements, opinions and data contained in all publications are solely those of the individual author(s) and contributor(s) and not of MDPI and/or the editor(s). MDPI and/or the editor(s) disclaim responsibility for any injury to people or property resulting from any ideas, methods, instructions or products referred to in the content.