1. Introduction
Global climate change has been posing serious challenges to water resources, with far-reaching impacts on the livelihoods of millions of people around the world (Gomez-Gomez, et al. [
1,
2,
3]. The Mekong River Basin (MRB), one of the largest and most important river systems in Southeast Asia, is no exception to this trend. With a dense population and an economy heavily dependent on agriculture, fisheries, and freshwater resources, the region is particularly sensitive to climate impacts, especially drought [
4]. In recent decades, the severity and frequency of droughts are projected to increase due to global warming and climate change [
5]. Drought is one of the costliest natural disasters in the MRB [
6,
7]. Under the impact of climate change, drought conditions in the MRB are becoming increasingly severe, affecting the lives of communities residing in the basin, destroying their crops and fisheries, and causing food shortages due to reduced livelihoods. Before issues related to hydropower reservoirs, climate change, and changes in agricultural practices are appropriately addressed, accurately assessing future drought conditions to minimize damage and developing sustainable and effective water resource management strategies in the area are necessary as soon as possible.
Studies in the MRB highlight diverse drought impacts: agricultural and hydrological droughts have intensified (2001–2021), while ecological droughts show a declining trend, with croplands experiencing fewer events compared to forests [
8]. In Cambodia, rice yields increased (2000–2016) despite drought variability, driven by fertilizer use, though drought–yield link was found [
9]. Long-term projections (1954–2099) suggest potential rice yield increases due to elevated CO2, but drought-induced precipitation declines could reduce yields in regions like Vietnam’s Central High Plain [
10]. Drought assessments vary depending on the meteorological, hydrological, agricultural, and economic dimensions of drought. These assessments are generally conducted by calculating various indices [
11], such as the Standardized Precipitation Index (SPI) [
12], the Standardized Precipitation Evapotranspiration Index (SPEI) [
13], and the Effective Drought Index (EDI) [
14] for meteorological drought; the Standardized Runoff Index (SRI) [
15] and Standardized Streamflow Index (SDI) [
16] for hydrological drought; the Standardized Soil Moisture Index for agricultural drought (SSI) [
17]; and the Socioeconomic Drought Index for evaluating the socioeconomic impacts of drought (SeDI) [
18]. Among these, the SPI and SPEI are the most widely used drought indices in numerous studies [
19,
20,
21,
22,
23,
24]. While it does not directly provide data on flow or soil moisture, it can effectively infer flow-related information for identifying hydrological drought [
25] and soil moisture conditions essential for addressing agricultural drought [
26]. SPI and SPEI were selected for this study due to their widespread use and effectiveness in assessing meteorological drought and water balance, whereas indices like SRI or SeDI, while valuable, are less commonly applied in the Mekong Basin context.
Recently, many studies have assessed and predicted drought in the Mekong River Basin (MRB). Tuong, et al. [
27] used the SPI index and the Mann–Kendall method to assess drought. Zhang and Liu [
7] analyzed the long-term trends and interannual variations of meteorological and hydrological drought using long-term global precipitation data (1901–2016) and daily streamflow data (1985–2016). Coupled Model Intercomparison Project (CMIP)” includes phases 5 and 6, such as CMIP5 and CMIP6, which are widely used in research on the assessment and prediction of climate change and drought [
28,
29,
30]. Thilakarathne and Sridhar [
31] predicted future changes in drought in the lower Mekong using various CMIP models from the National Aeronautics and Space Administration (NASA). Kang et al. [
10] determined the impacts of climate change on drought and rice production in the MRB using historical and future climate data (1954–2099) with four climate models and two emission scenarios from CMIP5. Overall, most studies either assess and forecast drought considering global climate scenarios or consider climate change scenarios but only for specific areas within the MRB. Additionally, the use of CMIP6 is still very limited in forecasting future drought for the entire MRB, although GCM models from CMIP6 have shown effectiveness in reproducing drought events more accurately than CMIP5 [
32,
33,
34].
The use of the CMIP6 model to assess drought for a specific area requires checking the suitability of the data. A common method is to compare historical simulations of the CMIP6 models with observational values to evaluate the model’s suitability. However, for large basins covering multiple countries, using measurement stations is very challenging. In the study, CMIP6-simulated data for the past are compared with the European Center for Medium-Range Weather Forecasting (ECMWF) Reanalysis fifth generation (ERA5) [
35], as proposed by previous studies [
36,
37,
38]. In this study, we propose to assess drought conditions in the MRB based on climate change scenarios from CMIP6, in which historical simulations of CMIP6 GCMs were assessed with respect to the ERA5 reanalysis dataset. Data from the ERA5 source, the drought indices SPI and SPEI, are reliable bases used for drought assessment in many studies [
39,
40,
41].
This study used a combination of qualitative and quantitative analysis to evaluate drought characteristics, including duration, intensity, and severity, using SPI and SPEI. They were calculated from precipitation and temperature data of the SSP245 and SSP585 emission scenarios from the CMIP6 model, covering two important future periods in the second half of the 21st century, 2041–2070 and 2071–2100. Using zonal statistical methods, the research area divided the basin into 28 zones, allowing for the detection and analysis of climate variability. The Mann–Kendall method was applied to quantify and identify trends, providing a concrete view of the future of drought in the region. This paper provides information for policymakers and water resource managers, toward a more sustainable future for the Mekong River Basin. This study utilized CMIP6 models for the entire Mekong River Basin, the integration of multiple temporal scales (1, 3, 6, 12 months) with SPI and SPEI indices, and the detailed zoning approach (28 ecological zones) to assess spatial variability under SSP245 and SSP585 scenarios.
2. Methodology and Data
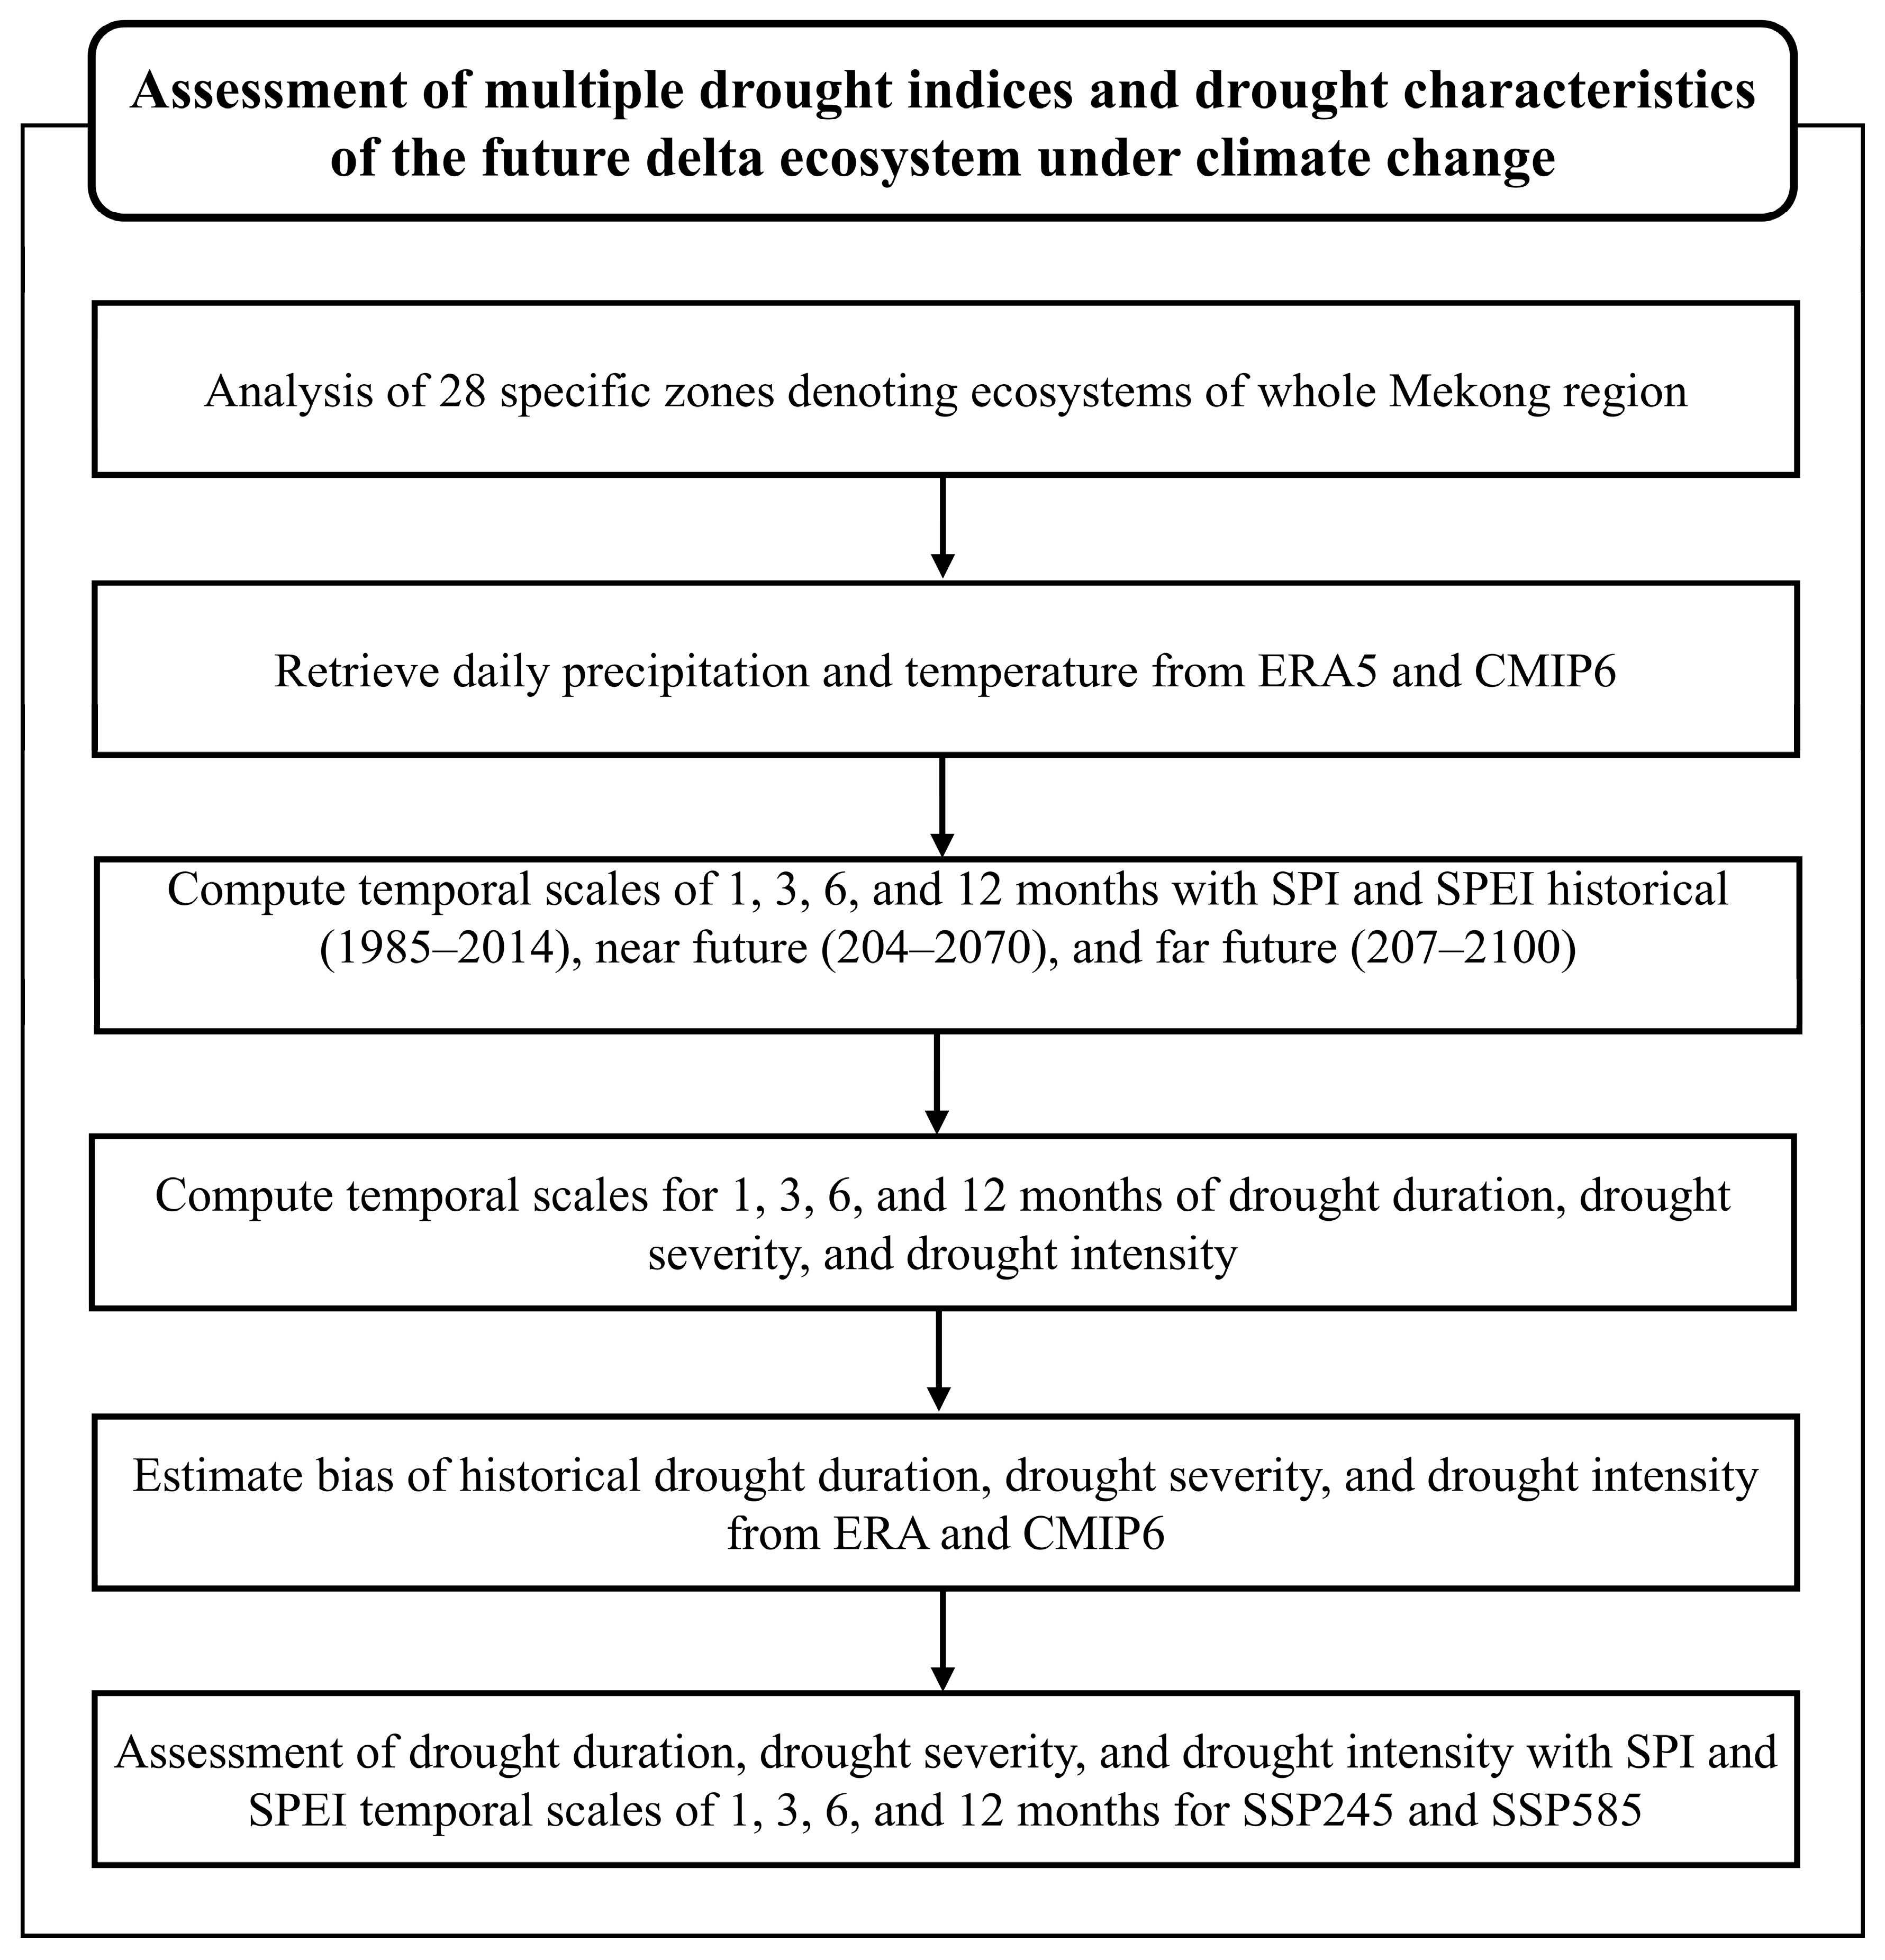
Figure 1 illustrates the process of assessing drought using multiple drought indices and temporal scales for the future of the Mekong’s ecological zones. The first step involves identifying these ecological zones. Then, precipitation and temperature data are collected from ERA5 and CMIP6 models. The SPI and SPEI drought indices are calculated for both the historical period (1985–2014) and the future (2041–2070) at 1-, 3-, 6-, and 12-month scales. Additionally, drought characteristics such as duration, severity, and intensity are computed. The discrepancies in drought characteristics are evaluated using CMIP6 and ERA5 data for the past. Future drought levels and trends are assessed using SPI and SPEI across the 1-, 3-, 6-, and 12-month temporal scales. The role of precipitation and evaporation in future drought assessment in the Mekong region will be presented in the discussion section.
2.1. Mekong Basin
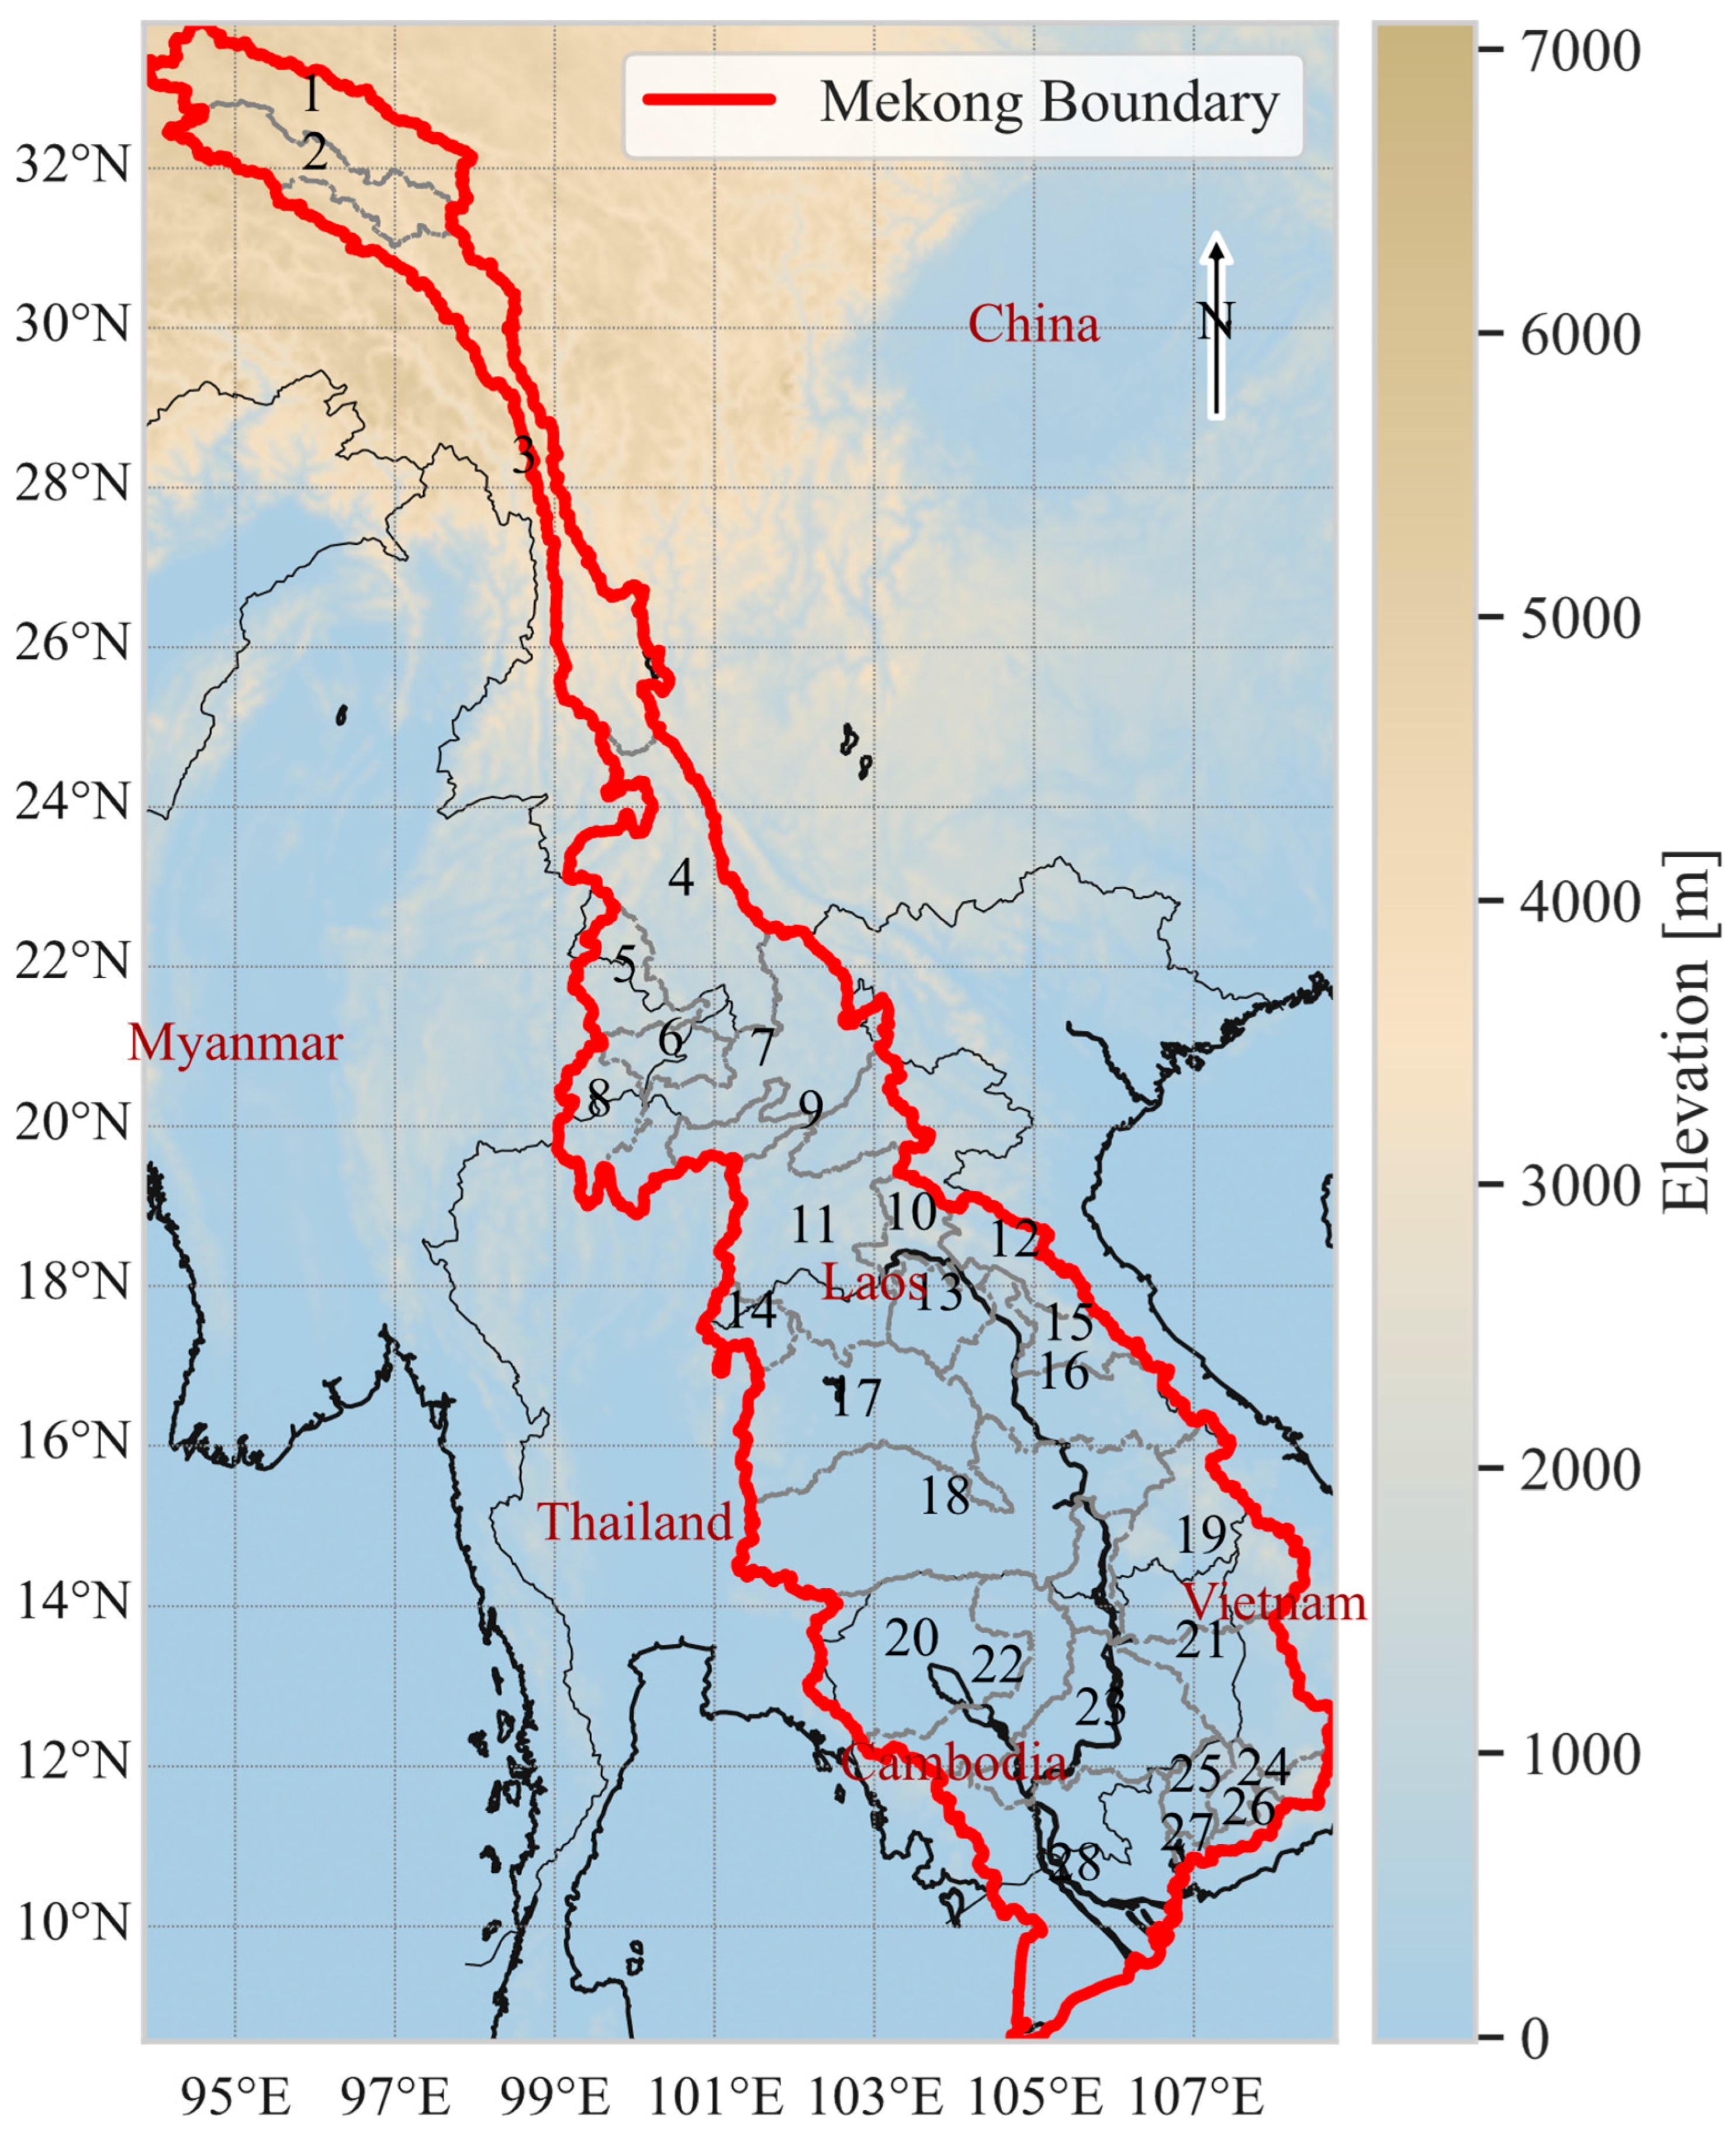
Figure 2 shows that the Mekong River originates in the Tibetan Plateau, which is characterized by high and complex mountain topography. These high mountain ranges play an important role in providing snowmelt runoff in the spring and summer, contributing to the maintenance of the river’s water flow. Moving south, the terrain gradually changes to narrow valleys and lower mountains as it passes through northern Laos and Myanmar, creating areas of steep slopes and affecting the flow rate and soil erosion potential. The terrain becomes flatter in the lowlands of Laos, Thailand, Cambodia, and Vietnam as it moves south. The vast alluvial plains in the lower reaches, especially the Mekong Delta, are important for agriculture, especially rice cultivation, thanks to the rich silt deposited by the river every year. The transition from high mountains to lowlands creates diverse ecosystems and habitats, supporting a rich and diverse ecosystem. In addition, the climate of the Mekong Basin is strongly influenced by the tropical monsoon, with a rainy season from May to October and a dry season from November to April. Heavy precipitation is concentrated mainly during the rainy season, resulting in an uneven distribution of water resources and complicating water resource forecasting and management. These pose challenges in water resource management and sustainable development, especially in climate change and the increase in development activities such as hydropower dam construction.
We divided the Mekong River Basin into 28 zones (shown in
Table 1) to facilitate a more detailed and accurate analysis of climate and hydrological characteristics. This regionalization allowed us to clearly identify areas of vulnerability and different impacts of climate change in each specific region. This approach has proven effective in providing more detailed information on the uneven distribution of climate events, as well as supporting the development of effective and appropriate water resource management strategies for each region. In the current study, we continue to apply this zoning method to further assess the impacts of climate change, using data from CMIP6 climate models, to provide a comprehensive and highly practical view for the management and sustainable development of the Mekong River Basin.
2.2. Retrieving Data from ERA and CMIP6 Models
ERA5 data are used as references for CMIP6 simulations due to their outstanding advantages in assessing the climate characteristics of the Mekong River Basin. ERA5 provides data with a high resolution of about 31 km, allowing detailed analysis of climate phenomena at the sub-regional level, which is especially important for assessing drought characteristics. Furthermore, ERA5 provides a consistent and long-term data series from 1979 to the present, allowing for effective comparison and contrast with future climate simulation data. The reliability of ERA5 is enhanced by the integration of data from multiple sources, including satellite and ground observations, making them the preferred choice for assessing climate change [
24,
43]. These advantages make ERA5 a powerful and suitable tool, not only to validate but also to improve the accuracy of climate simulations from CMIP6, making an important contribution to drought research in the region.
We employed the NASA NEX-GDDP-CMIP6 dataset, which underwent downscaling and bias correction, achieving a spatial resolution of about 25 × 25 km [
44]. This dataset includes two SSP scenarios: SSP2-45 and SSP5-85 [
44,
45]. These CMIP6 models were crafted to align with the goals of the IPCC AR6, concentrating on climate projections across different socioeconomic scenarios [
46]. The data were downscaled through the Bias-Correction Spatial Disaggregation method to overcome typical GCM output limitations [
47,
48]. The performance of GCMs is influenced by various elements, such as the algorithm used and baseline conditions, which lead to different accuracy levels in simulating specific regions and basins [
49]. Research by Tran, et al. [
50], Park, et al. [
51], and Thrasher, Wang, Michaelis, Melton, Lee and Nemani [
44] has shown that the BCC-CSM2-MR, CanESM5, MIROC6, and MRI-ESM2-0 models are highly effective for future climate research, which is why we chose them for our study. Furthermore, Chen, et al. [
52] have demonstrated the strong performance of these GCMs in predicting a variety of future streamflow changes, while Wang, et al. [
53] highlighted the unique strengths of CanESM5 and BCC-CSM2-MR in providing reliable precipitation results. Notably, these models exhibit good correlation with other GCMs [
53]. Moreover, Peng, et al. [
54] pointed out that MIROC6 and MRI-ESM2-0 show exceptional reliability in forecasting temperature and precipitation, surpassing the other 17 GCMs. The four GCMs (BCC-CSM2-MR, CanESM5, MIROC6, MRI-ESM2-0) were chosen based on their high performance in simulating climate conditions in Southeast Asia, as evidenced by prior studies. Our study analyzed two SSP scenarios, representing intermediate (SSP2-45) and high-end (SSP5-85) greenhouse gas emission levels [
44]. The details of these GCM models are summarized in
Table 2.
2.3. Computing Drought Indices (SPI, SPEI)
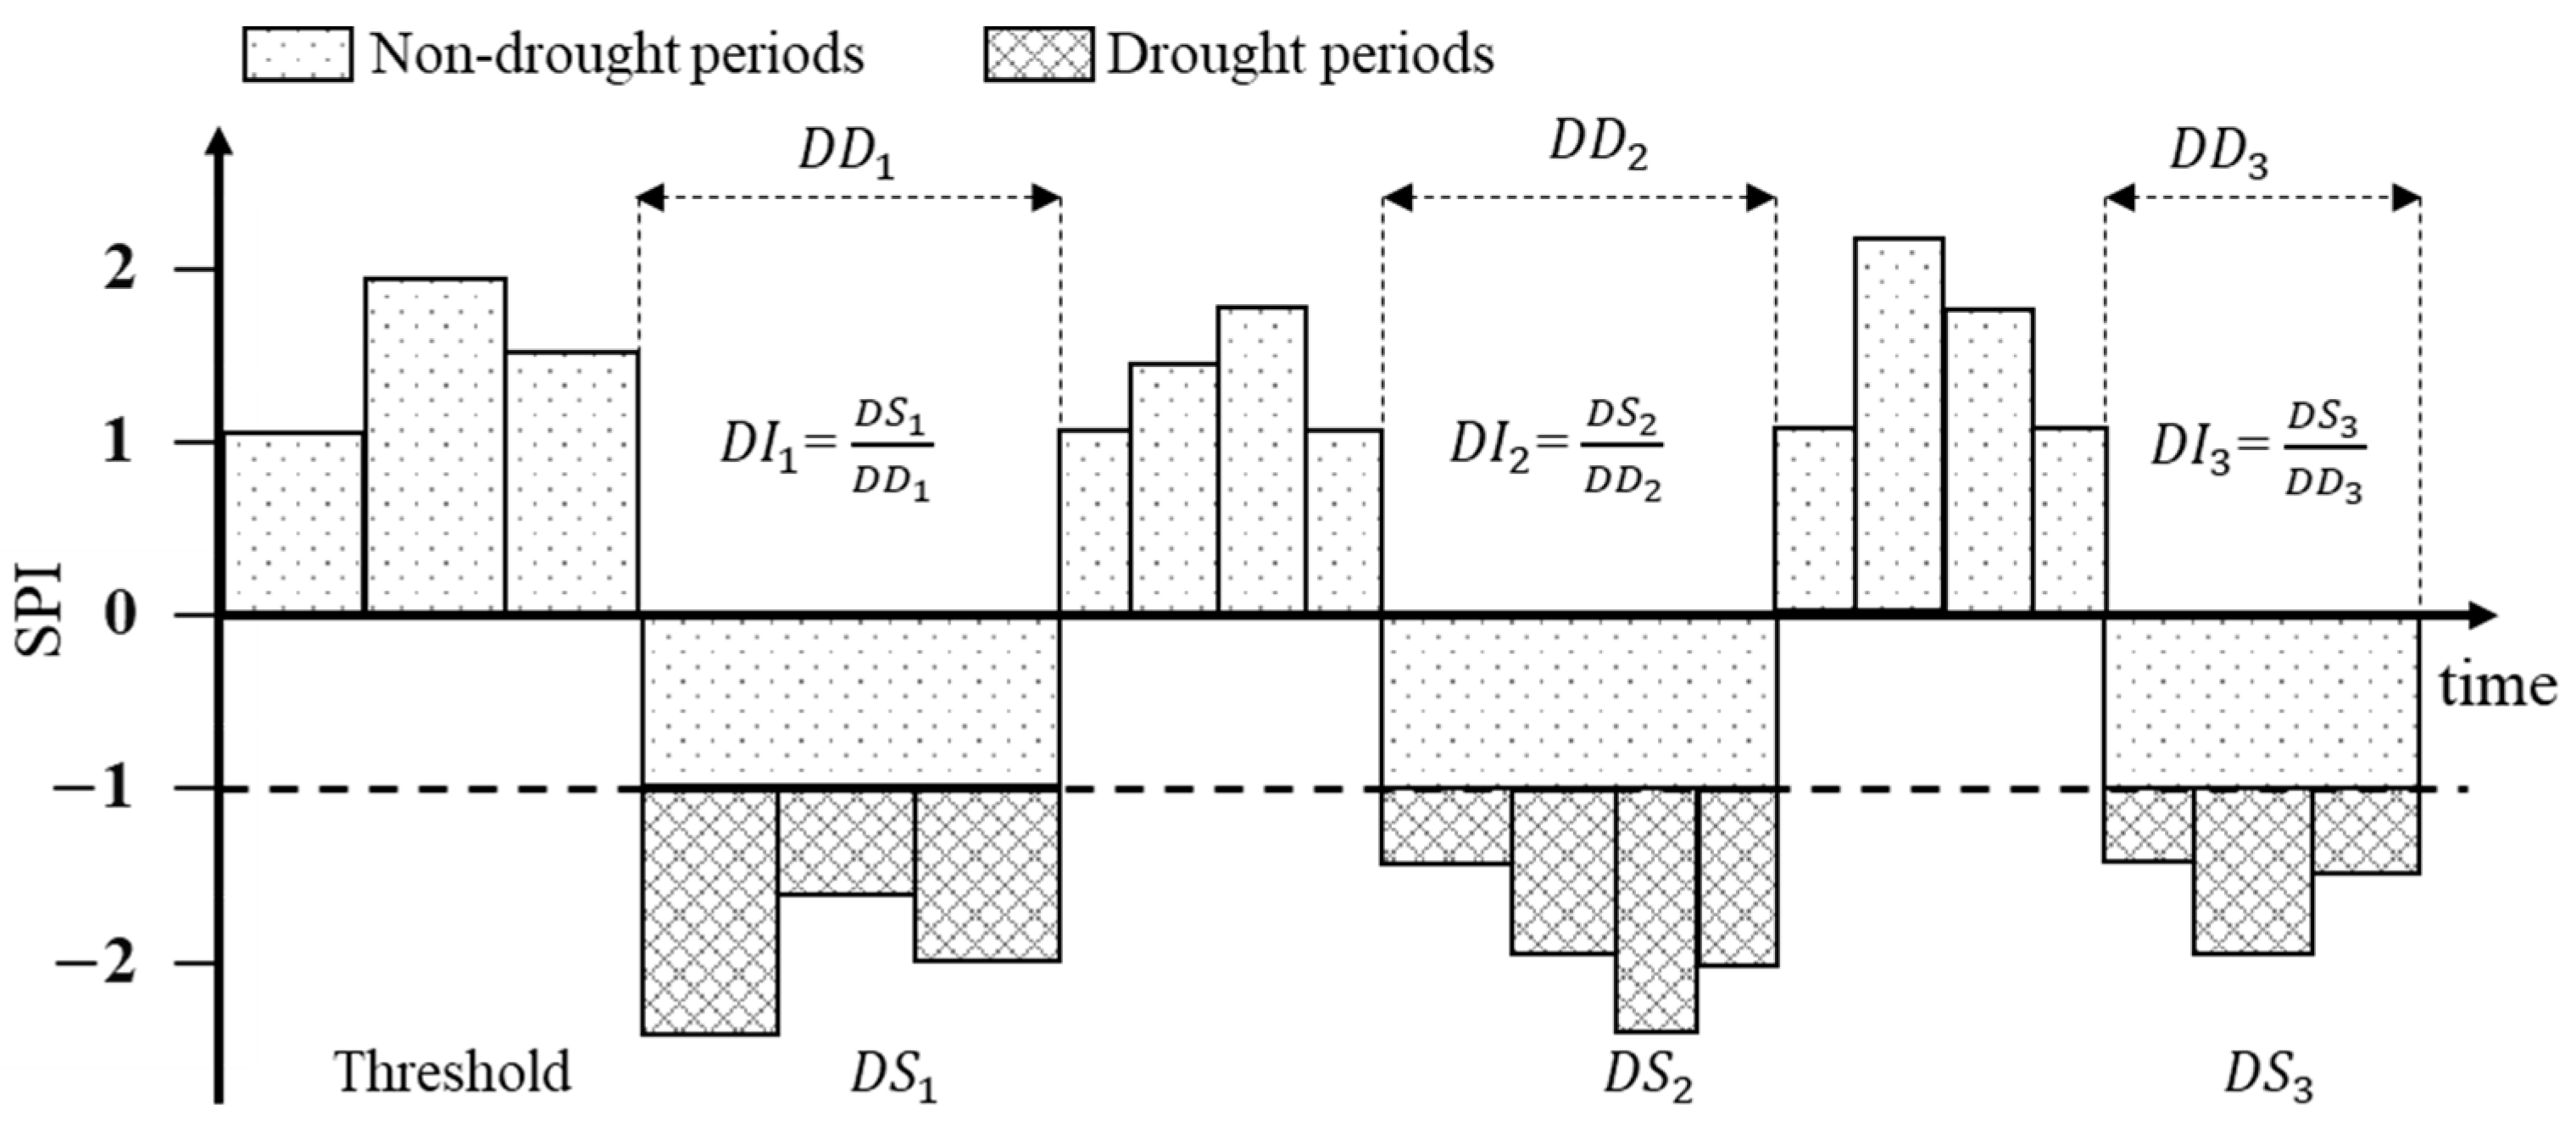
The Standardized Precipitation Index (SPI) is a popular tool for assessing meteorological drought, used to describe the deficit or excess of precipitation over a given period. The SPI is calculated by standardizing the cumulative precipitation over a given period relative to its long-term average, usually using a gamma probability distribution. The Standardized Precipitation Evapotranspiration Index (SPEI) extends the concept of the SPI by incorporating both precipitation and potential evapotranspiration (PET), helping to assess drought from a water balance perspective. The SPEI is calculated by taking the difference between precipitation and PET, then normalizing it in a similar way to the SPI. SPI and SPEI classifications are based on
Table 3. The characteristics of drought calculated according to the Run theory [
55], including drought duration, drought severity, and drought intensity [
56], are presented in
Figure 3.
The Standardized Precipitation Index (SPI) was calculated to assess meteorological drought by standardizing precipitation data over multiple temporal scales (1, 3, 6, and 12 months), following McKee, Doesken and Kleist [
12]. Monthly precipitation data from ERA5 (1985–2014) and CMIP6 models (historical and future periods: 2041–2070 and 2071–2100 under SSP245 and SSP585) were aggregated for each scale. A gamma distribution was fitted to historical precipitation for each month and scale using maximum likelihood estimation, with zero precipitation handled by computing the probability of zero (
) and fitting the gamma to non-zero values. The cumulative distribution function (CDF) was adjusted as
, where
is the gamma CDF is and transformed to a standard normal distribution using
. The numerical standardization was facilitated by the approximation of Abramowitz and Stegun [
57]. SPI values < −1.0 indicate drought, with thresholds defined in
Table 3. Historical SPI from CMIP6 was validated against ERA5 using cumulative distribution functions.
The Standardized Precipitation Evapotranspiration Index (SPEI) was computed to evaluate drought considering both precipitation and evapotranspiration, following Vicente-Serrano, et al. [
58] and Beguería, Vicente-Serrano, Reig and Latorre [
13]. Monthly precipitation and temperature data from ERA5 (1985–2014) and CMIP6 models (historical and future periods) were used. Potential evapotranspiration (PET) was estimated using the Thornthwaite method, calculated as
, where
is monthly temperature,
is the annual heat index,
is a coefficient, and
adjusts for latitude and days per month. The water balance was derived as
, aggregated over temporal scales (1, 3, 6, 12 months). A log-logistic distribution was fitted to historical
for each month and scale, and the CDF,
, was transformed to a standard normal distribution using
. The same numerical approximation as for SPI was applied. Historical SPEI from CMIP6 was validated against ERA5 using cumulative distribution functions.
Table 3.
Drought category based on SPI and SPEI values [
59,
60].
Table 3.
Drought category based on SPI and SPEI values [
59,
60].
| Drought Category | Probability (%) | SPI/SPEI Values |
|---|
| Extreme wet | 2.3 | 2.0 |
| Very wet | 4.4 | 1.5 .0 |
| Moderate wet | 9.2 | 1.0 |
| Near normal | 68.2 | −1.0 .0 |
| Moderate drought | 9.2 | −1 |
| Severe drought | 4.4 | −2 |
| Extreme drought | 2.3 | ≤−2.0 |
2.4. Computing Drought Trend Using Mann–Kendal
Mann–Kendall [
61,
62] was used to detect the trends of historical droughts in the MKB. This method considers data distribution and can cope with outliers. The processing of the Mann–Kendall test follows the following Equations (1)–(5):
where
is the run homogeneous test result, R is the run number,
is the number of values lower than medium, and
is the number of values higher than the median. If the
value corresponds to 5% significance level or below, then the data are non-homogenous. The only homogeneous data are used to determine trend conditions.
The Mann–Kendall test is computed following Equations (2)–(5) below.
The positive value means an increasing trend, negative value means a decreasing trend, and zero value means no trend. is the variance, and S is the Kendall sum statistic. The difference between each consecutive value is computed as positive (+1), negative (−1), and neural (0). and are the value of time series at time j among n observational values. The trend is considered significant if is higher than the significant levels. For instance, the confidence level of 90% has .
3. Results
3.1. Evaluate the Performance of the CMIP6
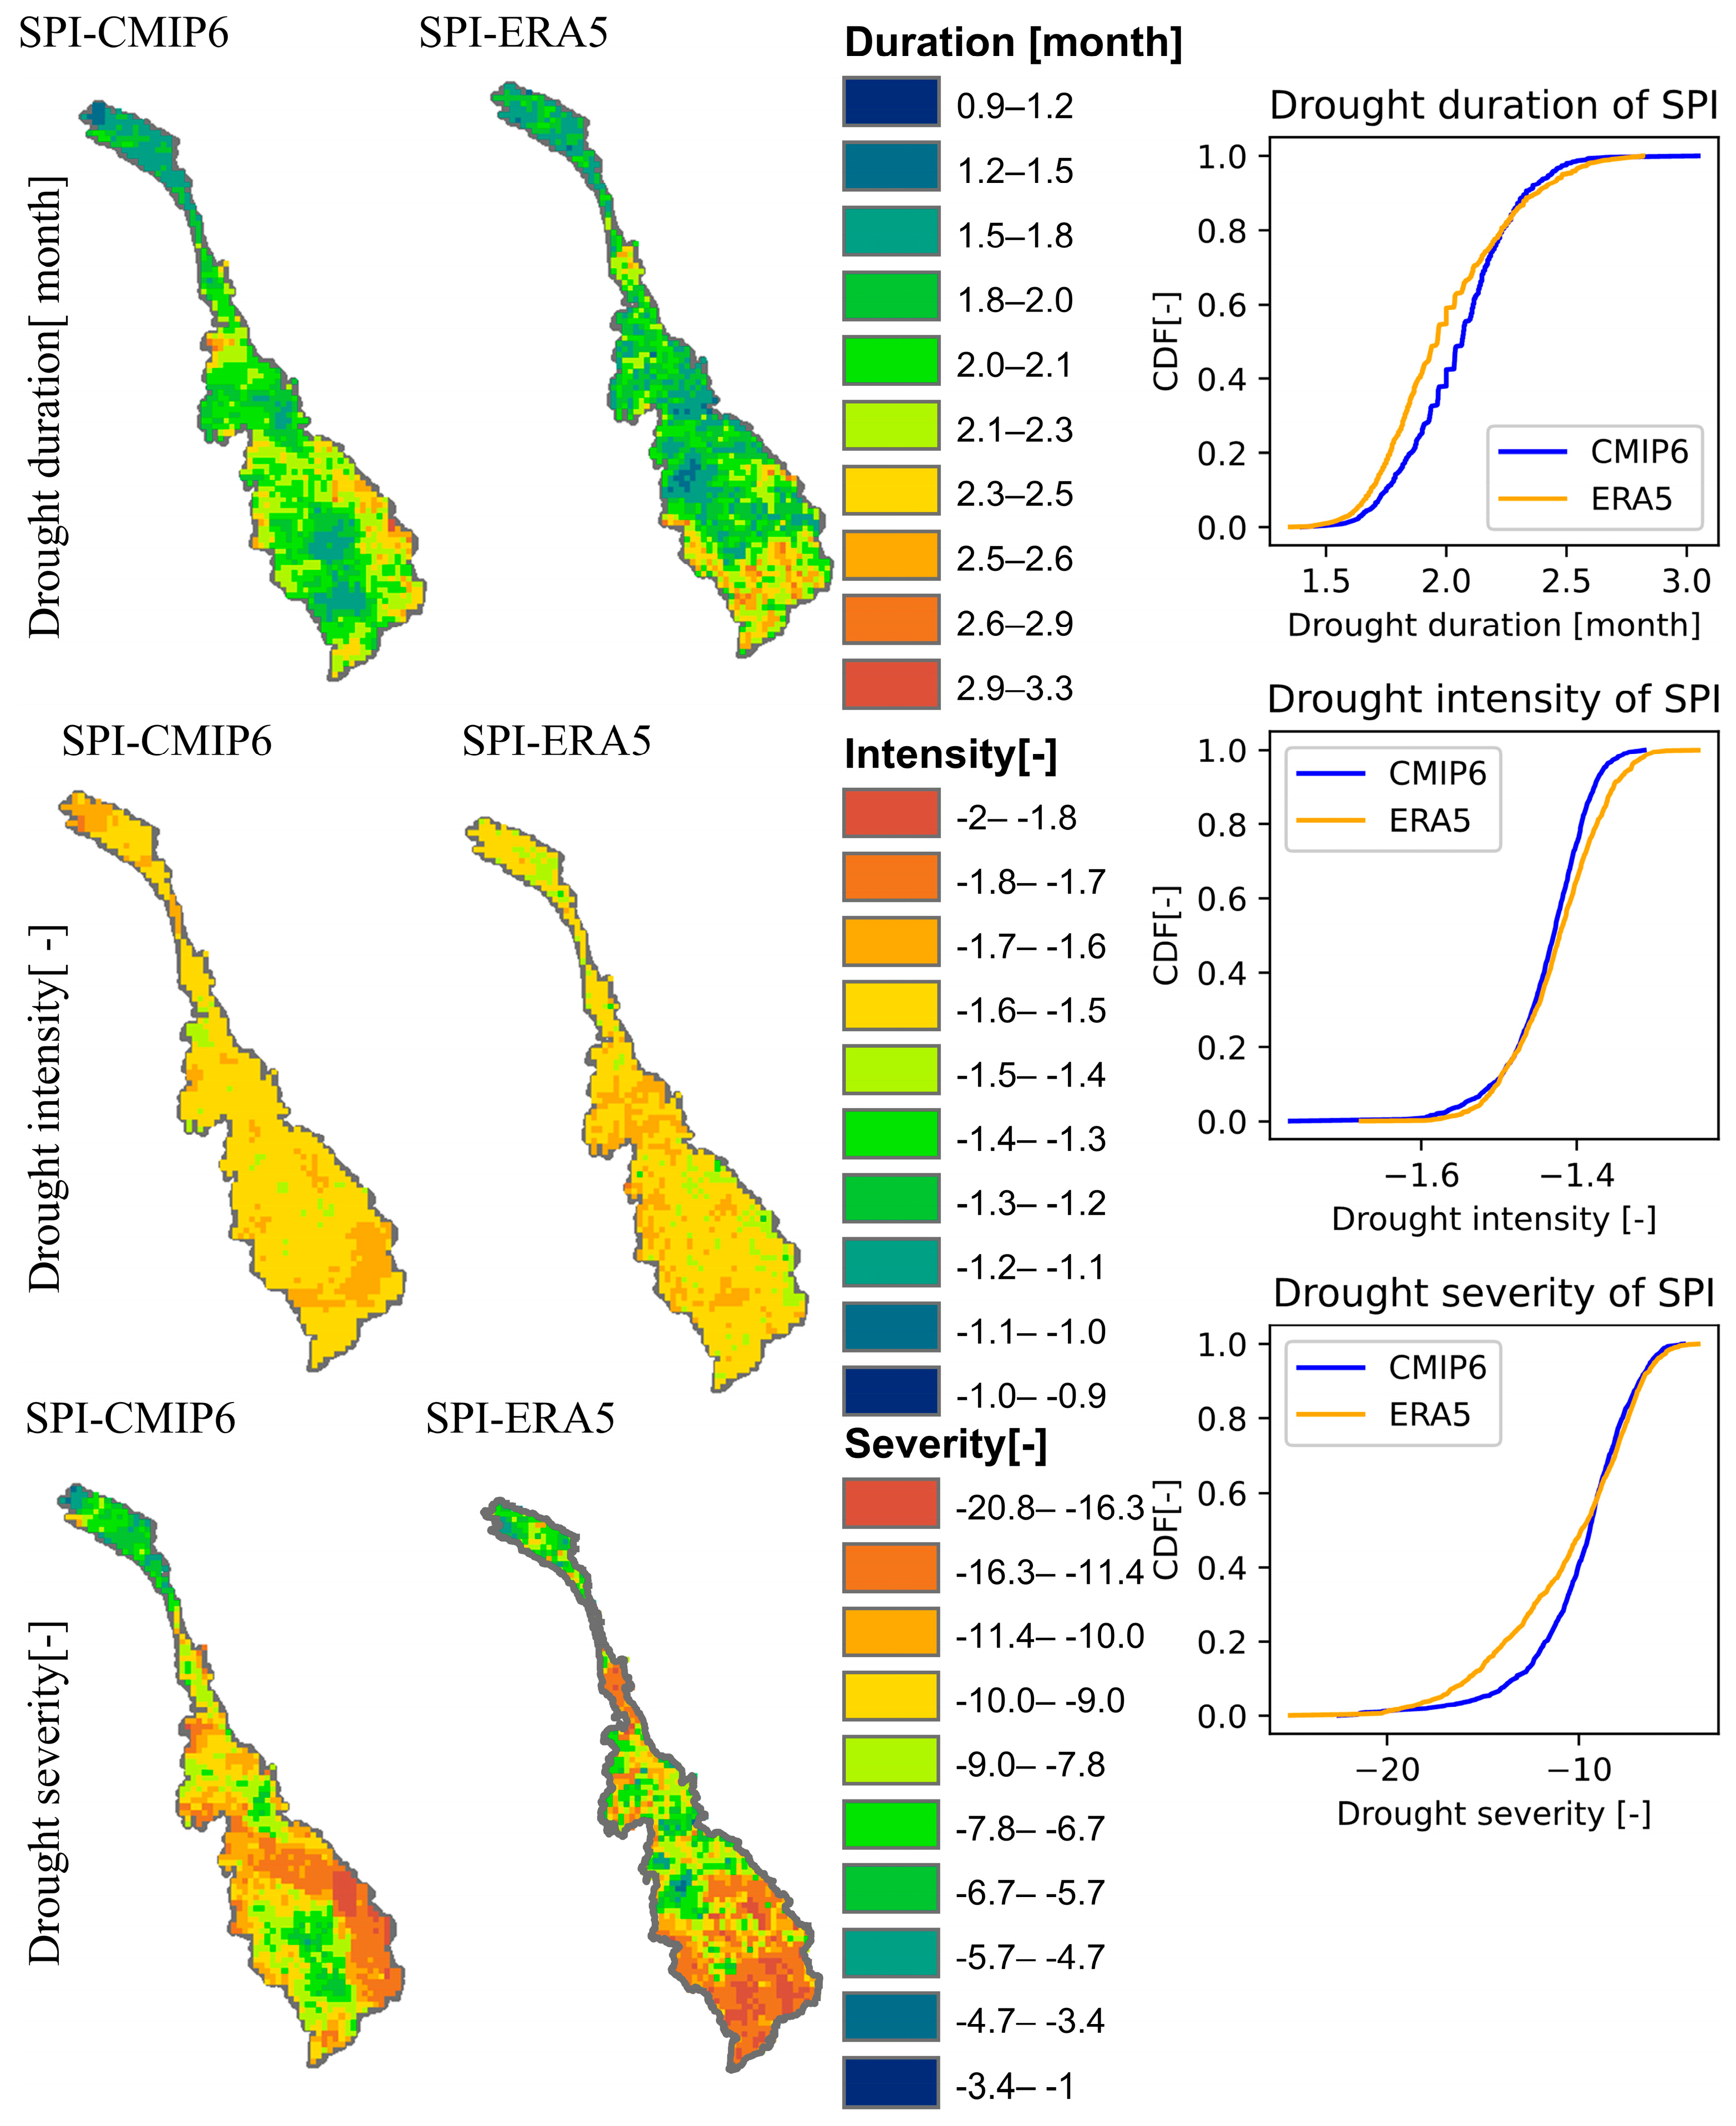
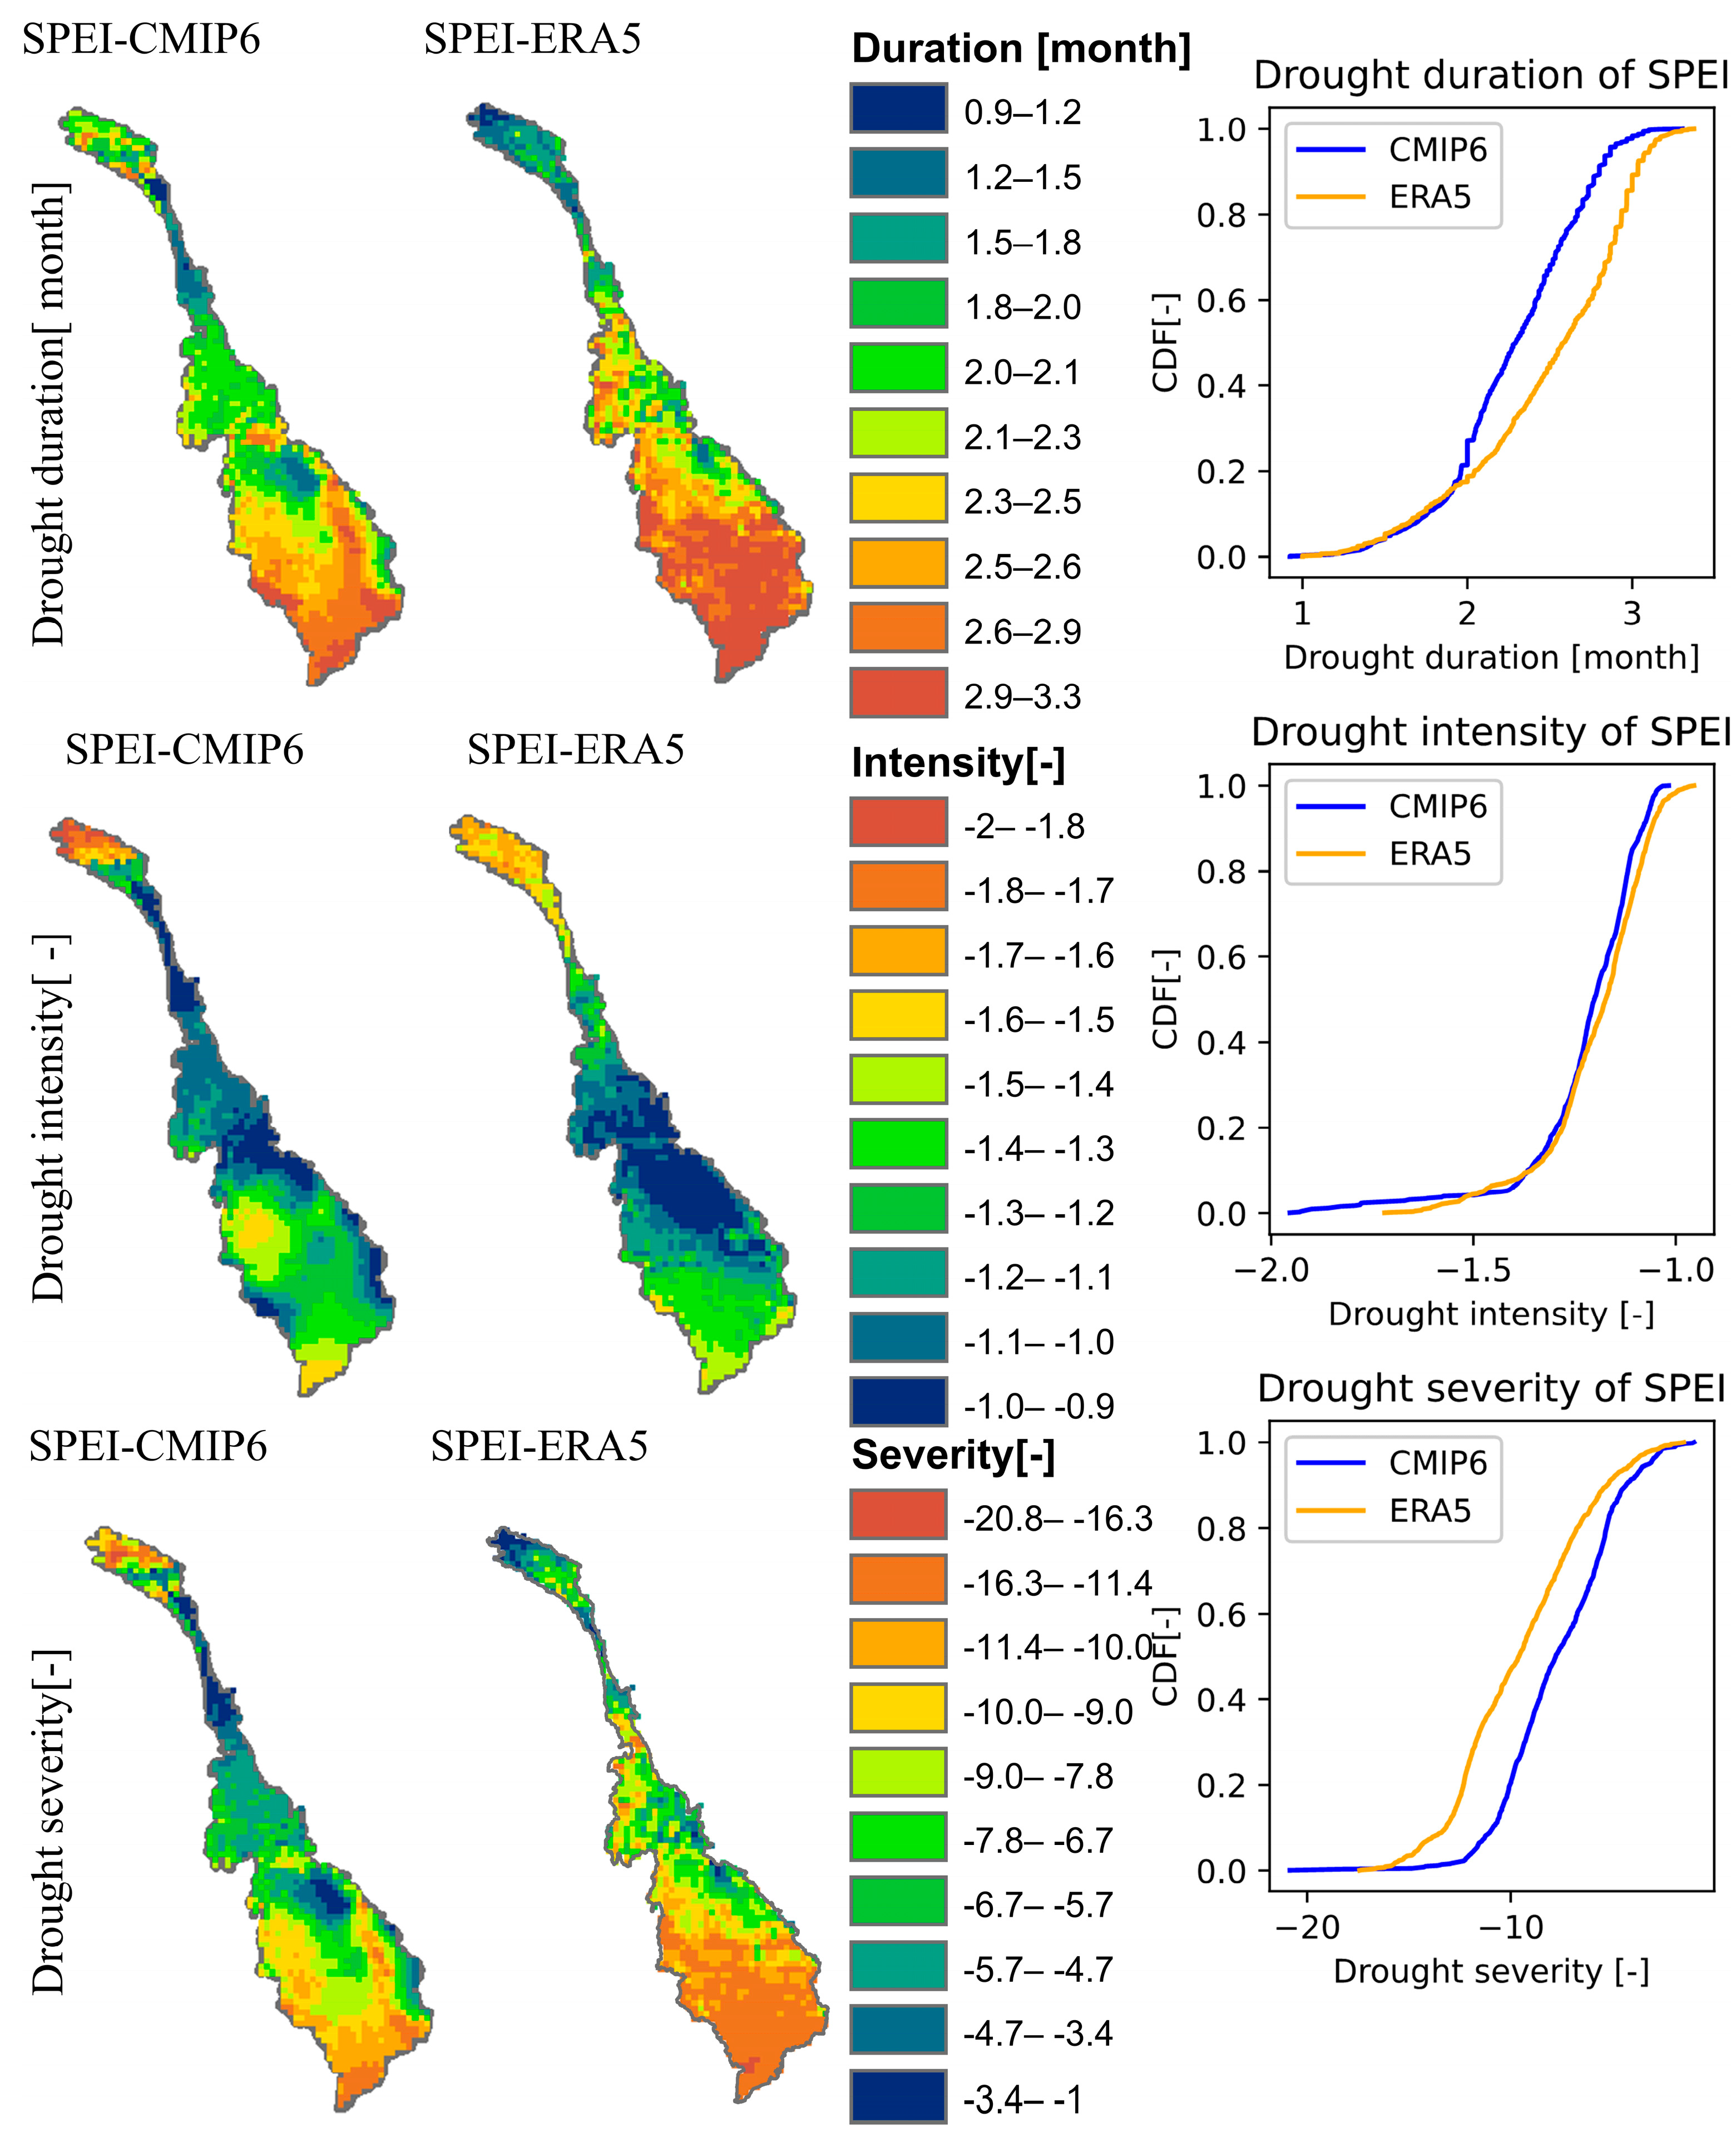
Figure 4 shows the spatial distribution of three key drought characteristics: duration, intensity, and severity, based on the SPI index. The northern region exhibits longer and more intense droughts (SPI below −2), while the central region shows shorter droughts with moderate intensity (SPI from −1 to −1.5). Meanwhile, the central region shows light yellow or orange colors, indicating shorter drought durations and moderate to severe intensity (SPI from −1 to −1.5). The southern region, if dark in color, also indicates severe droughts with major impacts on agriculture and livelihoods. Lighter colors in this region may indicate less severe conditions. In terms of the cumulative distribution curve (CDF), the image provides a quantitative assessment of the agreement between CMIP6 and ERA5 data. The horizontal axis represents the SPI index values, with values of −1 representing moderate drought and below −2 severe, while the vertical axis represents the cumulative probability. The close agreement between the CMIP6 CDF and ERA5 demonstrates the ability of CMIP6 to accurately reproduce drought conditions that occurred in the past.
Considering
Figure 5, it is easy to see an overview of the spatial distribution of drought characteristics, as measured by the SPEI index. In the northern region, dark colors such as red or orange indicate long-lasting droughts with strong intensity, represented by very low SPEI values (below −2), indicating a clear impact of climate change. In the central region, light shades of yellow or orange suggest shorter drought durations and moderate to severe intensity (SPEI between −1 and −1.5), reflecting natural variability in local climate. In the southern region, dark colors indicate severe drought conditions, with profound impacts on agriculture and livelihoods, while lighter colors may indicate less severe conditions. On the right, the CDF is used to compare CMIP6 data with ERA5, providing a quantitative assessment of the ability of the simulation to reproduce past drought conditions. The horizontal axis shows the SPEI index values, while the vertical axis shows the cumulative probability. The close match between the CMIP6 CDF and ERA5 indicates that CMIP6 has an accurate simulation capability. Therefore, CMIP6 data can be used for future drought assessment in the Mekong River Basin.
3.2. Drought Duration Assessment Using SPI and SPEI for SSP245 and SSP585 Scenarios in 2041–2070 and 2071–2100
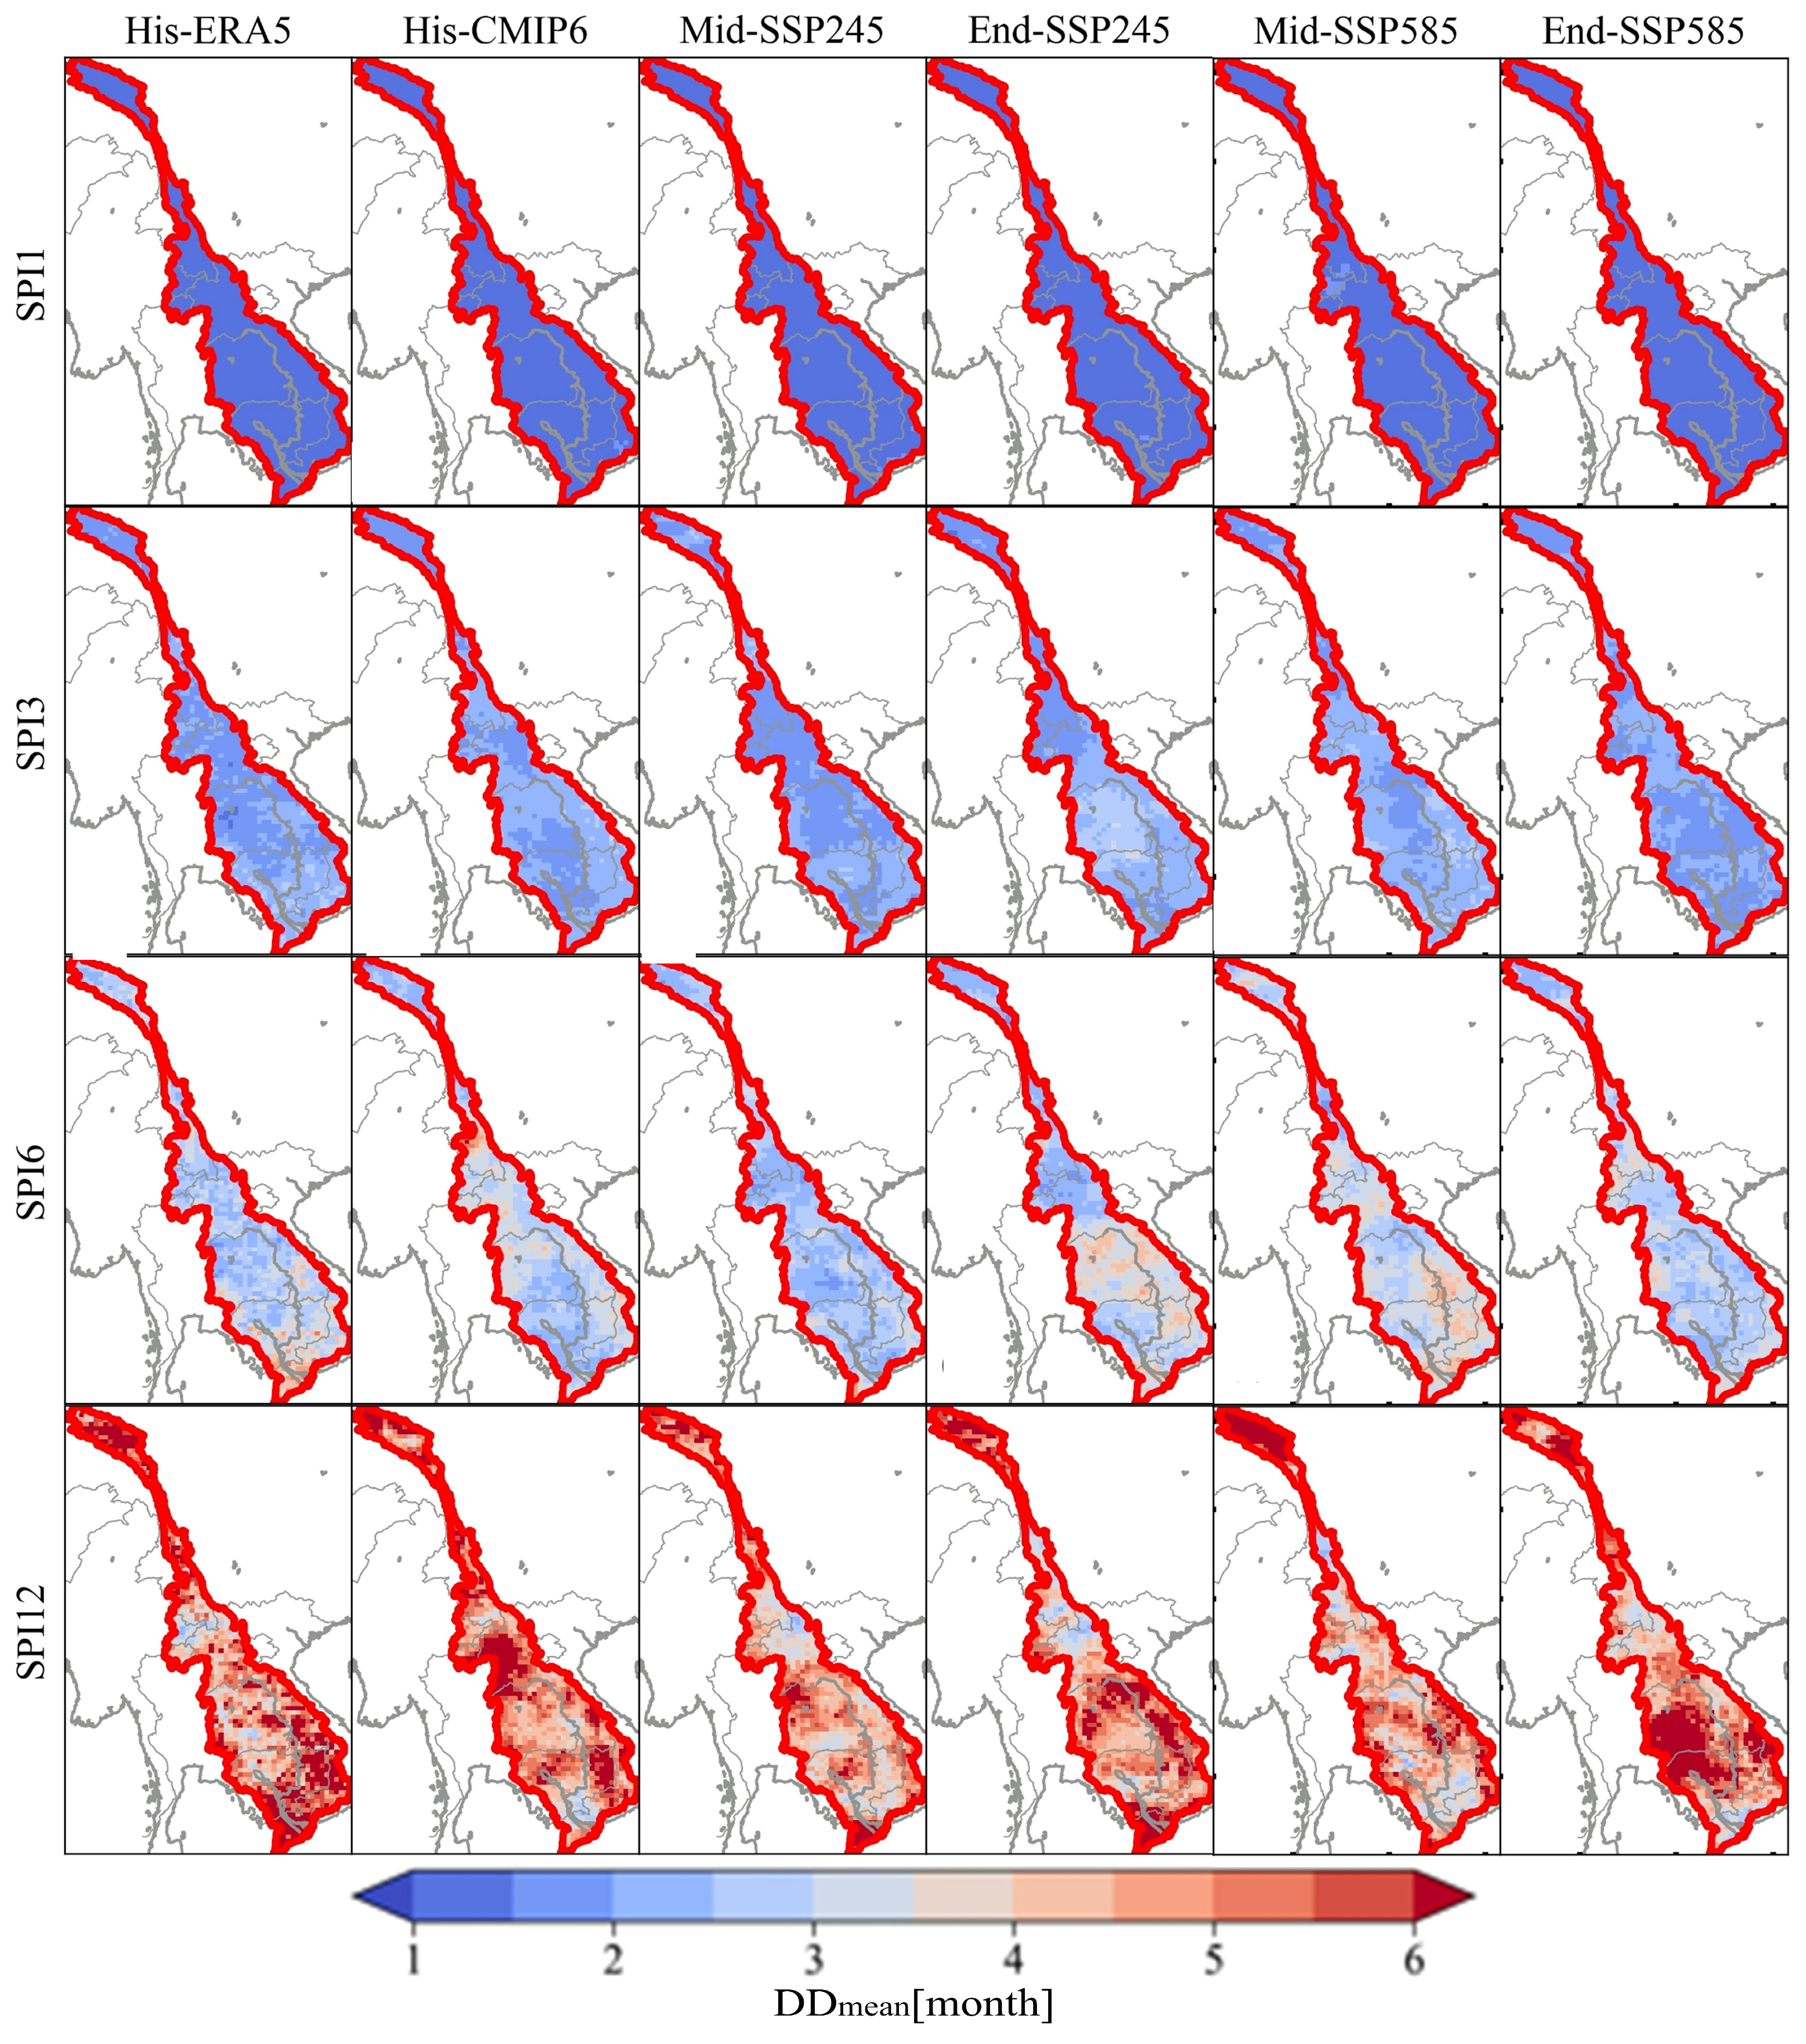
Figure 6 shows that in the historical period, the SPI1 and SPI3 indices show that short-term droughts usually last less than 3 months. For agricultural and hydrological droughts, SPI6 lasts from 3 to 4 months across the basin, with the southeast and central regions being affected for longer periods. Meanwhile, SPI12 lasts from 4 to 6 months in most areas, and the largest DD is likely in the north, northwest, southeast, and west of the central region. In the future, in general, the SPI1 index hardly changes significantly, and drought duration (DD) increases gradually according to the SPI1, SPI3, SPI6, and SPI12 indices in the past as well as in the future scenarios. Compared to the period 2041–2070, the period 2071–2100 increases more, meaning that DD increases gradually over time. According to SSP245, compared to the past, based on the SPI3 index, DD tends to increase slightly in the north and the south, decrease in the center, and increase in the south during the period 2071–2100. Considering SPI6 and SPI12, DD tends to decrease slightly in the Mid period but increases in the southern region during the End period, especially the south, southeast, and the area bordering the central region. Considering SSP585, the SPI6 index shows that DD increases in the southeast and the central region during the period 2041–2070 but decreases in most of the study areas during the period 2071–2100. Based on the SPI12 index, DD tends to decrease in the southwest during the period 2041–2070 but increases sharply during the period 2071–2100.
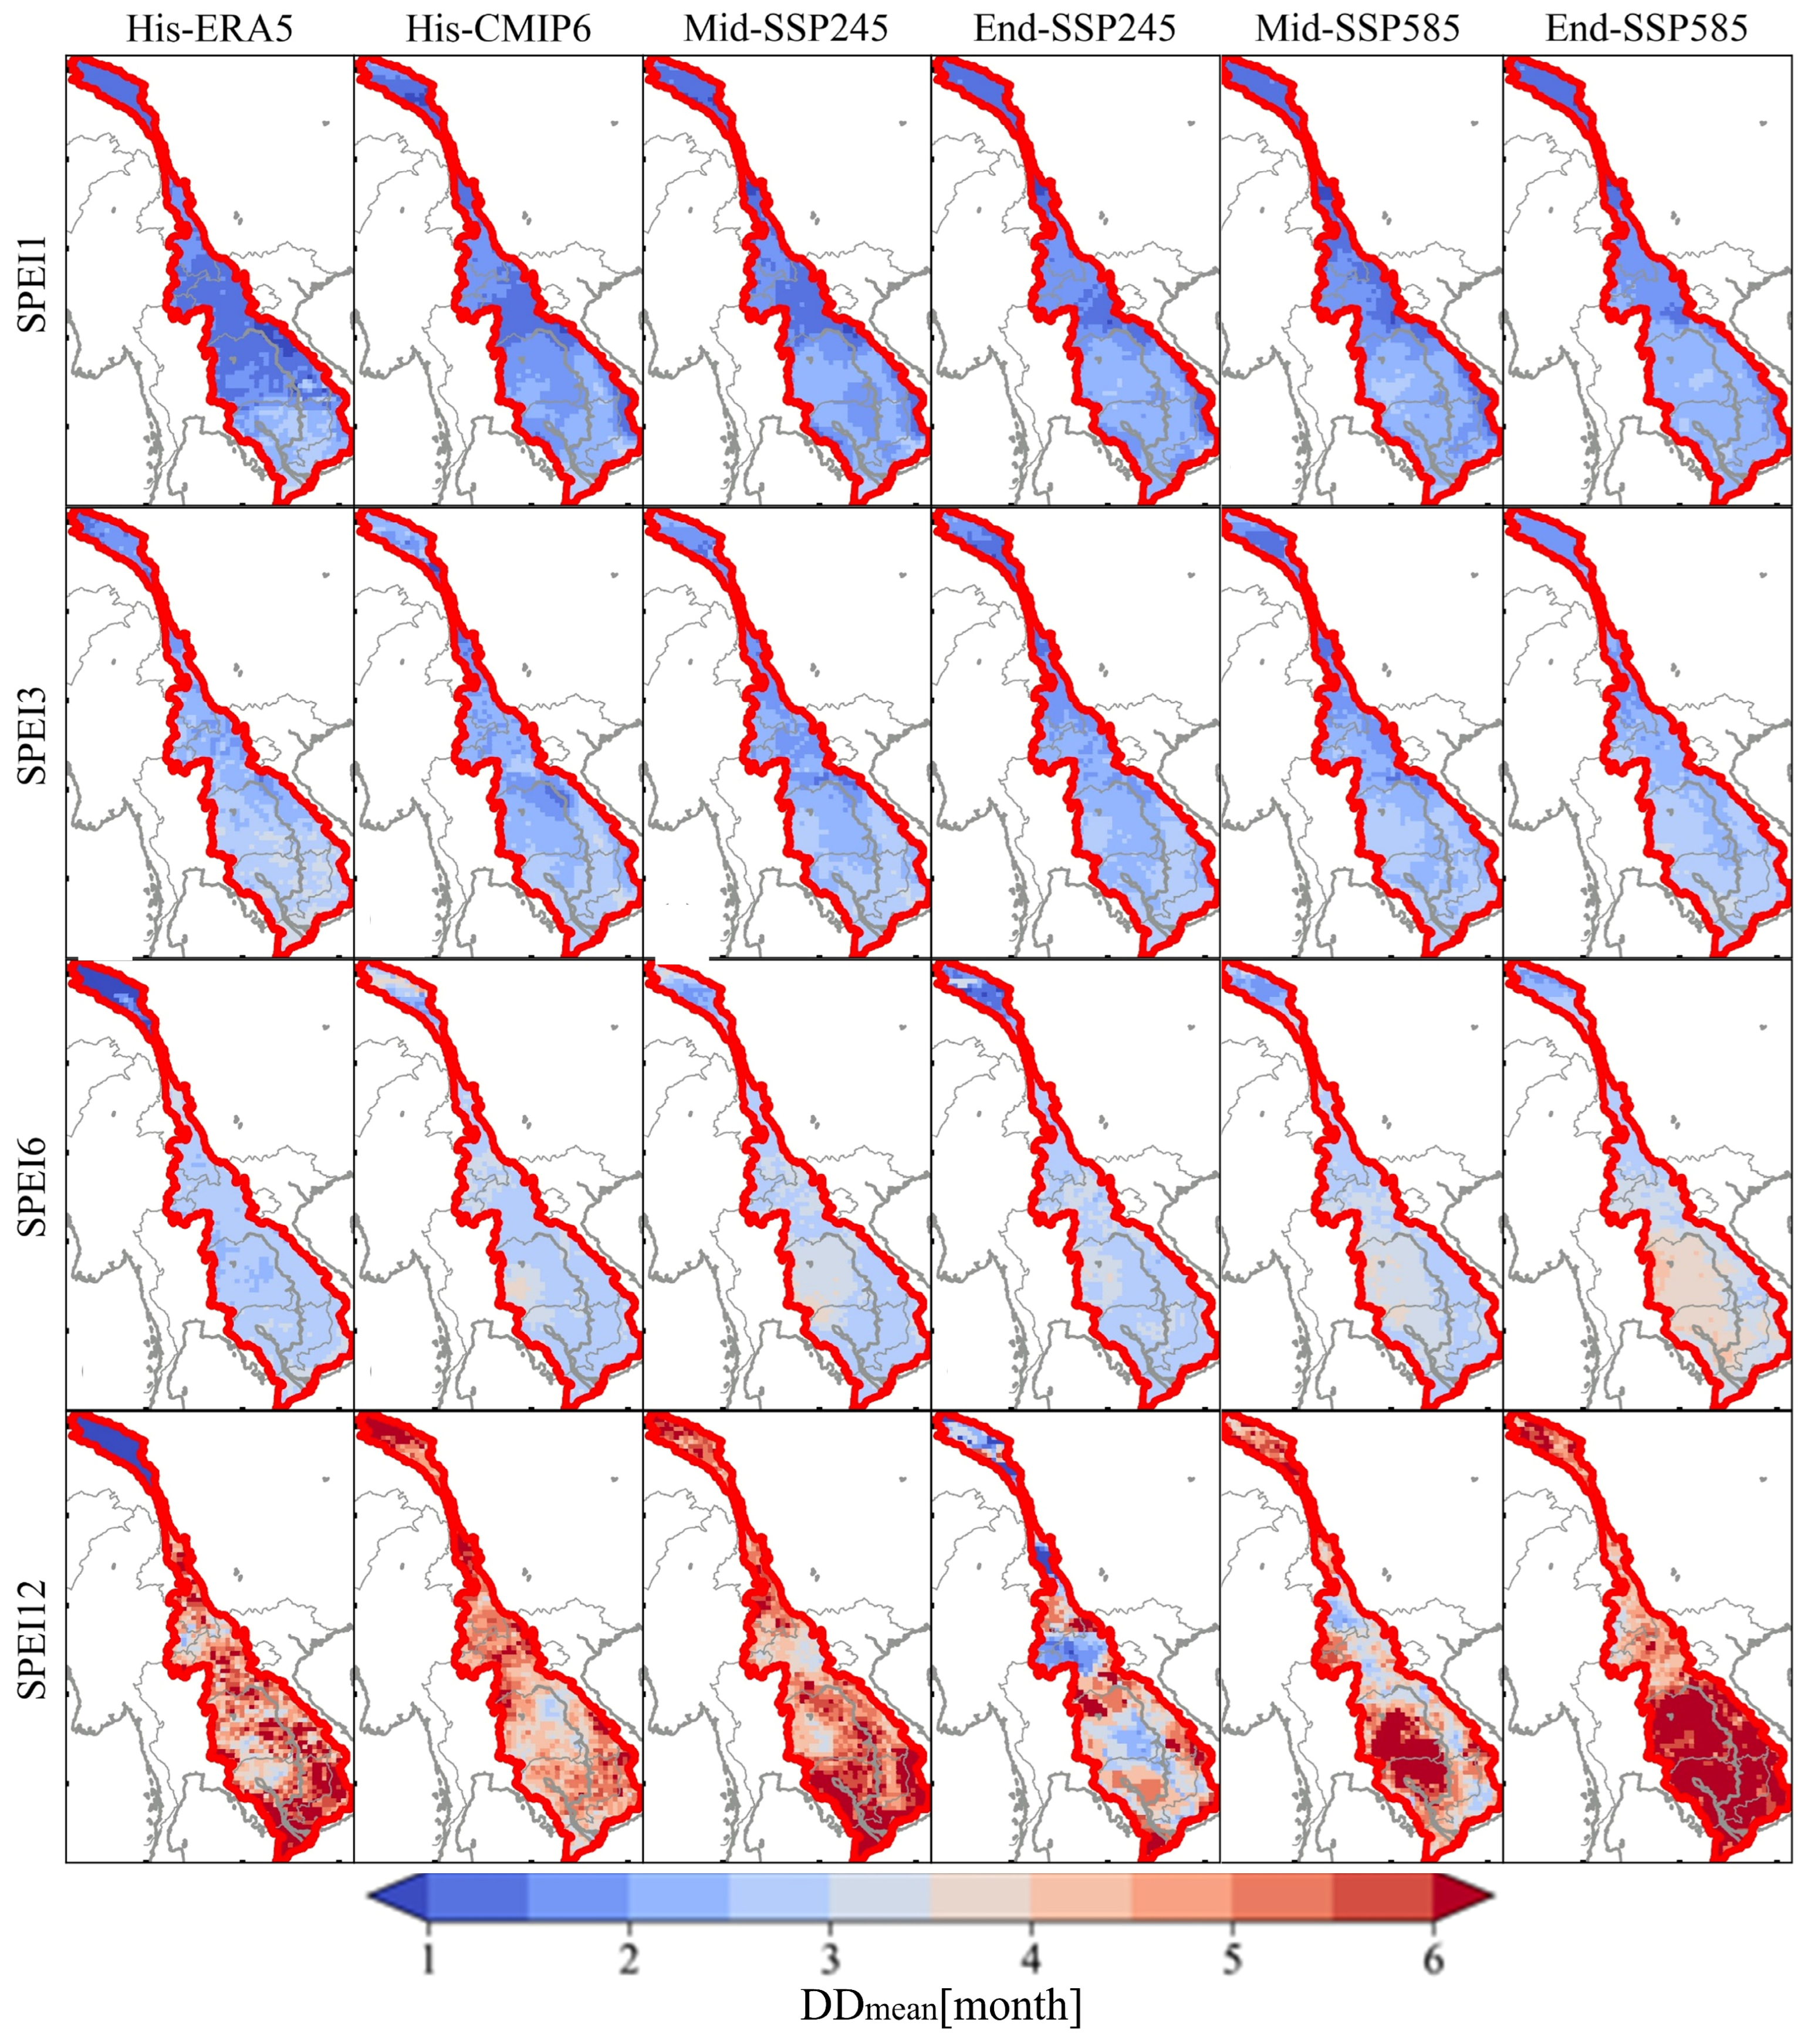
In the historical period for SPEI index (shown in
Figure 7), the SPEI1 and SPEI3 indices indicate that short-term droughts usually do not exceed 3 months. The northernmost region has the lowest DD compared to the rest of the regions. For the SPEI6 agricultural drought index, droughts usually last from 1 to 4 months across the basin, with larger DD in the southwest region. Meanwhile, the SPEI12 hydrological drought index indicates that droughts last from 1 to 6 months, and large DD is possible in the southeast and central regions. Looking into the future, the SPEI1 and SPEI3 indices do not change significantly. DD tends to increase gradually from SPEI1 to SPEI12, both in the past and future scenarios. Comparing the two periods 2041–2070 and 2071–2100, the latter period shows a more pronounced increase in DD. In the SSP245 scenario, compared to the past, the SPEI6 index shows that DD tends to increase slightly in the southwest during 2041–2070 but then decreases in the entire region during 2071–2100. With SPEI12, DD tends to decrease in the central region but increases in the southeast and the far south during the Mid period. In particular, in the End period, SPEI12 shows that DD decreases to 2–3 months in the central border region. In the SSP585 scenario, SPEI6 shows that DD increases in the south during the End period. The SPEI12 hydrological drought index shows that drought increases sharply in the north and southwest but decreases in the southeast and central regions during 2041–2070, then continues to increase sharply in the entire southern region during the 2071–2100 period.
3.3. Drought Intensity Assessment Using SPI and SPEI for SSP245 and SSP585 Scenarios in 2041–2070 and 2071–2100
Figure 8 depicts the regional average SPI drought intensity, with a comparison between the current period and the future scenarios SSP245 and SSP585 for the periods 2041–2070 and 2071–2100. Short-term drought (SPI1, SPI3) has an intensity ranging from −1.8 to −1.3 across the basin, with DI being larger than the remaining indices (SPI6, SPI12), reflecting moderate to severe but not very severe meteorological drought. In the future scenarios, short-term meteorological drought intensity is expected to remain stable compared to the reference period. However, at longer time scales (SPI6, SPI12), drought intensity increases, with levels ranging from −1.4 to −1.1 in the central and southeastern regions, indicating more pronounced agricultural and hydrological drought intensity. In the SSP245 scenario, SPI6 agricultural drought intensity decreases slightly, mainly from −1.4 to −1.1 in 2041–2070, but tends to increase in the southern region bordering the central region in 2071–2100. For SPI12, drought intensity decreases over most of the basin, except for some southern regions in 2041–2070, but then decreases over most of the study area (except for a small part of the southeast region) in 2071–2100. In the SSP585 scenario, SPI6 shows DI increasing, especially in the southeast and central regions in 2041–2070, but then decreasing across the entire basin in 2071–2100. The SPI12 index shows a decrease in drought intensity in the central and most southern regions, with a range of −1.2 to −1, emphasizing the risk of more severe hydrological drought. Overall, future scenarios show that SPI1 and SPI3 have more severe drought intensity than SPI6 and SPI12. The SPI12 index of SSP585 in the period 2071–2100 fluctuates little, while the period 2041–2070 has a clear fluctuation in drought intensity compared to the past period.
Figure 9 illustrates the regional average drought intensity according to the SPEI index, comparing the current period and the future scenarios SSP245 and SSP585 for the periods 2041–2070 and 2071–2100. In the past, short-term droughts measured by SPEI1 and SPEI3, with magnitudes ranging from −1.8 to −1.1, reflect moderate to severe meteorological droughts, less severe than those of SPEI6 and SPEI12. In the future, for drought intensity at longer time scales, such as SPEI6 and SPEI12, DI tends to decrease in the north and southwest but increase in the central and southeast regions, indicating more pronounced impacts of agricultural and hydrological droughts. Under the SSP245 scenario, the short-term drought SPEI3 tends to increase slightly in the southwest region in both future periods. The agricultural drought intensity (SPEI6) decreases slightly, fluctuating mainly from −1.4 to −1.1 in the period 2071–2100. For SPEI12, the drought intensity decreases in the northern region, decreasing significantly in the southern region in the period 2071–2100. Under the SSP585 scenario, SPEI1 shows a clear increase in drought intensity, especially in the southwest region in the period 2041–2070, and tends to increase further in the period 2071–2100. Similarly, SPEI3 also shows an increasing trend, emphasizing the risk of more severe hydrological drought in the future. For SPEI12, drought intensity decreases, most significantly in the southwest region, but increases in the north during 2041–2070, then increases steadily across the entire study basin during 2071–2100. Overall, future scenarios indicate that SPEI1 and SPEI3 have more severe drought intensity than SPI6 and SPI12.
3.4. Drought Severity Assessment Using SPI and SPEI for SSP245 and SSP585 Scenarios in 2041–2070 and 2071–2100
Figure 10 shows the severity of the SPI indices during the reference period (1985–2014), with short-term droughts being mostly insignificant, while the SPI1 and SPI3 indices indicate moderate to severe but not very severe impacts of meteorological drought. Meanwhile, the SPI3, SPI6, and SPI12 indices indicate increased severity, ranging from −2.4 to −1.8 over the entire study basin. In the future scenarios SSP245 and SSP585 in both future periods, the severity of droughts remains unchanged compared to the past period. The severity and duration of droughts based on SPI6 and SPI12 show a close relationship between the two, especially under the impact of the SSP585 scenario, which not only prolongs the duration of droughts but also increases the severity of droughts.
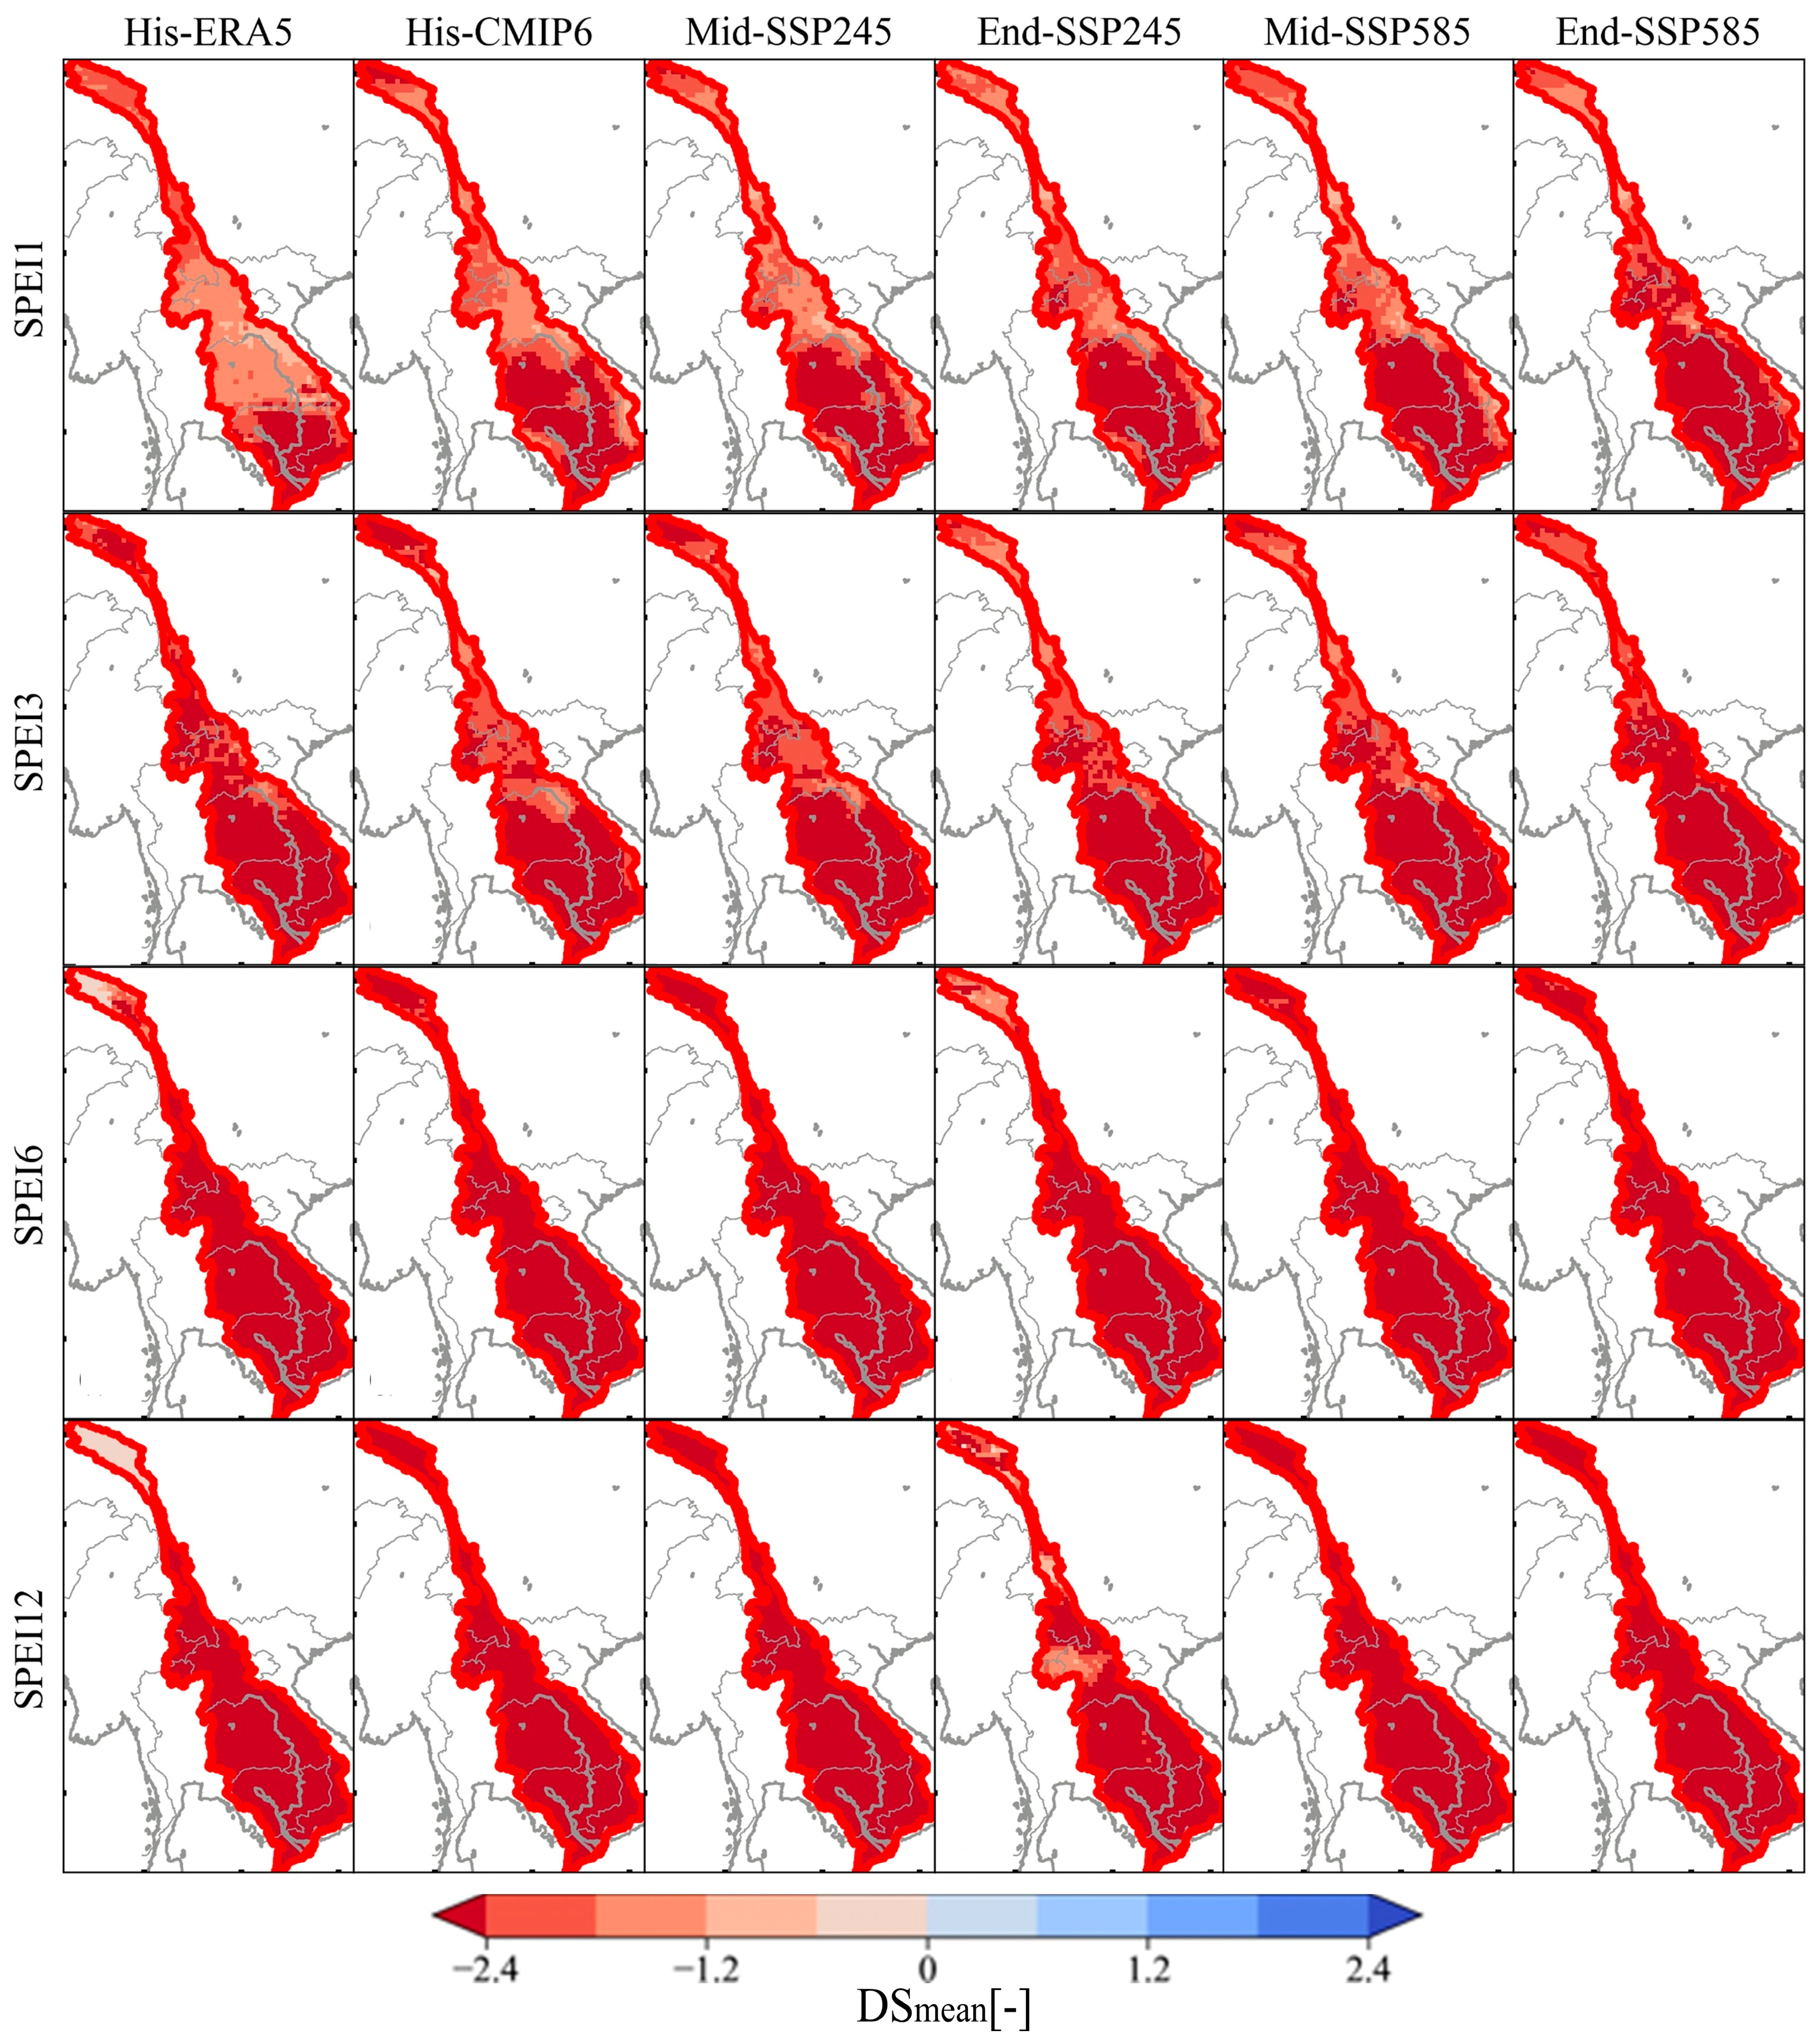
Figure 11 illustrates the severity of the SPEI indices for the reference period from 1985 to 2014 and for the future periods 2041–2070 and 2071–2100. Historically, DS assessed by SPEI6 and SPEI12 indices showed moderate to severe impacts, which were significantly more severe than DS based on SPEI1 and SPEI3. When considering short-term indices such as SPEI1, the severity ranged from −2.4 for the southern region and from −1.8 to 0 for the remaining regions. SPEI3 was more severe, with a majority of −2.4 for most of the study area, with scattered exceptions in the eastern and central regions. By SPEI6 and SPEI12, the severity in the north is at −0.6, significantly lower than the remaining regions with DS at −2.4, indicating a greater impact of agricultural and hydrological drought. When moving to the future scenarios SSP245 and SSP585, in both future periods, the severity of drought does not change significantly compared to the past period, except for DS using SPEI3, SPEI6, and SPEI12, which shows a decrease in drought severity in the northern region (SPEI3, SPEI6, SPEI12) and part of the central region (SPEI12) during the period 2041–2070.
3.5. Future Drought Assessment
Based on the changes in drought characteristics such as duration, intensity, and severity in the SSP245 and SSP585 future scenarios for the periods 2041–2070 and 2071–2100, it can be seen that future droughts will tend to last longer and become more severe. In the historical period, short-term droughts usually last less than 3 months, as assessed by the SPI1, SPI3, SPEI1, and SPEI3 indices. However, agricultural and hydrological droughts, assessed by SPI6, SPI12, SPEI6, and SPEI12, have longer durations, especially in the southeast and central regions. As we move into the future, drought duration (DD) tends to increase. Under the SSP245 scenario, agricultural and hydrological droughts may slightly decrease in the Mid period (2041–2070) but increase in the End period (2071–2100), especially in the south and southeast. In contrast, the SSP585 scenario shows a clear increase in drought duration in southern regions during 2071–2100. In terms of intensity (DI), short-term droughts do not change much in the future, but agricultural and hydrological drought intensity may increase, especially in the central and southeast regions. SPEI shows a strong increase in drought intensity in the south and center under the SSP585 scenario, emphasizing the strong impact of climate change. Drought severity (DS) does not change much compared to the historical period in most cases but may increase with drought duration under the SSP585 scenario, especially for SPEI6 and SPEI12, where severity may increase in the north and south.
Overall, future scenarios show that droughts will not only become more prolonged but also more severe, especially under the SSP585 scenario. This highlights the need to implement climate management and adaptation measures to mitigate future negative impacts.
3.6. Evaluation of Future Trends and Variation of Drought
Table 4 and
Table 5 provides a detailed view of the trends of the SPI across different climate scenarios, including historical, Mid-SSP245, End-SSP245, Mid-SSP585, and End-SSP585. The number of increasing and decreasing regions shows clear differences between the scenarios. For example, in the End-SSP245 scenario for SPI1, there are no increasing regions, while there are 27 decreasing zones, indicating a strong drying trend. The average slope, an indicator of the strength of the trend, shows variability: a negative slope indicates an increasing trend, while a positive slope indicates a decreasing trend. In particular, in the Mid-SSP585 scenario, the SPI indices generally have more increasing zones than decreasing zones, such as SPI1 with twenty-two increasing zones and five decreasing zones, which may indicate an improvement or positive change in rainfall. In contrast, in scenarios such as End-SSP245, decreasing zones dominate, especially for SPI12, with twenty-three decreasing zones compared to four increasing zones, suggesting a more severe drought potential. Regarding specific zones, zones 10–18 and 20–28 in the historical scenario show a strong increasing trend, while zones 1–8 show a decreasing trend, showing a clear distribution among zones. Zones 1–5 and 7–28 in the End-SSP245 scenario also show a strong decreasing trend. Overall, both tables show a notable drying trend in some scenarios, especially SSP245, while some SSP585 scenarios show a potential increase in rainfall, reflecting the change in climate conditions across different scenarios. This emphasizes the importance of monitoring and forecasting drought trends to take timely and effective response measures.
Based on
Table 6 and
Table 7 regarding the SPEI index across different scenarios, we see that the increasing trend is clearly dominant in the End-SSP245, Mid-SSP585, and End-SSP585 scenarios, with all 28 zones showing an increasing trend and no zone showing a decreasing trend. This indicates a significant improvement in wet conditions or a reduction in drought in these scenarios. The negative mean slope in these scenarios indicates a strong increase, especially in the SPEI12 index, where the largest negative mean slope is recorded in the End-SSP585 scenario with a value of −0.007325, indicating a significant improvement in wet conditions. In the Mid-SSP245 scenario, the number of zones showing an increasing trend is also dominant, but there are still some decreasing zones, especially SPEI12 which shows the strongest increasing trend with twenty-seven zones increasing and only one zone decreasing. In the historical scenario, although there is a distribution between increasing and decreasing zones, the increasing trend still dominates in many SPEIs, indicating some improvement in past climatic conditions. SPEI12 generally has a steeper average slope than other indices, especially in future scenarios, indicating greater sensitivity to climate change when evapotranspiration is taken into account. Overall, these tables indicate that the increasing trend dominates in most scenarios, reflecting improvements in climatic conditions or a reduction in drought when both precipitation and evapotranspiration are taken into account, emphasizing the importance of the SPEI in forecasting and managing water resources in the context of climate change.
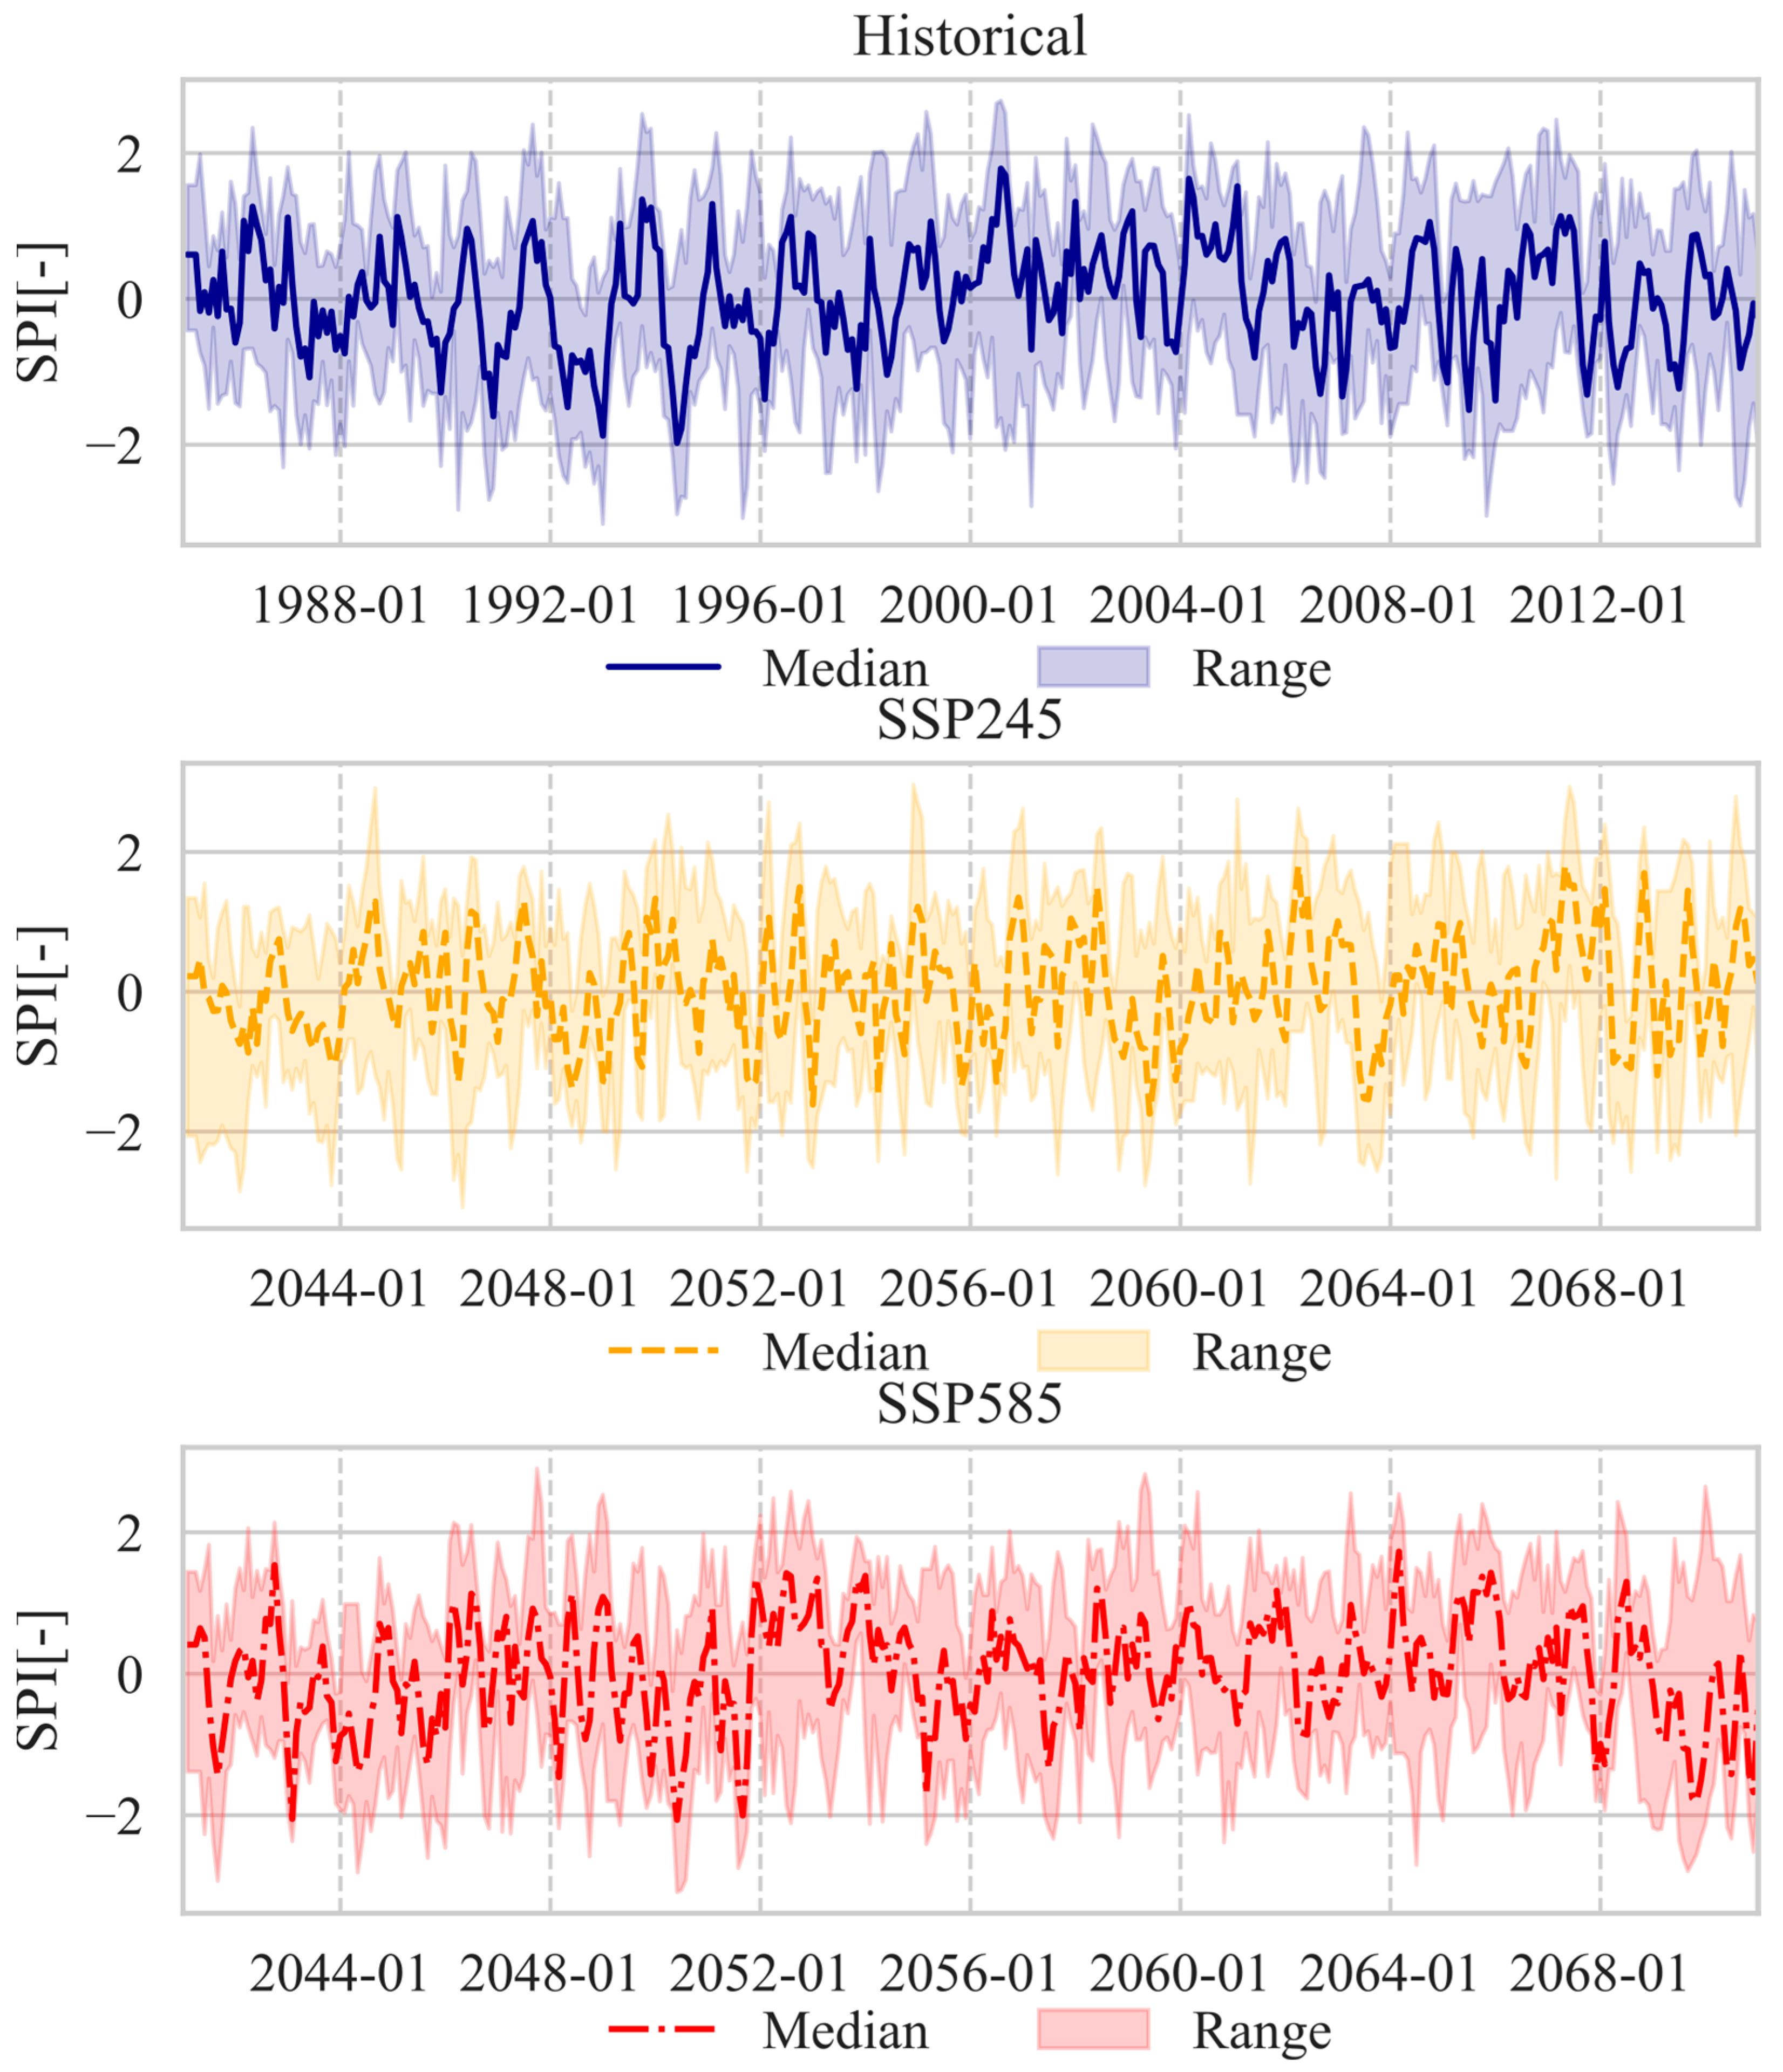
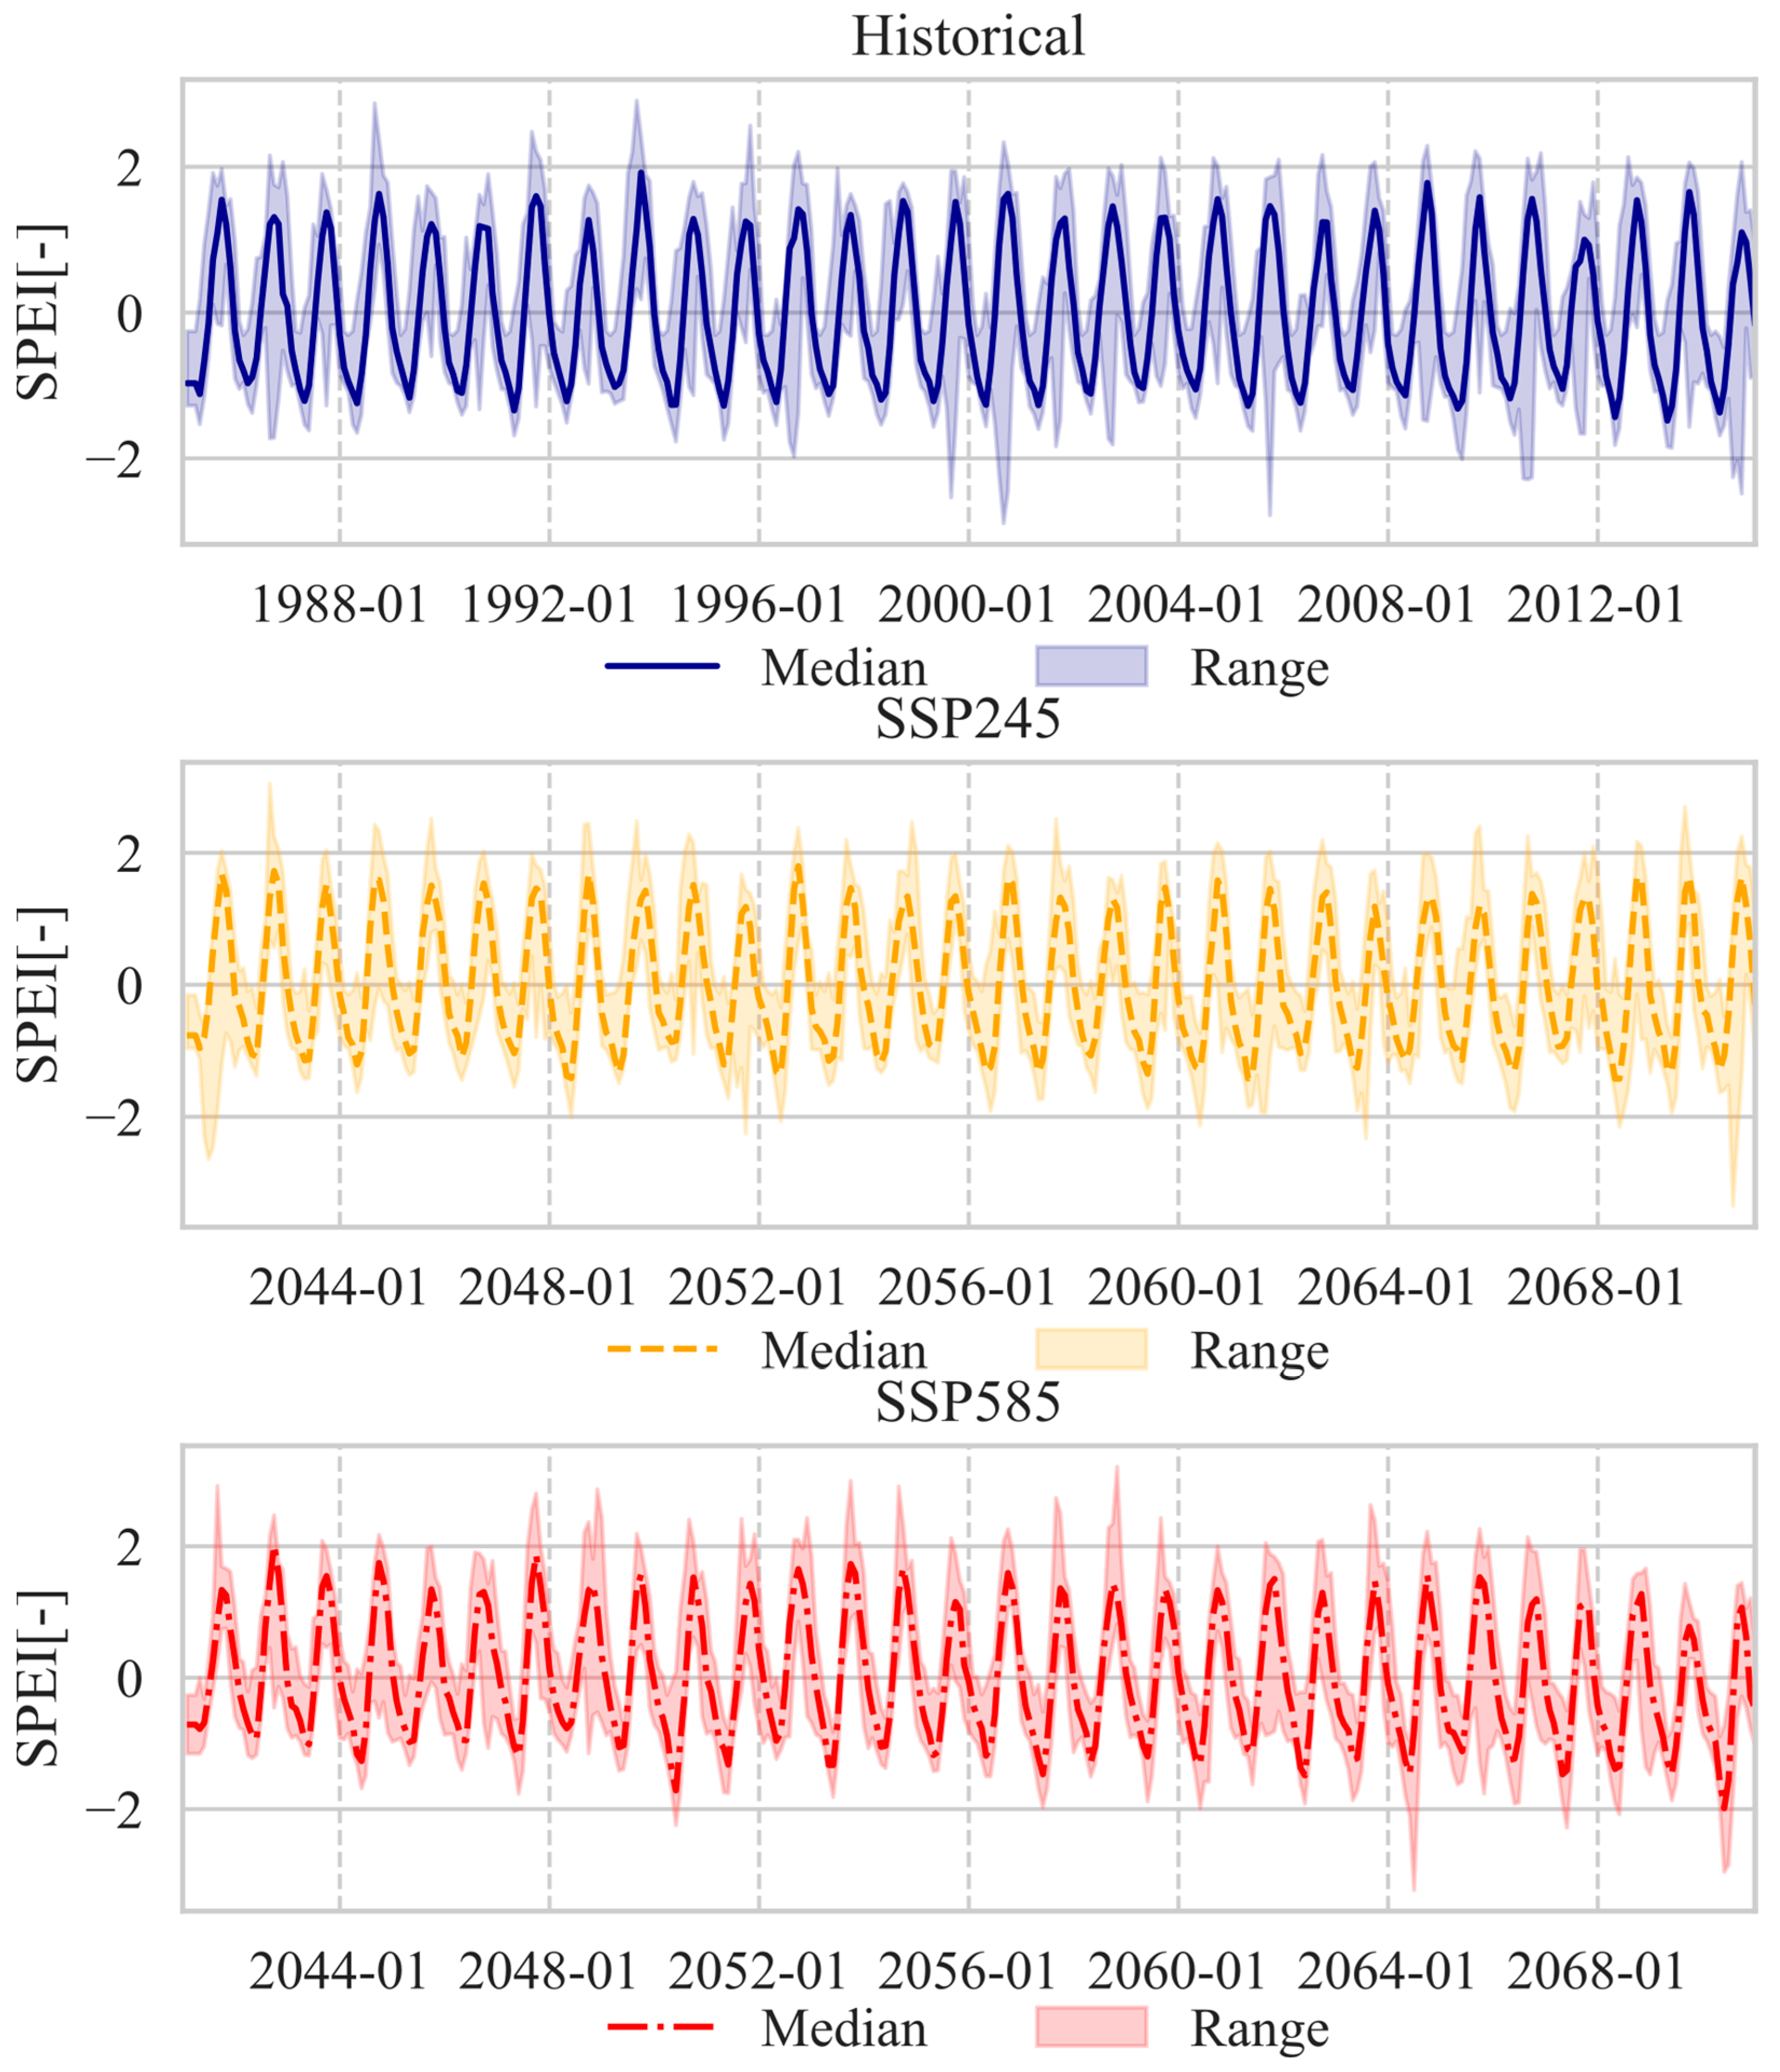
Based on the description of
Figure 12 and
Figure 13, the results show the variability of the 28 ecoregions according to the SPI and SPEI indices.
Figure 12 illustrates the stable variability of drought under SPI between past and future periods, while
Figure 13 highlights the clear cyclical nature of SPEI with approximately 30 high and low points over 30 years. These figures illustrate the average and overall variability of ecoregions in the past and the projections for the future. The solid line represents the historical meaning, while the dashed line represents the projections for the future. The shaded area between these lines represents the range of variability where droughts are likely to occur. Comparing the past and future scenarios SSP245 and SSP585, no significant variability is shown, suggesting a degree of stability in the projections, or at least the expectation that climate conditions will remain at the same level of variability as they are now. This reflects the cyclical nature of the climate, with the median increasing and decreasing over time. In particular, the SPEI clearly exhibits cyclical characteristics, as seen in
Figure 13, with approximately 30 low points and 30 high points corresponding to the dry and wet seasons over the 30-year analysis period. This demonstrates the regularity and predictability of climate cycles, which is important in planning and responding to climate change.
Figure 14 illustrates the spatial variability of drought in each region based on future scenarios compared to the historical period. This variability is calculated by taking the percentage of the maximum range between the highest and lowest values of SPI/SPEI in the future divided by the same range in the past period. In this figure, from left to right, the viewer can see the variability over the time scale of drought. From top to bottom, the figures in the first two rows represent the SSP245 and SSP585 scenarios for SPI, while the last two rows represent the corresponding scenarios for SPEI. Each radar chart shows 28 zones, with the area marked with a star indicating the area with the highest variability. Among the analyzed scenarios, zone 2 consistently exhibits the highest drought variability across different scenarios such as SSP245 with SPI3, SSP585 with SPI3, SSP585 with SPI6, and SSP245 with SPEI1, SPEI6, and SPEI12. This highlights the importance of monitoring and managing drought risks in these regions in the future. This information not only helps to better understand the variability of drought in each region but also provides insight into how different climate scenarios may influence this variability.
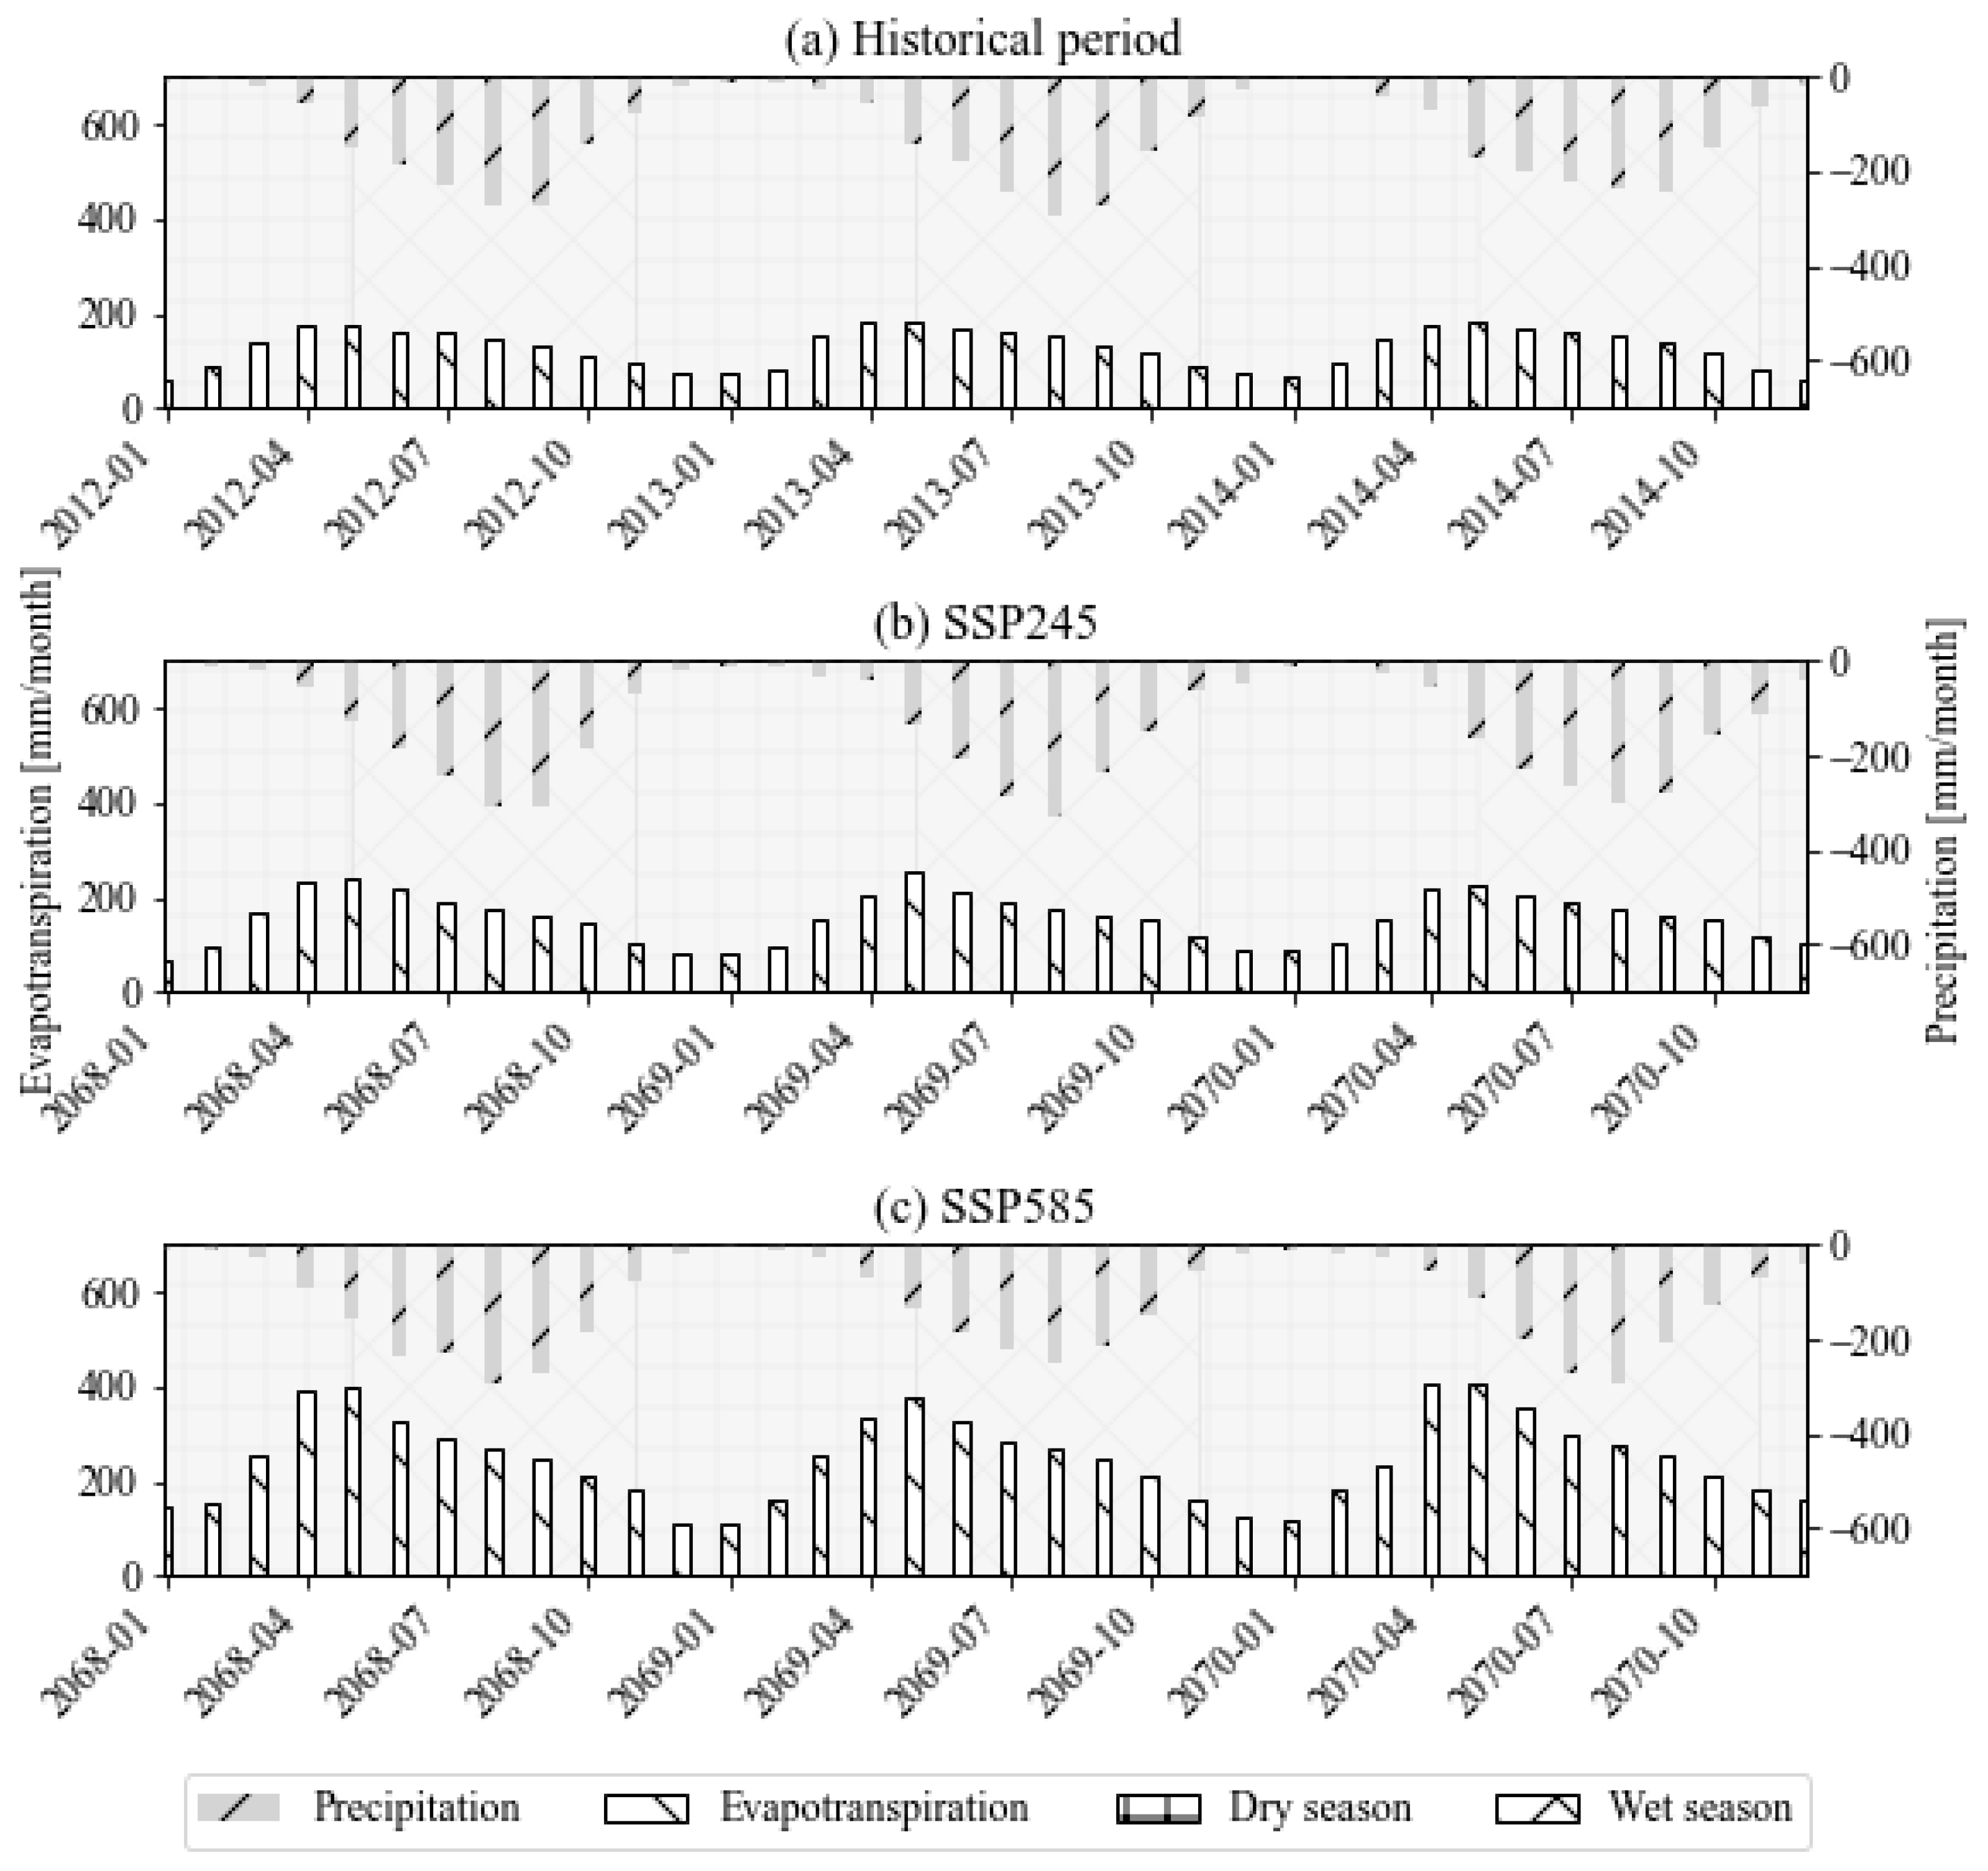
Seasonal variations in mean monthly rainfall and evaporation during the wet season (May–October) and dry season (November–April) in the past and under climate change scenarios for the Mekong River Basin are presented in
Figure 15, illustrating changes in key climate variables over time. In this figure, viewers can see a clear difference between the wet and dry seasons in terms of rainfall and evaporation. The data show how climate change scenarios may impact traditional weather patterns in the region. Mean monthly rainfall and evaporation are compared between the past and future projections, providing insight into potential changes that may occur in the ecosystem and water resources of the Mekong River Basin. These changes may impact agriculture, water supply, and natural resource management in the region.
4. Discussion
Performance evaluation of CMIP6 models shows that the spatial distribution of drought characteristics (length, intensity, severity) based on the SPI index shows that the northern region has long and intense droughts (SPI below −2), while the central region has shorter droughts with moderate intensity (SPI from −1 to −1.5). The southern region has a clear differentiation, with areas with severe droughts that greatly affect agriculture. The cumulative distribution curve (CDF) shows a good agreement between CMIP6 and ERA5 data, indicating that CMIP6 is capable of accurately reproducing past drought conditions, with CDFs that are nearly identical.
Evaluation of drought duration using SPI and SPEI for SSP245 and SSP585 scenarios shows that in the historical period, drought duration (DD) for SPI1, SPI3, SPI6, and SPI12 indices shows that short droughts (less than 3 months) are common in the region, with regions such as southeast and central being affected for longer periods. In the future, especially in SSP245 and SSP585 scenarios, drought duration increases gradually, especially in the period 2071–2100. Drought duration increases mainly in the south and southeast regions in the SSP245 scenario, while the SSP585 scenario shows a stronger increase in the southern regions by the end of the century. The prolonged droughts in the southern and southeastern regions under the SSP585 scenario could significantly strain agricultural production, particularly rice cultivation, and water supply systems. Drought intensity in the historical period, according to SPI1, SPI3, SPI6, and SPI12 indices, ranges from −1.8 to −1.3, reflecting moderate meteorological drought. Long-term drought intensities (SPI6, SPI12) tend to increase sharply, especially in the central and southeastern regions. In the future, drought intensities in the SSP245 and SSP585 scenarios show an increase in drought intensity, especially in the central and southeastern regions, reflecting the strong impact of climate change. Drought severity based on SPI6 and SPI12 indices in the historical period shows a strong impact, with severity increasing from −2.4 to −1.8 across the entire study area. In the future, severity does not change much compared to the historical period, but there is an increase in severity in the northern and southern regions, especially under the influence of the SSP585 scenario.
The overview of future droughts shows that drought characteristics in the SSP245 and SSP585 scenarios show that droughts tend to be more prolonged and severe, although the short-term drought intensity does not change much, but long-term agricultural and hydrological droughts tend to increase. In the SSP245 scenario, agricultural and hydrological droughts may decrease slightly in the period 2041–2070 but increase in the period 2071–2100, especially in the south and southeast. In the SSP585 scenario, drought intensity will increase in the southern and central regions, especially in the period 2071–2100.
This study analyzed the trends and changes in drought according to SPI and SPEI indices, based on different climate scenarios, including historical, SSP245, and SSP585. The results showed a clear difference between the scenarios in the number of regions with increasing and decreasing trends. In particular, in the End-SSP245 scenario for SPI1, there were no regions with increasing trends, while there were up to 27 regions with decreasing trends, indicating a strong drought trend. In contrast, in the Mid-SSP585 scenario, the SPI indices had more regions with increasing trends, such as SPI1 with 22 regions, suggesting improvements or positive changes in rainfall. The SSP245 scenarios generally showed a prominent drought trend, while some SSP585 scenarios indicated potential increases in rainfall. For the SPEI index, the End-SSP245, Mid-SSP585, and End-SSP585 scenarios show a predominant upward trend, with all 28 regions increasing, with no regions decreasing, indicating significant improvements in wet conditions or reductions in drought. This is particularly evident for the SPEI12 index, which shows greater sensitivity to climate change when considering both precipitation and evaporation.
The results for the mean and overall variability of the ecoregions according to the SPI and SPEI indices show that no significant variability is observed between the past and future scenarios, suggesting a degree of stability in the projections. The spatial variability of drought within each region is based on the future scenarios, with zone 2 consistently exhibiting the highest variability in drought. Seasonal variations in monthly mean rainfall and evaporation in the Mekong River Basin highlight the differences between wet and dry seasons and the potential impacts of climate change on traditional weather patterns in the region.
The Standardized Precipitation Index (SPI) and Standardized Precipitation Evapotranspiration Index (SPEI) yield different drought assessments due to their distinct inputs. SPI, based solely on precipitation, reflects precipitation deficits [
12], while SPEI incorporates precipitation and temperature-driven evapotranspiration, capturing water balance dynamics [
13]. Drought trends depend on whether precipitation or temperature dominates increased precipitation and reduces drought severity, whereas rising temperatures, elevating evapotranspiration, intensify droughts in SPEI. In the Mekong Basin, these differences are critical under SSP245 and SSP585 scenarios with varying climate trends. Additionally, SPI and SPEI relate to hydrological (SDI) and agricultural (SSI) drought indices, as precipitation and temperature influence runoff and soil moisture. These technical drought impacts contribute to economic losses in agriculture and water supply. A comprehensive assessment integrating technical (SPI, SPEI, SDI, SSI) and economic drought characteristics is needed to guide future water management in the Mekong Basin.
5. Conclusions
This study contributes a comprehensive analysis of future drought in the Mekong Basin using CMIP6 data, surpassing previous efforts through higher resolution and the combined use of SPI and SPEI. Based on the performance evaluation results of the CMIP6 models, it can be seen that the spatial distribution of drought characteristics in the study area is clearly differentiated between the northern, central, and southern regions. CMIP6 models show the ability to accurately reproduce past drought conditions, with good agreement between model data and actual data from ERA5. This indicates that these models have high potential in projecting future drought characteristics, although further improvements in accuracy and reliability in simulating extreme climate events in future scenarios are still needed.
One of the notable results is the increase in drought duration in the SSP245 and SSP585 scenarios, especially in the period 2071–2100. The southern and southeastern regions are expected to be more severely affected by long-term drought events, which can have negative impacts on agricultural and hydrological activities, especially in the context of increasing climate change. This highlights the importance of accurately assessing and forecasting drought characteristics to provide more effective water resource and agricultural management measures.
Historical drought intensity and severity have reflected moderate drought in many regions; however, in the future, projections show a sharp increase in both intensity and severity, especially in the central and southeastern regions. This may reflect the distinct impact of climate change, as factors such as rising temperatures and changing rainfall patterns increase the frequency and intensity of extreme weather events. Specifically, the SSP585 scenario, with high greenhouse gas emissions, projects that drought severity will increase rapidly in the later part of the century, posing major challenges to natural resource management strategies.
Analysis of drought trends and changes in the SPI and SPEI indices shows significant differences between the climate scenarios in the number of regions with increasing or decreasing trends. In the End-SSP245 scenario, SPI1 shows a strong drought trend, while the Mid-SSP585 scenario shows many regions with increasing trends, such as SPI1 with 22 regions, implying the potential for improving rainfall. The SSP245 scenarios generally show a prominent drought trend, whereas some SSP585 scenarios show potential for increasing rainfall. For the SPEI index, the End-SSP245, Mid-SSP585, and End-SSP585 scenarios do not show decreasing regions, indicating significant improvements in wet conditions and reduced drought, especially in SPEI12, demonstrating greater sensitivity to climate change when both rainfall and evaporation are considered. Results of mean and overall variability across ecoregions using SPI and SPEI show no significant variability between the past and the future, suggesting stability in projections. Spatial variability in droughts across future scenarios is consistent with zone 2 exhibiting the highest variability in droughts. Seasonal variability in mean monthly rainfall and evaporation in the Mekong River Basin highlights the distinction between wet and dry seasons as well as the potential impact of climate change on traditional weather patterns in the region.
This result also shows that using real-world data such as ERA5 to validate models is an important step in improving the reliability of forecasts, helping to provide accurate and timely recommendations to policymakers on water resource management, agriculture, and water-dependent industries.
This study, although providing important results, still has some limitations that need to be noted. CMIP6 models are capable of accurately reproducing past drought conditions, but the accuracy of future climate change projections may not be completely accurate, as greenhouse gas emission scenarios may change over time. In addition, although the study used SPI and SPEI indices to assess drought length, intensity, and severity, relying on these two indices alone may not fully reflect all factors affecting drought. Therefore, future studies need to continue to improve and expand research to address the above limitations, helping to increase the reliability of drought forecasts and future water resource management strategies.


