Abstract
In mining operations, the rock mass located between the water-conducting fault fracture zone and the waterproof protective coal column is highly susceptible to damage, which may result in sudden water inrush disasters. This paper first employs indoor experiments and on-site rock sample analysis to determine the macroscopic mechanical parameters of rocks and rock masses, as well as the microscopic mechanical parameters of block contacts. The fracture and seepage evolution mechanisms in the mining-induced rock mass adjacent to major faults were analyzed utilizing the discrete element-fluid coupling theory in Universal Distinct Element Code (UDEC). The results identified three primary pathways for water hazards caused by mining: the calculated stress field and seepage field indicated that the formation of the water-inrush channels was determined by the parameters of coal seam mining. Different waterproof protective coal columns were set up for the three geological conditions under study. Additionally, a “claw-shaped” detection and flow monitoring method has been proposed for small water-conducting faults. These findings are important and provide valuable guidance for understanding and managing water inrush hazards in mining operations near major faults.
1. Introduction
Mine water inrush disasters can lead to significant economic losses, dangerous working conditions, and environmental damage [1,2,3]. Faults are often located between confined aquifers and coal seams, with numerous fractures inside the fault and the surrounding rock mass lacking integrity and connectivity, which make them prone to flow deformation [4,5,6]. The rocks within the fracture zone are highly fragmented, which causes faults to become potential water inrush channels between confined aquifers and working faces. These conditions can lead to water inrushes and surrounding rock instability, resulting in casualties [7,8,9,10]. Therefore, studying the water inrush mechanism between confined aquifers and coal seam working faces during mining adjacent to water-conducting faults is crucial to reducing the occurrence of water inrush accidents.
In recent years, scholars have conducted extensive research on the mechanism of water inrush from faults using methods such as theoretical analysis, similar simulation experiments, the finite element method, and the discrete element method [11,12,13,14]. For example, Sun, et al. [15] developed a mechanical model for water inrush through a mining fault in the workface above confined aquifers and proposed a judgment method for the water inrush in this context. Ma, et al. [9] studied the evolution of stress and seepage fields during water inrush, explored the initiation and migration of particles in the process, and examined the impact of rock erosion on the hydraulic and mechanical properties of rock media. Liu and Li [16] used mechanical models to investigate the mechanism of water inrush caused by mining above confined water under a fault structure, providing a criterion for fault activation and aquitard failure. Zhu, et al. [17] employed AHP theory to analyze the factors influencing fault activation and water inrush, establishing a risk assessment indicator system. Lyu, et al. [18] studied the fault activation law and the mechanical essence of rock bursts induced by fault-crossing mining through theoretical analysis, microseismic monitoring, field investigations, and other methods. The above works have achieved some excellent results by using theoretical analysis methods. While these studies have produced valuable results using theoretical analysis, they have not thoroughly explored mining-induced overburden fractures and seepage fields.
Furthermore, Zhu, et al. [19] investigated the characteristics of fault activation and the mechanism of the confined water rising through similar simulation experiments. Zhai, et al. [20] combined similar simulation tests and numerical simulations to examine the water inrush mechanism and key controlling factors caused by fault activation in mining, based on the mining stress characteristics of surrounding rock in key aquifers. Guo, et al. [21] developed a three-dimensional physical model system for simulating water and mud inrush flow–solid coupling in tunnel fault zones. This system was used to conduct model tests, revealing the spatial and temporal changes in the surrounding rock’s stress field and seepage field during tunnel excavation. The aforementioned researchers utilized similar simulation material tests to study the evolution of fault water inrush disasters. However, in practical applications, achieving fluid–solid coupling in coal seam mining remains challenging.
To solve the mechanism of water inrush under the influence of faults, Song and Liang [22] examined the impact of advancing distance and fault dip angle on fault water inrush. Their findings revealed that, with a constant advancing distance, a smaller fault dip angle results in the earlier formation of the water inrush channel. Liu, et al. [23] established a mechanical model of fault activation and analyzed the distribution of shear stress on the fault plane. They identified the influence of coal face advancing distance on fault activation and demonstrated that the extension of the damage zone is linked to the activation of fault cracks, which ultimately leads to water inrush. Zhao, et al. [24] used extended finite element numerical simulation software to study the stress evolution and deformation failure behavior of a coal seam containing a fault floor. Wang and Miao [25] simulated the activation process of coal bottom faults caused by mining using ANSYS software. Their results showed that the impact of fault activation differs significantly between the upper and lower fault blocks, with a higher probability of water inrush occurring when the workface is located in the lower fault block. These scholars employed the finite element method to analyze the mechanism of water inrush due to fault activation. However, they did not account for the inhomogeneity, discreteness, and large deformation failure characteristics of the rock mass.
Additionally, Xian, et al. [13] developed a fluid–solid coupling model for fault zones to study the complex interaction between groundwater seepage and the migration of broken rock mass, aiming to reveal the mechanism of erosion-induced water inrush. Zheng, et al. [26] introduced a new parameter, the “activation coefficient,” to describe the activation process of a fault and established a functional relationship between the activation coefficient and the permeability coefficient. The parameters of this function were determined using numerical simulations across various scenarios, and a water-inrush risk assessment method was proposed. Gu, et al. [27] conducted a numerical analysis based on the three-dimensional discrete element method (DEM) to examine the evolution of displacement and seepage fields in the water-resistant rock mass of a tunnel adjacent to a water-rich fault during the water-inrush process. These researchers employed the discrete element method to investigate the mechanism of water inrush from faults, leveraging the method’s ability to simulate discontinuous behaviors such as large deformations and fractures in the overlying strata.
In summary, while substantial progress has been made in research on fault-induced water inrush during mining, most studies have concentrated on faults acting as water-conducting channels connecting upper and lower aquifers. Additionally, the faults investigated typically exhibit relatively small throws, with mining directed toward the fault. Research on the water-inrush disaster mechanism near large water-conducting faults, particularly when these faults and their associated minor faults serve as the water-inrush source, remains underdeveloped. Therefore, this study focuses on the 30,225 working face of Xiaochang Coal Mine as the study area. Based on the discrete element-fluid coupling theory, this study simulated and investigated the paths of the water inrush channel formed by fractures in water-conducting fault zones following coal seam mining using Universal Distinct Element Code (UDEC). The goal is to reveal the disaster mechanism of mine water inrush during mining near large water-conducting faults and to improve water-inrush prevention technologies for mining in proximity to such faults.
2. Water–Rock Coupling Mechanism
The FEM exhibits limitations in accurately simulating complex pathways involving fracture-dominated seepage, granular flow, or fluid transport within fragmented media. Additionally, mesh generation for complex geometries is computationally intensive and prone to distortion. In contrast, the DEM demonstrates superior capability in capturing dynamic processes, enabling direct modeling of seepage behavior in fracture networks, granular materials, or fractured rock masses without requiring equivalent continuum assumptions.
The seepage problem in rock mass is fundamentally a fluid–solid coupling issue, involving the mutual interaction between seepage pressure and mechanical deformation. In UDEC, fluid flow occurs only in the joints between adjacent mineral particles, not within the material particles themselves. The pressure gradient between adjacent joints governs the fluid flow within these joints. A “domain” refers to a 2D region representing the pore space created by contacts at joint intersections or along joints. The structure of the “domain” is crucial for enabling fluid flow. Fluid flow velocity across the contact surface is calculated using the classical cubic law [28]:
where q is the seepage rate of a single contact surface, m3/s; kj is the permeability coefficient of the fracture, m/s; Δp is the pressure difference between upstream and downstream, Pa; l is the fracture length, m; and a is the fracture aperture, m. The fracture aperture is typically given by the following formula:
where a0 is the contact aperture at zero normal stress, m; Δa is the contact normal displacement, m.
In the fluid–solid coupling simulation of the DEM model, the contact aperture and normal joint stiffness significantly influence the relationship between permeability and stress. When irregular polygons are used in the model, the permeability coefficient equation can be simplified as follows [29]:
where kf is the permeability, m2; g is the acceleration due to gravity, m/s2; ρ1 is the fluid density, kg/m3; and μ is the dynamic viscosity coefficient of the fluid, Pa·s.
In an isotropic medium, the relationship between the permeability coefficient and permeability is given by [30,31]:
where k is the permeability of the porous medium, m2.
Combining Equations (2)–(4), the relationship between the contact aperture and permeability is as follows:
During the calculation process, a new arrangement of elements is regenerated after each time step. The fracture lengths and unit thickness of all domains are then computed. Using the above formula, the flow rate at each contact is calculated. Finally, the fluid flow is superimposed into the fracture domain at each contact point. To account for the change in the volume of the fracture domain due to displacement increments of the surrounding blocks, the fracture water pressure in the domain is calculated using the following formula:
where p is the new pore pressure of the region, Pa; p0 is the pore water pressure from the previous time step, Pa; Q is the sum of the flow rates entering the pore through all contact points of the surrounding pores, m3/s; kω is the bulk modulus of the fluid, Pa; Δv = v − v0, vm = (v + v0)/2, and v and v0 are the pore areas at the current and the previous time steps, respectively, m/s; and Δt is the calculation time step, s.
Using the above formula, a fluid–solid coupling simulation of stress, fractures, and seepage can be carried out. The hydro-mechanical coupling process is shown in Figure 1.

Figure 1.
Hydro-mechanical coupling processes.
Figure 2 illustrates the numerical simulation flowchart for coal seam mining. Once the static analysis result after mining reaches the expected value, the flow setting is activated, and the number of iterations is set to 100. The width of the fracture zone ls around the working face is then checked to determine whether it has reached the water-conducting fault. Let the shortest distance from the working face to the water-conducting fault be lb. If ls < lb, it indicates that the cracks in the model have not yet developed into the water-conducting fault. In this case, the process continues with 100 more iterations, repeating until ls > lb. At this point, the mining-induced fracture zone has reached the water-conducting fault. The fracture zone will then connect to the confined aquifer along the fault.
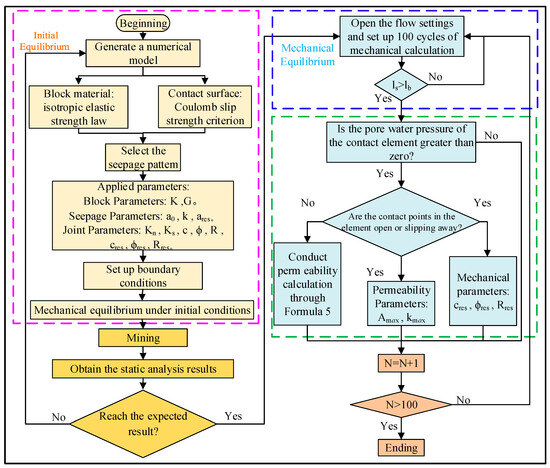
Figure 2.
Numerical simulation flowchart.
When the pore water pressure exceeds 0 MPa, the contact points in the element are assessed to determine if they will open or slip. If this occurs, the residual and the maximum values of the mechanical parameters and permeability coefficient for the contact surface within the element are provided. Otherwise, the permeability is calculated using Equation (5), where permeability increases as the contact pore diameter increases. The iteration cycle is repeated for 100 iterations. The process ends when N > 100.
3. Simulation Analysis of Water Inrush from Faults
3.1. Engineering Background
The Ergangshan south normal fault in the Xiaochang Coal Mine (Shanxi Province, China) marks the western boundary of the mine and serves as its boundary fault. This fault extends for 7.2 km along the mine’s perimeter. It is a water-conducting fault with a dip angle of 75 degrees. The maximum displacement along the fault is nearly 300 m, and it intersects the No. 3 coal seam. On the footwall of the fault, the No. 3 coal seam on the hanging wall, located in the lower part of the Shanxi Formation, is approximately 130 m away from the Ordovician aquifer. The faults DF2, DF3, DF4, DF7, and DF11 are minor faults that branch off from the major water-conducting fault. Mining activities at the 30,225 working face of the No. 3 coal seam occur in an area where the average coal seam thickness is 8 m. For additional geological details, see Figure 3. Mining operations can redistribute and concentrate rock-stratum stress, impacting fault stability and increasing the likelihood of water inrush from the confined aquifer into the working face, potentially causing water-inrush accidents [32]. For this reason, a numerical simulation model has been developed to analyze the risk of water inrush at the working face.

Figure 3.
Engineering environment in Xiaochang Coal Mine and rock mechanics experiments.
3.2. Mining Scheme and Computational Model
As shown in Figure 3, the influence of major water-conducting faults and minor epiphytic faults on the mining safety of the working face is considered. Therefore, the southwestern, middle, and northeastern sections of the 30,225 working face are selected for numerical simulation analysis. The mining direction of the working face is approximately parallel to the Ergangshan South Normal Fault. Coal pillars of varying widths are set up, mining schemes are compared, and the optimal one is selected. The specific scheme is presented in Table 1. The numerical simulation results are shown for the southwestern end, middle section, and northeastern section.

Table 1.
Mining scheme and results.
As depicted in the numerical simulation model in Figure 4, the model is 650 m wide and 320 m high. A uniformly distributed vertical load of 3.5 MPa is applied at the top to simulate ground stress. The confined aquifer refers to a subsurface water-bearing rock stratum confined between impermeable layers. When mining activities breach such aquifers, the pressure differential drives sudden water release into mine workings, resulting in water inrush disasters, with the confined aquifer serving as the hydrodynamic source of these events. Additionally, a water stress of 2 MPa is applied to the Ordovician aquifer and the Ergangshan south normal fault to simulate the effect of confined water on mining-induced stress. Displacement constraints are applied to the left, right, and lower boundaries, while the upper boundary is free to move. The model uses the Mohr–Coulomb criterion, with the Coulomb slip strength criterion applied to the contact surface. Coal and rock samples are collected near the fault of the 30,225 working face at Xiaochang Coal Mine, as shown in Figure 3. Triaxial rock compression tests are conducted to obtain the rock’s mechanical parameters, which are presented in Table 2. Due to differences in mechanical properties between rock and rock mass, previous research methods [33] are referenced. Using the rock quality designation (RQD) index, the rock mechanical parameters are converted into rock mass mechanical parameters:
where Em and Er represent the elastic moduli of the rock mass and rock, respectively, MPa; Tm and Tr refer to the tensile strengths of the rock mass and rock, respectively, MPa.
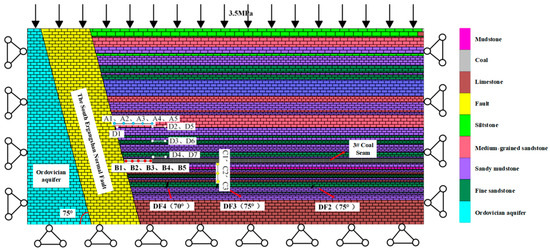
Figure 4.
The geometric features, boundary conditions, and monitoring point layout of the numerical model.
Table 2.
The mechanical characteristics of intact rocks and rock masses.
The rock mechanical parameters are then converted into rock mass mechanical parameters. Mechanical criteria refer to a set of parameters or conditions based on the mechanical properties of rocks, including their strength, elasticity, and permeability, which govern the behavior of rock masses under stress. These criteria are employed to evaluate the stability of geological structures and predict the likelihood of phenomena such as water inrush. The calibrated mechanical properties of the coal and rock mass are shown in Table 3.
where E represents the elastic modulus of the rock mass, MPa; v denotes the Poisson’s ratio of the rock mass; K is the bulk modulus, MPa; and G is the shear modulus, MPa.
Table 3.
Meso-mechanical parameters of model rock formations.
Based on laboratory triaxial tests of diverse rock specimens, the material parameters of each stratum, including Young’s modulus and cohesion, were calculated using Equations (9) and (10). The interface parameters between rock blocks were calibrated through an error optimization algorithm. During this calibration process, field monitoring data were incorporated into the algorithm to iteratively refine the parameters [33]. The optimized contact parameters enhanced the model’s fidelity to field conditions, significantly improving the prediction accuracy of fracture connectivity in the DEM simulations. The results are presented in Table 3.
3.3. Layout of Monitoring Points
Four monitoring areas are established to observe the evolution of water inrush channels. Monitoring area A is located 47 m above the No. 3 coal seam, near the outcrop of the Ergangshan south normal fault. Five monitoring points, spaced 15 m apart, are set up in this area, labeled A1 through A5 from left to right. This area is used to study the variation of maximum vertical strain in the channel when water inrush occurs from the roof. Monitoring area B is situated at the intersection of the No. 3 coal seam and the Ergangshan south normal fault. In this area, five monitoring points, spaced 10 m apart, are arranged from left to right as B1 through B5. This area focuses on studying the variation in maximum vertical strain and water pressure during water inrush events in the waterproof coal pillar. Monitoring area C is located between the floor of the No. 3 coal seam and the DF3 fault. Monitoring points C1, C2, and C3 are set up in the floor of the No. 3 coal seam, in the middle of the DF3 fault, and above the DF3 fault, respectively. This area is used to observe the variation in maximum vertical strain and water pressure during water inrush from the floor. Monitoring area D includes monitoring point D1, located 37 m above the coal seam, near the Ergangshan south normal fault. Additionally, monitoring points D2, D3, and D4 are arranged 37 m, 20 m, and 0.5 m above B5, respectively, while monitoring points D5, D6, and D7 are placed 37 m, 20 m, and 0.5 m to the right of B5. This area aims to study the variation in water pressure when a water-gushing channel forms in the roof.
3.4. Calculation Results
Mining activities and fault activation influence each other. When mining approaches a fault, the stress redistribution caused by mining-induced and water pressure leads to fault activation. The impact of fault activation on mining activities is primarily reflected in the extent of damage to the coal seam, roof, and floor rock masses in front of the working face [25]. The simulation results are shown in Figure 5. In the goaf, both the roof and floor exhibit tensile yield failure, while shear failure occurs on both sides of the goaf. Roof fracture damage is more significant on the side near the large water-conducting fault. The maximum height of the water-conducting fracture zone in the overlying strata of the roof is 140.4 m, while the floor fracture zone reaches a maximum of 47.4 m, influenced by hidden minor faults. Borehole television is a geographical exploration method, and its optical imaging resolution can reach the level of 0.1 mm. Compared with other detection methods, borehole television has higher accuracy. The maximum height of the water-conducting fracture zone observed by on-site borehole television is 133 m. The simulation results are consistent with the on-site geological survey results.
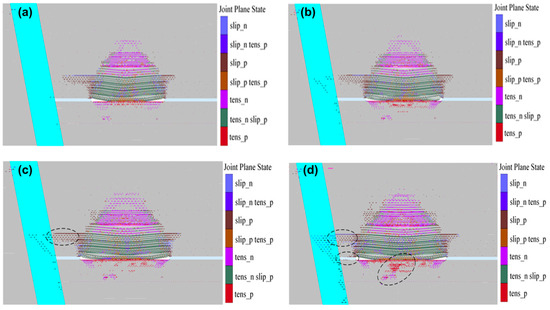
Figure 5.
Diagram of fracture zone evolution: (a) 110 m adjacent to the water-conducting major fault; (b) 90 m adjacent to the water-conducting major fault; (c) 70 m adjacent to the water-conducting major fault; (d) 50 m adjacent to the water-conducting major fault.
When mining occurs 110 m and 90 m adjacent to the large water-conducting fault, both the large water-conducting fault zone and the DF2 fault zone rupture. However, at this stage, the fault fracture zone has not yet connected with the surrounding rock damage fracture zone. At 70 m from the large water-conducting fault, the roof fracture zone connects with the fracture zone of the fault. This marks the appearance of the first water inrush channel: aquifer–fault–roof mining-induced fractures–goaf, with a maximum flow rate of 0.62 m/s. At 50 m from the large water-conducting fault, three water inrush channels appear. The second channel is: aquifer–fault–fractures in the coal seam floor–goaf, with a maximum flow rate of 0.61 m/s. The third channel is: the aquifer–fault–water inrush prevention coal pillar–goaf, with a maximum flow rate of 0.87 m/s. The analysis indicates that safe mining of the coal seams can be achieved at the southwestern end of the 30,225 working face, which is located 90 m from the large water-conducting fault, with a mining width of 240 m.
Due to the influence of mining, the damage range of the roof is larger than that of the floor. The water-conducting channels connected to the aquifer through roof fissures and faults will occur preferentially, namely, the aquifer–Ergangshan fault–roof mining-induced fractures–goaf water inrush channel. This passage appeared the earliest and is most likely to experience a water inrush disaster first. When the working face continued to advance, the waterproof coal pillar was damaged, resulting in cracks. At this time, an aquifer–large water-conducting fault–water inrush prevention coal pillar–goaf–a water inrush channel in the goaf was formed. This passage is located directly in front of the working face, and the mechanical properties of the coal body are poor under high pressure. Therefore, the risk is relatively high, significantly increasing the susceptibility to catastrophic water inrush events. Therefore, a reasonable length of the working face needs to be arranged, and a sufficiently wide waterproof coal column should be left to prevent the occurrence of flood disasters.
The formula used to calculate the safe width of a coal pillar is as follows:
where L represents the width of the reserved coal pillar, m; K is the safety factor, typically ranging from 2 to 5; M is the thickness of the coal seam or mining height, m; P is the actual water head value, MPa; and Kp is the tensile strength of coal, MPa.
The coal pillar experiences stress from faults, coal-seam mining, and high lateral water pressure. The rock mass near the Ergangshan Fault is situated within the fault’s fracture zone. Due to the relatively low integrity and strength of this area compared to the complete rock mass, the safety factor K is assigned a value of 5. Tensile strength tests of three groups of coal samples yielded values ranging from 0.40 to 0.49 MPa, so Kp is set at 0.4 MPa. The value of P is taken as 2.4 MPa. Considering the elastic-plastic failure of the goaf-side coal pillar, the fault-water-barrier coal pillar should have an increased elastic-plastic width, x0. Based on actual production research, the value of x0 is taken as 20 m. Equation (11) is then corrected as follows:
By substituting the numerical values and performing the calculations, the safe width of the coal pillar is determined to be L = 116.65 m. The simulated safe width of the coal pillar is 90 m, indicating a reduction in its safe width.
Figure 6 illustrates the variations in maximum vertical strain at different measurement points in monitoring areas A, B, and C. It depicts the relationship between the maximum vertical strain and the shortening distance to the large water-conducting fault.
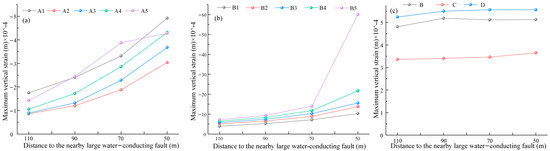
Figure 6.
The relationship between maximum vertical strain and the distance to nearby large water-conducting faults in the monitoring areas: (a) Area A, (b) Area B, and (c) Area C.
As shown in Figure 6a and Figure 7, the maximum vertical compressive strain at all monitoring points increases as the distance from the large water-conducting fault decreases. This is because monitoring points in area A, which are closer to the working face, are subjected to greater mining stress. The maximum vertical compressive strain at A1 and A5 is consistently higher than that at other monitoring points. A1 is near the large water-conducting fault and is heavily influenced by the fracture stress in the fault zone, while A5 is closer to the working face and is strongly affected by mining stress. When the distance from the large water-conducting fault decreases from 90 m to 70 m, the growth rate of maximum vertical compressive strain at A2, A3, A4, and A5 increases. The findings from this simulation data analysis are consistent with those reported in existing research studies. This is due to the connection between the damaged fractures in the roof and the fracture zone of the large water-conducting fault, leading to the formation of a water inrush channel.
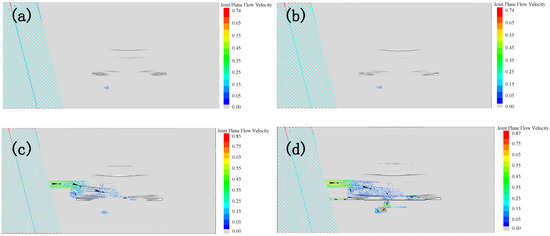
Figure 7.
Diagram of joint plane flow velocity: (a) 110 m near the large water-conducting fault; (b) 90 m near the large water-conducting fault; (c) 70 m near the large water-conducting fault; (d) 50 m near the large water-conducting fault.
As shown in Figure 6b, the maximum vertical compressive strain at all monitoring points increases as the distance from the large water-conducting fault decreases. When the distance reaches 50 m, the maximum compressive strain increases sharply, with the largest increase observed at monitoring point B5. At this time, the damaged fractures in the coal pillar are connected to the fracture zone of the large water-conducting fault, creating a water inrush channel. Figure 6c depicts the maximum vertical tensile strain at the monitored points, which gradually increases as the distance from the large water-conducting fault decreases. The maximum tensile strain at C1 and C3 is consistently higher than at C2. This is because C1, located near the floor, is more affected by mining-induced stress, while C3, near the DF3 fault, experiences a greater influence from the fracture stress of the fault zone. When the distance from the large water-conducting fault decreases from 70 m to 50 m, the growth rate of the maximum compressive strain at C2 increases. This is due to the connection between the damaged fractures in the floor and the fracture zone of the DF2 fault, resulting in the formation of a water-inrush channel. The vertical height of the fracture in the large water-conducting fault zone is defined as the activity height of the fault. Figure 8 illustrates the relationship between the mining damage depth and the activity height of the large water-conducting fault as the distance from the fault decreases. As the distance shortens, both the fault activity height and mining damage depth increase. The maximum fault damage height reaches 155 m, and the maximum mining damage depth reaches 39 m, presenting significant safety hazards in coal mine production. At this point, the damaged fractures in the floor are connected to the fracture zone of the DF2 fault.
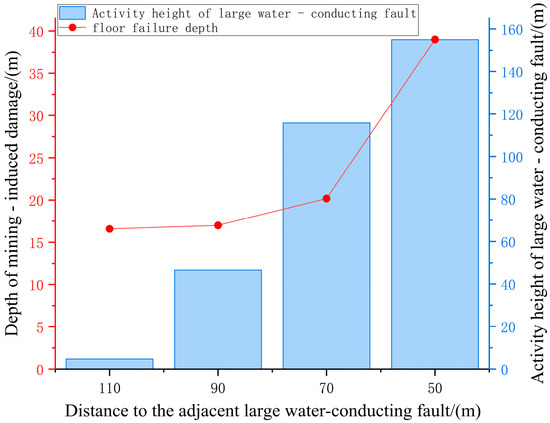
Figure 8.
The relationships between mining failure depth, the height of large water-conducting faults activated by mining, and the distance to nearby large water-conducting faults.
When mining is conducted at distances of 110 m and 90 m from the large water-conducting fault, the water pressure at all monitoring points in Figure 9a,b is 0 MPa. The water pressure at measuring points C1 and C2 in Figure 9c is also 0 MPa, while the water pressure at monitoring point C3 is 0.011 MPa. At this point, fractures occur near the DF3 fault zone. When mining is conducted at a distance of 70 m from the large water-conducting fault, the water pressure in the B monitoring area is 0 MPa across all points. At monitoring point C3 in the C monitoring area, the water pressure is 0.012 MPa. In monitoring area A, water pressure is detected at each point and a water inrush channel forms on the roof. The water pressure is highest near the large water-conducting fault, reaching 1.984 MPa. As the water flows into the channel, the pressure generally decreases. When mining is carried out at a distance of 50 m from the large water-conducting fault, water pressure is detected at monitoring points in the B, C, and D areas. At this distance, three water inrush channels form. In the roof water inrush channel, the pressure at monitoring point D1, located near the large water-conducting fault, is 1.97 MPa. As water flows into the channel, the pressure gradually decreases. In the coal-and-rock pillar water inrush channel, the pressure at monitoring point B1, near the fault, is 1.706 MPa, with the pressure decreasing as the water flows into the channel. In the floor water inrush channel, the pressure near the floor is 0.248 MPa, increasing to 0.822 MPa at the midpoint between the floor and the DF3 fault. The pressure near the DF3 fault is 1.964 MPa.
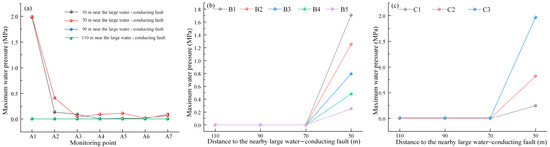
Figure 9.
The relationship between maximum water pressure and the location of monitoring points. (a) Area A, (b) Area B, and (c) Area C.
4. Countermeasures for Water Prevention and Control
The large water-conducting fault and the concealed, proven epiphytic minor faults are critical factors in water inrush disasters at the 30,225 working face. Therefore, this study proposes a detection method for “claw-shaped” water-conducting minor faults and concealed faults. It aims to monitor and provide effective warnings for both identified and simulated water inrush channels. The proposed detection scheme is as follows:
Before roadway excavation, it is essential to thoroughly investigate the water-richness of the roadway and surrounding aquifers, as well as the water-conducting properties of faults and collapse columns. The surrounding rock is detected by using the high-precision transient electromagnetic method. If faults, fractures, collapse columns, or other structures are found to be water-filled, safety measures such as grouting reinforcement or the establishment of coal pillars to prevent water inrush should be implemented [34]. During roadway excavation, drilling should be used to verify the water conductivity of the top and bottom plates, as well as the side coal pillars, to prevent water inrush. The first roof water exploration and drainage hole should be constructed 60 m outward from the working face’s open-off cut. Subsequent roof water exploration holes should be installed every 200 m, with the final hole at stratum K10 to mitigate the hazards of roof and fault water. For the floor, the final hole location should be at stratum K5. In abnormal areas with abundant water, the arrangement of water exploration holes may induce water inrush. Therefore, monitoring efforts should be strengthened, and drainage holes should be arranged to drain the water from these areas (roofs and floors). Meanwhile, more advanced detection technologies should be adopted to accurately identify water-rich areas. The layout of water exploration and drainage holes for roof fissure water is shown in Figure 10a, while the layout for floor fissure water is shown in Figure 10c. The channels for exploring water are shaped like a claw, so this method is called “claw-shaped” hydraulic conductivity mini-fault detection. When exploring and draining water in the coal seam, a water-separating gate wall must be designed and implemented before water exploration and drainage begin. For areas near faults, long-distance drilled water holes should be used for detection, while short-distance holes should be employed near the working face. This approach will expedite construction progress and reduce the frequency of drilling rig mobilizations. Water exploration and drainage holes should follow a path that is first oblique and then horizontal [35]. The specific design parameters L are shown in Figure 10b,d. Additionally, the length of the horizontal section S in Figure 10d can be adjusted based on the capacity of the drilling rig. A longer horizontal section (S) will reduce the number of rig movements and speed up construction progess. For associated faults where water is detected, continuous flow monitoring and water quality assessments should be conducted to identify the water source. The water-gushing channels should be analyzed, and a reasonable water-retaining coal pillar should be established. However, the challenges of the “claw-shaped” hydraulic conductivity mini-fault detection method cannot be ignored. For instance, the angle of the detection channels should not be too small to prevent the detection range from being too small. The solution is to pre-detect the range of the water-containing area by transient electromagnetism to determine the appropriate angle of the detection channels.
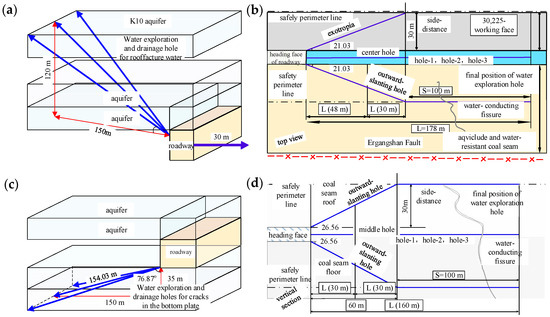
Figure 10.
“Claw-shaped” hydraulic conductivity mini-fault detection design plan: (a) Design of water exploration and drainage for the roof fracture aquifer; (b) Top view of water exploration and drainage adjacent to the working face; (c) Design of water exploration and drainage for the floor fracture aquifer; (d) Side view of water exploration and drainage adjacent to the fault.
5. Conclusions
This work investigates the issue of water inrush from faults induced by mining in the working face adjacent to large water-conducting faults. The required DEM parameters of block contacts were calibrated through the trial-and-error optimization algorithm. Numerical simulations were performed by applying block discrete element fluid–solid coupling theory. The study examines the characteristics of seepage channels in the mining rock mass under different geological conditions. It systematically explains the evolution mechanism of fractures and seepage in the mining rock mass adjacent to large water-conducting faults and proposes effective methods for preventing and controlling water inrush disasters. The main conclusions drawn are as follows:
(1) Three paths for the formation of water-inrush channels during mining near large water-conducting faults are identified. The calculated stress field and seepage field indicated that the formation of the water-inrush channels is determined by the parameters of coal seam mining.
(2) In the southwestern section of the 30,225 working face, a 90 m protective coal pillar is set, and the working face width is 240 m. In the middle section, an 80 m protective coal pillar is set, with a working face width of 230 m. In the northeastern section, a 90 m protective coal pillar is set, and the working face width is 260 m. This design scheme can significantly reduce the risk of water inrush at the 30,225 working face.
(3) Large water-conducting faults and concealed or proven epiphytic minor faults are critical channels for water inrush disasters. The “claw-shaped” drilling detection scheme is effective in identifying concealed minor faults around the coal seam to be mined and in determining the water conductivity of these faults, thereby providing an early warning of potential water inrush disasters. This ensures the safety of roadway tunneling and mining operations at the working face.
However, this study still exhibits certain limitations, particularly regarding the boundary condition settings in the simulation, model scale, and applicability of the results. Future research should prioritize exploring advanced monitoring technologies and improving predictive models for water inrush events.
Author Contributions
X.G.: Conceptualization, Methodology, Formal analysis, Writing—original draft. D.M.: Supervision, Project administration, Funding acquisition, Writing—review and editing. L.W.: Formal analysis, Software, Writing—original draft. Q.L.: Validation, Writing—review and editing, Funding acquisition. Z.L.: Validation, Supervision, Project administration, Funding acquisition. F.D.: Validation, Writing—review and editing. R.Q.: Software, Validation, Writing—review and editing. J.H.: Validation, Writing—review and editing. All authors have read and agreed to the published version of the manuscript.
Funding
The author(s) declare that financial support was received for the research, authorship, and/or publication of this article. This research was funded by the National Natural Science Foundation of China (U23B2091, U24B2041, 52304104), the National Key R&D Program of China (2022YFC2905600), and the China Postdoctoral Science Foundation (2023M741009).
Data Availability Statement
Data are contained within the article.
Conflicts of Interest
Authors Rui Qiao and Jiufang Han were employed by the company Jiaozuo Coal Group Co., Ltd. and Jiaozuo Shenlong Hydrogeological Engineering Co., Ltd. The remaining authors declare that the research was conducted in the absence of any commercial or financial relationships that could be construed as a potential conflict of interest.
References
- Li, L.P.; Zhou, Z.Q.; Li, S.C.; Xue, Y.G.; Xu, Z.H.; Shi, S.S. An Attribute Synthetic Evaluation System for Risk Assessment of Floor Water Inrush in Coal Mines. Mine Water Environ. 2015, 34, 288–294. [Google Scholar] [CrossRef]
- Wu, J.; Yang, S.; Wong, H.S.; Yin, Q.; Zhang, H.; Chen, W.; Ma, D. Reinforcement mechanisms of cellulose nanofibers on cemented rockfill: Macroscopic, microscopic and molecular insights. Constr. Build. Materi. 2025, 466, 140192. [Google Scholar] [CrossRef]
- Ma, D.; Duan, H.; Liu, W.; Ma, X.; Tao, M. Water-Sediment Two-Phase Flow Inrush Hazard in Rock Fractures of Overburden Strata During Coal Mining. Mine Water Environ. 2020, 39, 308–319. [Google Scholar] [CrossRef]
- Ma, D.; Duan, H.Y.; Zhang, J.X.; Bai, H.B. A state-of-the-art review on rock seepage mechanism of water inrush disaster in coal mines. Int. J. Coal. Sci. Technol. 2022, 9, 50. [Google Scholar] [CrossRef]
- Hou, W.; Ma, D.; Li, Q.; Zhang, J.; Liu, Y.; Zhou, C. Mechanical and hydraulic properties of fault rocks under multi-stage cyclic loading and unloading. Int. J. Coal Sci. Technol. 2023, 10, 54. [Google Scholar] [CrossRef]
- Zhang, C.; Chen, Y.; Ren, Z.; Wang, F. Compaction and seepage characteristics of broken coal and rock masses in coal mining: A review in laboratory tests. Rock Mech. Bull. 2024, 3, 100102. [Google Scholar] [CrossRef]
- Wu, L.Y.; Bai, H.B.; Yuan, C.; Wu, G.M.; Xu, C.Y.; Du, Y. A Water-Rock Coupled Model for Fault Water Inrush: A Case Study in Xiaochang Coal Mine, China. Adv. Civ. Eng. 2019, 2019, 9343917. [Google Scholar] [CrossRef]
- Ma, D.; Duan, H.; Li, Q.; Wu, J.; Zhong, W.; Huang, Z. Water–rock two-phase flow model for water inrush and instability of fault rocks during mine tunnelling. Int. J. Coal Sci. Technol. 2023, 10, 77. [Google Scholar] [CrossRef]
- Wu, Q.; Guo, X.M.; Shen, J.J.; Xu, S.; Liu, S.Q.; Zeng, Y.F. Risk Assessment of Water Inrush from Aquifers Underlying the Gushuyuan Coal Mine, China. Mine Water Environ. 2017, 36, 96–103. [Google Scholar] [CrossRef]
- Zhang, C.; Bai, Q.; Han, P. A review of water rock interaction in underground coal mining: Problems and analysis. Bull. Eng. Geol. Environ. 2023, 82, 157. [Google Scholar] [CrossRef]
- Liu, X.; Wang, S. Mine Water Inrush Forecasting during the Mining under Waters. Disaster Adv. 2012, 5, 876–881. [Google Scholar]
- Duan, H.Y.; Ma, D.; Zou, L.C.; Xie, S.J.; Liu, Y. Co-exploitation of coal and geothermal energy through water-conducting structures: Improving extraction efficiency of geothermal well. Renew. Energy 2024, 228, 120666. [Google Scholar] [CrossRef]
- Duan, H.Y.; Ma, D.; Kong, S.B.; Ma, Z.S.; Zou, L.C. Hydraulic erosion-heat transfer coupling model for coal and geothermal energy co-exploitation. Renew. Energy 2025, 248, 123109. [Google Scholar] [CrossRef]
- Wang, J.; Zhang, Y.; Qin, Z.; Song, S.; Lin, P. Analysis method of water inrush for tunnels with damaged water-resisting rock mass based on finite element method-smooth particle hydrodynamics coupling. Comput. Geotech. 2020, 126, 103725. [Google Scholar] [CrossRef]
- Sun, J.; Wang, L.G.; Hu, Y. Mechanical criteria and sensitivity analysis of water inrush through a mining fault above confined aquifers. Arab. J. Geosci. 2019, 12, 4. [Google Scholar] [CrossRef]
- Liu, W.; Li, Y. Theoretical and Simulation Investigations of Water Inrushes Due to Fault Activation by Mining. Mine Water Environ. 2023, 42, 146–157. [Google Scholar] [CrossRef]
- Zhu, G.L.; Wang, S.L.; Zhang, W.Q. Research on Risk Assessment of Water Inrush Caused by Fault Activation Based on Unascertained Mathematics Theory. Geotech. Geol. Eng. 2019, 37, 4381–4389. [Google Scholar] [CrossRef]
- Lyu, P.F.; Bao, X.Y.; Lyu, G.; Chen, X.H. Research on Fault Activation Law in Deep Mining Face and Mechanism of Rockburst Induced by Fault Activation. Adv. Civ. Eng. 2020, 2020, 8854467. [Google Scholar] [CrossRef]
- Zhu, G.L.; Zhang, W.Q.; Wang, S.L.; Zhang, P.S. Experimental Research on Characteristics of Fault Activation and Confined Water Rising. Geotech. Geol. Eng. 2018, 36, 2625–2636. [Google Scholar] [CrossRef]
- Zhai, X.; Wu, J.; Dou, Z.; Kai, K.; Wang, G.; Yangzhou, Y. Water Inrush Mechanism Caused by Fault Activation Based on Stress Evolution of Surrounding Rock of Key Aquifer. J. Eng. Sci. Technol. 2017, 10, 179–185. [Google Scholar] [CrossRef]
- Guo, Y.; Kong, Z.; He, J.; Yan, M. Development and Application of the 3D Model Test System for Water and Mud Inrush of Water-Rich Fault Fracture Zone in Deep Tunnels. Math. Probl. Eng. 2021, 2021, 8549094. [Google Scholar] [CrossRef]
- Song, W.; Liang, Z. Theoretical and numerical investigations on mining-induced fault activation and groundwater outburst of coal seam floor. Bull. Eng. Geol. Environ. 2021, 80, 5757–5768. [Google Scholar] [CrossRef]
- Liu, Y.; Yang, H.; Liu, C. Study on the Influence of Coal Face Advancing Distance on Fault-Activated Water Inrush. Geotech. Geol. Eng. 2020, 38, 3559–3575. [Google Scholar] [CrossRef]
- Zhao, J.; Juntao, C.; Huilin, X.; Zhao, Z.; Xinguo, Z. Dynamic Mechanical Response and Movement Evolution Characteristics of Fault Systems in the Coal Mining Process. Pure Appl. Geophys. 2022, 179, 233–246. [Google Scholar] [CrossRef]
- Wang, L.-G.; Miao, X.-X. Numerical Simulation of Coal Floor Fault Activation Influenced by Mining. J. China Univ. Min. Technol. 2006, 16, 385–388. [Google Scholar] [CrossRef]
- Zheng, Z.; Liu, R.; Zhang, Q. Numerical Simulation and Risk Assessment of Water Inrush in a Fault Zone that Contains a Soft Infill. Mine Water Environ. 2019, 38, 667–675. [Google Scholar] [CrossRef]
- Gu, J.; Guo, J.; Chen, F.; Li, J. Evolution Law and Grouting Treatment of Water Inrush in Hydraulic Tunnel Approaching Water-Rich Fault: A Case Study. Appl. Sci. 2024, 14, 3407. [Google Scholar] [CrossRef]
- Gao, X.; Zhang, Y.; Cheng, Y.; Yu, Z.; Huang, Y. Impact of fractures with multi-scale aperture variability on production observations of geothermal reservoir units. J. Hydrol. 2022, 615, 128693. [Google Scholar] [CrossRef]
- Gao, X.; Zhang, Y.; Cheng, Y.; Yu, Z.; Hu, Z.; Huang, Y. Heat extraction performance of fractured geothermal reservoirs considering aperture variability. Energy 2023, 269, 126806. [Google Scholar] [CrossRef]
- Chen, S.; Zhang, Q.; Li, H.; McLellan, B.; Zhang, T.; Tan, Z. Investment decision on shallow geothermal heating & cooling based on compound options model: A case study of China. Appl. Energy 2019, 254, 113655. [Google Scholar] [CrossRef]
- Zhang, C.; Liu, J.; Zhao, Y.; Zhang, L.; Guo, J. A fluid-solid coupling method for the simulation of gas transport in porous coal and rock media. Comput. Geotech. 2019, 7, 1913–1924. [Google Scholar] [CrossRef]
- Yin, S.; Zhang, J.; Liu, D. A study of mine water inrushes by measurements of in situ stress and rock failures. Nat. Hazards 2015, 79, 1961–1979. [Google Scholar] [CrossRef]
- Zhang, L.; Einstein, H.H. Using RQD to estimate the deformation modulus of rock masses. Int. J. Rock Mech. Min. Sci. 2004, 41, 337–341. [Google Scholar] [CrossRef]
- Wu, J.Y.; Yang, S.; Williamson, M.; Wong, H.S.; Bhudia, T.; Pu, H.; Yin, Q.; Ma, D.; Chen, W.Q. Microscopic mechanism of cellulose nanofibers modified cemented gangue backfill materials. Adv. Compos. Hybrid Mater. 2025, 8, 177. [Google Scholar] [CrossRef]
- Wu, J.Y.; Wong, H.S.; Zhang, H.; Yin, Q.; Jing, H.W.; Ma, D. Improvement of cemented rockfill by premixing low-alkalinity activator and fly ash for recycling gangue and partially replacing cement. Cem. Concr. Compos. 2024, 145, 105345. [Google Scholar] [CrossRef]
Disclaimer/Publisher’s Note: The statements, opinions and data contained in all publications are solely those of the individual author(s) and contributor(s) and not of MDPI and/or the editor(s). MDPI and/or the editor(s) disclaim responsibility for any injury to people or property resulting from any ideas, methods, instructions or products referred to in the content. |
© 2025 by the authors. Licensee MDPI, Basel, Switzerland. This article is an open access article distributed under the terms and conditions of the Creative Commons Attribution (CC BY) license (https://creativecommons.org/licenses/by/4.0/).