Article

Prediction of the Water-Conducting Fracture Zone Height Across the Entire Mining Area Based on the Multiple Nonlinear Coordinated Regression Model

1
School of Mining Engineering and Geology, Xinjiang Institute of Engineering, Urumqi 830023, China
2
Key Laboratory of Xinjiang Coal Resources Green Mining, Ministry of Education, Xinjiang Institute of Engineering, Urumqi 830023, China
3
Xinjiang Key Laboratory of Coal-Bearing Resources Exploration and Exploitation, Xinjiang Institute of Engineering, Urumqi 830023, China
4
Xinjiang Engineering Research Center of Green Intelligent Coal Mining, Xinjiang Institute of Engineering, Urumqi 830023, China
5
School of Energy and Mining Engineering, China University of Mining and Technology-Beijing, Beijing 100083, China
*
Author to whom correspondence should be addressed.
Water 2025, 17(9), 1303; https://doi.org/10.3390/w17091303
Submission received: 20 March 2025 / Revised: 12 April 2025 / Accepted: 25 April 2025 / Published: 27 April 2025

Abstract

:
The water-conducting fracture zone (WCFZ) is a critical geological structure formed by the destruction of overburden during coal mining operations. Accurately predicting the height of the water-conducting fractured zone (HWCFZ) is essential for ensuring safe coal production. Based on more than 150 measured heights of fractured water-conducting zone samples from various mining areas in China, this study investigates the influence of five primary factors on the height: mining thickness, mining depth, length of the panel, coal seam dip, and the proportion coefficient of hard rock. The correlation degrees and relative weights of each factor are determined through grey relational analysis and principal component analysis. All five factors exhibit strong correlations with the height of the fractured water-conducting zone, with correlation degrees exceeding 0.79. Mining thickness is found to have the highest weight (0.256). A multiple nonlinear coordinated regression equation was constructed through regression analysis of the influencing factors. The prediction accuracy was compared with three other predictive models: the multiple nonlinear additive regression model, the BP neural network model, and the GA-BP neural network model. Among these models, the multiple nonlinear coordinated regression model was found to achieve the lowest error rate (7.23%) and the highest coefficient of determination (R2 = 87.42%), indicating superior accuracy and reliability. The model’s performance is further validated using drill hole data and numerical simulations at the B-1 drill hole in the Fuda Coal Mine. Predictive results for the entire Fuda Coal Mine area indicate that as the No. 15 coal seam extends northwestward, the height of the fractured water-conducting zone increases from 52.1 m to 73.9 m. These findings have significant implications for improving mine safety and preventing geological hazards in coal mining operations.

1. Introduction

Rock movement and deformation induced by coal seam mining lead to the upward development and transfixion of overburden fractures and can even connect with aquifers to form water flow channels, thereby increasing the risk of water inrushes and bursts in mines [1,2]. The fractured water-conducting zone is a critical geological structure affected by overburden failure during mining, and its development height is directly related to the risk assessment and prevention of mine water hazards [3]. Currently, the prediction of the HWCFZ in coal seams primarily relies on empirical formulas outlined in the “Code for Retaining Coal Pillars and Mining under Buildings, Water Bodies, Railways, and Main Roadways” [4]. These empirical formulas solely consider mining thickness as a factor. However, the geological conditions, coal seam overburden structure, and mining techniques also should be considered. To improve the accuracy of predicting the HWCFZ, it is necessary to consider as many influencing factors as possible and to establish a prediction model for the HWCFZ. This is crucial for ensuring mine safety and preventing geological hazards.
To enhance the accuracy and applicability of the HWCFZ predictions, scholars worldwide have conducted research on the development characteristics and prediction of the HWCFZ. Given the complex coal occurrence conditions in China, studies have been carried out on the development of the HWCFZ under various conditions, including the presence or absence of faults [5], high-intensity mining in western China [6], shallow and thick Jurassic coal seams [7], combined mining of Jurassic and Carboniferous coal seams, weakly cemented overburden [8,9], and different panel lengths [10]. The main factors influencing the height of the fractured water-conducting zone in coal seam roofs include the mining thickness, burial depth, panel length, coal seam dip, and the proportion coefficient of hard rock. By collecting a large amount of measured data on the fractured water-conducting zone, multiple linear and nonlinear regression equations have been established for prediction [11,12,13,14]. Various numerical simulation software have been used for modeling to predict the height of the fractured zone [15,16]. Machine learning prediction models such as Back Propagation neural networks (BP-NNs) [17], GA-Catboost algorithms [18], Support Vector Regression (SVR) models under Multi-Population Genetic Algorithms (MPGAs) [19,20,21], optimal Convolutional Neural Network (CNN) models [22,23], and Extreme Learning Machine (ELM) models [24] have been developed to train and validate the measured data. Based on specific mines, methods such as elastic wave detection using critical stratigraphy theory [25,26], multi-algorithm combined optimization models [27], Microseismic Monitoring Systems (MMSs) [28], and Random Forest Regression (RFR) models [29,30] have been adopted to improve the accuracy and applicability of the height of the WCFZ predictions. The nonlinear regression model has been widely applied in various fields, including mining, medicine, forestry, chemistry, biology, and navigation, demonstrating its broad adaptability and high accuracy [31,32,33,34,35,36]. Scholars have conducted extensive research on the development patterns of the WCFZ and its height prediction using machine learning models under different geological conditions. Compared to the uncertainty of machine learning predictions, the predicted values of regression equations are unique and reliable. However, regression equations for predicting the HWCFZ often use simple multiple linear or nonlinear regression, which yields less accurate predictions than machine learning models. Therefore, it is highly necessary to establish a regression equation model with high accuracy.
Based on extensive collected measured data on the WCFZ in fully mechanized mining of coal mines in China, this study considers the mining thickness, mining depth, panel length, coal seam dip, and proportion coefficient of hard rock as the main influencing factors on the development height of the WCFZ. The correlation degree and weight of each influencing factor on the HWCFZ are determined through grey relational analysis and principal component analysis. Based on the fitting results of the influencing factors, a multiple nonlinear coordinated regression equation is proposed, and multiple nonlinear regression models, BP neural network models, and GA-BP neural network models are established. By comparing and analyzing the development heights of the WCFZ obtained from different prediction models, it is demonstrated that the proposed prediction method for the HWCFZ in this study has higher accuracy and reliability, providing a reference for similar mining predictions.

2. Analysis of the Factors for the HWCFZ and Research Methods

2.1. Analysis of Influencing Factors of the HWCFZ

The development of the fractured water-conducting zone in fully mechanized caving mining is influenced by multiple factors, and there is a correlation among them. The mining thickness, mining depth, length of the panel, coal seam dip, and proportion coefficient of hard rock are usually regarded as the main factors influencing the height of the fractured water-conducting zone by scholars, as illustrated in Figure 1.
(1)
Mining Thickness M
The mining thickness is a critical factor affecting the height of the fractured water-conducting zone. As the mining thickness increases, the stress structure of the roof strata changes, leading to the instability and fracturing of the strata, followed by more extensive collapse and the formation of fractures.
(2)
Mining Depth D
The mining depth primarily affects the stress distribution and geological environment of the underground strata rather than directly determining the height of the fractured water-conducting zone. Generally, the insitu stress of the surrounding rock increases with depth, leading to a more severe degree of damage in the overlying strata and the development of the WCFZ. However, under shallow burial conditions, the range and degree of damage to the overlying strata are relatively larger. The height of the WCFZ may be higher than that of deeper coal seams.
(3)
Length of Panel L
The length of the panel determines the final development of the HWCFZ when the coal seam is fully mined. As the span increases, the degree of bending of the rock beam increases, leading to a higher development of fractures. When the goaf area reaches the full extraction condition of the overlying strata, the height of fracture development no longer increases.
(4)
Coal Seam Dip α
The coal seam dip controls the development of the HWCFZ by influencing the failure behaviors of the overlying strata. When the coal seam dip is less than 35°, the fracture zone exhibits a “saddle shape”, with a relatively uniform rock failure form. At this point, the height of the fracture zone development is mainly influenced by the breaking angle. As the dip angle increases, the breaking angle gradually decreases, causing the fracture height to decrease slowly with the increase in the dip angle. When the dip angle exceeds 35°, the fracture zone rapidly develops into an “ear shape” or a “large upper and smaller lower arch shape”. The increased rolling and sliding of the collapsed rock restrict the lower boundary expansion of the fracture zone, while the upper boundary of the WCFZ rapidly extends upward, with the fracture height increasing as the coal seam dip increases.
(5)
Proportion Coefficient of Hard Rock K
The proportion coefficient of hard rock refers to the ratio of the cumulative thickness of the hard rock strata within the statistical HWCFZ to the statistical height. In fully mechanized caving mining, different structural types and compressive strengths of the roof strata result in varying ranges of deformation and damage after mining. Since the compressive strength of the multilayer strata is not clearly defined and the structural types of strata are difficult to quantify, the proportion coefficient of hard rock can be used as a substitute [31].
K = h ( 15 ~ 20 ) M
where M is the mining thickness and h is the cumulative thickness of the hard rock strata within the statistical HWCFZ (generally 15 to 20 times the mining thickness). When 0 ≤ K ≤ 0.1, the roof is classified as extremely weak; when 0.1 < K ≤ 0.3, it is classified as weak; when 0.3 < K ≤ 0.7, it is classified as moderately hard; and when 0.7 < K ≤ 1, it is classified as hard.

2.2. Specific Lines of Research

Through statistical analysis, over 150 measured height samples of the WCFZ from various mining areas in China were collected from the literature, as shown in Table 1. These samples include parameters such as the mining height, burial depth, and panel inclination length, facilitating the development of a predictive model. The analysis process involved several steps. MATLAB 2020b was used to classify and organize the dataset, forming a foundational multidimensional dataset. SPSS 25 software was then employed to calculate the correlation coefficients and weights of various factors affecting the fracture zone.
A multiple nonlinear coordinated regression model was proposed based on nonlinear data fitting. This model was further evaluated by comparing prediction results using a neural network and a GA-BP neural network. Validation of the nonlinear multiplicative regression model was conducted using the results of borehole B-1 observations from the Fuda Coal Mine in Shanxi Province. A numerical model for the development of the WCFZ was established. Finally, using data from multiple boreholes across the entire Fuda coal seam, the multiple nonlinear coordinated regression model was applied to construct a distribution map of the HWCFZ across the entire mining area. The research methodology is illustrated in Figure 2.

3. Results and Discussion

3.1. Measured Data of the WCFZ

3.1.1. Correlation Analysis

According to the Grey System Theory, underlying laws inevitably exist even though the objective system appears complex with discrete data and incomplete information. Grey relational analysis (GRA) is widely used in systems with limited information and small sample sizes. GRA was employed to calculate the correlation between primary factors and the HWCFZ in MATLAB software, with the HWCFZ as the reference factor and the mining thickness, length of the panel, proportion coefficient of hard rock, mining depth, and coal seam dip as subordinate factors. The closer the correlation value is to 1, the greater the influence. As illustrated in Figure 3, all five primary control factors have a correlation value above 0.79, indicating that these factors significantly impact the HWCFZ. The mining thickness and length of the panel have the largest influence, followed by the mining depth and coal seam dip, while the proportion coefficient of hard rock has a relatively smaller effect.
A Pearson correlation heatmap was employed to further analyze the relationships between the HWCFZ (F) and influencing factors, including the mining height (A), burial depth (B), panel length (C), hard rock ratio coefficient (D), and dip angle (E), As shown in Figure 4. The results indicate that the mining height exhibits the strongest correlation with the fracture zone height (r = 0.74), followed by the burial depth (r = 0.24), dip angle (r = −0.23), panel length (r = 0.12), and hard rock ratio coefficient (r = 0.08). Notably, no significant inter-factor correlations were observed, confirming the absence of multicollinearity or overfitting risks in subsequent model fitting.

3.1.2. Principal Component Analysis

Principal component analysis (PCA) transforms multiple correlated indicators from the original data into a few independent composite indicators without losing or with minimal loss of information. The mathematical model for PCA is as follows:
F 1 = a 11 X 1 + a 21 X 2 + a n 1 X n F 2 = a 12 X 1 + a 22 X 2 + a n 2 X n F m = a 1 m X 1 + a 2 m X 2 + a n m X n
a i j = μ i j λ j ( i = 1 , 2 , n ; j = 1 , 2 , , m )
where Fj represents the principal component; μij is the initial factor loading; and λj is the eigenvalue.
From the principal component expression, the comprehensive score model can be derived as follows:
Y = w 1 X 1 + w 2 X 2 + + w n X n
W i = a i j v j j = 1 m v j
where vj is the variance contribution rate; Wi is the weight of i, which is the indicator determined by the principal components.
Using SPSS software, a PCA was conducted on the 149 measured samples from Table 1, analyzing factors such as the mining thickness, mining depth, length of the panel, coal seam dip, and proportion coefficient of hard rock. The calculated weights of each influencing factor are shown in Figure 5. These weights show a positive correlation with the results of the grey relational analysis. Mining thickness, with a weight of 0.256, remains the most significant factor, followed by the length of the panel with a weight of 0.243. Mining depth and coal seam dip are secondary, while the proportion coefficient of hard rock has a relatively smaller influence.

3.2. Prediction Models for the HWCFZ

3.2.1. Nonlinear Additive Regression Model

Previous studies have shown that the HWCFZ does not have a linear relationship with the five influencing factors discussed earlier. A nonlinear model is required for accurate analysis. Using the curve fitting module of SPSS software, the coefficient of determination (R2) was selected as the criterion to determine the optimal univariate model for each factor. Univariate regression analyses were conducted to explore the relationships between the HWCFZ and mining thickness (M), mining depth (H), length of the panel (L), coal seam dip (Q), and (K), as illustrated in Figure 6.
Y 1 = a 1 M 2 + b 1 M + c 1 Y 2 = a 2 H 2 + b 2 H + c 2 Y 3 = a 3 ln ( L ) + b 3 Y 4 = a 4 Q 2 + b 4 Q + c 4 Y 5 = a 5 ln ( K ) + b 5
where a1~a5, b1~b5, and c1~c3 are the coefficients of each factor.
Based on these models, the individual nonlinear relationships were superimposed to establish a comprehensive nonlinear regression model for the WCFZ. SPSS was used to solve for the coefficients, which are presented in Table 2.
Y = a 1 M 2 + b 1 M + a 2 H 2 + b 2 H + a 3 ln ( L ) + a 4 Q 2 + b 4 Q + a 5 ln ( K ) + a 6
where a6 is the coefficient of the factor.

3.2.2. Multivariate Nonlinear Coordinated Regression Model

Since the influencing factors are not independent and interact with each other in determining the HWCFZ, using an additive fitting approach would likely introduce errors. By fitting the factors multiplicatively, their interactions are considered, which reduces the prediction error to some extent. A multivariate nonlinear coordinated regression model was established, and SPSS was used to solve for the coefficients, which are presented in Table 3.
Y = ( a 1 M 2 + b 1 M + c 1 ) ( a 2 H 2 + b 2 H + c 2 ) ( a 3 ln ( L ) + b 3 ) ( a 4 Q 2 + b 4 Q + c 4 ) ( a 5 ln ( K ) + b 5 ) + a 6
The standardized mean squared residual (SMR) of the model is 0.076, which is below the threshold of 0.08, indicating a good fit to the data. However, the nonlinear coordinated regression model exhibits relatively wide confidence intervals for its parameters; for instance, parameter a1 ranges from −35.48 to 33.16, As shown in Table 3. Such broad intervals may reduce the prediction accuracy, attributable to the multifactorial influences governing the development height of the water-conducting fracture zone. To address this, additional field data under analogous geological conditions could be incorporated into the fitting process, thereby narrowing the confidence intervals and enhancing the model’s accuracy and stability.

3.2.3. Neural Network Model

The Back Propagation neural network (BPNN) is a multi-layer feedforward neural network with powerful self-learning and self-adaptation capabilities. It is especially suited for dealing with problems involving complex causality, uncertainty, inference, judgment, and classification. The complexity and nonlinearity of predicting the HWCFZ make the BPNN an ideal candidate for building the prediction model.
While performing well in certain cases, the BPNN can easily fall into a local optimum because of the sensitivity to initial parameters and network structure, resulting in limited prediction performance. The GA-BPNN, optimized by the genetic algorithm (GA), improves the prediction accuracy by using GA to search for an optimal parameter for the BPNN.
MATLAB software was used to process the data from Table 1. The activation function (Sigmoid), the transfer function (Tansig), and the output layer function (Purelin) were applied to process the data. According to the modeling principles of the BPNN, the first 135 sets of data in Table 1 were used for training, and the remaining 15 sets were used for validating the prediction model.
The input layer has five nodes corresponding to the mining depth, coal seam dip, mining thickness, length of the panel, and proportion coefficient of hard rock. The output layer has one node representing the HWCFZ. The neural network structure was optimized by setting the learning parameters and adjusting the internal parameters. The training structure is shown in Figure 7. Based on multiple training iterations and previous research, the data were preprocessed by Matlab software. When the number of hidden layer nodes is determined to be eight, the best prediction performance is achieved with R = 0.95, as shown in Figure 8.
A genetic algorithm was employed to find the optimal weight threshold. The initial population size was set to 20, the maximum evolutionary algebra is 80, the crossover probability is 0.8, the mutation probability is 0.2, and the other settings are consistent with the BPNN. As shown in Figure 9, the difference between the calculated and optimal weights became negligible after about 50 iterations, indicating that the optimal threshold has been found.

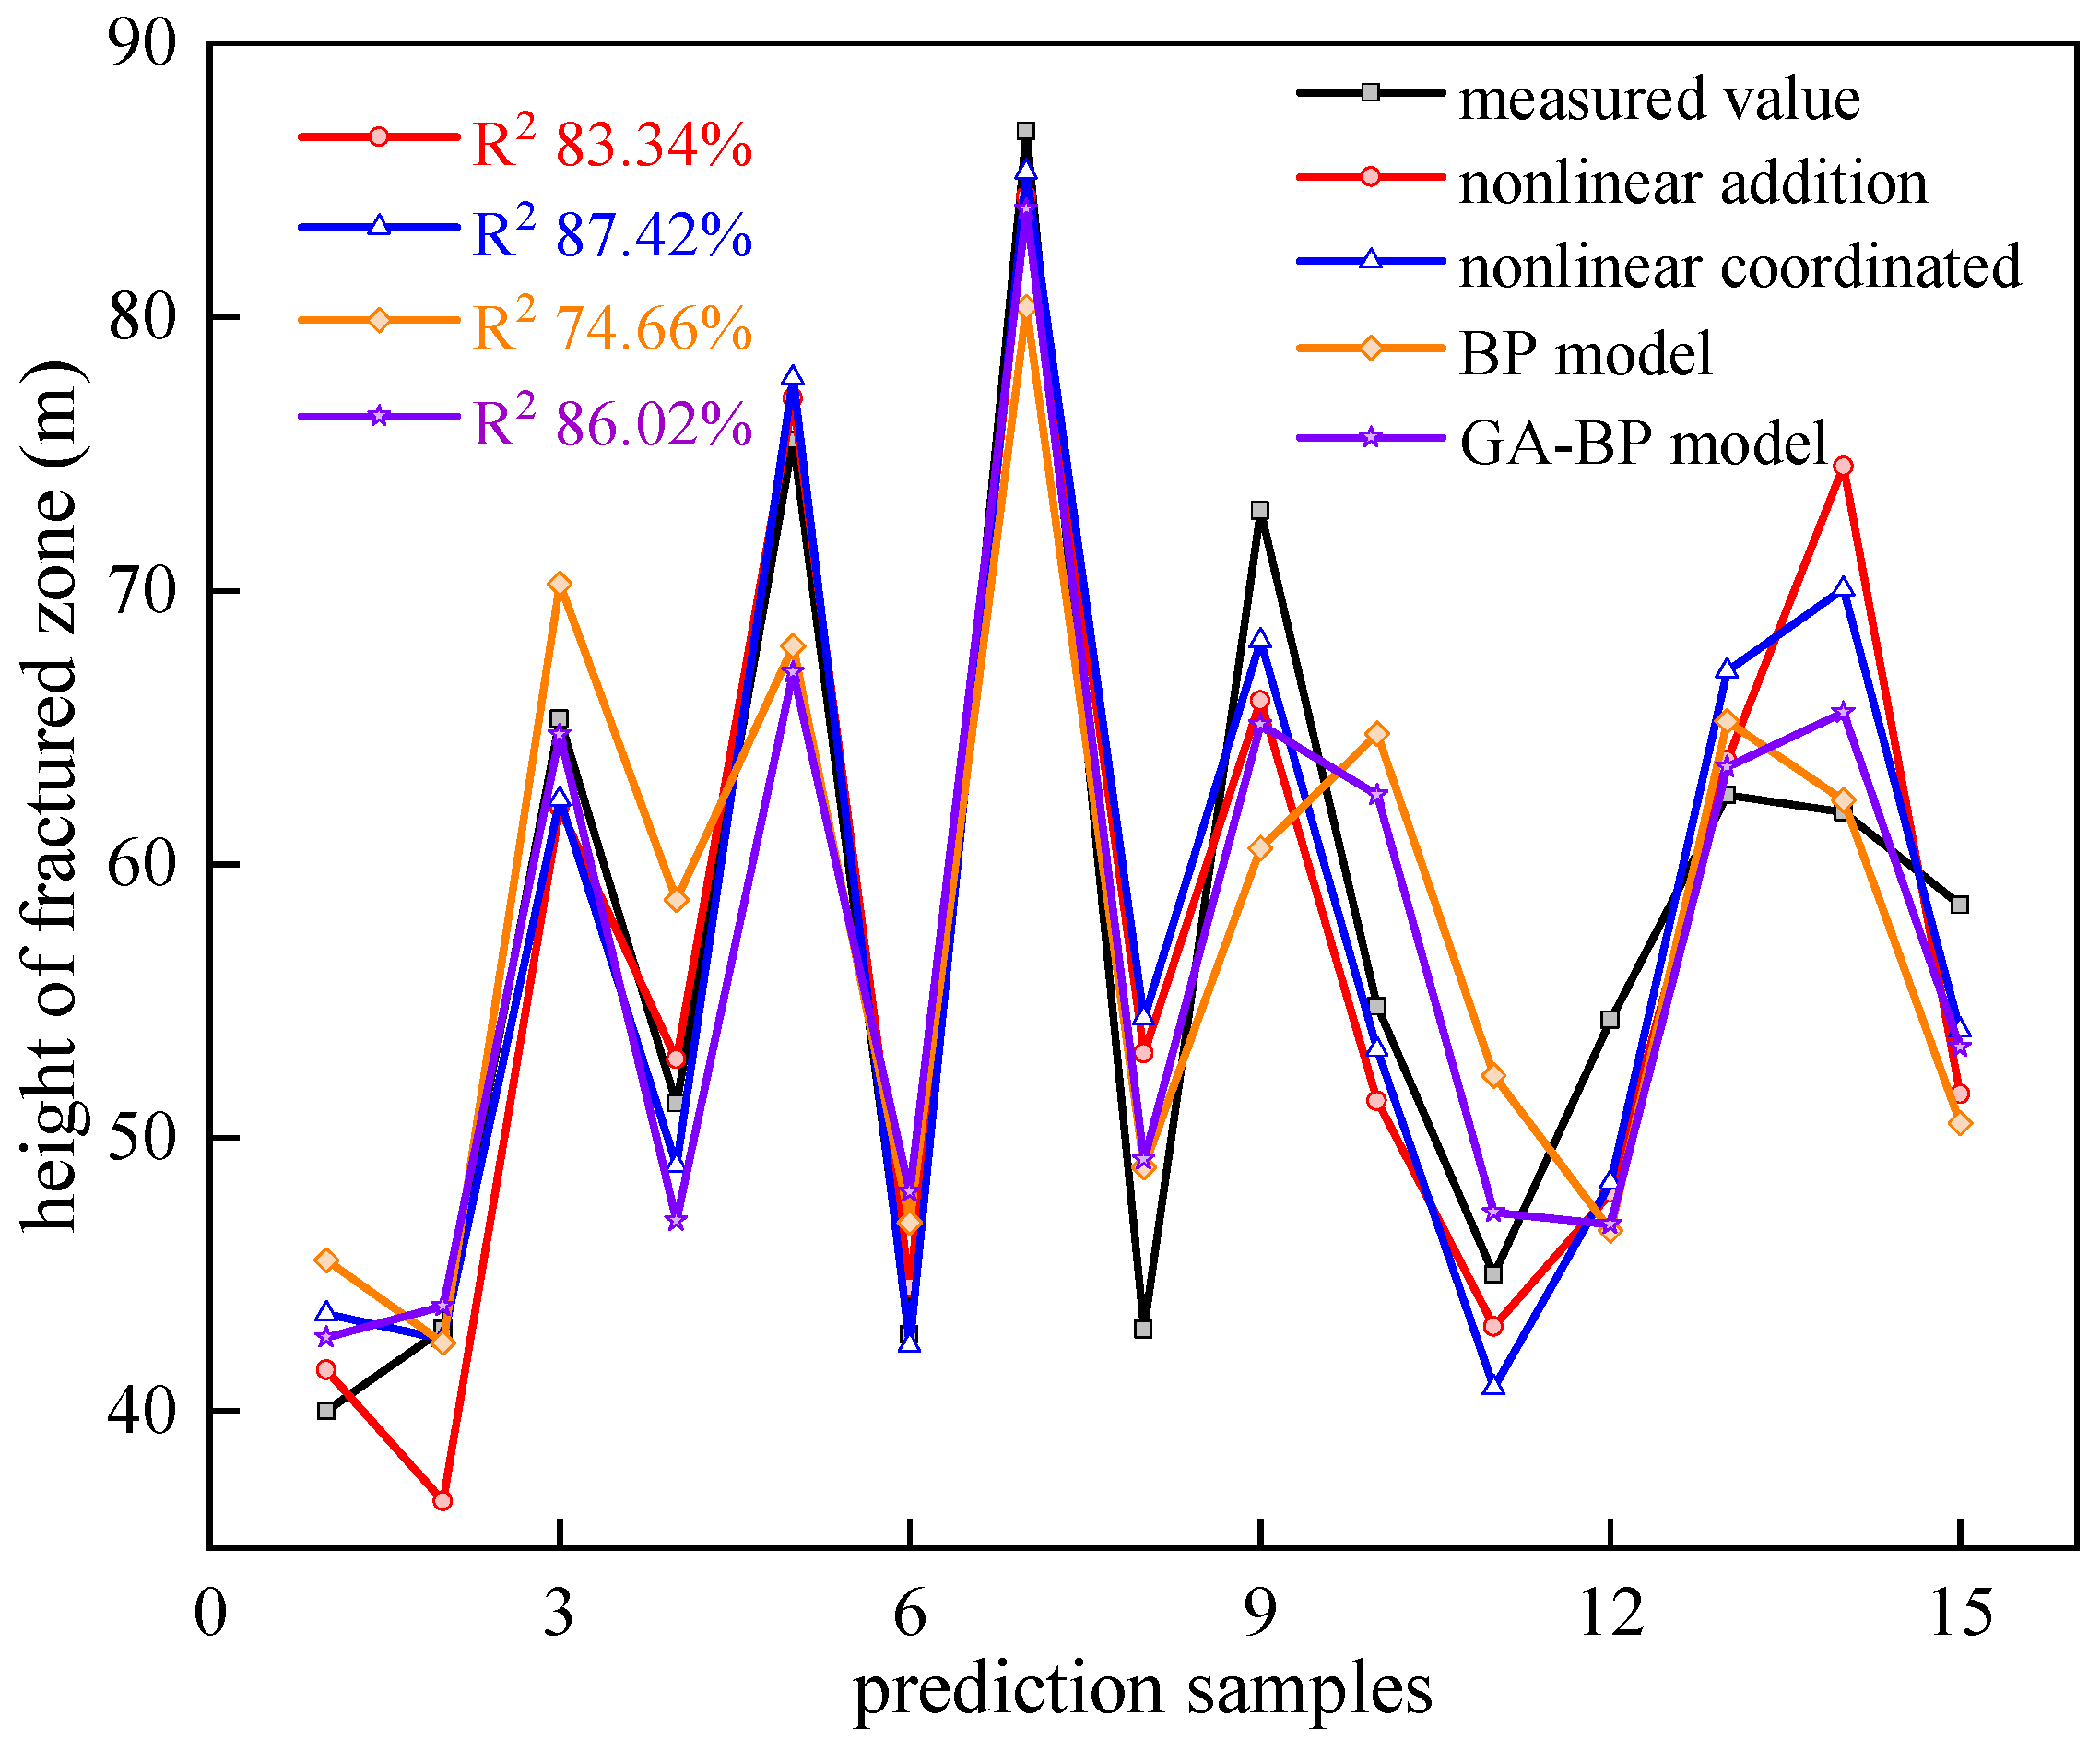
3.2.4. Comparison of Prediction Models

The last 15 measured samples from Table 1 were used as test samples in the four models mentioned above. The results are shown in Figure 10 and Table 4.
MAPE is a measure of the average absolute difference between predicted and actual values. A higher MAPE indicates greater deviation and less accurate model predictions. As seen in Table 4, the MAPE for each model is 8.31%, 7.23%, 10.78%, and 7.94%, respectively, indicating that the multivariate nonlinear coordinated regression model provides the most accurate predictions.
As illustrated in Figure 10, the multivariate nonlinear coordinated regression model has the highest R2 value of 87.42%, followed by the GA-BPNN model with an R2 of 86.02%, the nonlinear additive regression model with an R2 of 83.34%, and the BPNN model with an R2 of 74.66%. The results demonstrate that the nonlinear coordinated regression model outperforms traditional additive nonlinear regression models in both prediction accuracy and reliability. Although machine learning approaches (e.g., neural networks) may achieve high accuracy, they typically require extensive training data and exhibit inherent prediction stochasticity, resulting in inferior stability compared to the coordinated nonlinear model. Consequently, the multivariate nonlinear coordinated approach shows distinct advantages for predicting the HWCFZ.
The HWCFZ is influenced by multiple factors. In addition to the five primary factors previously discussed, other variables including mining technology variations, roof management methods, overburden lithology characteristics, geological structures, and mining speed may significantly impact the prediction accuracy. It should be noted that the current model has certain limitations and may not be suitable for predicting fracture zone heights under special geological conditions or unconventional mining techniques.

3.3. Analysis of Safe Water Break Distance of Panel Based on Hydraulic Fracture Zone Modeling

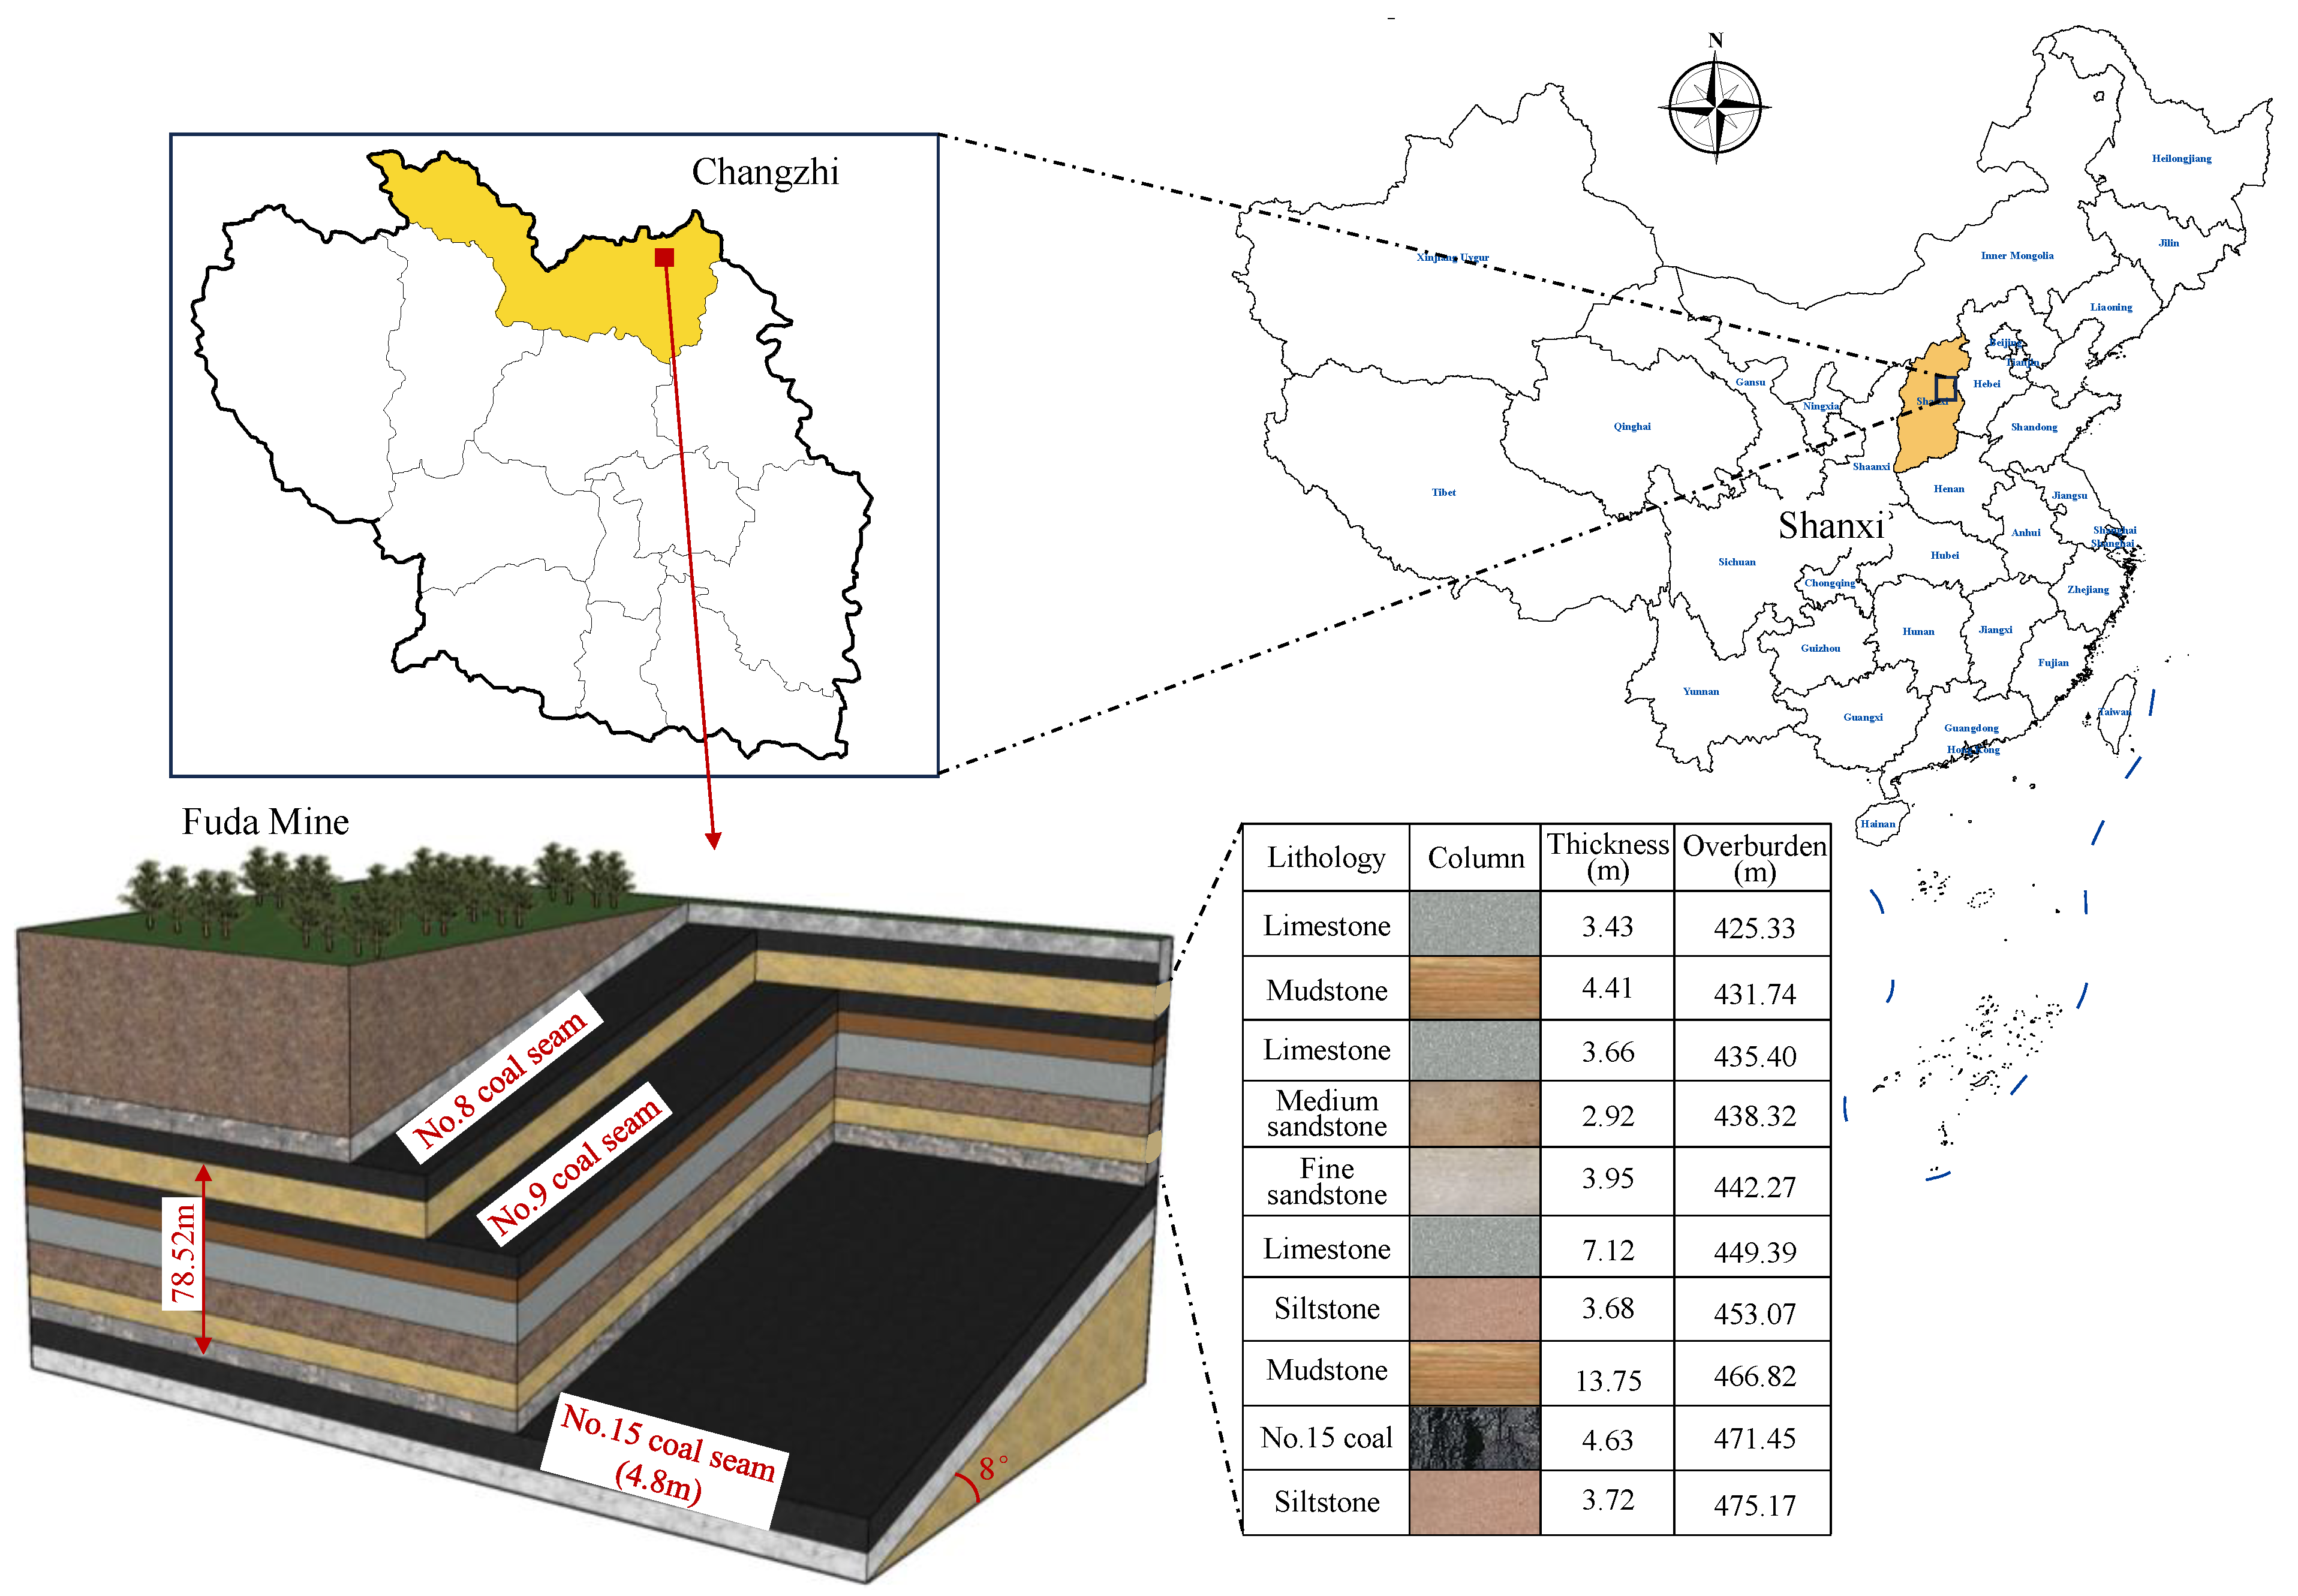
3.3.1. Geological Overview

The Fuda Coal Mine is located in Wuxiang County, Changzhi City, Shanxi Province. The No. 8, No. 9, and No. 15 coal seams are primarily extracted with the interlayer distance between the No. 8 and No. 15 coal seams being 78.52 m. The geological model distribution is shown in Figure 11. In the next five years, the No. 15 coal seam is planned for extraction. According to hydrogeological analysis, the accumulated water in the old mined-out areas is the primary source of water inflow in this mine, making it the key focus of water control efforts. The main water hazard in the No. 15 coal seam comes from the accumulated water in the overlying No. 8 coal seam. During the extraction of the 15,102 panel, a water inrush incident occurred. Currently, within the mine boundary, there are 11 old mine water accumulation zones and 1 old roadway water accumulation zone in the No. 8 coal seam, with a total accumulated water area exceeding 283,236 m2.
To prevent further water inrush accidents and to control related water hazards, a comprehensive geological borehole survey was conducted. Using the WCFZ development model, the entire Fuda mine area was divided into different risk zones based on the severity of potential water inrush incidents.

3.3.2. Model Verification and Comparison

To verify the accuracy of the model, a borehole (B-1) was drilled 70 m from the open-off cut in the 15,103 panel at Fuda Mine, which had a vertical depth of 78.52 m. Using a YTGD10 rock drilling probe, the degree of rock fracturing was observed. The collapsed and broken rock height was about 24.5 m, the HWCFZ was about 30.6 m, and the total HWCFZ was 55.1 m, as shown in Figure 12.
For the B-1 borehole, the burial depth of the 15,103 panel was approximately 326.3 m, the face width was about 197.31 m, the coal seam dip was about 8°, and the proportion coefficient of hard rock was 0.46. The prediction result of the multivariate nonlinear coordinated regression model was 56.62 m. Fourteen measured results of the HWCFZ from different mines were collected and compared with the model results, achieving an R2 with an accuracy of 95.28%, as shown in Figure 13. Therefore, the multivariate nonlinear coordinated regression model shows high accuracy and stability and can be applied to the prediction of the coal mining HWCFZ.

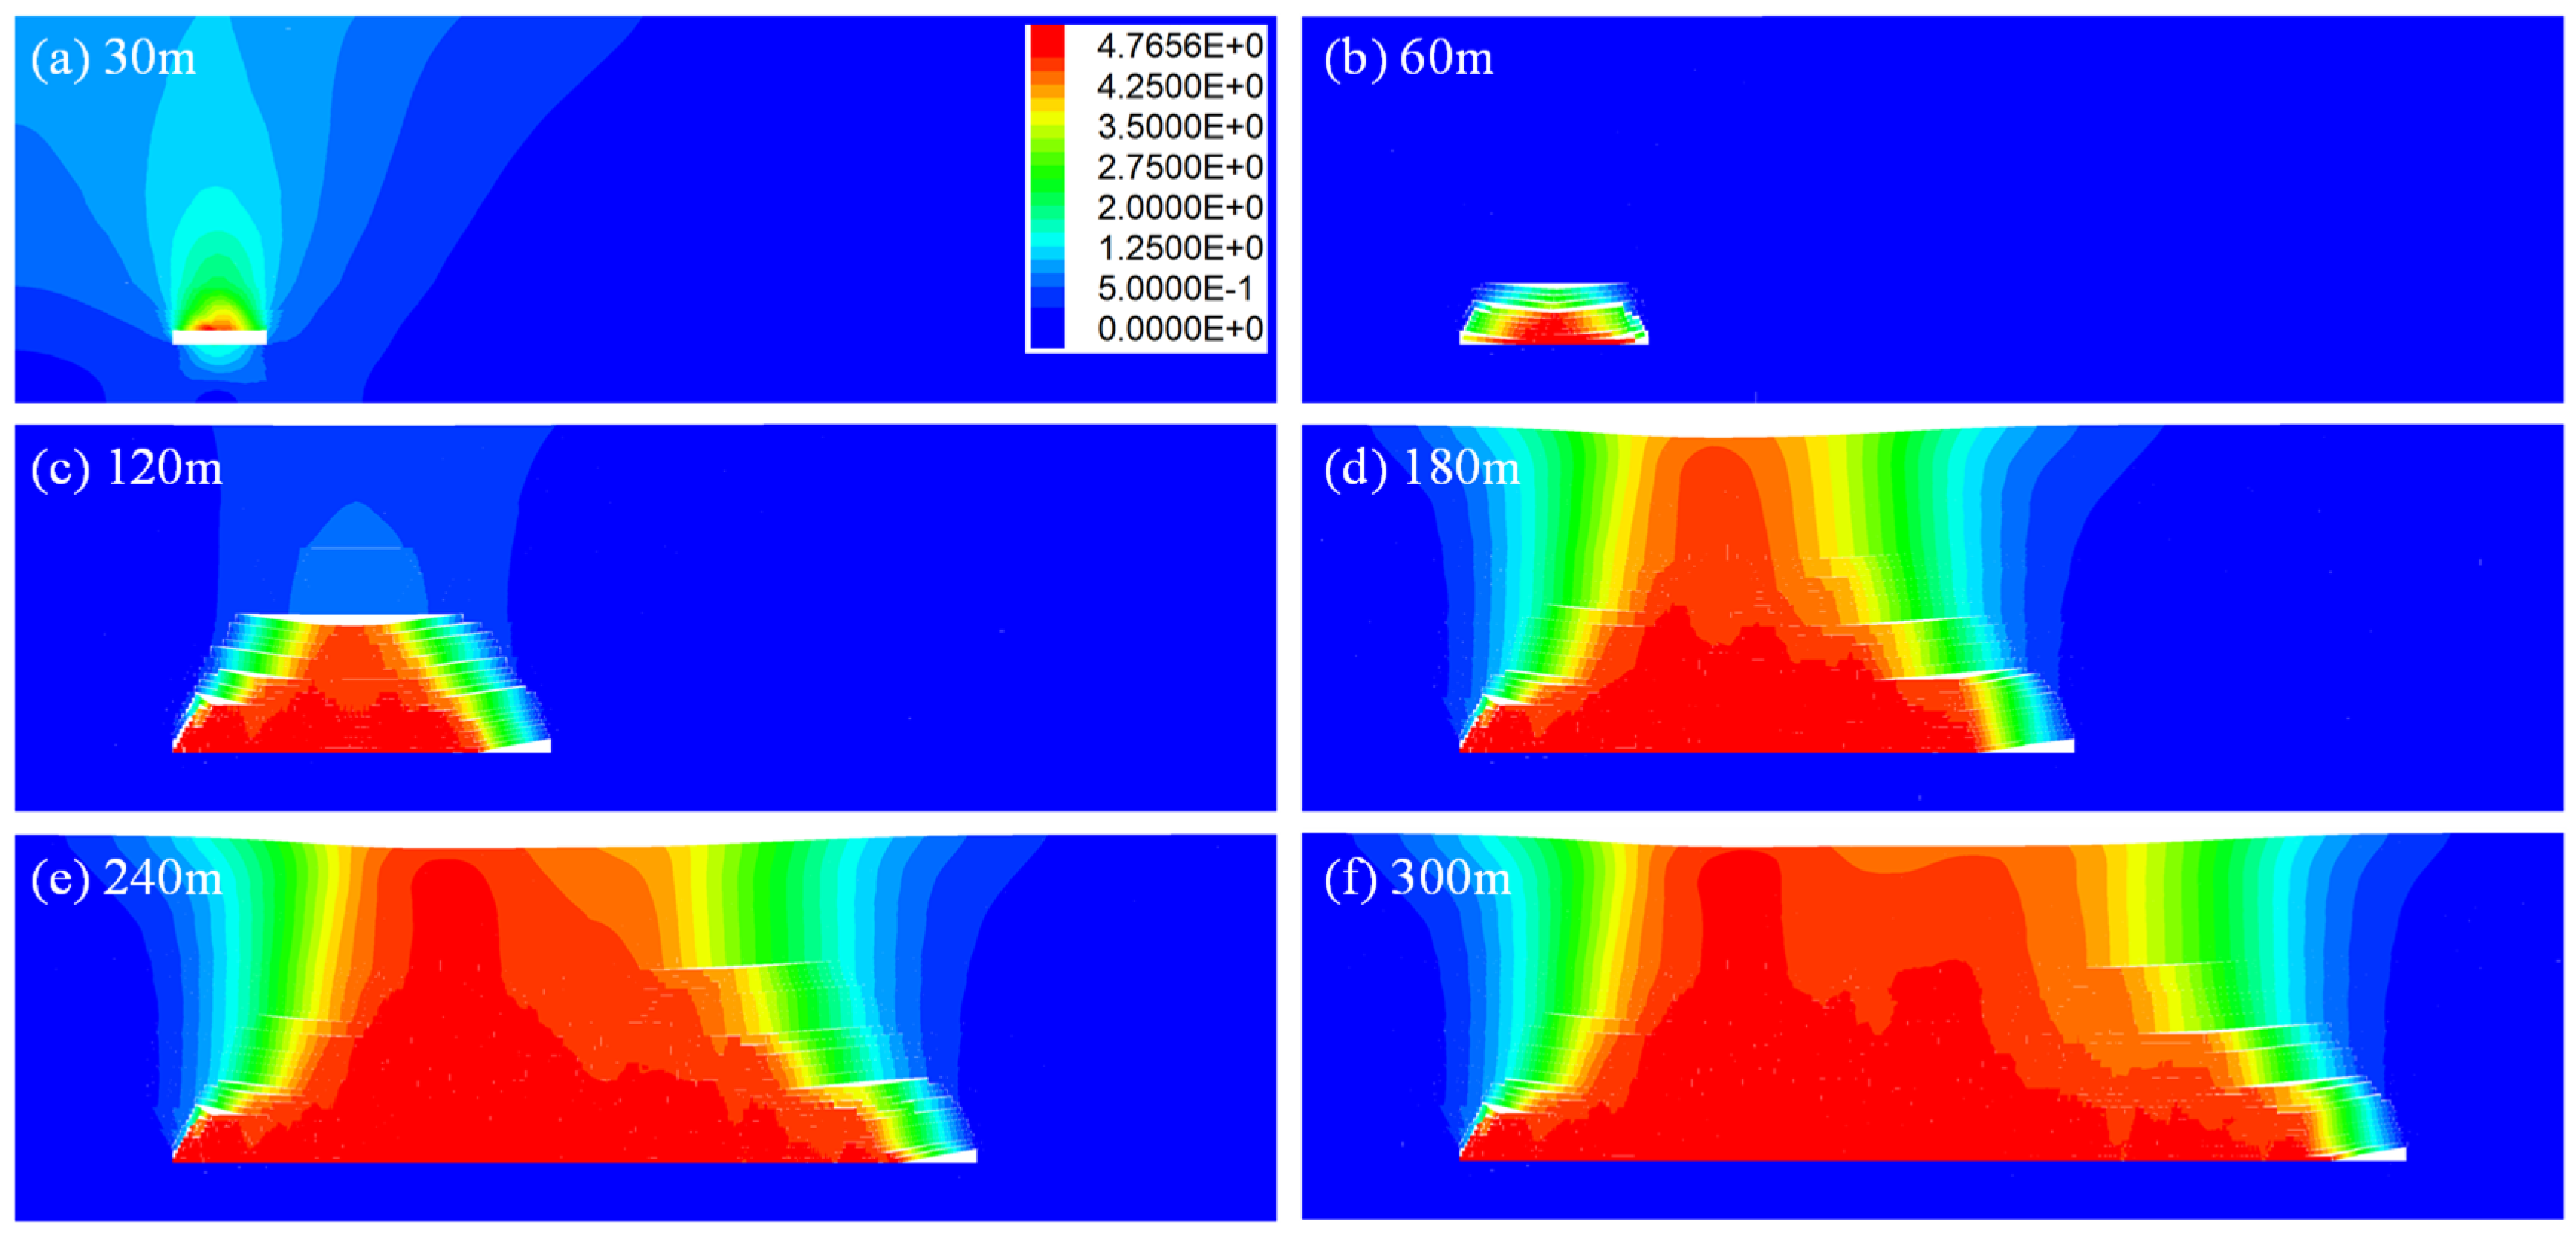
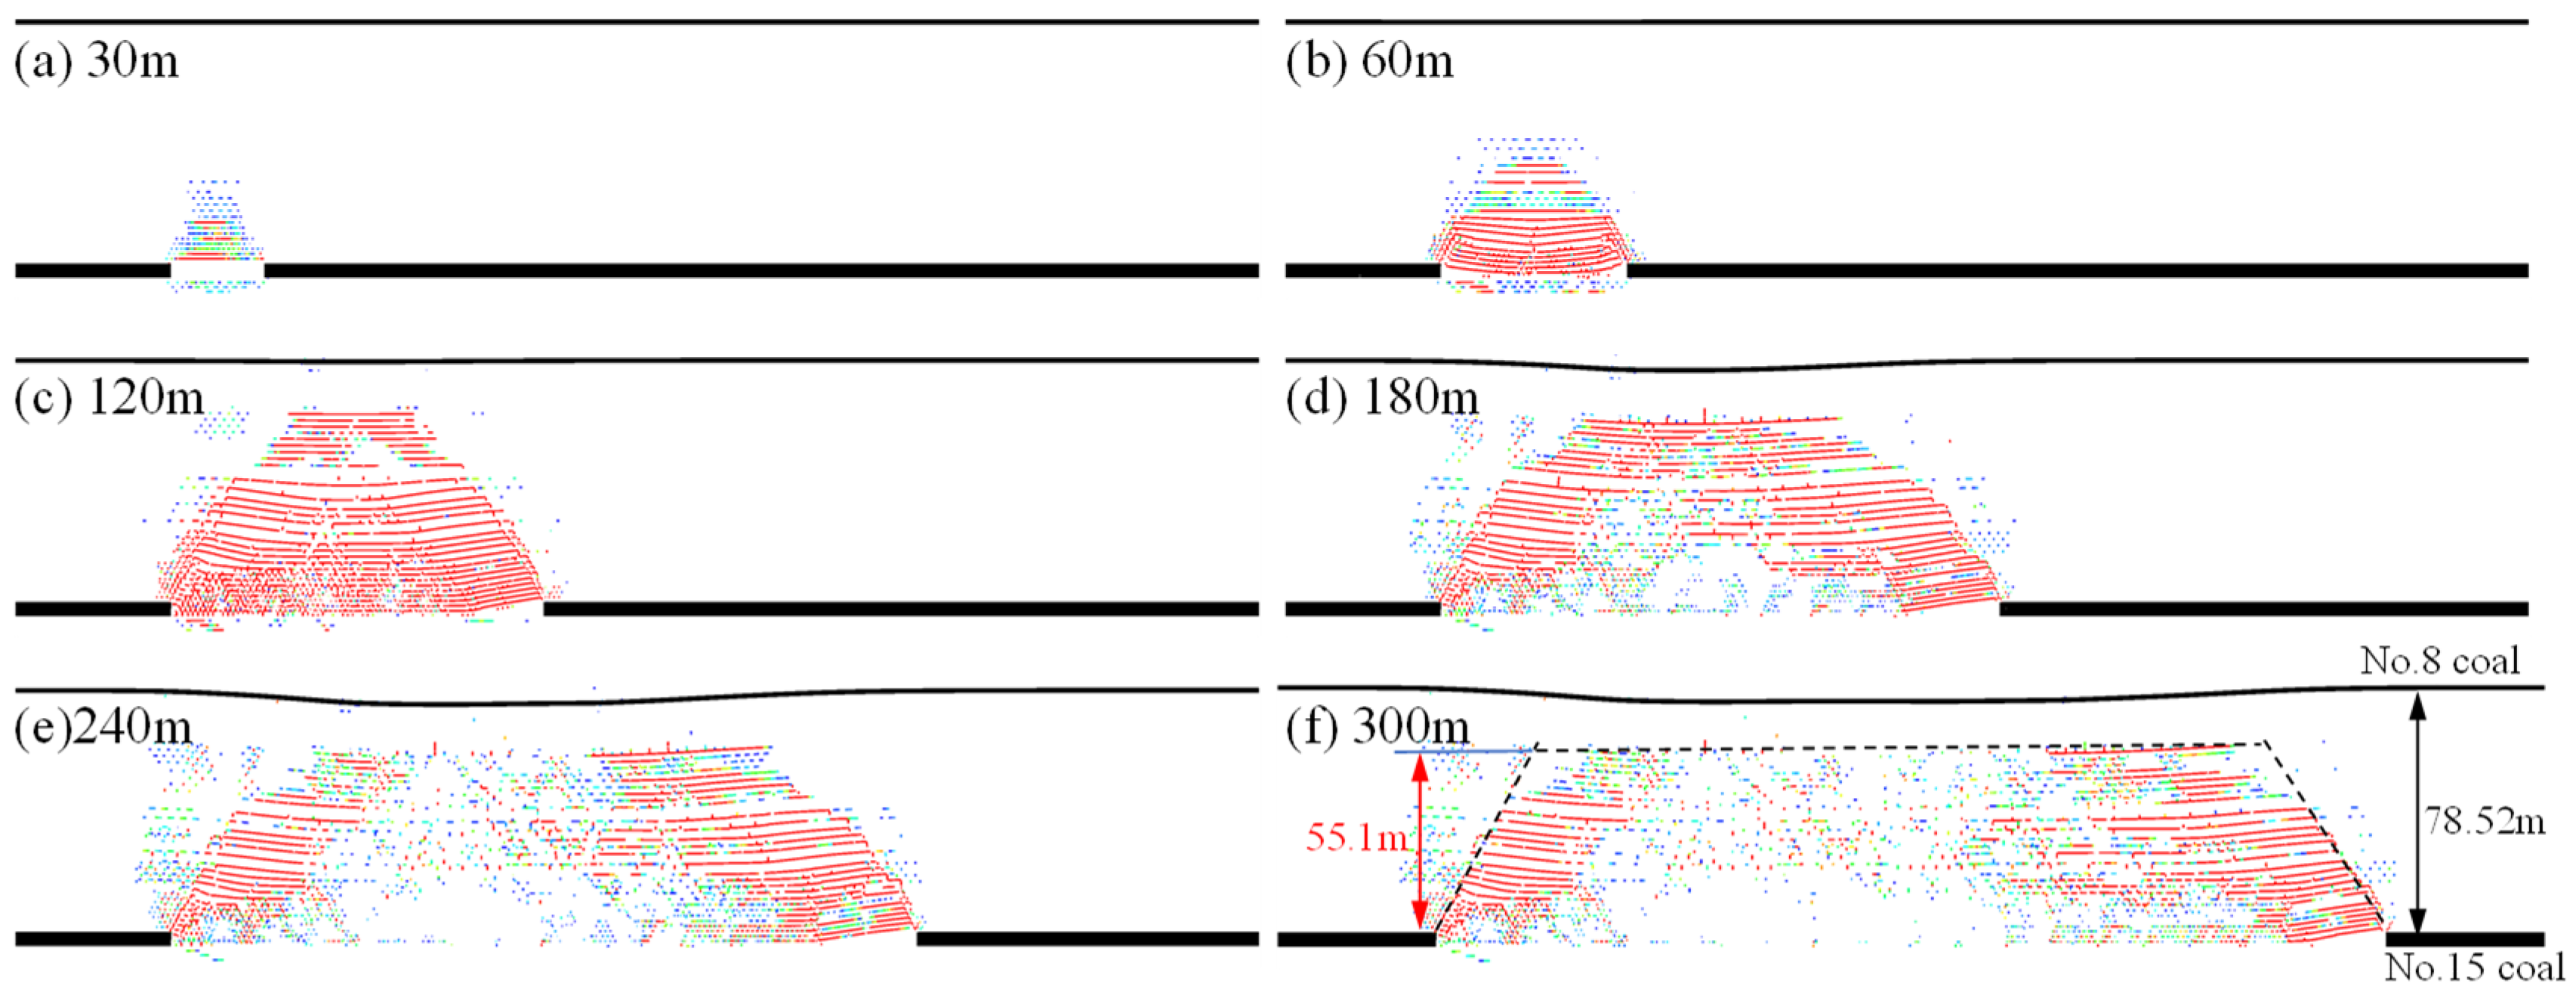
3.3.3. Developmental Pattern of Water-Conducting Fissure Zones

Based on the geological conditions of the Fuda Coal Mine 15,103 panel and incorporating relevant mechanical and physical parameters of the strata, as shown in Table 5, a development model for the WCFZ was established to investigate the evolutionary patterns of water-conducting fracture zone development height in relation to panel advance progression. The model dimensions are 400 m × 123 m, with a boundary load of 8.75 MPa applied to the upper surface to replace the omitted strata. Zero velocity was set for the boundaries on both sides and at the bottom to fix the model’s boundaries, as shown in Figure 14. The model achieves equilibrium solely under the influence of gravity. After stress equilibrium is reached, the displacement is reset to zero. Once the model has stabilized, excavation of the panel is carried out.
As the panel advances, the surrounding rock mass of the goaf begins to exhibit movement and deformation. The overlying strata show subsidence, while the floor exhibits heaving, and the coal and rock on both sides move horizontally toward the goaf. Due to the variability in the lithology and thickness of each layer of overburden, coupled with the differing effects of mining at various distances and time periods, uneven movement and deformation occur in the coal and rock mass surrounding the goaf. After the panel advances by 120 m, the maximum subsidence displacement of the overburden reaches 4.76 m. The displacement of the overburden exhibits coordinated subsidence, showing periodic changes as the panel continues to advance, as illustrated in Figure 15.
When the panel advances by 30 m, the overburden fractures begin to expand. As the panel continues to advance, the fracture aperture increases, with fractures near the mining area showing significantly larger apertures, while fractures farther from the mining area gradually exhibit smaller apertures. Additionally, with the further advancement of the panel, the height of the overburden fractures gradually increases, and the area of fracture expansion continues to grow.
During the phase from 30 m to 120 m of panel advancement, the height of the overburden fractures increases, with fractures continuously extending toward the floor of the No. 8 coal seam, as shown in Figure 16. When the panel reaches 180 m, the height of the overburden fractures no longer increases. The fractures primarily extend along the direction of the panel, but it is observed that fractures in the central part of the goaf decrease significantly, and the fracture aperture is reduced markedly, indicating that the collapsed gangue in the central part of the goaf is gradually being compacted.
As the panel progresses, the area of the compaction zone in the central part of the goaf increases, and the overburden fractures gradually evolve into a pattern with well-developed fractures on both sides and a sparse fracture zone in the center. By the time the panel reaches 240 m, the height of the overburden fractures decreases, and the distribution of fractures exhibits distinct zonal characteristics.
As the panel continues to advance, the distribution and morphological characteristics of the overburden fractures essentially remain unchanged, with fractures primarily developing on both sides of the surrounding rock and compaction occurring in the central region of the goaf. Upon completion of the mining face, the developed height of the overburden fractures reaches 55.1 m, without extending to the No. 8 coal seam.

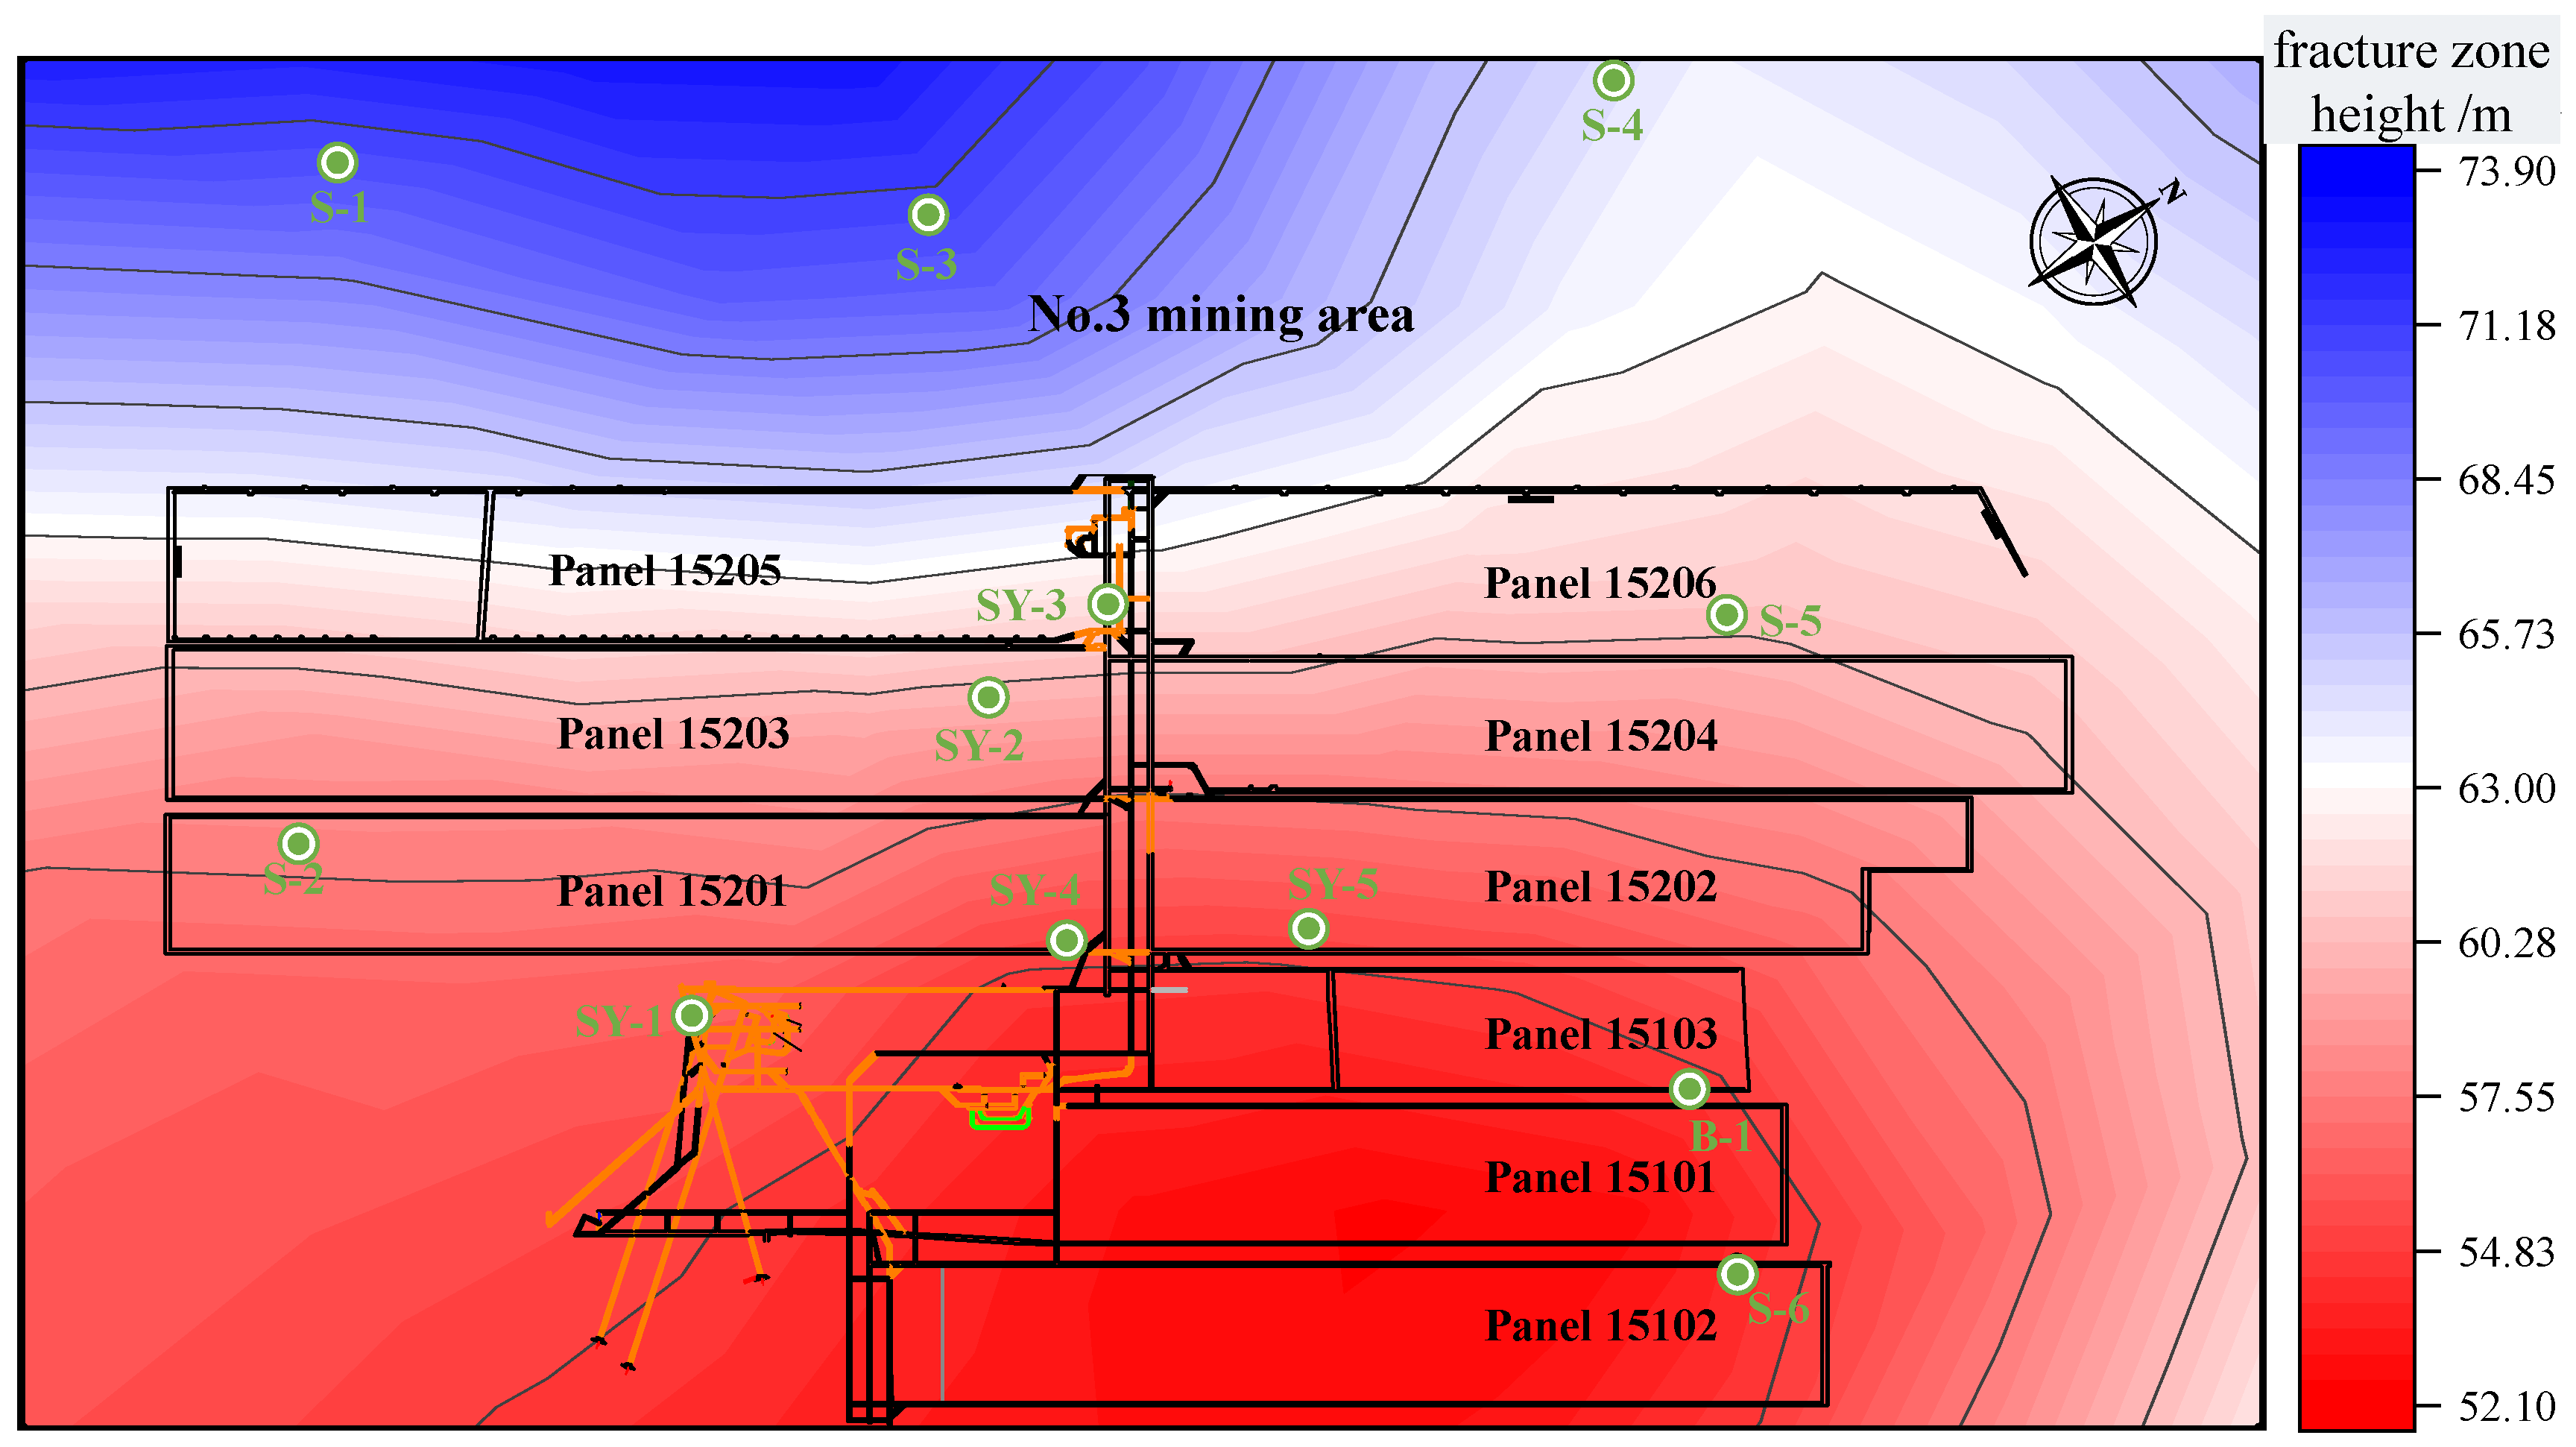
3.3.4. Prediction of the Water-Conducting Fracture Zone Height Across the Entire Mining Area of the Fuda Coal Mine

Based on the geological conditions of each borehole at the Fuda Coal Mine, the HWCFZ across the entire mining area was predicted using the multiple nonlinear coordinated regression model. The predicted values are presented in Table 6.
The coal seam dip of the Fuda mine is approximately 8°. As the No. 15 coal seam extends towards the northwest, its burial depth increases gradually from 314.38 m to 709.21 m. The coal seam thickness ranges from 4.35 m to 5.16 m, the working length of the panel ranges from 194.57 m to 241.41 m, and the proportion coefficient of hard rock ranges from 0.27 to 0.55. The variation rates of the coal thickness, burial depth, length of the panel, coal seam dip, and proportion coefficient of hard rock across the entire No. 15 coal seam at Fuda Mine are 18.62%, 125.59%, 24.07%, 0%, and 103.70%, respectively. This indicates that the HWCFZ across the Fuda Mine area is mainly influenced by the burial depth and the proportion coefficient of hard rock.
Based on the predicted results from the nonlinear collaborative regression model in Table 6, coupling was performed using Origin 2021 software to plot the distribution map of the development of the HWCFZ across the entire Fuda Coal Mine area, as shown in Figure 17.
As the No. 15 coal seam extends toward the northwest, the predicted HWCFZ across the entire Fuda Coal Mine area gradually increases from 52.1 m to 73.9 m, according to the multiple nonlinear coordinated regression model, as shown in Figure 17. The burial depth of the No. 15 coal seam increases along the northwest direction, while the proportion coefficient of hard rock lithology in the upper zone decreases along the northeast direction. In the lower zone, the proportion coefficient of hard rock lithology also decreases along the northeast direction. Under constant conditions, an increase in the burial depth and a higher proportion coefficient of hard rock lithology result in a greater HWCFZ. The model’s predicted results are consistent with the geological distribution pattern observed in the Fuda Coal Mine.

4. Conclusions

The prediction and optimization of the height of the WCFZ in overlying strata was explored by multivariate regression analysis and neural networks. The main conclusions are as follows:
(1)
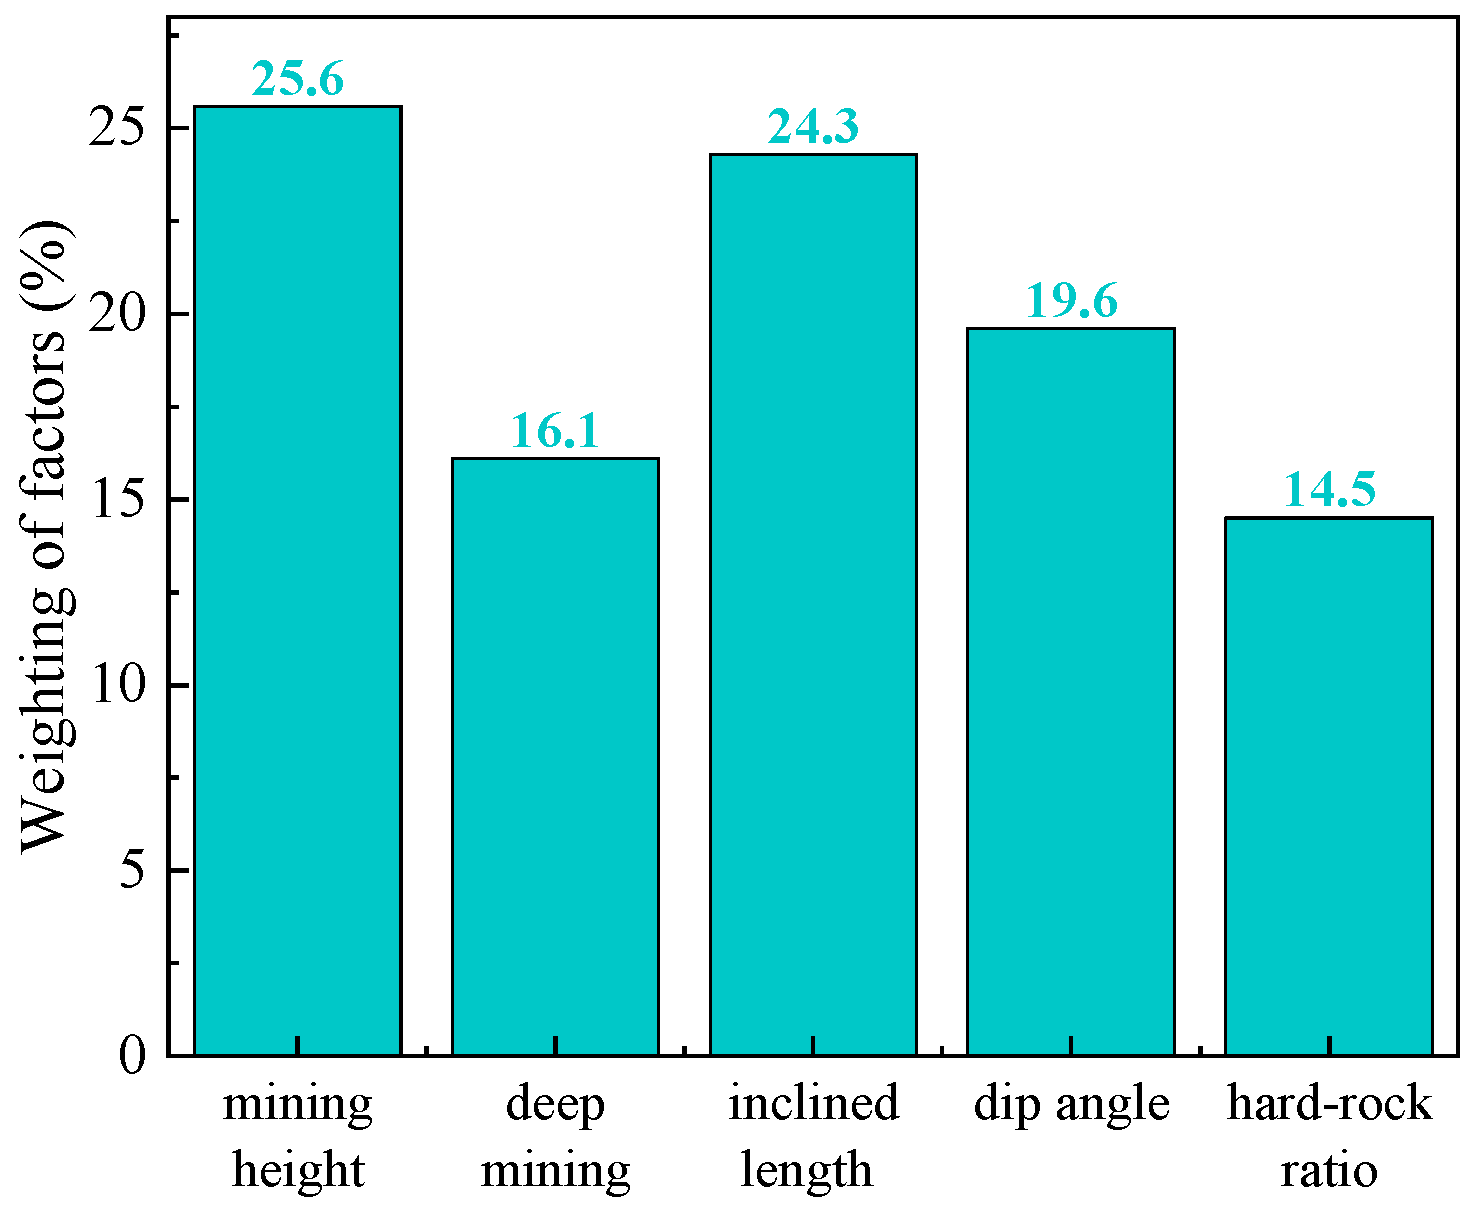
The five influencing factors—mining thickness, burial depth, length of the panel, coal seam dip, and proportion coefficient of hard rock—were identified through an analysis of their impact on the development of the HWCFZ. Using grey relational analysis and principal component analysis methods, the correlation and weight of the HWCFZ were studied. The correlation coefficients for all five factors exceeded 0.79, showing a positive relationship between correlation and weight. Mining thickness had the highest weight at 0.256, followed by the length of the panel at 0.243. Burial depth and coal seam dip had moderate influences, while the proportion coefficient of hard rock had a relatively smaller impact.
(2)
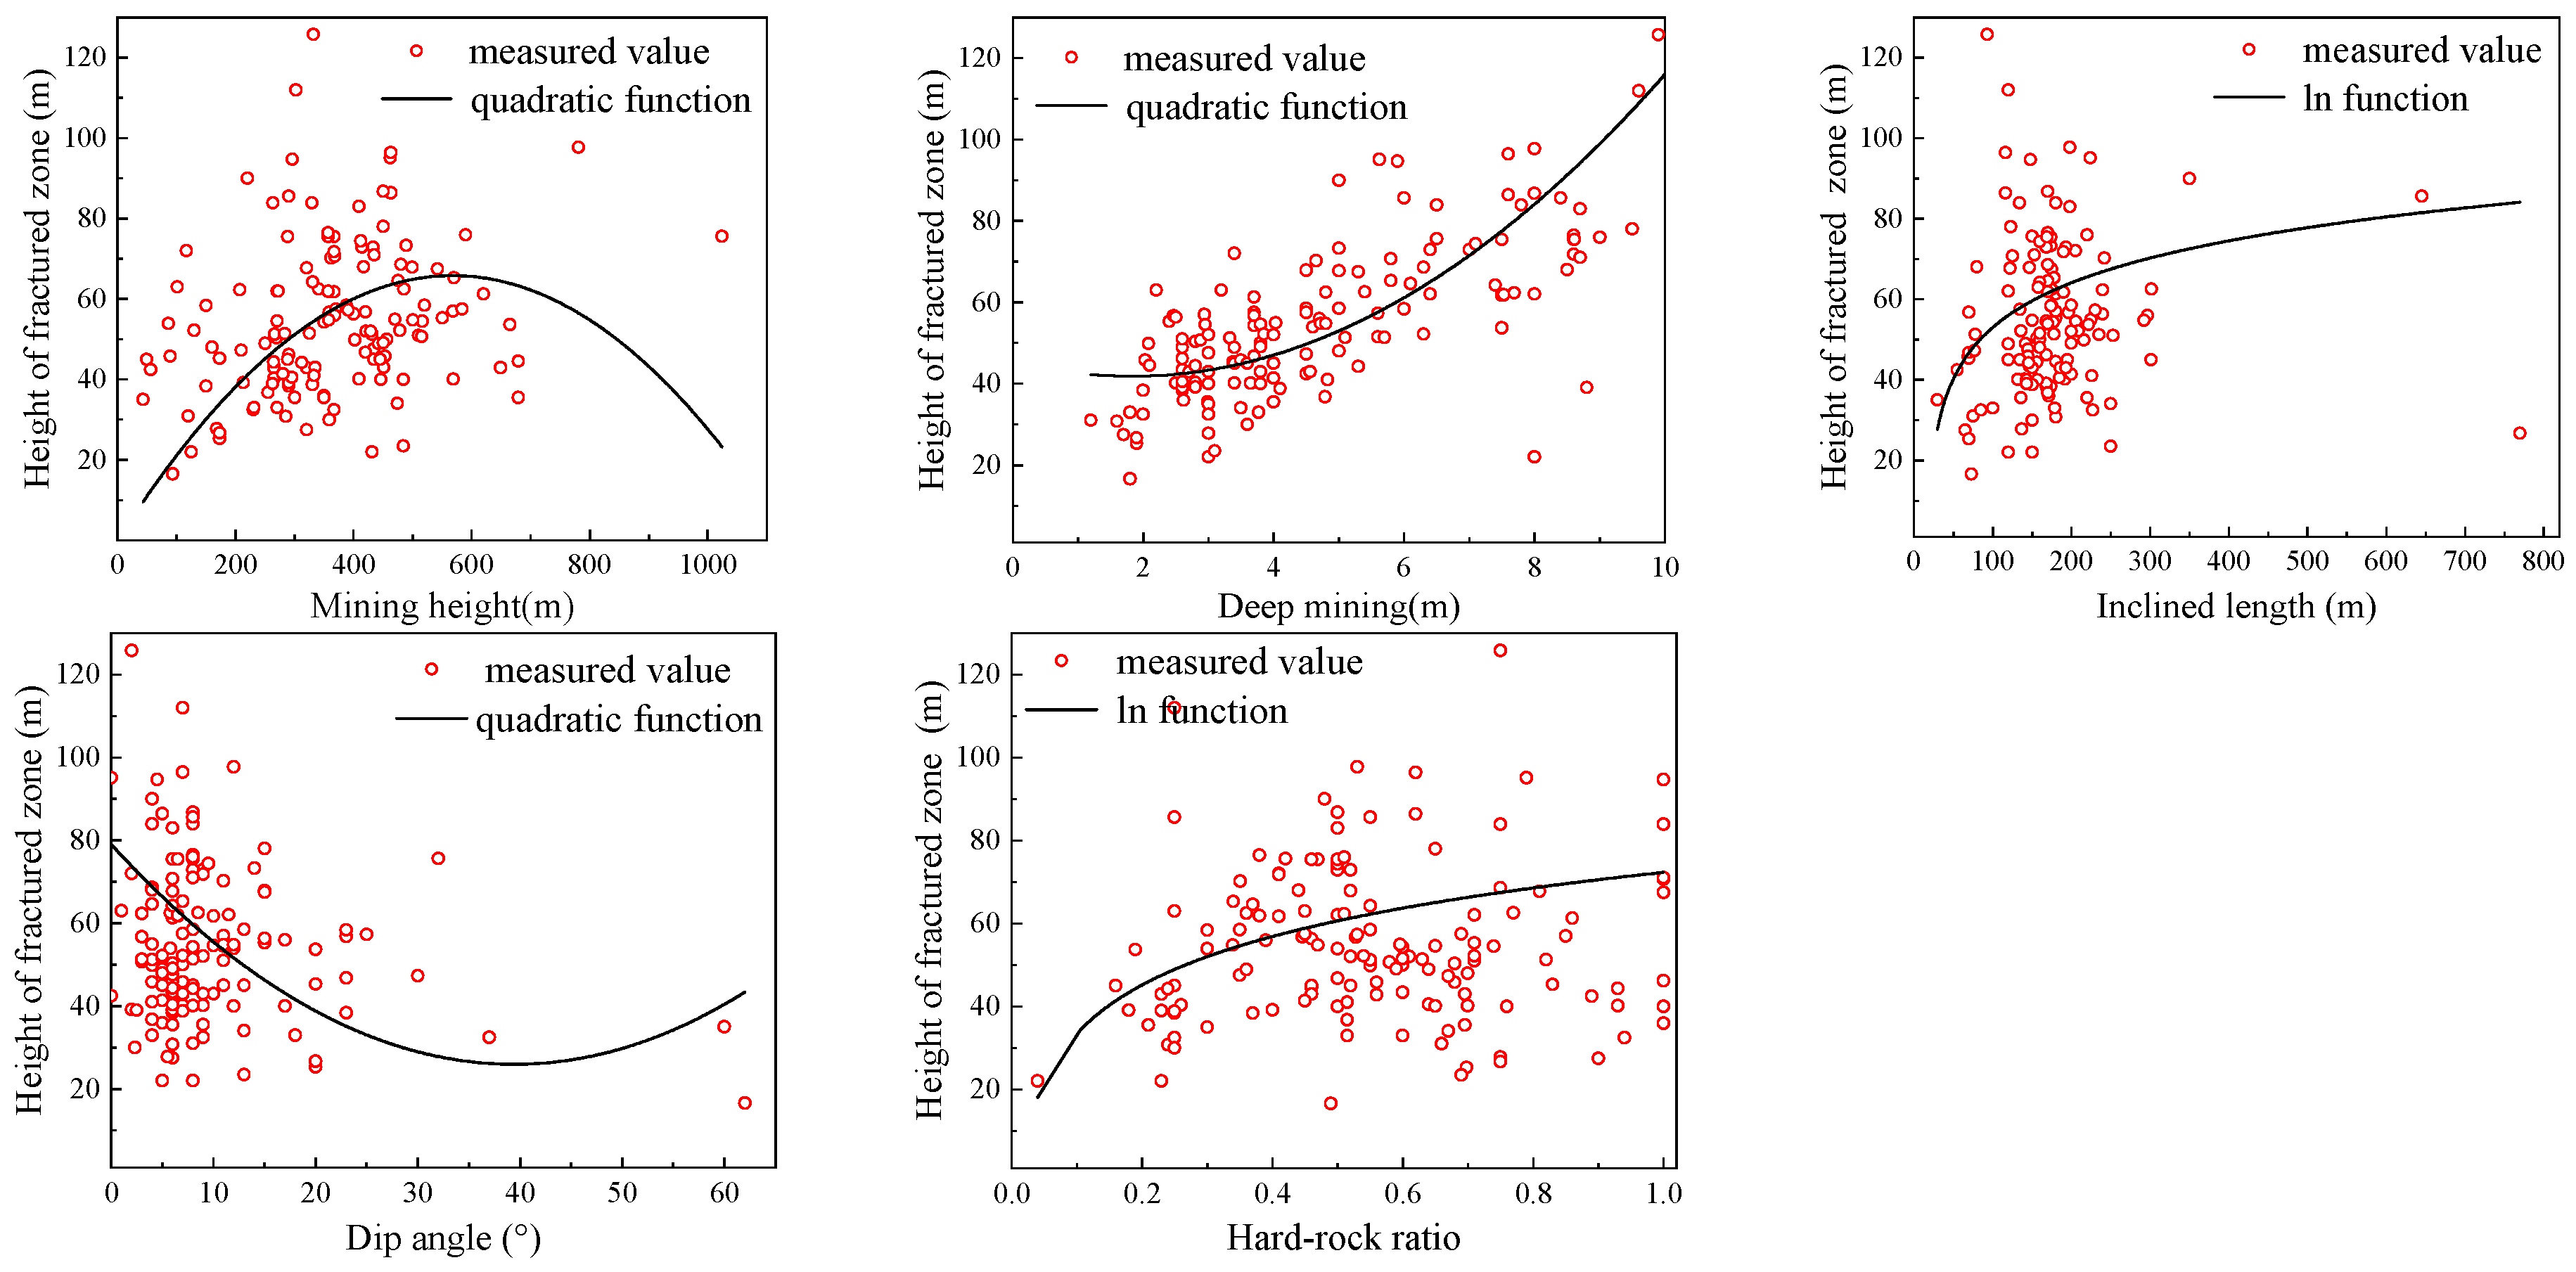
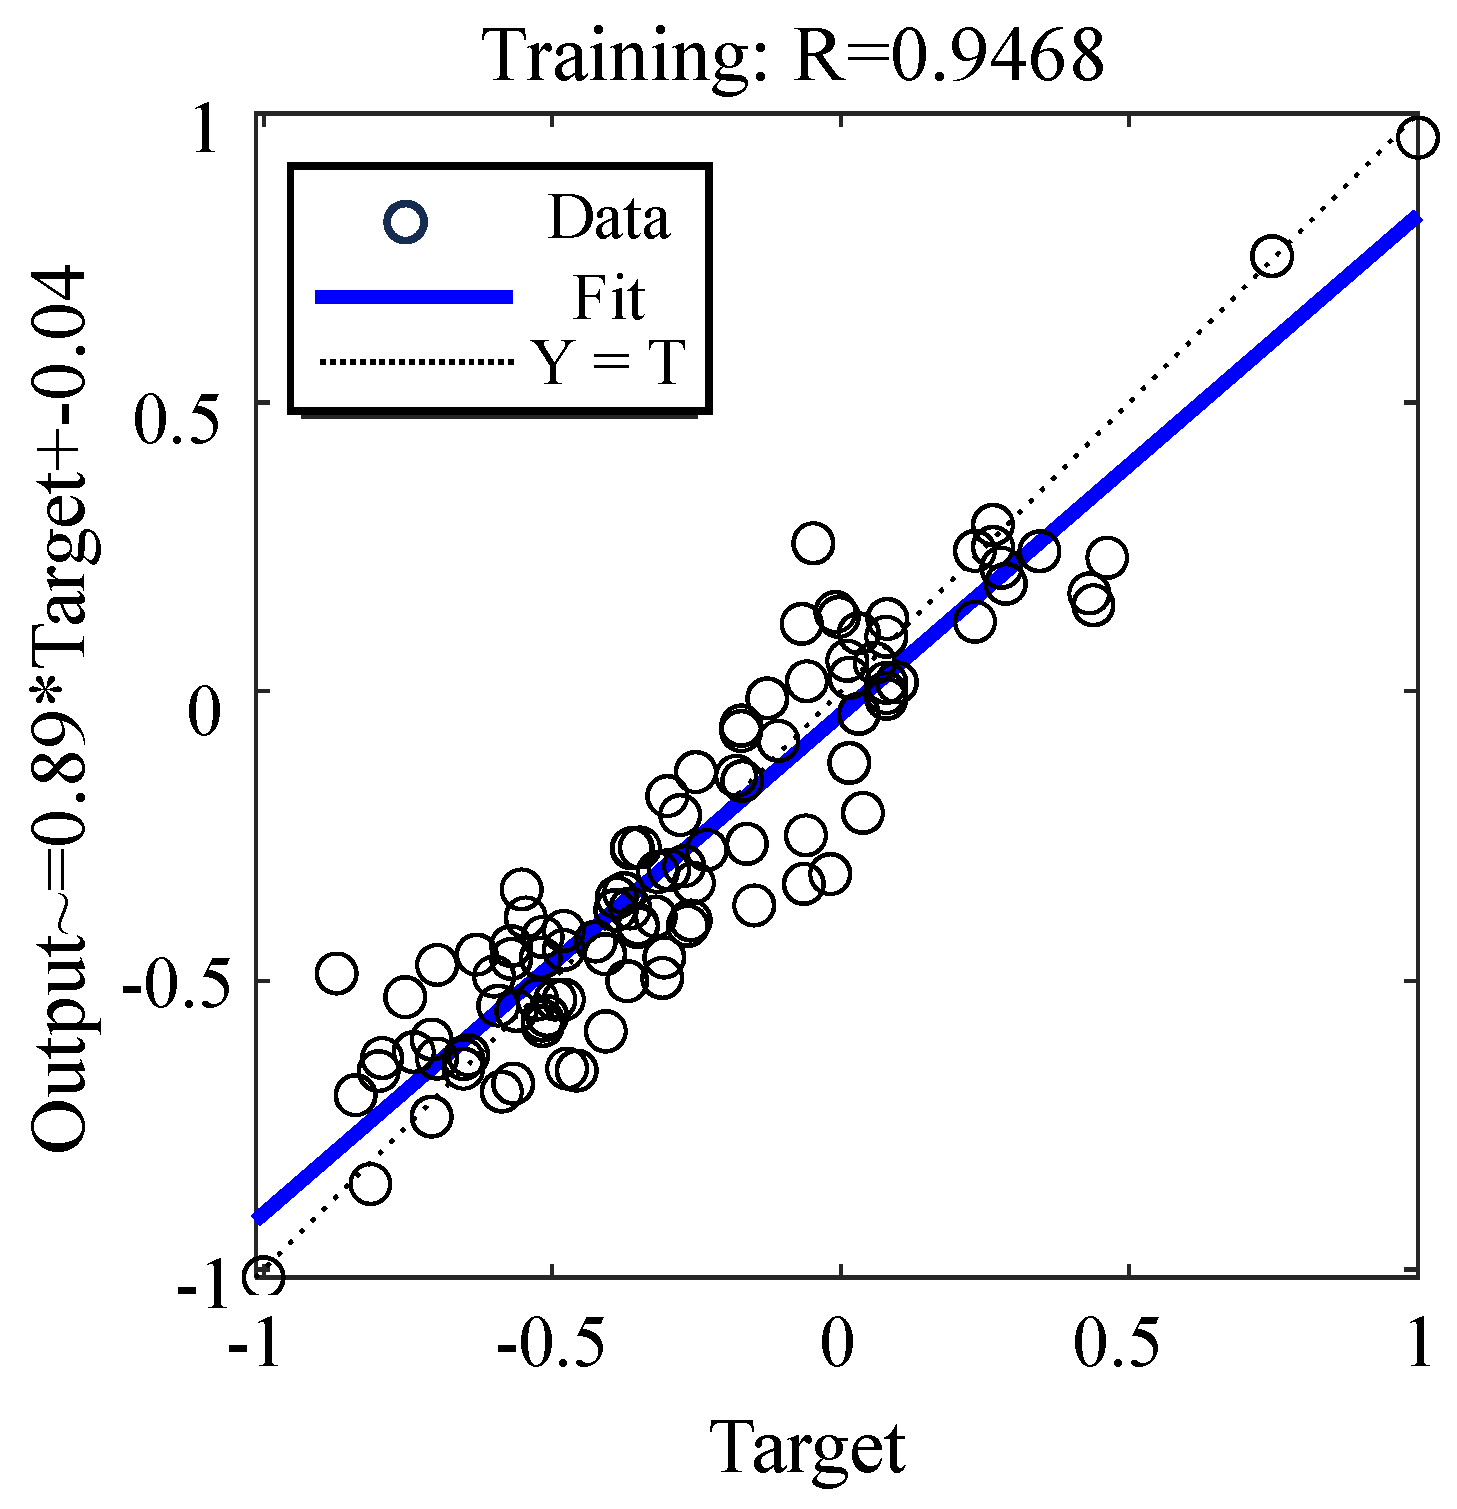
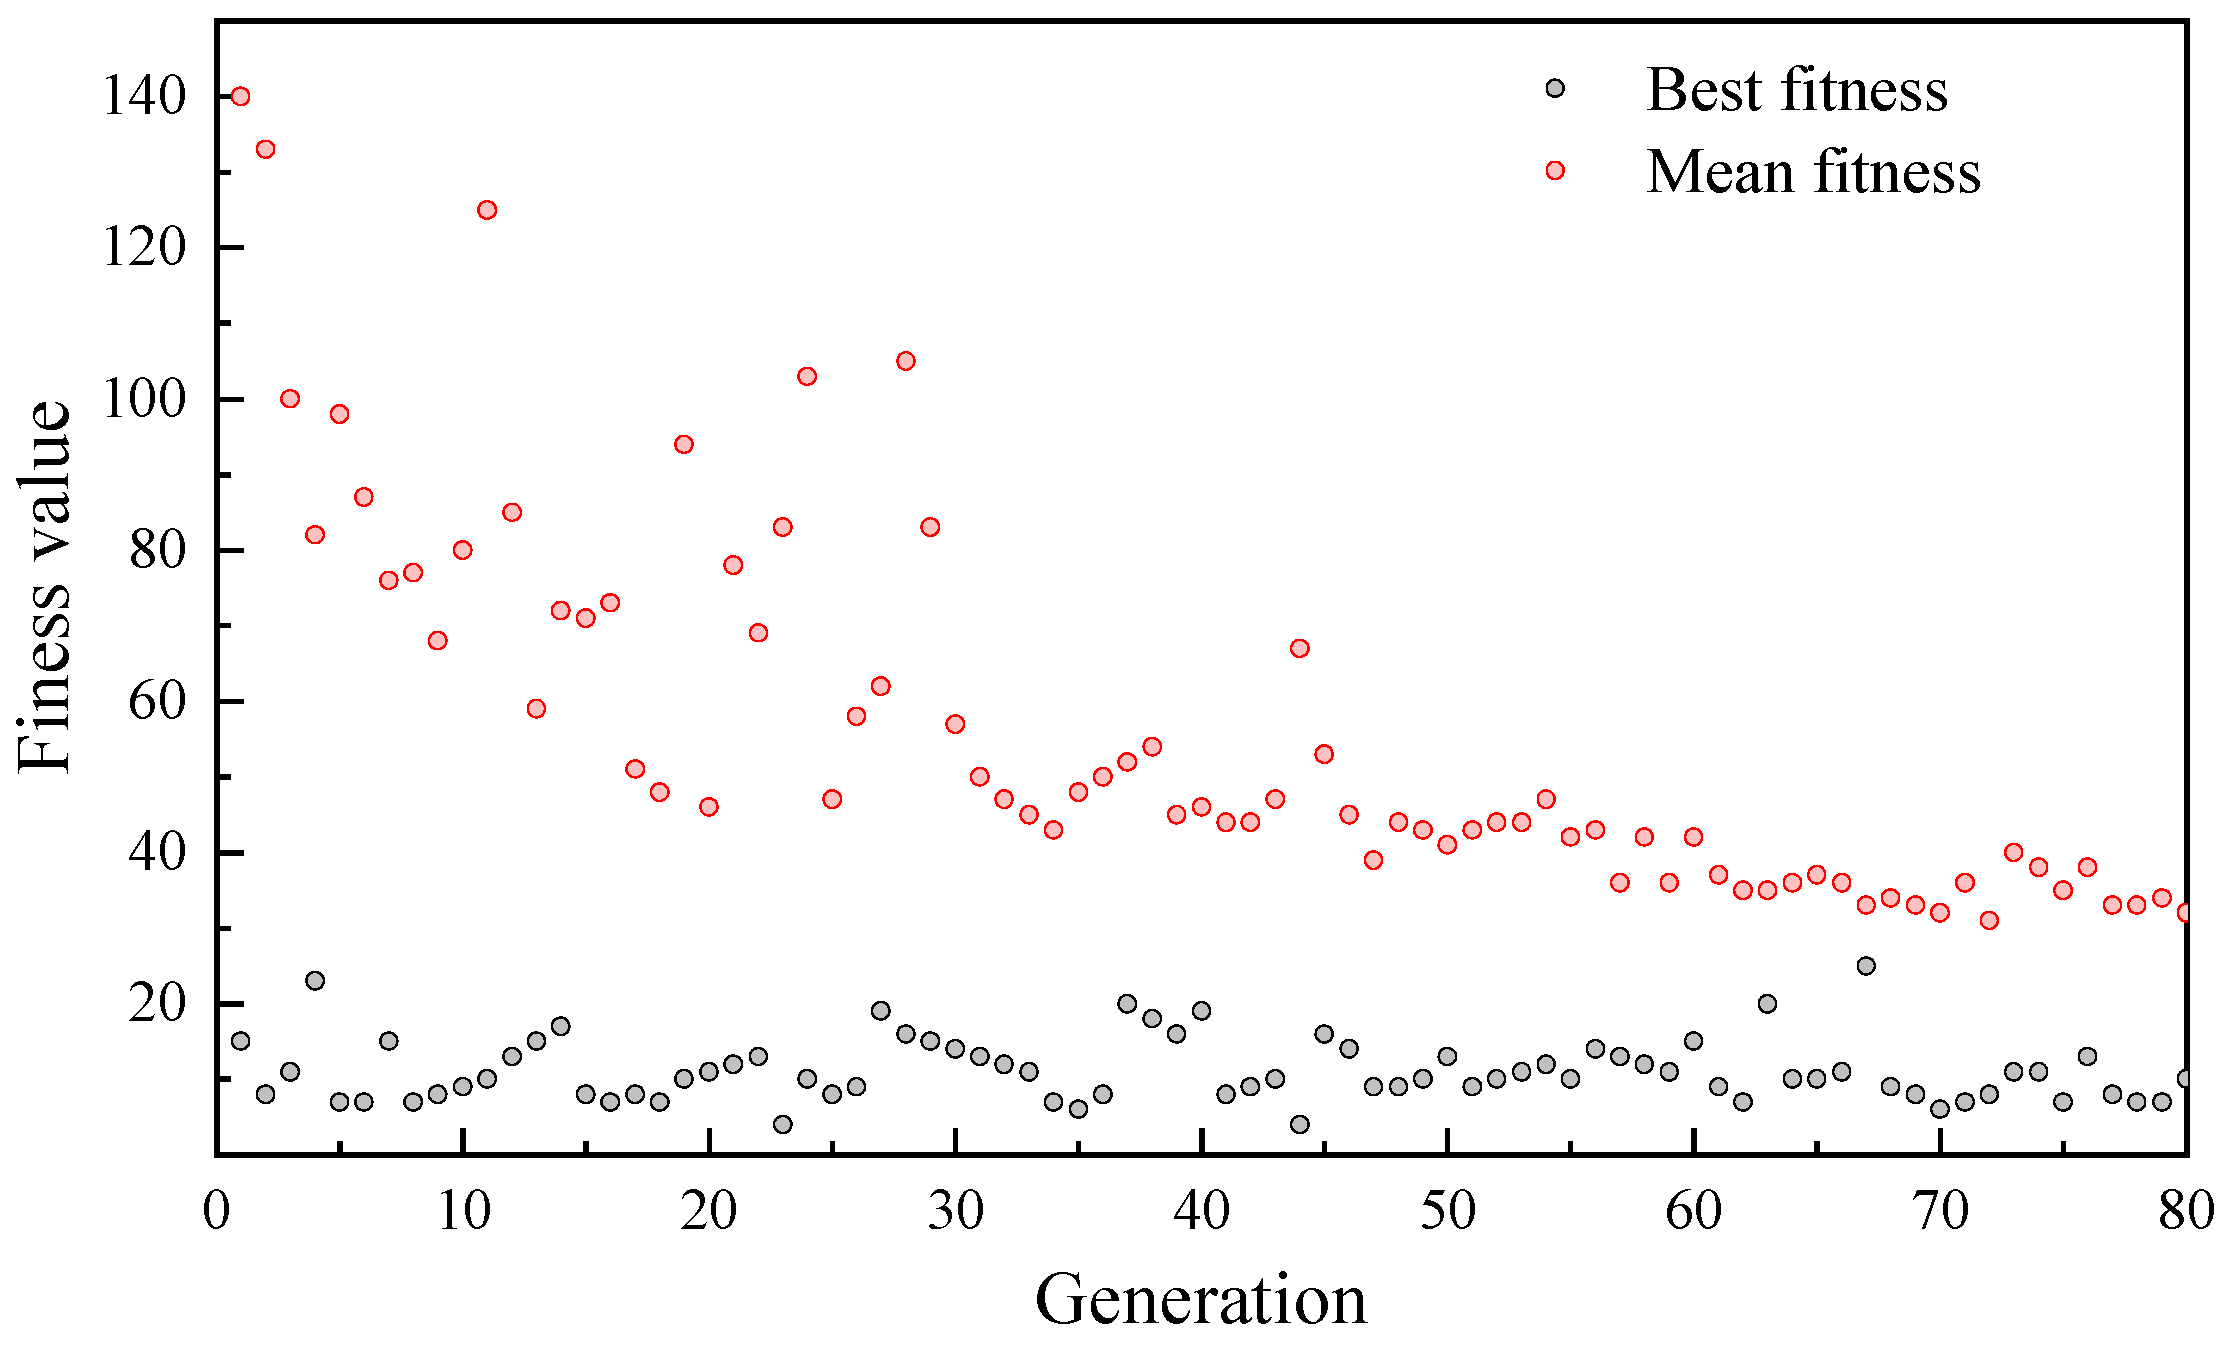
The nonlinear relationships between each influencing factor and the HWCFZ were identified by nonlinear fitting on the measured data for individual factors. On account of the deviations between the prediction results of the nonlinear additive regression model and the measured values, a multivariate nonlinear coordinated regression model was proposed. A comparison of the absolute errors and R2 values among the nonlinear additive regression model, nonlinear coordinated regression model, BP neural network model, and GA-BP neural network model revealed that the nonlinear coordinated regression model had an error rate of 7.23% and the highest R2 fitting value of 87.42%, confirming its accuracy.
(3)
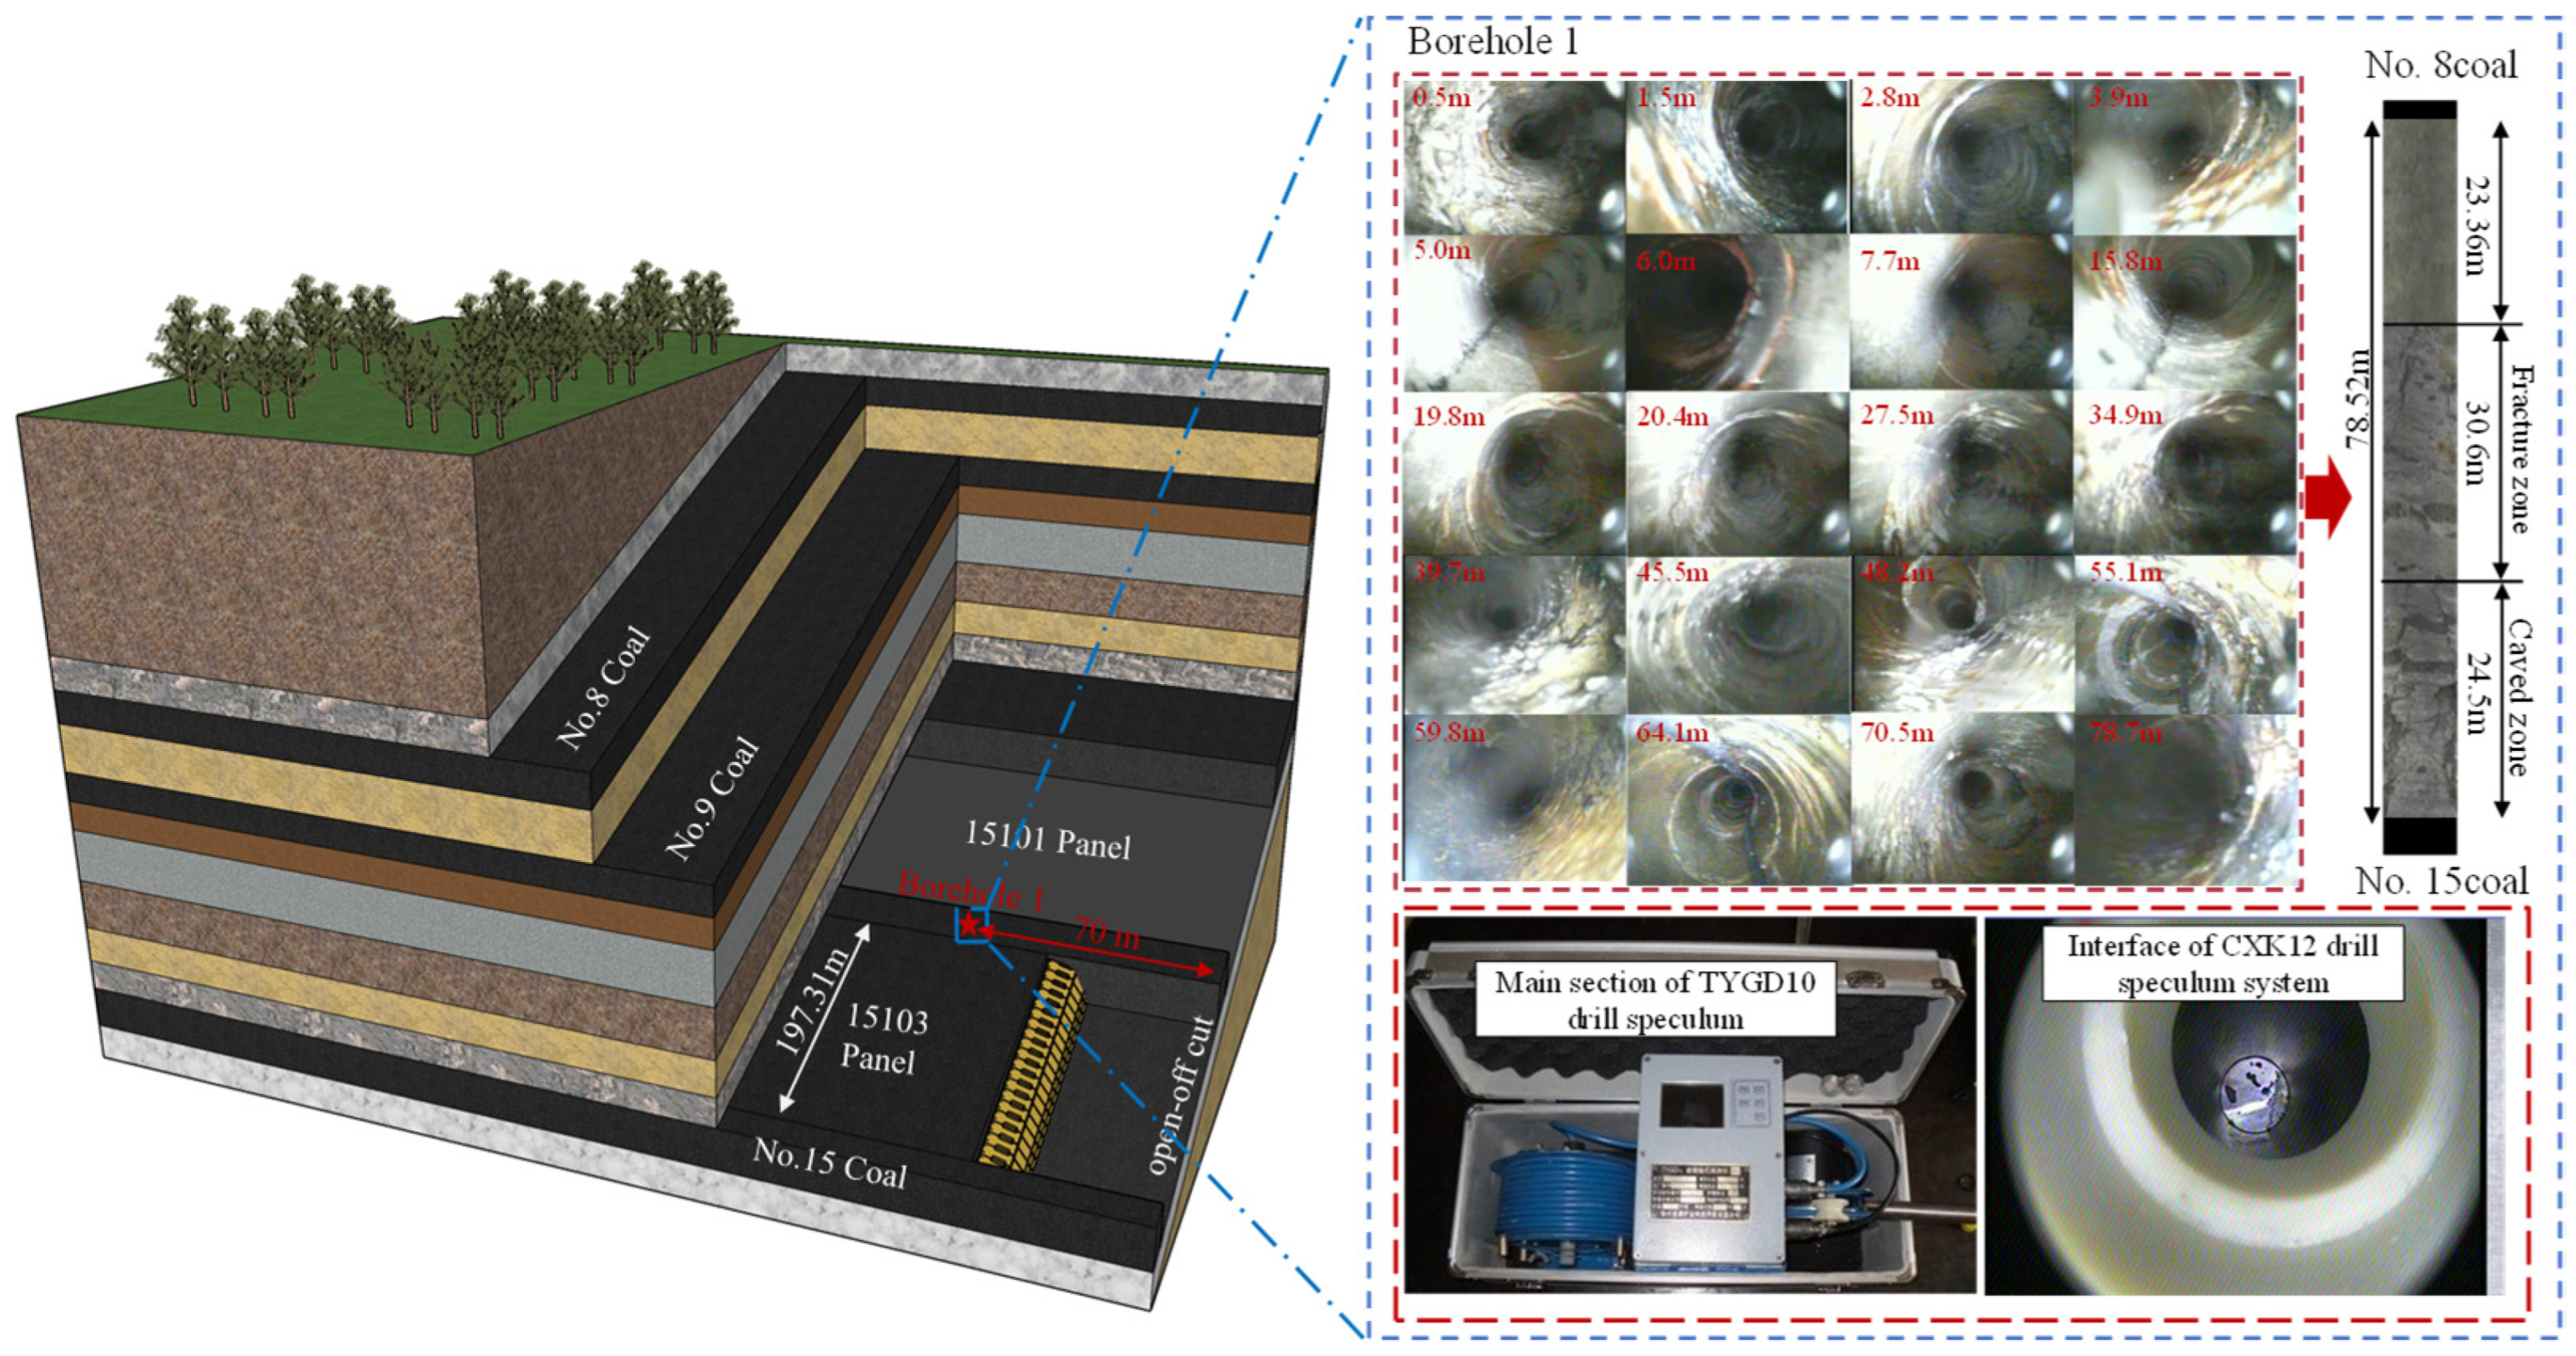
Borehole B-1 at the Fuda Coal Mine and numerical simulation results were used to validate the multivariate nonlinear coordinated regression model. The accuracy rates of 97.5%, respectively, demonstrate that the predicted results closely align with the measured values. Therefore, these models can be effectively applied to predict the HWCFZ at the Fuda Coal Mine.
(4)
Based on the borehole data and mining conditions, the distribution of the WCFZ development height across the entire Fuda Coal Mine area was fitted using the multivariate nonlinear coordinated regression prediction model. As the No. 15 coal seam extends to the north, the development of the HWCFZ in the entire mining area gradually increases from 52.1 m to 73.9 m.

Author Contributions

All authors contributed to the study conception and design. J.F.: Writing—review and editing, Methodology, Data curation, Investigation, Validation, Conceptualization. X.S.: Writing—original draft, Methodology, Formal analysis. J.C.: Writing—review and editing. K.W.: Writing—review and editing. All authors have read and agreed to the published version of the manuscript.

Funding

This research is supported by the Xinjiang Uygur Autonomous Region Key Research and Development Task Special Fund Project (2023B011009-2), Central-Guided Local Science and Technology Development Fund Project (ZYYD2024JD16), Xinjiang Uygur Autonomous Region Natural Science Foundation—Youth Fund Project (2023D01B22), Basic Scientific Research Operating Fund of Universities in Xinjiang Uygur Autonomous Region (XJEDU2024J127), and Innovation and Entrepreneurship Training Program for college students at Autonomous Region level (S202310994019).

Data Availability Statement

All data included in this study are available upon request by contacting the corresponding author.

Conflicts of Interest

The authors declare no conflicts of interest.

References

  1. Sun, D.D.; Hou, X.A.; Yang, T.H.; Zhao, Y.; Zhang, P.H.; Yang, B.; Liu, Y.L.; Ma, K. Calibration of Water Inrush Channel and Numerical Simulation of Water Inrush Process in Coal Mine Roof. Front. Earth Sci. 2022, 10, 931508. [Google Scholar] [CrossRef]
  2. Li, Y.; Lei, X.H.; Wang, N.; Ren, Y.Q.; Jin, X.Y.; Li, G.S.; Li, T.Z.; Ou, X.J. Study on the Failure Characteristics of Overburden and the Evolution Law of Seepage Field in Deep Buried Thick Coal Seam under Aquifers. Nat. Hazards 2023, 118, 1035–1064. [Google Scholar] [CrossRef]
  3. Lu, C.J.; Xu, J.P.; Li, Q.; Zhao, H.; He, Y. Research on the Development Law of Water-Conducting Fracture Zone in the Combined Mining of Jurassic and Carboniferous Coal Seams. Appl. Sci. 2022, 12, 11178. [Google Scholar] [CrossRef]
  4. Wang, X.; Yin, S.; Xu, B.; Cao, M.; Zhang, R.; Tang, Z.; Huang, W.; Li, W. Study on Height Optimization Prediction Model of Overburden Water-Conducting Fracture Zone under Fully Mechanized Mining. Coal Sci. Technol. 2023, 51 (Suppl. S1), 284–297. [Google Scholar] [CrossRef]
  5. Wang, X.; Zhu, S.; Yu, H.; Liu, Y. Comprehensive Analysis Control Effect of Faults on the Height of Fractured Water-Conducting Zone in Longwall Mining. Nat. Hazards 2021, 108, 2143–2165. [Google Scholar] [CrossRef]
  6. Feng, D.; Hou, E.; Xie, X.; Hou, P.; Chen, M.T. Research on Water-Conducting Fractured Zone Height under the Condition of Large Mining Height in Yushen Mining Area, China. Lithosphere 2023, 2023, 8918348. [Google Scholar] [CrossRef]
  7. Han, Y.; Wang, Q.; Li, W.; Yang, Z.; Gu, T.; Wang, Z. Predicting the Height of the Water-Conducting Fractured Zone in Fully Mechanized Top Coal Caving Longwall Mining of Very Thick Jurassic Coal Seams in Western China Based on the NNBR Model. Mine Water Environ. 2023, 42, 121–133. [Google Scholar] [CrossRef]
  8. Zhang, L.; Zhang, Z.; Wang, K.; Tan, X.; Zhang, L.; Zhang, T. Development and Height Prediction of Fractured Water-Conducting Zone in Weakly Cemented Overburden: A Case Study of Tashidian Erjingtian Mine. Sustainability 2023, 15, 13899. [Google Scholar] [CrossRef]
  9. Zhang, L.; Zhang, Z.; Wang, K.; Tan, X.; Zhang, T.; Zhang, L. Characteristic Developments of the Water-Conducting Fracture Zones in Weakly Cemented Overlying Strata of Jurassic Coal Mines in Western China. Water 2023, 15, 1097. [Google Scholar] [CrossRef]
  10. Ding, Z.; Wang, S.; Liao, J.; Li, L.; Jia, J.; Tang, Q.; Li, X.; Gao, C. Reasonable Working-Face Size Based on Full Mining of Overburden Failure. Sustainability 2023, 15, 3351. [Google Scholar] [CrossRef]
  11. Li, X.; Li, Q.; Xu, X.; Zhao, Y.; Li, P.; Wang, Q. Multiple Influence Factor Sensitivity Analysis and Height Prediction of Water-Conducting Fracture Zone. Geofluids 2021, 2021, 8825906. [Google Scholar] [CrossRef]
  12. Liu, Y.; Yuan, S.; Yang, B.; Liu, J.; Ye, Z. Predicting the Height of the Water-Conducting Fractured Zone Using Multiple Regression Analysis and GIS. Environ. Earth Sci. 2019, 78, 422. [Google Scholar] [CrossRef]
  13. Yang, P.; Yang, W.; Nie, Y.; Saleem, F.; Lu, F.; Ma, R.; Li, R. Predicting the Height of the Water-Conducting Fractured Zone Based on a Multiple Regression Model and Information Entropy in the Northern Ordos Basin, China. Mine Water Environ. 2021, 41, 225–236. [Google Scholar] [CrossRef]
  14. Yin, H.; Dong, F.; Zhang, Y.; Cheng, W.; Zhai, P.; Ren, X.; Liu, Z.; Zhai, Y.; Li, X. Height Prediction and 3D Visualization of Mining-Induced Water-Conducting Fracture Zone in Western Ordos Basin Based on a Multi-Factor Regression Analysis. Energies 2022, 15, 3850. [Google Scholar] [CrossRef]
  15. Ajayi, K.M.; Shahbazi, K.; Tukkaraja, P.; Katzenstein, K. Estimation of Radon Diffusivity Tensor for Fractured Rocks in Cave Mines Using a Discrete Fracture Network Model. J. Environ. Radioact. 2019, 196, 104–112. [Google Scholar] [CrossRef] [PubMed]
  16. Suner, M.C.; Tulu, I.B. Examining the Effect of Natural Fractures on Stone Mine Pillar Strength Through Synthetic Rock Mass Approach. Min. Metall. Explor. 2022, 39, 1863–1871. [Google Scholar] [CrossRef]
  17. Gao, Z.; Jin, L.; Liu, P.; Wei, J. Height Prediction of Water-Conducting Fracture Zone in Jurassic Coalfield of Ordos Basin Based on Improved Radial Movement Optimization Algorithm Back-Propagation Neural Network. Mathematics 2024, 12, 1602. [Google Scholar] [CrossRef]
  18. Gu, L.; Shen, Y.; Wang, N.; Kou, H.; Song, S. Prediction of the Height of Fractured Water-Conducting Zone: Significant Factors and Model Optimization. Water 2023, 15, 2720. [Google Scholar] [CrossRef]
  19. Guo, C.; Yang, Z.; Li, S.; Lou, J. Predicting the Water-Conducting Fracture Zone (WCFZ) Height Using an MPGA-SVR Approach. Sustainability 2020, 12, 1809. [Google Scholar] [CrossRef]
  20. Zheng, Q.; Wang, C.; Liu, W.; Pang, L. Evaluation on Development Height of Water-Conducted Fractures on Overburden Roof Based on Nonlinear Algorithm. Water 2022, 14, 3853. [Google Scholar] [CrossRef]
  21. Iraji, S.; Soltanmohammadi, R.; Matheus, G.F.; Basso, M.; Vidal, A.C. Application of Unsupervised Learning and Deep Learning for Rock Type Prediction and Petrophysical Characterization Using Multi-Scale Data. Geoenergy Sci. Eng. 2023, 230, 221241. [Google Scholar] [CrossRef]
  22. Zhai, P.; Li, N. Predicting the Height of the Hydraulic Fracture Zone Using a Convolutional Neural Network. Mine Water Environ. 2023, 42, 500–512. [Google Scholar] [CrossRef]
  23. Fernández, A.; Sanchidrián, J.A.; Segarra, P.; Gómez, S.; Li, E.M.; Navarro, R. Rock Mass Structural Recognition from Drill Monitoring Technology in Underground Mining Using Discontinuity Index and Machine Learning Techniques. Int. J. Min. Sci. Technol. 2023, 33, 555–571. [Google Scholar] [CrossRef]
  24. Zhao, D.; Li, Z.; Feng, G.; Wang, F.; Hao, C.; He, Y.; Dong, S. Using Swarm Intelligence Optimization Algorithms to Predict the Height of Fractured Water-Conducting Zone. Energy Explor. Exploit. 2023, 41, 1603–1627. [Google Scholar] [CrossRef]
  25. Zhao, B.; He, S.; Bai, K.; Lu, X.; Wang, W. Elastic Wave Prospecting of Water-Conducting Fractured Zones in Coal Mining. Sci. Rep. 2024, 14, 7036. [Google Scholar] [CrossRef]
  26. Lee, S.C.H.; Noh, K.A.M.; Zakariah, M.N.A. High-Resolution Electrical Resistivity Tomography and Seismic Refraction for Groundwater Exploration in Fractured Hard Rocks: A Case Study in Kanthan, Perak, Malaysia. J. Asian Earth Sci. 2021, 218, 104880. [Google Scholar] [CrossRef]
  27. Xu, C.; Zhou, K.; Xiong, X.; Gao, F.; Zhou, J. Research on Height Prediction of Water-Conducting Fracture Zone in Coal Mining Based on Intelligent Algorithm Combined with Extreme Boosting Machine. Expert Syst. Appl. 2024, 249, 123669. [Google Scholar] [CrossRef]
  28. Gao, W.; Li, Y.; He, Q. Determination of Fractured Water-Conducting Zone Height Based on Microseismic Monitoring: A Case Study in Weiqiang Coalmine, Shaanxi, China. Sustainability 2022, 14, 8385. [Google Scholar] [CrossRef]
  29. Zhao, D.; Wu, Q. An Approach to Predict the Height of Fractured Water-Conducting Zone of Coal Roof Strata Using Random Forest Regression. Sci. Rep. 2018, 8, 10986. [Google Scholar] [CrossRef]
  30. Bhattacharya, S.; Mishra, S. Applications of Machine Learning for Facies and Fracture Prediction Using Bayesian Network Theory and Random Forest: Case Studies from the Appalachian Basin, USA. J. Pet. Sci. Eng. 2018, 170, 1005–1017. [Google Scholar] [CrossRef]
  31. Li, B.; Wu, H.; Li, T. Height Prediction of Water-Conducting Fractured Zone under Fully Mechanized Mining Based on Weighted Multivariate Nonlinear Regression. J. Min. Saf. Eng. 2022, 39, 536–545. [Google Scholar]
  32. Duarte, B.P.M.; Atkinson, A.C.; Oliveira, N.M.C. Optimum design for ill-conditioned models: K-optimality and stable parameterizations. Chemom. Intell. Lab. Syst. 2023, 239, 104874. [Google Scholar] [CrossRef]
  33. Chu, E.Y.; Stull, K.E. An investigation of the relationship between long bone measurements and stature: Implications for estimating skeletal stature in subadults. Int. J. Leg. Med. 2025, 139, 441–453. [Google Scholar] [CrossRef] [PubMed]
  34. Mikolajczyk, A.P.; Fortela, D.L.B.; Berry, J.C.; Chirdon, W.M.; Hernandez, R.A.; Gang, D.D.; Zappi, M.E. Evaluating the Suitability of Linear and Nonlinear Regression Approaches for the Langmuir Adsorption Model as Applied toward Biomass-Based Adsorbents: Testing Residuals and Assessing Model Validity. Langmuir 2024, 40, 20428–20442. [Google Scholar] [CrossRef]
  35. Biswal, A.; Jwo, D.-J. Maximum Correntropy Extended Kalman Filtering with Nonlinear Regression Technique for GPS Navigation. Appl. Sci. 2024, 14, 7657. [Google Scholar] [CrossRef]
  36. Wang, D.; Zhang, Z.; Zhang, D.; Huang, X. Biomass allometric models for Larix rupprechtii based on Kosak’s taper curve equations and nonlinear seemingly unrelated regression. Front. Plant Sci. 2023, 13, 1056837. [Google Scholar] [CrossRef]
Figure 1. Main factors influencing the development height of the conductive fissure zone.
Water 17 01303 g001
Figure 2. Overall research line.
Water 17 01303 g002
Figure 3. The correlation between five primary control factors and the HWCFZ.
Water 17 01303 g003
Figure 4. Correlation heatmap analysis.
Water 17 01303 g004
Figure 5. Weights of influencing factors based on principal component analysis.
Water 17 01303 g005
Figure 6. Scatter plots and fitting functions of each influencing factor.
Water 17 01303 g006
Figure 7. Network structure training.
Water 17 01303 g007
Figure 8. Hidden layer node.
Water 17 01303 g008
Figure 9. Genetic algebraic matching degree.
Water 17 01303 g009
Figure 10. Comparison of prediction results.
Water 17 01303 g010
Figure 11. Geological model diagram of Fuda mine.
Water 17 01303 g011
Figure 12. Borehole observation result.
Water 17 01303 g012
Figure 13. The predicted results are compared with the field measured results.
Water 17 01303 g013
Figure 14. Water-conducting fracture zone development model.
Water 17 01303 g014
Figure 15. Vertical stress distribution contour map.
Water 17 01303 g015
Figure 16. Development contour map of the water-conducting fracture zone.
Water 17 01303 g016
Figure 17. Distribution map of the development height of the water-conducting fracture zone across the entire Fuda Coal Mine area.
Water 17 01303 g017
Table 1. Measured data of the fractured water-conducting zone (partial data).
NumberMining Thickness/mMining Depth/mLength of Panel/mProportion Coefficient of Hard RockCoal Seam Dip/°Height of the Fractured Water-Conducting Zone/m
11.2120750.66831
21.62851800.24630.8
31.7320650.9627.5
41.82701000.61833
51.893730.496216.6
1468.74091980.5683
14795902200.51876
1489.54501230.651578
1499.63021200.257112
1509.9332930.752125.8
Table 2. Parameter estimation of nonlinear additive regression model.
ModelParameterEstimationStandard Error95% Confidence Interval
Lower LimitUpper Limit
Mining thicknessa11.0950.1500.7991.391
b1−4.442.029−8.449−0.431
Mining deptha20.010.000−0.010.01
b20.0050.028−0.0500.060
Length of panela39.0373.7491.62916.445
Coal seam dipa48.343.0342.34514.335
b40.0110.008−0.0050.028
Proportion coefficient of hard rocka5−0.7390.426−1.5800.102
a67.57519.610−31.17946.329
Table 3. Parameter estimation of nonlinear coordinated regression model.
ModelParameterEstimationStandard Error95% Confidence Interval
Lower LimitUpper Limit
Mining thicknessa11.33617.31−35.4833.16
b110.27616.09−20.0727.63
c1−35.21618.08−29.9229.48
Mining deptha2−1.2609.72−33.33631.82
b21783.8211.84−28.7536.38
c2−1279.850.47−38.1148.41
Length of panela30.0086.457−29.85129.87
b3−0.02514.207−34.14538.10
Coal seam dipa40.1235.209−18.16112.41
b40.2582.175−3.0232.54
C40.0012.065−4.0824.082
Proportion coefficient of hard rocka5−0.0011.789−1.9361.936
b50.0001.817−2.5912.592
a641.8502.63836.63447.066
Table 4. Prediction results of the HWCFZ.
ModelMeasurementNonlinear Additive Regression ModelNonlinear Coordinated Regression ModelBPGA-BP
140.00 m41.51 m43.56 m45.51 m42.69 m
242.99 m36.70 m42.62 m42.49 m43.85 m
365.30 m62.05 m62.36 m70.24 m64.71 m
451.25 m52.86 m48.96 m58.69 m46.96 m
575.50 m77.01 m77.75 m67.97 m66.99 m
642.81 m44.53 m42.41 m46.88 m48.00 m
786.80 m84.39 m85.29 m80.34 m83.94 m
843.00 m53.08 m54.35 m48.93 m49.19 m
972.90 m65.98 m68.15 m60.58 m65.11 m
1054.79 m51.35 m53.20 m64.75 m62.52 m
1145.00 m43.09 m40.84 m52.28 m47.26 m
1254.30 m47.97 m48.35 m46.60 m46.84 m
1362.53 m63.80 m67.07 m65.23 m63.55 m
1461.90 m74.54 m70.06 m62.33 m65.53 m
1558.50 m51.59 m53.93 m50.55 m53.30 m
Mean absolute error rate 8.31%7.23%10.78%7.94%
Table 5. Physical and mechanical parameters of each rock formation.
Serial No.LithologyThickness (m)Density (kg/m3)Bulk Modulus (GPa)Shear Modulus (GPa)Cohesion (MPa)Tensile Strength (MPa)Friction Angle (°)
1Fine Sandstone17.425004.83.53.41.138
2Mudstone422002.381.623.51.833
3No. 8 Coal1.615601.81.21.71.332
4Siltstone31.9524003.42.24.12.036
5Limestone3.43255011.210.7208.248
6Sandy Mudstone6.4122002.31.61.81.234
7Limestone3.66255011.210.7208.248
8Medium Sandstone2.9226405.84.72.80.940
9Fine Sandstone3.9525004.83.53.41.138
10Limestone7.12255011.210.7208.248
11Siltstone3.6824003.42.24.12.036
12Sandy Mudstone13.7522002.31.61.81.234
13No. 15 Coal4.6315601.81.21.71.332
14Siltstone3.7224003.42.24.12.036
15Fine Sandstone14.7825004.83.53.41.138
Table 6. Boreholes and safety distance calculations of Fuda coal mine.
NumberThickness of Coal Seam/mMining Depth/mLength of Panel/mCoal Seam Dip/°Proportion Coefficient of Hard RockPrediction Value/m
S14.88662.33220.008.000.4869.57
S24.75432.03194.588.000.2756.21
S35.16703.49220.008.000.4873.88
S44.74709.21220.008.000.3262.44
S54.63471.44241.418.000.3760.70
S64.35314.38200.118.000.3552.13
SY-14.81357.12215.008.000.3858.01
SY-24.80519.15215.758.000.3060.27
SY-34.89485.98215.008.000.3461.88
SY-44.46339.74194.578.000.3252.86
SY-54.60374.30219.678.000.5556.46
B-14.42326.3197.318.000.4656.62
Disclaimer/Publisher’s Note: The statements, opinions and data contained in all publications are solely those of the individual author(s) and contributor(s) and not of MDPI and/or the editor(s). MDPI and/or the editor(s) disclaim responsibility for any injury to people or property resulting from any ideas, methods, instructions or products referred to in the content.

