1. Introduction
With the acceleration of urbanization and the continuous change in water demand, real-time optimization of water injection pipe network scheduling is facing increasingly complex challenges. China’s water injection enterprises need to invest a lot of energy costs to maintain the huge water injection system every year, of which up to 95% of the power consumption is used to maintain the pump operation [
1]. Therefore, the optimization of pump group regulation has been proven to be an effective method to reduce the operating cost of the whole water injection system [
2]. The offshore oil and gas field water injection pipe network system is a complex network composed of interconnected modules [
3,
4,
5], which aims to meet the water injection demand of offshore platforms [
6]. Take the water injection pipe network system of an offshore oil and gas field development platform as an example, which includes a buffer tank, a water injection pump, a pipeline, a valve, a water injection manifold, and so on. The system not only needs to meet the pressure requirements of the reservoir but also needs to achieve efficient and energy-saving operation under dynamic conditions. The operational efficiency of the main energy-consuming equipment in the water injection system directly affects the utilization efficiency of water resources and the cost of water injection [
7,
8,
9]. Optimizing operation scheduling is not only related to the effective utilization of energy but also to the safe operation of the water injection system, which is of great significance in reducing the cost of water injection and improving the quality of the water injection service [
10,
11,
12,
13,
14,
15,
16].
The purpose of the water supply regulation of complex pipe networks is to reduce energy consumption and save costs as much as possible on the premise of meeting the demand of water supply dispatching. Since the pipe network optimization problem was proposed, researchers have done a lot of research and exploration in this field. Traditional water injection pipe network scheduling methods, such as linear programming and dynamic programming, solve the scheduling problem to a certain extent. However, these methods are often difficult to adapt to dynamic water demand fluctuations and nonlinear characteristics of the system. In addition, they usually require a lot of calculation time and parameter adjustment, which limits their effectiveness in real-time scheduling [
17]. Therefore, the realization of real-time and efficient scheduling of water injection pipeline networks has become an urgent problem that needs to be solved in the water injection industry. In recent years, Yasaman Makaremi et al. (2017) combined the genetic algorithm NSGA-II with the EPANET hydraulic simulation model to increase the constraints of pump start–stop times and optimize the actual pipe network [
18]. By carefully arranging the pump operation program, even compared with the previous optimal operation, the total pump switching times can still be reduced by 69%, and the energy cost can be increased by up to 10%. With the rapid development of artificial intelligence technology, advanced methods such as machine learning, deep learning, and reinforcement learning have been gradually introduced into the optimal scheduling of water injection networks [
19,
20,
21,
22,
23]. However, classical heuristic algorithms, such as genetic algorithms, become more time-consuming as the number of pumps used and the target increase [
24]. Gergely Hajgató et al. (2020) trained a deep Q-network-based agent to adjust the speed of the pump based on instantaneous node pressure data [
25]. The main contribution of this method is that the agent can control the operation of the pump in real time. Jiahui Xu et al. (2021) studied the problem of pump scheduling optimization in water supply networks by combining new algorithms of knowledge learning and deep reinforcement learning [
26]. The results show that this method works well in practice and is superior to the Nelder–Mead method. This method can not only adapt to the dynamic change in water injection demand but can also effectively improve the nonlinear characteristics of the system, showing a broad application prospect, but its optimization effect may be inconsistent [
27].
This study introduces a constant-pressure variable-frequency control strategy. The control strategy is a method based on feedback PID control, which is used to monitor the pressure of the pipe network in real time and adjust the operating frequency of the pump. This strategy is widely used in the traditional water injection pipe network system, but with the expansion of the system scale and the complexity of operating conditions, its limitations in energy saving and optimal scheduling are gradually emerging.
In this paper, the genetic algorithm and reinforcement learning for real-time control of a variable speed pump are proposed and applied to the experimental platform of a simulated water injection pipe network. The genetic algorithm finds the global optimal or near-optimal solution in the complex search space, showing good global search ability [
28]. Recent popular reinforcement learning algorithms, such as Deep Q-Network (DQN), transfer most of the computational cost to the training phase compared to heuristic algorithms, and the trained agents have an extremely fast decision-making speed. The programmable logic controller (PLC) is connected to the computer through the network cable, and the hardware and algorithm of the experimental platform are combined. Through experiments with different requirements, the performance of the genetic algorithm, DQN algorithm, and constant-pressure control strategy to solve the optimal scheduling problem of a water injection pipe network is compared. The energy-saving effect and decision speed under different requirements are compared, and the research characteristics of the algorithm are comprehensively evaluated. These findings provide new insights and practical guidance for the real-time optimal scheduling of water injection networks, ultimately promoting technological advancements and sustainable development in the industry.
The structure of this paper is as follows: The
Section 2 introduces the construction of the experimental platform and the simulation model. The
Section 3 introduces the mathematical model. The
Section 4 introduces four control strategies. The
Section 5 introduces the experimental results and analysis. Finally, the
Section 6 gives the main conclusions.
2. Build Experimental Platform and Simulation Model
2.1. Build an Experimental Platform
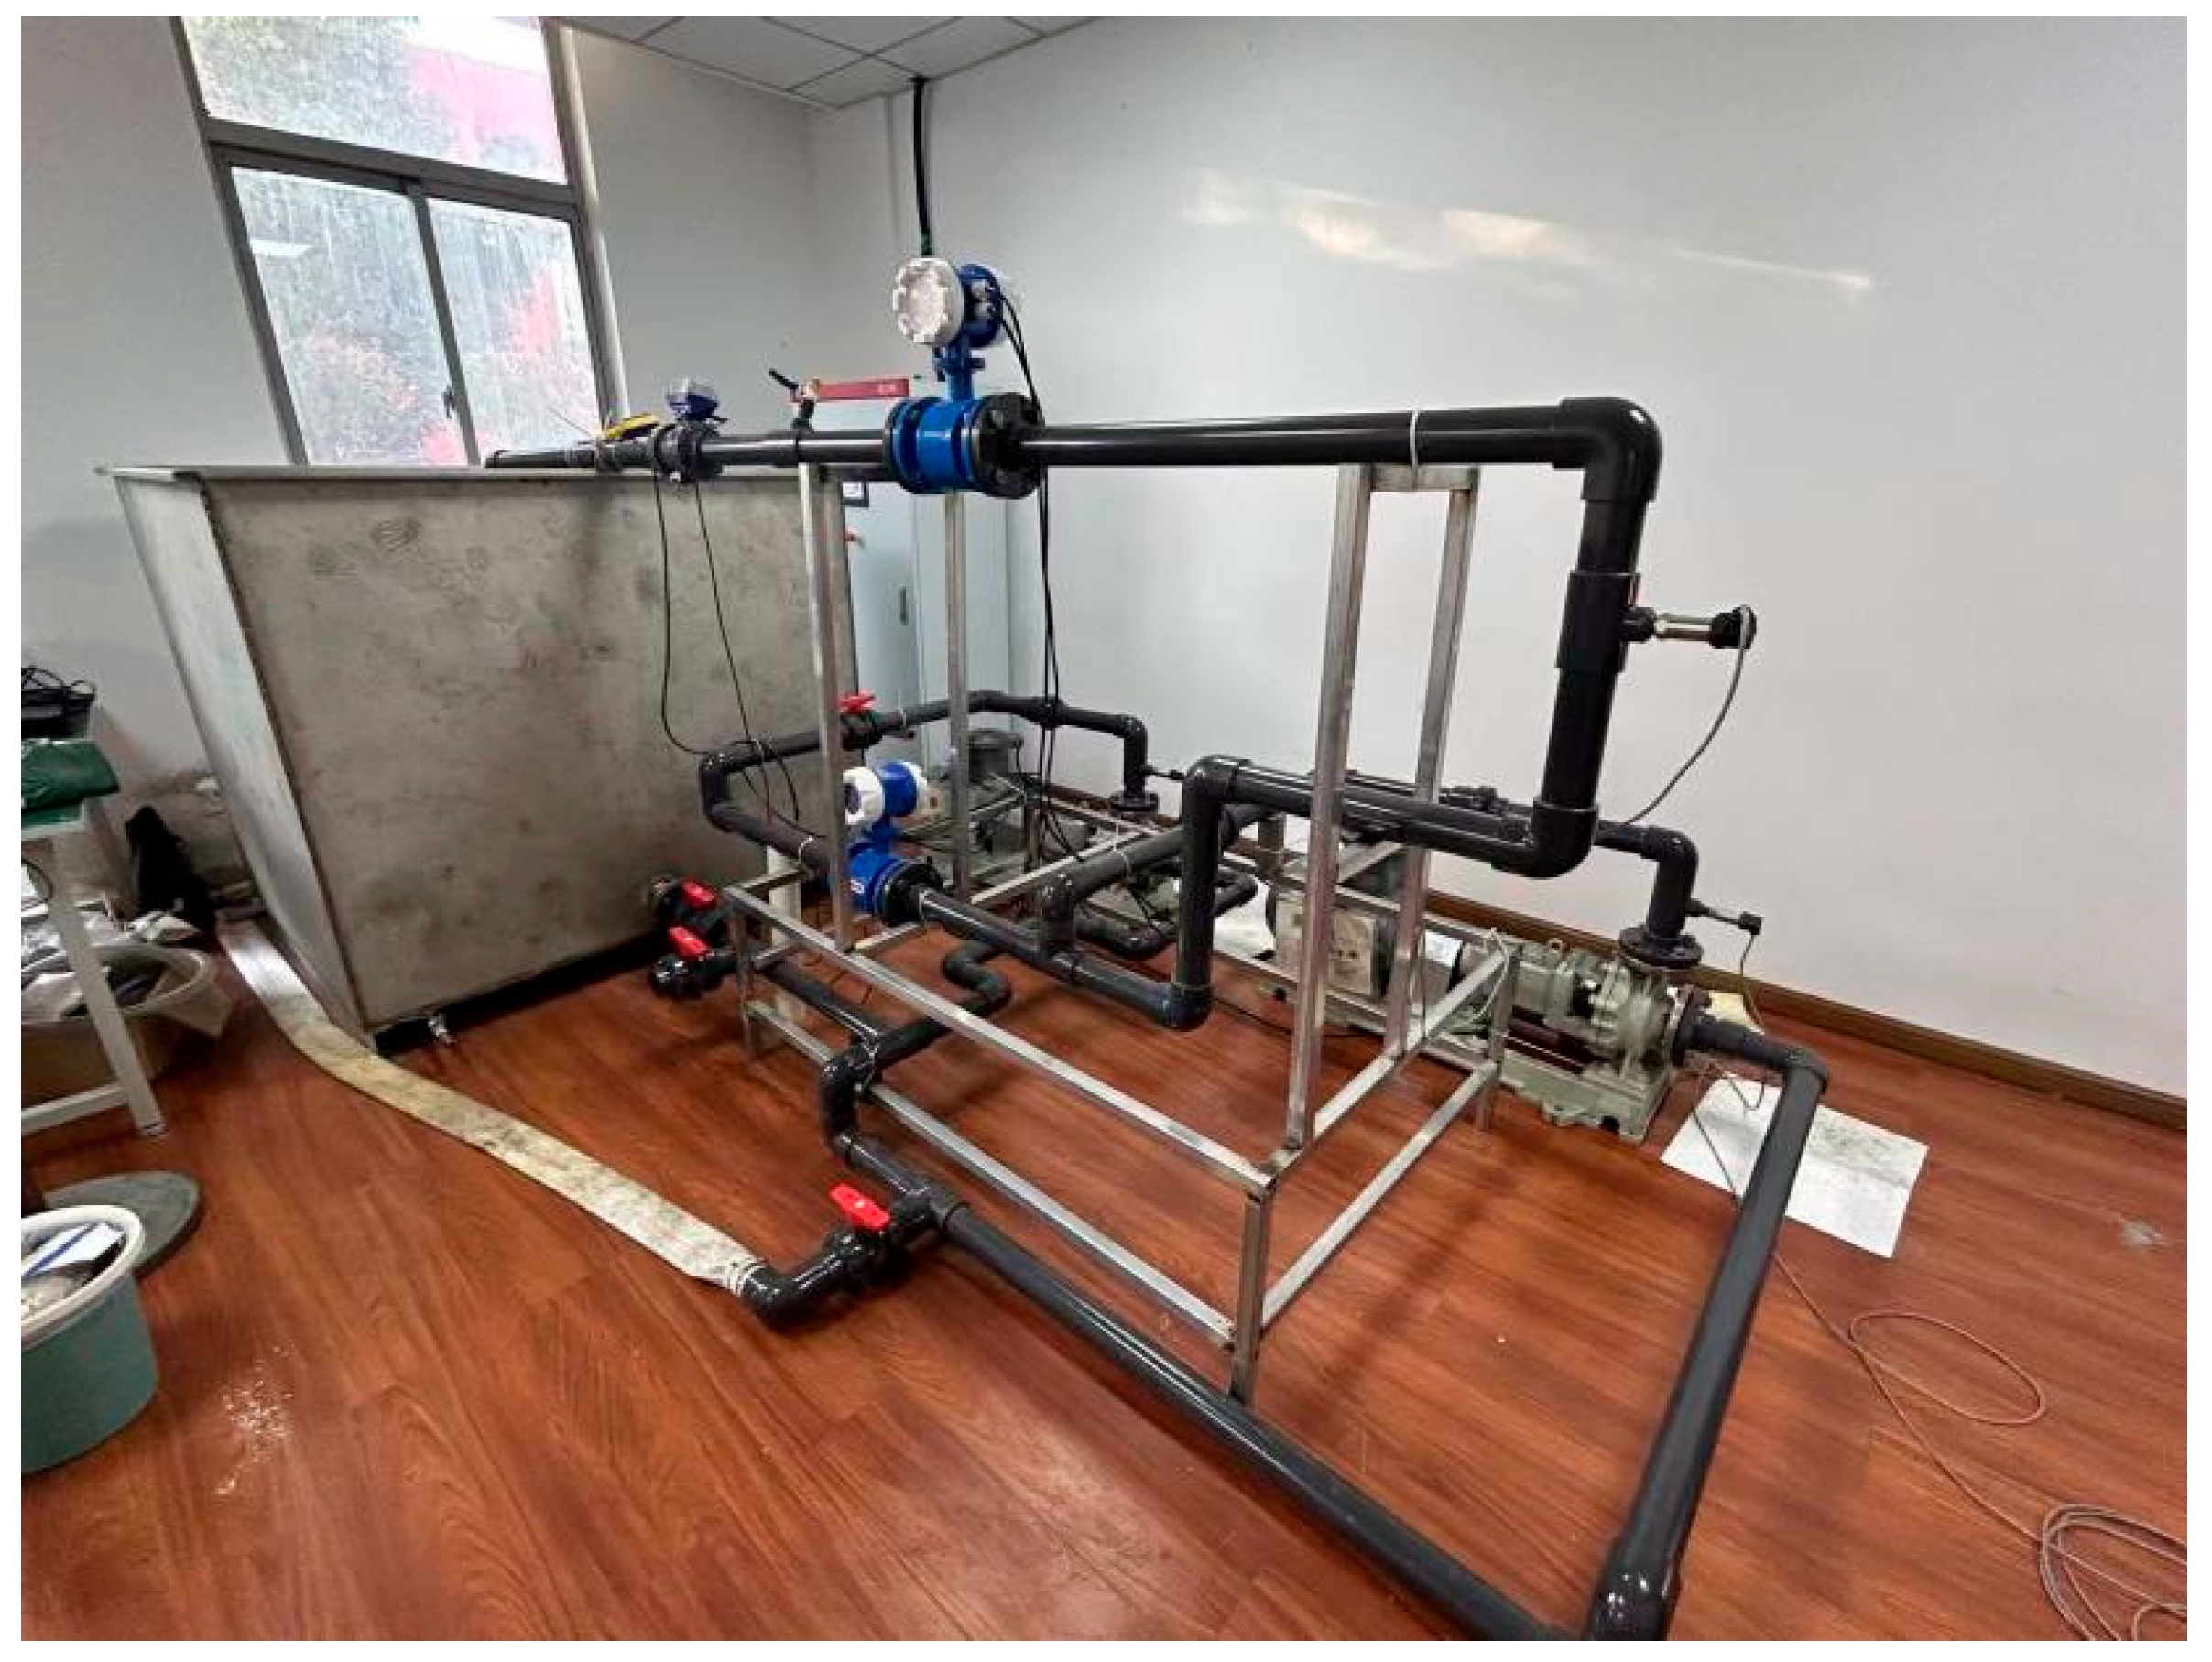
In this study, a circulatory system simulating a water injection network is constructed to model dynamic changes in real water distribution and evaluate the energy optimization effects of different control strategies. The experimental platform is a simplified model for civil and industrial multi-pump group systems, which is widely representative and can provide a basis for studying the universal characteristics of water injection pipe networks.
The experimental platform consists of two identical centrifugal pumps (defined as pump A and pump B, respectively), flow meters, pressure sensors, valves, water tanks, 50 mm PVC piping, electric meters, and control panels, as shown in
Figure 1.
Both pumps are rated to operate at a flow rate of 22.5 m
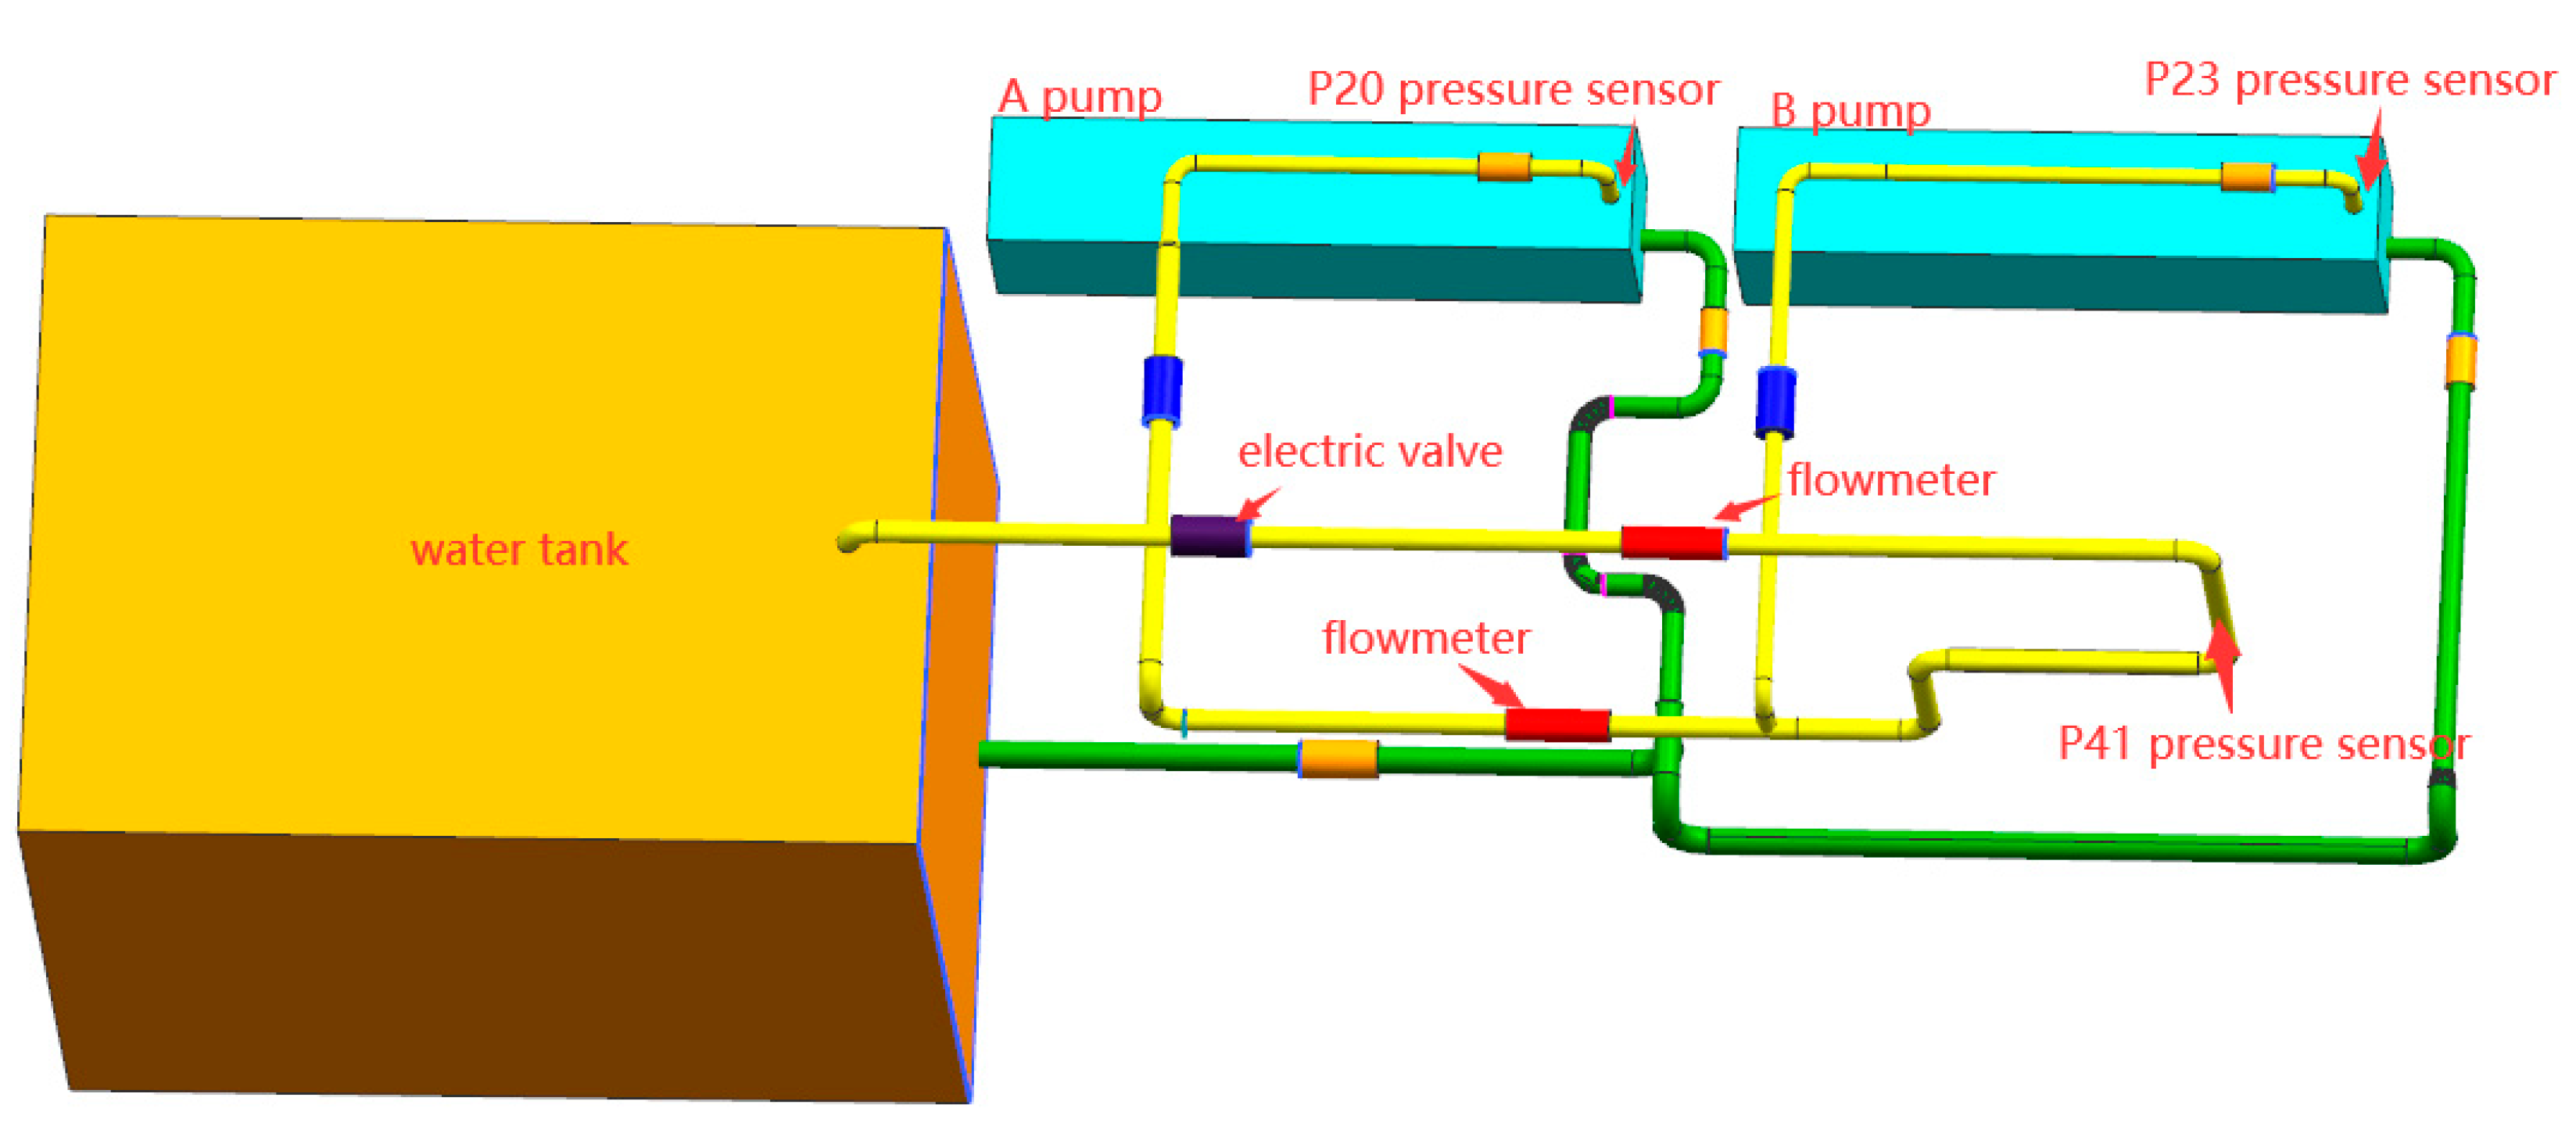
3/h and a head of 26 m. Flow meters are installed in the branch circuit of pump A and in the main pipeline to monitor the local and overall flow rate. Three pressure sensors with a range of 0–1 MPa are installed at the key pressure measurement points of the A pump outlet, the B pump outlet, and the two pump outlets converging to the main pipeline for real-time monitoring of pressure changes. Motorized valves are installed at the end of the whole system for regulating the flow rate of the system to simulate the dynamic demand changes in the actual water injection network, and the installation position of the instrument is shown in
Figure 2.
The experimental steps of this study include checking the running state of the equipment and running four control methods in turn in each state (rated operation, constant-pressure control, genetic algorithm control method, and reinforcement learning control method). The principles of the four control methods are described in detail in
Section 4 of this article. Additional steps include recording relevant data, meter reading, calculating energy consumption, discharging water from the pipeline, checking the state of the equipment, and summarizing the experiment. The experimental parameters were set based on the rated operating conditions of the pump, and the flow rate ranged from 15.75 m
3/h to 45 m
3/h. In the experiment, each control method was tested for 20 min under each condition, with meter readings recorded every five minutes to ensure data stability and reliability. The experimental steps were performed in strict accordance with the preset procedures to ensure the consistency and repeatability of the experimental conditions. By accurately recording and analyzing key parameters such as energy consumption and operating frequency, this experiment provides a scientific basis for evaluating the energy-saving effects of different control methods.
Constructing this experimental platform allows for the effective simulation of real-world water injection network operations while simplifying complexity for systematic analysis and validation of energy optimization strategies.
2.2. Developing a Simulation Model
Simulating a water injection pipe network requires a model that accurately represents hydraulic system characteristics based on structural and diameter parameters measured in the field. The construction of this model not only provides an environment close to the actual working conditions for the subsequent application of a genetic algorithm and reinforcement learning but also provides rich online data support for the optimization and learning of the algorithm. Through simulation modeling, a large amount of data similar to the actual operating conditions can be generated, thus providing more comprehensive inputs for algorithm training and further improving the generalization ability and optimization effect of the model. Therefore, simulation modeling is the basis for achieving efficient optimal scheduling, which is significant for improving the operational efficiency and energy saving of water injection network systems. To achieve this goal, all relevant components, such as the water source, pumps, and piping nodes, as well as the water demand and physical constraints of the system, must be incorporated into the model, which involves complex fluid mechanics and system dynamics calculations. To ensure the accuracy and reliability of the model, EPANET 2.0, a widely recognized open-source hydraulic simulator, was used in this study. EPANET 2.0 has been scientifically tested and validated in several studies, including those by Rossman et al., confirming its accuracy in hydraulic simulations [
29]. Additionally, to enhance the model’s analytical efficiency and processing capability, the EPANET model was integrated with the WNTR library in the Python programming language (Python 3.11). The WNTR library provides comprehensive interfaces and tools that make the simulation and analysis of hydraulic networks more efficient and accurate [
30]. This comprehensive method can construct a scientific and practical simulation model of a water injection pipe network and provide strong support for the optimal design and operational management of the pipe network.
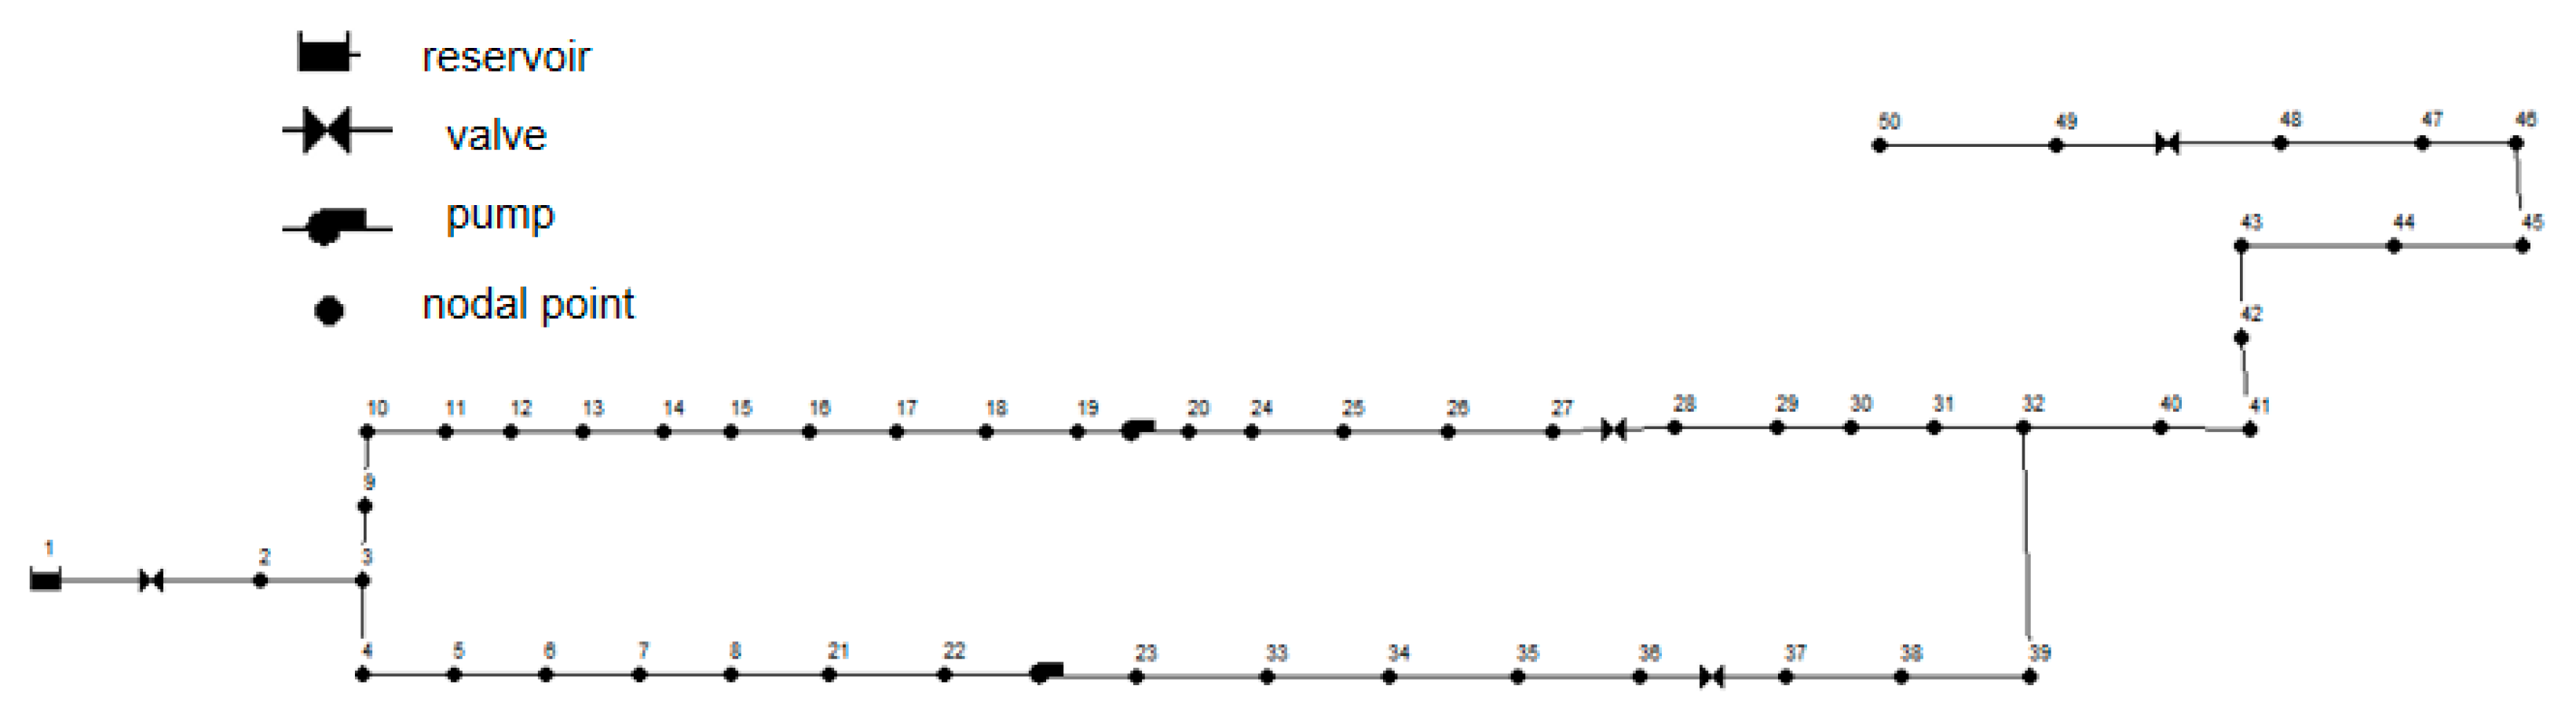
The system structure is as follows: a storage tank is used as the water source node, and the total valve is used as the end node. The hydraulic model takes into account the loss along the way, the local resistance loss (bends, valves), and the elevation difference between the nodes. The local loss coefficient and the height of each node are clearly defined in the pipeline configuration. In
Figure 3, the bends are simplified as straight lines, but their local losses are retained in the calculation.
2.3. Validating the Simulation Model
In the pipeline network circulation system, node P41 is defined as a key pressure measurement point where the outlets of pump A and pump B converge to the main pipeline. P20 and P23 represent the pressure nodes at the outlets of pump A and pump B, respectively, reflecting each pump’s working status and performance. To validate the model, pressure readings at nodes P41, P20, and P23 were compared with simulation model values under seven different operating conditions.
Under the condition of flow rate 15.7 m
3/h to 24.8 m
3/h, the test pressures of P
20 and P
41 under single pump A operation are shown in
Figure 4a. The results of subtracting the simulated pressure values from the test pressure values of P
20 and P
41 under single pump A operation are shown in
Figure 4b. Under the condition of flow rate 31.5 m
3/h to 45 m
3/h, the test pressures of P
20, P
23, and P
41 under dual pump operation are shown in
Figure 4c. The results of subtracting the simulated pressure values from the test pressure values of P
20, P
23, and P
41 under dual pump operation are shown in
Figure 4d.
The analysis of seven working conditions shows that when the flow rate is between 15.7 m3/h and 24.8 m3/h, the maximum relative error between the experimental value and the simulated value under the single-pump operation condition is 0.35%, and the minimum relative error is 0.0017%. At the main pipeline node, the maximum and minimum relative errors are 0.533% and 0.33%, respectively. For the flow rate between 31.5 m3/h and 45 m3/h, the maximum relative error of the pressure value of the A pump is 0.189%, the maximum relative error of the pressure value of the B pump is 0.19%, and the relative error of the pressure value at the main pipe node is from 0.085% to 2.015%.
Through the comparison and verification with the experimental data, the established simulation model shows high accuracy under different working conditions, which can accurately reflect the actual operating status of the pipe network circulation system and provides a strong theoretical support and reference basis for the optimization design and operation management of the pipe network system.
4. Pipe Network Scheduling Method
The optimal scheduling method of this study, in addition to the constant-pressure control mode, is the same frequency operation of the two pumps in the double-pump operation mode. For different flow rates, the genetic algorithm and reinforcement learning are combined with the simulation model to apply to the pipe network system, and the pump speed is output and applied to the pipe network system.
4.1. Rated Operation
Rated operation refers to the operation of the pump at a fixed grid frequency, and its flow rate and head are determined by the characteristic curve of the pump.
Figure 5 shows the flow–head curve (Q-H curve) of the pump. In the power frequency operation mode, the operating point of the pump is determined by the actual demand (flow rate and head) of the system. Adjusting valve openings modifies system resistance, aligning the actual working point of the pump with system requirements. While straightforward, this method lacks real-time adaptability and often leads to low energy efficiency.
If the single-pump operation can meet the pressure constraint of node P41 (pressure value between 12 m and 24 m), the system will select the single-pump operation mode. However, when single-pump operation cannot meet the minimum pressure requirement of node P41, the system will automatically switch to the double-pump operation mode to ensure that the pressure of the entire pipeline network circulatory system is stabilized to meet the pressure demand of the system. In addition, when the pressure at node P41 is too high, the valve needs to be adjusted to meet the pressure demand at the pressure point.
4.2. Constant-Pressure Control
Constant-pressure control is a precise automatic control strategy; its main purpose is to ensure that the pressure of the water injection network is always maintained at a set constant level.
Figure 7 shows the working principle of constant-voltage control. By installing pressure sensors at key nodes of the pipe network, the pressure change of the pipe network can be monitored in real time, and the data can be fed back to the controller. The controller uses the PID control algorithm to accurately adjust the speed of the pump according to the deviation between the set target pressure value and the actual pressure value. In this way, it can sensitively respond to subtle changes in pressure, achieve efficient and accurate regulation of pipe network pressure, and ensure the stable operation of the entire water injection system.
In this study, the outlet pressure nodes P20 and P23 were assigned identical target pressures. The system continuously adjusts pump operations to maintain a stable pressure of 21.2 m. This value was selected to balance energy efficiency while preventing over-frequency operation, ensuring adequate pressure at all times.
4.3. Genetic Algorithms
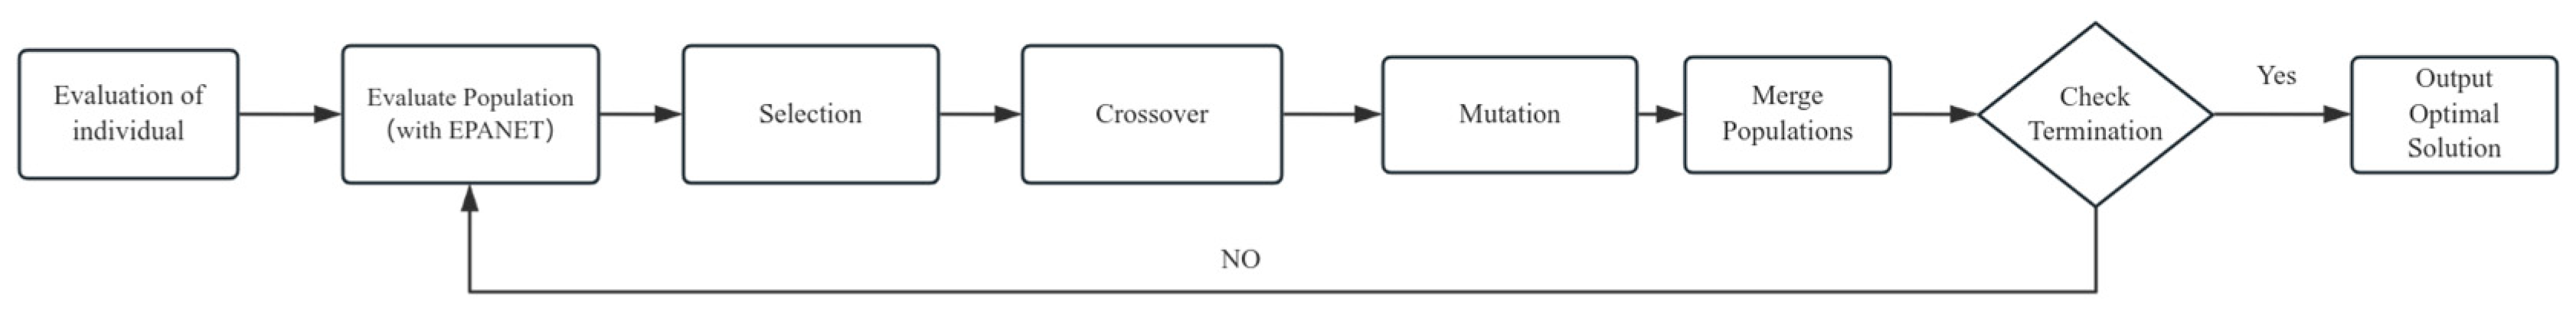
Based on natural selection and genetics principles, genetic algorithms (GAs) are widely used for optimization problems in complex systems. By simulating biological evolutionary processes, genetic algorithms are able to efficiently find global optimal or approximate optimal solutions in a large-scale search space. In the water injection pipe network system, the genetic algorithm is used to optimize the operation scheme of the water pump to achieve the lowest energy consumption.
Figure 8 illustrates the application of genetic algorithms in pipe networks. The initial population is randomly generated, with each individual representing a water pump operation scheme. The energy expenditure of each individual was calculated, and its fitness was assessed by coupling to a pipe network simulation model. Based on the fitness values, selection, crossover, and variation operations were used to generate new populations. Through multiple generations of iterations, the genetic algorithm can gradually approach the optimal solution and find the running scheme with the least energy consumption.
4.3.1. Initial Populations
The optimization process of a genetic algorithm begins with the generation of a random initial population. However, considering the complexity of the pump set optimization problem and the wide search space, this paper combines the historical optimization scheme with the random generation method to ensure that the initial population contains effective running schemes. This approach not only improves the quality of the initial population but also enhances the optimization effect.
4.3.2. Individual Evaluations
In each generation of the genetic algorithm, the individuals in the population will be evaluated by coupling with the pipe network simulation module. Each individual represents a pumping station operation scenario, which the algorithm feeds into EPANET for simulation and calculates the corresponding energy consumption. The algorithm imposes penalties on individuals that do not satisfy the constraints, thus ensuring the selection of high-quality individuals in the optimization process [
31].
4.3.3. Selection and Generation of New Populations
The selection operation is the core of the genetic algorithm, aiming to select the well-adapted individuals as parents from the current population. In this paper, we adopt a roulette selection method without put-back to ensure that each individual is selected only once in each iteration while incorporating an optimal selection strategy to retain the optimal individuals and increase the diversity of the population. This approach helps to avoid local optimal solutions and improve the overall optimization.
4.3.4. Crossing and Variation
In the process of generating a new population, the genetic algorithm performs crossover and mutation operations on the selected individuals to produce a new offspring population. The crossover operation generates new individuals by combining the characteristics of the parent individuals, while the mutation operation introduces randomness to increase the diversity of the population. Eventually, the offspring population merges with the parent population to form a transition population that provides input for the next round of selection.
In this study, the influence of algorithm parameters on the energy consumption and optimization effect of the algorithm is systematically analyzed by adjusting the algorithm parameters. The experimental results show that increasing the population capacity and the maximum number of iterations can effectively improve the optimization performance of the genetic algorithm. However, after the parameters are increased, there is still a certain probability that the optimization results are not ideal. At the same time, as the population capacity and the maximum number of iterations increase, the computational time of the algorithm increases significantly, which puts forward higher requirements for computing resources. Based on the above experimental results, this study sets the maximum number of iterations to 40 and the number of populations to 60 in order to achieve a balance between the optimization effect and the calculation efficiency and provide a reference for subsequent research and engineering applications.
4.4. Reinforcement Learning
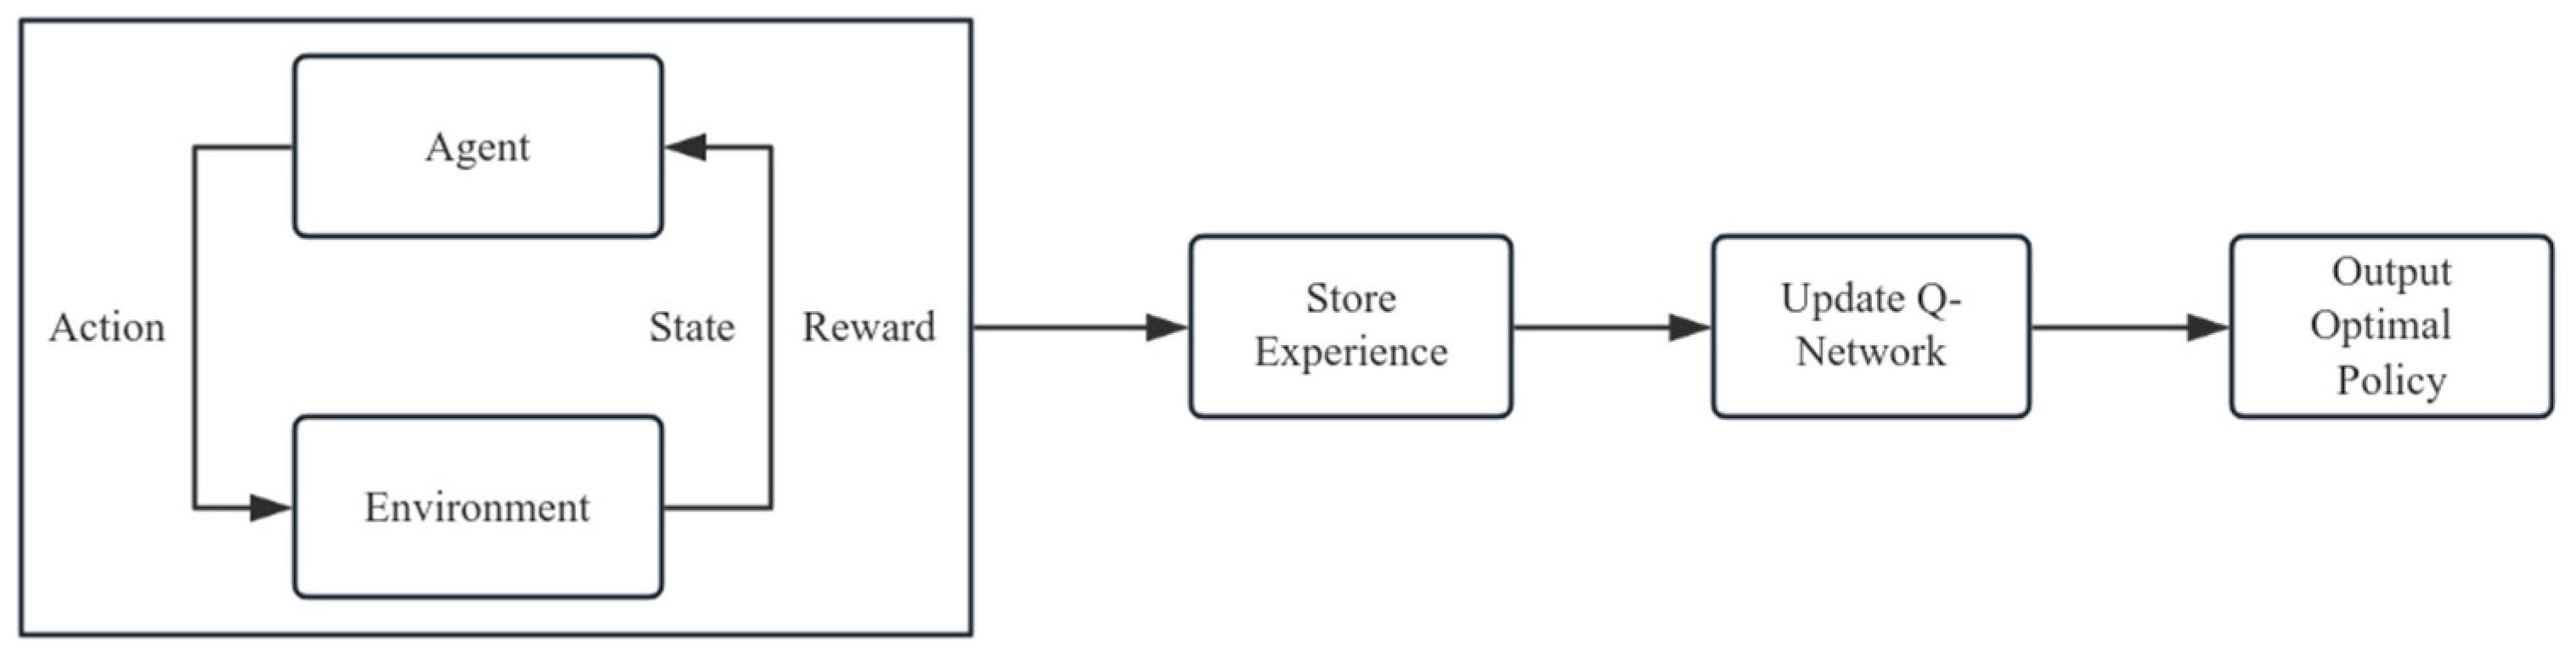
Reinforcement learning (RL) algorithms iteratively refine decision-making strategies through interactions with the environment, adapting to real-time system changes. Most reinforcement learning algorithms are based on five fundamental components: state, action, policy, state transition function, and reward. An agent learns to choose an action by observing the state and receiving rewards from the environment. The environment comprises everything external to the agent; it responds to the agent’s actions by transitioning to new states and providing reward feedback. By modeling this process as a sequential decision-making problem using a Markov Decision Process (MDP), reinforcement learning guides the agent to make optimal decisions that maximize cumulative rewards. In this paper, the DQN reinforcement learning algorithm is used to update the parameters of the policy network based on the value network, which is shown in
Figure 9.
Before applying the DQN algorithm to optimize water injection pipe network scheduling, it must be trained to handle multiple uncertainties. To this end, a large number of random states—generated based on actual operating data from the on-site pipe network system—were used as training environments. During training, the initial random action probability was set to 100% and reduced by 0.005% after each update, with a minimum probability of 10%. These three hyperparameters primarily affect the convergence speed of the training process. Their settings follow the recommendations in the relevant literature [
32], aiming to balance exploration and exploitation, effectively avoid local optima during training, and ultimately converge to an optimal dynamic scheduling strategy network. The average reward curve during the training period is shown in
Figure 10. It indicates that the algorithm gains substantial experience in the first 100 rounds, after which the reward increases rapidly and then continues to rise slowly with fluctuations, ultimately converging to the optimal dynamic scheduling strategy network.
During the training process of DQN, the cumulative reward obtained by an agent through continuous interaction with the environment typically shows an upward trend before eventually stabilizing. This behavior indicates that the agent has learned an effective strategy to minimize operating costs. However, DQN algorithms often exhibit high reward variance and volatility during training due to the inherent randomness involved in exploration and strategy formulation.
5. Analysis of Experimental Results
5.1. Implementation of the Algorithm in Connection with the Hardware
In this study, both the genetic algorithm and the reinforcement learning algorithm were developed in Python and encapsulated as independent software modules, which were then installed on a computer near the experimental bench. To ensure effective integration of the algorithms with the hardware, a programmable logic controller (PLC) was connected to the computer via a network cable, and dedicated control software was developed for precise hardware management. During the experimental operation, the researcher selects the preset intelligent control mode and inputs the total flow rate demand of the pipe network system through the encapsulated software on the computer. The software then calculates the required operating frequency for the two pumps and transmits these parameters to the PLC control interface, enabling the pumps to operate at the specified frequency. This process ensures seamless integration between algorithm optimization and hardware control, facilitating the automated and intelligent operation of the entire experimental system.
5.2. Comparison of Experimental Data
According to the rated operation of the centrifugal pump, seven different operating flow rates, i.e., 70%, 85%, 100%, 110%, 140%, 170%, and 200% of the rated flow rate of a single pump, were selected in this study in order to carry out a comprehensive experimental analysis, and four different control strategies, namely, rated operation, genetic algorithm control, reinforcement learning control, and constant-pressure control, were implemented under each of these operating conditions. Each scheme was run for the same time period under each operating condition, the energy consumption data under each control strategy were obtained by recording the meter readings, and the energy consumption for the operation under the four schemes was obtained, as shown in
Table 1.
The energy saving in this study refers to the difference between the energy consumption under rated operation and the energy consumption of the algorithm. The energy-saving effect is based on the ratio of energy saving and energy consumption under rated operation.
By comparing the energy consumption and rated operation energy consumption of the three intelligent control strategies, it can be seen that near the rated working condition of a single pump (22.5 m3/h), the system flow rate is close to the rated flow rate of the pump, and the operating efficiency of the pump is usually higher. However, even in this high-efficiency operating range, the intelligent control strategy still shows significant energy-saving efficiency. Among them, the energy-saving rate of the genetic algorithm under the single-pump rated condition is 23.98%, the energy-saving rate of reinforcement learning is 14.62%, and the energy-saving rate of constant-pressure control is only 6.43%. This shows that through the optimal control of the intelligent algorithm, the energy consumption can be further reduced when it is close to the rated working condition of the single pump. This is due to the fact that the algorithm can dynamically adjust the operating frequency of the pump according to the actual flow rate demand, thereby reducing unnecessary energy loss.
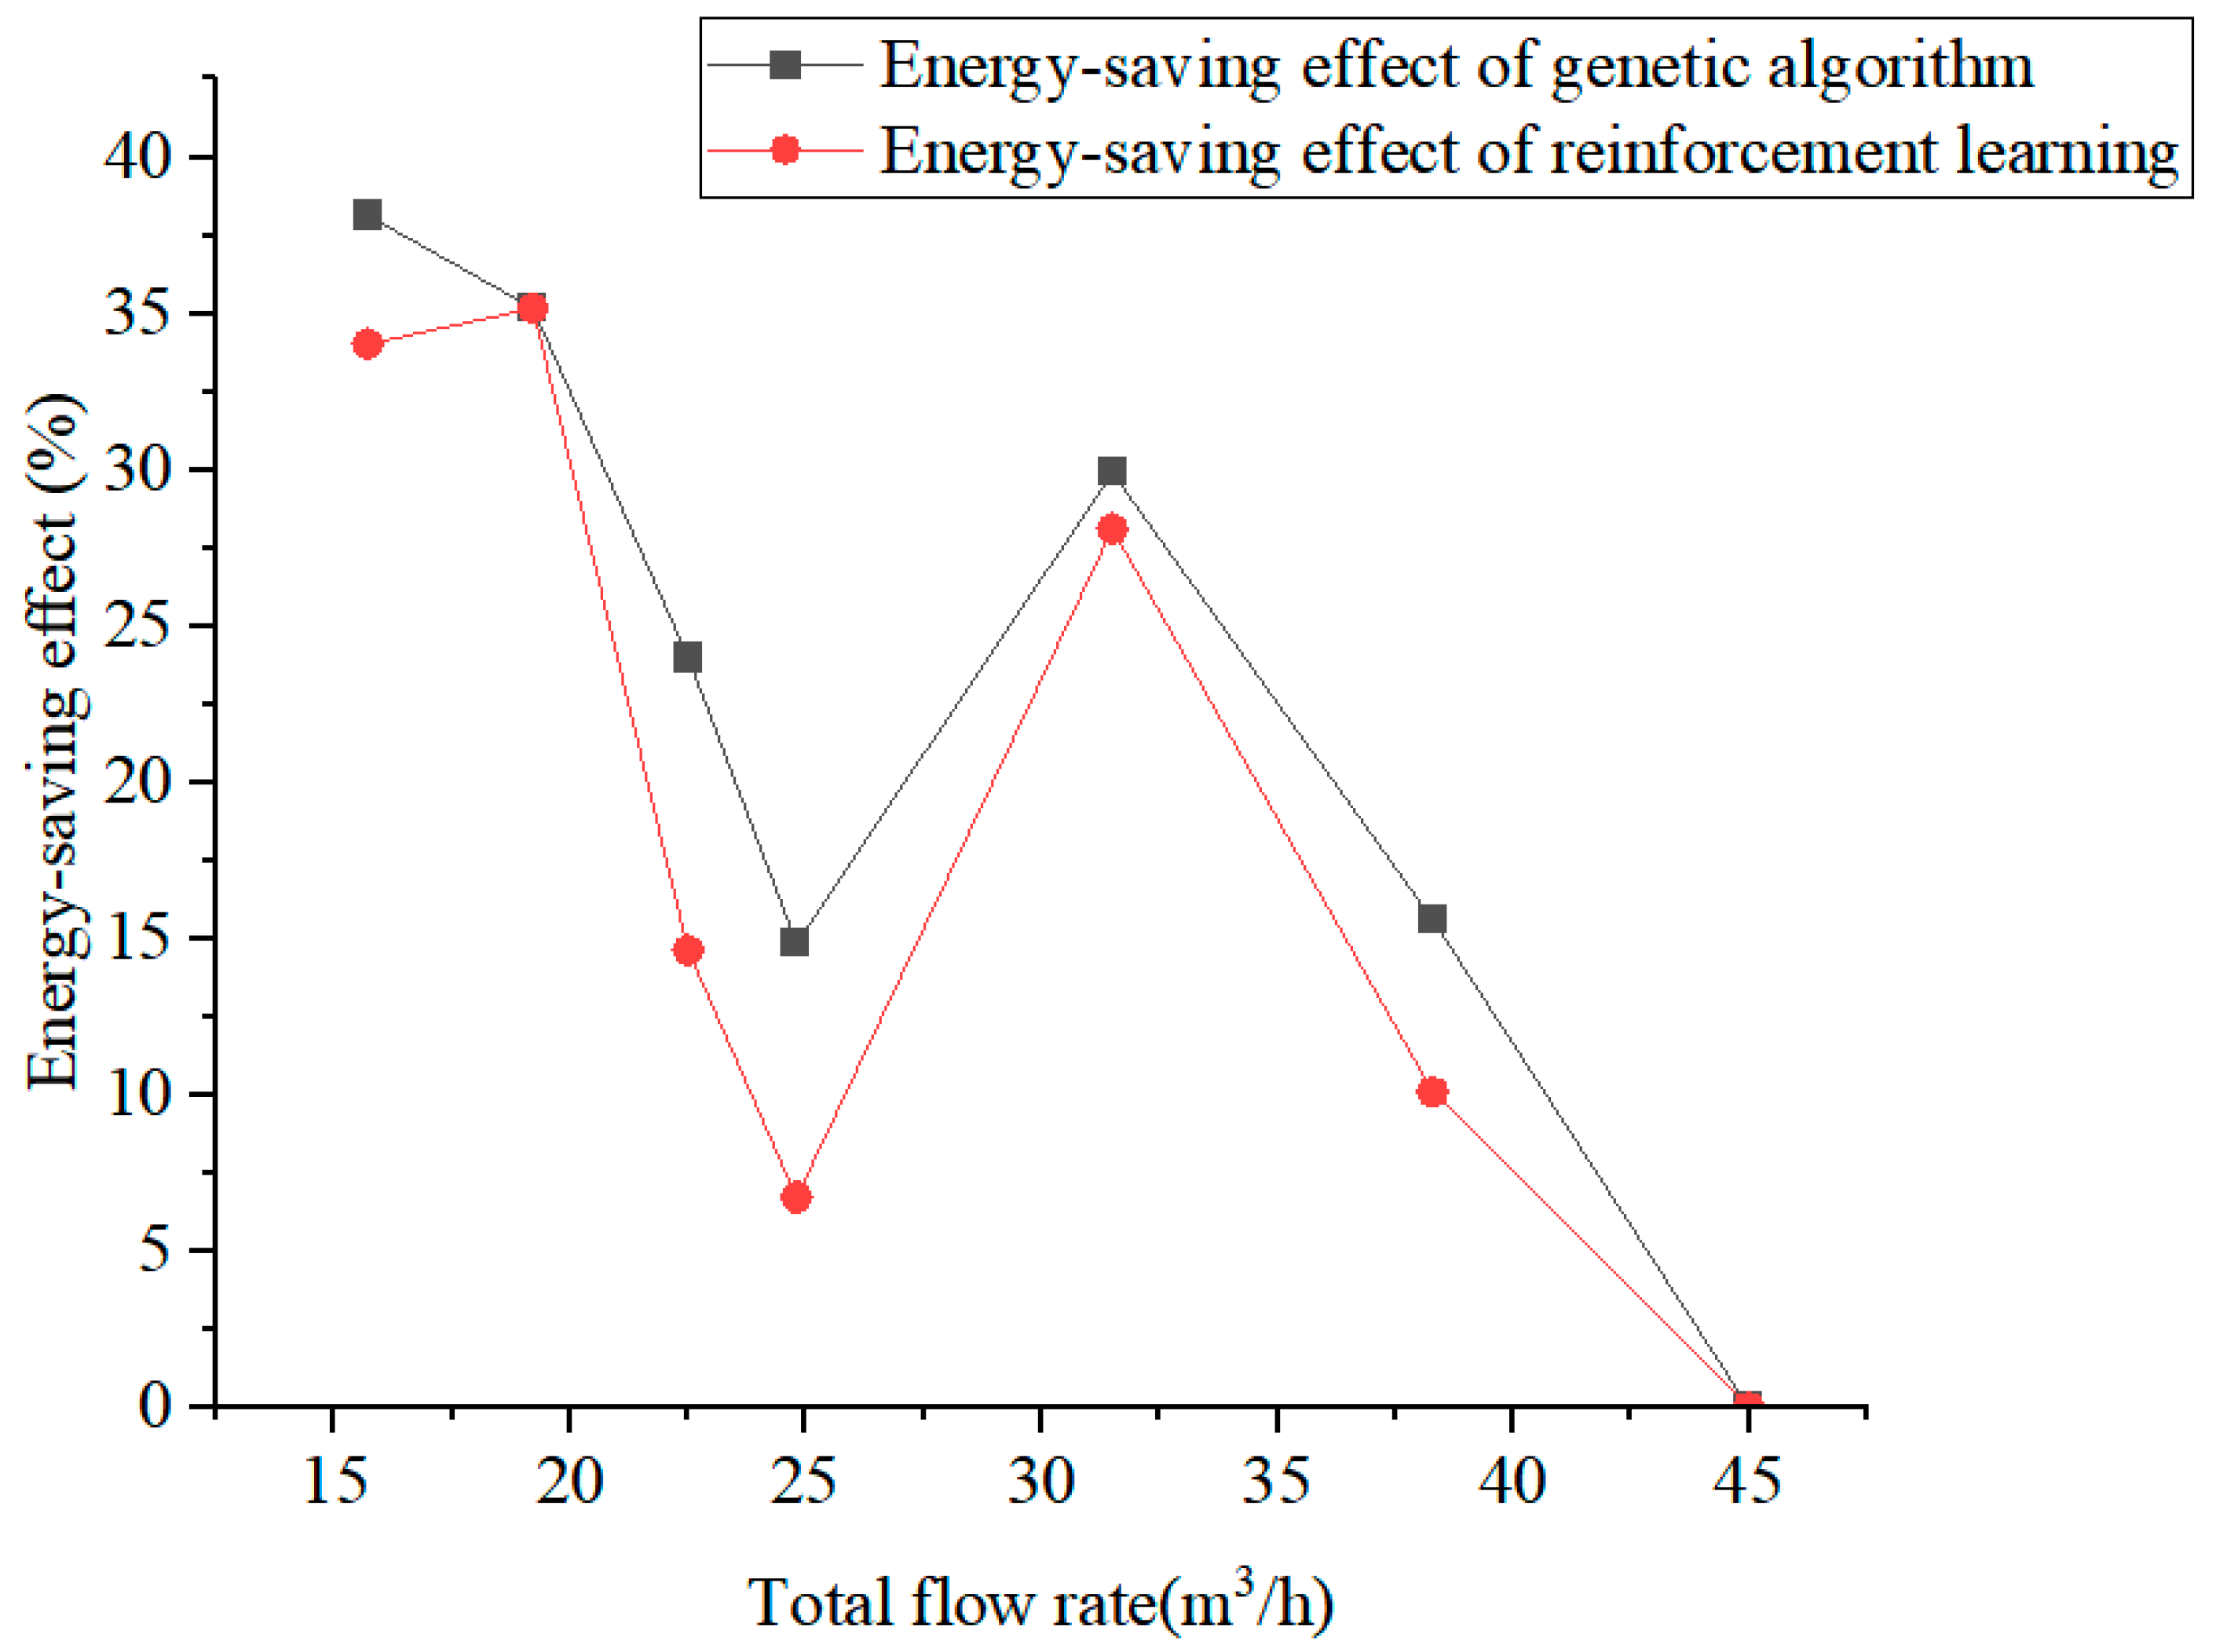
When the flow rate deviates from the rated flow rate of a single pump (such as 19.2 m3/h), the energy-saving effect is more significant. The energy saving rate of the genetic algorithm reaches 35.17%, and the energy saving rate of reinforcement learning also reaches 35.17%. This phenomenon shows that when the flow rate deviates from the rated flow rate, the intelligent control strategy can effectively reduce energy consumption by accurately adjusting the operating parameters of the pump, and its energy-saving effect is of great significance in practical applications. Especially in the design condition of the system operating flow rate deviating from the rated flow, intelligent control can achieve significant energy-saving optimization.
Under seven working conditions, the overall energy saving of the system using a genetic algorithm is 6.46 kwh, and the average energy-saving effect is 22.51%. The overall energy saving of the system using reinforcement learning is 5.26 kwh, and the average energy-saving effect is 18.39%. The overall energy saving of the system using constant-pressure control is 2.55 kwh, and the average energy-saving effect is 8.81%, as shown in
Figure 11.
5.3. Study of the Properties of the Different Algorithms
In this study, the genetic algorithm (GA), the reinforcement learning (RL) algorithm, and constant-pressure control were evaluated for their performance in optimizing the pipe network system. The GA demonstrated a significant energy-saving effect, achieving an average energy-saving rate of 22.51%, with the highest savings reaching 38.14% under a low flow rate. This superior performance can be attributed to its ability to dynamically adjust pump operating parameters based on actual flow rate demand, effectively reducing unnecessary energy consumption. The GA’s optimization process, which involves generating an initial population and iteratively improving solutions through selection, crossover, and mutation, ensures that the pump operation remains close to the most energy-efficient point. Additionally, the GA’s stability was enhanced by incorporating historical optimization schemes into the initial population, which improved the quality of the initial solutions and facilitated convergence to near-optimal results.
The RL algorithm showed considerable energy-saving potential, with an average energy-saving rate of 18.39%. The RL algorithm’s adaptive learning capability allows it to respond to changes in water demand and optimize pump operation in real time. However, its optimization effect was slightly inferior to that of the GA, primarily due to the inherent randomness in its exploration process and the complexity of the environment. The RL algorithm’s training process involves generating a large number of random states as training environments and updating the neural network parameters based on the experiences accumulated through interactions with the environment. Once trained, the RL algorithm provides extremely fast decision-making, making it suitable for real-time control applications.
In contrast, the constant-pressure control method had the lowest energy-saving effect, with an average energy-saving rate of only 8.81%. This traditional control strategy focuses on maintaining a stable pressure level regardless of the flow rate demand, ensuring the system’s reliability but not optimizing energy consumption based on actual flow rate. As a result, its energy-saving effect was relatively low, especially under a low flow rate, where significant energy savings could be achieved by adjusting the pump operating parameters.
In summary, the GA and the RL algorithm both demonstrated significant advantages over the traditional constant-pressure control method in terms of energy savings and adaptability to flow rate. The GA achieved the highest energy-saving effect and stability, while the RL algorithm provided faster decision-making and adaptability to real-time changes. These findings highlight the effectiveness and practicality of intelligent control strategies in the field of energy saving for water supply networks.
6. Conclusions
In this study, the energy consumption optimization effects of intelligent control strategies such as GA, RL, and constant-pressure control under different flow rates were systematically evaluated by constructing a circulating system experimental platform for simulating a water injection network. The results show that the intelligent control strategy has significant advantages in the field of energy saving of water injection networks, which provides a new theoretical basis and practical guidance for real-time optimal scheduling.
The GA performs well in energy saving, with an average energy-saving rate of 22.51% and a maximum energy-saving rate of 38.14% under a low flow rate. The GA dynamically adjusts the operating frequency of the pump by simulating natural selection and genetic principles, effectively reducing unnecessary energy loss. In addition, by introducing the historical optimization scheme, the stability and convergence speed of the GA are significantly improved.
The RL algorithm shows good energy-saving potential, with an average energy-saving rate of 18.39%. Its core advantage lies in its adaptive learning ability, which can respond to flow-rate changes in real time and optimize pump operation strategies. Although its optimization effect is slightly inferior to the GA, RL can provide fast decision-making after training, which is suitable for real-time control scenarios.
In contrast, the energy-saving effect of the traditional constant-pressure control method is limited, and the average energy-saving rate is only 8.81%. The main goal is to maintain the constant pressure of the pipe network rather than optimize energy consumption, so the energy-saving potential is not fully tapped under low flow rates.
In summary, the GA and the RL algorithm are superior to traditional constant-voltage control in terms of energy-saving effect, adaptability, and real-time performance. The GA performs well in optimization accuracy and stability, while RL has unique advantages in dynamic response and real-time decision-making. These research results not only provide a new solution for the real-time optimal scheduling of a water injection network but also lay a foundation for the further development of an intelligent water supply system.
This study provides a new solution and practical guidance for the real-time optimal scheduling of offshore water injection pipeline networks, especially in optimizing the control of the water injection process flow rate and improving energy efficiency, showing significant application potential. Through the optimal control of an intelligent algorithm, it can not only reduce the energy consumption of water injection system but also improve the operation stability and reliability of the system, which provides strong support for the efficient operation of the water injection system in offshore oil and gas fields. The analytical methodology and technical route of this study can also be applied to the application scenarios of urban civil water pipe networks or other fields.


