Article

Agroforestry Systems Enhance Soil Moisture Retention and Aquifer Recharge in a Semi-Arid Mexican Valley

by
Aldo Yair Pulido-Esquivel
1,
Jorge Víctor Prado-Hernández
2,*,
Julio César Buendía-Espinoza
2,* and
Rosa María García-Núñez
3
1
The Agroforestry Center for Sustainable Development, Universidad Autónoma Chapingo, Texcoco 56230, Mexico
2
Department of Soil Sciences, Universidad Autónoma Chapingo, Texcoco 56230, Mexico
3
Department of Agricultural High School, Universidad Autónoma Chapingo, Texcoco 56230, Mexico
*
Authors to whom correspondence should be addressed.
Water 2025, 17(10), 1488; https://doi.org/10.3390/w17101488
Submission received: 1 April 2025 / Revised: 6 May 2025 / Accepted: 12 May 2025 / Published: 15 May 2025
(This article belongs to the Special Issue Research on Soil and Water Conservation and Vegetation Restoration)

Abstract

Agroforestry systems (AFSs) have been recognized for their ecological potential, yet quantitative assessments of their hydrological functions in semi-arid regions remain limited. This study evaluates soil moisture retention and potential aquifer recharge in two agroforestry systems compared to a traditional rainfed maize system in the semi-desert region of Celaya, Mexico, where aquifer depletion is a growing concern. Field measurements during the 2022 rainy season included precipitation, soil moisture at multiple depths, and soil physical properties across seven vegetation covers. The results show significantly higher moisture content, improved uniformity, and enhanced recharge potential under tree species such as Bursera graveolens and Lysiloma divaricatum. These effects are attributed to vegetation cover, organic matter input, and reduced evaporation. This study provides empirical evidence supporting the integration of AFSs into regional water management strategies, offering a nature-based solution for aquifer recovery and climate adaptation in arid landscapes.

1. Introduction

Sustainable management of agroecosystems has become essential to mitigate climate change and biodiversity loss, particularly in semi-arid regions where water scarcity is intensifying. Agroforestry systems (AFSs), which integrate trees with crops or livestock, are widely acknowledged for their multifunctional benefits, enhancing soil quality, providing ecosystem services, and regulating hydrological cycles [1]. Research has shown that agroforestry can improve infiltration rates, reduce runoff, and increase aquifer recharge compared to conventional agriculture [2,3,4,5,6,7]. Under forest cover, soil porosity and moisture retention have been found to be improved in tropical and temperate zones [8,9,10].
However, these findings are mainly based on global case studies, and their relevance to arid and semi-arid environments remains limited, since ecosystems tend to respond differently due to the complex interactions among rainfall patterns, vegetation structure, and soil characteristics [1,11,12]. Mexico’s agroforestry systems are traditionally practiced by indigenous and rural communities and represent significant ecological and cultural reserves [13]. Nevertheless, hydrological research on Mexican AFS has been fragmented and often limited to specific soil parameters or crop performance. In other instances, agroforestry systems have not been directly assessed. Instead, infiltration rates have been inferred from hydrological balance models applied at the watershed scale. These watersheds typically exhibit a range of soil types, vegetation covers, and agricultural production systems, which adds complexity to isolating the effects of agroforestry practices [14,15,16,17]. In terms of soil moisture dynamics and aquifer recharge, there is a critical lack of long-term, integrative studies assessing how tree species composition, canopy structure, and spatial arrangements affect soil moisture dynamics. Murray-Nuez et al. [18] and Luna-Robles et al. [19] have addressed soil properties and infiltration at local scales, but a national synthesis by vegetation type or climate zone has not been attempted. Groundwater depletion is particularly severe in the semi-arid regions of Central Mexico [20,21], yet policy frameworks for recharge management remain uninformed by agroecological research.
Agroforestry configurations such as arboreta and intercropped systems have not been systematically compared with conventional monoculture plots under uniform soil, climate, and species conditions. The mechanisms by which specific species or canopy traits influence water retention and recharge remain poorly understood. In regions where aquifer levels are declining at an alarming rate, this limits the translation of agroforestry into water management policy.
This study aims to quantify soil moisture retention and potential aquifer recharge in the Celaya Valley under semi-arid conditions by evaluating two agroforestry systems and a conventional rainfed maize system. Agroforestry configurations differ in terms of vegetation composition and spatial arrangement. The hypothesis is that systems with greater canopy cover, such as those dominated by Bursera graveolens and Lysiloma divaricatum, will exhibit better soil moisture retention and greater groundwater recharge. The findings are intended to support the development and application of nature-based solutions for sustainable water management in arid and semi-arid Mexican agricultural landscapes.

2. Materials and Methods

2.1. Experimental Site

This study was conducted in the Experimental Field of the Forest, Agriculture, and Livestock Research Center (INIFAP), Bajío branch, located in Celaya, Guanajuato, central Mexico (20°34′ N, 100°48′ W), at an elevation of 1767 m above sea level. The climate is classified as semi-arid (Cwa), with annual precipitation ranging from 400 to 600 mm and average annual temperatures between 15 and 25 °C [22]. The soil type corresponds to vertisols, with high clay content, which affects infiltration and water retention capacities [23].
This area lies within the Celaya Valley aquifer zone, which is considered severely depleted. According to CONAGUA [20], this aquifer exhibited a mean annual drawdown of 1.77 m in 2013 and a cumulative overextraction between 386.58 and 440.78 Mm3 [21]. Groundwater constitutes the primary water source for irrigation and urban use in the region, making this site relevant for studying recharge potential under agroforestry systems.

2.2. Experimental Design

The experimental layout consisted of two agroforestry systems and a conventional control plot. The first agroforestry system (Ar) was a dense arboretum established with trees planted at 3 × 3 m spacing. The species composition included Prosopis laevigata (mesquite), Bursera graveolens (copal), and Leucaena esculenta (huaje). The second system (AIC) was an intercropped agroforestry configuration, where trees were spaced at 5 × 3 m and interspersed with maize (Zea mays). The AIC system included Prosopis laevigata, Lysiloma divaricatum (palo prieto), and Hesperalbizia occidentalis (palo blanco) as the main tree components. The control plot was a conventional rainfed maize field with typical regional management practices and a planting density of approximately 100,000 plants per hectare. The experimental setup is visually summarized in Figure 1.
The selection of tree species in each system was based on their adaptability to semi-arid environments, multifunctionality, and ecological relevance [24,25,26,27,28,29,30,31].

2.3. Measurement of Tree Species

On 15 September 2022, tree canopy diameter, height, and canopy were measured using a tape measure and a free mobile application called HabitApp [32]. Measurements were taken from five trees of each species at the same time of day (12:00 pm), from all selected trees, to avoid bias. The selected trees were those whose soil moisture was measured under their canopy, as well as five other trees near the measurement site.

2.4. Measurement of Soil and Climate Variables

Measurements at the experimental site were taken between 3 August and 12 October 2022.

2.4.1. Soil Characterization

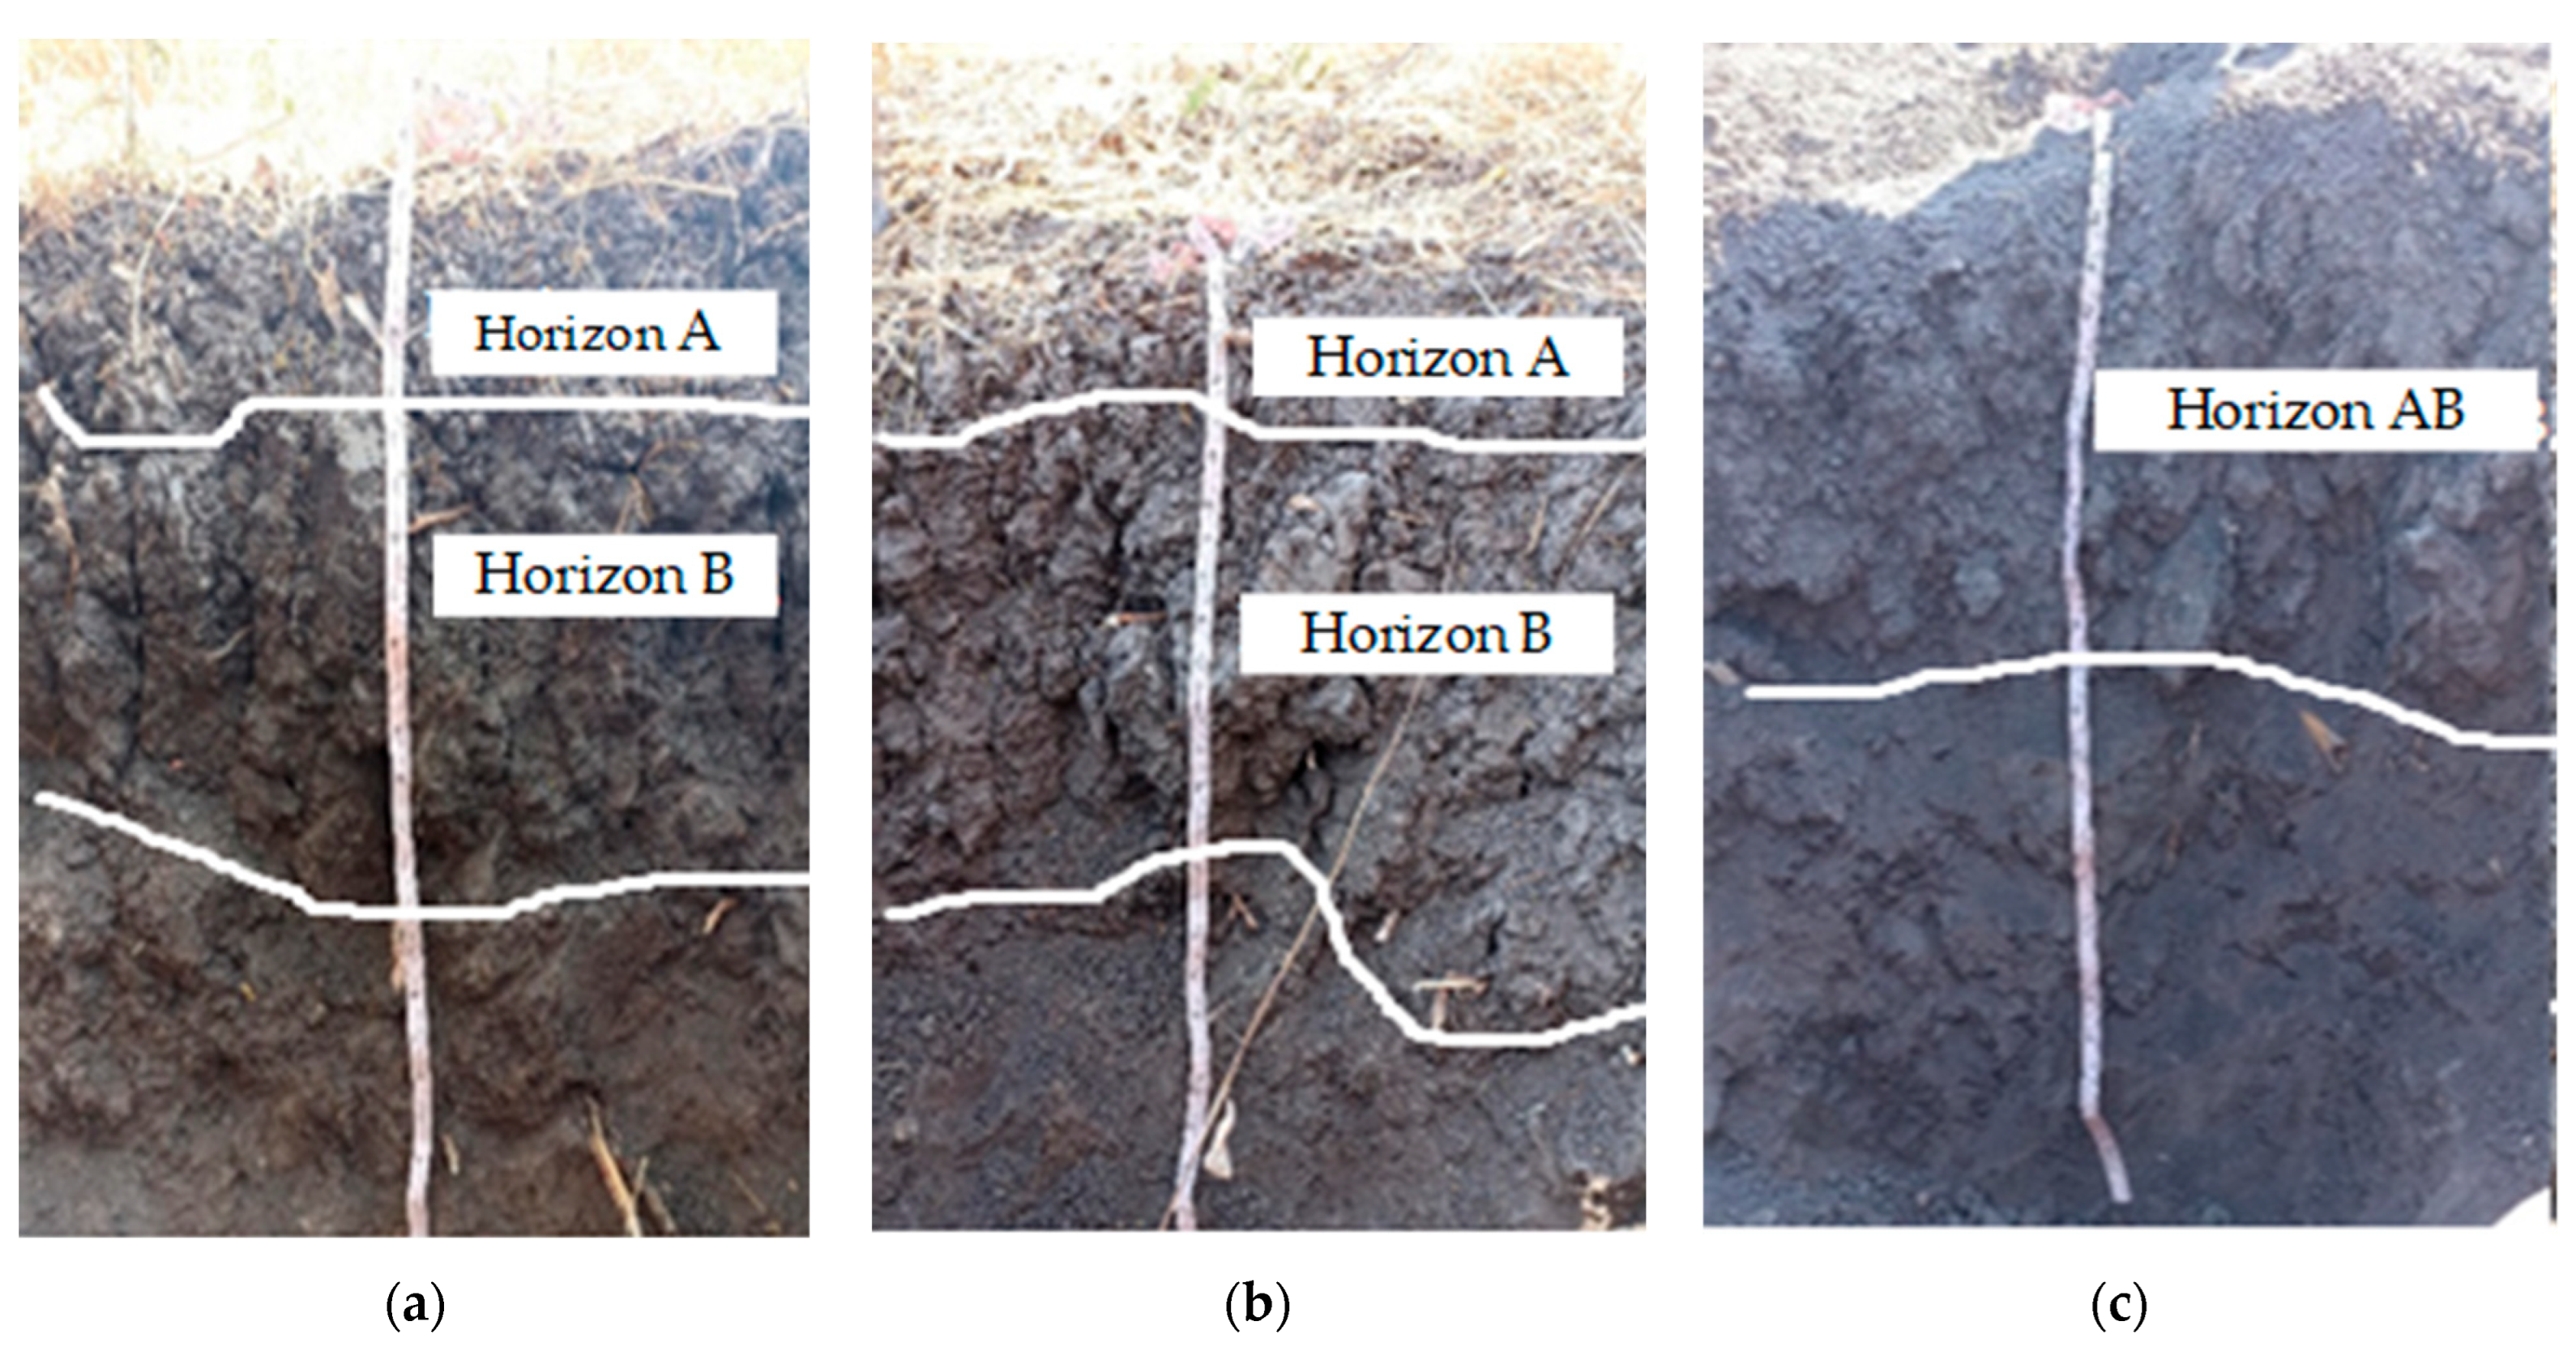
Soil samples were collected from both agroforestry systems and the control plot to characterize their physical and chemical properties. At each plot, soil pits were excavated to a depth of one meter, allowing for the identification and morphological description of the A and B horizons. From each horizon, composite samples were obtained using a 5 cm diameter auger, combining material from at least four different locations within each plot to reduce spatial variability. In the laboratory, texture was determined using a Bouyoucos hydrometer method [33], bulk density was measured through the core sampling method [34], and true density was calculated using a pycnometer. Organic carbon content was estimated using the Walkley–Black method [35], which quantifies the oxidizable fraction of organic matter. These methods were chosen due to their proven reliability in soil hydrology research [36,37], particularly under arid and semi-arid conditions, where infiltration and water retention are strongly influenced by soil texture and organic matter content [38,39,40].

2.4.2. Soil Moisture Content

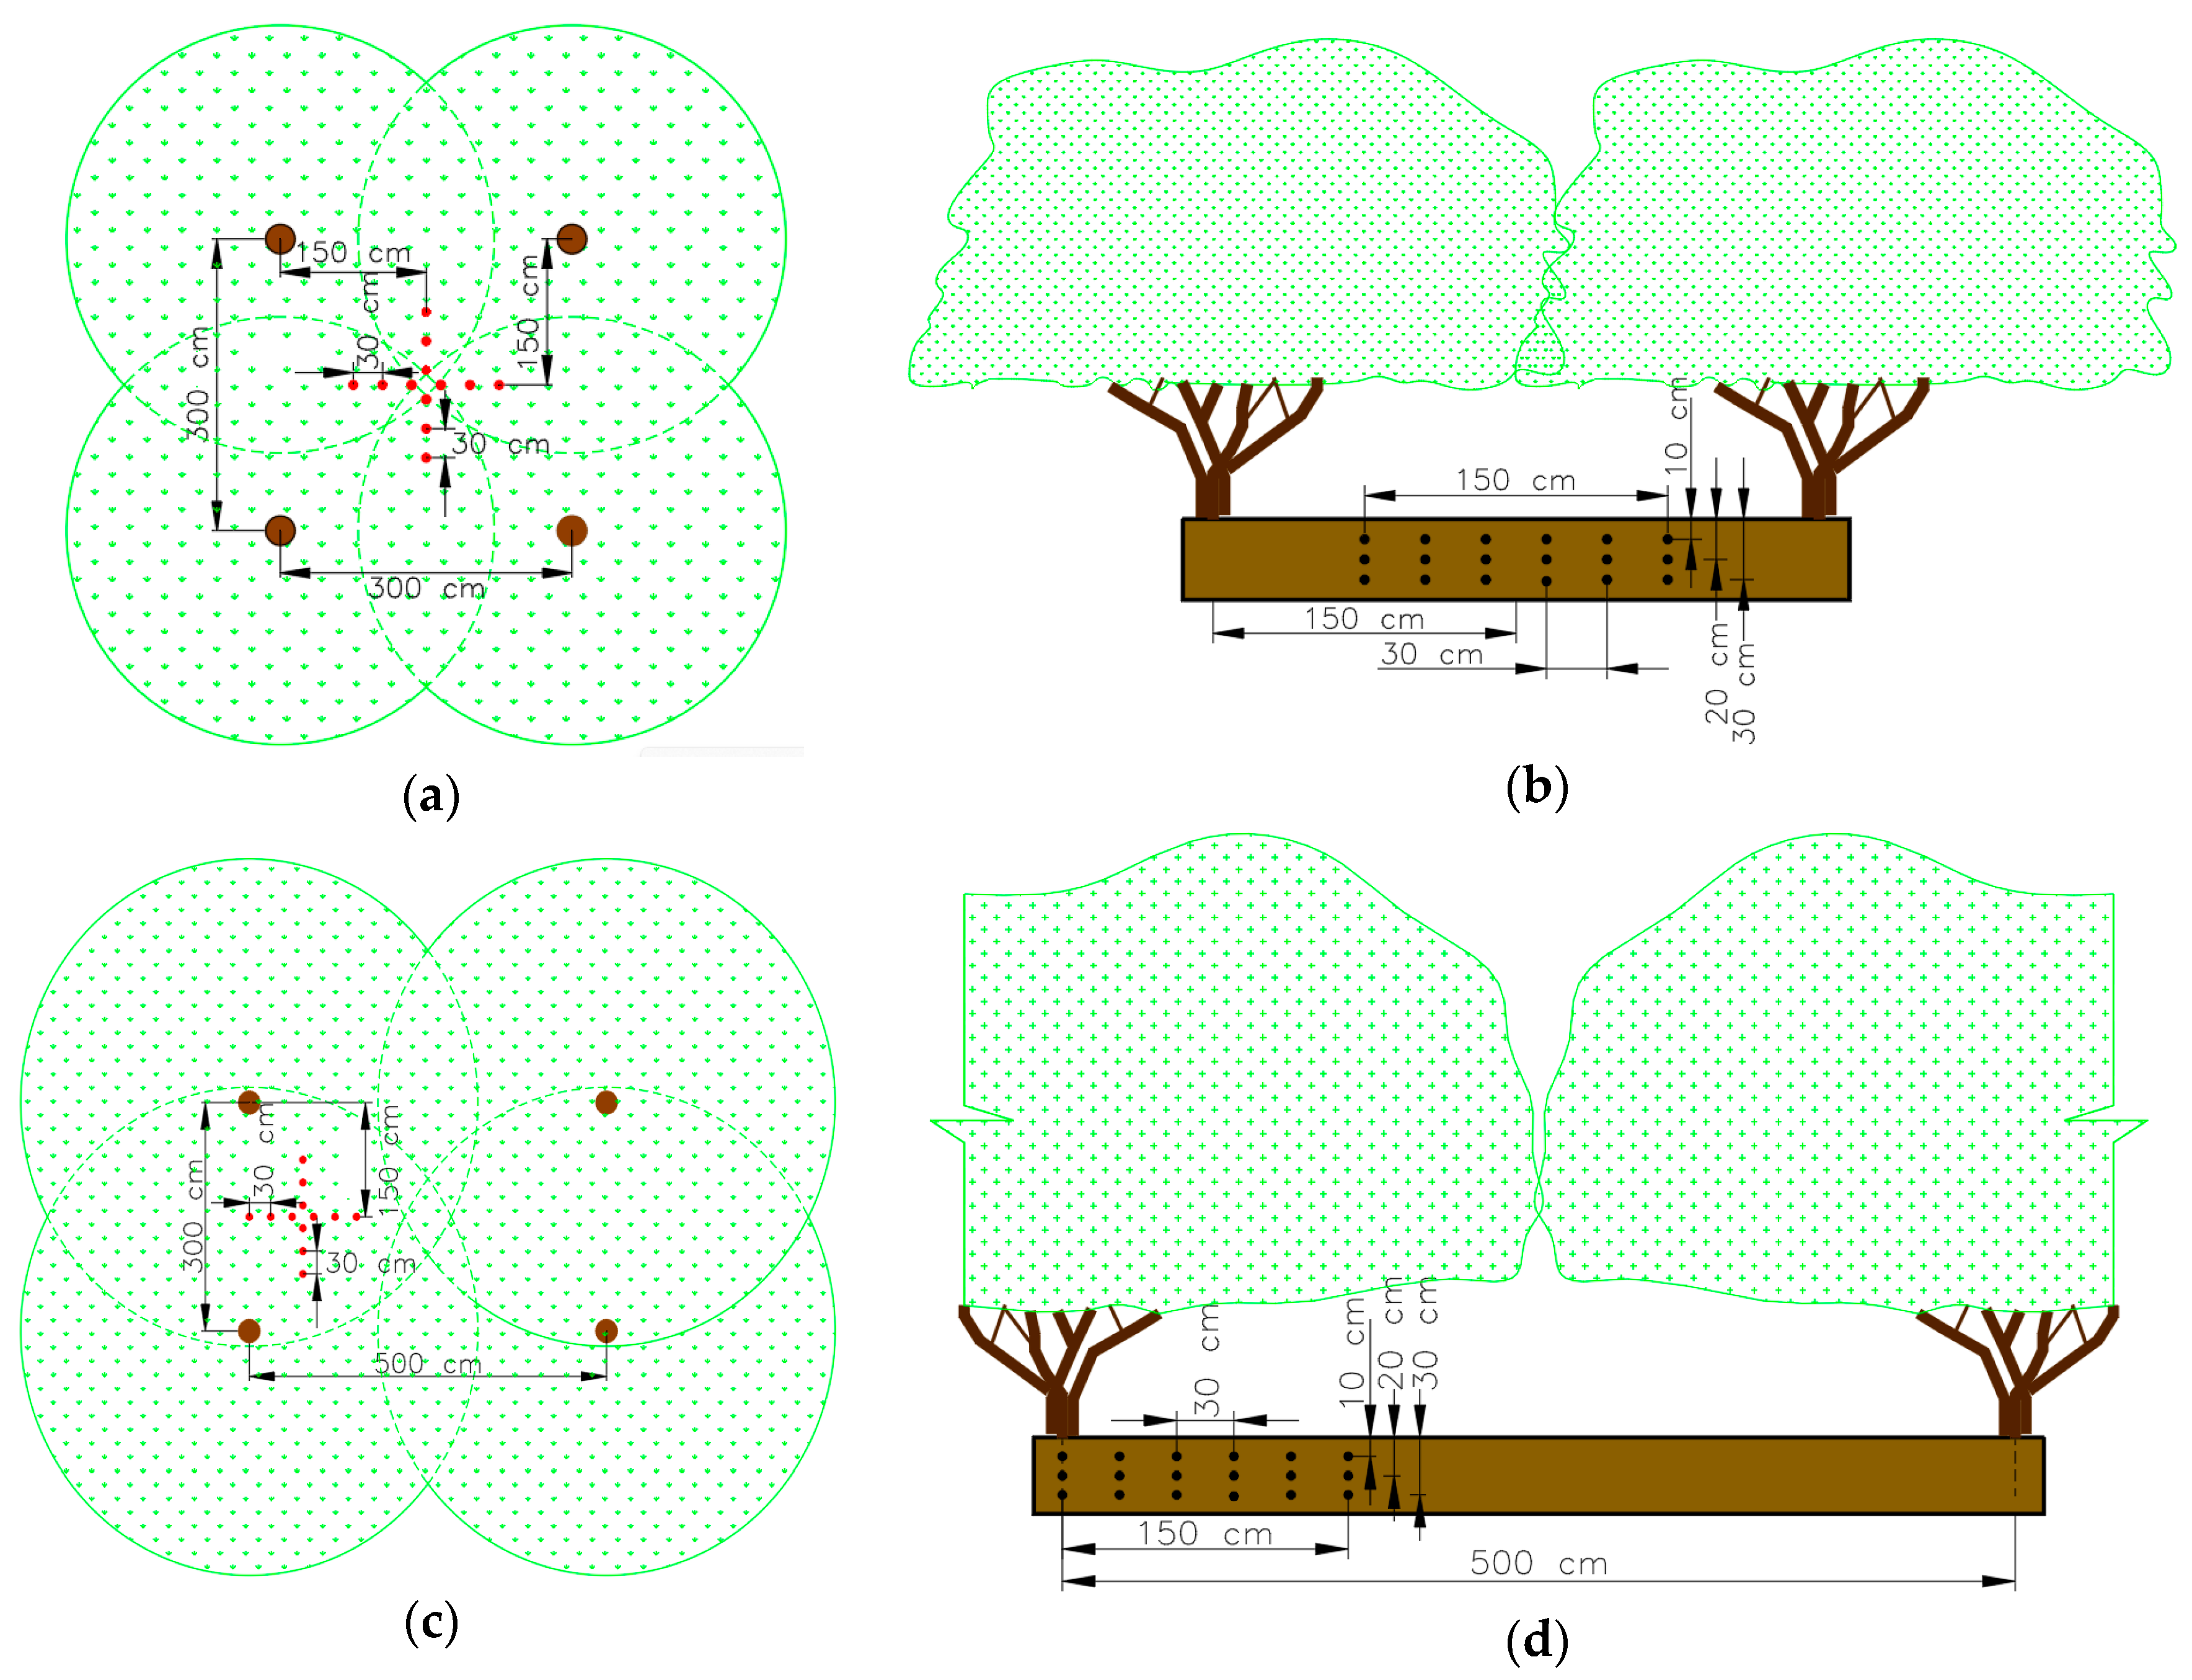
Soil moisture content was measured on five dates: 3 August, 17 August, 15 September, 28 September, and 12 October 2022, designated as dates 1, 2, 3, 4, and 5, respectively. Volumetric moisture content was measured using a FIEDSCOUT 300 ® Time Domain Reflectrometer (Spectrum Technologies, Inc. Aurora, IL, USA) with an accuracy of ±3% VWC (volumetric water content) at the intersection points of two rectangular, perpendicular grids (Figure 2a,c); 150 cm long and 30 cm deep in the dense agroforestry system (Figure 2b) and 500 cm long and 30 cm deep in the AIC agroforestry system (Figure 2d). Each mesh has 18 measuring points, arranged in three rows and six columns, separated by 10 cm and 30 cm, respectively. Due to the limitations of the measuring equipment and because it has been observed that the major lateral roots of species similar to those in the study are located within the top 30 cm of soil [41], moisture measurements were taken at depths of 10, 20, and 30 cm. Three measurements were taken for each agroforestry system, one for each tree species; in the dense system (Ar), measurements were taken under the cover of four adjacent trees of the same species (Figure 2a), while in the agroforestry system intercropped with crops (AIC), they were taken under the cover of two adjacent trees of the same species (Figure 2c). Moisture was measured in the control system in the center of the plot using two rectangular and perpendicular meshes; 120 cm long horizontally by 30 cm thick, with measuring points every 30 cm horizontally and every 10 cm deep.
To relate soil moisture behavior and potential aquifer recharge to precipitation, precipitation was recorded during the rainy season (summer) using a Davis Vantage pro-2® (Davis Instruments Corp., Hayward, CA, USA), weather station, model 6162, located less than two kilometers from the studied systems. The station has a discharge dipstick every 0.25 mm, with an accuracy of ±4% for rainfall intensities up to 50 mm h−1 and ±5% for rainfall intensities greater than 50 mm h−1.

2.5. Soil Moisture Distribution Uniformity

Christiansen’s uniformity coefficient was calculated to quantify soil moisture uniformity in the agroforestry systems and the control system:
C U C = 1 i = 1 n θ i θ n θ × 100
where  C U C  is the Christensen uniformity coefficient,  θ  is the average soil moisture,  θ i  is the average soil moisture of the i-th measurement site, and  n  is the number of measurement sites [42].

2.6. Potential Aquifer Recharge Depth

The potential aquifer recharge depth was calculated using the following equation:
L R P A = θ o b s θ c c × 1 c m   |   θ o b s θ c c
where  L R P A  is the potential aquifer recharge depth (cm),  θ o b s  is the average observed soil moisture, and  θ c c  is the soil moisture at field capacity.  θ o b s  was obtained by averaging the soil moisture under each vegetation cover, and  θ c c  was obtained from the texture and organic matter content [43].

2.7. Statistical Analysis

Soil moisture content was assessed at three depths (10, 20, and 30 cm) under seven vegetation covers (six from the agroforestry systems and the control), for five dates, averaging the 12 replicates at each depth and vegetation cover. To evaluate the effect of vegetation cover and soil depth on soil moisture content, a completely randomized design with an asymmetric two-factor combinatorial arrangement and Tukey multiple comparison with a p-value < 0.05 was used. Factor 1 was soil depth with three depth levels, and Factor 2 was vegetation cover with seven cover levels. Calculations were performed using Minitab 18 Statistical Sofware [44].

3. Results and Discussion

3.1. Characteristics of Tree Species

The tree species included in each agroforestry system presented distinct structural attributes that likely influenced their respective hydrological performances (Table 1). In the Ar system, Bursera graveolens and Leucaena esculenta exhibited high canopy coverage values (73.80% and 75.20%, respectively), despite having moderate crown diameters and heights (4.04 m and 3.83 m in diameter; 4.34 m and 3.90 m in height). These values suggest a compact, closed canopy that favors shading and reduces evaporation, but may also limit uniform rainwater infiltration due to higher interception [45,46].
In contrast, the AIC system included species such as Hesperalbizia occidentalis and Lysiloma divaricatum, which reached greater heights (6.00 m and 4.70 m) and have broader crown diameters (7.51 m and 6.25 m). These traits, combined with intermediate canopy coverage (~71%), suggest that the AIC system may allow more rain to reach the soil surface while still reducing evapotranspiration through partial shading [47]. Notably, Prosopis laevigata presented lower canopy coverage in the AIC system (58.05%) than in the Ar system (62.40%), reinforcing the hypothesis that the spacing and vertical structure in AIC favor infiltration and reduce canopy interception losses [48].
These morphological differences between the systems help explain the higher soil moisture and recharge values observed in the AIC plots. Therefore, beyond the presence of vegetation, it is the structural configuration and species-specific architecture that modulate hydrological function, supporting the central hypothesis of this study [49].

3.2. Soil Characteristics

Figure 3 shows the soil profiles of the three production systems, which illustrate the structural differences influenced by management practices. In the soils under agroforestry systems, a better aggregate structure was observed, characterized by angular aggregates in the A horizon and columnar structures in the B horizon. In contrast, the control system exhibited a more fractured structure, associated with long-term cultivation [50]. According to USDA classification [43], the soil texture in both A and B horizons of the three systems was clay, with values of up to 70.55% clay in the A horizon (Table 2). These findings are consistent with the classification of these soils as vertisols by González et al. [23].
The organic carbon content and bulk density varied between systems and horizons. The Ar system exhibited the highest organic carbon content in the A horizon (2.61%), followed by the AIC system (1.30%) and the control (1.04%). In the B horizon, values were lower across systems: 0.52% in Ar, 0.78% in AIC, and 0.26% in the control. Correspondingly, total porosity in the A horizon was 33.23% for Ar, 32.68% for AIC, and 28.90% for the control. In the B horizon, values were 30.01% in both Ar and control, and 32.01% in AIC.
A moderate-to-strong positive correlation ( r = 0.68 ) was found between organic carbon content and total soil porosity across both A and B horizons. This relationship supports the hypothesis that increased organic matter contributes to improved soil structural properties, particularly in semi-arid environments where aggregation and pore formation are strongly influenced by biological activity and organic inputs [51,52,53]. The higher porosity observed in the Ar and AIC systems may be attributed to the continuous deposition of organic matter via litterfall and root turnover, which improves aggregation and creates biopores [38,39,40]. In the control system, the relatively lower organic carbon but comparable porosity may reflect long-term tillage effects or structural alterations due to continuous cropping [39].
The decomposition of organic matter also leads to the formation of angular aggregates, particularly in the A horizon, enhancing porosity and water retention capacity. This effect is further supported by field observations and comparative studies, such as those conducted in the Tarim River Basin, China, where higher vegetation cover was linked to greater soil carbon and aggregate stability [38]. Moreover, the differences in porosity and organic carbon are directly reflected in soil moisture dynamics, as will be discussed in the following section.
These findings reinforce previous work emphasizing the central role of soil organic matter in water regulation under agroforestry systems in semi-arid regions [51,52,53]. Nevertheless, the magnitude of the correlation and the variability among systems suggest that these results, while significant, should not be overgeneralized to all semi-arid agroecosystems without considering differences in soil mineralogy, climate variability, and land-use history.
In addition to the structural indicators described, the hydraulic behavior of the soils was also evaluated (Table 3). The moisture content at saturation ( θ s ), at field capacity ( θ c c ), and at the permanent wilting point ( θ p m p ), the apparent density ( D a ), and the saturated hydraulic conductivity ( K s ) were estimated according to the pedotransfer functions proposed by Saxton and Rawls [42]. In the A horizon, the two agroforestry systems and the control displayed similar  θ s θ c c , and  θ p m p  values due to their shared clayey texture. However,  K s  differed notably: the control system exhibited the highest value ( ~ 2.5   cm   h 1 ), while the agroforestry systems showed a lower  K s  ( ~ 1.3   cm   h 1 ), possibly due to structural differences such as cracking under conventional tillage [50].
In the B horizon, the dense agroforestry system showed the highest  K s  ( ~ 1.0   cm   h 1 ), despite its higher bulk density ( ~ 1.43   g   cm 3 ) and slightly lower porosity, while the control system had the lowest  K s  ( ~ 0.7   cm   h 1 ). This suggests that, even under compacted subsurface conditions, agroforestry practices enhance soil hydraulic behavior, likely due to improved aggregation and biopore networks.
Although all soils share the same textural class, the observed variations in  K s  and  D a  highlight structural differences induced by organic matter inputs and vegetation cover. The agroforestry systems, especially the dense one, maintained higher levels of organic carbon, which contribute to greater aggregate stability and infiltration. These effects are not accounted for by the pedotransfer functions used, which omit the role of structure and vegetation. Thus, while model-based estimates are useful, they likely underestimate the functional improvements introduced by agroforestry. The benefits are directly observable in soil moisture data, which will be analyzed in the next section.

3.3. Behavior of Soil Moisture Content

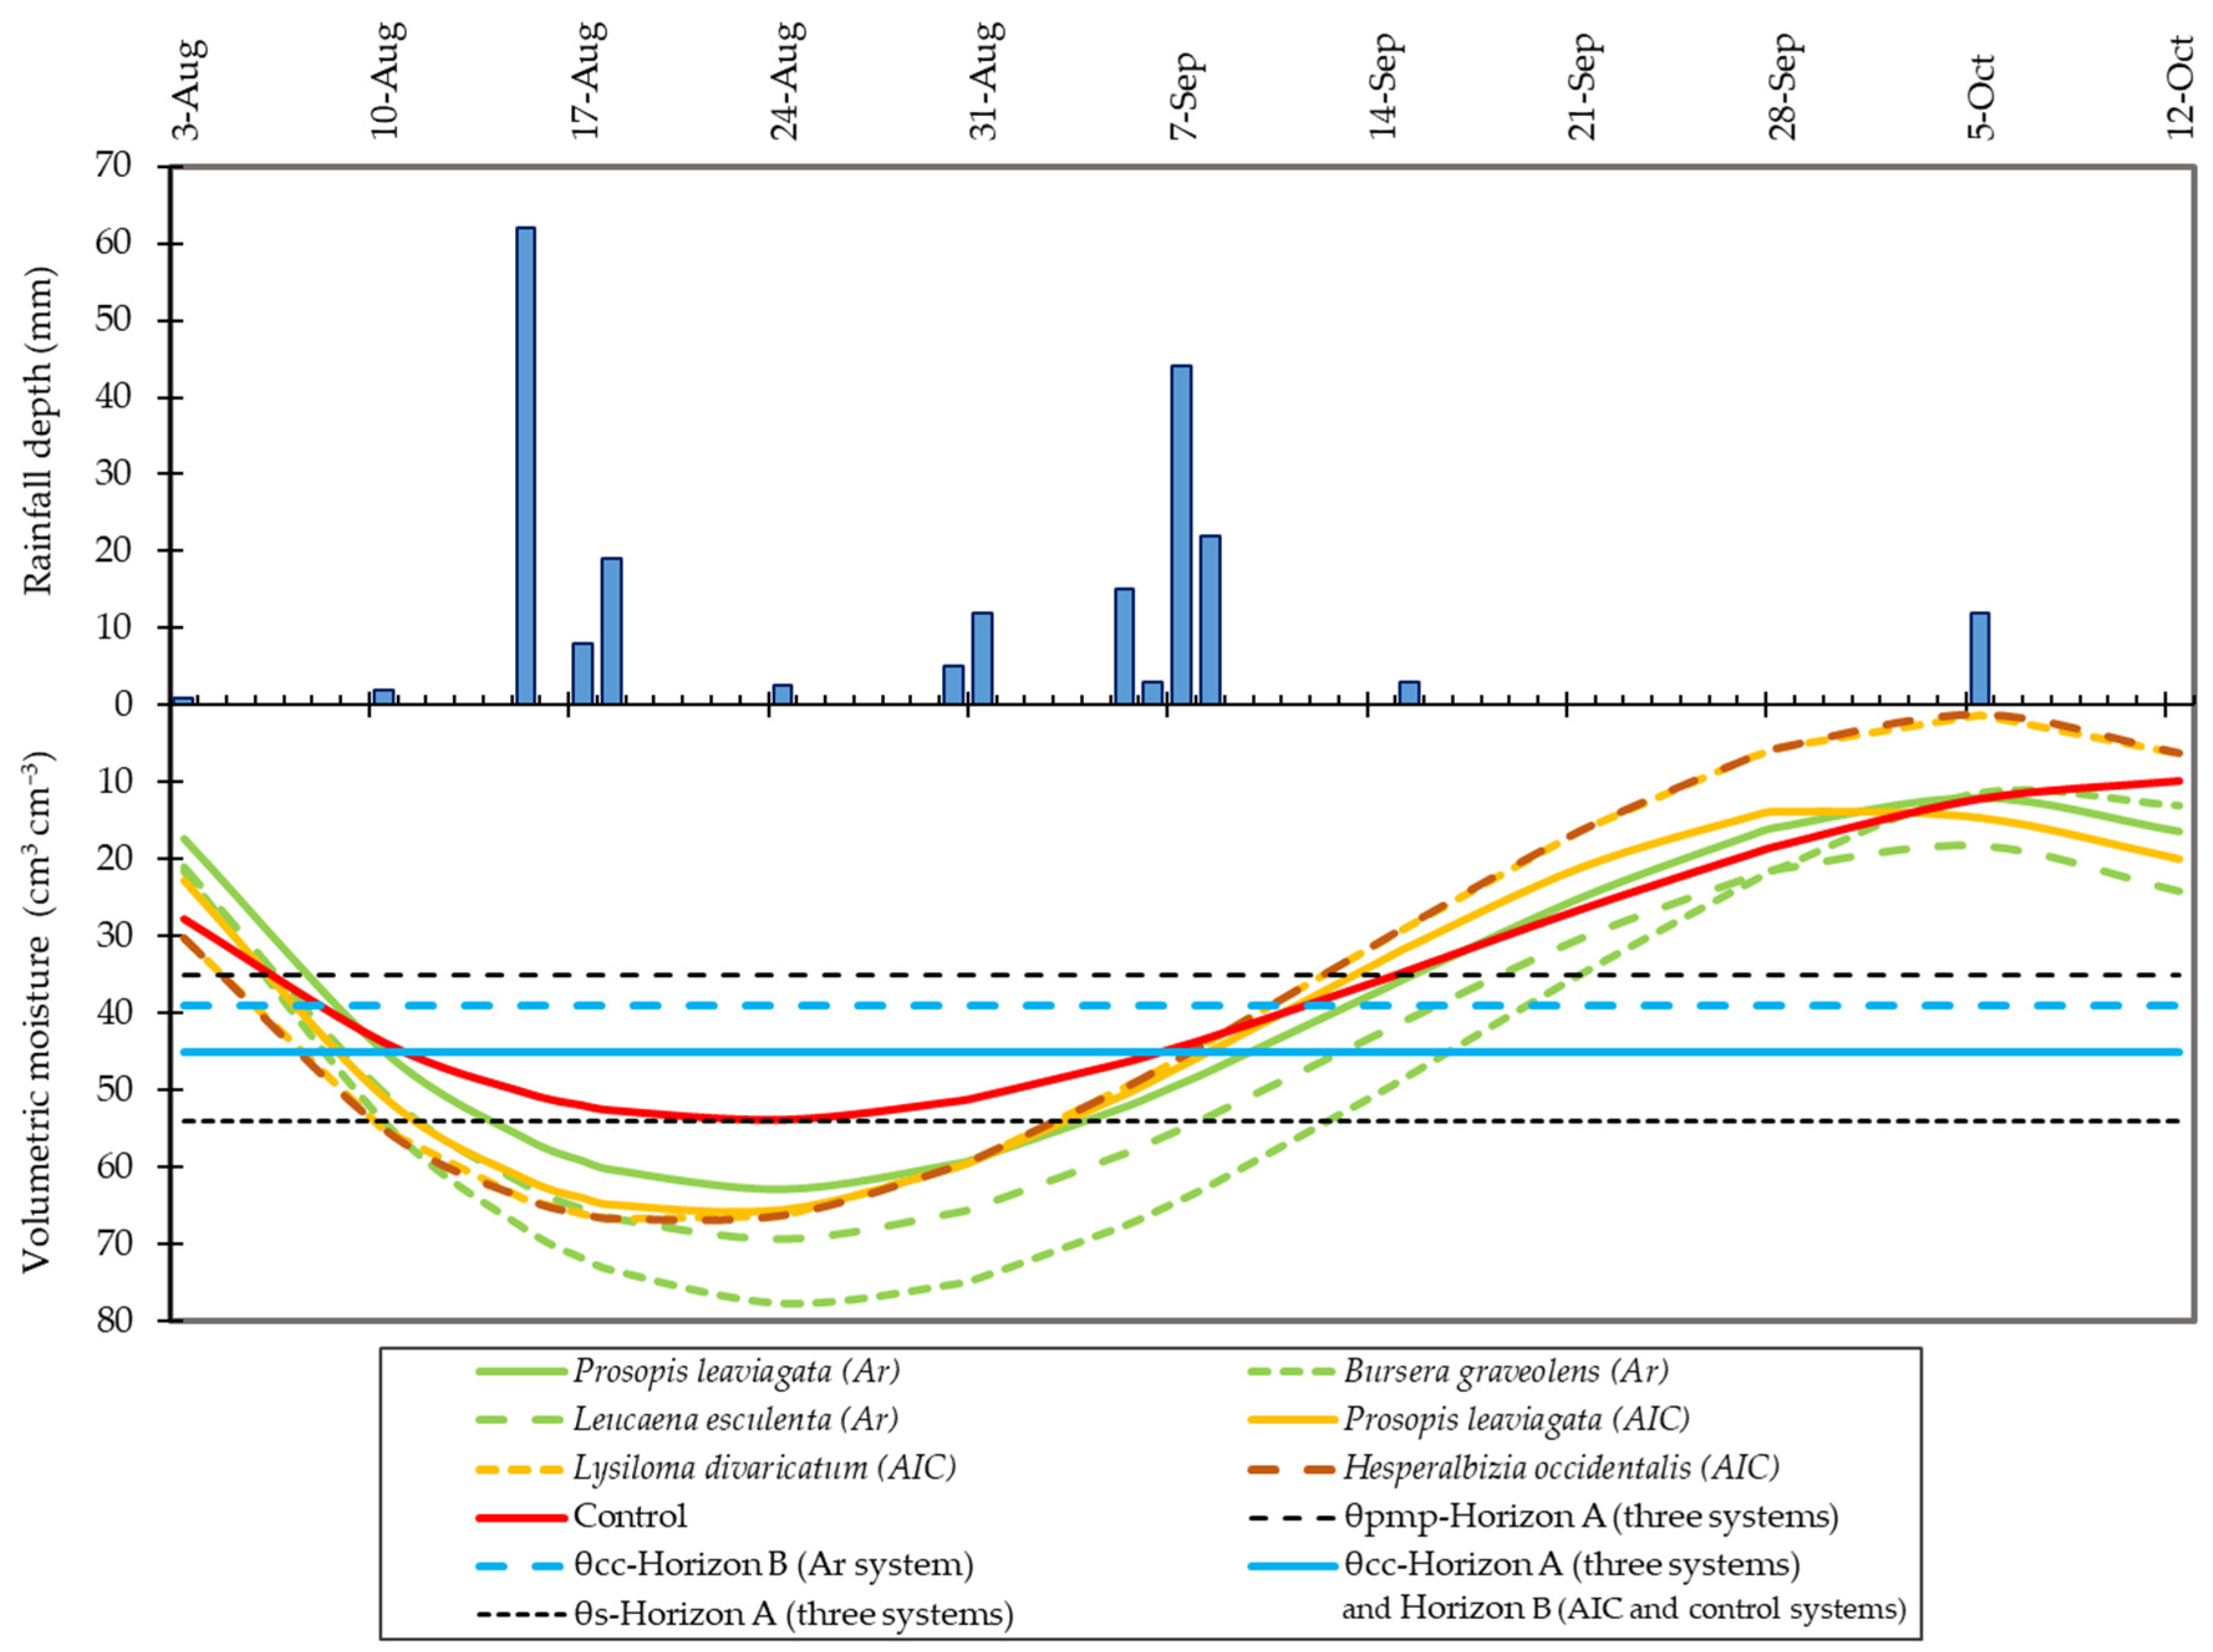
Figure 4 shows the behavior of the average daily moisture in the soil under different vegetation covers, for the two agroforestry systems and the control system, during the rainy season from 3 August to 12 October 2022. In general, in the control soil the moisture content was lower than in the soils under the different vegetation covers of the two agroforestry systems. Also, higher moisture contents were observed in the soil of the dense Ar agroforestry system than in the soil of the AIC agroforestry system. The soils reacted with an increase in moisture to the rain event of 15 August, the largest of the period analyzed; in all cases they exceeded the moisture value corresponding to field capacity ( θ c c ), with a longer period in the soils to the two agroforestry systems than in the control soil, but also the moisture content in the soils of the agroforestry systems exceeded the value corresponding to the saturation value ( θ s ) obtained from Saxton and Rawls [43].
As seen in Figure 4, the behavior of moisture in the soil is not consistent with the presence of rain on some dates. The above is explained because in some cases moisture measurement days (3 and 17 August, 15 and 28 September, and 12 October) did not come immediately after a rain event, so its immediate effect is not shown. In this way, on 3 August, an increase in moisture appears because there was precipitation that day and on previous days, then the increase was sustained until reaching a maximum value in the measurement taken on 17 August due to the precipitation on that day and the previous days (15 and 16 August). The moisture subsequently decreased because it was measured until 15 September, and the effect of the precipitation from 5 to 8 September was not detected, since a considerable period of time occurred between the dates of moisture measurement. Then, the moisture decreased, because until the next moisture measurement date (28 September) there was no precipitation. Finally, an increase in moisture was recorded on 12 October due to the rainfall on 5 and 6 October.
In the dense Ar system, Bursera graveolens cover had the highest moisture content, followed by Leucaena esculenta and Prosopis leaviagata. In the AIC system, the soil under Prosopis leaviagata cover was also the one with the lowest moisture. The moisture content of the soil under Bursera graveolens cover was higher than the moisture under Prosopis leaviagata cover because Bursera graveolens cover is the second densest after Leucaena esculenta cover, and also the trees are short, which favors the reduction of evapotranspiration [54]. In contrast, the moisture content under Prosopis leaviagata cover was the lowest of all covers, largely because its cover is lower, allowing more solar radiation to pass through, resulting in greater evapotranspiration and greater soil moisture loss [55]. In the AIC system, being more open and having greater exposure to the sun, the trend is that the moisture content in the soil was lower compared to the denser Ar system, in which more moisture is retained, which could be advantageous or disadvantageous depending on the intended application of the system [56,57].

3.4. Uniformity of Moisture Distribution in the Soil

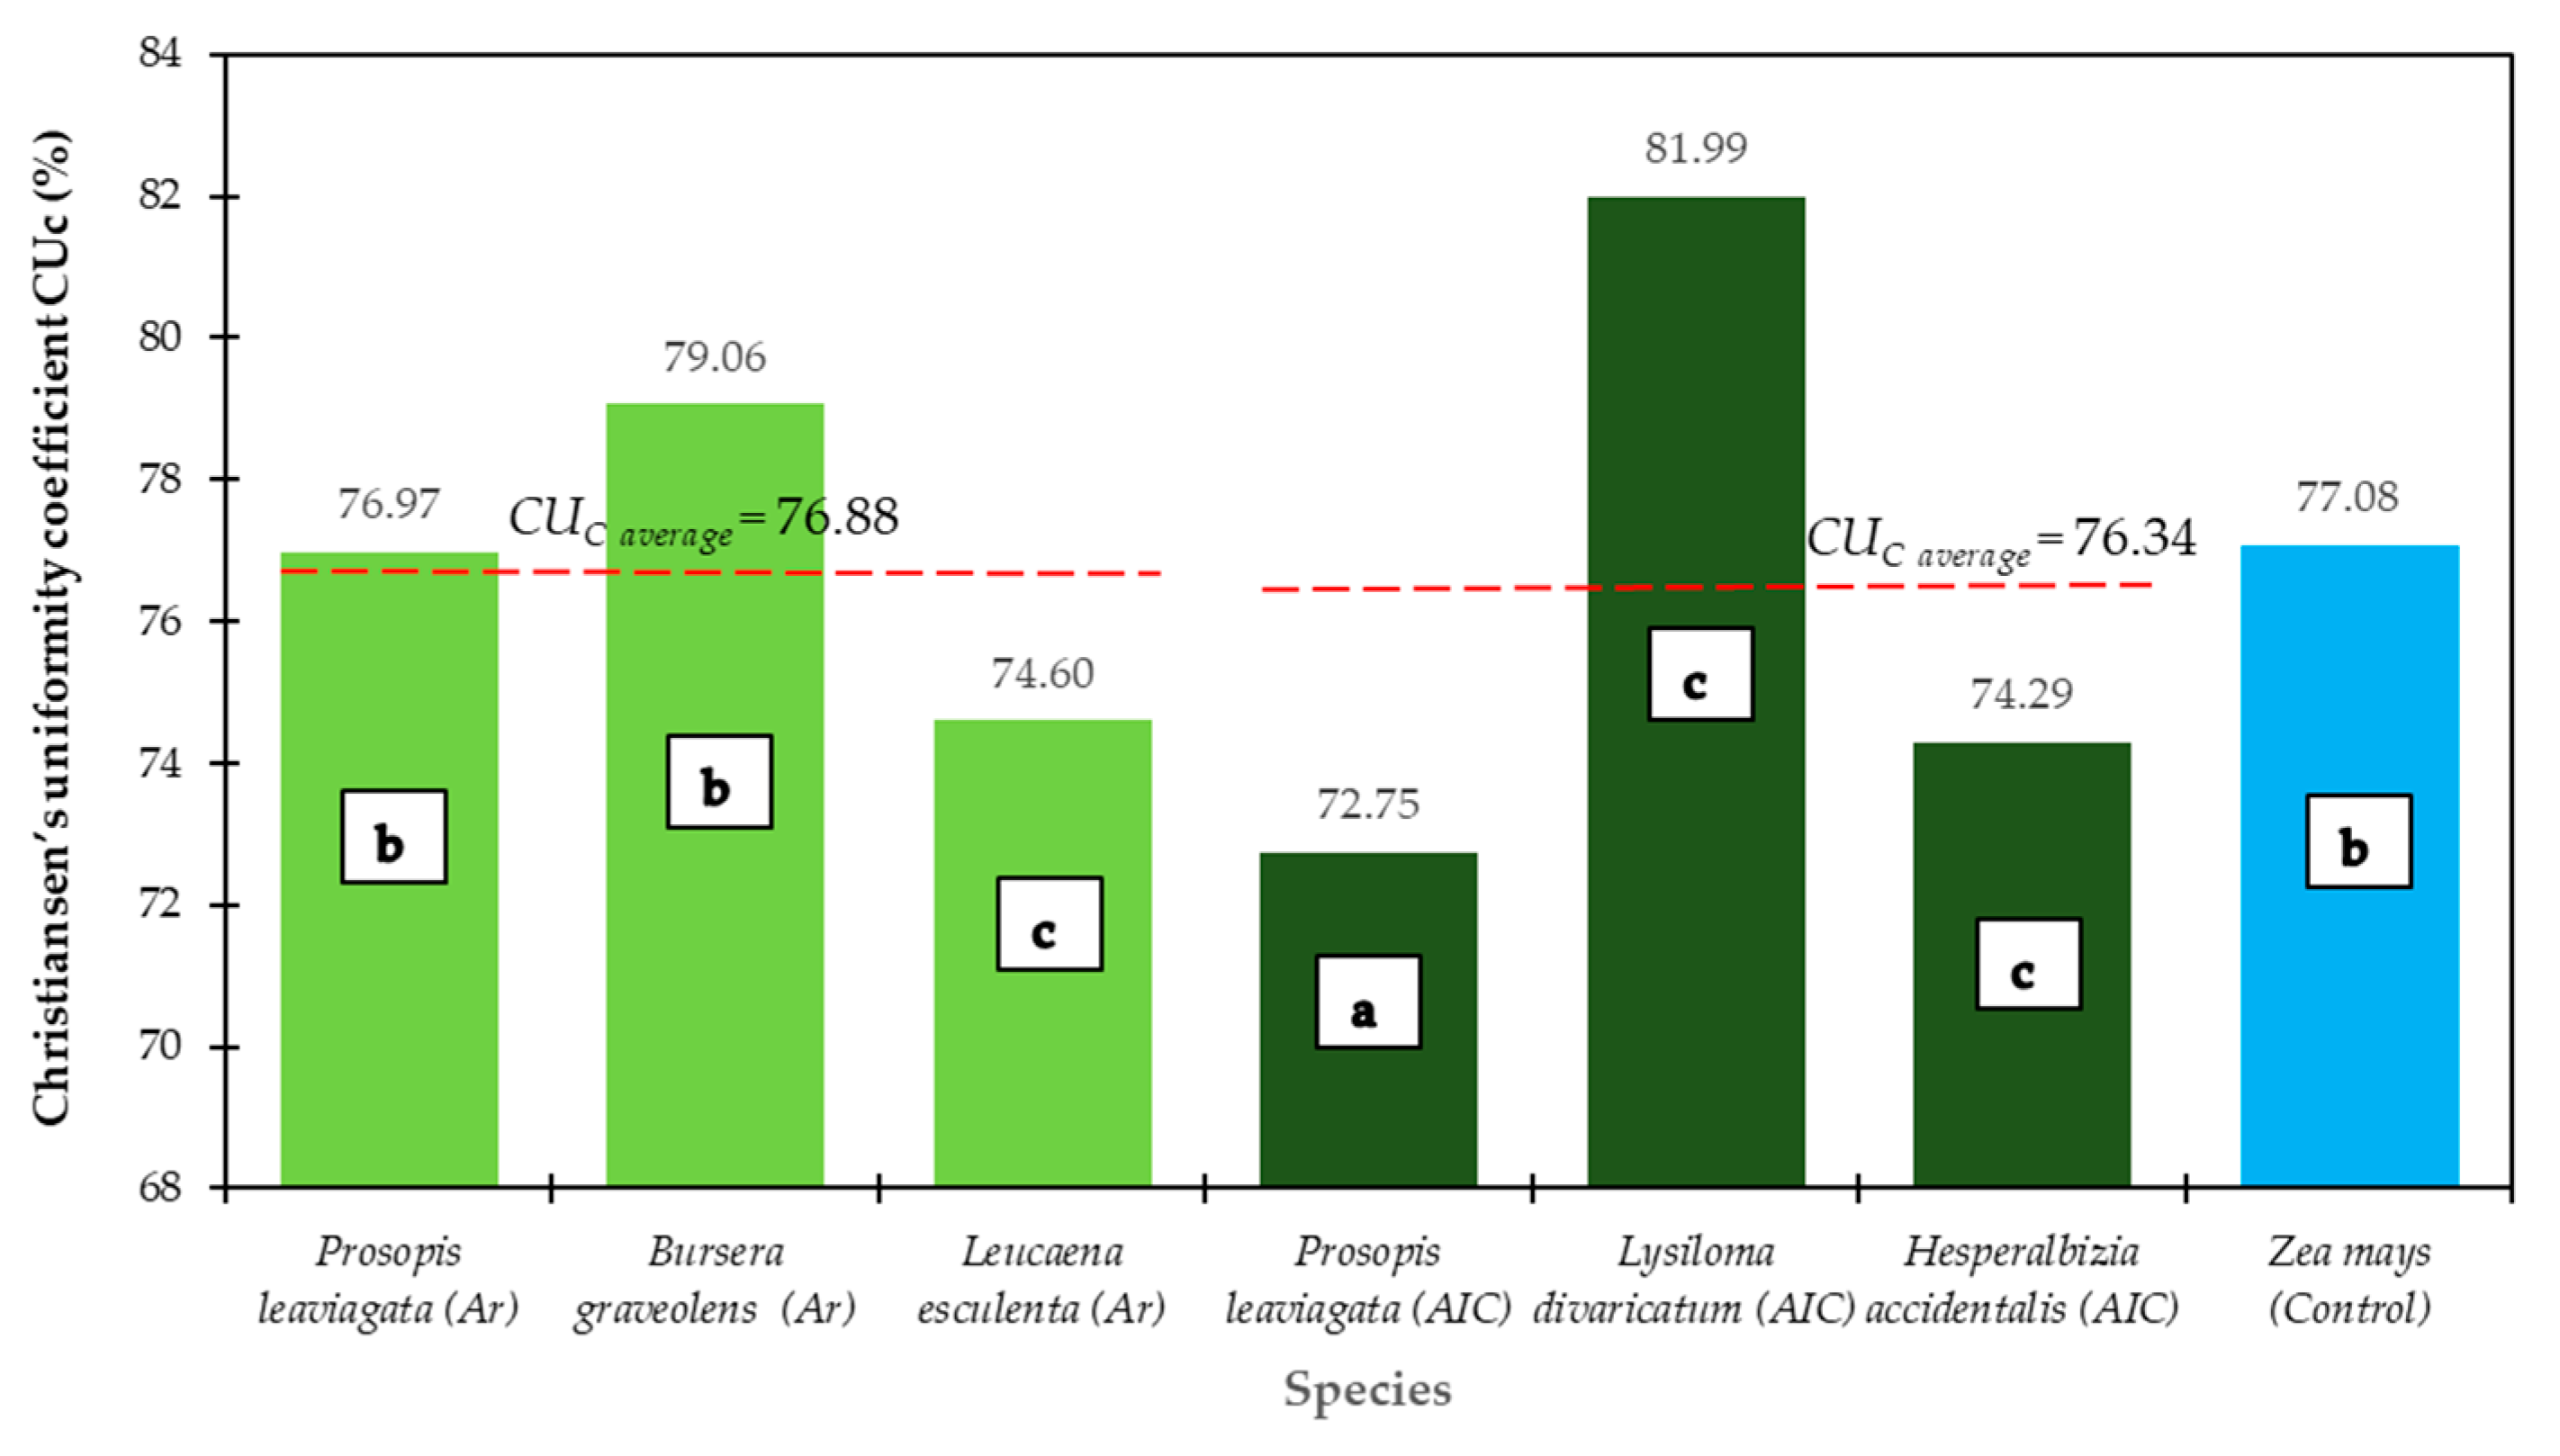
Figure 5 shows the average uniformity coefficient of the distribution of the soil moisture for all vegetation cover in the three production systems between 4 August 2022 and 12 October 2022, demonstrating significant statistical differences in the three systems studied. The dense agroforestry moisture (Ar) under Prosopis leaviagata cover and under Bursera graveolens cover did not present statistical differences with the control soil, but they did present differences with the moisture under the Leucaena esculenta cover in Ar system and with the moisture under the cover of the three species in the AIC system. The moisture under Leucaena esculenta cover in the Ar system did not present significant statistical differences with Prosopis leaviagata and Herperalbizia occidentalis cover in the AIC system, but did with Lysiloma divaticatum in AIC system. In the Ar system, Bursera graveolens cover presented the greatest uniformity of soil moisture distribution (79.56%), followed by Prosopis leavagata (76.97%) and Leucaena esculenta (74.60%, which has some correspondence with its dendrometric measurements (Table 1); Bursera graveolens, being a species with a larger leaf size than the other species in the Ar system, exhibits greater buffering of soil moisture [27]. In the intercropped agroforestry system (AIC), Lysiloma divaricatum presented the greatest uniformity of moisture distribution at 81.99%, followed by Herperalbizia occidentalis at 74.29% and the Prosopis leaviagata at 72.75%; these data show some correlation with the vegetation cover and morphology results presented in Table 1 [24,29]. The highest values were found for Lysiloma divaricatum cover in the AIC system and Bursera graveolens cover in the Ar system, which can be associated with the fact that they are species that present the greatest cover and crown diameter, thereby reducing evaporation from the surface layer of the soil. In the control system, the distribution uniformity was 77.98%. This result, which is greater than in the soils under some species cover in the two agroforestry systems, may be due to the fact that the corn crop had high cover during the study period, preventing evaporation of the surface layer of the soil, thereby promoting greater vertical moisture uniformity. In general, the average moisture distribution uniformity in the soil was similar in the three production systems: 76.88% in the Ar system, 76.34% in the AIC system, and 77.08% in the control system, with a standard deviation of 0.38%.
The results in Figure 4 and Figure 5 show that the species of Bursera graveolens in the Ar system and Lysiloma divaricatum in the AIC system are the ones that generate more water retention in the soil and with a more uniform distribution than the rest of the tree species and the control.

3.5. Potential Recharge to the Aquifer

There is a significant difference for potential recharge on the dates of greatest precipitation, which were 15 August 2022 and 7 September 2022. The greatest potential recharge of water to the aquifer occurred under Bursera graveolens cover (25.98 cm cm−1), followed by Leucaena esculenta cover (19.77 cm cm−1) and Prosopis leaviagata cover in the Ar system (14.06 cm cm−1). In the intercropped system (AIC), the highest potential water recharge to the aquifer occurred under Lysiloma divaricatum and Hesperalbizia occidentalis cover (with 23.88 and 23.47 cm cm−1, respectively), followed by Prosopis leaviagata cover (21.45 cm cm−1). Bursera graveolens, Lysiloma divaricatum, and Herperalbizia occidentalis cover are those that generated the greatest potential recharge to the aquifer, and the least recharge occurred in the control plot that does not have tree cover. In general, the AIC system reached the highest average potential recharge to the aquifer with 22.93 cm cm−1, followed by the Ar system with 19.93 cm cm−1, and the control system with 9.64 cm cm−1 (Table 4).

3.6. Relationship Between Moisture Behavior and Vegetation Cover

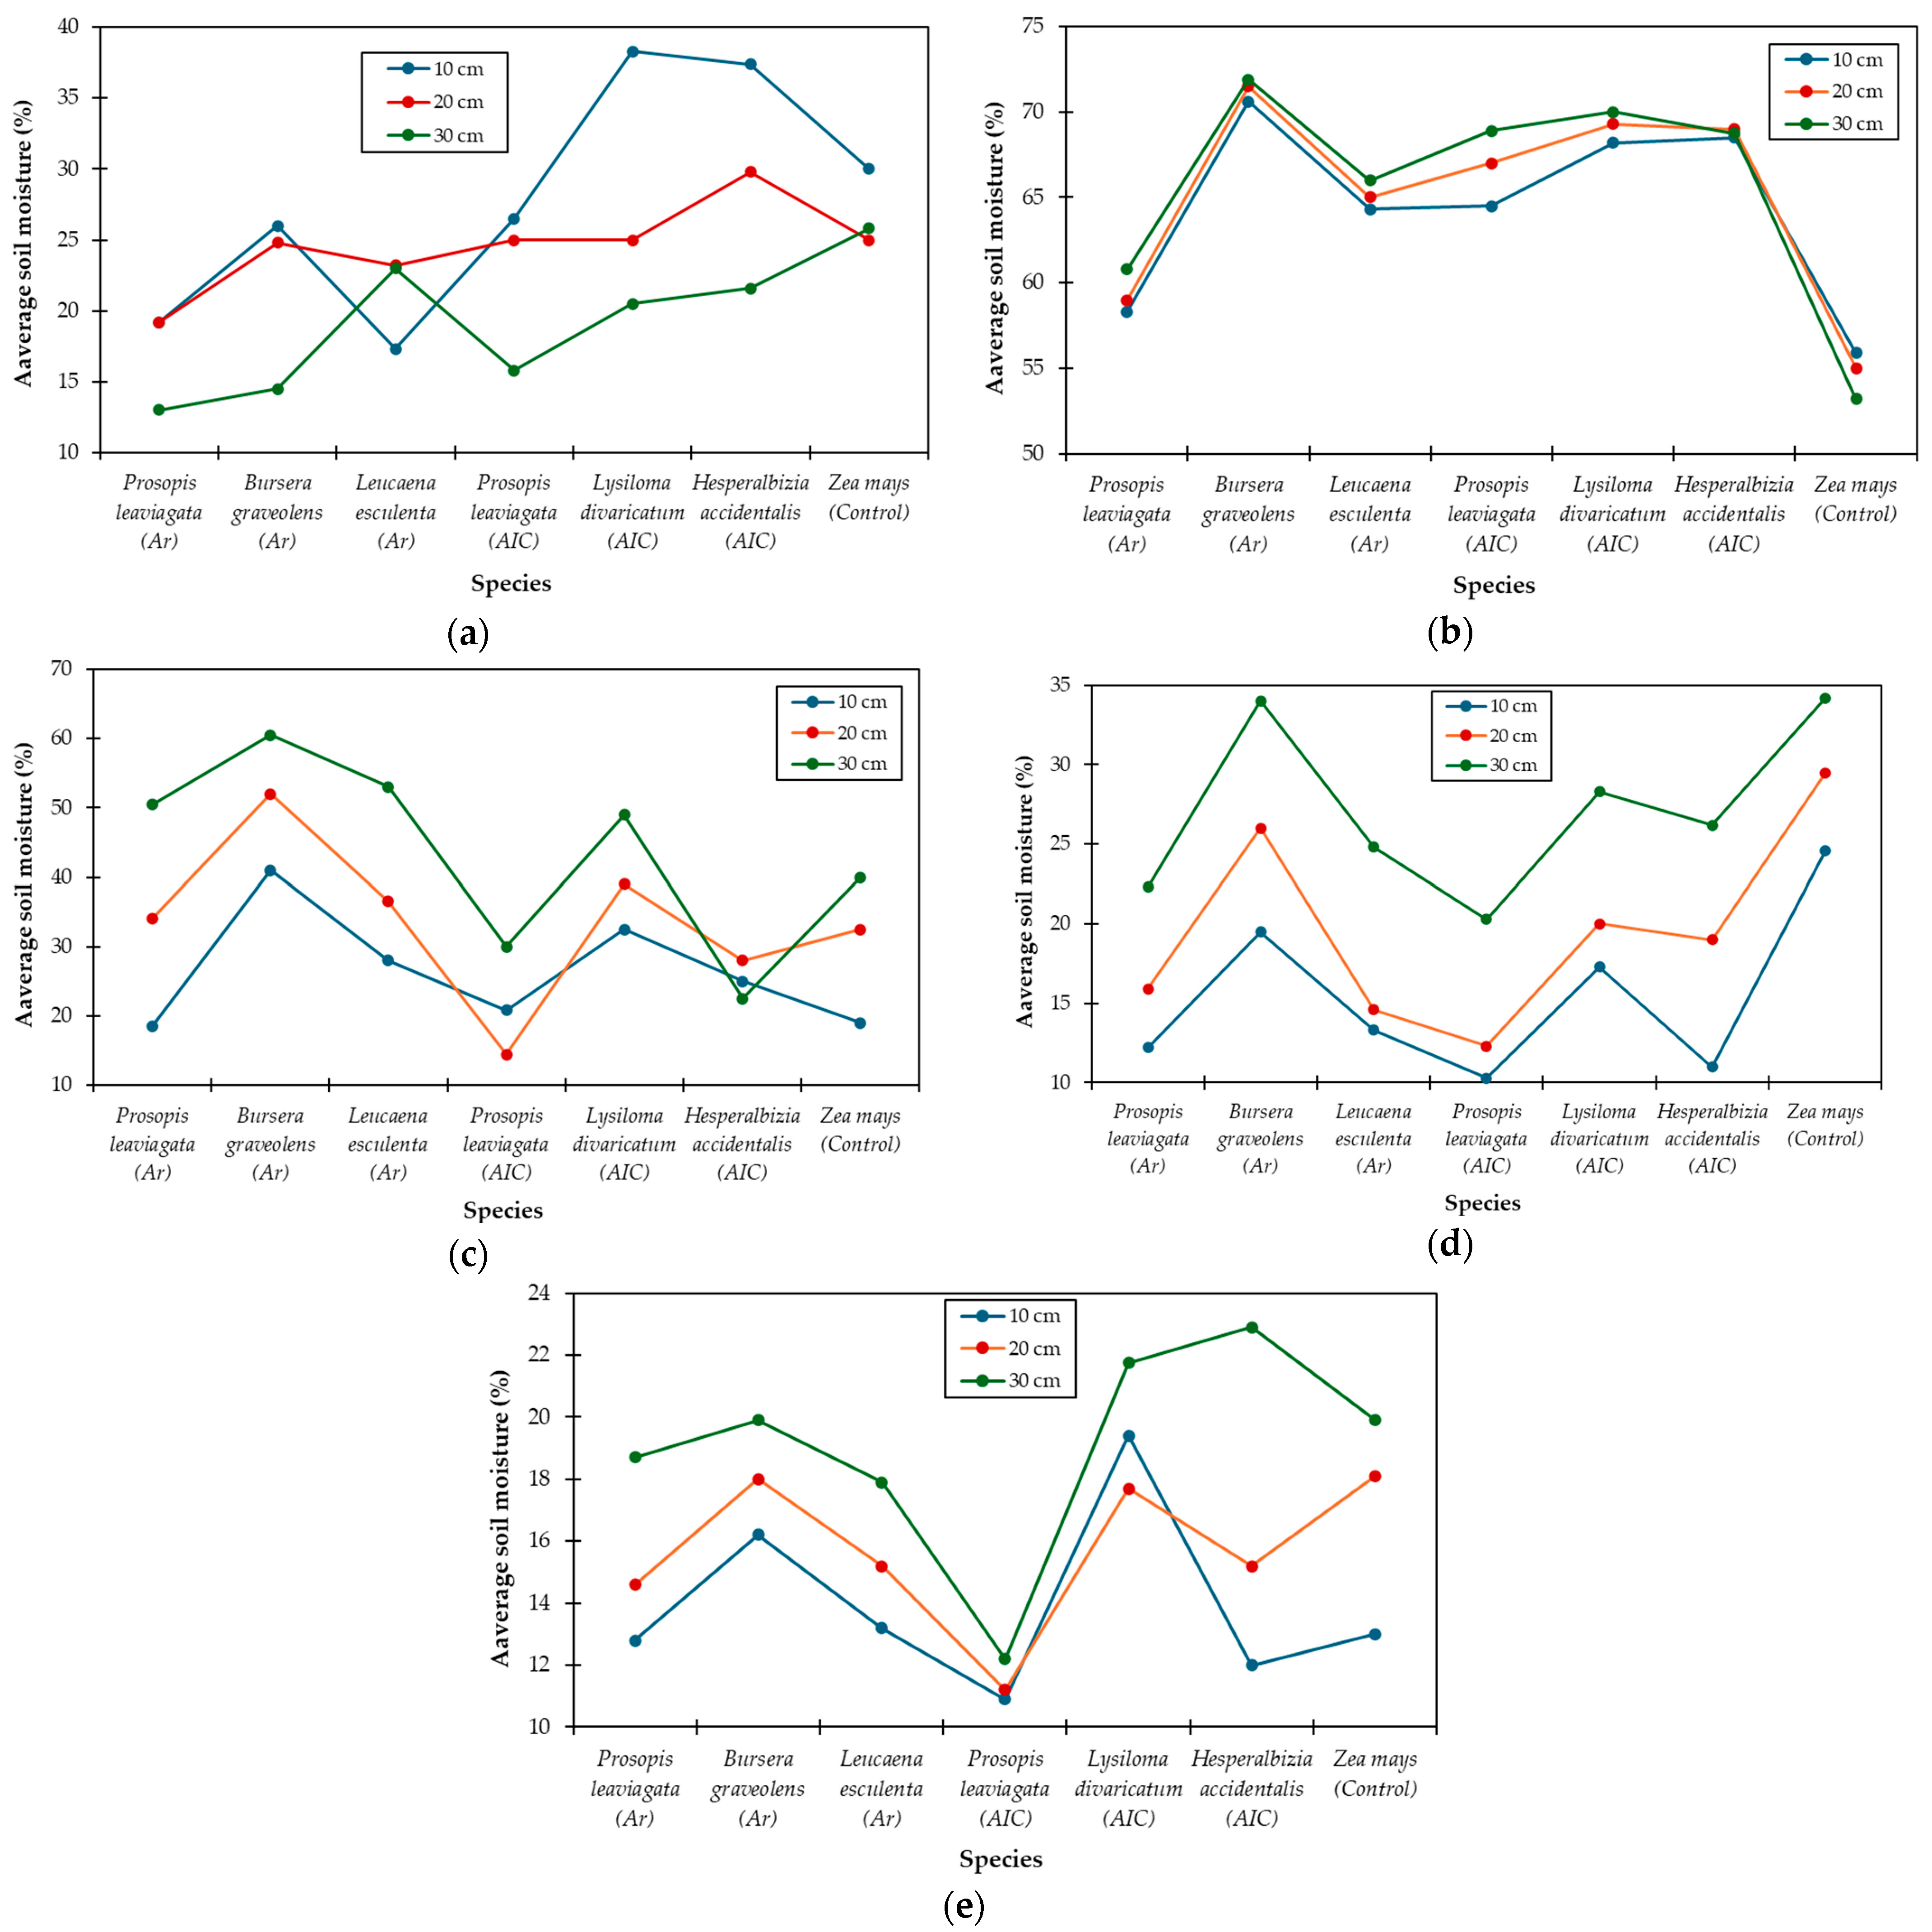
The statistical analysis indicated that there is no dependence between the main factors of soil depth and vegetation cover that explains the soil moisture content, for all measurement dates. The phenomenon is complex, since there is no linear relationship between the density of the vegetation cover and the moisture content, except in some of the species studied. Such behavior was observed by Yang et al. [58], as they found an inverse relationship in the moisture content in the soil and the vegetation cover and discovered that there was a higher moisture content in the dry season that in the wet season. The moisture content was different both for the three depths, as well as for the seven vegetation covers evaluated (p-value < 0.05). For the first date, the highest moisture content was under the Lysiloma divaricatum and Herperalbizia occidentalis cover in the AIC system and at a soil depth at 10 cm for all the systems studied, possibly due to some precipitation event that occurred before data collection (Figure 6a). For the second date, the highest moisture content was found under Bursera graveolens cover in the Ar systems, while there were no differences in the three levels of soil depth (Figure 6b). This is because soil moisture content becomes homogenized throughout the soil profile after a rainfall event [50]. For the third date, the highest moisture retention was achieved under the Ar system (Figure 6c), since the agroforestry arrangement is denser and prevents greater evapotranspiration than what can occur in the AIC system and the control [59]. For the fourth date, the highest moisture retention was reached under Bursera graveolens and Lysiloma divaricatum covers in the AIC and Ar systems, at a soil depth of 30 cm (Figure 6d). For the fifth and last date, the highest soil moisture content was reached under Bursera graveolens and Lysiloma divaricatum covers, in the Ar and AIC systems respectively, and at a depth of 30 cm (Figure 6e). This is because weeks after the precipitation event the water moves to a greater depth [60]. In general, in two of the plant species with the highest plant cover (Bursera graveolens in the Ar system and Lysiloma divaricatum in the AIC system), the highest moisture contents were present, and in one of the species with the lowest plant cover (Prospis leaviagata), the lowest moisture values were observed. In sand dunes in China they observed an inverse behavior, as they observed an inverse correlation between the degree of vegetation cover and moisture content [58]. In our study, in general, higher moisture was observed at greater depths, but a reverse situation was observed in sand dunes in China [58].

4. Conclusions

Agroforestry systems have been shown to enhance soil structural properties and water regulation functions under semi-arid agricultural conditions. A positive correlation exists between soil organic carbon and porosity, and improved hydraulic behavior is observed in agroforestry-managed soils, indicating that integrating woody vegetation into cropping systems can promote conditions favorable for aquifer recharge. As compared to conventional rainfed maize fields, dense agroforestry and an intercropped system improved soil water retention and infiltration.
This research has important practical implications: agroforestry can help alleviate aquifer depletion in regions that are experiencing overexploitation of groundwater. In addition to improving soil porosity and water storage capacity, agroforestry practices contribute to broader hydrological sustainability at the landscape level. Evidence indicates that agroforestry can complement existing groundwater management policies in semi-arid regions.
In terms of policy, it is recommended that agroforestry practices be incorporated into local and regional water conservation programs, with incentives for farmers to adopt diversified vegetation structures. Additionally, land-use planning strategies should integrate agroecological models that emphasize ecosystem services in addition to crop yields.
Future research should involve more frequent measurements of soil moisture at greater depths, as well as measuring water retention by the canopy and evapotranspiration. This would aim to refine the understanding of the relationship between precipitation characteristics, vegetation, and soil, enabling the development of mathematical models for predictive purposes.

Author Contributions

Conceptualization, J.V.P.-H.; methodology, J.V.P.-H. and A.Y.P.-E.; software, J.V.P.-H. and A.Y.P.-E.; validation, J.V.P.-H. and A.Y.P.-E.; formal analysis, J.V.P.-H., A.Y.P.-E. and J.C.B.-E.; investigation, J.V.P.-H., A.Y.P.-E., J.C.B.-E. and R.M.G.-N.; resources, J.V.P.-H. and A.Y.P.-E.; data curation, J.V.P.-H., A.Y.P.-E. and J.C.B.-E.; writing—original draft preparation, J.V.P.-H. and A.Y.P.-E.; writing—review and editing, J.V.P.-H., A.Y.P.-E., J.C.B.-E. and R.M.G.-N.; visualization, J.V.P.-H., A.Y.P.-E. and J.C.B.-E.; supervision, J.V.P.-H.; project administration, J.V.P.-H.; funding acquisition, J.V.P.-H. All authors have read and agreed to the published version of the manuscript.

Funding

This research was funded by the DGIPS-Research Institute from the Chapingo Autonomous University (grant number 24222-C-65).

Data Availability Statement

The data will be made available on request.

Acknowledgments

The authors would like to thank the National Council of Humanities, Sciences and Technologies (CONAHCYT) Mexico, for the support provided to carry out this work. The authors also thank the authorities and staff of the Bajío Experimental Research Center of INIFAP, Celaya, Guanajuato, Mexico for providing the experimental site and for their support.

Conflicts of Interest

The authors declare no conflicts of interest.

References

  1. Acharya, B.S.; Kharel, G.; Zou, C.B.; Wilcox, B.P.; Halihan, T. Woody Plant Encroachment Impacts on Groundwater Recharge: A Review. Water 2018, 10, 1466. [Google Scholar] [CrossRef]
  2. Chapman, T.G. Construction of hydrological models for natural systems management. Math. Comput. Simul. 1990, 32, 13–37. [Google Scholar] [CrossRef]
  3. Ríos, N.; Andrade, H.J.; Ibrahim, M. Evaluación de la recarga hídrica en sistemas silvopastoriles en paisajes ganaderos. Zootec. Trop. 2008, 26, 183–186. [Google Scholar]
  4. Bayala, J.; Prieto, I. Water acquisition, sharing and redistribution by roots: Applications to agroforestry systems. Plant Soil 2020, 453, 17–28. [Google Scholar] [CrossRef]
  5. Hamadi, A.; Larid, M.; Gómez, J.A.; Ouabel, H. Potential Impacts of Agroforestry on Controlling Soil Degradation by Water Erosion in the Agricultural Lands of Foothills North-West of Dahra (Mostaganem, Algeria). Proceedings 2019, 30, 50. [Google Scholar] [CrossRef]
  6. Anderson, S.H.; Udawatta, R.P.; Seobi, T.; Garrett, H.E. Soil water content and infiltration in agroforestry buffer strips. Agrofor. Syst. 2009, 75, 5–16. [Google Scholar] [CrossRef]
  7. Sahin, H.; Anderson, S.H.; Udawatta, R.P. Water infiltration and soil water content in claypan soils influenced by agroforestry and grass buffers compared to row crop management. Agrofor. Syst. 2016, 90, 839–860. [Google Scholar] [CrossRef]
  8. Wang, C.; Zhao, C.Y.; Xu, Z.L.; Wang, Y.; Peng, H.H. Effect of vegetation on soil water retention and storage in a semi-arid alpine forest catchment. J. Arid Land 2013, 5, 207–219. [Google Scholar] [CrossRef]
  9. Niu, C.Y.; Musa, A.; Liu, Y. Analysis of soil moisture condition under different land uses in the arid region of Horqin sandy land, northern China. Solid Earth 2015, 6, 1157–1167. [Google Scholar] [CrossRef]
  10. Zhang, Q.; Wei, W.; Chen, L.; Yang, L.; Luo, Y.; Cai, A. Plant traits in influencing soil moisture in semiarid grasslands of the Loess Plateau, China. Sci. Total Environ. 2020, 718, 137355. [Google Scholar] [CrossRef]
  11. Shukla, M.K.; Lal, R.; Ebinger, M.; Meyer, C. Physical and chemical properties of soils under some piñon-juniper-oak canopies in a semi-arid ecosystem in New Mexico. J. Arid Environ. 2006, 66, 673–685. [Google Scholar] [CrossRef]
  12. Popović, Z.; Cerdà, A. Soil water repellency and plant cover: A state-of-knowledge review. Catena 2023, 229, 107213. [Google Scholar] [CrossRef]
  13. Moreno-Calles, A.I.; Galicia-Luna, V.J.; Casas, A.; Toledo, V.M.; Ramos, M.V.; Santos-Fita, D.; Camou-Guerrero, A. Etnoagroforestería: El estudio de los sistemas agroforestales tradicionales de México. Etnobiología 2014, 12, 1–16. [Google Scholar]
  14. Muñoz-Villers, L.; Holwerda, F.; Alvarado-Barrientos, M.S.; Geissert, D.; Marín-Castro, B.; Gómez-Tagle, A.; McDonnell, J.; Asbjornsen, H.; Dawson, T.; Bruijnzeel, L.A. Hydrological effects of cloud forest conversion in central Veracruz, Mexico. Bosque 2015, 36, 395–407. [Google Scholar] [CrossRef]
  15. Fuentes, J.L.; Rivera, C.M.; McDonald, M.; Otárola, F.J.; Ibrahim, M.A.; Fragoso, L.V.; Luna, F.B. Hydrological information, the first step to design a local policy of payment for ecosystem services. Rev. Mex. Cienc. For. 2015, 6, 24–43. [Google Scholar] [CrossRef]
  16. Ávila-García, D.; Morató, J.; Pérez-Maussán, A.I.; Santillán-Carvantes, P.; Alvarado, J.; Comín, F. Impacts of alternative land-use policies on water ecosystem services in the Río Grande de Comitán-Lagos de Montebello watershed, Mexico. Ecosyst. Serv. 2020, 45, 101179. [Google Scholar] [CrossRef]
  17. Pascual-Ramírez, F.; Prado-Hernández, J.V.; Martínez-Ruiz, A.; Cristóbal-Acevedo, D. Surface water balance at the Chapingo River basin: Rainfall intercepted by vegetation and water infiltration into the soil. Agro Product. 2023, 16, 173–180. [Google Scholar] [CrossRef]
  18. Murray-Núñez, R.; Bojórquez-Serrano, J.I.; Hernández-Jiménez, A.; Orozco-Benítez, M.G.; García-Paredes, J.D.; Gómez-Aguilar, J.R.; Ontiveros-Guerra, H.; Aguirre-Ortega, J. Efecto de la materia orgánica sobre las propiedades físicas del suelo en un sistema agroforestal de la llanura costera norte de Nayarit, México. Bio Cienc. 2011, 1, 27–35. [Google Scholar] [CrossRef]
  19. Luna-Robles, E.; Cantú-Silva, I.; Yáñez-Díaz, M.I.; González-Rodríguez, H.; Marmolejo-Monsiváis, J.G.; Béjar Pulido, S.J. Ajuste de modelos empíricos de infiltración en un Umbrisol bajo diferentes tratamientos silvícolas. Rev. Mex. Cienc. For. 2020, 11, 132–152. [Google Scholar] [CrossRef]
  20. Estadísticas del Agua en México 2023. Comisión Nacional del Agua (CONAGUA)-Secretaría de Medio Ambiente y Recursos Naturales (SEMARNAT). Available online: https://sinav30.conagua.gob.mx:8080/Descargas/pdf/EAM2023_f.pdf (accessed on 20 December 2024).
  21. Romero, J.H.; Palacios, O.L.; Escobar, B.S. Estimación de la sobreexplotación producida en el acuífero Valle de Celaya (México). Tecnol. Cienc. Agua 2017, 3, 127–138. [Google Scholar] [CrossRef]
  22. García, E. Modificaciones al Sistema de Clasificación Climática de Köppen; Instituto de Geografía, Universidad Nacional Autónoma de México: Ciudad de México, Mexico, 2004. [Google Scholar]
  23. González, J.M.; Ventura, E.; Castellanos, J.Z.; Brevik, E.C. Soil Science in Mexico: History Challenges and the Future. Soil Surv. Horiz. 2010, 51, 63–71. [Google Scholar] [CrossRef]
  24. Bhansali, R.R. Biology and multiplication of Prosopis species grown in the Thar Desert. In Desert Plants; Ramawat, K., Ed.; Springer: Berlin/Heidelberg, Germany, 2010; pp. 371–406. [Google Scholar] [CrossRef]
  25. Vásquez-Méndez, R.; Ventura-Ramos, E.; Oleschko, K.; Hernández-Sandoval, L.; Domínguez-Cortázar, M.A. Soil erosion processes in semiarid areas: The importance of native vegetation. INTECH Open Access Publ. 2011, 1, 25–41. [Google Scholar] [CrossRef]
  26. Rzedowski, J.; Lemos, R.M.; de Rzedowski, G.C. Inventario del conocimiento taxonómico, así como de la diversidad y del endemismo regionales de las especies mexicanas de Bursera (Burseraceae). Acta Bot. Mex. 2005, 70, 85–111. [Google Scholar] [CrossRef]
  27. Romero-Estrada, A.; Maldonado-Magaña, A.; González-Christen, J.; Bahena, S.M.; Garduño-Ramírez, M.L.; Rodríguez-López, V.; Alvarez, L. Anti-inflammatory and antioxidative effects of six pentacyclic triterpenes isolated from the Mexican copal resin of Bursera copallifera. BMC Complement. Altern. Med. 2016, 16, 422. [Google Scholar] [CrossRef] [PubMed]
  28. Peralta-Juárez, I.; Gómez-Campos, A.; Romero-Castillo, P.A.; Reyes-Dorantes, A. Anthropocentric use of the guaje leucaena esculenta (Moc. & Sessé Ex. Dc.) Benth, in two communities in the mixteca baja region of Oaxaca, Mexico. Polibotánica 2017, 43, 349–364. [Google Scholar] [CrossRef]
  29. Sánchez-Hernández, M.Á.; Fierros-González, A.M.; Velázquez-Martínez, A.; Santos-Posadas, H.; Aldrete, A.; Cortés-Díaz, E. Estructura, riqueza y diversidad de especies de árboles en un bosque tropical caducifolio de Morelos. Rev. Mex. Cienc. For. 2018, 9, 131–156. [Google Scholar] [CrossRef]
  30. Stewart, J.L.; Dunsdon, A.J. The potential of some neotropical Albizia species and close relatives as fodder resources. Agrofor. Syst. 2000, 49, 17–30. [Google Scholar] [CrossRef]
  31. Salvador, R. Maíz. Publicaciones del Programa Nacional de Etnobotánica; Universidad Autónoma Chapingo: Chapingo, Texcoco, México, 2001. [Google Scholar]
  32. Landert, K. Comparing Photographic and GIS-based Applications for Estimating Canopy Cover in Southern Appalachian Bogs. In Proceedings of the National Conference on Undergraduate Research (NCUR), Asheville, NC, USA, 7–9 April 2016. [Google Scholar]
  33. Bouyoucos, G.J. Hydrometer Method Improved for Making Particle Size Analyses of Soils. Agron. J. 1962, 54, 464–465. [Google Scholar] [CrossRef]
  34. Blake, G.R. Bulk Density. In Methods of Soil Analysis, Part 1: Physical and Mineralogical Properties, Including Statistics of Measurement and Sampling; American Society of Agronomy, Crop Science Society of America, and Soil Science Society of America: Madison, WI, USA, 2015; pp. 374–390. [Google Scholar] [CrossRef]
  35. De Vos, B.; Lettens, S.; Muys, B.; Deckers, J.A. Walkley–Black analysis of forest soil organic carbon: Recovery, limitations and uncertainty. Soil Use Manag. 2007, 23, 221–229. [Google Scholar] [CrossRef]
  36. Ladoni, M.; Bahrami, H.A.; Alavipanah, S.K.; Norouzi, A.A. Estimating soil organic carbon from soil reflectance: A review. Precis. Agric. 2010, 11, 82–99. [Google Scholar] [CrossRef]
  37. She, D.; Zhang, W.; Hopmans, J.W.; Timm, L.C. Area representative soil water content estimations from limited measurements at time-stable locations or depths. J. Hydrol. 2015, 530, 580–590. [Google Scholar] [CrossRef]
  38. Zhang, Q.; Yue, C.; Yu, P.; Xu, H.; Liu, K.; Wu, J.; Sheng, F. Impacts of Different Vegetation Types on Soil Aggregate Stability in the Key Ecological Rehabilitation Area of the Tarim River Basin, Northwest China. Land 2024, 13, 2157. [Google Scholar] [CrossRef]
  39. Bottinelli, N.; Jouquet, P.; Capowiez, Y.; Podwojewski, P.; Grimaldi, M.; Peng, X. Why is the influence of soil macrofauna on soil structure only considered by soil ecologists? Soil Tillage Res. 2015, 146, 118–124. [Google Scholar] [CrossRef]
  40. Brady, N.C.; Weil, R.R. The Nature and Properties of Soils; Prentice Hall: Upper Saddle River, NJ, USA, 1998; p. 881. [Google Scholar]
  41. Heitschmidt, R.K.; Ansley, R.J.; Dowhower, S.L.; Jacoby, P.W.; Price, D.L. Some observations from the excavation of honey mesquite root systems. J. Range Manag. 1988, 41, 227–231. [Google Scholar] [CrossRef]
  42. Camp, C.R.; Sadler, E.J.; Busscher, W.J. A comparison of uniformity measures for drip irrigation systems. Trans. ASAE 1997, 40, 1013–1020. [Google Scholar] [CrossRef]
  43. Saxton, K.E.; Rawls, W.J. Soil Water Characteristic Estimates by Texture and Organic Matter for Hydrologic Solutions. Soil Sci. Soc. Am. J. 2006, 70, 1569–1578. [Google Scholar] [CrossRef]
  44. Minitab Statistical Software. Available online: http://www.minitab.com/en-US/products/minitab/ (accessed on 15 December 2024).
  45. Bruijnzeel, L.A. Hydrological functions of tropical forests: Not seeing the soil for the trees? Agric. Ecosyst. Environ. 2004, 104, 185–228. [Google Scholar] [CrossRef]
  46. Ilstedt, U.; Bargués Tobella, A.; Bazié, H.R.; Bayala, J.; Verbeeten, E.; Nyberg, G.; Sanou, J.; Benegas, L.; Murdiyarso, D.; Laudon, H.; et al. Intermediate tree cover can maximize groundwater recharge in the seasonally dry tropics. Sci. Rep. 2016, 6, 21930. [Google Scholar] [CrossRef]
  47. Ong, C.K.; Black, C.R.; Muthuri, C.W. Modifying forestry and agroforestry to increase water productivity in the semi-arid tropics. CAB Rev. Perspect. Agric. Vet. Sci. Nutr. Nat. Resour. 2006, 1, 1–19. [Google Scholar] [CrossRef]
  48. Levia, D.F.; Frost, E.E. Variability of throughfall volume and solute inputs in wooded ecosystems. Prog. Phys. Geogr. 2006, 30, 605–632. [Google Scholar] [CrossRef]
  49. Hölscher, D.; Mackensen, J.; Roberts, J.-M. Forest recovery in the humid tropics: Changes in vegetation structure, nutrient pools and the hydrological cycle. In Forests, Water and People in the Humid Tropics: Past, Present and Future Hydrological Research for Integrated Land and Water Management; Bonell, M., Bruijnzeel, L.A., Eds.; International Hydrology Series; Cambridge University Press: Cambridge, UK, 2005. [Google Scholar]
  50. Porta Casanellas, J.; Reguerín, L.A.; de Laburu, C. Edafología Para la Agricultura y el Medio Ambiente, 3rd ed.; Mundi-Prensa: Madrid, Spain, 2003; p. 961. [Google Scholar]
  51. Khaleel, A.A.; Sauer, T.J.; Tyndall, J.C. Changes in deep soil organic carbon and soil properties beneath tree windbreak plantings in the U.S. Great Plains. Agrofor. Syst. 2020, 94, 565–581. [Google Scholar] [CrossRef]
  52. Barbosa-Briones, E.; Cardona-Benavides, A.; Reyes-Hernández, H.; Muñoz-Robles, C. Ecohydrological function of vegetation patches in semi-arid shrublands of central Mexico. J. Arid Environ. 2019, 168, 36–45. [Google Scholar] [CrossRef]
  53. Korkanҫ, S.Y. Effects of afforestation on soil organic carbon and other soil properties. CATENA 2014, 123, 62–69. [Google Scholar] [CrossRef]
  54. Bhark, E.W.; Small, E.E. Association between plant canopies and the spatial patterns of infiltration in shrubland and grassland of the Chihuahuan desert, New Mexico. Ecosystems 2003, 6, 185–196. [Google Scholar] [CrossRef]
  55. Bosi, C.; Pezzopane, J.R.M.; Sentelhas, P.C. Soil water availability in a full sun pasture and in a silvopastoral system with eucalyptus. Agrofor. Syst. 2020, 94, 429–440. [Google Scholar] [CrossRef]
  56. Chamizo, S.; Cantón, Y.; Lázaro, R.; Domingo, F. The role of biological soil crusts in soil moisture dynamics in two semiarid ecosystems with contrasting soil textures. J. Hydrol. 2013, 489, 74–84. [Google Scholar] [CrossRef]
  57. Ni, J.; Cheng, Y.; Wang, Q.; Ng, C.W.W.; Garg, A. Effects of vegetation on soil temperature and water content: Field monitoring and numerical modelling. J. Hydrol. 2019, 571, 494–502. [Google Scholar] [CrossRef]
  58. Yang, T.; Ala, M.; Zhang, Y.; Wu, J.; Wang, A.; Guan, D. Characteristics of soil moisture under different vegetation coverage in Horqin Sandy Land, northern China. PLoS ONE 2018, 13, e0198805. [Google Scholar] [CrossRef]
  59. He, S.; Zhang, C.; Meng, F.R.; Bourque, C.P.A.; Huang, Z.; Li, X. Impacts of re-vegetation on soil water dynamics in a semiarid region of Northwest China. Sci. Total Environ. 2024, 911, 168496. [Google Scholar] [CrossRef]
  60. Xu, Q.; Liu, S.; Wan, X.; Jiang, C.; Song, X.; Wang, J. Effects of rainfall on soil moisture and water movement in a subalpine dark coniferous forest in southwestern China. Hydrol. Process. 2012, 26, 3800–3809. [Google Scholar] [CrossRef]
Figure 1. Experimental design: dense agroforestry system (Ar), agroforestry intercropped (AIC) and corn (control).
Water 17 01488 g001
Figure 2. Moisture measurement in the soil in the two agroforestry systems: (a) elevation view of the dense agroforestry system (Ar); (b) profile view of the dense agroforestry system (Ar); (c) elevation view of agroforestry system intercropped with crops (AIC); (d) profile view of agroforestry system intercropped with crops (AIC). The red and brown dots in (a,c) represent the soil moisture measurement sites and the tree trunks, respectively. The black dots in (b,d) represent the moisture measurement depths.
Water 17 01488 g002
Figure 3. Soil profiles of the agroforestry systems studied: (a) dense agroforestry (Ar); (b) intercropped agroforestry (AIC); (c) control.
Water 17 01488 g003
Figure 4. Trends in the behavior of the daily average moisture content in the soils under the tree species analyzed and in the control system: dense agroforestry system (Ar), intercropped agroforestry (AIC), rainfed corn (Control).
Water 17 01488 g004
Figure 5. Average distribution uniformity of soil moisture in each of the three production systems, during the period between 3 August 2022 and 12 October 2022. Tukey means from highest to lowest: a, b, c (p-value < 0.05).
Water 17 01488 g005
Figure 6. Effect of the interaction between vegetation cover and soil depth (10, 20 and 30 cm) on soil moisture: (a) 3 August; (b) 17 August; (c) 15 September; (d) 28 September; (e) 12 October 2022.
Water 17 01488 g006
Table 1. Means and standard deviations of the dendrometric measurements of the study species.
SpeciesHigh (m)Crown Diameter (m)Cover (%)
Prosopis leaviagata (Ar)5.00 ± 1.005.23 ± 0.7262.40 ± 5.87
Bursera graveolens (Ar)4.34 ± 0.504.04 ± 1.6873.80 ± 4.12
Leucaena esculenta (Ar)3.90 ± 0.65 3.83 ± 1.2175.20 ± 3.84
Prosopis leaviagata (AIC)4.30 ± 0.445.70 ± 0.5858.05 ± 3.69
Lysiloma divaricatum (AIC)4.70 ± 1.156.25 ± 1.0471.05 ± 8.22
Hesperalbizia occidentalis (AIC)6.00 ± 0.617.51 ± 1.0671.65 ± 10.77
Table 2. Texture and thickness of soil horizons of the studied agroforestry systems.
HorizonThickness, Particle Content, and TextureSystem
Dense Agroforestry
(Ar)
Intercropped Agroforestry (AIC)Control
AThickness (cm)14.004.00Close to zero
Clay (%)70.5566.9571.95
Silt (%)17.5020.0022.20
Sand (%)11.9513.055.55
TextureClayClayClay
BThickness (cm)26.0028.0030.00
Clay (%)44.4564.4556.96
Silt (%)15.0020.0022.50
Sand (%)40.5515.5520.55
TextureClayClayClay
Table 3. Hydraulic parameters of the soil horizons of the studied agroforestry systems.
HorizonParameter System
Dense Agroforestry (Ar)Intercropped Agroforestry (AIC)Control
A   θ s   cm 3   cm 3 0.5390.5360.553
  θ c c cm 3 cm 3 0.4530.4530.449
  θ p m p cm 3 cm 3 0.3470.3480.345
  D a   g   cm 3 1.2201.2301.190
  K s   mm   h 1 1.4601.3202.490
B   θ s   cm 3   cm 3 0.4620.5290.518
  θ c c cm 3 cm 3 0.3880.4550.458
  θ p m p cm 3 cm 3 0.2690.3490.350
  D a   g   cm 3 1.4301.2501.280
  K s   mm   h 1 0.9900.9600.730
Table 4. Potential recharge to the aquifer (cm of water per cm of soil thickness) of the soil in the studied systems. Tukey means from highest to lowest: a, b.
Cover   Recharge   ( c m   c m 1 )
15 August 20227 September 2022
Prosopis leaviagata Ar b14.060.00
Bursera graveolens Ar a25.986.03
Leucaena esculenta Ar a19.770.00
Prosopis leaviagata AIC a21.450.00
Lysiloma divaricatum AIC a23.880.00
Hesperalbizia occidentalis AIC a23.470.00
Control b9.640.00
Disclaimer/Publisher’s Note: The statements, opinions and data contained in all publications are solely those of the individual author(s) and contributor(s) and not of MDPI and/or the editor(s). MDPI and/or the editor(s) disclaim responsibility for any injury to people or property resulting from any ideas, methods, instructions or products referred to in the content.