Article

Comparison of the Influences of Fresh and Corroded Carbon Steels on the Decay Law of Sodium Hypochlorite in Reclaimed Water

1
Key Laboratory of Urban Stormwater System and Water Environment, Ministry of Education, Beijing University of Civil Engineering and Architecture, Beijing 100044, China
2
China Kunlun Contracting and Engineering Corporation (CKCEC), Beijing 100037, China
*
Author to whom correspondence should be addressed.
Water 2025, 17(10), 1428; https://doi.org/10.3390/w17101428
Submission received: 12 March 2025 / Revised: 3 May 2025 / Accepted: 6 May 2025 / Published: 9 May 2025
(This article belongs to the Special Issue Water Reclamation and Reuse in a Changing World)

Abstract

:
Sodium hypochlorite is a commonly used disinfectant in reclaimed water, and the decay law of its free chlorine directly affects the disinfection effect and the safety of reclaimed water. Currently, most of the decay studies have been carried out on the temperature, pH value, and concentration of organic matter in water, without fully considering the differences between fresh and corroded pipeline materials and their effects. This study aims to compare the influences of fresh and corroded carbon steels on the decay law of sodium hypochlorite through dynamic reaction devices and static flask experiments, based on simulations using uncorroded and pre-corroded carbon steel hanging plates. The effects of Fe⁰ and corrosion products on sodium hypochlorite decay are investigated to provide data support for disinfection strategies in reclaimed water distribution networks. By integrating DPD spectrophotometry, ATP detection, XRD analysis, and corrosion weight loss analysis, the microbial control efficacy and corrosion of sodium hypochlorite under the effects of fresh and corroded carbon steels are compared. The differences in decay kinetics are quantified using the restricted first-order decay model, and the dominant mechanisms of sodium hypochlorite consumption that cause differences in the effectiveness of the action are explored. The influences of fresh and corroded carbon steels on the decay are evaluated. Additionally, the percentages of consumption are also analyzed. The results show that in order to effectively kill microorganisms while reducing corrosion, it is recommended to add sodium hypochlorite under simulated conditions for fresh and corroded carbon steels to achieve free chlorine concentrations of 5 mg/L and 9 mg/L in the water, respectively. The effective control time of sodium chlorate on microorganisms in the bulk of the water under the fresh carbon steel conditions can be maintained for up to 48 h. However, under the corroded carbon steel conditions, the activity of microorganisms in the bulk of the water is relatively high, with an effective action time of only 8 h. The decay coefficient of sodium chlorate under the corroded carbon steel conditions is 2.61~6.94 times that of the fresh carbon steel. The additional average consumption of sodium hypochlorite under the corroded carbon steel conditions is 13.91~26.57% compared to the fresh carbon steel. Both Fe0 and corrosion products accelerate the decay of sodium hypochlorite in the initial stage, with an average consumption increase rate of 18.9% for Fe0 and 17.4% for corrosion products. The bulk decay coefficient is 0.073 h−1, and the wall decay coefficient represented by Fe0 is 0.204 h−1, which is higher than the wall decay coefficient represented by corrosion products, which is 0.077 h−1.

1. Introduction

With the increasing global water shortage, reclaimed water has been widely used as an important water alternative. However, the water quality complexity of reclaimed water can lead to problems such as microbial colonization in the pipeline system [1,2]. The main ways to control water quality can be achieved through methods such as ultraviolet disinfection or adding disinfectants [3].
As a commonly used disinfectant, the main function of sodium hypochlorite is to kill microorganisms in water and control the reproduction of microbial communities. The disinfection effect of sodium hypochlorite is affected by many factors, thus affecting the safety of the water quality, so the study of the decay law of sodium hypochlorite is of great significance. Current studies have mostly focused on the effects of water quality characteristics on disinfectant decay, such as temperature, pH, and organic matter concentration [4,5,6,7,8,9]. Hua F. et al. studied the effects of water temperature and initial chlorine concentration on the decay of free chlorine in the bulk of the water [10]. In addition, different pipe materials also have a significant impact on decay. Hallamn N.B. et al. focused on studying the decay of chlorine on the pipe wall [11]. However, research on the effect of the aging state of pipelines, a practical engineering factor, on sodium hypochlorite consumption has not received sufficient attention.
The difference between fresh and corroded pipelines involves pipeline corrosion products, and microorganisms are more likely to harbor in corroded pipelines [12,13,14,15,16]. Therefore, this article first compares the effects of sodium hypochlorite under fresh and corroded carbon steels, and analyzes the differences in microbial control effectiveness and corrosion rate. Then a mathematical model for the decay of sodium hypochlorite is established. The decay laws under the influences of fresh and corroded carbon steels are quantitatively analyzed, and the reasons for the differences in effectiveness are explored. This study further evaluates the effects of different wall materials such as zero-valent iron powder and corrosion products on the decay of sodium hypochlorite, and conducts consumption percentage analysis and separation of the bulk coefficient and wall coefficient. Through a systematic comparative study of the influences of fresh and corroded carbon steels on the decay law of sodium hypochlorite, an optimal dosing scheme based on different wall material states is proposed to provide data support for the disinfection strategy of a reclaimed water network.

2. Materials and Methods

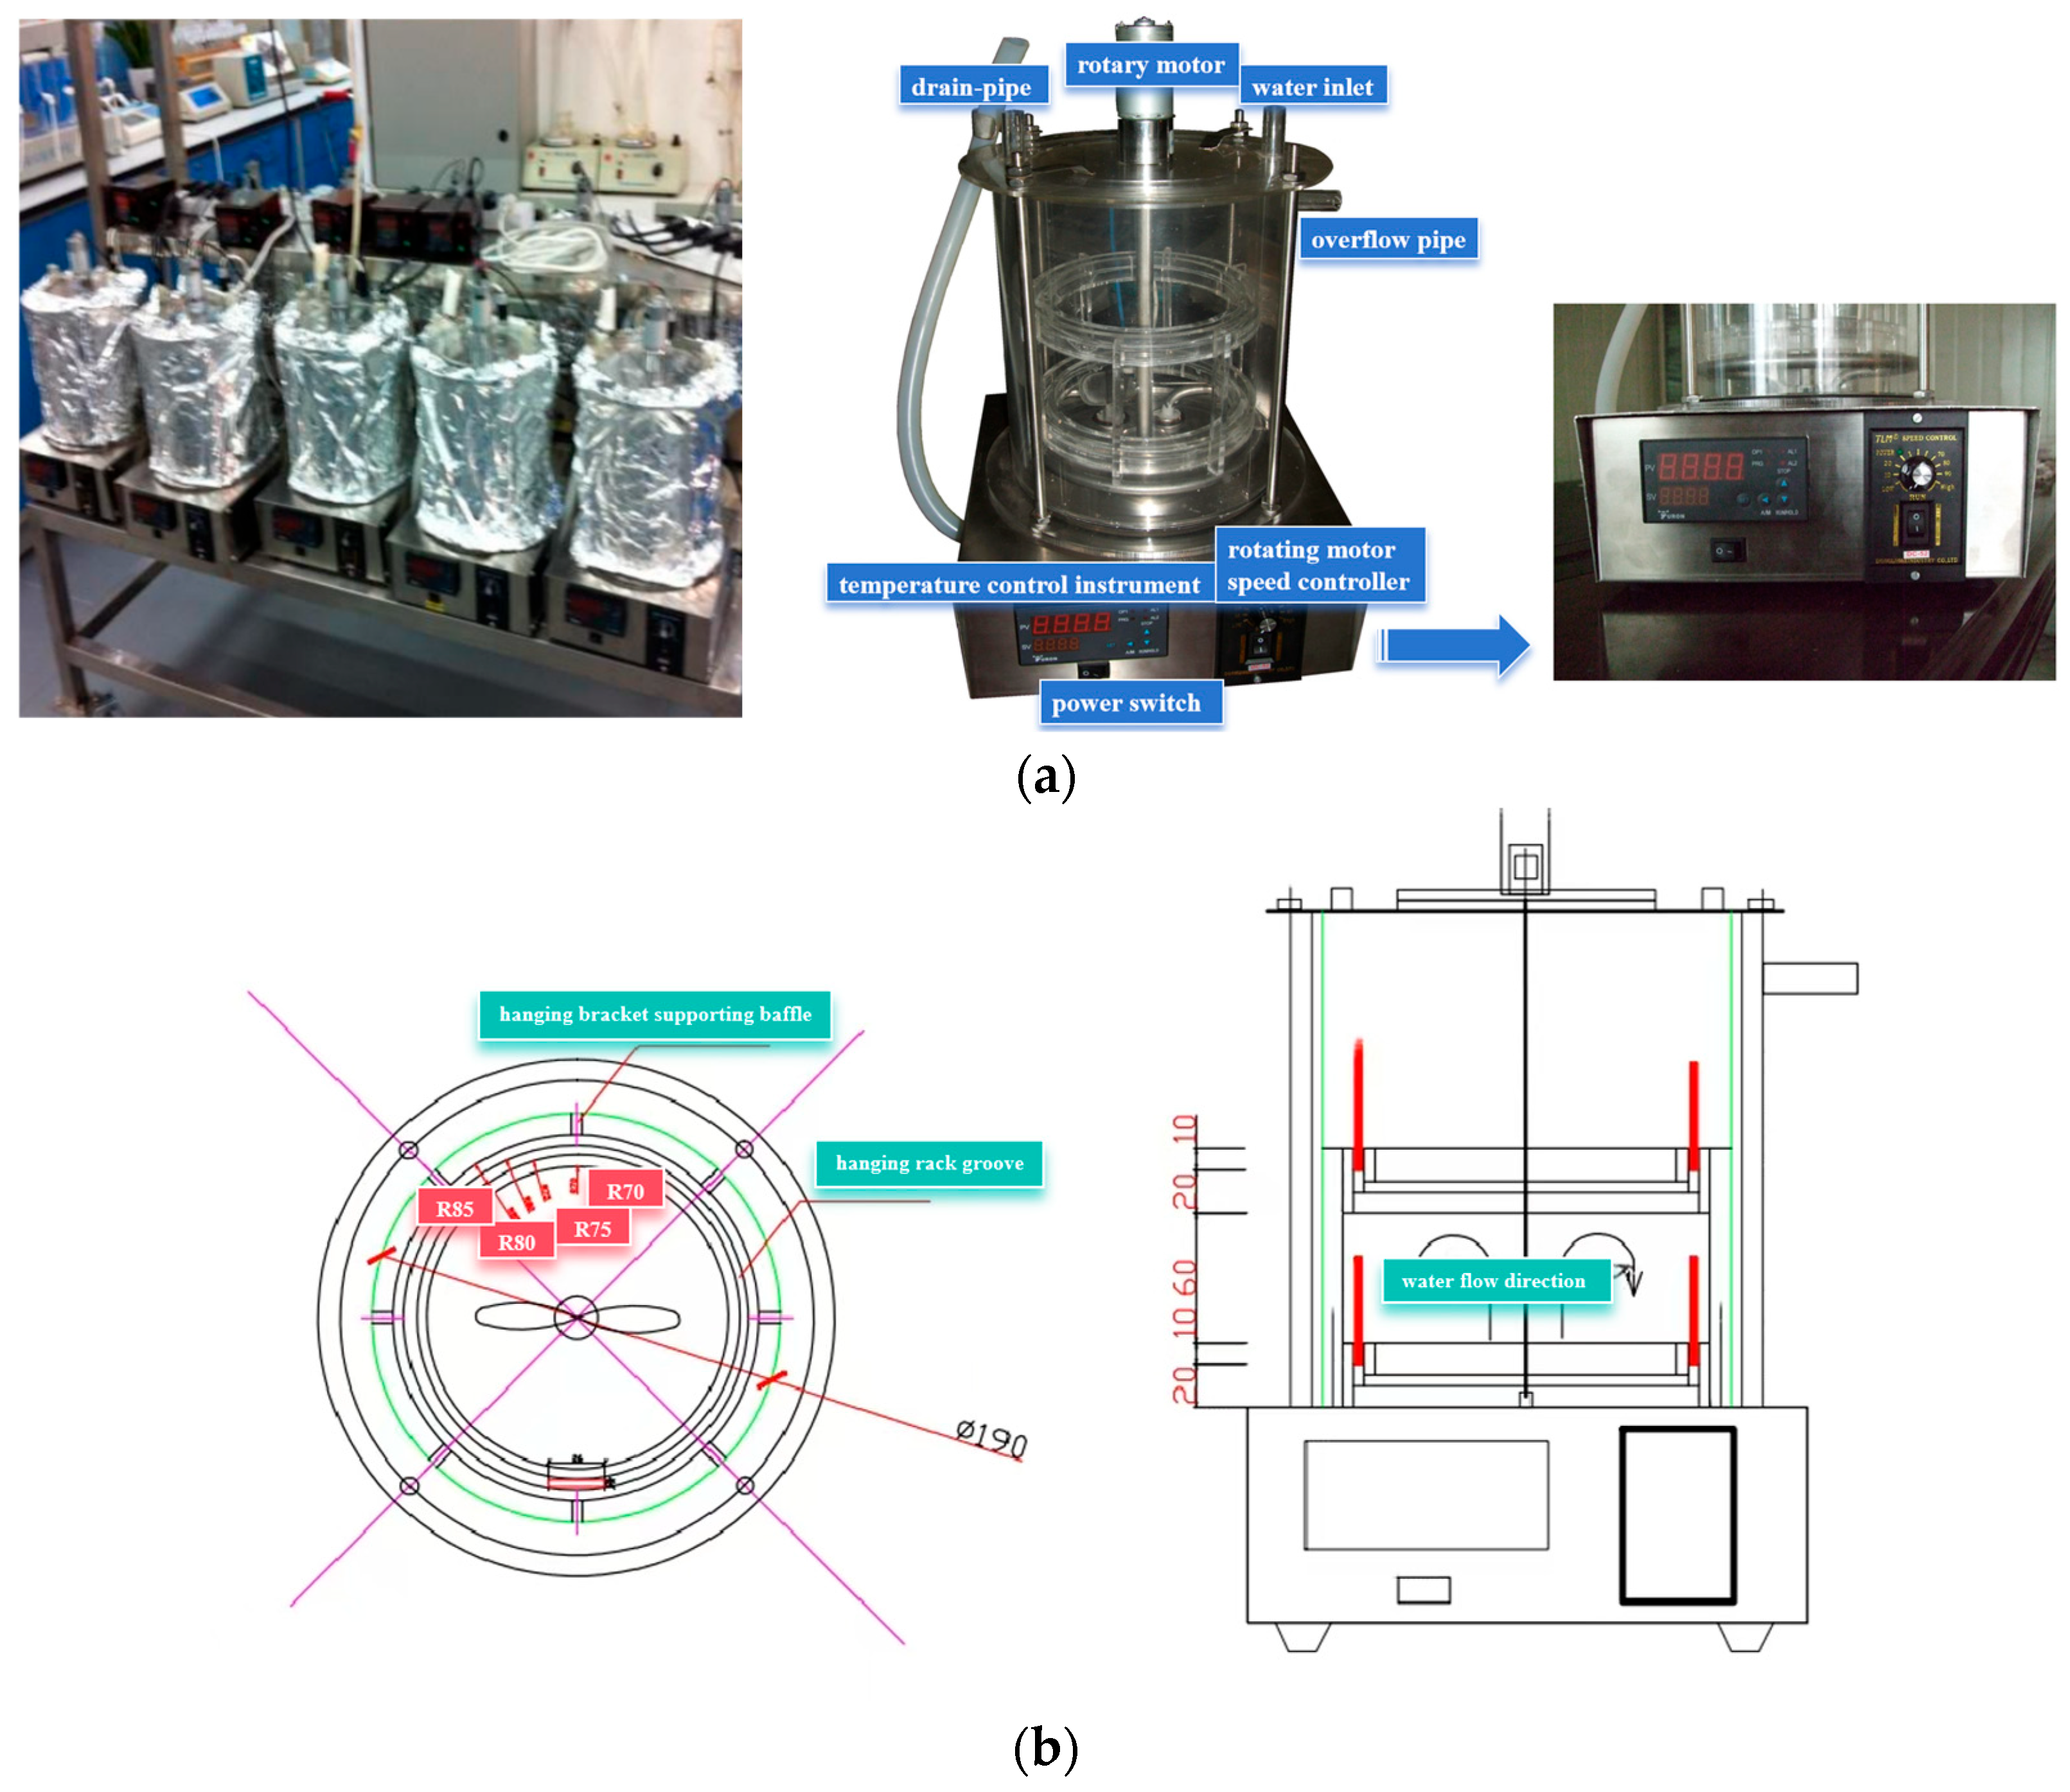
2.1. Experimental Design

This study compares the decay law of sodium hypochlorite under the influences of fresh and corroded carbon steels by means of dynamic reaction devices and static flask experiments. In the dynamic experiment, under the simulated actual operating environment of reclaimed water, different initial dosages of sodium hypochlorite are set and the free chlorine concentration is used as the core monitoring index to track the decay process of sodium hypochlorite. Additionally, the microbial activity is measured and the corrosion loss analysis is used to assess the corrosion.
The dynamic experiments use a rotating hanging plates reactor to simulate the surface of the carbon steel in the reclaimed water in contact with sodium hypochlorite. The surface of the fresh carbon steel is simulated by an uncorroded hanging plate, representing the original carbon steel surface without a corrosion layer and biofilm. The corrosive layer surface is simulated by a pre-corroded carbon steel hanging plate, containing corrosion products and microorganisms. Pre-corrosion hanging plates were obtained by the uncorroded hanging plates in the rotating hanging plates reactor after 14 d of reaction, with a peristaltic pump for uninterrupted water change, until the iron content in the final reactor no longer significantly changed, that is, when the hanging plate surface corrosion products reached a stable state. The composition of the carbon steel hanging plates is similar to that of actual carbon steel pipelines. The selection of carbon steel hangers can also better simulate the corrosion process. The main study in the static flask experiments is the effect of the state of the wall material, i.e., Fe0 simulating the fresh wall and the corrosion products simulating the corroded wall, on the decay of sodium hypochlorite.
Figure 1 shows the physical photos and schematic diagram of the rotating hanging plate reactor for dynamic experiments. The device consists of a glass fiber-reinforced plastic cylindrical sealed water storage tank, an adjustable speed rotating shaft, a ring for fixing the hanging tablets, and a heating ring at the bottom. The reservoir is used to hold the experimental water, the spindle and ring are used to fix and rotate the hanging plates, and the heating ring is used to control the experimental temperature. The volume of water used for the experiment is 6 L, the rotational speed of the spindle is set at 80 r/min, and the ratio of water volume to surface area of the tested plate is 0.21 L/cm2. All storage and sampling devices are chlorine-saturated during the experiment to avoid consumption of the container itself.

2.2. Materials

The national Type I test pieces are selected as the carbon steel corrosion hanging plates for the experiment, with the specification of 50 mm × 25 mm × 2 mm and the material of Grade 20# carbon steel. “Type I” refers to the standard Type I carbon steel corrosion test piece, which is specified in the Chinese standard (HG/T 3523-2008) [17]. The test piece is suitable for laboratory weightlessness corrosion experiments. The elemental composition of the carbon steel hanging plates is as follows: C is 0.19%, Si is 0.22%, Mn is 0.47%, P is 0.013%, S is 0.009%, Cr is 0.05%, Ni is 0.05%, and Cu is 0.01%. The Grade 20# carbon steel is widely used in water supply pipelines and structural components due to its balanced mechanical strength (yield strength ≥ 245 MPa) and cost-effectiveness in corrosive environments.
The experimental water used is the effluent from a reclaimed water plant in Beijing after membrane filtration and before disinfection. The water quality is as follows: pH value of 6.2, COD of 2.2 mg/L, BOD5 of 0.61 mg/L, total hardness (calculated as CaCO3) of 1.06 mmol/L, total dissolved solids of 14.6 mg/L, conductivity of 26.2 μS/cm, and total alkalinity of 7.9 mmol/L.
The experimental sodium hypochlorite is a 10% effective chlorine concentration sodium hypochlorite solution sold by Sinopharm Chemical Reagent Co., Ltd., Shanghai, China. The experiments are conducted using this solution to control the initial free chlorine concentration of the water sample at 5 mg/L, 9 mg/L, and 13 mg/L.

2.3. Experimental Methods

The key methodological steps for the dynamic experiments are as follows: The reactor is wrapped with aluminum foil to achieve thermal insulation and light isolation, then heated to 30 °C. Sodium hypochlorite is added to the water, and timing is initiated. Parallel concentration conditions are set with initial free chlorine levels of 5, 9, and 13 mg/L. The residual chlorine content is measured at 0.5 h, 1 h, 2 h, 3 h, 4 h, 8 h, 12 h, 24 h, 36 h, 48 h, 60 h, and 72 h during the reaction to analyze the decay law. Additionally, the ATP index of microorganisms in the water is measured at 0.5 h, 4 h, 8 h, 12 h, 24 h, 36 h, 48 h, 60 h, and 72 h to evaluate microbial control effectiveness. Choosing 30 °C as the experimental temperature can ensure the stability and reproducibility of the experimental conditions. This temperature is easy to control and maintain in the laboratory, which helps to obtain reliable and consistent experimental data. In addition, 30 °C can accelerate the corrosion reaction kinetics and microbial metabolic activity, thereby capturing significant differences in chlorine decay and corrosion within a controllable experimental period, significantly reflecting the risk of disinfectant failure in the reclaimed water system.
The experiments investigating the influence of Fe0 (simulating fresh wall) and corrosion products (simulating corroded wall) on sodium hypochlorite decay are conducted using static flasks. The flasks are completely wrapped with aluminum foil in advance to ensure light isolation, and degreasing cotton is used as a stopper. The experiments are performed in a water bath at 30 °C to maintain constant temperature and light-shielded conditions. A uniform initial sodium hypochlorite concentration of 9 mg/L is applied, and parallel concentration conditions are established by dosing iron powder and old pipeline corrosion products at concentrations of 0 mg/L, 10 mg/L, 20 mg/L, and 50 mg/L, respectively. Residual chlorine content is measured to analyze the decay kinetics, and the ATP index of microorganisms is determined to evaluate the impact on microbial control efficacy.
The determination of residual chlorine is carried out using DPD spectrophotometry, and the spectrophotometer model is Shimadzu UV-1700, sourced from Shimadzu Enterprise Management (China) Co., Ltd. (Shanghai, China) The result obtained is the free effective residual chlorine value. The model of the ATP detector is Hygiena Pi-102, produced by Hygiena in Camarillo, CA, USA, which uses the ATP bioluminescence method to detect and obtain the relative luminescence unit RLU to represent the microbial activity level in the sample.
The X-ray diffraction (XRD) analysis is performed using a ceramic-sealed copper (Cu) target X-ray tube on a X’Pert Pro MPD diffractometer manufactured by PANalytical in the Almelo, The Netherlands. The Cu tube generates Kα radiation with dual wavelengths of Kα1 = 1.540598 Å and Kα2 = 1.544426 Å, at an intensity ratio of Kα2/Kα1 = 0.5. The operational parameters are set to a 40 kV accelerating voltage and 40 mA tube current to balance X-ray intensity and sample exposure. A fixed divergence slit of 0.76 mm is used to control beam collimation, while Ni filtration eliminates Kβ radiation. The scan range covers 10.0°~90.0° (2θ) to capture critical diffraction peaks of iron oxides. Data are collected with a step size of 0.02626° and a dwell time of 70.89 s per step, ensuring high resolution for low-intensity peaks.
The primary steps for corrosion weight loss analysis include the following: After retrieving the tested pieces, observe and record their surface conditions before proceeding with treatment. For pieces with mild corrosion, remove the corrosion products from the surface to expose the bare metal. Then, immerse the pieces in absolute ethanol, take them out, and wipe them clean with degreasing cotton. Re-immerse the pieces in absolute ethanol, remove them after a brief period, place them on clean filter paper, and dry them with a cold air blower. Wrap the pieces carefully in clean filter paper and store them in a desiccator. After 24 h, weigh the pieces to calculate the weight loss and subsequently determine the corrosion rate. For pieces with severe corrosion, perform ultrasonic cleaning followed by chemical cleaning. The quality determination of corrosion samples is carried out using a one in ten thousand analytical balance (accuracy 0.1 mg). The corrosion rate is calculated according to Equation (1).
CR = 8760 · 10 · m 1     m 2 s · ρ · t ,
In the formula, CR is the corrosion rate, mm/a; m 1   is the mass before the hanging experiment, g;   m 2 is the mass after the hanging experiment, g; s is the surface area of the hanging experiment, cm2; ρ is the density of the hanging film, g/cm3; t is the experimental time, h; and 8760 and 10 are the calculation constants.

3. Results and Discussion

3.1. Comparison of the Effects of Sodium Hypochlorite Under the Influences of Fresh and Corroded Carbon Steels

3.1.1. Comparison of Microbiological Control Effects

The microbial activity in water is analyzed by the ATP index, and the results are shown in Figure 2.
As shown in Figure 2, compared with the corroded carbon steel conditions, the microbial activity under the influence of the fresh carbon steel is weaker. Free chlorine in water can stably and effectively inhibit microbial growth, and the effective action time of sodium hypochlorite is up to 48 h. Under the corroded carbon steel conditions, microbial activity is significantly enhanced, and the control effect of sodium hypochlorite is significantly reduced. When the initial free chlorine concentration is 5 mg/L, 9 mg/L, and 13 mg/L, the RLU values of microorganisms after 48 h are 7.5, 10.4, and 9.6 times higher than those under the fresh carbon steel conditions, respectively. Whether it is the fresh or corroded carbon steel condition, the higher the initial concentration, the better the control effect of microorganisms, which is consistent with the research results of Zhou et al. [18].
According to Figure 2a, it can be seen that under the fresh carbon steel, the RLU values at 48 h are reduced by 66.4%, 82.4%, and 91.2%, respectively, compared to the unsterilized condition with initial free chlorine concentrations of 5 mg/L, 9 mg/L, and 13 mg/L. The microbial activity significantly increases at 48 h under three different concentration conditions, indicating that sodium hypochlorite can no longer effectively control microbial growth at this time. Microbial activity reaches its maximum value around 60 h and then begins to decline. When the microbial count reaches its peak, the RLU values decrease by 31.9%, 54.6%, and 73.2%, respectively, compared to the unsterilized condition.
From Figure 2b, it can be seen that although the peak RLU of microorganisms under the corroded carbon steel condition reaches 38,000 when sodium hypochlorite is not added, the microbial biomass rapidly decreases in the first 4 h of adding sodium hypochlorite under all three conditions, and the RLU value is controlled within 2400 at 4 h, indicating that the initial sodium hypochlorite sterilization effect is significant. At this stage, the sterilization consumption of sodium hypochlorite is relatively high. After 4 h, the number of microorganisms begins to increase, especially after 8 h, with a faster rate of growth, indicating that sodium hypochlorite could no longer effectively control the growth of microorganisms. On the surface of corroded pipelines, there are porous biofilms and corrosion products attached, which can induce the rapid growth of domesticated microorganisms in the absence of disinfectants. On the other hand, in the condition of adding disinfectants, they also provides a shelter for microorganisms, reducing the contact efficiency of disinfectants, which is also the main reason for the rapid proliferation of microorganisms in the later stage [19,20,21].

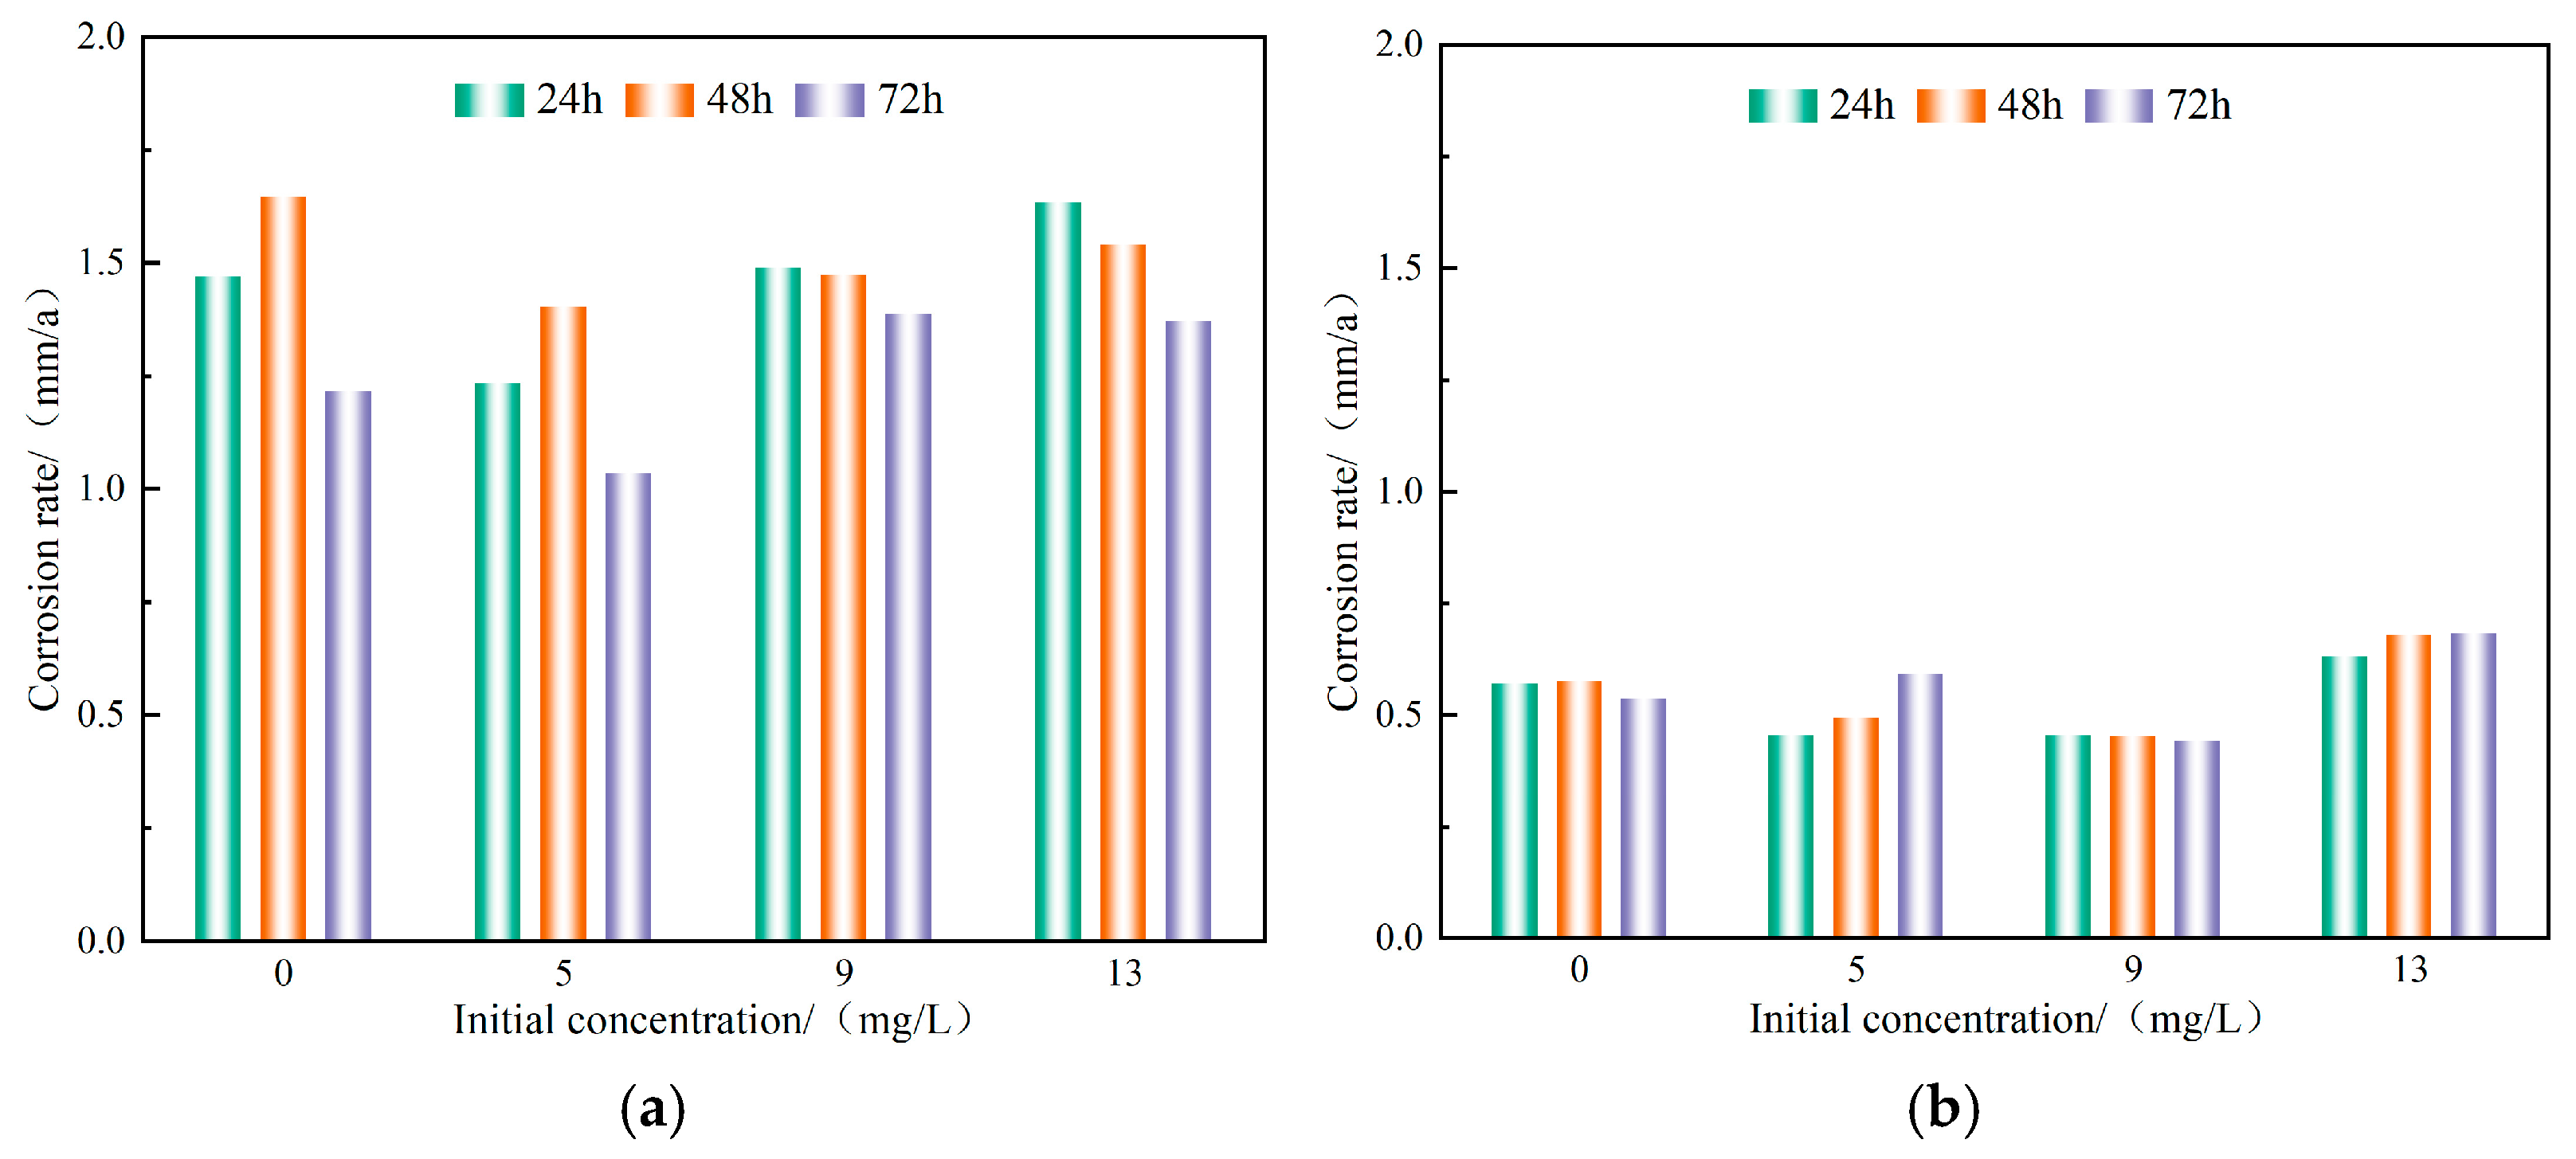
3.1.2. Comparison of Fresh and Corroded Carbon Steel Corrosion Rates

The addition of sodium hypochlorite is mainly to kill microorganisms, but due to its oxidizing nature, it may cause corrosion problems [22], leading to additional consumption of sodium hypochlorite, which is not conducive to microbial control. Based on this, the influence of different concentrations of free chlorine in water on the corrosion rates of fresh and corroded carbon steels is explored. The experimental results are shown in Figure 3.
According to Figure 3a, compared with the condition without sodium hypochlorite added, the corrosion rate is lower when the initial free chlorine concentration is 5 mg/L, with a decrease of 14.9% to 16.1% within 24~72 h. However, the corrosion rates of 9 mg/L and 13 mg/L are relatively high, increasing by 1.2% and 11.1%, respectively, at 24 h and 14.1% and 12.7%, respectively, at 72 h. The initial concentration of 5 mg/L can effectively control corrosion, but 9 mg/L and 13 mg/L not only fail to control corrosion, but also accelerate pipeline corrosion. Research has found that microorganisms attach to the surface of pipelines in the form of biofilms, which can affect the electrochemical processes on the pipeline surface through metabolism or products, inducing pipeline corrosion [23,24,25,26]. During disinfection, the addition of sodium hypochlorite can kill microorganisms and hinder the occurrence of microbial corrosion, thereby reducing the corrosion rate of metals [27]. Based on Figure 2, it can be seen that in this study, the above process is achieved when the initial free chlorine concentration is 5 mg/L. However, when the initial concentration is increased to 9 mg/L and 13 mg/L, in addition to killing microorganisms [28], ClO, due to its strong oxidizing properties, will also attack the surface of fresh carbon steel, causing corrosion. It can be seen that disinfectants with appropriate concentrations can effectively control corrosion while killing microorganisms, but high concentrations of disinfectants can actually accelerate the corrosion rate. Zhang et al. found that the higher the initial concentration of NaClO added, the faster the metal corrosion rate [29], which is consistent with the results of this study.
According to Figure 3b, under the three operating conditions, the corrosion rate of the corroded carbon steel decreases by 43% to 71% compared to the fresh carbon steel. This may be due to the corrosion layer on the surface of the corroded carbon steel, which hinders the transmission of the cathodic oxidizer to the pipe wall and the electron conduction process of the anode. Under the three operating conditions, the corrosion rate is the lowest at 9 mg/L, which is reduced by 17.5% to 20.2% compared to the absence of sodium hypochlorite. However, the corrosion rate at 13 mg/L not only does not decrease, but increases by 10.7% to 27.5%. According to Figure 2, 9 mg/L precisely balances microbial control and corrosion, resulting in the lowest corrosion rate. At a concentration of 13 mg/L, ClO attacks the original corrosion layer, causing it to detach or change in morphology, which will result in secondary corrosion of the base metal.
Based on the comprehensive analysis of Section 3.1.1 and Section 3.1.2, it can be concluded that there are significant differences in the control effect of sodium hypochlorite on microorganisms and the corrosion rate of pipelines between fresh and corroded carbon steels. The best effect is achieved under the initial free chlorine concentration of 5 mg/L under the fresh carbon steel conditions, and the recommended dosing frequency is 48 h. For the corroded carbon steel conditions, the suitable concentration is 9 mg/L, and the recommended dosing frequency is 8 h. What are the differences in the decay laws of sodium hypochlorite under the influences of fresh and corroded carbon steels behind the macroscopic differences, and what are the reasons for these differences? These will be discussed in Section 3.2 and Section 3.3.

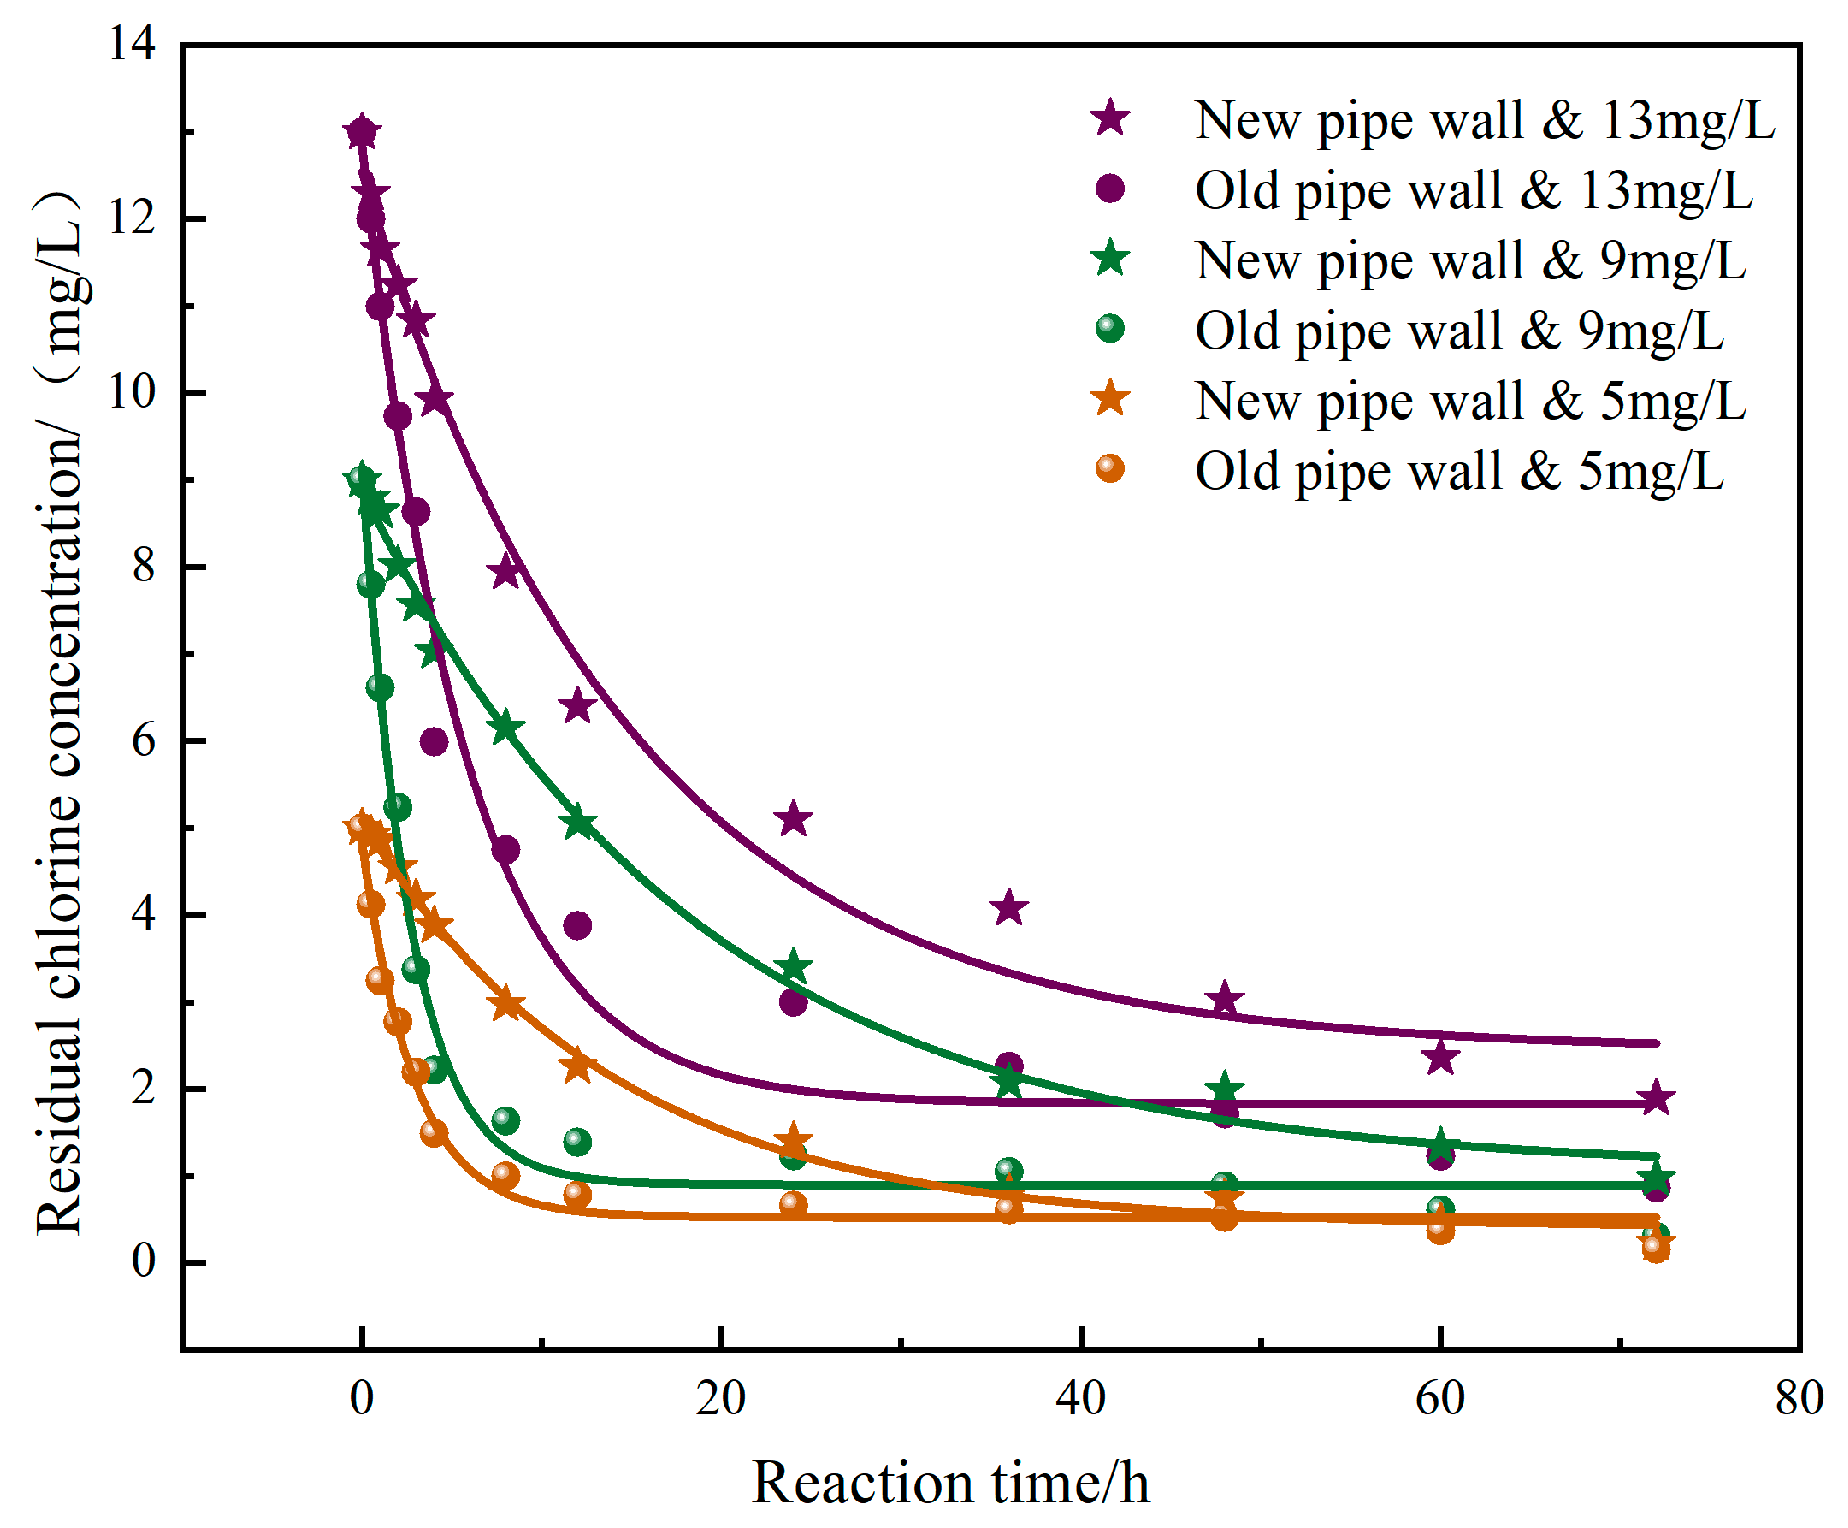
3.2. Comparison of Residual Chlorine Decay Models Under the Influences of Fresh and Corroded Carbon Steels

The decay process of initial free chlorine at concentrations of 5, 9, and 13 mg/L under the influences of fresh and corroded carbon steels is shown in Figure 4.
In order to study the actual disinfection effect and propose control strategies, the decay process of residual chlorine is usually fitted by a model. Common decay models include the empirical model, first-order decay model, parallel first-order decay model, restricted first-order decay model, second-order decay model, and n-order decay model [30,31,32,33,34]. The fitting analysis of the experimental results in Figure 4 shows that the restricted first-order decay model has a good fit for all experimental conditions, with R2 above 0.97, and the specific parameters are shown in Table 1.
The restricted first-order decay model is shown in Equation (2):
C t =   a + b   ×   exp kt ,
Where C t denotes the residual concentration at time t, mg/L; a denotes the lowest stable residual chlorine concentration of the system, mg/L; b denotes the average participating reaction concentration, mg/L; k denotes the decay coefficient, h−1; and t denotes the reaction time, h.
The first-order decay model and second-order decay model are shown in Equations (3) and (4), respectively [35]. The specific parameters are shown in Table 2.
C t = C 0 exp kt
Where C t represents the residual chlorine concentration at time t, mg/L; C 0 represents the initial residual chlorine concentration added, mg/L; k represents the decay coefficient, h−1; and t represents the reaction time, h.
C t = C 0 1 R / 1 Re ut
Where C t represents the residual chlorine concentration at time t, mg/L; C 0 represents the initial residual chlorine concentration added, mg/L; R is dimensionless; u represents the parameters that need to be estimated, min−1; and t represents the reaction time, h. u = M (1 − R), where M > 0.
According to the analysis of the fitting results in Table 2, the R2 effect obtained by the first-order decay model is not good enough, and the parameter u obtained by the second-order decay model may be zero, indicating that there are some issues with the applicability of the model.
As shown in Figure 4, for the fresh carbon steel conditions, under the same external conditions, the higher the initial concentration of sodium hypochlorite added, the faster the initial decay. After 1 h of decay, the free chlorine concentration under the 13 mg/L condition decreases to 11.65 mg/L, a decrease of 1.35 mg/L, consuming 10.4%. However, for the 5 mg/L condition, it only decreases from 5 mg/L to 4.86 mg/L within 1 h, consuming only 2.9%. The consumption of sodium hypochlorite under the fresh carbon steel is twofold: firstly, it is used to kill microorganisms and react with substances in the bulk water; secondly, it reacts with the carbon steel wall. Based on Figure 3, it can be seen that the corrosion rate is higher under the condition of 13 mg/L, indicating that wall consumption accounts for a large proportion.
According to Table 1, compared to the fresh carbon steel conditions, the residual chlorine decay under the influence of the corroded carbon steel is significantly accelerated. Under the condition of 13 mg/L, the decay coefficient k increased from 0.067 h−1 to 0.175 h−1, with a greater increase in decay coefficient under the conditions of 5 mg/L and 9 mg/L. The decay coefficients under the influence of the corroded carbon steel under the conditions of 5 mg/L, 9 mg/L, and 13 mg/L are 4.83, 6.94, and 2.61 times that of the fresh carbon steel, respectively. For the fresh carbon steel, the decay coefficient is relatively high at an initial chlorine concentration of 5 mg/L. For the corroded carbon steel, the decay coefficients are relatively high at initial chlorine concentrations of 5 mg/L and 9 mg/L. Hua F. et al.’s study found that lower initial concentrations produce larger decay coefficients [10]. Moreover, rapid decay mainly occurs within the initial 8 h. As shown in Figure 2, this period coincides with the effective control of microorganisms. Therefore, it can be inferred that the rapid decay of sodium hypochlorite under the influence of the corroded carbon steel is mainly used to kill microorganisms.
Figure 5 shows the increased consumption of the corroded carbon steel compared to the fresh carbon steel for different initial concentration conditions.
As shown in Figure 5, when the initial concentration is 5 mg/L, 9 mg/L, and 13 mg/L, the average consumption of free chlorine in the corroded carbon steel condition increased by 22.22%, 26.57%, and 13.91%, respectively, compared to the fresh carbon steel condition. According to Figure 2, the number of microorganisms in the corroded carbon steel condition is 6.5 times that of the fresh carbon steel, requiring more free chlorine consumption. In addition, based on Figure 3 and the relevant literature [36,37], it can be inferred that free chlorine may also be consumed by corroding carbon steel surfaces or reacting with existing corrosion products on the walls.

3.3. Comparison of the Effects of Wall Substances on Residual Chlorine Decay

Using Fe0 and corrosion products as representatives of the wall composition of fresh and corroded carbon steels, this study further compares and explores the effects of different wall substances in fresh and corroded carbon steels on the decay of residual chlorine.

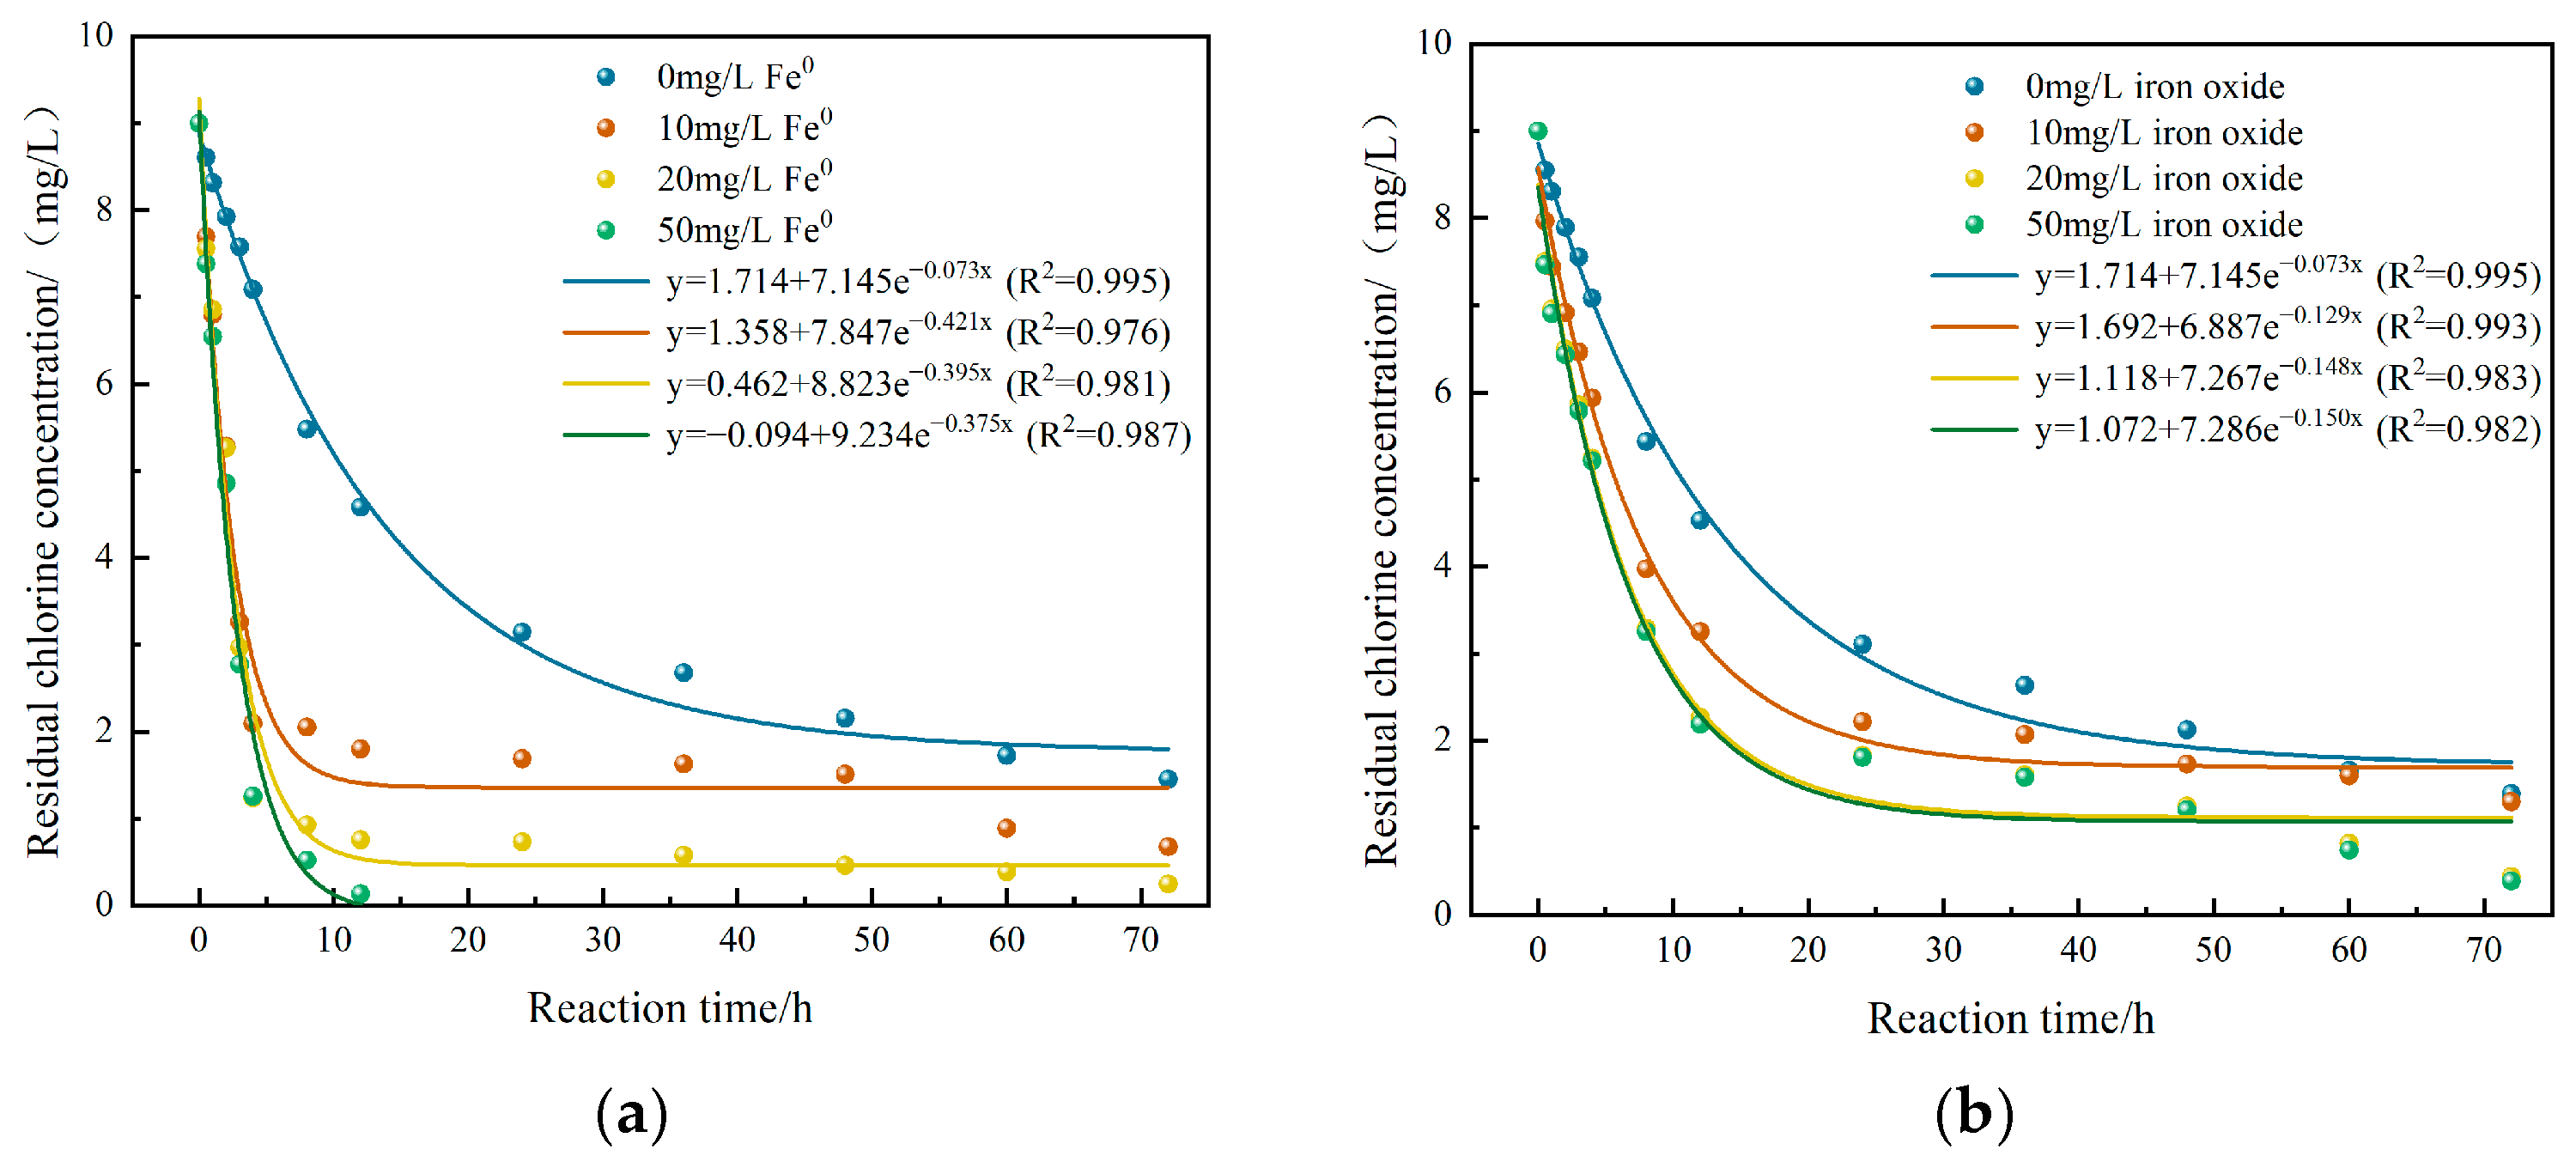
3.3.1. The Effects of Fe0 and Corrosion Products on the Decay Process of Residual Chlorine

When the initial free chlorine concentration is 9 mg/L, and different concentrations of Fe0 and corrosion products are added simultaneously, the residual chlorine decay process is shown in Figure 6. Through fitting analysis, it can be concluded that the decay process still conforms to the restricted first-order model.
As shown in Figure 6a, the residual chlorine concentration rapidly decreases within 4 h after the addition of Fe0. Afterwards, it enters a slow decline phase. As the concentration increases, the decay coefficient slightly decreases, and under experimental conditions, the decay coefficient is 5.14~5.77 times that of the untreated condition. This indicates that Fe0 significantly increases the consumption of sodium hypochlorite.
As shown in Figure 6b, compared with Fe0, the corrosion products also have the effect of accelerating the decay of residual chlorine, but the degree of influence is significantly lower. Under the experimental conditions, the decay coefficient is 1.77~2.05 times that of the untreated condition. As the concentration of corrosion products increases, the decay coefficient of residual chlorine also increases. However, the accelerated decay of residual chlorine by corrosion products has a saturation effect. Comparing the working conditions of 20 mg/L and 50 mg/L, it can be seen that the decay coefficient changes very little, indicating that 20 mg/L is approaching the limit point. Research has found that the presence of corrosion products in pipelines increases the consumption of chlorine, and in the presence of iron deposits, the rate of chlorine decay accelerates [38], which is consistent with the results of this study.
By comparing Figure 4 in Section 3.2, it can be seen that the decay coefficient of Fe0 in Figure 6 is 5.94~6.8 times higher than that in the fresh carbon steel condition. On the one hand, this is because the Fe0 content involved in the redox reaction in the fresh carbon steel condition is lower. On the other hand, in the static test, Fe0 is uniformly dispersed in the water in the form of particles, and its huge specific surface area significantly increases the effective contact interface with residual chlorine. Compared with the actual pipeline, the dispersed state of particles can provide more reaction sites, promoting the rapid progress of the redox reaction. The decay coefficient of corrosion products in the working condition is 60% to 65.6% lower than that of the corroded carbon steel condition, indicating that the influence of corrosion products is limited in actual operation. Microorganisms may be the main cause of the rapid decay of residual chlorine in the corroded carbon steel condition, which will be verified through the research in Section 3.3.2.

3.3.2. The Effects of Fe0 and Corrosion Products on Microbial Control Effectiveness

The control of microbial activity by sodium hypochlorite caused by the additions of Fe0 and corrosion products is shown in Figure 7.
According to Figure 7, in the absence of Fe0 and corrosion products, the microbial activity is very low, and the RLU value is controlled within 2000. After adding three concentrations of Fe0 and corrosion products, the activity of microorganisms increases. Under the condition of 50 mg/L Fe0, due to the rapid consumption of residual chlorine by Fe0, its microbial activity is more consistent with the condition without sodium hypochlorite. When adding 20 mg/L Fe0, the RLU value increases by 2.55~4.97 times compared to the 0 mg/L Fe0 working condition. When 20 mg/L of corrosion products are added, the RLU value increases by 1.56~3.85 times. According to Figure 6, in the presence of Fe0 and corrosion products, the additional consumption of residual chlorine will increase, and its reaction with residual chlorine will produce competitive decay, reducing the proportion of residual chlorine used to kill microorganisms and thus reducing the effectiveness of microbial control.
In addition, compared with Figure 2 in Section 3.1.1, it can be seen that under the 0 mg/L condition of the corroded carbon steel in the dynamic experiment, the peak microbial count at 8 h is 4.46 times that of the static experiment at 0 mg/L in this section. At the same time, the microbial control effect of the corroded carbon steel condition in the early stage is good in the dynamic experiment, which means that killing a large number of microorganisms in the water of the corroded carbon steel condition is the main reason for the significant decay of residual chlorine. This result also verifies the speculation in Section 3.3.1.
Therefore, based on the results of Section 3.3.1 and Section 3.3.2, new reclaimed water pipelines can use corrosion-resistant coatings to reduce wall corrosion and lower the consumption of disinfectants [39,40]. The corroded carbon steel pipelines that have been put into use need to be incrementally and frequently added to to more effectively kill microorganisms in the water and ensure disinfection effectiveness.

3.3.3. Discussion on the Mechanisms of Fe0 and Corrosion Products Affecting the Decay of Residual Chlorine

The rapid decay of residual chlorine under Fe0 conditions is mainly due to the strong reducibility of Fe0, while sodium hypochlorite is a strong oxidant that forms a chain-like consumption of sodium hypochlorite through redox reactions, as shown in Equations (5) and (6) [41,42]. Based on Figure 3 in Section 3.1.2, it can be seen that the surface of the fresh carbon steel does not have a protective oxide layer, and the exposed wall material comes into direct contact with sodium hypochlorite, resulting in a higher corrosion rate.
5 Fe + 6 HClO 3 FeCl 2 + 2 Fe OH 3
2 Fe 2 + + ClO + 2 H + 2 Fe 3 + + Cl + H 2 O
There are two pathways for the consumption of sodium hypochlorite by Fe0. Firstly, Fe0 reacts directly with HClO, consuming 1.2 mol of HClO per mol of Fe0. Secondly, the generated Fe2+ further reacts with ClO, consuming 0.5 mol of ClO per mol of Fe2+. In Equation (5), 3 mol Fe2+ is generated, corresponding to the subsequent consumption of 1.5 mol ClO. Therefore, 5 mol Fe0 results in a consumption of 7.5 mol ClO, with an average consumption of 1.5 mol ClO per mol Fe0. It can be seen that Fe0 consumes sodium hypochlorite through direct and indirect oxidation–reduction reactions, resulting in a rapid initial decay and significantly increased decay coefficient of residual chlorine in Figure 6. However, the decay coefficient decreases with the increase of Fe0 concentration, which is due to the limitation of reactant metering. In the experiment, the amount of sodium hypochlorite added is constant. When the Fe0 concentration is too high, sodium hypochlorite is rapidly consumed, and the subsequent reaction time only relies on a slow decay path, resulting in a decrease in the overall decay rate.
To explore the reasons for the decay of residual chlorine caused by corrosion products of the corroded carbon steel, XRD is used for crystal analysis, and the results are shown in Figure 8. The component information table is shown in Table 3.
According to Figure 8 and Table 3, the crystal structures present on the corroded carbon steel mainly include γ-FeOOH (lepidocrocite), α-FeOOH (goethite), Fe2O3 (hematite), and Fe3O4 (magnetite). The composition of corrosion products is similar to previous pipeline research results [43,44,45,46]. Research has found that ferrous ions on the surface of goethite react with chlorine, and the adsorption and modification of natural organic matter (NOM) on the surface of goethite lead to increased chlorine consumption [47,48]. Compared to goethite, the presence of magnetite results in comparable or even higher chlorine consumption [49]. In addition, trace metals such as Cu, Ni, and Cr may adsorb on the surface of iron oxides, preferentially promoting the reaction kinetics of chlorine consumption, leading to accelerated chlorine consumption [50]. In addition to iron oxides increasing the consumption of sodium hypochlorite, biofilm is also present in pipeline corrosion products. Lee et al. found that biofilm in reclaimed water systems is also a factor that increases the decay coefficient [51]. These factors all contribute to the promoting effect of corrosion products from the corroded carbon steel on the decay of residual chlorine.
According to Equation (6), the oxidation–reduction reaction between the corrosion products of the corroded carbon steel and sodium hypochlorite is mainly carried out by Fe2+, which consumes 0.5 mol ClO per mol Fe2+. Compared to Fe2+, Fe0 consumes three times more sodium hypochlorite. This also reflects that the influence of corrosion products on the decay of residual chlorine in Figure 6 is lower than the promoting effect of Fe0. Moreover, it can be seen from Figure 6 that the decay coefficient of residual chlorine under the Fe0 addition condition is 2.5~3.26 times that under the corrosion product condition. However, corrosion products are not entirely composed of effective concentrations of Fe2+, and there may also be Fe3+ and other components present. However, Fe3+ has weak reducibility, and as a stable valence state iron ion, it will not have a significant impact on the consumption of the oxidation–reduction reaction.

3.4. Discussion of the Effects of Fe0 and Corrosion Products on the Consumption of Sodium Hypochlorite and Decay Coefficients

3.4.1. The Effects of Fe0 and Corrosion Products on the Consumption of Sodium Hypochlorite

Based on the results of Section 3.2 and Section 3.3, this study further explores the consumption of sodium hypochlorite used for the bulk water reaction and pipe wall reaction under the addition of different pipe wall materials, iron powder, and corrosion products. Comparing the final concentrations of the fresh and corroded carbon steel conditions in Figure 4 at the initial concentration of 9 mg/L, combined with the research results in Figure 6, it can be concluded that the corresponding Fe0 and corrosion product concentrations are 5.5 mg/L and 50 mg/L. The residual chlorine decay process under different concentrations of Fe0 added in Figure 6 is fitted to obtain the residual chlorine decay process under the condition of 5.5 mg/L Fe0. The consumption of sodium hypochlorite for the bulk water and wall reaction is analyzed accordingly, and the results are shown in Figure 9. In Figure 9, the yellow column values represent the sodium hypochlorite consumed by the bulk water, the blue column values represent the sodium hypochlorite consumed jointly by Fe0 and the bulk water, and the purple column values represent the sodium hypochlorite consumed jointly by corrosion products and the bulk water. The blue line represents the average increase rate of Fe0 on the consumption of sodium hypochlorite, while the purple line represents the average increase rate of corrosion products on the consumption of sodium hypochlorite.
From Figure 7 and Figure 9, it can be seen that under the Fe0 condition, the content of Fe0 is relatively high in the early stage, and the number and activity of microorganisms are low. Therefore, the consumption of sodium hypochlorite is mainly due to the redox reaction of Fe0. At 4 h, the decay of residual chlorine reaches 63.9%, of which the consumption of Fe0 accounts for as high as 42.7%. However, as the reaction proceeds, the content of sodium hypochlorite and Fe0 rapidly decreases, while the number and activity of microorganisms continue to increase. At this time, the proportion of sodium hypochlorite used for disinfection of the bulk water gradually increases, reaching 39.1% at 8 h and up to 65.1% at 24 h. Compared with the Fe0 condition, the consumption rate of sodium hypochlorite is lower under the corrosion products condition. The consumption of sodium hypochlorite at 8 h is equivalent to that at 4 h under the Fe0 condition, and the proportion of sodium hypochlorite used for corrosion product consumption at 4 h is only 20.6%, while the proportion used for bulk water is 21.2%. The rate increase of Fe0 on sodium hypochlorite consumption is from 4.3% to 42.7%, with an average consumption increase rate of 18.9%. The rate increase of corrosion products on the consumption of sodium hypochlorite is 10~25.7%, with an average consumption increase rate of 17.4%.

3.4.2. The Effects of Fe0 and Corrosion Products on the Wall Decay Coefficients

In the water distribution system used for the bulk water and wall demands, the decay of free chlorine should be modeled separately because they have different functional dependencies. The total decay coefficient is usually expressed as the decay caused by the bulk water demand, known as the bulk decay, and the decay caused by the chlorine demand of the pipeline wall, known as the wall decay, as shown in Equation (7) [10,11].
k = k b + k w
Where k represents the total decay coefficient, h−1; k b represents the bulk decay coefficient, h−1; and k w represents the wall decay coefficient, h−1.
The decay coefficients and model parameters under the conditions of adding Fe0 and corrosion products are shown in Table 4.
According to Table 4, the bulk decay coefficient is 0.073 h−1. Under the conditions of adding Fe0 and corrosion products, the total decay coefficients are 0.277 h−1 and 0.150 h−1, respectively. The wall decay coefficient represented by Fe0 is 0.204 h−1, and the wall decay coefficient represented by corrosion products is 0.077 h−1. Hallamn N.B. et al.’s study found that the variability in the cast iron decay constants was large, varying between 0.03 h−1 and 1.64 h−1 [11]. This variation will, in part, be related to the condition of the pipe itself. The wall coefficients reflected by Fe0 and corrosion products in this study are both within this range of variation.
The wall decay coefficient represented by Fe0 is significantly higher than that of the corrosion products. This is because iron powder, as a reducing agent, easily reacts with chlorine, and the surface area for mass transfer is relatively large, with a large number of reaction sites. Research shows that, the higher the surface to volume ratio, the larger the surface area across which mass transfer can occur, and the greater the number of reactive sites available for each unit volume of water passing down the pipe [11]. Previous in situ studies have also shown that unlined cast iron pipes have decay rates between 4 and 100 times greater than lined or plastic pipes [52]. It can be seen that for highly reactive pipelines with large wall decay coefficients, coating or lining anti-corrosion measures are necessary.
Under the same environmental conditions, the initial chlorine concentration is consistent and relatively sufficient, and the wall decay is limited by the reactivity of the wall material. The wall decay coefficient due to Fe0 is 2.65 times higher than that due to corrosion products. Due to the direct oxidation of Fe0, it rapidly and initially consumes chlorine at a high rate. The chemical properties of the corrosion products result in a reaction rate lower than Fe0, but they continue to consume chlorine during the reaction process. Although the porous structure of corrosion products increases the water–solid contact interface and facilitates the diffusion of chlorine to the active sites, pore blockage may also limit mass transfer. In addition, due to hydraulic loads and water flow impacts, corrosion products in the actual pipeline network may peel off and regenerate, resulting in a wall decay coefficient that may be between that of Fe0 and corrosion products.

4. Conclusions

This article mainly focuses on the comparison of the influences of fresh and corroded carbon steels on the decay law of sodium hypochlorite in reclaimed water. The results show the following:
(1)
Under the conditions of fresh and corroded carbon steels, adding sodium hypochlorite to achieve initial free chlorine concentrations of 5 mg/L and 9 mg/L can relatively more effectively achieve disinfection effects, while the corrosion rate is the lowest. Under the conditions of the fresh carbon steel, it has a good control effect on microorganisms, and the effect of sodium hypochlorite can last for about 48 h. Under the conditions of the corroded carbon steel, the microbial activity is relatively high, and the recommended dosing frequency is once every 8 h.
(2)
The decay law of residual chlorine in both fresh and corroded carbon steel conditions conforms to the restricted first-order decay model. The decay coefficient of residual chlorine under the corroded carbon steel conditions is 2.61~6.94 times that of the fresh carbon steel. Compared with the fresh carbon steel, the average consumption of sodium hypochlorite under the corroded carbon steel conditions will increase by 13.91% to 26.57%. The corrosion products and high microbial content in the corroded carbon steel are the main reasons for accelerating the consumption of sodium hypochlorite.
(3)
Fe0 accelerates the consumption of sodium hypochlorite in the first 4 h, with the highest consumption rate reaching 42.7%. The corrosion products rapidly consume sodium hypochlorite in the first 12 h, with a consumption rate of up to 25.7%. As time goes on, the consumption of sodium hypochlorite by Fe0 and corrosion products decreases. Under experimental conditions, the average consumption increase rates of sodium hypochlorite by Fe0 and corrosion products are 18.9% and 17.4%, respectively. The results also show that the bulk decay coefficient is 0.073. Additionally, the wall decay coefficient represented by Fe0 is 0.204, which is higher than the wall decay coefficient represented by corrosion products, which is 0.077.
Therefore, attention needs to be paid to the coating of new iron pipelines against corrosion. Future research could be supplemented with studies of actual pipelines with a variety of materials and in different states of use.

Author Contributions

Conceptualization, P.X.; methodology, X.W. and B.L.; software, X.W.; validation, P.X.; formal analysis, X.W. and B.L.; investigation, X.W. and B.L.; resources, P.X.; data curation, X.W. and B.L.; writing—original draft preparation, X.W.; writing—review and editing, P.X.; visualization, X.W. and B.L.; supervision, P.X.; project administration, P.X.; funding acquisition, P.X. All authors have read and agreed to the published version of the manuscript.

Funding

This research was funded by the National Natural Science Foundation of China, grant number No. 51578035, and the Design of Statistical Indicators and Methods for Domestic Water Conservation, grant number No. H19124.

Data Availability Statement

The data presented in this study are available on request from the corresponding author. The data are not publicly available due to privacy.

Conflicts of Interest

Author Bo Liu was employed by the company China Kunlun Contracting and Engineering Corporation (CKCEC). The remaining authors declare that the research was conducted in the absence of any commercial or financial relationships that could be construed as a potential conflict of interest.

References

  1. Caicedo, C.; Rosenwinkel, K.-H.; Exner, M.; Verstraete, W.; Suchenwirth, R.; Hartemann, P.; Nogueira, R. Legionella Occurrence in Municipal and Industrial Wastewater Treatment Plants and Risks of Reclaimed Wastewater Reuse: Review. Water Res. 2019, 149, 21–34. [Google Scholar] [CrossRef] [PubMed]
  2. Al-Jassim, N.; Ansari, M.I.; Harb, M.; Hong, P.-Y. Removal of Bacterial Contaminants and Antibiotic Resistance Genes by Conventional Wastewater Treatment Processes in Saudi Arabia: Is the Treated Wastewater Safe to Reuse for Agricultural Irrigation? Water Res. 2015, 73, 277–290. [Google Scholar] [CrossRef] [PubMed]
  3. Liu, B.; Wang, Y.; Wu, Y.; Hu, H. Effect of Ultraviolet Disinfection on Growth and Secretion Characteristics of Microorganism in Reclaimed Water. Environ. Eng. 2020, 38, 28–34. [Google Scholar] [CrossRef]
  4. García-Ávila, F.; Sánchez-Alvarracín, C.; Cadme-Galabay, M.; Conchado-Martínez, J.; García-Mera, G.; Zhindón-Arévalo, C. Relationship between Chlorine Decay and Temperature in the Drinking Water. MethodsX 2020, 7, 101002. [Google Scholar] [CrossRef]
  5. Li, C.; Yang, Y.J.; Yu, J.; Zhang, T.; Mao, X.; Shao, W. Second-Order Chlorine Decay and Trihalomethanes Formation in a Pilot-Scale Water Distribution Systems. Water Environ. Res. 2012, 84, 656–661. [Google Scholar] [CrossRef] [PubMed]
  6. Blokker, M.; Vreeburg, J.; Speight, V. Residual Chlorine in the Extremities of the Drinking Water Distribution System: The Influence of Stochastic Water Demands. Procedia Eng. 2014, 70, 172–180. [Google Scholar] [CrossRef]
  7. Liu, C.; Von Gunten, U.; Croué, J.-P. Enhanced Chlorine Dioxide Decay in the Presence of Metal Oxides: Relevance to Drinking Water Distribution Systems. Environ. Sci. Technol. 2013, 47, 8365–8372. [Google Scholar] [CrossRef]
  8. Monteiro, L.; Viegas, R.M.C.; Covas, D.I.C.; Menaia, J. Modelling Chlorine Residual Decay as Influenced by Temperature. Water Environ. J. 2015, 29, 331–337. [Google Scholar] [CrossRef]
  9. Liu, J.Q.; Jiang, W.; Wu, J.M.; Li, C. The Influence of Total Hardness on Chlorine Decay in Water Distribution Systems. Appl. Mech. Mater. 2014, 535, 776–784. [Google Scholar] [CrossRef]
  10. Hua, F.; West, J.R.; Barker, R.A.; Forster, C.F. Modelling of Chlorine Decay in Municipal Water Supplies. Water Res. 1999, 33, 2735–2746. [Google Scholar] [CrossRef]
  11. Hallam, N.B.; West, J.R.; Forster, C.F.; Powell, J.C.; Spencer, I. The Decay of Chlorine Associated with the Pipe Wall in Water Distribution Systems. Water Res. 2002, 36, 3479–3488. [Google Scholar] [CrossRef]
  12. Pandey, S.; Lemmons, D.; de Alwis, C.; Mackie, R.; Kolodge, D.; Perrine, K.A. Reactions of Disinfectants at Solution/Iron Interfaces: Modeling Pipeline Surface Chemistry. Appl. Surf. Sci. 2025, 684, 161876. [Google Scholar] [CrossRef]
  13. Baig, S.A.; Lou, Z.; Baig, M.A.; Qasim, M.; Shams, D.F.; Mahmood, Q.; Xu, X. Assessment of Tap Water Quality and Corrosion Scales from the Selected Distribution Systems in Northern Pakistan. Environ. Monit. Assess. 2017, 189, 194. [Google Scholar] [CrossRef]
  14. Safiur Rahman, M.; Whalen, M.; Gagnon, G.A. Adsorption of Dissolved Organic Matter (DOM) onto the Synthetic Iron Pipe Corrosion Scales (Goethite and Magnetite): Effect of pH. Chem. Eng. J. 2013, 234, 149–157. [Google Scholar] [CrossRef]
  15. Zhang, H.; Liu, D.; Zhao, L.; Wang, J.; Xie, S.; Liu, S.; Lin, P.; Zhang, X.; Chen, C. Review on Corrosion and Corrosion Scale Formation upon Unlined Cast Iron Pipes in Drinking Water Distribution Systems. J. Environ. Sci. 2022, 117, 173–189. [Google Scholar] [CrossRef] [PubMed]
  16. Li, R.A.; McDonald, J.A.; Sathasivan, A.; Khan, S.J. Disinfectant Residual Stability Leading to Disinfectant Decay and By-Product Formation in Drinking Water Distribution Systems: A Systematic Review. Water Res. 2019, 153, 335–348. [Google Scholar] [CrossRef] [PubMed]
  17. HG/T 3523-2008; Technical Conditions of Standard Corrosion Spool of Chemical Treatment in Cooling Water. The Standardization Administration of the People’s Republic of China: Beijing, China, 2008.
  18. Zhou, X.; Zhao, J.; Li, Z.; Song, J.; Li, X.; Yang, X.; Wang, D. Enhancement Effects of Ultrasound on Secondary Wastewater Effluent Disinfection by Sodium Hypochlorite and Disinfection By-Products Analysis. Ultrason. Sonochem. 2016, 29, 60–66. [Google Scholar] [CrossRef]
  19. Douterelo, I.; Husband, S.; Boxall, J.B. The Bacteriological Composition of Biomass Recovered by Flushing an Operational Drinking Water Distribution System. Water Res. 2014, 54, 100–114. [Google Scholar] [CrossRef]
  20. Garner, E.; McLain, J.; Bowers, J.; Engelthaler, D.M.; Edwards, M.A.; Pruden, A. Microbial Ecology and Water Chemistry Impact Regrowth of Opportunistic Pathogens in Full-Scale Reclaimed Water Distribution Systems. Environ. Sci. Technol. 2018, 52, 9056–9068. [Google Scholar] [CrossRef]
  21. Li, D.; Zeng, S.; Gu, A.Z.; He, M.; Shi, H. Inactivation, Reactivation and Regrowth of Indigenous Bacteria in Reclaimed Water after Chlorine Disinfection of a Municipal Wastewater Treatment Plant. J. Environ. Sci. 2013, 25, 1319–1325. [Google Scholar] [CrossRef]
  22. Li, W.; Tian, Y.; Chen, J.; Wang, X.; Zhou, Y.; Shi, N. Synergistic Effects of Sodium Hypochlorite Disinfection and Iron-Oxidizing Bacteria on Early Corrosion in Cast Iron Pipes. Front. Environ. Sci. Eng. 2021, 16, 72. [Google Scholar] [CrossRef]
  23. Liu, T.; Cheng, Y.F.; Sharma, M.; Voordouw, G. Effect of Fluid Flow on Biofilm Formation and Microbiologically Influenced Corrosion of Pipelines in Oilfield Produced Water. J. Pet. Sci. Eng. 2017, 156, 451–459. [Google Scholar] [CrossRef]
  24. Jia, Y.; Qi, B.; Zhao, J.; Guo, X.; Dong, W.; Lv, X.; Dai, Z.; Yuan, Y. Recent Challenges and Research Progress in Microbiologically Influenced Corrosion in Drinking Water Distribution Systems. Environ. Technol. Innov. 2025, 38, 104054. [Google Scholar] [CrossRef]
  25. Liu, X.; Wang, Y.; Song, Y.; Liu, W.; Zhang, J.; Li, N.; Dong, K.; Cai, Y.; Han, E.-H. The Respective Roles of Sulfate-Reducing Bacteria (SRB) and Iron-Oxidizing Bacteria (IOB) in the Mixed Microbial Corrosion Process of Carbon Steel Pipelines. Corros. Sci. 2024, 240, 112479. [Google Scholar] [CrossRef]
  26. Emerson, D. The Role of Iron-Oxidizing Bacteria in Biocorrosion: A Review. Biofouling 2018, 34, 989–1000. [Google Scholar] [CrossRef] [PubMed]
  27. Su, W.; Tian, Y.; Peng, S. The Influence of Sodium Hypochlorite Biocide on the Corrosion of Carbon Steel in Reclaimed Water Used as Circulating Cooling Water. Appl. Surf. Sci. 2014, 315, 95–103. [Google Scholar] [CrossRef]
  28. Fukuzaki, S. Mechanisms of Actions of Sodium Hypochlorite in Cleaning and Disinfection Processes. Biocontrol Sci. 2006, 11, 147–157. [Google Scholar] [CrossRef]
  29. Zhang, Y.; Li, S.; Xu, P.; Lu, L.; Sun, L. Effect of NaClO Addition on Bacteriostasis of Iron Bacteria and Corrosion Control of Pipe Line Steel for Water Distribution Network in Urban Reclaimed Water. Corros. Sci. Prot. Technol. 2015, 27, 165–170. (In Chinese) [Google Scholar] [CrossRef]
  30. Feben, D.; Taras, M.J.; Faber, H.A.; Hedgepeth, L.L. Studies on Chlorine Demand Constants [with Discussion]. J. (Am. Water Work. Assoc.) 1951, 43, 922–932. [Google Scholar] [CrossRef]
  31. Clark, R.M.; Sivaganesan, M. Predicting Chlorine Residuals and Formation of TTHMs in Drinking Water. J. Environ. Eng. 1998, 124, 1203–1210. [Google Scholar] [CrossRef]
  32. Kastl, G.J.; Fisher, I.H.; Jegatheesan, V. Evaluation of Chlorine Decay Kinetics Expressions for Drinking Water Distribution Systems Modelling. J. Water Supply Res. Technol.-Aqua 1999, 48, 219–226. [Google Scholar] [CrossRef]
  33. Powell, J.C.; West, J.R.; Hallam, N.B.; Forster, C.F.; Simms, J. Performance of Various Kinetic Models for Chlorine Decay. J. Water Resour. Plan. Manag. 2000, 126, 13–20. [Google Scholar] [CrossRef]
  34. Jonkergouw, P.M.R.; Khu, S.-T.; Savic, D.A.; Zhong, D.; Hou, X.Q.; Zhao, H.-B. A Variable Rate Coefficient Chlorine Decay Model. Environ. Sci. Technol. 2009, 43, 408–414. [Google Scholar] [CrossRef]
  35. Clark, R.M. Chlorine Demand and TTHM Formation Kinetics: A Second-Order Model. J. Environ. Eng. 1998, 124, 16–24. [Google Scholar] [CrossRef]
  36. Al-Jasser, A.O. Chlorine Decay in Drinking-Water Transmission and Distribution Systems: Pipe Service Age Effect. Water Res. 2007, 41, 387–396. [Google Scholar] [CrossRef]
  37. Norton, C.D.; LeChevallier, M.W. A Pilot Study of Bacteriological Population Changes through Potable Water Treatment and Distribution. Appl. Environ. Microbiol. 2000, 66, 268–276. [Google Scholar] [CrossRef] [PubMed]
  38. Sharma, V.K.; Yang, X.; Cizmas, L.; McDonald, T.J.; Luque, R.; Sayes, C.M.; Yuan, B.; Dionysiou, D.D. Impact of Metal Ions, Metal Oxides, and Nanoparticles on the Formation of Disinfection Byproducts during Chlorination. Chem. Eng. J. 2017, 317, 777–792. [Google Scholar] [CrossRef]
  39. Chen, W.; Chen, J. Formation and Prevention of Pipe Scale in Water Supply Pipelines with Anti-Corrosion Lining. Water Supply 2022, 22, 4006–4014. [Google Scholar] [CrossRef]
  40. Galleguillos Madrid, F.M.; Soliz, A.; Cáceres, L.; Bergendahl, M.; Leiva-Guajardo, S.; Portillo, C.; Olivares, D.; Toro, N.; Jimenez-Arevalo, V.; Páez, M. Green Corrosion Inhibitors for Metal and Alloys Protection in Contact with Aqueous Saline. Materials 2024, 17, 3996. [Google Scholar] [CrossRef]
  41. Zhang, Z.; Stout, J.E.; Yu, V.L.; Vidic, R. Effect of Pipe Corrosion Scales on Chlorine Dioxide Consumption in Drinking Water Distribution Systems. Water Res. 2008, 42, 129–136. [Google Scholar] [CrossRef]
  42. Rahman, M.S.; Gagnon, G.A. Bench-Scale Evaluation of Drinking Water Treatment Parameters on Iron Particles and Water Quality. Water Res. 2014, 48, 137–147. [Google Scholar] [CrossRef] [PubMed]
  43. Zhang, H.; Zhao, L.; Liu, D.; Wang, J.; Zhang, X.; Chen, C. Early Period Corrosion and Scaling Characteristics of Ductile Iron Pipe for Ground Water Supply with Sodium Hypochlorite Disinfection. Water Res. 2020, 176, 115742. [Google Scholar] [CrossRef] [PubMed]
  44. Sancy, M.; Gourbeyre, Y.; Sutter, E.M.M.; Tribollet, B. Mechanism of Corrosion of Cast Iron Covered by Aged Corrosion Products: Application of Electrochemical Impedance Spectrometry. Corros. Sci. 2010, 52, 1222–1227. [Google Scholar] [CrossRef]
  45. Li, M.; Liu, Z.; Chen, Y.; Hai, Y. Characteristics of Iron Corrosion Scales and Water Quality Variations in Drinking Water Distribution Systems of Different Pipe Materials. Water Res. 2016, 106, 593–603. [Google Scholar] [CrossRef]
  46. Little, B.J.; Gerke, T.L.; Lee, J.S. Mini-Review: The Morphology, Mineralogy and Microbiology of Accumulated Iron Corrosion Products. Biofouling 2014, 30, 941–948. [Google Scholar] [CrossRef]
  47. Hassan, K.Z.A.; Bower, K.C.; Miller, C.M. Iron Oxide Enhanced Chlorine Decay and Disinfection By-Product Formation. J. Environ. Eng. 2006, 132, 1609–1616. [Google Scholar] [CrossRef]
  48. Hu, C.-Y.; Zhang, J.; Xu, B.; Lin, Y.-L.; Zhang, T.-Y.; Tian, F.-X. Effect of Pipe Corrosion Product–Goethite–on the Formation of Disinfection by-Products during Chlorination. Desalination Water Treat. 2016, 57, 553–561. [Google Scholar] [CrossRef]
  49. Hua, P.; Gao, Q.; Wang, Z.; Jiang, S.; de Oliveira, K.R.F.; Macedo, D.O. Modeling and Elucidation the Effects of Iron Deposits on Chlorine Decay and Trihalomethane Formation in Drinking Water Distribution System. Water Res. 2021, 207, 117804. [Google Scholar] [CrossRef]
  50. Chebeir, M.; Liu, H. Oxidation of Cr(III)–Fe(III) Mixed-Phase Hydroxides by Chlorine: Implications on the Control of Hexavalent Chromium in Drinking Water. Environ. Sci. Technol. 2018, 52, 7663–7670. [Google Scholar] [CrossRef]
  51. Lee, H.D.; Park, J.H.; Kang, S.W.; Kong, M.S. A Study on Evaluation of the Pipe Wall Decay Constants of Residual Chlorine and Affecting Factors in Reclaimed Water Supply System. Desalination Water Treat. 2015, 53, 2378–2387. [Google Scholar] [CrossRef]
  52. Vasconcelos, J.J. Characteristics and Modeling of Chlorine Decay in Distribution Systems; AWWA Research Foundation: Denver, CO, USA, 1996. [Google Scholar]
Figure 1. Physical photos and schematic diagram of the rotating hanging plate reactor. (a) Physical photos; (b) schematic diagram.
Water 17 01428 g001
Figure 2. Microbial activity under the influences of fresh and corroded carbon steels. (a) Fresh carbon steel; (b) corroded carbon steel.
Water 17 01428 g002
Figure 3. Corrosion rates of fresh and corroded carbon steels at different initial concentrations. (a) Fresh carbon steel; (b) corroded carbon steel.
Water 17 01428 g003
Figure 4. The decay process of residual chlorine at different initial concentrations.
Water 17 01428 g004
Figure 5. Relative additional consumption of the corroded carbon steel.
Water 17 01428 g005
Figure 6. The decay process of residual chlorine under the additions of Fe0 and corrosion products. (a) Fe0; (b) corrosion products.
Water 17 01428 g006
Figure 7. Changes in microbial activity caused by the additions of Fe0 and corrosion products. (a) Fe0; (b) corrosion products.
Water 17 01428 g007
Figure 8. XRD absorption peaks of corrosion products from the corroded carbon steel.
Water 17 01428 g008
Figure 9. Consumption rates of sodium hypochlorite under the additions of Fe0 and corrosion products.
Water 17 01428 g009
Table 1. Parameters of the restricted first-order decay model.
Working ConditionabkR2
Fresh carbon steel and 13 mg/L2.44410.0930.0670.989
Corroded carbon steel and 13 mg/L1.83110.9980.1750.979
Fresh carbon steel and 9 mg/L1.0717.8160.0540.996
Corroded carbon steel and 9 mg/L0.8988.2410.3750.987
Fresh carbon steel and 5 mg/L0.4134.6660.0710.996
Corroded carbon steel and 5 mg/L0.5254.2970.3430.985
Table 2. Parameters of the first-order decay model and second-order decay model.
Working ConditionC0 (1st)kR2 (1st)C0 (2nd)RuR2 (2nd)
Fresh carbon steel and 13 mg/L11.8950.0330.96212.8140.9710.0020.995
Corroded carbon steel and 13 mg/L12.0670.1020.92013.2350.9330.0160.988
Fresh carbon steel and 9 mg/L8.6630.0380.9879.2150.9990.0000.993
Corroded carbon steel and 9 mg/L8.8970.2860.9429.3880.9480.0290.979
Fresh carbon steel and 5 mg/L4.9690.0550.9895.3040.9990.0000.988
Corroded carbon steel and 5 mg/L4.6480.2470.9335.0400.9340.0350.991
Table 3. Component information table of corrosion products.
Ref. CodeScoreCompound NameComponent RatioChemical Formula
00-022-035316Iron oxide hydroxide31.2%γ-FeOOH
01-072-046914Iron(III) oxide5.4%Fe2O3
00-026-113613Iron oxide20.3%Fe3O4
01-089-609614Iron oxide hydroxide43.1%α-FeOOH
Table 4. Decay coefficients and model parameters.
Working ConditionabkkbkwR2
The bulk of the water1.7147.1450.0730.07300.995
The bulk of the water and 5.5 mg/L Fe01.8057.1240.2770.0730.2040.967
The bulk of the water and
50 mg/L corrosion products
1.0727.2860.1500.0730.0770.982
Disclaimer/Publisher’s Note: The statements, opinions and data contained in all publications are solely those of the individual author(s) and contributor(s) and not of MDPI and/or the editor(s). MDPI and/or the editor(s) disclaim responsibility for any injury to people or property resulting from any ideas, methods, instructions or products referred to in the content.

