1. Introduction
Water overconsumption, pollution, and unchecked global warming are draining freshwater bodies and threatening the development, health, resilience, and prosperity of people and the planet alike [
1]. Transformational change in the agriculture sector as a large yet least productive water user [
2] is required to shift water resource allocation and use onto sustainable pathways such as increased and improved environmental flows. The success of that transformation choice can be measured by the costs and benefits of that policy, where economics can justify expenditure by explaining the patterns of public policy intervention benefits and costs consistent with Public Interest Theory [
3].
Economists use policy costs and benefits to evaluate private and public welfare changes, rank/modify proposed policies to identify/select superior options, and calculate the magnitude/direction (patterns) of policy investments over time. A variety of techniques (e.g., contingent valuation, production function, hedonic pricing, and benefit transfer) can be employed to assign monetary values to the benefits and abatement costs (e.g., policy costs borne by economic agents, including opportunity costs, such as the construction and operation of infrastructures, caps, or charges [
4]) of capital infrastructure investment and policy interventions, including non-market values, leveraging the theory of Total Economic Value [
5]. Yet, transaction costs associated with the enactment, administration, monitoring, redesign, and possible lock-in of policies [
6] have proven more challenging to quantify and incorporate into economic assessments of policy design [
7]. Consequently, much of the last two decades have been spent improving transaction cost definitions, developing methods for their quantification, and understanding their impact on environmental policy. This has included the interaction between abatement and transaction costs (e.g., [
8,
9,
10]), the relevance of transaction costs on improved environmental outcomes (e.g., [
11,
12,
13]), and whether transaction cost magnitude and direction (i.e., patterns) over time signal environmental policy adaptive efficiency (e.g., [
14,
15]). This is why Marshall [
16], amongst others, stresses the requirement to account for both
AC and
TC in any assessment or measurement of environmental policy.
However, despite this recommendation, a framework enabling the combination of
AC and
TC for environmental policy evaluation remains absent. Further, environmental policy evaluation using transaction costs has not been as prolific despite McCann and Easter [
8] recommending the inclusion of abatement and transaction costs into benefit–cost analysis (BCA) to evaluate environmental policies. An exception is Pannell et al. [
17] who provide a framework aimed at calculating the ex ante benefit–cost ratios (BCR) for selecting between policy alternatives via the quantification or assessment of transaction costs. This is an innovation in the literature that, to date, has not been much advanced and leaves many questions unanswered:
First, while ex ante evaluation perspectives may be common for environmental policy, what if the context involves ex post or in situ (i.e., between policy iterations) scenarios? How might this alter future policy investment choices?
Second, should policy evaluation, whatever the context, be based solely on a BCR value alone as per techno-economic assessments or, as is more common in traditional BCA, should the other evaluation tests (i.e., net present value [NPV] and internal rate of return [IRR]) also be calculated and reviewed?
Third, if decision-making by policy target groups (e.g., farmers) changes ex post, how can we incorporate that into policy evaluation under renewed abatement/transaction costs to inform future investment choices if our (current) focus is largely ex ante?
Finally, ex ante perspectives may prevent the inclusion of lock-in costs in the analyses that are important from a policy-effectiveness perspective [
17]. The analysis of lock-in costs is possible using adaptive efficiency metrics [
14] but only ex post. So, does ex ante dual (i.e., benefit-maximising) optimisation via transaction cost synthesis (i.e., higher, lower, or stable transaction cost scenarios) offer useful or informative alternative evaluation criteria to the current primal (cost-minimisation) emphasis?
These questions are important for advancing transaction cost literature back to the more familiar arena of economic evaluation analysis. Our framework is also important within a context where transaction costs continue to be poorly understood by government agencies and their staff, such that ignorance of these costs and their relevance continues to confound economic evaluations of government investments (e.g., [
18]). The obfuscation of transaction costs and their impact on environmental policy may enable politicians and government staff to avoid accountability with respect to social welfare maximisation, instead preferencing poor governance structures/weakened institutions. Finally, any reluctance/incapacity to account for lock-in costs risks policies that limit adaptive capacity over time could raise future total economic costs by reducing effectiveness and adaptive efficiency. The objective of this paper is (i) to suggest an extension based on Pannell et al.’s [
17] environmental policy evaluation framework, which enables alternative contexts/tests; and (ii) to evaluate the usefulness of that framework to answer the questions above via an example case of an environmental policy aimed at increased ecological water flows in the Douro River Basin, Spain.
2. Case Study Background: The Douro River Basin (DRB), Spain
The environmental policy objective of interest to the paper is improved ecosystem flows. In Europe, the Water Framework Directive (WFD) commits Member States to actions that improve the ecological status of water bodies [
19]. River Basin Authorities (RBAs) must deliver a river basin plan detailing the necessary measures to achieve minimum environmental flows. Further, the WFD requires economic analyses (e.g., cost-effectiveness) to evaluate policies following the Common Implementation Strategy (CIS) [
20], including cost-effectiveness based on defined categories and indicators of costs (e.g., abatement costs) and effectiveness (e.g., environmental flows). Yet, institutional transaction costs are ignored. This is concerning when one considers that all EU river basin plans undergo a renewed cycle of planning every six years where design, enactment, administration, and monitoring costs will be invested, which are unaccounted for in any economic evaluation. Finally, the benefits of the policy at the basin level are not mentioned because the focus is typically placed on cost-effectiveness.
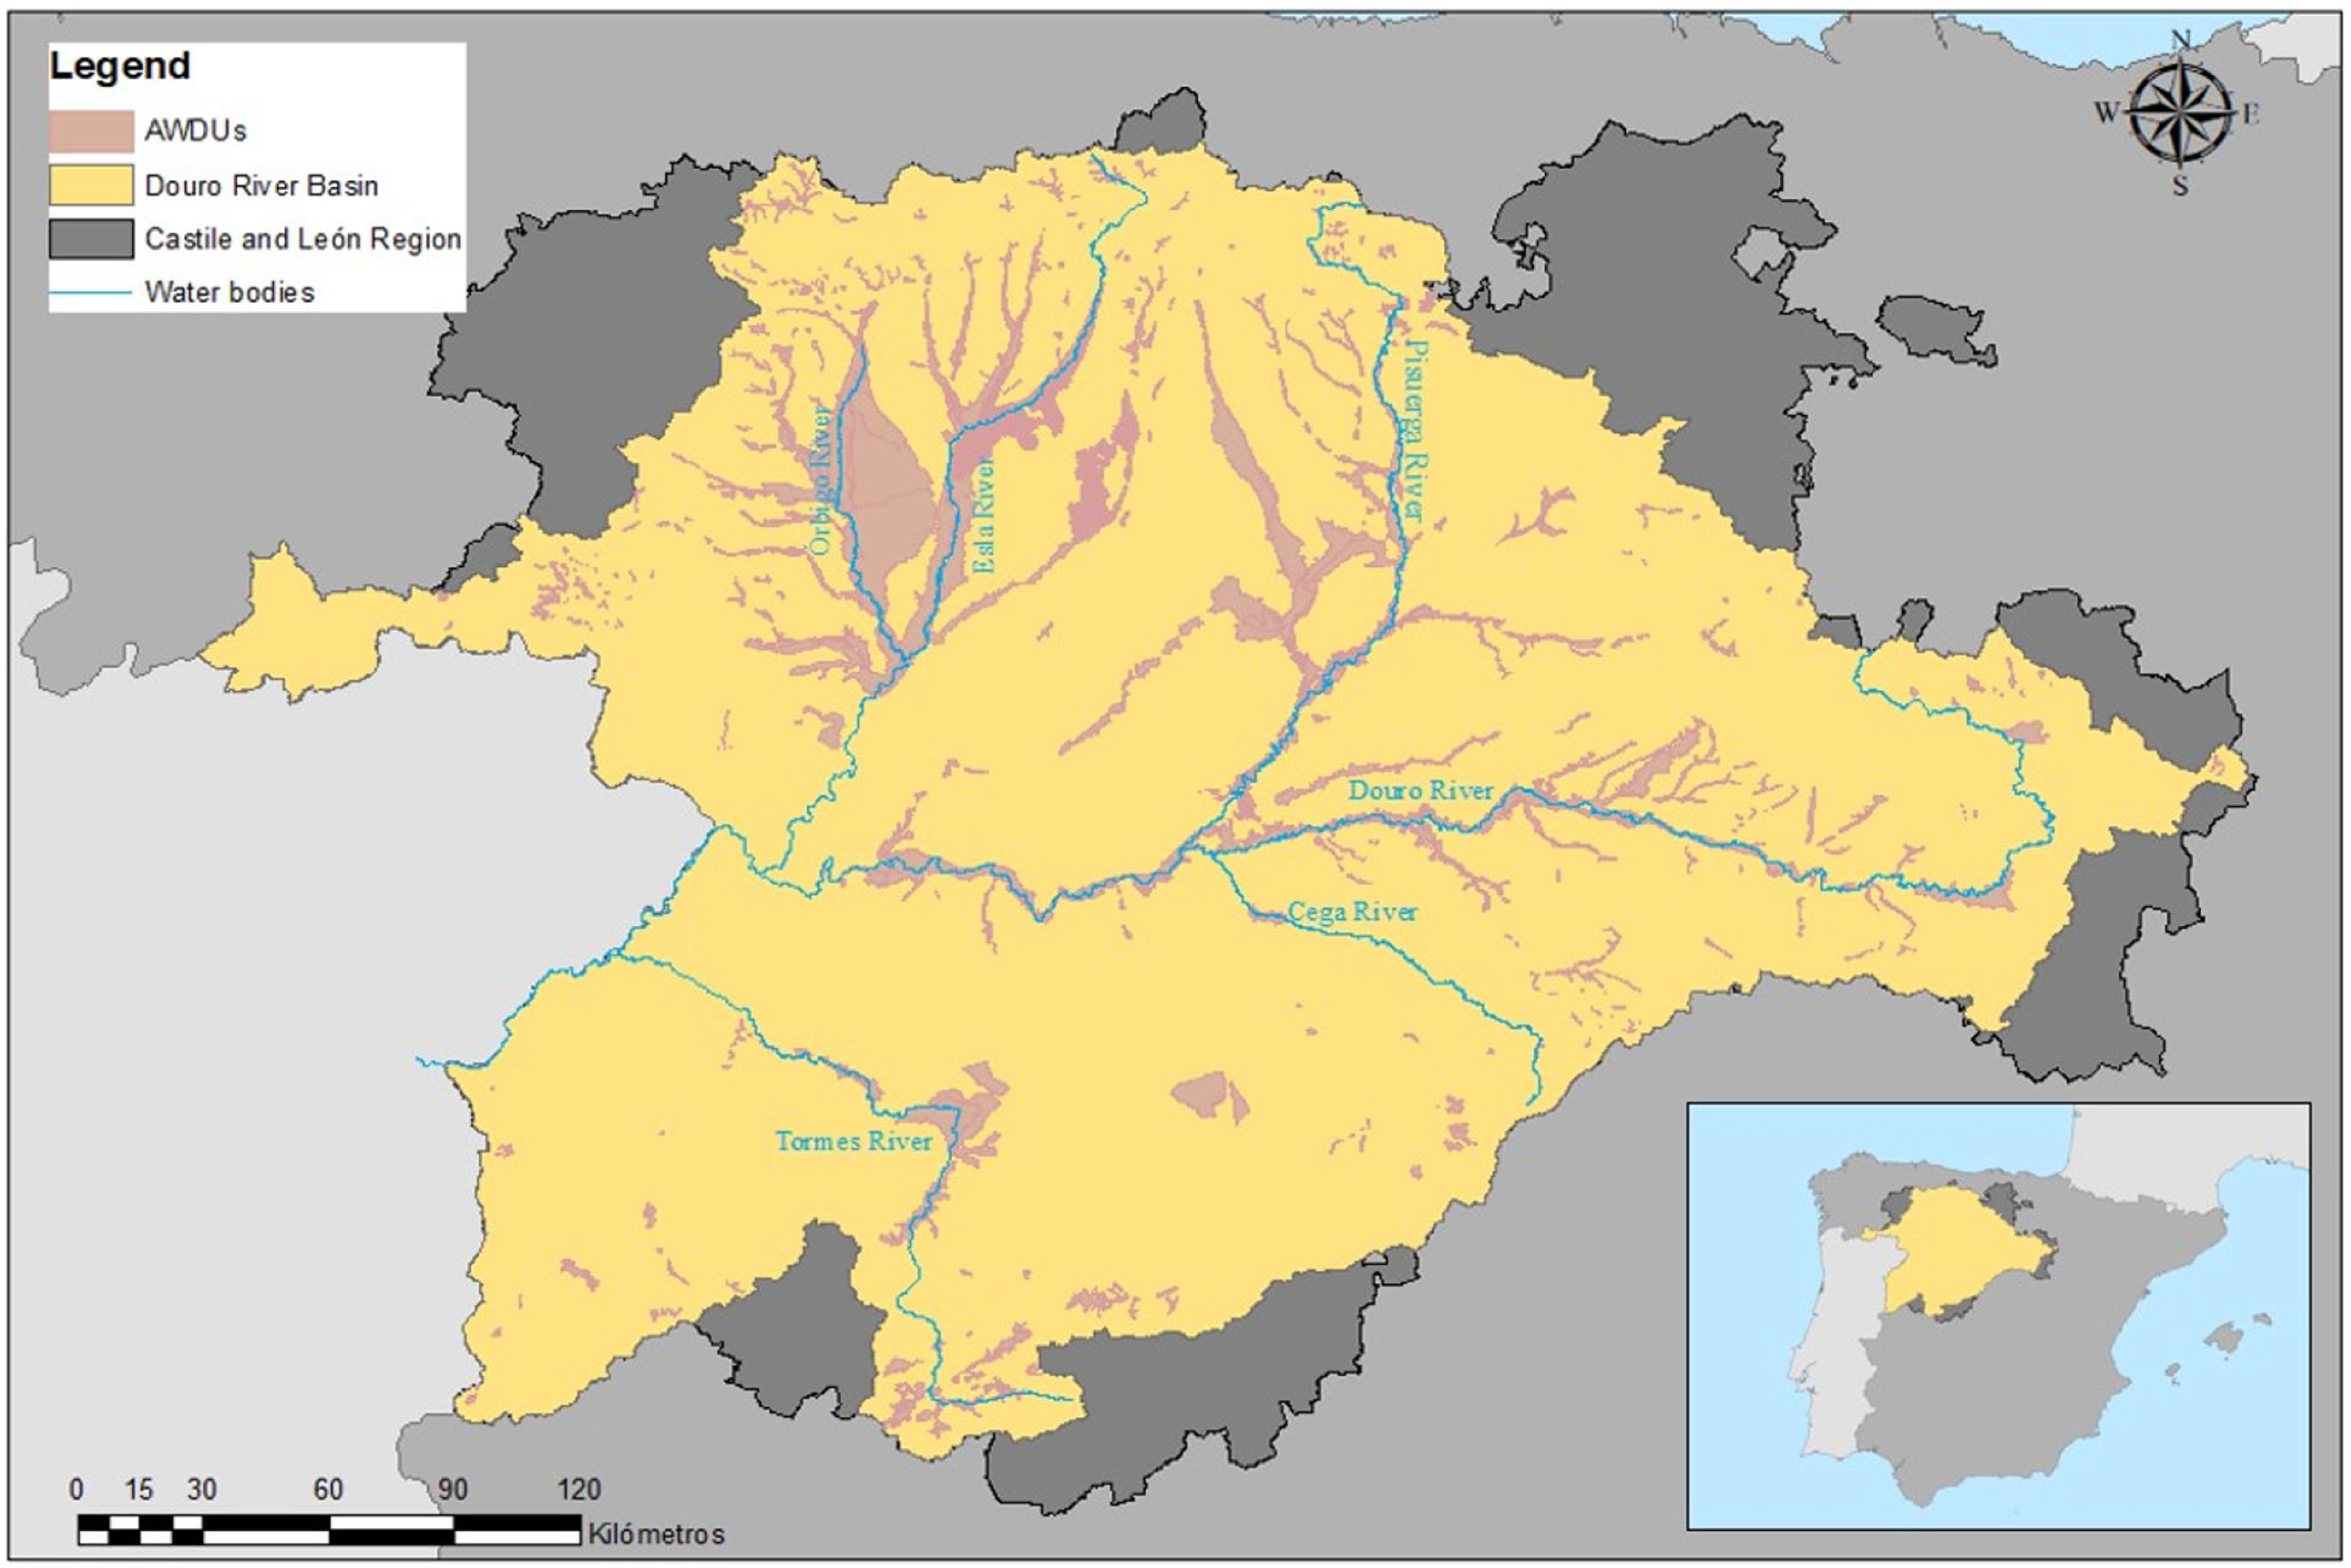
Our study focuses on the Douro River Basin in Spain or DRB (
Figure 1). The Spanish Douro River Basin comprises an area of 97,290 km
2, which roughly matches the area occupied by the Spanish region (NUTS2 (The Nomenclature des Unités Territoriales Statistiques (NUTS) is a hierarchical system for dividing up the economic territory of the EU (Eurostat, 2020). In Spain, NUTS2 refers to regions of Castile and León—the largest region in Spain and the second largest in Europe (after the region of Upper Norrland in Swedish Lapland with 3.4 inhabitants/km
2). Traditionally regarded as a water-abundant area since the 1980s, the average annual water supply has decreased to 14,166 million m
3 (−10.3%) while demand has increased to 4330 million m
3 (+34.1%), leading to increasingly frequent and intense droughts [
21]. In the Douro River Basin, agricultural activities account for approximately 93% of total water withdrawals, with most of the irrigation demands met by surface water sources, primarily rivers and reservoirs. In terms of ecological status, 29% of the 708 classified surface water bodies currently achieve the “good” status required under the Water Framework Directive (WFD), with approximately 70% remaining in moderate or poor condition [
22]. Among the 64 identified groundwater bodies, around 30% fail to meet WFD standards, primarily due to nitrate contamination associated with agricultural practices and, to a lesser extent, overextraction pressures [
22].
In response, the Douro RBA has adopted stringent environmental standards to reinforce WFD objectives and abatement measures spanning water policy and infrastructure works (i.e., new dams and canals) through to water reallocation incentives (i.e., cost recovery charges and limits to further extraction) [
22]. Water charges are based on an annuity payment charged to all economic users [
23,
24]. Thus, while the environment is also expected to bear some of the policy costs, a majority of economic and hydroeconomic assessments of drought adaptation policies in the Douro River Basin focus on irrigated agriculture. Irrigated agriculture in the DRBA comprises 150 Agricultural Water Demand Units (AWDUs), which are groups of local farmers sharing a common water source [
22]. The Douro River Basin is conducting a performance evaluation of its management plan for 2021–2027 [
22], which offers an opportunity to apply our framework where historic/expected policy benefits can be quantified, and an assessment of total costs is also possible.
To achieve this, we use a socio-hydrology-inspired protocol-based modular framework (see [
25] for details) specifically designed for analysing and exploring questions such as these to estimate the environmental impacts of improved environmental water reallocations (i.e., policy benefits
B) relevant to
AC. In the more recent Pérez-Blanco et al. [
26] study,
AC and
TC were measured and reported but
benefits were not measured/compared. There is added value in that comparison, so we attempt it here.
ACs are rarely measured in policy design, with the focus typically on implementation costs (e.g., the cost of building infrastructure) but not how or if those
ACs achieve target X, which in turn translates into lower or higher income. This explains why large-scale infrastructure projects often fail [
27]. Consequently, we quantify and monetise a full set of
ACs,
TCs, and net social-benefits (
NSBs) to build a longitudinal dataset to evaluate adaptive efficiencies (i.e., policy capacity to adapt to unpredictable future events) and to create an actionable framework beyond the innovations of Marshall/Pannell to observe if Garrick’s [
14] predictions hold. To ensure brevity and maintain focus on the proposed framework and case study, we deliberately omit significant detail on the modelling, which is described exhaustively elsewhere (see for example [
26,
28,
29,
30]). The BCA framework is detailed below.
3. The Proposed BCA Framework
As stated, an objective of economics is to explain patterns of government investment. The abatement and transaction budgets associated with these investments (i.e., costs) should ideally maximise social welfare (i.e., benefits). However, obscurity associated with political and regulatory institutions often confounds our measurement and understanding of policy costs/benefits [
3]. In response, a simple analytical framework may add value.
Consider the objective of any set of beneficial potential environmental policies (
BP) that could deliver, for example, social benefits (
b). Ideally, the newly created or recently revised policy solution will maximise the total quantity (
q) of realised social benefits (
b), such that the social benefits of the environmental policy (
PV) are at least equal to the policy outcomes. As noted above and characterised in the literature (e.g., [
6]), a vector (complex set) of costs (
M) would be required to design and implement the policy content and context, establish positive/negative abatement incentives to drive changed behaviour or resource reallocation, administer the policy structure and delivery, monitor and assess progress towards those changes, and (potentially) redirect/redesign the policy at some future stage:
where
AC = +/− abatement costs aimed at transforming behaviour, and
TC = transaction costs aimed at institutional or organisation design and development. Following this, the net social benefits (
NSBs) of any single policy solution would be defined as:
It follows that, for any policy choice within a set of solutions, one assessment criterion (of many possible) is provided: if 0, the selection of a policy and its progression to the design, implementation, use of abatement (production) costs, future monitoring, and possible redirection can be economically justified. If the social values (PV) are challenging to quantify, we could utilise a cost-effectiveness/cost-efficiency evaluation criteria on the broader basis of NSB/M. However, with respect to the literature above, if AC and/or TC are excluded from M, then the total costs of the policy will be understated and the total benefits overstated.
To address this gap, our framework is aimed at extending Pannell et al.’s [
17] work to incorporate
AC and
TC measures and allow for (i) ex post analysis of environmental policy; (ii) tests and critiques of adaptive efficiency hypotheses via time series data analysis; (iii) extended analytical scope beyond single policy evaluations to multiple policies; (iv) additional constrained welfare optimisation assessments [
31] of environmental policy incorporating
AC/
TC values; (v) calculation of the full set of BCA decision-making rules (i.e., an NPV that assesses the net present value of the investment in today’s dollars, a BCR or benefit–cost ratio that if greater than one suggests a motive to invest, and an IRR or internal rate of return that equals the discount rate at which the NPV = 0 or BCR = 1), thereby providing superior assessment and selection criteria [
32]; and (vi) the illustration of any risk/uncertainty associated with the benefits/costs of policy transformations to be explored via (for example) scenarios concerning climate change within the BCA approach (see [
33]). A complexity of our analysis arises from an ex post comparison of policy reform that has been adopted (and led to significant
TC) but whose implementation remains in situ (i.e., additional
ACs lie in the future), which has a feedback effect on final
TCs (i.e., redirection costs) that may be estimated with slightly more precision given historical data. In the following sections, we apply the framework to a particular case to evidence our claims of superior evaluation outcomes.
4. Methods
A central concept of this paper is the complexity involved when combining
AC and
TC metrics to then compare against
NSB. As the WFD environmental policy in question is ex post by nature and evolving in situ under the six-year WFD review process, most
TCs lie in the past [
26]. However, under the feedback process between
TC and
AC, there is considerable future uncertainty surrounding future policy investments (i.e., out to 2027). We examine past behaviour and elicit a utility function for previous
ACs to model future behaviour in the river basin plan, which may not be implemented or could change going forward. So, how can we achieve this?
4.1. Model Scenarios
Using the model developed by Pérez-Blanco et al. [
26], we explore alternative future policy pathways adopted by the Douro RBA draft management plan [
22] that reflect possible path dependencies via adopted infrastructure or soft policies. For example, dam construction can be assumed to be irreversible in the basin plan pathways and provide some measure of technological lock-in costs. We developed eight scenarios representing varying levels of policy interventions and climate change projections to assess the impact of water reallocation policies on environmental and economic outcomes. Each scenario set included a counterfactual or Business-as-Usual (BAU) case for comparative analysis with combinations of storage and distribution infrastructure, irrigation systems, and soft policies like caps and charges. These scenarios were then altered to include a future with climate change (
Table 1, from Perez-Blanco et al. [
26]).
4.2. Abatement Costs
These scenarios were then incorporated into hydroeconomic model simulations over a 38-year hydrological series (i.e., 1980–2018, the period used for policy assessments in Spain under the current planning cycle) to evaluate (i) any environmental effectiveness measured through compliance with minimum environmental flows across the basin and (ii) economic outcomes evaluated as changes in agricultural profit, employment, and Gross Value Added (GVA) at the AWDU level—leading to abatement costs. More specifically, abatement costs were measured via a coupling of (i) a microeconomic Positive Multi-Attribute Mathematical Programming (PMAMP) that elicits irrigators’ preference behaviour and simulates their adaptive responses [
34] to (ii) the hydrological model AQUATOOL, which is a Decision Support System (DSS) used by the Spanish RBA to inform decision-making at a basin level [
35]. The PMAMP model assesses irrigators’ responses to water availability constraints or other shocks, notably the charges for recovering the costs of new infrastructure and provides information on effective water use of relevance for AQUATOOL. Importantly, water charges are obtained from the investment costs of the projected infrastructure in the river basin plan [
36], available on demand. The integration of investments, or transformation costs [
6], as user charges in abatement costs simulations means that they should not be added again to the total costs to avoid double counting. Conversely, AQUATOOL provides information about the impacts of environmental shocks and (re)allocation rules (e.g., droughts, environmental flows) on water availability for irrigation, which reinforms the PMAMP model. These iterative feedback loops between the two models enable the simulation of the dynamic co-evolution of human–water systems [
25] and how abatement costs may be impacted over time through changes in GVA. Therefore, to estimate the abatement costs of the policy over time, we used longitudinal data from the coupled PMAMP-AQUATOOL on the date and quantity of GVA over the 37 years, aggregated it across AWDUs, and discounted them. By comparing the aggregate and discounted GVA in each policy scenario versus the baseline scenario we obtain the abatement cost (assuming the policy scenario involves costs towards reducing the number of infringements) of that specific policy scenario.
4.3. Transaction Costs
Transaction costs associated with water reallocations in the DRB related to the EU Water Framework Directive between 2004 and 2021 were collected through engagement with public authorities and stakeholders. Records from public institutions provided data on staff salaries, travel costs, fees, and costs related to studies conducted by third parties [
37]. Key data were extracted from institutional databases such as [
36], which documented over 3000 records of activities involving the Douro RBA. From these records, 196 entries related to transaction costs were identified. The identified transaction costs included institutional transition costs (e.g., studies, hydrological planning), static costs (e.g., monitoring runoff), and lock-in costs (e.g., meetings to revise management rules). To supplement the institutional records, 11 interviews were conducted with key personnel, including unit directors and other stakeholders involved in planning and management. These interviews were used to gather information not covered in existing records, such as the number of staff employed or time spent on specific tasks [
8,
38]. This effort ultimately yielded 506 database entries over 18 years (2004–2021). All data collected were adjusted for inflation using the GDP deflator with reference to the prices of 2018, which served as the calibration year for the hydroeconomic model, and discounted.
4.4. Benefit Transfer Approach
Since monetary values for restored environmental flows in the DRB do not exist, we turned to other study areas and their estimations to calibrate equivalent data. This is known as the benefit transfer method, which relies on combining and integrating several other estimates from other (similar) contexts to provide a basis for the current study by leveraging existing valuation data from similar environmental flow models [
39]. While it also reportedly requires caution, as per the guidelines provided [
39], these data are subsequently adapted to estimate the value of the target asset located in a different geographical or ecological setting. The validity of this method depends on the similarity between the study site (where data originates) and the policy site (where data are applied), as well as the quality and availability of the original valuation studies [
40].
The benefit transfer study compiled data from multiple sources to establish a comprehensive valuation framework, subsequently validating this information using well-defined criteria including data consistency, accuracy, and contextual relevance to the target ecosystem. The initial phase involved systematically searching for primary studies on environmental flow valuation, particularly those assessing willingness to pay for maintaining environmental flow and associated ecosystem services. We relied on the Environmental Valuation Reference Inventory (EVRI) database, which yielded 83 studies. Subsequently, we filtered these studies to identify those specifically relevant to the DRB by focusing on their provision of essential ecosystem services. The filtering process identified critical ecosystem services present in the DRB that could be affected by environmental flows across the basin, as per the ecosystem services category provided by The Economics of Ecosystems and Biodiversity [
41], and then looked for studies where these ecosystem services were valued, focusing on techniques that yielded annual values excluding capitalised values to avoid uncertainty from discounting. Non-monetizable values (e.g., because they are reported in units that could not be transferred to the study site) and studies older than 25 years (to keep sample size tractable) were also excluded.
This filtering process resulted in the selection of nine studies from six different countries, all of which reported values in local currency per household per year. These values were subsequently updated to 2018 EUR (calibration year of the hydroeconomic model) using the GDP deflator and the relevant exchange rate to ensure comparability across different geographical locations and time periods. After adjusting the economic value of environmental flow for the year 2018, the average economic value was calculated using the unit value transfer method. This involved calculating the mean of the economic values derived from the studies in the sample in EUR/household/year, thereby providing a representative estimate of the willingness to pay for maintaining environmental flows across the different contexts represented by the case studies—which in our case is 70.5 EUR/household/year.
4.5. Environmental Flow Benefits
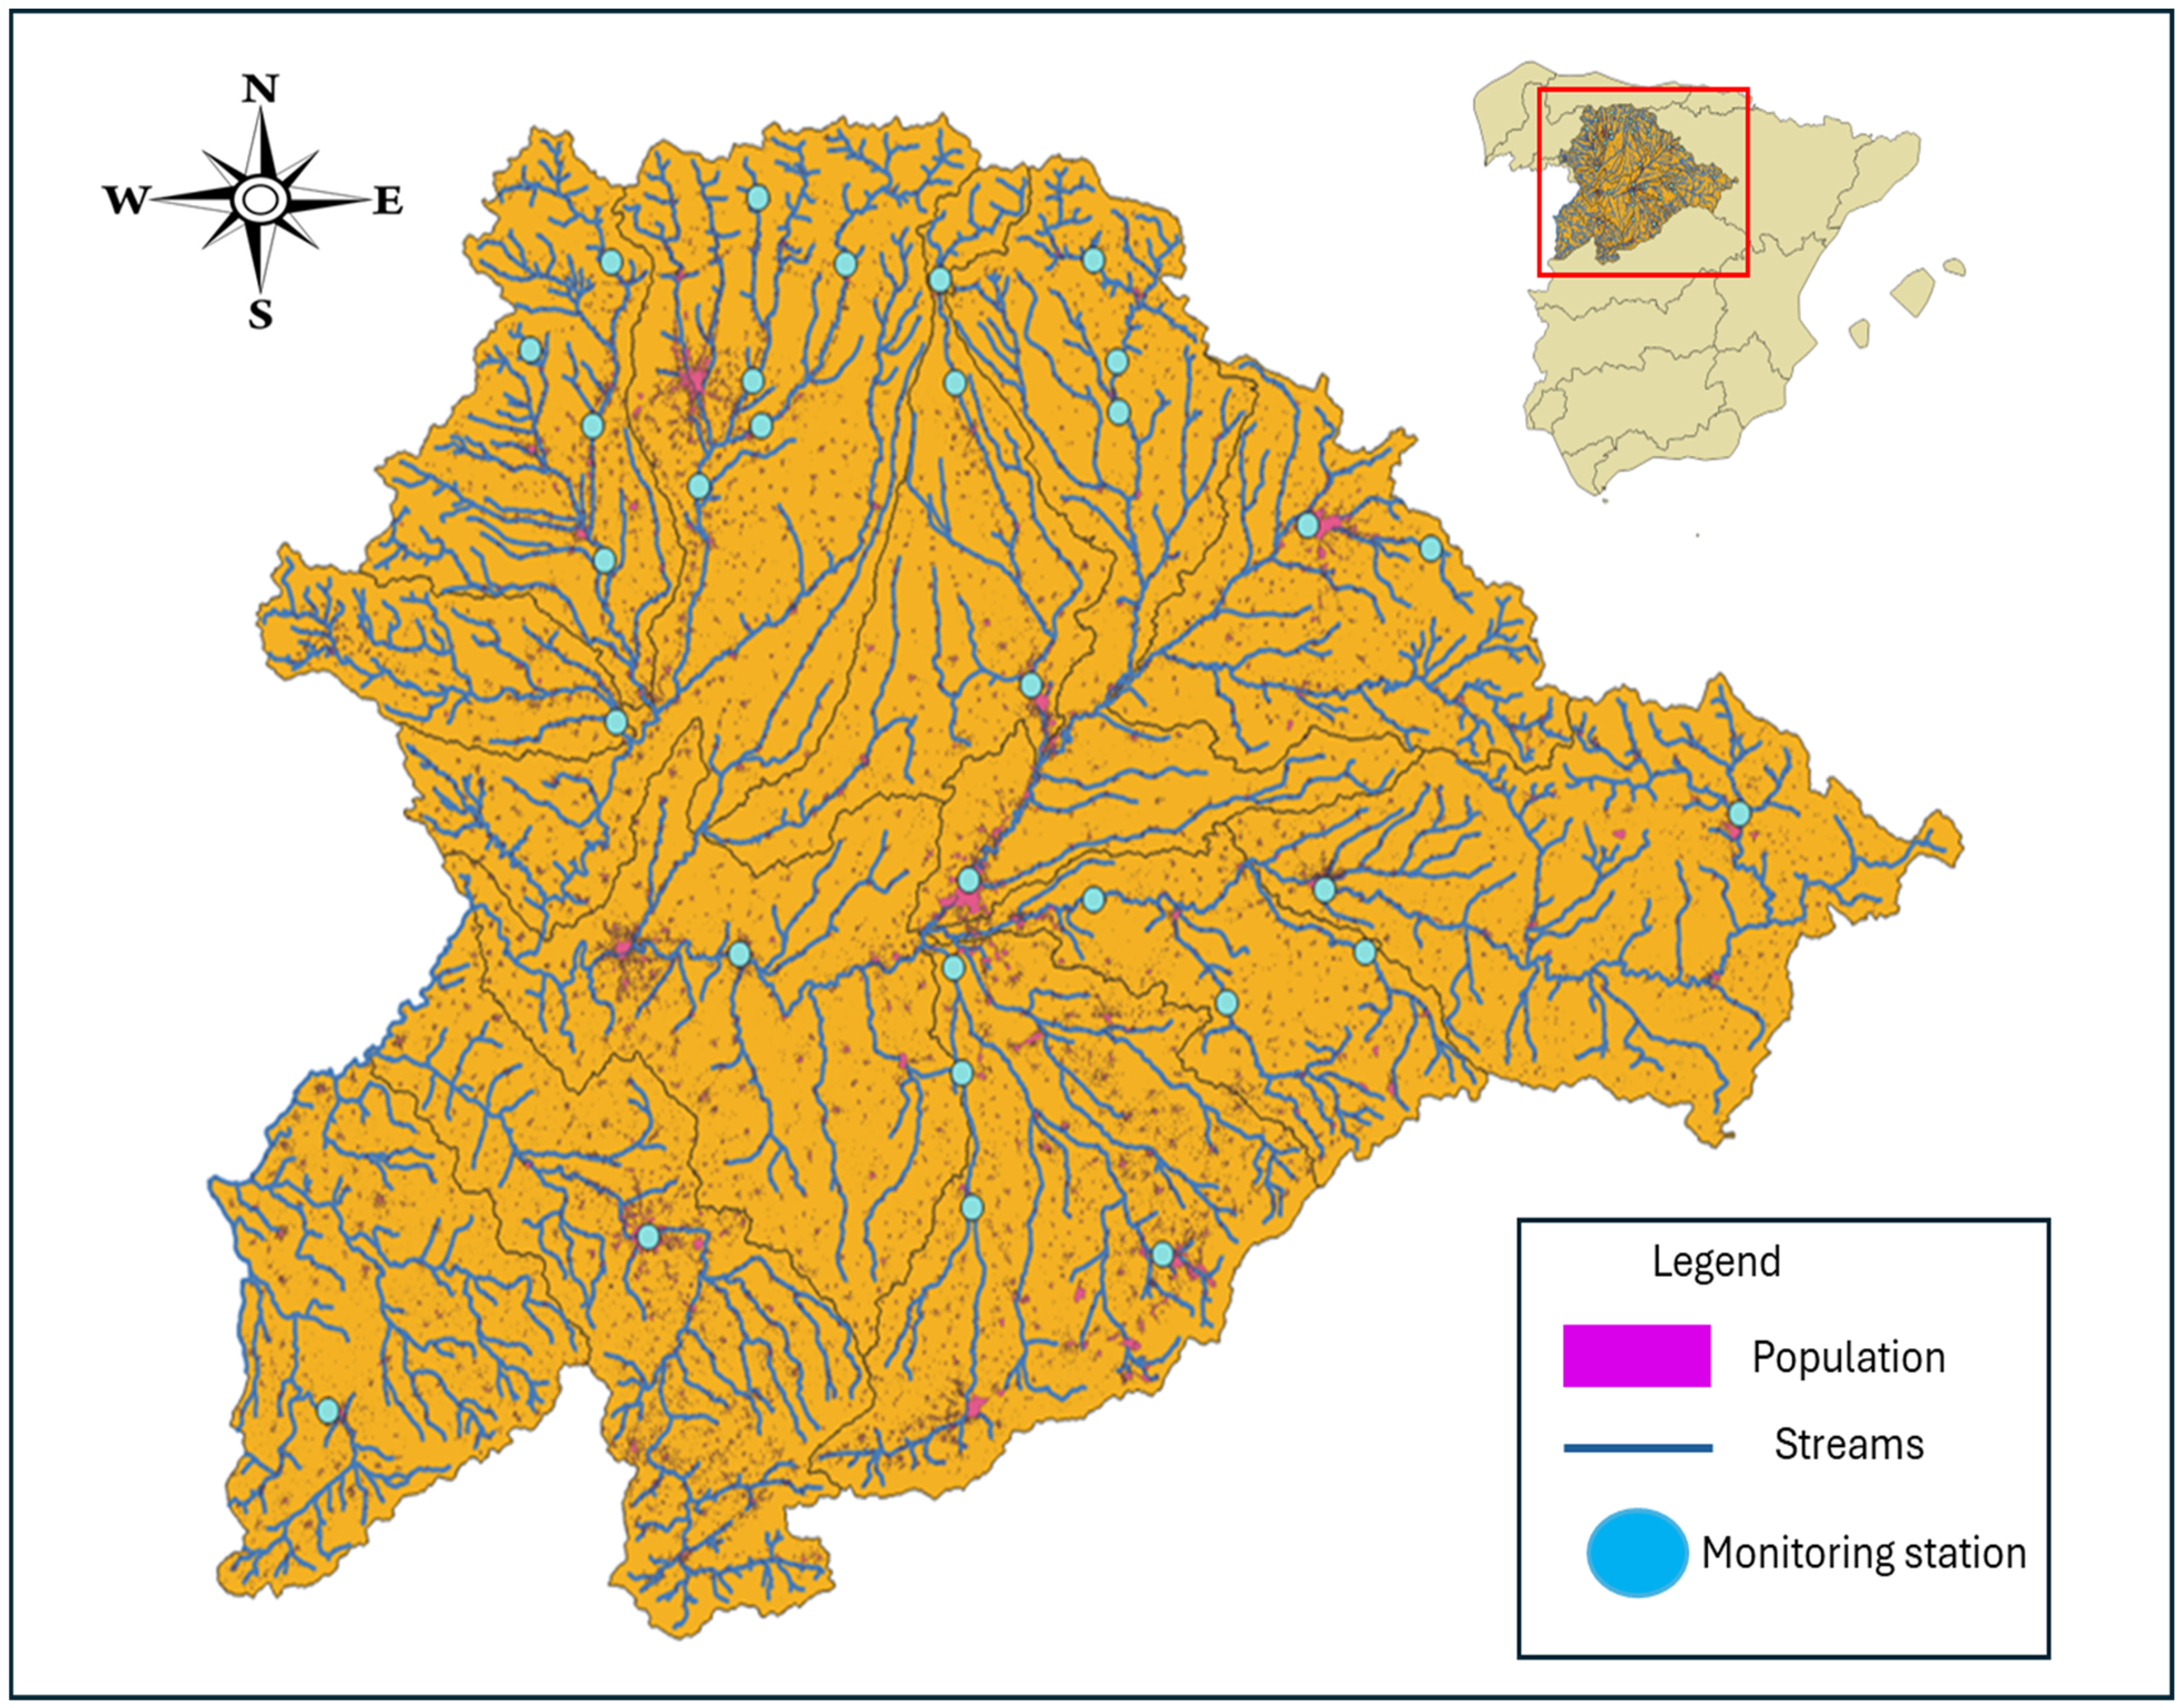
Finally, the regional monetary value of environmental flows will be conditional on the policy’s effectiveness and the population affected by that policy. To estimate the economic value of environmental flow benefits in the DRB, we first spatially distributed the households to portray the mean economic value per household of meeting environmental flows that normally would differ by area (i.e., if environmental flows are infringed inside a city, the economic impact will be larger than if they are infringed in an isolated river where population and environmental flow benefits are smaller). To achieve the spatial allocation of values, we overlayed three maps containing (i) georeferenced information on urban centres and population in the Douro Basin, (ii) the 12 sub-basins of the Douro, and (iii) the 34 monitoring stations where environmental flows are measured in AQUATOOL. Subsequently, we transformed total population into households by dividing the former by the average household size in the Castile and León Region (which nearly matches the Douro River Basin), and it was 2.5 persons [
42]. The average economic value of keeping environmental flows in a given monitoring station per year is estimated by multiplying the mean value of 70.5 EUR/household/year by the number of households.
Figure 2 illustrates the spatial distribution of the populations impacted.
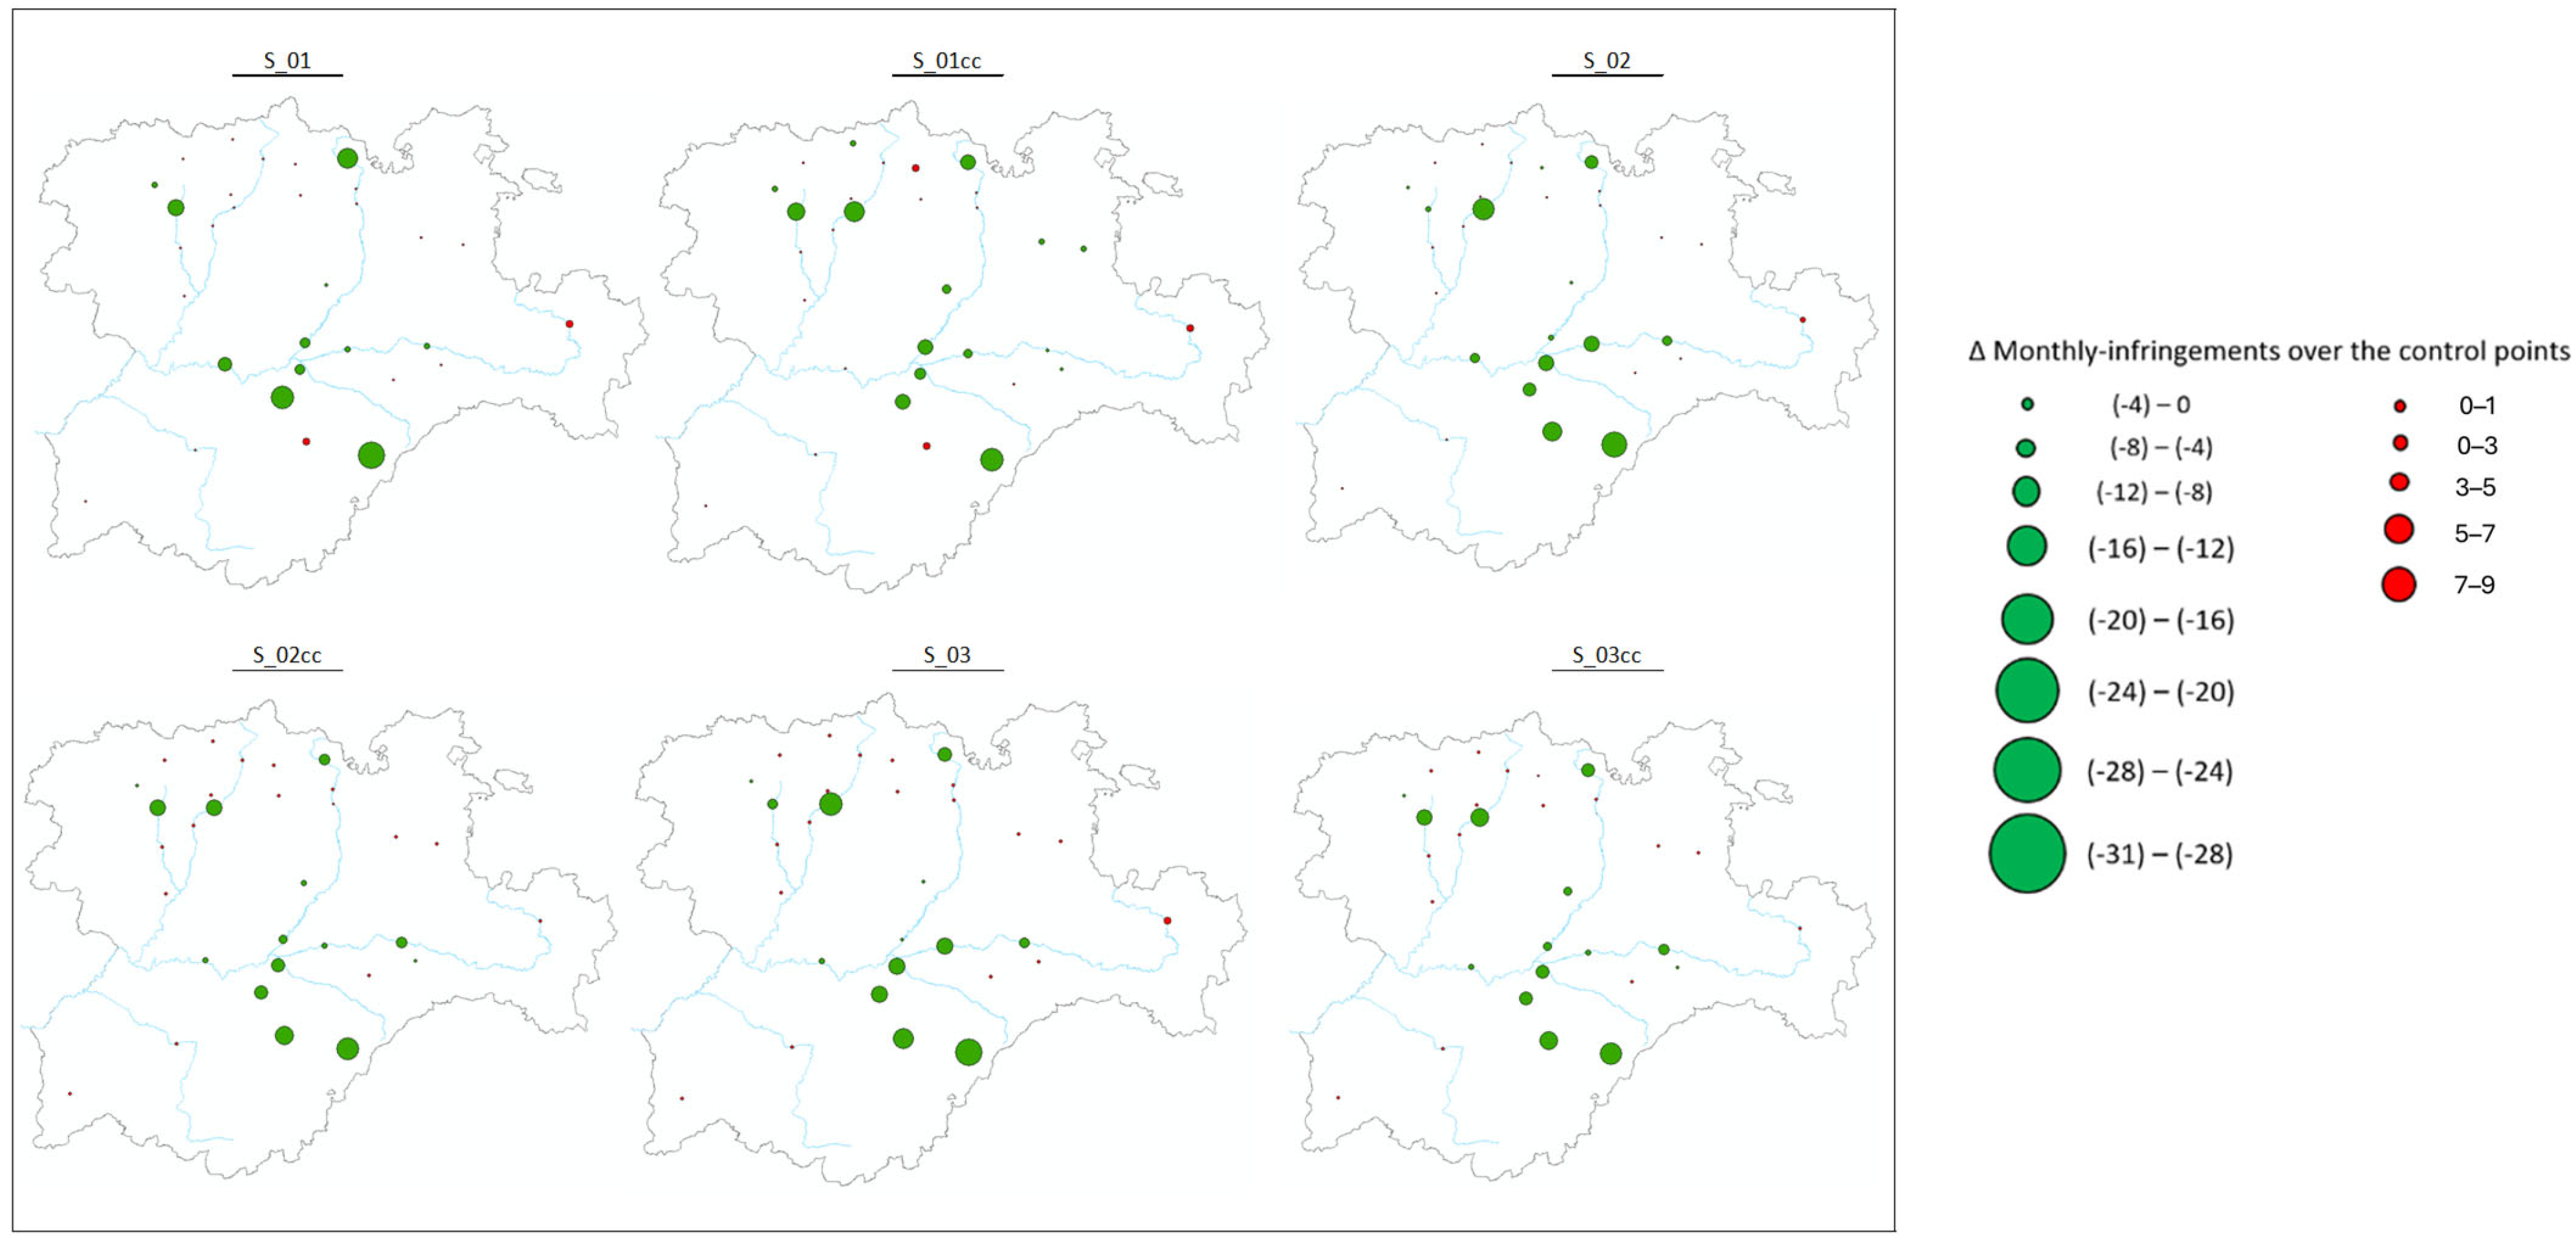
Finally, to estimate the environmental benefits of the policy over time, we used longitudinal data from AQUATOOL on the date and number of environmental flow infringements for each monitoring station and policy scenario over the 37 years (
Figure 3), aggregated the costs of each individual infringement, discounted them, and then aggregated the costs for all monitoring stations across each policy scenario to calculate the cost of environmental flow infringements over the entire basin. By comparing the costs of environmental flow infringements in each policy scenario versus the baseline scenario, we obtained the avoided costs or benefits (assuming the policy scenario succeeds in reducing the number of infringements) of that specific policy scenario.
Subsequently, the benefits and abatement and transaction costs/benefits under each scenario were aggregated for each year in the series to calculate the net profit (NSB). These aggregated outcomes were then used as inputs for a standard BCA model, providing a comprehensive evaluation of the potential economic benefits of maintaining environmental flow under different management and climate scenarios.
4.6. Adaptive Efficiency
Finally, the adaptive efficiency of water reallocation institutions and incentives—defined as their capacity to adapt to and change effectively—were assessed using transaction cost trajectory over time [
14]. This was the process followed by Loch and Gregg [
15]. Note that this assumes a cost-minimisation objective function, which may not maximise overall beneficial policy outcomes and thus have higher social welfare.
5. Results
Like any BCA, we begin with the three main measures: Net Present Value (NPV), Benefit–Cost Ratio (BCR), and Internal Rate of Return (IRR). For the uninitiated, if
NPV = 0 the project has broken even. When
NPV > 0 the project is profitable. Finally, when
NPV < 0 the project is expected to make a loss. However, consistent with the IPCC [
43] guidelines, it is logical to assume that both risk and uncertainty occur when estimating the final generated output, prices paid/received, and WUE investment costs. Thus, representing and quantifying the negative and positive effects derived from risk or uncertainty estimates on any single WUE investment is crucial for understanding the opportunity costs of a full set of investment choices [
33]. The other two measures of BCR and IRR provide secondary, but equally important, signals for assessing and choosing between scenarios [
44].
Table 2 contains the results for our scenarios. All have positive NPV results, with the maximum agricultural development under both current and climate change scenarios and irrigation modernisation under climate change being particularly significant. The limited occurrence of IRR values largely happens because the benefits of the programs are immediate and greater than the total costs. Thus, we focus on the NPV and BCR results, which show that some are just positive while others (as stated) have far better benefits.
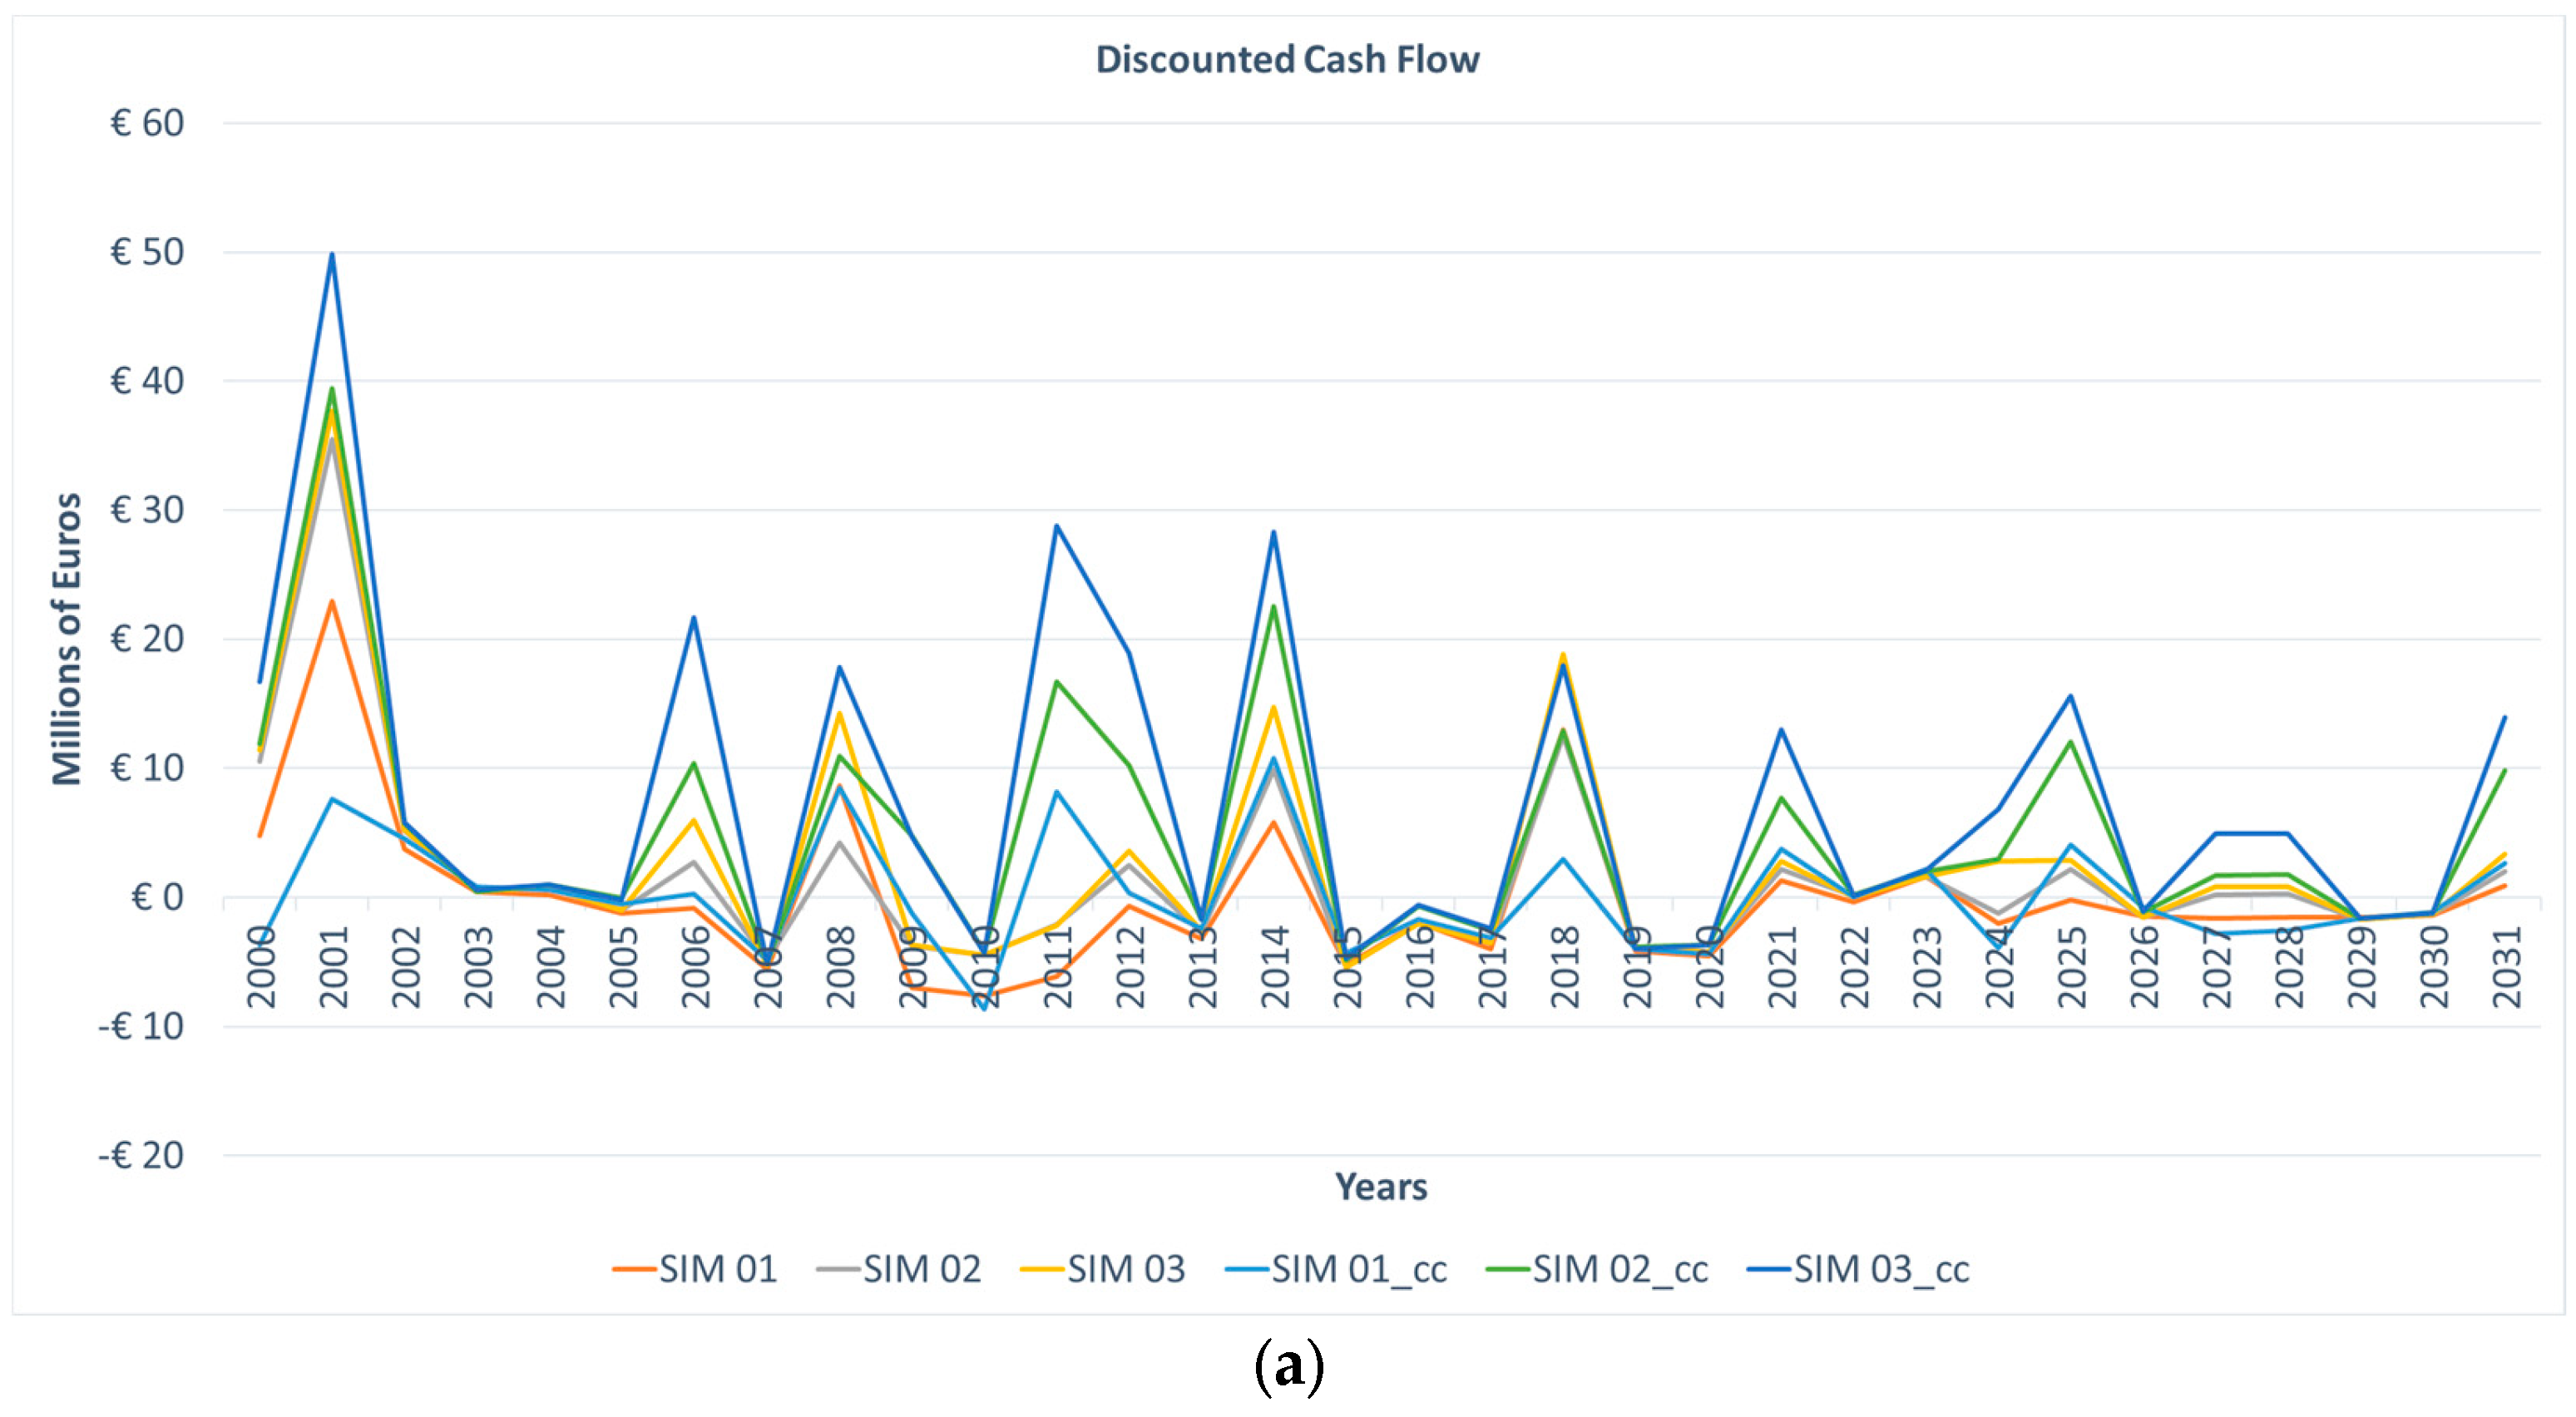
If we track these results over the timeframe, we can see the broad pattern emerging through the scenarios, particularly with respect to Garrick’s [
14] theory. According to Garrick [
14], the adaptive efficiency of water reallocation institutions—defined above as their capacity to adapt to and change effectively—can be assessed by studying the trajectory of costs and benefits over time. The general appearance of our DRB results is one of gradually diminishing results, as we might expect and hope for as public water managers (
Figure 4a). However, Garrick did not anticipate or incorporate risk from shifting discount rates or uncertainty over longer timeframes, such as climate change—or he was using a mean-variance approach [
45]. In general, it is possible that the nature of institutional lending or the role of distributional tails were not considered in his analysis, leading to limits in the conceptual assessments. This is illustrated in
Figure 4b.
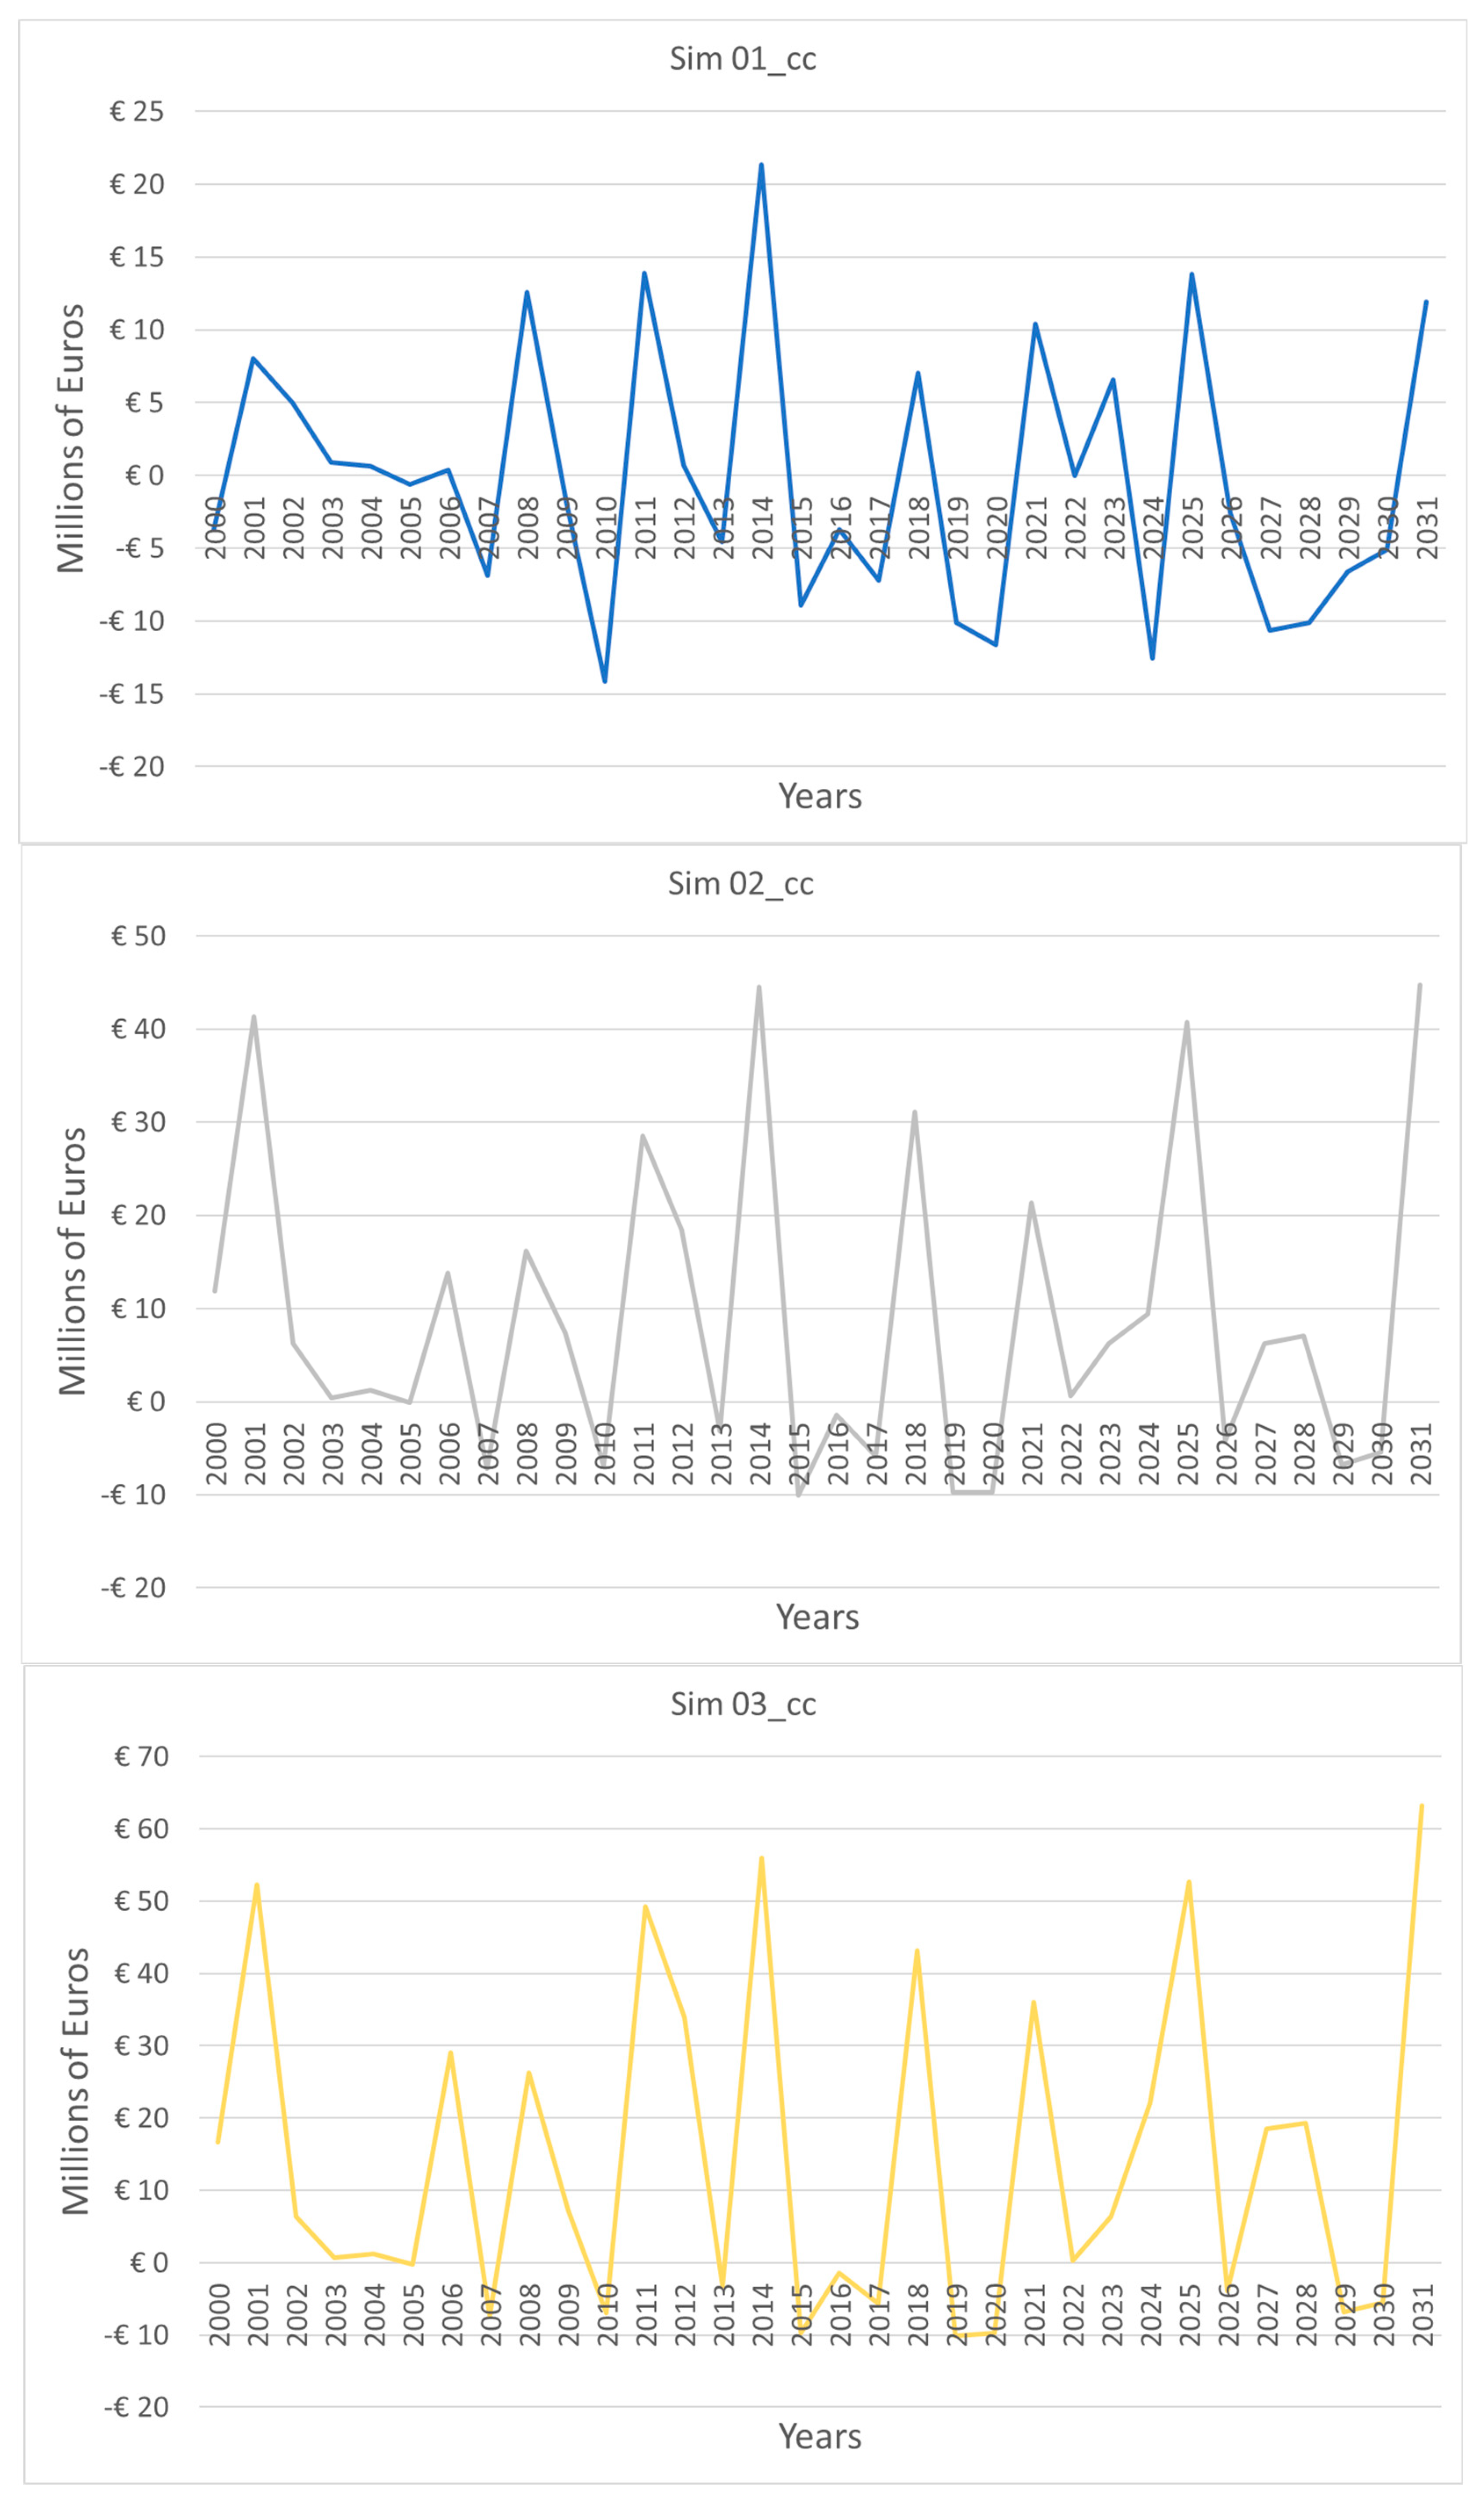
Each scenario seems to suggest intermittent rises over time to cope with reinvestment needs (i.e., program redirecting) and a gradual decline in those investments as the program continues. However, it is a bit messy, so let us separate them out by scenario (
Figure 5), where the real adaptive efficiency results become clearer. We can see that each scenario has different outcomes, as we should expect from the
Table 1 analysis, but while the standard scenarios start with high costs to meet program establishment needs, the movement over time is flatter, suggesting limited adaptive efficiency from those options. If we consider the climate change scenarios, both S_02 and S_03 provide better choices with far more obvious capacity to adapt to (uncertain) future changes and for increased user and environmental benefit—at higher costs, of course, as shown. But as governments must be responsible for their actions and associated costs, this analysis allows them to better justify the selections made and argue the need for critical data related to those choices as they progress.
Governments have limited budgets and increasing opportunity costs associated with those budgets. If policymakers do not provide sufficient budgets to achieve the policy objectives of water reallocation programs, while ensuring value for money over time, we will face decreased social welfare. Our assessment of the DRB river basin plan provides evidence for increasing objectives/effectiveness and evidence of a sufficient budget given the link between public expenditure and outcomes.
6. Discussion and Conclusions
This paper presents the first integrated analysis of the benefits and the abatement and transaction costs of water allocation reform. Ultimately, it suggests that we should capture actual abatement and transaction costs/benefits, not budgeted costs alone that may (not) realistically reflect the investment (
M), because this provides the capacity to assess who receives the benefits of the policy (e.g., the environment) and those capturing rents to determine if it is because of the program intervention (as shown in
Figure 6). The methods for the measurement of abatement and transaction costs developed in this paper are designed to be replicable and flexible, based on standard methods available in the literature. This is critical, as many governments and public resource management organisations appear to be either confused or afraid of transaction costs, choosing to ignore them in the main. This research shows the power of combined
AC and
TC data to both fit into familiar BCA analysis frameworks and how this provides greater insights into welfare gains for public resource managers.
Beyond those questions, this research has provided insights not previously considered. This includes that the true social benefits that accrue from the true social costs of policy or programs can be determined and calibrated to avoid over-promising or over-delivering. This is good for both politicians and national or state government organisational managers. Additionally, future studies may be able to identify the key components of TC that allow for the maximisation of NSB, highlighting the value of expenditure as a benefit—not solely a cost—to a program design, implementation, administration, performance, and redesign (if needed) over time to definitively justify whether additional TCs may add further value. Further, having a suite of BCA evaluation metrics allows for greater clarity of the value of a program or policy aimed at environmental gains as the BCA equations allow them to be easily adapted and altered with other approaches (e.g., optimisation, risk and uncertainty, etc.) This is highly critical for all stakeholders and may lead to greater utility and appreciation for the humble assessment approach.
Limitations
That is not to say that some improvements are not likely. First, uncertainty could be quantified further, such as by considering multiple alternative models at each system level (human and water systems) via ensembles or by exploring alternative inputs (scenarios, forcing, or data inputs) to more thoroughly explore plausible futures to better inform robust decision-making. Second, the microeconomic and hydrological models could be improved by leveraging recent scientific developments. For example, the PMAMP microeconomic model used in the human module, which presently assumes that water is applied in fixed proportions to land (i.e., irrigated crops require a predetermined amount of water), could be expanded to allow for deficit or supplementary irrigation [
46]. This makes possible the representation and assessment of adaptation responses at the intensive margin (deficit/supplementary irrigation), beyond the extensive (shift to less water-intensive crops) and super-extensive (shift to rainfed crops) margin adaptations studied in conventional microeconomic models. Third, additional systems could be endogenously modelled, including through the inclusion of a macroeconomic model that provides information on the consequences of water reallocation on commodity prices and how this, in turn, affects irrigators’ behaviour. Fourth, while we recognise that we can quantify the sum of abatement and transaction cost benefits, we cannot determine the estimated benefit from the transaction costs alone as a percentage of total benefits (i.e., we cannot distinguish between the two categories). Thus, we can talk about the total benefits from the investment but not abatement versus transaction costs separately. To address these, our longitudinal transaction costs database could be expanded with new data gathered over the incoming planning cycle (2021–2027) to obtain more conclusive results on the direction and magnitude of transaction costs in the future. This will all be a focus for future planned research.
7. Conclusions
Here we have collected, analysed, and assessed the appropriate set of ACs and TCs associated with identifying and restoring public environmental flows in the Douro Basin of Spain and the funds required over time to purchase and monitor them. But more than that, we have, for the first time, collected, evaluated, and reported the full set of costs and benefits that arise from those programs or policies. We have assembled a suitable—and importantly, it is no different to earlier BCA versions—framework for this process and offered it to the research community. That, then, requires further testing to modify, update, and evaluate it for practical or modified use around ACs and TCs in general. This, ideally, will be carried out in partnership with public resource managers under funding and assessment agreements. However, that too requires future commitment to those funds, and that is highly uncertain itself. Therefore, it is our opinion that it faces many challenges and barriers in the future.


