Article

Research on Flood Storage and Disaster Mitigation Countermeasures for Floods in China’s Dongting Lake Area Based on Hydrological Model of Jingjiang–Dongting Lake

1
Hunan Institute of Water Resources and Hydropower Research, Changsha 410007, China
2
College of Hydrology and Water Resources, Hohai University, Nanjing 210098, China
*
Author to whom correspondence should be addressed.
Water 2025, 17(1), 1; https://doi.org/10.3390/w17010001
Submission received: 14 October 2024 / Revised: 13 November 2024 / Accepted: 4 December 2024 / Published: 24 December 2024
(This article belongs to the Special Issue Advances in Ecohydrology in Arid Inland River Basins)

Abstract

:
China’s Dongting Lake area is intertwined with rivers and lakes and possesses many water systems. As such, it is one of the most complicated areas in the Yangtze River Basin, in terms of the complexity of its flood control. Over time, siltation and reclamation in the lake area have greatly weakened the river discharge capacity of the lake area, and whether it can endure extreme floods remains an open question. As there is no effective scenario simulation model for the lake area, this study constructs a hydrological model for the Jingjiang–Dongting Lake system and verifies the model using data from 11 typical floods occurring from 1954 to 2020. The parameters derived from 2020 data reflect the latest hydrological relationship between the lake and the river, while meteorological data from 1954 and 1998 are used as inputs for various scenarios with the aim of evaluating the flood pressure of the lake area, using the water levels at the Chengglingji and Luoshan stations as indicators. The preliminary results demonstrate that the operation of the upstream Three Gorges Dam and flood storage areas cannot completely offset the flood pressure faced by the lake area. Therefore, the reinforcement and raising of embankments should be carried out, in order to cope with potential extreme flood events. The methodology and results of this study have reference value for policy formation, flood control, and assessment and dispatching in similar areas.

1. Introduction

Floods and droughts are common global challenges at present [1,2]. In particular, major flood events (e.g., Pakistan in 2022, Libya in 2023, and the Midwest and south of the United States in 2024) have impacted tens of millions of people and caused property losses worth tens of billions [3]. Rapid and accurate hydrological forecasting, coupled with the effective planning and management of water conservancy projects—including reservoirs and dams—has become crucial in mitigating the impacts of flood and drought disasters [4,5,6]. Water conservancy projects play a vital role in reducing flood peaks, supplementing irrigation, and supporting ecological balance, all of which contribute to sustainable development [7,8]. However, they also significantly alter the morphology of rivers, leading to uncertainty in flood modeling and simulation endeavors [9]. Combined with the impacts of climate change, such changes present substantial challenges for accurately simulating floods within complex river and lake systems [10,11].
To date, three types of models have been developed for flood simulation and forecasting; namely, hydraulic, hydrological, and data-driven models [12,13]. Among them, hydraulic models (represented by MIKE and HEC) are widely used globally due to their clear physical meaning and relatively reliable simulation results [14]. However, for complex river–lake water networks, models with high efficiency and high-precision flood forecasting capabilities are still under development due to limitations associated with acquiring refined topography and boundary conditions [15,16]. Traditional hydrological models (represented by SWAT and the Muskingum method) have achieved remarkable results in the field of flood simulation due to their high computational efficiency and ease of data collection [17,18]. However, for river–lake water networks in plains heavily influenced by human activities and significant erosion and deposition changes, they can no longer meet the needs of flood simulation. As black-box models, data-driven models simplify the basic principles of hydraulics through seeking the non-linear relationships between hydrological elements such as water level and flow rate, playing a significant role in rapid flood element simulation [19]. However, the effectiveness of these models varies greatly with the scale of the training dataset and the selection of driving factors [20]. Additionally, when considering complex river–lake water networks, they ignore the interaction and hysteresis effects between upstream and downstream hydrological elements, and further improvements are needed for the simulation of hydrological processes under extreme flooding and drought events. To overcome the shortcomings of each model, some researchers have studied hydrological–hydrodynamic coupling models and hydrodynamic data-driven coupling models [21,22]. However, addressing the issue of low operational efficiency in large and complex river–lake systems without compromising simulation accuracy remains a key problem [23]. Therefore, it is necessary to build new flood forecasting hydrological models based on traditional hydrological models, incorporating refined flood simulation methods while considering erosion and deposition changes through hydrodynamic models and the operational efficiency of data-driven models, in order to achieve rapid and precise simulation and facilitate flood control and disaster reduction management.
The Yangtze River is the most flood-prone river in China [24,25]. As an important flood regulation and storage area of the Yangtze River, the Jingjiang–Dongting Lake reach has been described as follows: “while the Yangtze River stretches for thousands of miles, dangers may occur in Jingjiang River and challenges may be confronted by the Dongting Lake”. To address the complex flood issues in this region, a flood control engineering system centered on the Three Gorges Reservoir, Jingjiang Embankment, and flood storage and detention areas has been established through long-term practice and exploration [26,27,28,29,30,31]. During the flood season, through ensuring that the water level at Shashi City on the Yangtze River mainstream does not exceed 45 m and the water level at Lianhuatang does not exceed 34.4 + 0.5 m, the system effectively controls floods below the 1954 standard (once-in-a-century) in the middle and lower reaches of the Yangtze River, safeguarding regional flood safety [32,33]. However, in recent years, due to the impacts of climate change and variations in river discharge capacity, floods have concentrated near Chenglingji, resulting in a flood control situation in the region that is still severe. In the event of a major flood, the limited storage capacity of 12.02 billion cubic meters near Chenglingji can be utilized; however, its activation would have significant economic and social impacts [34,35].
This study takes the Jingjiang–Dongting Lake reach as the research object and assumes that, under the periodic action of water cycle due to climate change, floods similar to those in 1954 and 1998 will recur in the Yangtze River Basin. Under the influence of river–lake erosion and deposition changes and the operation of the reservoir group, significant differences can be expected to emerge under the existing river–lake relationships. Through a predictive analysis using a self-constructed model, this hypothesis was verified and the flood risks faced by the region under the present river–lake relationships were further revealed, providing important technical support for rapid flood forecasting and flood control layout optimization in the basin.

2. Study Area and Data
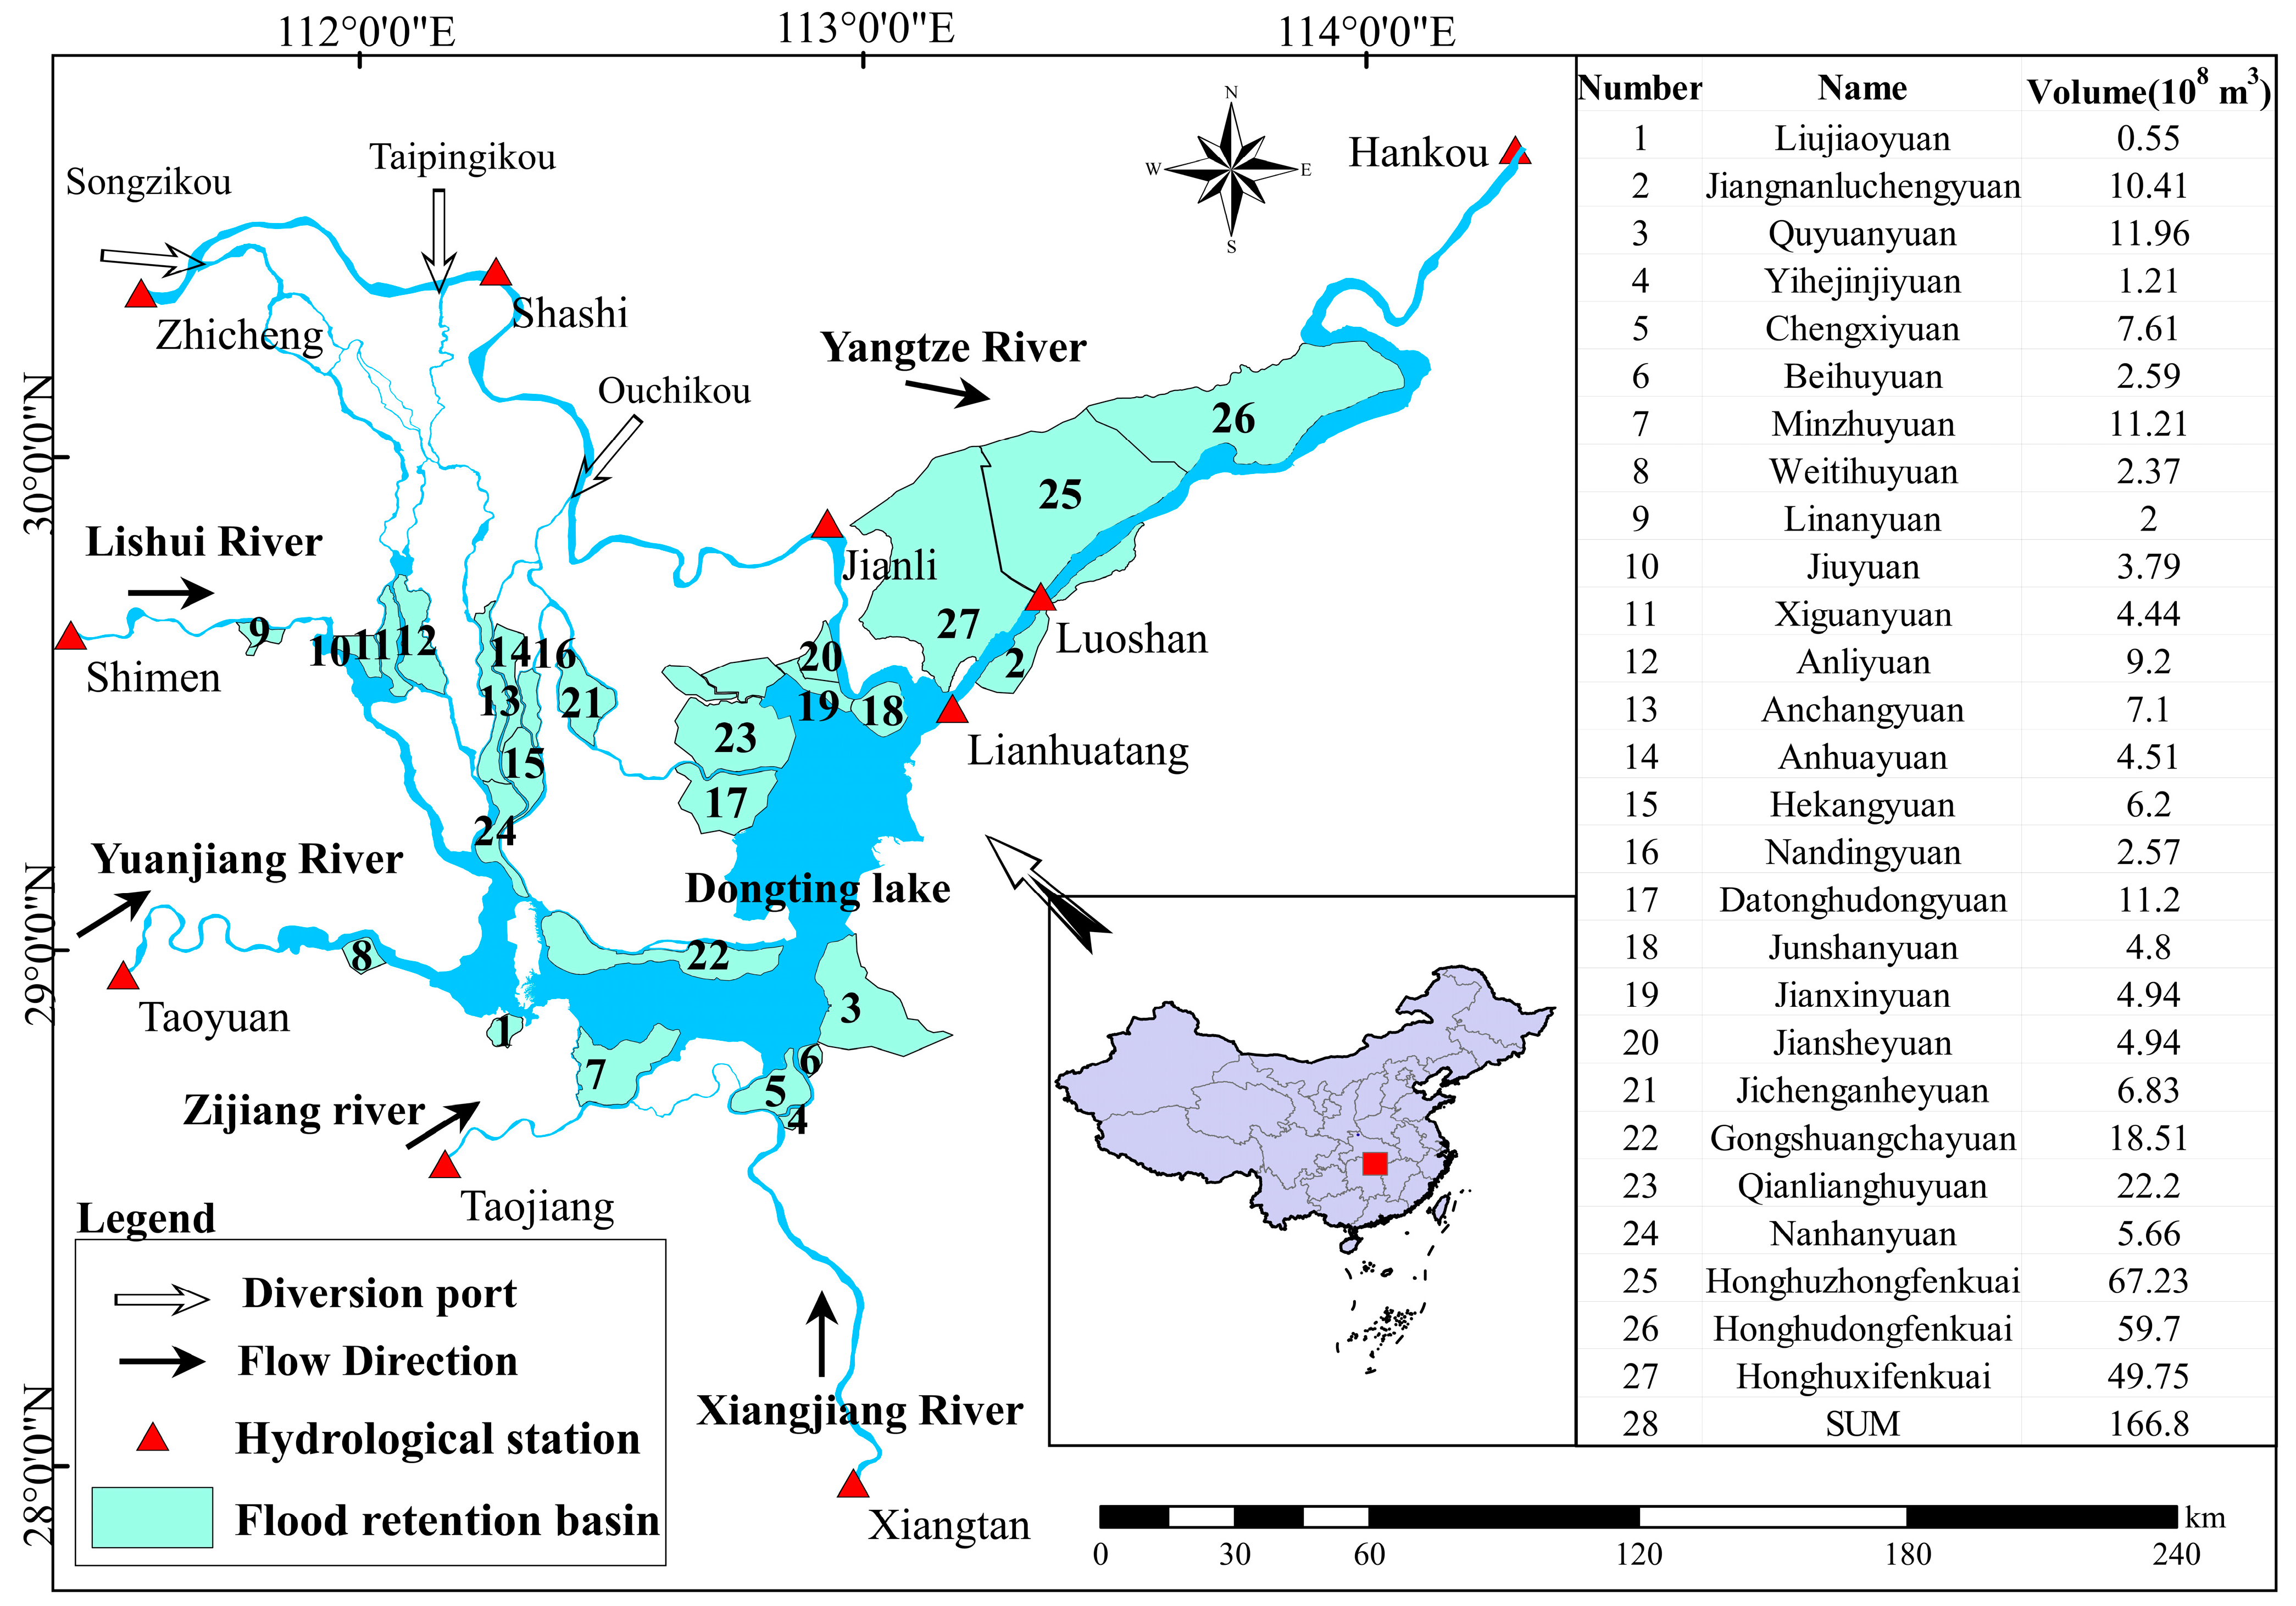
2.1. Study Area

The Jingjiang–Dongting Lake river section (27.8840°–30.4383° N Latitude and 113.3275°–111.37742° E Longitude) is located in the middle of China, within the midstream of the Yangtze River basin. The Jingjiang River starts from Zhicheng Hydrological Station and ends at Chenglingji Lianhuatang Hydrological Station, with a total length of 339 km. The Yangtze River is diverted into Dongting Lake through the Songzi Estuary, Taiping Estuary, Ouchi Estuary, and Diaoxian Estuary (which have been gated and controlled since 1958). After converging with the waters of Xiangjiang, Zijiang, Yuanjiang, and Lishui rivers, the combined flow then rejoins the Yangtze River at Chenglingji and flows out through Luoshan Hydrological Station—a well-known bottleneck of the Yangtze River where the relationship between water level and flow rate remains stable [35,36]. Xiangtan Hydrological Station, Taojiang Hydrological Station, Taoyuan Hydrological Station, and Shimen Hydrological Station are located on the Xiangjiang River, Zijiang River, Yuanjiang River, and Lishui River, respectively, serving as control stations in their respective downstream regions. For a long time, in order to ensure flood control safety within the region as well as in the middle and lower reaches of the Yangtze River, a total of 27 flood retention basins have been established, with an effective flood storage capacity totaling 16.68 billion cubic meters, as shown in Figure 1.

2.2. Data Sources

Considering that this study is primarily focused on the issue of floods, typical high-water years were selected from the measured hydrological sequences between 1954 and 2024 as the research objects, including 1954, 1983, 1995, 1996, 1998, 1999, 2002, 2003, 2016, 2017, and 2020. Through integrating the measured data, flood survey results, and reconstruction data from various high flood years, the model construction and flood control situation analysis were successfully completed. Table 1 outlines the primary sources of meteorological and hydrological elements used in this process. Specifically, the investigation and reconstruction data related to precipitation and floods in 1954 were sourced from the Hydrology Bureau of the Yangtze River Water Resources Bureau and relevant references. For other years, the measured hydrological data—including precipitation, water level, and discharge at Lianhuatang and Luoshan stations—were obtained from the Hydrology Bureau of the Yangtze River Water Resources Bureau and related references [37]. Additionally, the measured hydrological data for precipitation, water level, and discharge at Xiangtan, Taojiang, Taoyuan, and Shimen stations were sourced from the Hunan Hydrology and Water Resources Survey Center. Furthermore, precipitation data for Changde, Changsha, and Yueyang stations were retrieved from the China Meteorological Data Network (http://data.cma.cn/dataService/cdcindex/datacode/A.0012.0001.html, accessed on 22 September 2023).

3. Methods

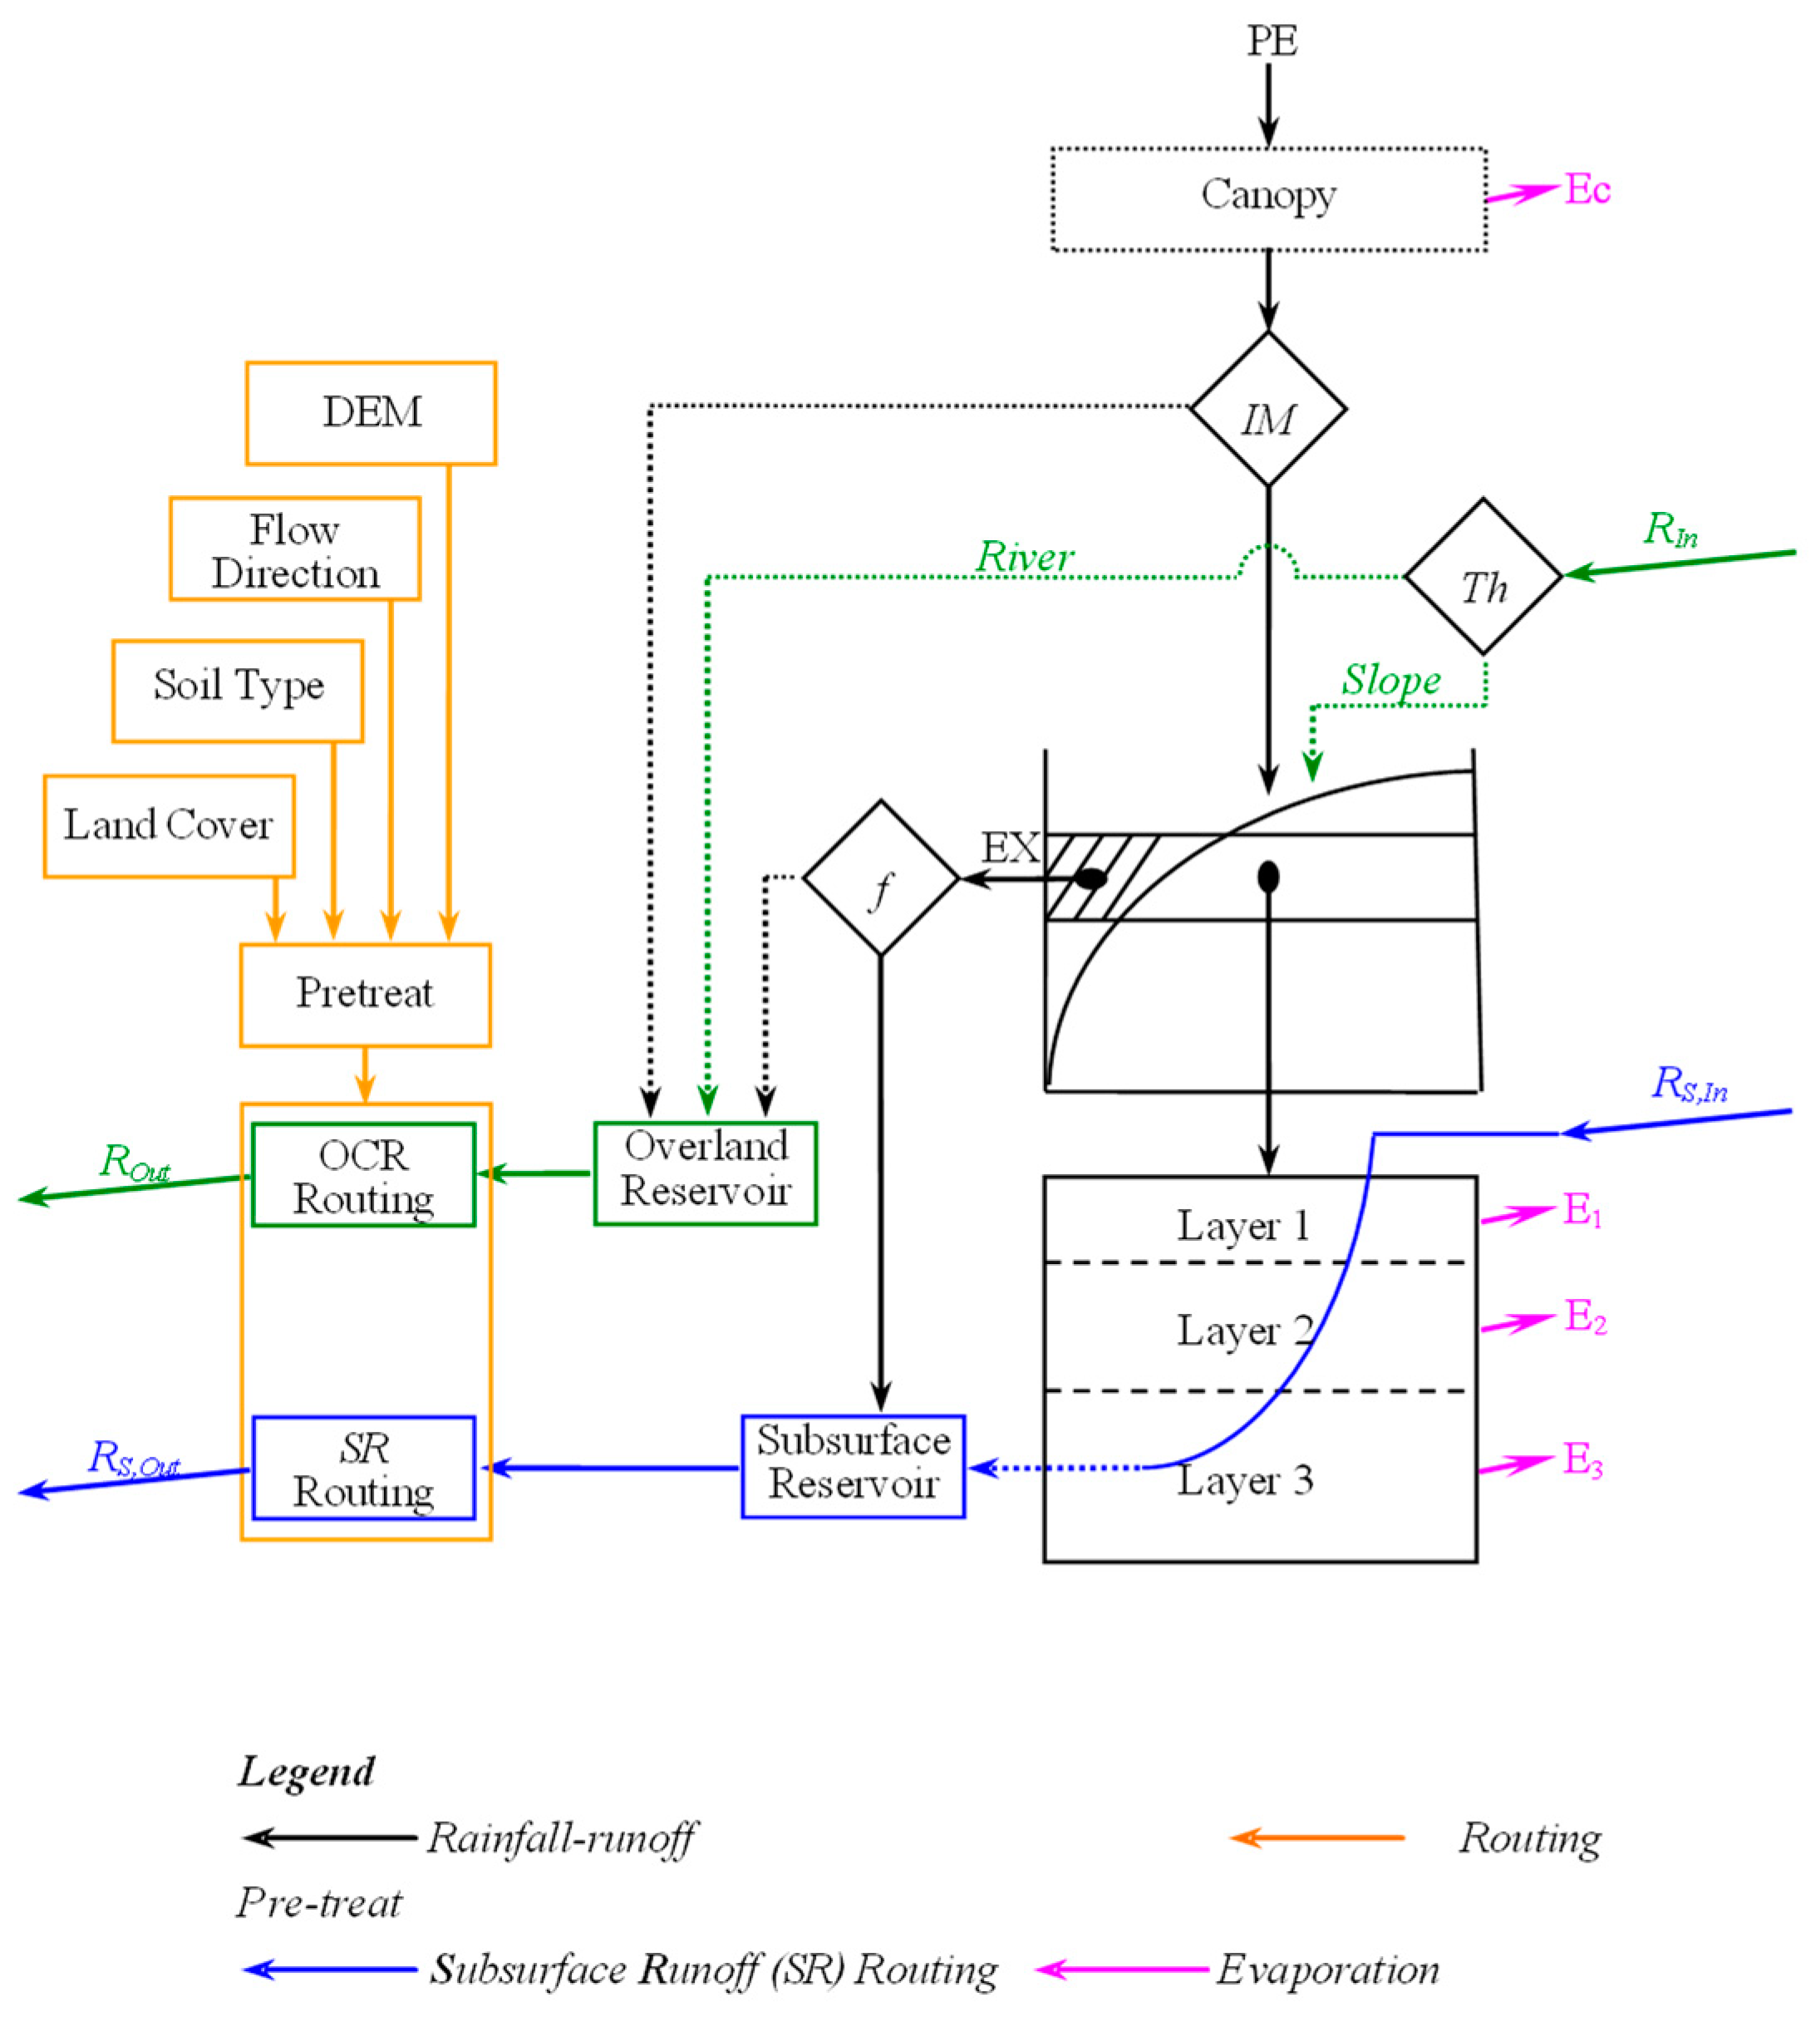
3.1. Jingjiang–Dongting Lake Hydrological Model

3.1.1. Flood Routing Model

The Jingjiang–Dongting Lake hydrological model, based on the Saint-Venant equations, simplifies the continuity equation into a water balance equation for the river segment and the dynamic equation into a storage equation using the empirical hydrological storage curve method, as follows:
I d t Q d t = d W ,
W = f Q ,   I ,
where I, Q, and W denote the inflow, outflow, and storage volume of the river segment, respectively.
For the calculation, the storage volume of the river segment and the stage–discharge relationship curve, which takes the daily stage increase rate, downstream backwater effect, and initial stage as parameters, are used to rewrite Equation (1) as:
I 1 + I 2 2 t Q 1 + Q 2 2 t = W 2 W 1 ,
where I1 and I2 represent the inflow at the beginning and end of the time period, respectively; Q1 and Q2 represent the outflow at the beginning and end of the time period, respectively; ∆t represents the time duration (in days); and W1 and W2 represent the storage volume at the beginning and end of the time period, respectively.
When performing the specific calculations, Equation (3) is transformed into:
I 1 + I 2 Q 1 + 2 W 1 t = Q 2 + 2 W 2 t .
Based on the inflow values I1 and I2 at the beginning and end of the time period, as well as the initial water level H1, and considering that Q1 W1 is a function of H1, the relevant calculation curves are utilized to perform the computations:
I 1 + I 2 Q 1 + 2 W 1 t = M .
Then, assuming a water level H2 at the end of the time period and considering that Q2 W2 is a function of H2, the relevant calculation curves are used to compute:
Q 2 + 2 W 2 t = M * .
If the calculated values meet the criteria (with ε representing the allowable error limit), Q2 and H2 are considered as the desired values at the end of the time period. Otherwise, the bisection method is used for iterative calculation [38].
M * M < ε .

3.1.2. Interval Runoff Generation and Concentration Model

For the interval runoff generation and concentration model, the Coupled Routing and Excess Storage (CREST) approach was adopted. With the aid of a Digital Elevation Model (DEM), the watershed was divided into numerous regular units. For each unit, the rainfall runoff generation is calculated using the storage capacity curve, and rapid and slow runoffs are distinguished based on the soil’s steady infiltration rate [39]. The main structure of the model is illustrated in Figure 2.

3.1.3. Parameter Processing

(1)
The stage–discharge relationship at Luoshan
The relationship between water level and discharge generally exhibits a complex loop pattern, and is influenced by backwater from tributaries or fluctuations of flood levels. For the sake of convenience in calculation, the concept of fluctuation rate is introduced to simplify the water level–discharge relationship at Luoshan into a cluster of lines.
Assuming that, during the rise and fall of a flood, for the same water level Z within a time interval Δt, the increment in water level is Δh, the surface slope is ΔI, and the flood propagation time is U, then:
I = h L = h U · t = 1 U h t ,
According to the Chézy formula, there is a direct proportional relationship between the discharge at the same water level and the square root of the slope.
Q Q = I + I I = 1 + 1 U I h t ,
where Q represents the flow rate considering flood fluctuations, Q represents the steady flow rate, and I represents the slope of the stable flow water surface.
During this process, the relationship between water level and discharge under steady flow conditions is known and, based on measured discharge data, a relationship curve between Z and UI can be plotted. Based on this, assuming that there is a power exponential relationship between water level fluctuations and discharge, the water level–discharge relationship at Luoshan station under simplified water level fluctuation conditions can be established as follows:
Z = k 1 Q m ,
where k1 and m are respectively referred to as the ZQ coefficient and the ZQ exponent.
Meanwhile, S—namely, the storage capacity of the composite system with Luoshan Station as the outlet—exhibits a linear relationship with the outflow discharge Q [40]:
Q Δ t = S k 2 ,
where k2 is the outflow coefficient, k2 ∈ (0, 1].
(2)
Diversion of water flow through three outlets during high water levels
According to the study by Zhu et al. on the relationship between the diversion flows at Songzi, Taiping, and Ouchikou and the flow at Zhicheng from 1955 to 2020, the diversion ratios at gates with Zhicheng flow exceeding 30,000 m3/s follow a linear relationship [41]. These ratios can be calculated using Equations (12)–(14).
Q s o n g z i = 0.154 · Q z h i c h e n g 850 ,
Q t a i p i n g = 0.04 · Q z h i c h e n g + 100 ,
Q o u c h i = 0.3025 · Q z h i c h e n g 5175 .
(3)
Calculation of excess flood volume
The excess flood volume is calculated by flattening the water level curve, which means that the cumulative flow remaining after deducting the discharge capacity corresponding to the Lianhuatang water level of 34.4 m is subtracted from the Luoshan discharge process, and the remaining cumulative discharge is regarded as the excess flood volume.

3.1.4. Parameter Optimization

In this study, the SCE-UA algorithm—which has been widely used in conceptual, semi-distributed, and distributed hydrological models—was selected for parameter optimization [42,43,44]. The main parameters optimized include k1, m, and k2.

3.2. Evaluation Indices for Model Effects

For evaluation of model performance, we primarily employed the Nash–Sutcliffe Efficiency Coefficient (NSE) and the Absolute Error (AE).

3.3. Scenario Design

The impact of controlled water levels on excess flood volumes is significant. This study explores the reasonable range of controlled water levels at Lianhuatang station from the perspective of smooth water surface profiles, combined with a fitting analysis of the correlation between the measured super-warning high flood levels at Lianhuatang station and those at upstream and downstream control stations from 1954 to 2020.
To avoid the influence of the Three Gorges Dam and upstream cascade reservoirs on the consistency of the hydrological series, the year 2003 was taken as the dividing point to separately plot the water levels at downstream Hankou station before and after the operation of the Three Gorges Dam, in comparison with the water levels at Lianhuatang station. Through linear fitting it was found that, under high flood conditions both before and after the operation of the Three Gorges Dam, the correlation between the water levels at Hankou and Lianhuatang was relatively good, with R2 values exceeding 0.5 in both cases (Figure 3). When the controlled water level at Hankou is 29.73 m, based on the correlation before and after the operation of the Three Gorges Dam, the corresponding controlled water levels at Lianhuatang are 35.45 m and 35.18 m, respectively.
Based on the current controlled water level and warning water level at Lianhuatang, along with the calculated controlled water level, further plotting of the measured highest water levels at Shashi, Jianli, Lianhuatang, Luoshan, and Hankou revealed the following: the controlled water level surface profile from Shashi to Hankou tends to follow a concave curve, while the measured high water level surface profile exhibits a trend of first concave, then convex, and finally concave again, with the water level at Lianhuatang located at the inflection point of the curve.
In the observed high-water-level series, the water levels at various stations in 1954, 1980, and 1983 all fell within the ranges defined by the warning and control levels. In 1976 and 1989, despite Wuhan and Luoshan stations recording water levels below the warning level, Lianhuatang, Jianli, and Shashi stations experienced water levels exceeding the warning level. In 1988, 1991, 1995, 1996, 2002, 2003, 2010, 2016, 2017, and 2020, when Shashi station’s water level was below the warning level and Hankou’s was near the warning level, the water levels at Luoshan and Lianhuatang stations approached or exceeded the guaranteed level. During the years of 1998 and 1999, when Hankou’s water level was below the guaranteed level and Shashi’s was close to the guaranteed level, the water levels at Lianhuatang, Luoshan, and Jianli stations far exceeded the guaranteed level. A statistical analysis of the relationships between the water levels at various stations and the guaranteed level in high water years before and after the operation of the Three Gorges Dam, as well as over the long-term, revealed the following: at Shashi station, the average distance from the high water level to the guaranteed level was −1.48 m before the dam operation, −2.97 m after the dam operation, and −1.92 m over the long-term; at Lianhuatang station, these averages were −0.42 m before the dam operation, −0.45 m after the dam operation, and −0.43 m over the long-term; and, at Hankou station, the averages were −1.77 m before the dam operation, −1.93 m after the dam operation, and −1.82 m over the long-term. Overall, these findings indicate that, regardless of whether the Three Gorges Dam was operating, the water level near Lianhuatang presented a relatively small difference from the guaranteed level, leading to prominent flooding issues in the region. Considering the smoothness of the water surface profile and based on the calculated control levels of 35.18 m and 35.45 m, only the floods in 1998 and 1999 exceeded Lianhuatang’s control level (Figure 4).
Therefore, combining the current controlled water levels, water levels analyzed through correlation analysis, and historical highest flood levels, ten scenarios were set for flood routing in the years of 1954 and 1998. Meanwhile, based on potential floodwater diversion and storage plans, an analysis of the regional flood control situation was conducted under the scenario where the control water level remained unchanged. The specific plan design is outlined in Table 2.

4. Results

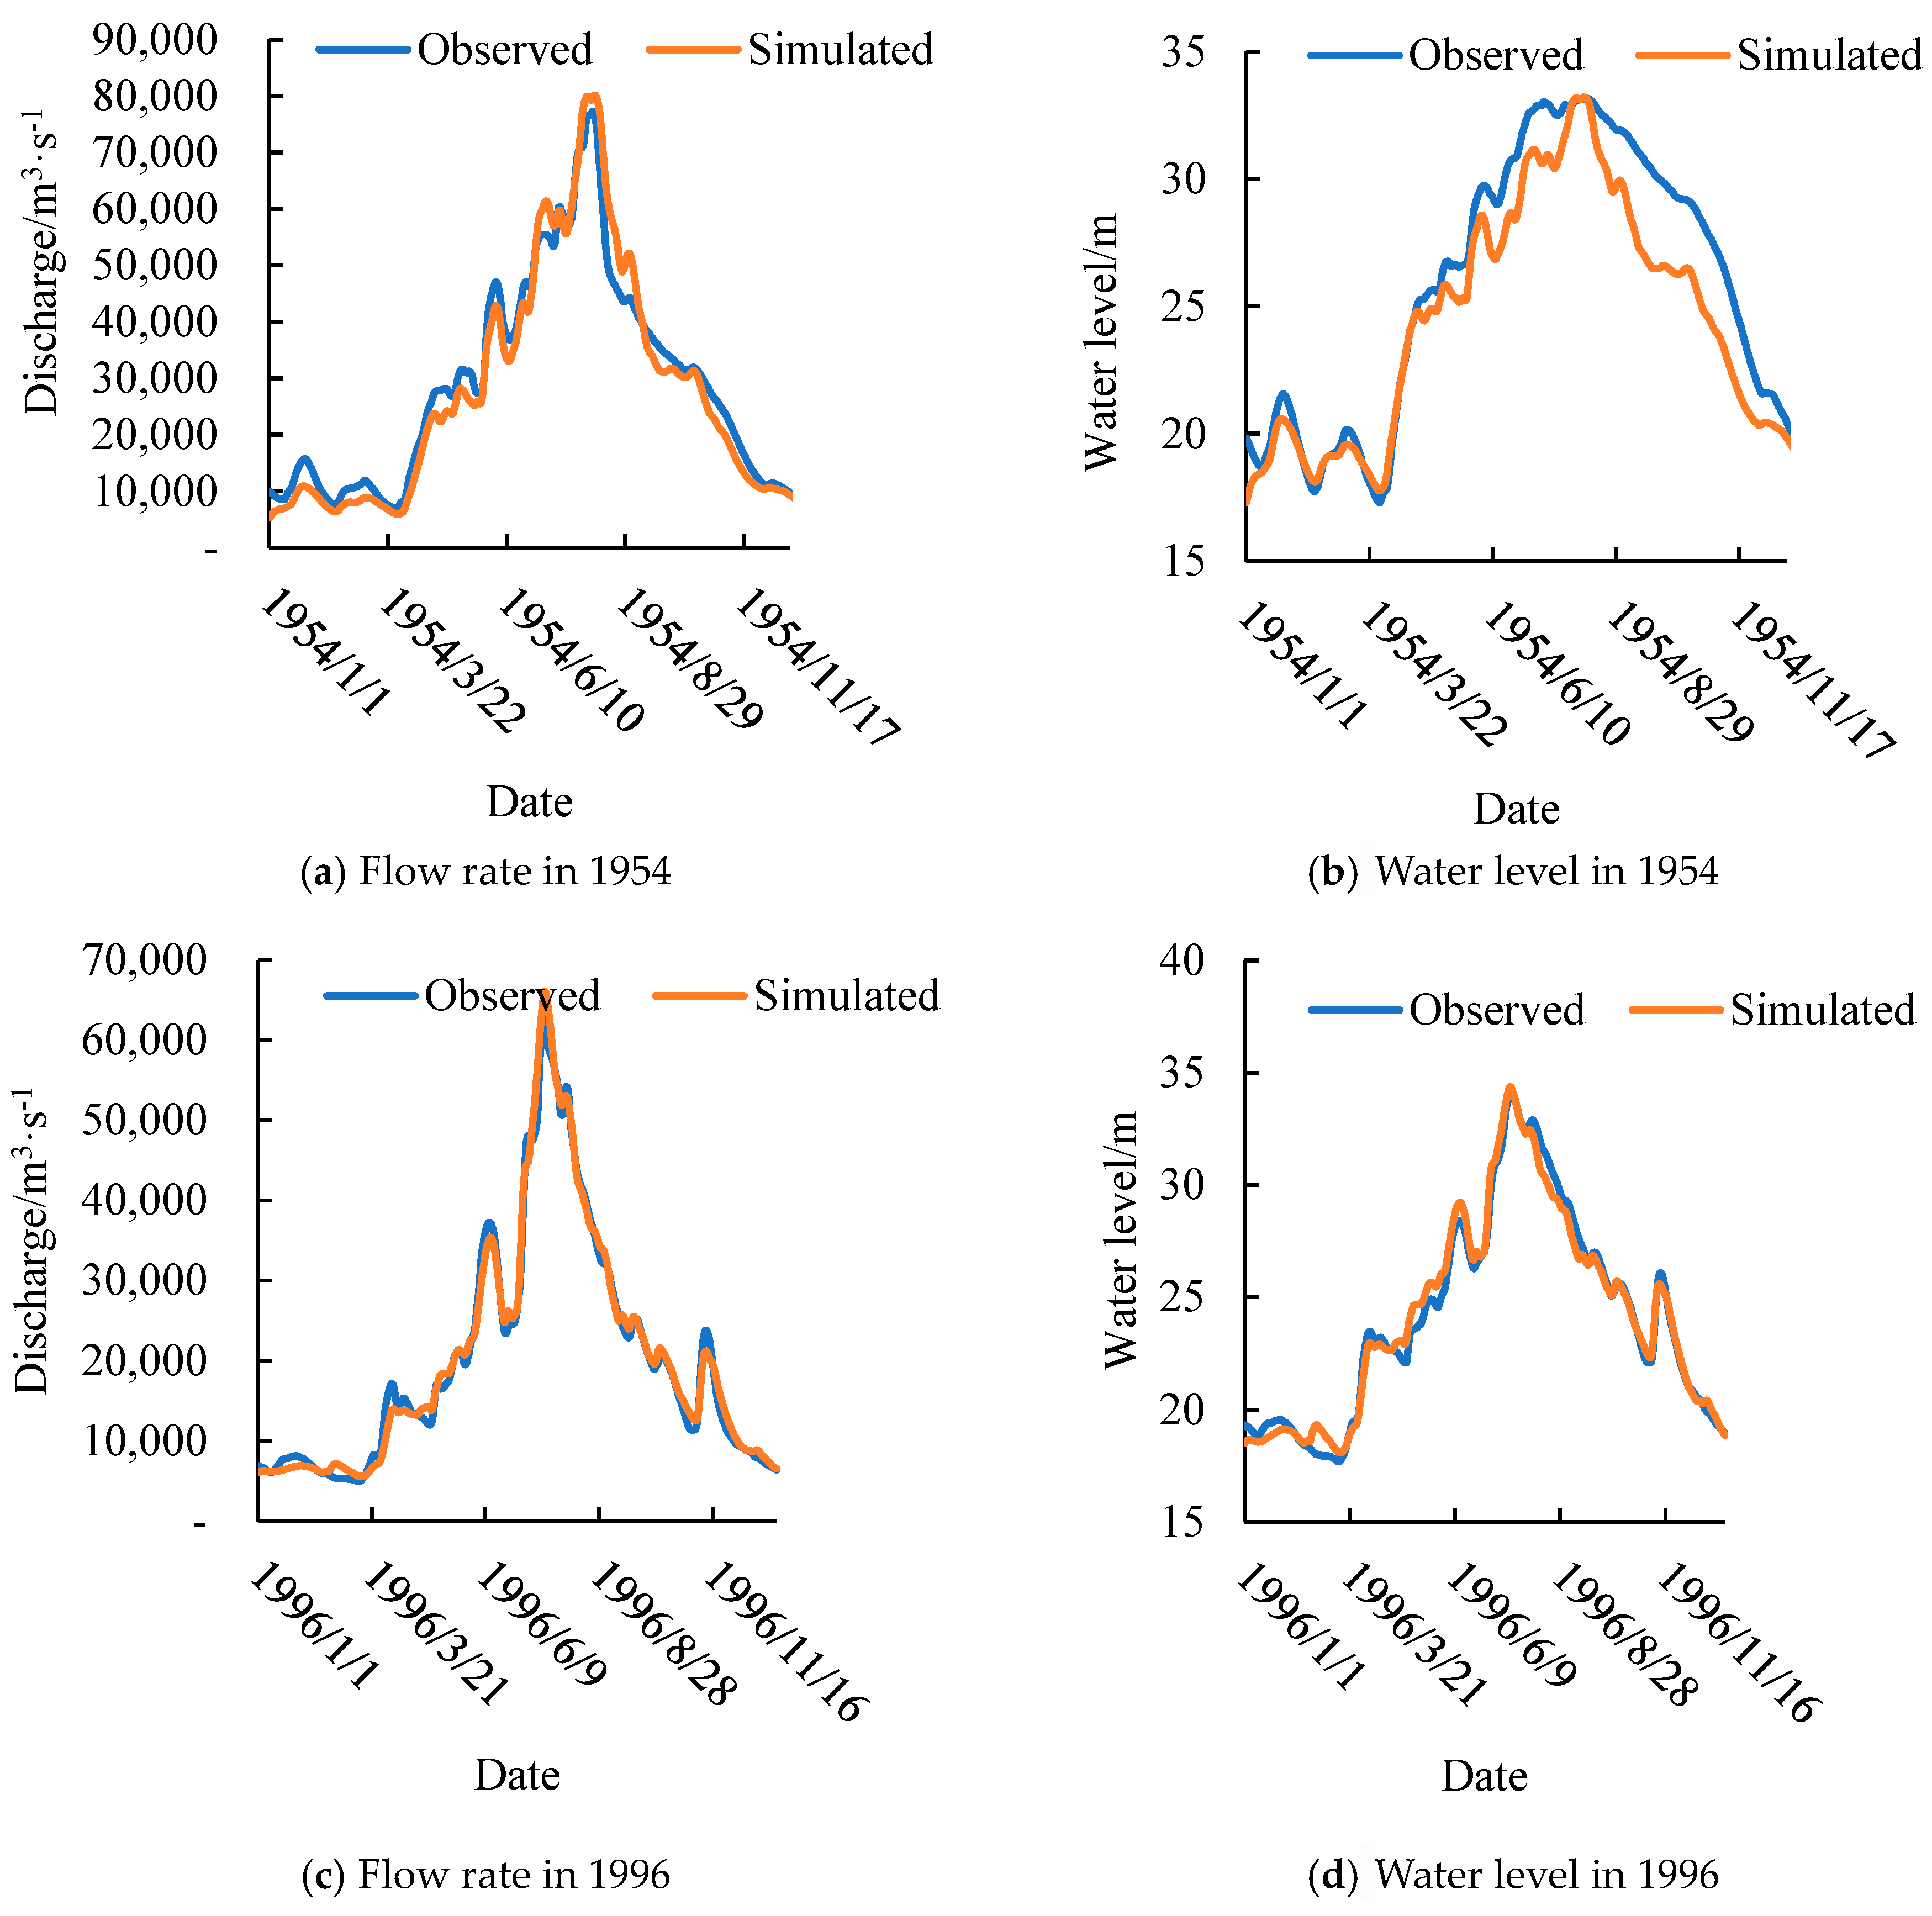
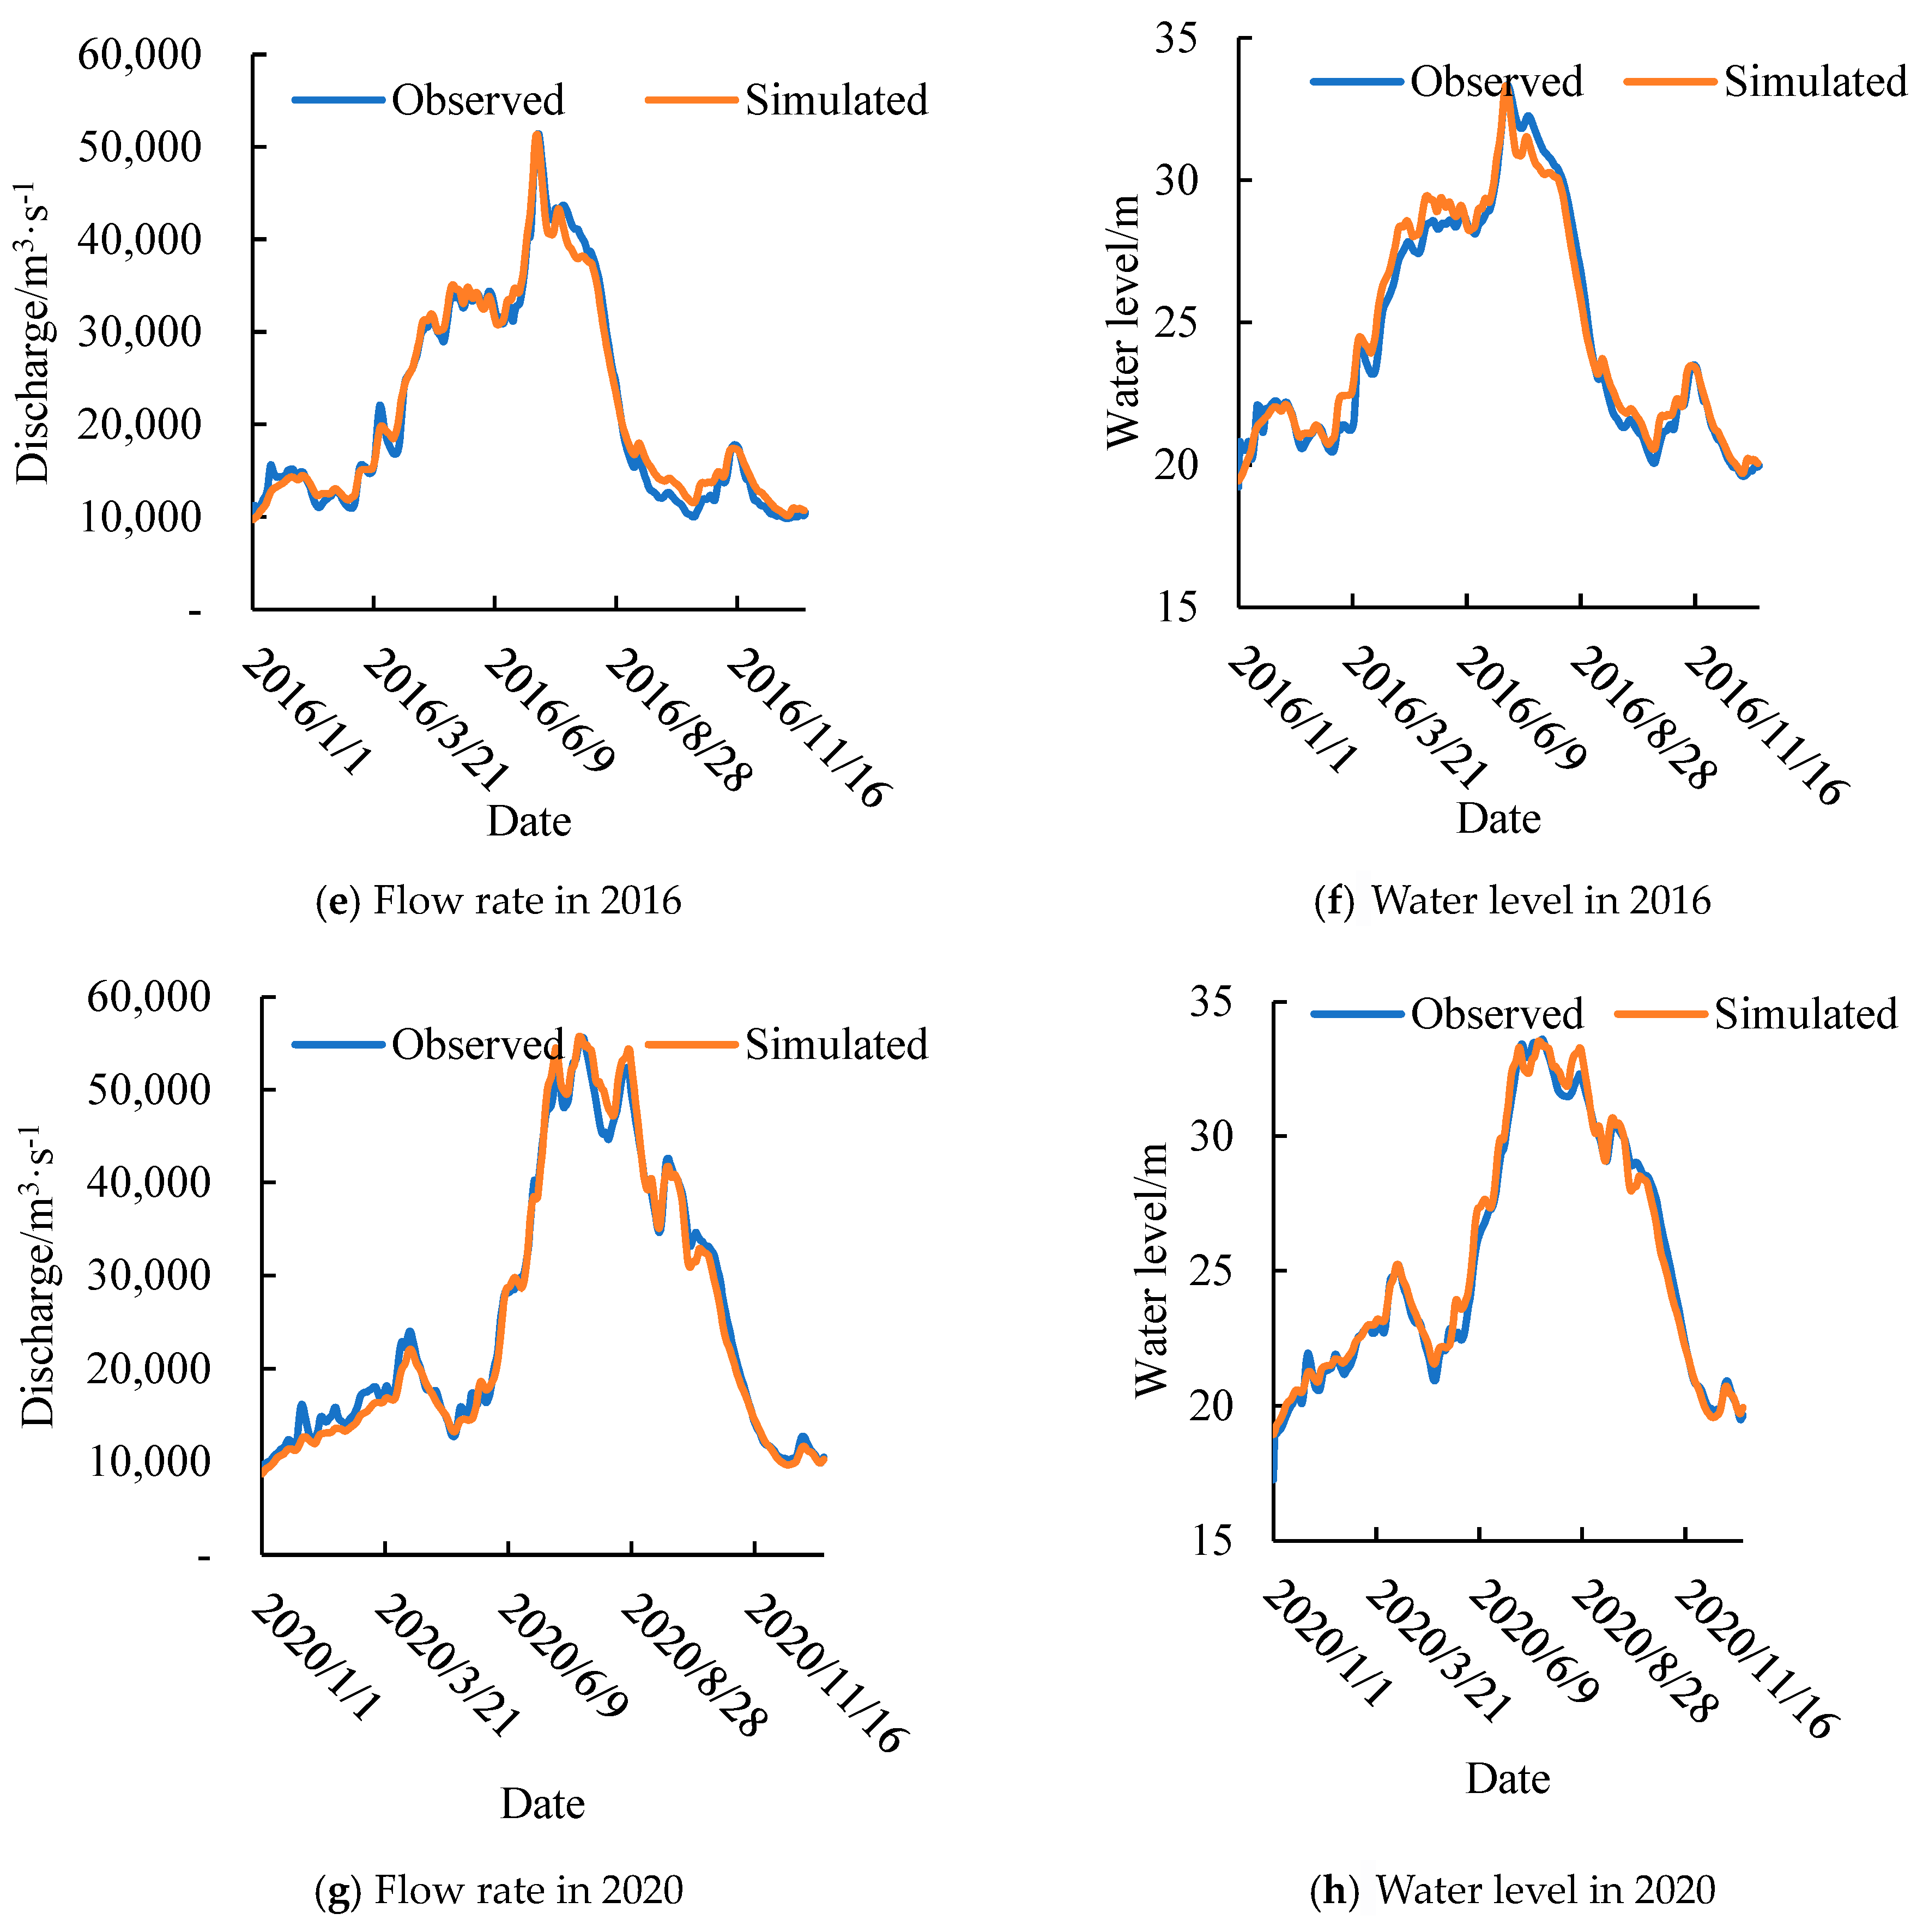
4.1. Training and Verification of Jingjiang–Dongting Lake Hydrological Model

To construct the Jingjiang–Dongting Lake hydrological model, daily hydrological data from high flood years spanning from 1954 to 2020 and precipitation data from corresponding stations were utilized. Figure 5 and Table 3 present the training and testing results of the model, from which it can be seen that the simulated flow rates and water levels were in high agreement with the observed values. Specifically, the Nash–Sutcliffe Efficiency (NSE) coefficients were no less than 0.86. The absolute error for the highest water level ranged from 0.02 to 0.26 m, with an average error of −0.06 m, accounting for 0.18% of the multi-year average highest water level. The absolute error for peak flood flow ranged from 47.7 to 2643.7 m3/s, with an average error of 315.88 m3/s, accounting for 0.53% of the multi-year average peak flood flow. This indicates that the model performed excellently in simulating flow rates and water levels. Meanwhile, all the values were within reasonable parameter ranges: k1 ranged from 1 to 3.24, k2 from 0.13 to 0.19, and m from 0.21 to 0.32.

4.2. Impact on Flood Control Situations in Dongting Lake Under Different Flood Scenarios

Relying on the constructed Jingjiang–Dongting Lake hydrological model, in order to invert the flood impacts on the Dongting Lake area caused by the floods in 1954 and 1998 under the current river–lake relationship conditions, the measured flood series at the Yangtze River’s Zhicheng boundary was utilized, with the discharge from the Three Gorges and upstream cascaded reservoirs set to no more than 30,000 m3/s. Given the limited flood regulation capabilities of the reservoirs on Xiangjiang, Zijiang, Yuanjiang, and Lishui rivers, the corresponding measured flood series at the boundaries of Xiangtan on the Xiangjiang River, Taojiang on the Zijiang River, Taoyuan on the Yuanjiang River, and Shimen on the Lishui River were adopted. The entire model operated under the river–lake relationship conditions of 2020.

4.2.1. Scenario of Elevated Flood Control Water Level

The overall flood control standard for the middle and lower reaches of the Yangtze River aims to defend against the largest flood that has occurred since 1949; namely, the catastrophic basin-wide flood in 1954. The flood control standard for the Jingjiang reach is for a flood with a 100-year return period [45]. The 1998 flood was another major basin-wide flood of the Yangtze River, characterized by its large magnitude, wide coverage, long duration, and severe flooding disasters [46].
Under the river–lake relationship conditions for 2020, the maximum water level at Lianhuatang station during the 1954 flood was 37.2 m and the maximum discharge at Luoshan station was 73,770 m3/s. With water level controls at Lianhuatang station set at 34.4 m, 34.9 m, 35.18 m, 35.45 m, and 35.8 m, the excess flood volumes near Chenglingji were 17.864 billion m3, 7.957 billion m3, 6.926 billion m3, 4.418 billion m3, and 1.421 billion m3, respectively. The excess flood volume in 1954, under the current engineering system, was basically consistent with the previously studied figure of 17.6 billion m3 [47]. When the controlled water level at Lianhuatang was raised to 35.18 m, 35.45 m, and 35.80 m, respectively, compared to the controlled water level of 34.4 m, the excess flood volume near Chenglingji decreased by 10.938 billion m3, 13.446 billion m3, and 16.443 billion m3, respectively, with reduction percentages of 61.23%, 75.27%, and 92.05%.
For the 1998 flood, when the controlled water level at Lianhuatang was raised to 35.18 m, 35.45 m, and 35.80 m, respectively, compared to the controlled water level of 34.4 m, the excess flood volume near Chenglingji decreased by 5.314 billion m3, 7.359 billion m3, and 7.556 billion m3, respectively, with reduction percentages of 65.28%, 90.41%, and 92.75% (Table 4).
In summary, raising the controlled water level at Lianhuatang can basically address the excess flood volume near Chenglingji. Moreover, the highest water level during the historic flood in 1998 reached 35.8 m. Considering the current regional flood control layout, if the water level at Lianhuatang was raised to 35.8 m, it would only require raising of the 550 km main dike along the Yangtze River from Jianli to Hankou within the region, as well as reinforcement of the main dikes totaling 2377 km in length at 11 key polders and 24 flood storage polders in the Dongting Lake area [34]. Based on the unit investment cost for the first-phase risk removal and reinforcement of key polders in Dongting Lake, the estimated cost was CNY 20.376 billion.

4.2.2. Scenario of Using Flood Storage and Detention Areas

Taking into consideration the construction status of flood storage and detention areas, current operable areas include Chengxi polder (5), Weidihu polder (8), Linan polder (9), Datonghu dong polder (17), Gongshuangcha polder (22), Qianlianghu polder (23), and Honghudongfenkuai (26). As shown in Table 5, for the 1954 flood, the excess flood volume near Chenglingji was 17.864 billion cubic meters. Under current conditions, all completed flood storage and detention areas would need to be activated, with a cumulative floodwater storage and diversion of 12.36 billion cubic meters, reducing the peak flow at Luoshan by 19.07% and lowering the water level at Lianhuatang Station by 0.23 m. For the 1998 flood, considering economic losses, the effectiveness of floodwater storage and diversion by the polders, and the need for roughly equal floodwater distribution between Hunan and Hubei provinces, the activation of Weidihu polder (8), Linan polder (9), Gongshuangcha polder (22), and Honghudongfenkuai (26) would be required, which would lower the water level at Lianhuatang Station by 2 m and reduce the peak flow at Luoshan by 17.98%.
Combining previous studies, the estimated inundation losses from floodwater storage and detention areas during the 1954 flood were CNY 26.978 billion, while the estimated inundation losses for the 1998 flood were CNY 11.027 billion [48,49].
After comprehensively considering both the economic cost and the rationality of the water surface profile, raising the controlled water level at Lianhuatang to 35.8 m and implementing supporting measures to heighten and reinforce the dikes and polders is a feasible strategy for flood control and disaster reduction in the middle reaches of the Yangtze River, especially in the vicinity of Chenglingji.

5. Discussion

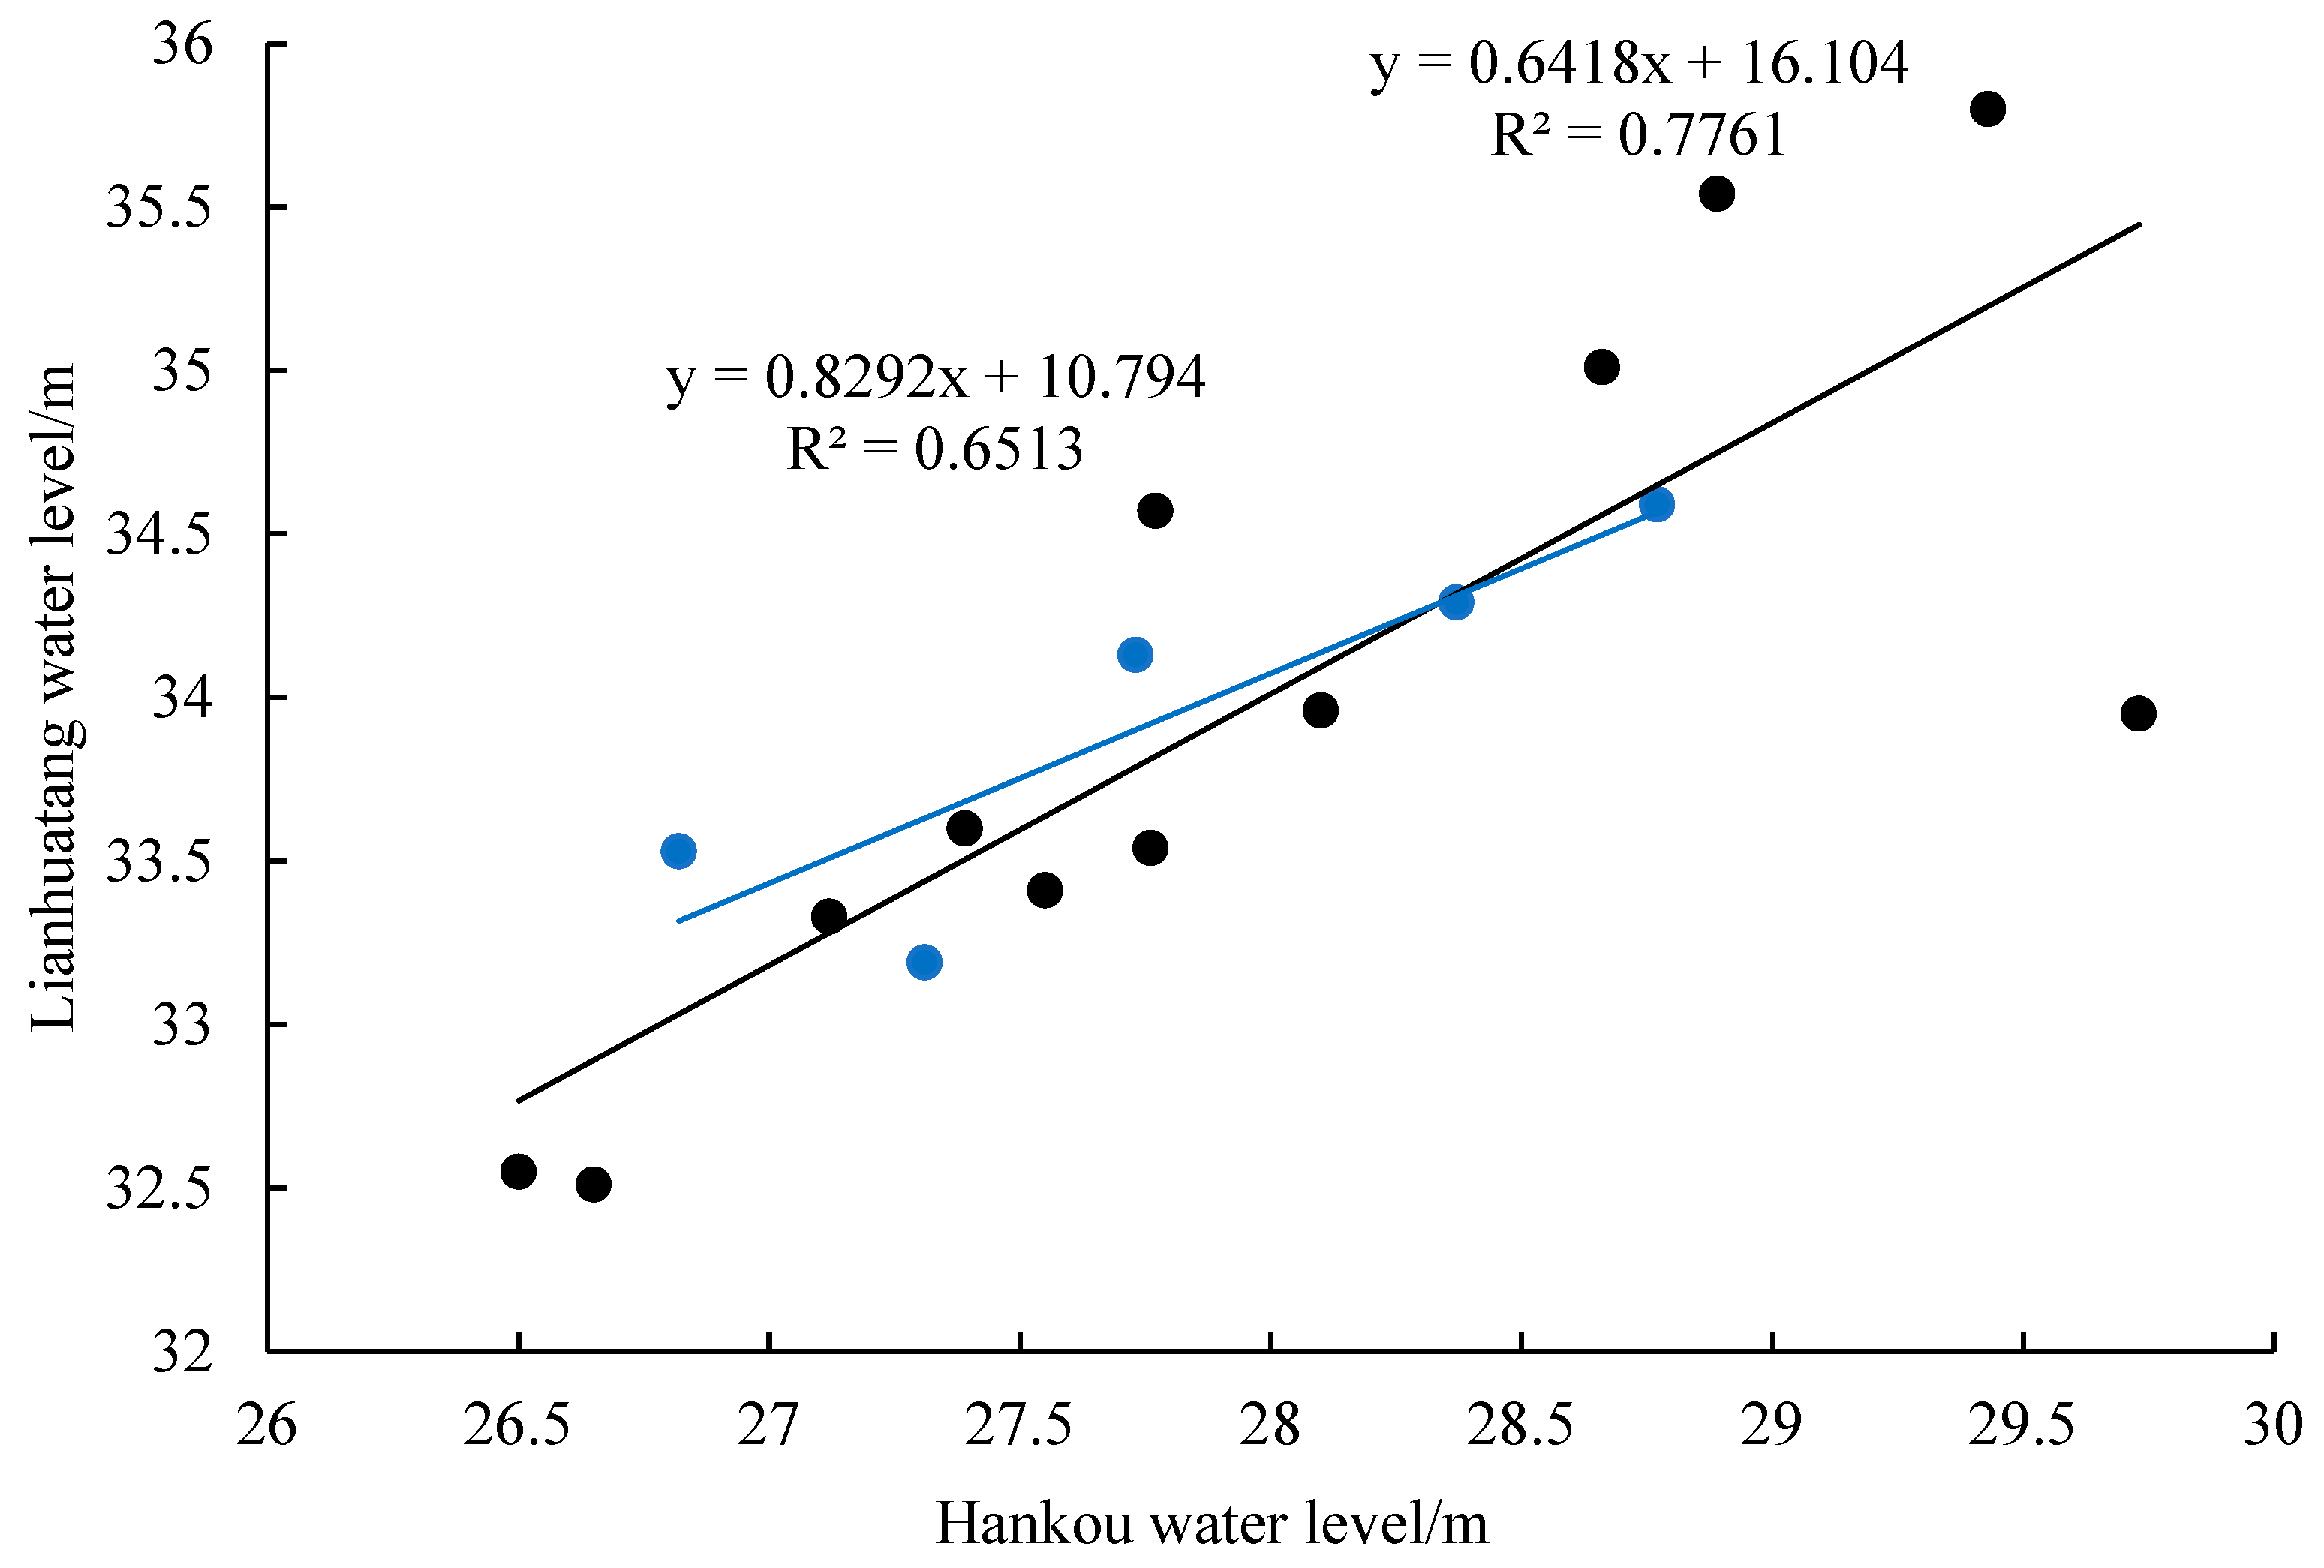
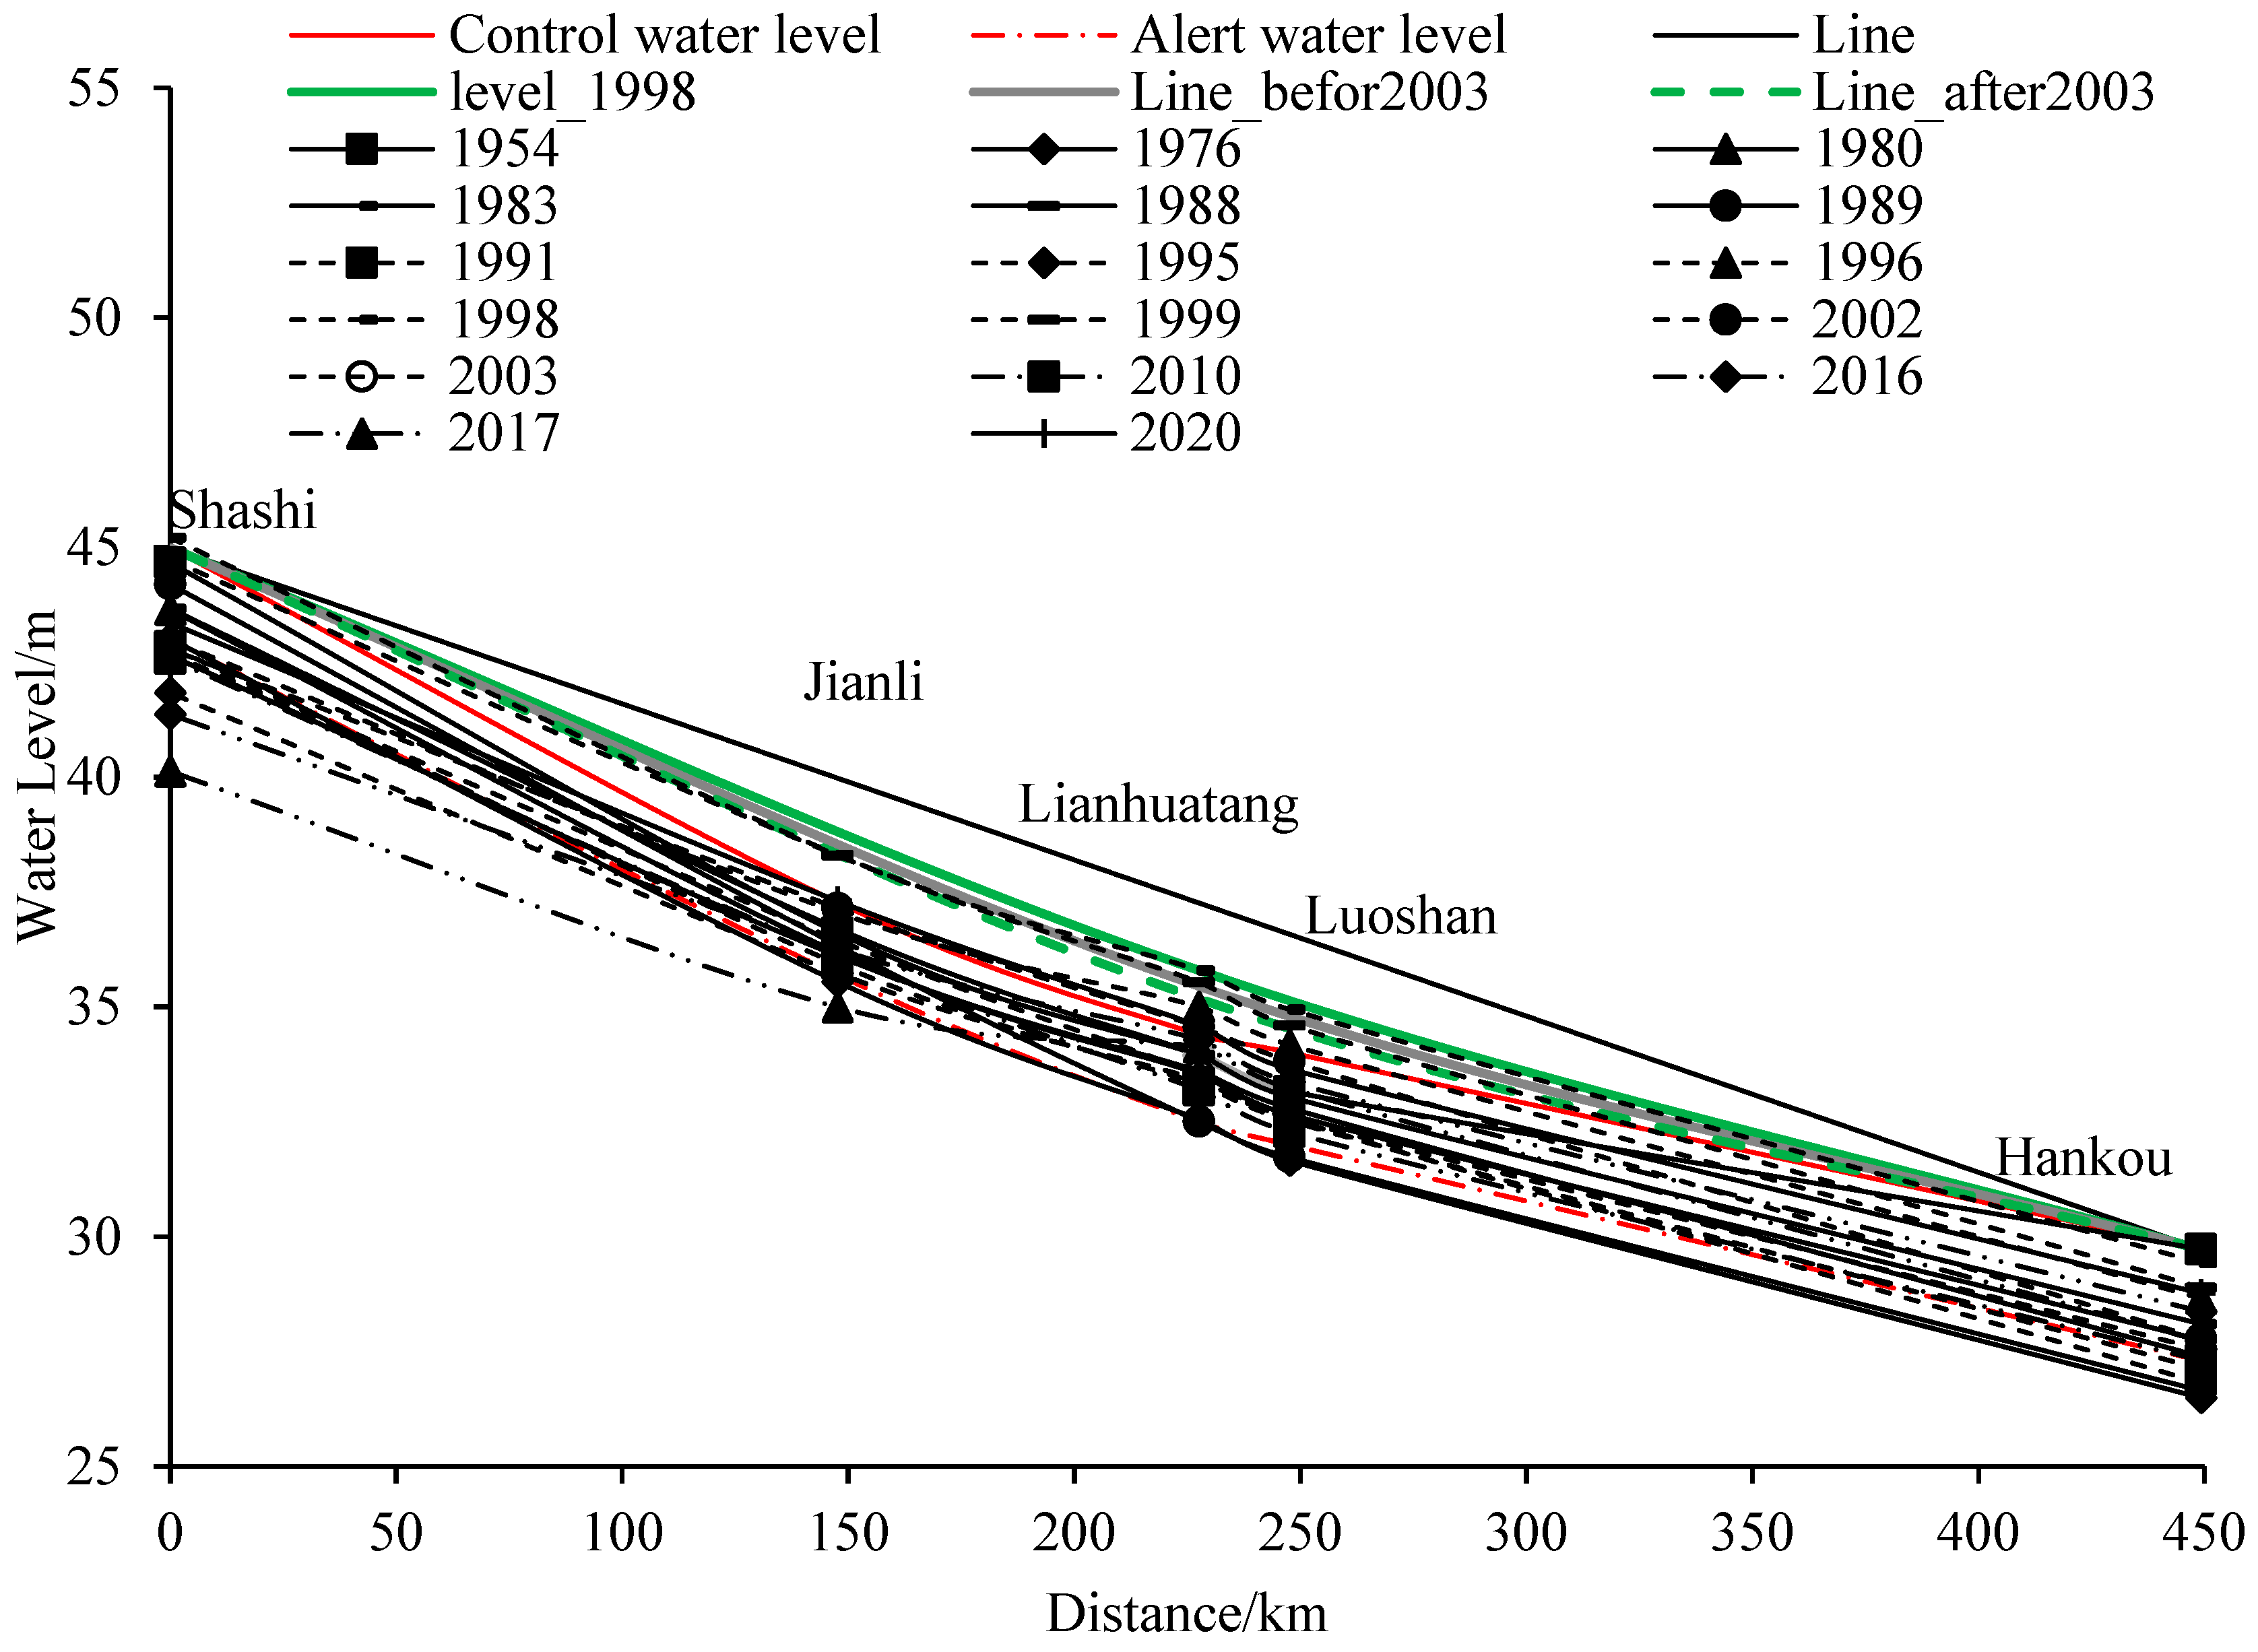
5.1. Analysis of the Impact of River–Lake Conditions on the Flood Control Situation near Chenglingji

Under the condition of raising the controlled water level at Lianhuatang, the impacts of changes in channel storage due to erosion and deposition, as well as variations in the discharge capacity of Luoshan, on the excess flood volume within the region cannot be ignored. Under the determined controlled water level at Lianhuatang, the excess flood volume near Chenglingji is greatly influenced by the state of the river–lake system, especially the diversions at the three outlets of Songzi, Taiping, and Ouchi; the discharging capacity of Luoshan; and the changes in the storage capacity of the river–lake system. Table 6 reflects the flood situations in 1954 under the river–lake states of 1983, 1988, 1989, 1995, 1996, 1998, 1999, 2002, 2003, 2016, 2017, and 2020. It is evident that the highest water level at Lianhuatang Station did not exceed the current controlled water level of 34.4 m in 1954 under the river–lake states of 1988, 1989, 1996, 2003, and 2017, with no excess flood volume. This is likely mainly due to the river–lake conditions in the years 1988, 1989, 2002, 2003, and 2017, which were characterized by the convergence of floods from the Yangtze and Yuanjiang Rivers, floods in the Yangtze River, floods from the Yangtze and Yuanjiang Rivers, floods from the Yangtze and Lishui Rivers, and floods from the Yangtze, Xiangjiang, and Zijiang Rivers. These floods mainly originated in the upstream areas, with combined inflow rates ranging from 54,900 to 66,000 m³/s. When the downstream water level at Hankou was below 28 m and the drop between Luoshan and Hankou was maintained in the range of 5.08 to 5.75 m, the attenuation effect on the discharge capacity of Luoshan was limited, allowing it to remain around the theoretical value of 65,000 m³/s. This is generally consistent with the discharge capacity of 65,800 m³/s at Luoshan, as estimated by An Shenyi et al. in 2003, when the water levels at Chenglingji and Hankou were 34.4 m and 27.5 m, respectively [50]. Adequate discharge capacity ensured that the floods were transmitted downstream without significant accumulation in the region, thus not generating excessive flood volumes.
In 1996, the river–lake conditions were characterized by major floods in the middle and lower reaches of the Yangtze River. With an upstream combined inflow of 64,800 m3/s, a downstream water level at Hankou of 28.66 m, and a drop of 5.52 m, the backwater effect was significant, reducing the discharge capacity of Luoshan to 60,000 m3/s. However, with the initial water level at Lianhuatang at 27.18 m and limited base water in the rivers and lakes, no excessive flood volumes were generated after centralized storage and regulation.
The river–lake conditions in 1995, 1998, and 1999 were all characterized by major floods in the middle and lower reaches of the Yangtze River. With upstream combined inflow rates ranging from 50,700 to 66,900 m3/s, downstream water levels at Hankou of 27.79 to 29.43 m, and drops of 4.79 to 5.71 m, the backwater effect at Hankou was significant, reducing the discharge capacity of Luoshan to 60,000 m3/s. Coupled with the initial high water levels at Lianhuatang (ranging from 28.05 to 29.72 m) and limited storage and regulation space in the rivers and lakes, the region generated excessive flood volumes of 0.06 to 0.32 billion m3.
In 1983, the river–lake relationship had not been reshaped by the multiple floods occurring in the 1990s and still maintained the discharge capacity of 65,000 m3/s determined in the flood control planning of the Yangtze River Basin in the 1960s. However, due to the impact of early-stage reclamation, the storage and regulation space in the rivers and lakes has reduced, resulting in an excessive flood volume of 0.33 billion m3 in the region.
In 2016 and 2020, the river–lake conditions were characterized by high water levels in the region due to the backwater effect of floods in the Poyang Lake water system or Hanjiang River water system downstream. When the water level at Hankou was above 28.3 m and the drop between Hankou and Luoshan was below 5 m, the discharge capacity of Luoshan further decreased to 53,000–56,000 m3/s. With high initial water levels at Lianhuatang and reduced storage and regulation space in the rivers and lakes, the region generated excessive flood volumes of 5.72 to 17.864 billion m3.

5.2. The Limitation of the Study

This study primarily utilized actual flood data recorded in the Yangtze River basin, considering an ideal regulation scenario where the combined discharge from the Three Gorges Dam and upstream cascade reservoirs does not surpass 30,000 m3/s. These data were integrated with the actual flood processes observed in the Xiangjiang, Zijiang, Yuanjiang, and Lishui rivers, employing a specially constructed hydrological model of the Jingjiang–Dongting Lake system in order to delve into the flood control challenges faced by typical high flood water level regions within the current river–lake system (i.e., in 2020). This analysis holds immense significance for flood control and disaster mitigation initiatives.
However, it is crucial to acknowledge that the ongoing operation of upstream cascade reservoirs, led by the Three Gorges Dam, alongside the 53 control reservoirs that operate under the unified management of the Yangtze River—which collectively possess a flood storage capacity of 70.6 billion m3—will further modify downstream discharges during flood seasons [51,52]. Subsequently, refined reservoir operations will lead to corresponding changes in the inflow into tributaries within the Jingjiang–Dongting Lake area. Taking the 2024 flood season as an illustrative example, the Three Gorges Dam maintained a minimum discharge of 14,000 m3/s, well below the 30,000 m3/s threshold, thereby notably enhancing the region’s flood control capabilities.
Moreover, the activation of flood detention basins exerts an interactive influence on the flood control dynamics of external rivers—an aspect that was simplified in this study by considering its impact solely on the flood volume of external rivers. Therefore, future research endeavors must strive to further refine regional inflow optimization approaches in tandem with control objectives, and incorporate hydrodynamic models of local flood detention basins to conduct a detailed re-assessment of the region’s future flood control landscape.

6. Conclusions

A hydrological model of the Jingjiang–Dongting Lake system was constructed using data from 12 typical high flood years between 1954 and 2020. The Nash–Sutcliffe Efficiency (NSE) coefficients of the model exceeded 0.86, with an average absolute error in peak flow simulation of 315.88 m3/s, accounting for 0.53% of the multi-year average peak flow. The average absolute error in the highest water level was 0.06 m, representing 0.18% of the average annual highest water level. This indicates that the constructed Jingjiang–Dongting Lake hydrological model performs well in simulating both flows and water levels.
Based on the river–lake conditions in 2020, the Jingjiang–Dongting Lake hydrological model was used to study the floods of 1954 and 1998. The findings revealed that, without activating flood storage and detention areas, raising the control water level at Lianhuatang to 35.8 m could reduce the excess flood volume near Chenglingji by 92.05% and 92.75%, respectively. Alternatively, without raising the control water level at Lianhuatang, activating the flood storage and detention areas could reduce the peak flow at Luoshan Station by 19.07% and 17.98%, decreasing the excess flood volume near Chenglingji by 69.19% and 100%, respectively. From the perspectives of reducing disaster losses and hydraulic rationality, raising the controlled water level at Lianhuatang to 35.8 m and fully utilizing the storage capacity of rivers and lakes, while reinforcing and raising the 2377 km of main levees, can both address the issue of excessive flood volumes and avoid direct losses of approximately 2.6978 billion Yuan due to flood diversion and storage. This has significant practical implications for ensuring flood control safety, thus promoting the economic and social development of the Yangtze River Economic Belt.

Author Contributions

Conceptualization, X.L. and W.Z.; methodology, W.J. and J.W.; Software J.W. and W.S.; formal analysis, J.J. and Z.W.; investigation, H.L. (Huizhu Lv) and H.L. (Hanyou Lu); writing—original draft preparation, W.Z., W.J. and J.W.; funding acquisition, X.L. All authors have read and agreed to the published version of the manuscript.

Funding

This research was funded by the National Key Research and Development Program Project (Grant No. 2022YFC3201804-03), Hunan Provincial Water Conservancy Science and Technology Planning Project (Grant No. XSKJ2022068-13, XSKJ2022068-12, XSKJ2023059-05), and Hunan Xiaohe science and technology talent project (Grant No. 2024TJ-X76).

Data Availability Statement

The datasets generated during and/or analyzed during the current study can be made available upon request.

Acknowledgments

The research team acknowledges data support from Changjiang Water Resources Bureau Hydrology Bureau and the Hunan Provincial Hydrology and Water Resources Survey Center.

Conflicts of Interest

The authors declare no conflicts of interest.

References

  1. Masson-Delmotte, V.; Zhai, P.; Pirani, S.; Connors, C.; Péan, S.; Berger, N.; Caud, Y.; Chen, L.; Goldfarb, M.; Scheel Monteiro, P.M. Ipcc, 2021: Summary for policymakers. In Proceedings of the Climate Change 2021: The Physical Science Basis. Contribution of Working Group I to the Sixth Assessment Report of the Intergovernmental Panel on Climate Change; Cambridge University Press: Cambridge, UK; New York, NY, USA, 2021. [Google Scholar]
  2. Mirza, M.M.Q. Global warming and changes in the probability of occurrence of floods in Bangladesh and implications. Glob. Environ. Chang. 2002, 12, 127–138. [Google Scholar] [CrossRef]
  3. Bates, P.D. Flood Inundation Prediction. Annu. Rev. Fluid Mech. 2022, 54, 287–315. [Google Scholar] [CrossRef]
  4. Brunner, M.I.; Slater, L.; Tallaksen, L.M.; Clark, M. Challenges in modeling and predicting floods and droughts: A review. WIREs Water 2021, 8, e1520. [Google Scholar] [CrossRef]
  5. Patel, D.P.; Ramirez, J.A.; Srivastava, P.K.; Bray, M.; Han, D. Assessment of flood inundation mapping of Surat city by coupled 1D/2D hydrodynamic modeling: A case application of the new HEC-RAS 5. Nat. Hazards 2017, 89, 93–130. [Google Scholar] [CrossRef]
  6. Yang, T.-H.; Liu, W.-C. A General Overview of the Risk-Reduction Strategies for Floods and Droughts. Sustainability 2020, 12, 2687. [Google Scholar] [CrossRef]
  7. Fekete, B.M.; Bogárdi, J.J. Role of engineering in sustainable water management. Earth Perspect. 2015, 2, 2. [Google Scholar] [CrossRef]
  8. Lebu, S.; Lee, A.; Salzberg, A.; Bauza, V. Adaptive strategies to enhance water security and resilience in low-and middle-income countries: A critical review. Sci. Total Environ. 2024, 925, 171520. [Google Scholar] [CrossRef]
  9. Teraguchi, H.; Nakagawa, H.; Kawaike, K.; Yasuyuki, B.; Zhang, H. Effects of hydraulic structures on river morphological processes. Int. J. Sediment Res. 2011, 26, 283–303. [Google Scholar] [CrossRef]
  10. Vionnet, V.; Fortin, V.; Gaborit, E.; Roy, G.; Abrahamowicz, M.; Gasset, N.; Pomeroy, J.W. Assessing the factors governing the ability to predict late-spring flooding in cold-region mountain basins. Hydrol. Earth Syst. Sci. 2020, 24, 2141–2165. [Google Scholar] [CrossRef]
  11. Contreras, M.T.; Gironás, J.; Escauriaza, C. Forecasting flood hazards in real-time: A surrogate model for hydrometeorological events in an Andean watershed. Nat. Hazards Earth Syst. Sci. Discuss. 2020, 20, 3261–3277. [Google Scholar] [CrossRef]
  12. Kumar, V.; Sharma, K.; Caloiero, T.; Mehta, D.; Singh, K. Comprehensive Overview of Flood Modeling Approaches: A Review of Recent Advances. Hydrology 2023, 10, 141. [Google Scholar] [CrossRef]
  13. Zou, J.; Huang, F.; Yu, F.; Shen, X.; Han, S.; Qian, Z.; Jiang, H. Differentiating the Effects of Streamflow and Topographic Changes on the Water Level of Dongting Lake, China, Using the LSTM Network and Scenario Analysis. Water 2023, 15, 3742. [Google Scholar] [CrossRef]
  14. Ansarifard, S.; Eyvazi, M.; Kalantari, M.; Mohseni, B.; Ghorbanifard, M.; Moghaddam, H.J.; Nouri, M. Simulation of floods under the influence of effective factors in hydraulic and hydrological models using HEC-RAS and MIKE 21. Discov. Water 2024, 4, 92. [Google Scholar] [CrossRef]
  15. Long, Y.; Chen, W.; Jiang, C.; Huang, Z.; Yan, S.; Wen, X. Improving streamflow simulation in Dongting Lake Basin by coupling hydrological and hydrodynamic models and considering water yields in data-scarce areas. J. Hydrol. Reg. Stud. 2023, 47, 101420. [Google Scholar] [CrossRef]
  16. Chen, Y.; Wang, Y.; Zhang, Y.; Luan, Q.; Chen, X. Flash floods, land-use change, and risk dynamics in mountainous tourist areas: A case study of the Yesanpo Scenic Area, Beijing, China. Int. J. Disaster Risk Reduct. 2020, 50, 101873. [Google Scholar] [CrossRef]
  17. Suwannachai, L.; Sriworamas, K.; Sivanpheng, O.; Kangrang, A. Application of SWAT Model for Assessment of Surface Runoff in Flash Flood Areas. Water 2024, 16, 495. [Google Scholar] [CrossRef]
  18. Salvati, A.; Moghaddam Nia, A.; Salajegheh, A.; Shirzadi, A.; Shahabi, H.; Ahmadisharaf, E.; Han, D.; Clague, J.J. A systematic review of Muskingum flood routing techniques. Hydrol. Sci. J. 2024, 69, 810–831. [Google Scholar] [CrossRef]
  19. Zhou, Q.; Teng, S.; Situ, Z.; Liao, X.; Feng, J.; Chen, G.; Zhang, J.; Lu, Z. A deep-learning-technique-based data-driven model for accurate and rapid flood predictions in temporal and spatial dimensions. Hydrol. Earth Syst. Sci. 2023, 27, 1791–1808. [Google Scholar] [CrossRef]
  20. Chafjiri, A.S.; Gheibi, M.; Chahkandi, B.; Eghbalian, H.; Waclawek, S.; Fathollahi-Fard, A.M.; Behzadian, K. Enhancing flood risk mitigation by advanced data-driven approach. Heliyon 2024, 10, e37758. [Google Scholar] [CrossRef]
  21. Zhang, K.; Ji, Z.; Luo, X.; Liu, Z.; Zhong, H. Flood Simulation in the Complex River Basin Affected by Hydraulic Structures Using a Coupled Hydrological and Hydrodynamic Model. Water 2024, 16, 2383. [Google Scholar] [CrossRef]
  22. Huang, H.; Lei, X.; Liao, W.; Liu, D.; Wang, H. A hydrodynamic-machine learning coupled (HMC) model of real-time urban flood in a seasonal river basin using mechanism-assisted temporal cross-correlation (MTC) for space decoupling. J. Hydrol. 2023, 624, 129826. [Google Scholar] [CrossRef]
  23. Pang, C.; Zhou, Z.; Liu, J.; Tianyu, S.; Du, C.; Wang, K.; Yu, X. Parallel computing performance of distributed hydrological model accelerated by GPU. South-North Water Transf. Water Sci. Technol. 2024, 22, 33–38. [Google Scholar]
  24. Zhang, D.; Shi, X.; Xu, H.; Jing, Q.; Pan, X.; Liu, T.; Wang, H.; Hou, H. A GIS-based spatial multi-index model for flood risk assessment in the Yangtze River Basin, China. Environ. Impact Assess. Rev. 2020, 83, 106397. [Google Scholar] [CrossRef]
  25. Zhang, C.; Sun, F.; Sharma, S.; Zeng, P.; Mejia, A.; Lyu, Y.; Gao, J.; Zhou, R.; Che, Y. Projecting multi-attribute flood regime changes for the Yangtze River basin. J. Hydrol. 2023, 617, 128846. [Google Scholar] [CrossRef]
  26. Duan, G.-L.; Long, H.; Guo, M.-J. Evolvement of Riverbed Near Bank of Dangerous Reach along Jingjiang River Levee after the Impoundment of Three Gorges Reservoir. J. Yangtze River Sci. Res. Inst. 2014, 31, 117. [Google Scholar]
  27. Jiang, Y.-H.; Cheng, H.-Q.; Zhou, Q.-P.; Li, Y.; Yang, G.-Q.; Jin, Y.; Mei, S.-J.; Gu, X.; Zhang, H. Influence of major water conservation projects on river channels and shorelines in the middle and lower reaches of the Yangtze River. Arab. J. Geosci. 2021, 14, 884. [Google Scholar] [CrossRef]
  28. Li, S.; Li, Y.; Yuan, J.; Zhang, W.; Chai, Y.; Ren, J. The impacts of the Three Gorges Dam upon dynamic adjustment mode alterations in the Jingjiang reach of the Yangtze River, China. Geomorphology 2018, 318, 230–239. [Google Scholar] [CrossRef]
  29. Chang, J.; Li, J.; Lu, D.; Zhu, X.; Lu, C.; Zhou, Y.; Deng, C. The hydrological effect between Jingjiang River and Dongting Lake during the initial period of Three Gorges Project operation. J. Geogr. Sci. 2010, 20, 771–786. [Google Scholar] [CrossRef]
  30. Liao, S.; Wang, C.; Ji, R.; Zhang, X.; Wang, Z.; Wang, W.; Chen, N. Balancing Flood Control and Economic Development in Flood Detention Areas of the Yangtze River Basin. ISPRS Int. J. Geo-Inf. 2024, 13, 122. [Google Scholar] [CrossRef]
  31. Xia, J.; Chen, J. A new era of flood control strategies from the perspective of managing the 2020 Yangtze River flood. Sci. China Earth Sci. 2021, 64, 1–9. [Google Scholar] [CrossRef]
  32. Xing, L.; Zhang, D.-D.; Shuai, L. Influence of Three Gorges Reservoir on Flood Regime of Mid-lower Reaches of Yangtze River. Water Resour. Power 2019, 37, 44–46. [Google Scholar]
  33. Hu, C.; Zhang, S. Discussion on development and protection strategy of Yangtze River. Yangtze River 2020, 51, 1–5. [Google Scholar]
  34. Shen, X.; Liu, X.; Zhao, W. Reflections on Flood Control in the Middle Reaches of Yangtze River. Technol. Econ. Change 2023, 7, 43–48. [Google Scholar]
  35. Lai, X.; Jiang, J.; Yang, G.; Lu, X.X. Should the Three Gorges Dam be blamed for the extremely low water levels in the middle–lower Yangtze River? Hydrol. Process. 2013, 28, 150–160. [Google Scholar] [CrossRef]
  36. Wang, H.; Sun, F.; Liu, W. Characteristics of streamflow in the main stream of Changjiang River and the impact of the Three Gorges Dam. Catena 2020, 189, 104498. [Google Scholar] [CrossRef]
  37. Bureau of Hydrology, Changjiang Water Resources Commission. The 1954 Flood of the Yangtze River; Changjiang Publishing House: Wuhan, China, 2004. [Google Scholar]
  38. Zhang, Y.; Liu, X.; Lu, X. Study on Flood Simulation in the Middle and Lower Reaches of the Yangtze River. Hydraul. Hydropower Eng. 2003, 5, 17–19. [Google Scholar]
  39. Wang, J.; Hong, Y.; Li, L.; Gourley, J.J.; Khan, S.I.; Yilmaz, K.K.; Adler, R.F.; Policelli, F.S.; Habib, S.; Irwn, D.; et al. The coupled routing and excess storage (CREST) distributed hydrological model. Hydrol. Sci. J. 2011, 56, 84–98. [Google Scholar] [CrossRef]
  40. Zou, B.; Shiqiang, L. Applicability of Single-valued Lake Routing Model at the Luoshan Station. J. China Hydrol. 2011, 31, 140–142+147. [Google Scholar]
  41. Zhu, Y.; Guo, X.; Li, L. Changes of flood diversion capacity of three outlets on Jingjiang reach and outflow of Dongting Lake during 2020 flood season. Yangtze River 2020, 51, 210–215. [Google Scholar]
  42. Yan, B.; Gu, Y.; Li, E.; Xu, Y.; Ni, L. Runoff Prediction of Tunxi Basin under Projected Climate Changes Based on Lumped Hydrological Models with Various Model Parameter Optimization Strategies. Sustainability 2024, 16, 6897. [Google Scholar] [CrossRef]
  43. Dariane, A.B.; Bagheri, R.; Ghasemi, M.; Asadi, R. Comparative implementation of melody search in auto-calibrating SWAT. Arab. J. Geosci. 2024, 17, 168. [Google Scholar] [CrossRef]
  44. Sohi, H.Y.; Zahraie, B.; Dolatabadi, N.; Zebarjadian, F. Application of VIC-WUR model for assessing the spatiotemporal distribution of water availability in anthropogenically-impacted basins. J. Hydrol. 2024, 637, 131365. [Google Scholar] [CrossRef]
  45. Zhang, X.; Li, Y.; Niu, W. Strategy of water projects joint operation program on upper-middle reaches of Changjiang River for controlling 1954 flood under current conditions. Yangtze River 2020, 51, 141–148. [Google Scholar]
  46. Hu, X.; Ding, Y.; Zou, Q.; Li, A. Study and application of collaborative operation model of reservoir groups in upper reaches of Changjiang River for multi-regional flood control. Yangtze River 2020, 51, 56–63+79. [Google Scholar]
  47. Zou, Q.; Yu, B.; Ding, Y.; He, X. Study on the Flood Control Role of Reservoir Group in the Upper Reaches of the Yangtze River during the 1998 Flood. In Proceedings of the 2023 China Water Resources Academic Conference, Zhengzhou, China, 7–8 July 2023; p. 9. [Google Scholar]
  48. Cai, L. An Evaluation of the Honghu East Block Flood Project’Social Impact—Based on an Survey of the Social and Economic Development at the Honghu Est Block Storage Area. J. Hubei Univ. Technol. 2016, 31, 26–30. [Google Scholar]
  49. Shen, X.; Shi, Y.; Liu, X.; Song, P.; Luan, Z.; Zhao, W. Study on Countermeasures for Flood Storage and Disaster Mitigation during Extraordinary Floods in Dongting Lake Region; Changjiang Publishing House: Wuhan, China, 2022. [Google Scholar]
  50. An, S.; Guo, L. Discussion on the Flood Discharge Capacity of Chenglingji (Luoshan Station). Hog Shui River 2005, 24, 1–4. [Google Scholar]
  51. Liu, Z.; Chen, X.; Liu, F.; Lin, K.; He, Y.; Cai, H. Joint Dependence Between River Water Temperature, Air Temperature, and Discharge in the Yangtze River: The Role of the Three Gorges Dam. J. Geophys. Res. Atmos. 2018, 123, 11938–11951. [Google Scholar] [CrossRef]
  52. Tan, G.; Chen, P.; Deng, J.; Xu, Q.; Tang, R.; Feng, Z.; Xiong, Y. Estimations and changes of the dominant discharge in Three Gorges Reservoir channel. Arab. J. Geosci. 2019, 12, 82. [Google Scholar] [CrossRef]
Figure 1. Map of the study area’s location.
Water 17 00001 g001
Figure 2. Flowchart of the CREST Model. (PE: rainfall minus evapotranspiration capacity; IM: impermeability factor; Ec: canopy evaporation; Th: thresholds for delineation of slopes and channels; other symbols are customary in hydrological modelling).
Water 17 00001 g002
Figure 3. Correlations between water levels at Hankou and Lianhuatang stations before and after the operation of the Three Gorges Dam.
Water 17 00001 g003
Figure 4. Relationships between the highest water levels at various control stations and the warning and control water levels during high flood years.
Water 17 00001 g004
Figure 5. Comparisons of simulated and observed water levels and flow rates for typical years at Luoshan station.
Water 17 00001 g005aWater 17 00001 g005b
Table 1. List of data sources for relevant meteorological and hydrological factors.
FactorsStationsYears
DischargeXiangtan, Taojiang, Taoyuan, Shimen, Zhicheng, Lianhuatang, Luoshan1954, 1983, 1995, 1996, 1998, 1999, 2002, 2003, 2016, 2017, 2020
Water levelLianhuatang, Luoshan
PrecipitationXiangtan, Taojiang, Taoyuan, Shimen, Zhicheng, Changsha, Changde, Yueyang
Table 2. Scenario design for typical flood years in Dongting Lake area.
ScenariosYearControl Water Level (m)Note
1195434.40Current controlled water level
2195434.90Current operating water level
3195435.18Projected water level after the Three Gorges Dam operation
4195435.45Projected water level before the Three Gorges Dam operation
5195435.80Highest historical water level
6199834.40Current controlled water level
7199834.90Current operating water level
8199835.18Projected water level after the Three Gorges Dam operation
9199835.45Projected water level before the Three Gorges Dam operation
10199835.80Highest historical water level
11195434.40Activate Flood Storage and Detention Areas
12199834.40Activate Flood Storage and Detention Areas
13195434.40\
14199834.40\
Table 3. Evaluation of results and calibration parameters for the Jingjiang–Dongting Lake hydrological model (Luohshan station).
YearDischargeWater Level
NSEAbsolute Error of Peak Flood Discharge (m3/s)k2NSEAbsolute Error of Peak Water Level (m)k1m
19540.862643.70.150.860.042.210.24
19830.95−797.80.190.95−0.082.030.25
19880.98326.10.190.98−0.182.000.25
19890.9447.70.170.94−0.13.240.21
19950.99700.170.990.141.810.27
19960.99710.130.990.261.930.26
19980.981712.50.180.99−0.182.040.25
19990.9910.80.140.990.032.040.25
20020.97144.40.170.97−0.202.230.24
20030.98−379.30.150.98−0.232.550.23
20160.98−72.40.130.98−0.021.000.32
20170.98201.10.140.98−0.141.510.28
20200.99128.60.160.99−0.081.170.31
Average-315.88--−0.06--
Table 4. Analysis of flood control situation near Chenglingji under different controlled water level conditions.
ScenariosYearControl Water Level (m)Peak Discharge/34.4 m (m3/s)Peak Water Level (m)Excess Flood Volume (108 m3)
BeforeAfterReduction
1195434.4073,770/56,30037.2178.64--
2195434.9073,770/56,30037.2178.6479.5799.07
3195435.1873,770/56,30037.2178.6469.26109.38
4195435.4573,770/56,30037.2178.6444.18134.46
5195435.8073,770/56,30037.2178.6414.21164.43
6199834.4068,280/56,30036.481.40--
7199834.9068,280/56,30036.481.4039.6641.74
8199835.1868,280/56,30036.481.4028.2653.14
9199835.4568,280/56,30036.481.407.8173.59
10199835.8068,280/56,30036.481.405.9075.5
Table 5. Analysis of flood control situation near Chenglingji with the activation of different flood retention basins.
ScenariosYearActivated Flood Retention BasinsPeak Discharge (34.4 m)Peak Water Level (m)Excess Flood Volume (108 m3)
Before (m3/s)After (m3/s)Decay RateBeforeAfterReductionBeforeAfterReduction
1119545, 8, 9, 17, 22, 23, 2673,770
(56,300)
59,700
(53,900)
19.07%
(4.03%)
37.234.92.30178.6455.04123.6
1219988, 9, 22, 2668,280
(56,300)
56,00017.98%
(0.53%)
36.434.42.0081.40081.4
Table 6. Flood control situation near Chenglingji under different river–lake conditions.
Serial NumberConditions of River–Lake InteractionsPeak Water Level of Lianhuatang Station (m)Peak Discharge of Luoshan Station (m3/s)Excess Flood Volume (108 m3)
34.435.8
1198334.665,5803.4-
2198833.360,610--
3198933.360,399--
4199534.659,5023.2-
5199634.259,944--
6199834.660,7362.3-
7199934.561,5700.6-
8200233.963,840--
9200333.560,961--
10201635.759,91457.2-
11201734.060,772--
12202037.273,770178.6414.21
Disclaimer/Publisher’s Note: The statements, opinions and data contained in all publications are solely those of the individual author(s) and contributor(s) and not of MDPI and/or the editor(s). MDPI and/or the editor(s) disclaim responsibility for any injury to people or property resulting from any ideas, methods, instructions or products referred to in the content.

