
Human Activities Impacts on Runoff and Ecological Flow in the Huangshui River of the Yellow River Basin, China


Abstract
1. Introduction
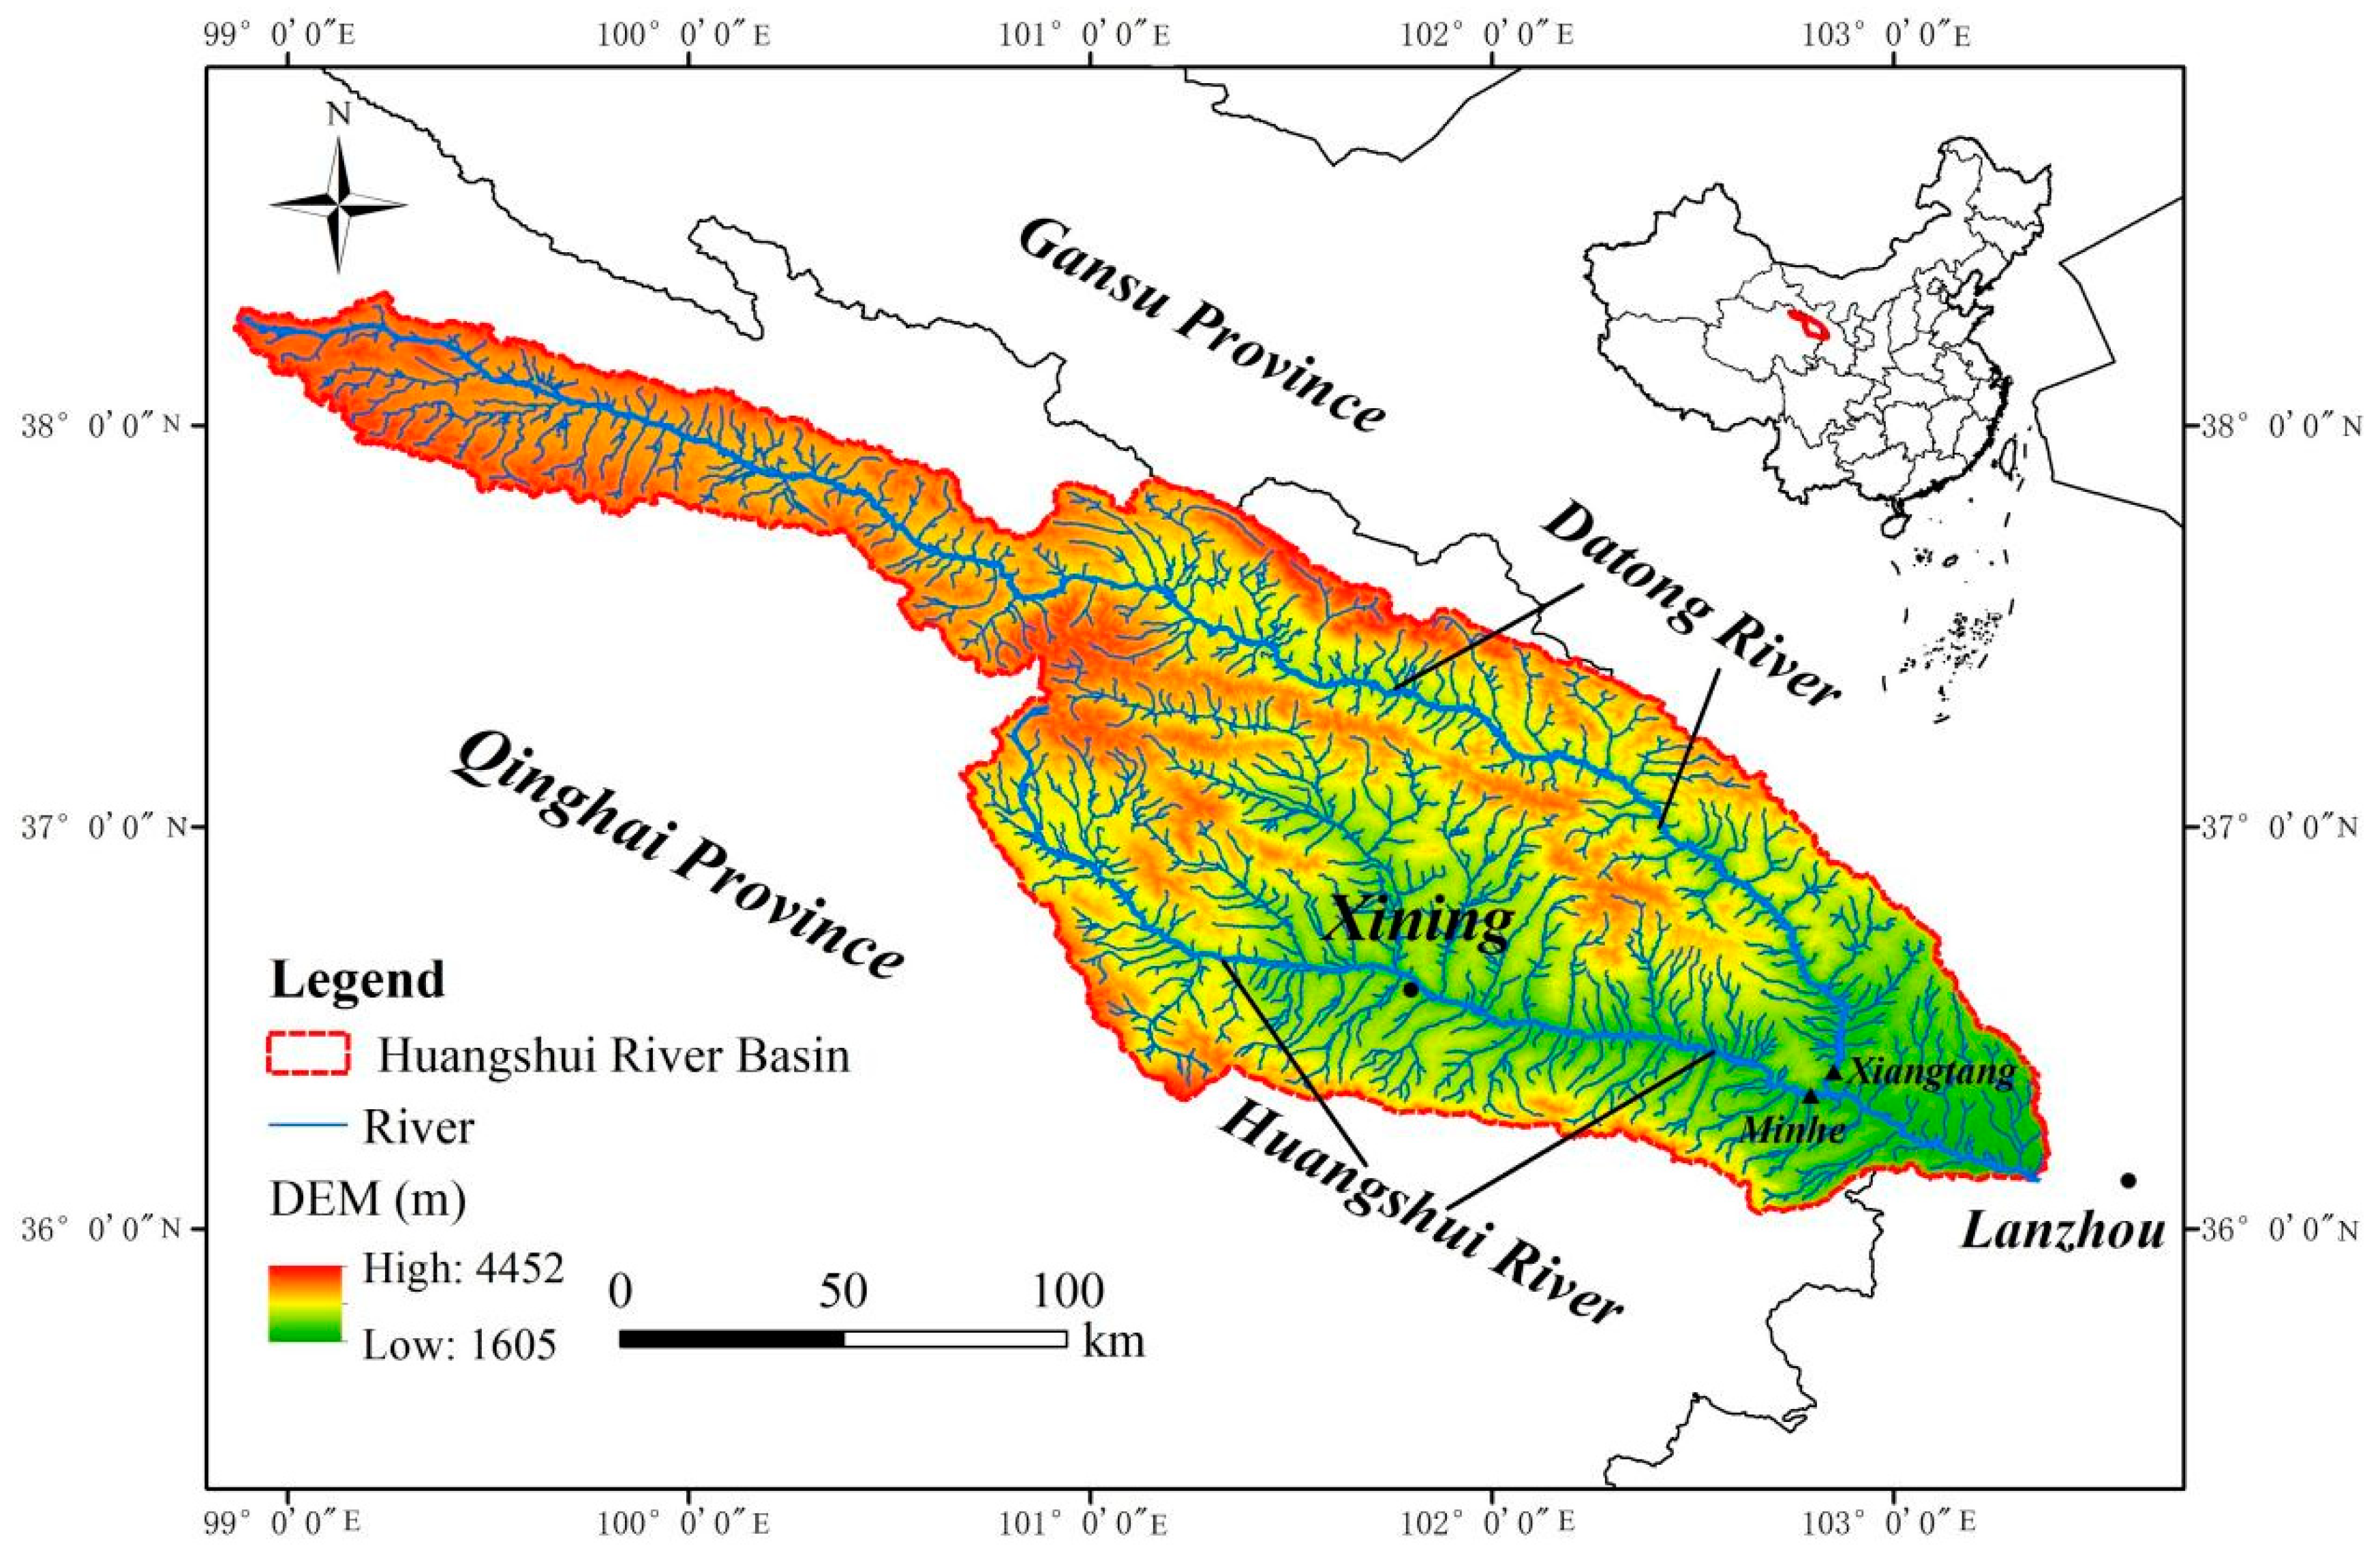
2. Study Area
3. Study Methods
3.1. Mann–Kendall Mutation Test Method
3.2. Indicators of Hydrologic Alteration (IHA)
3.3. Range of Variability Approach (RVA)
3.4. Ecological Water Demand Method
3.4.1. Tennant Method
3.4.2. Ecological Flow Assurance Rate and Evaluation Standard
4. Result Analysis
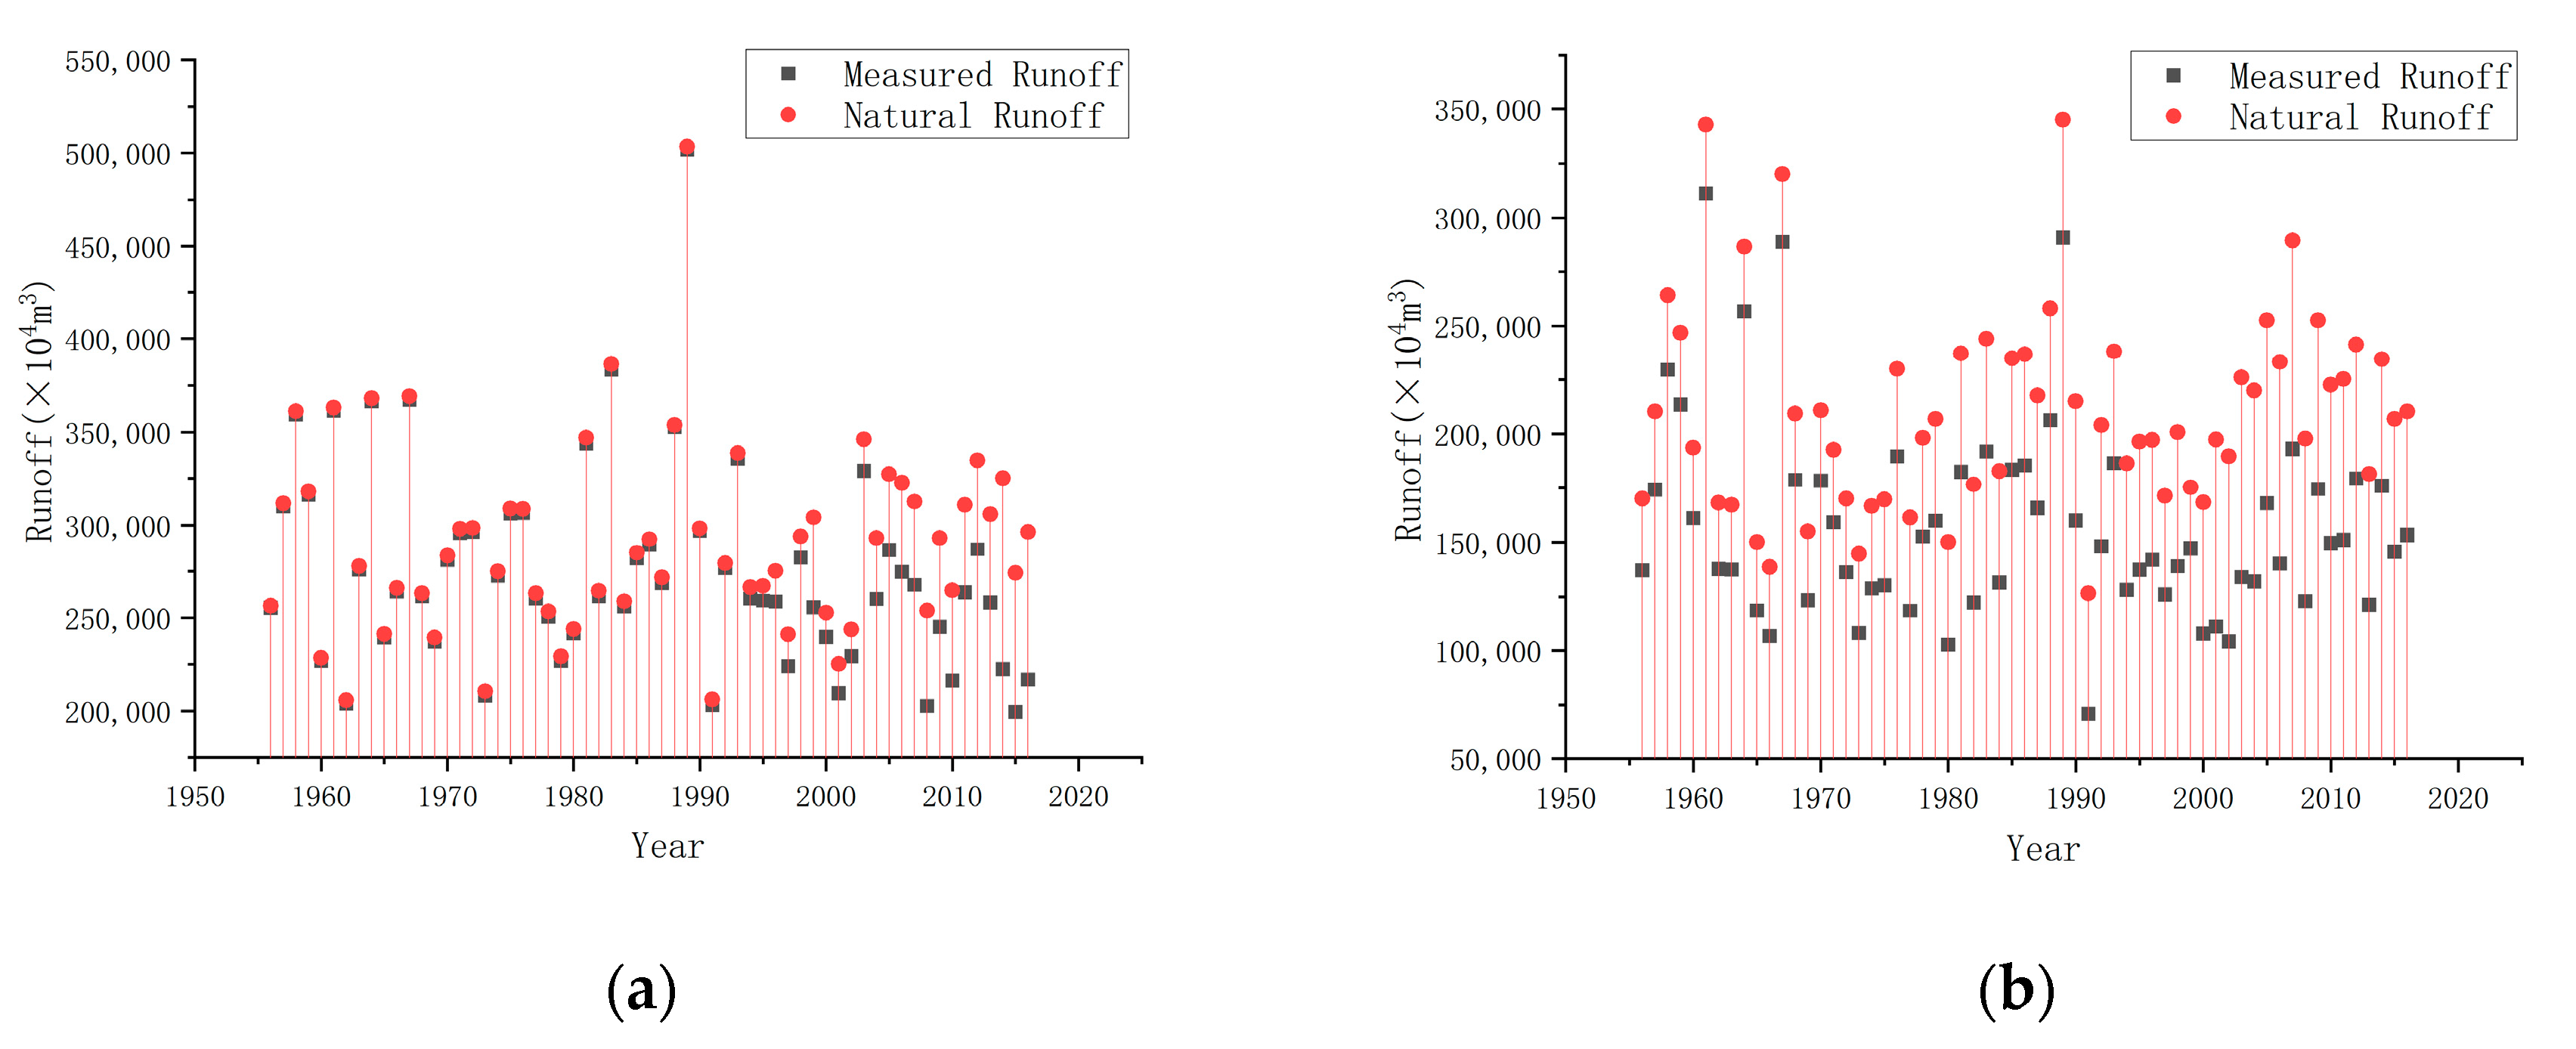
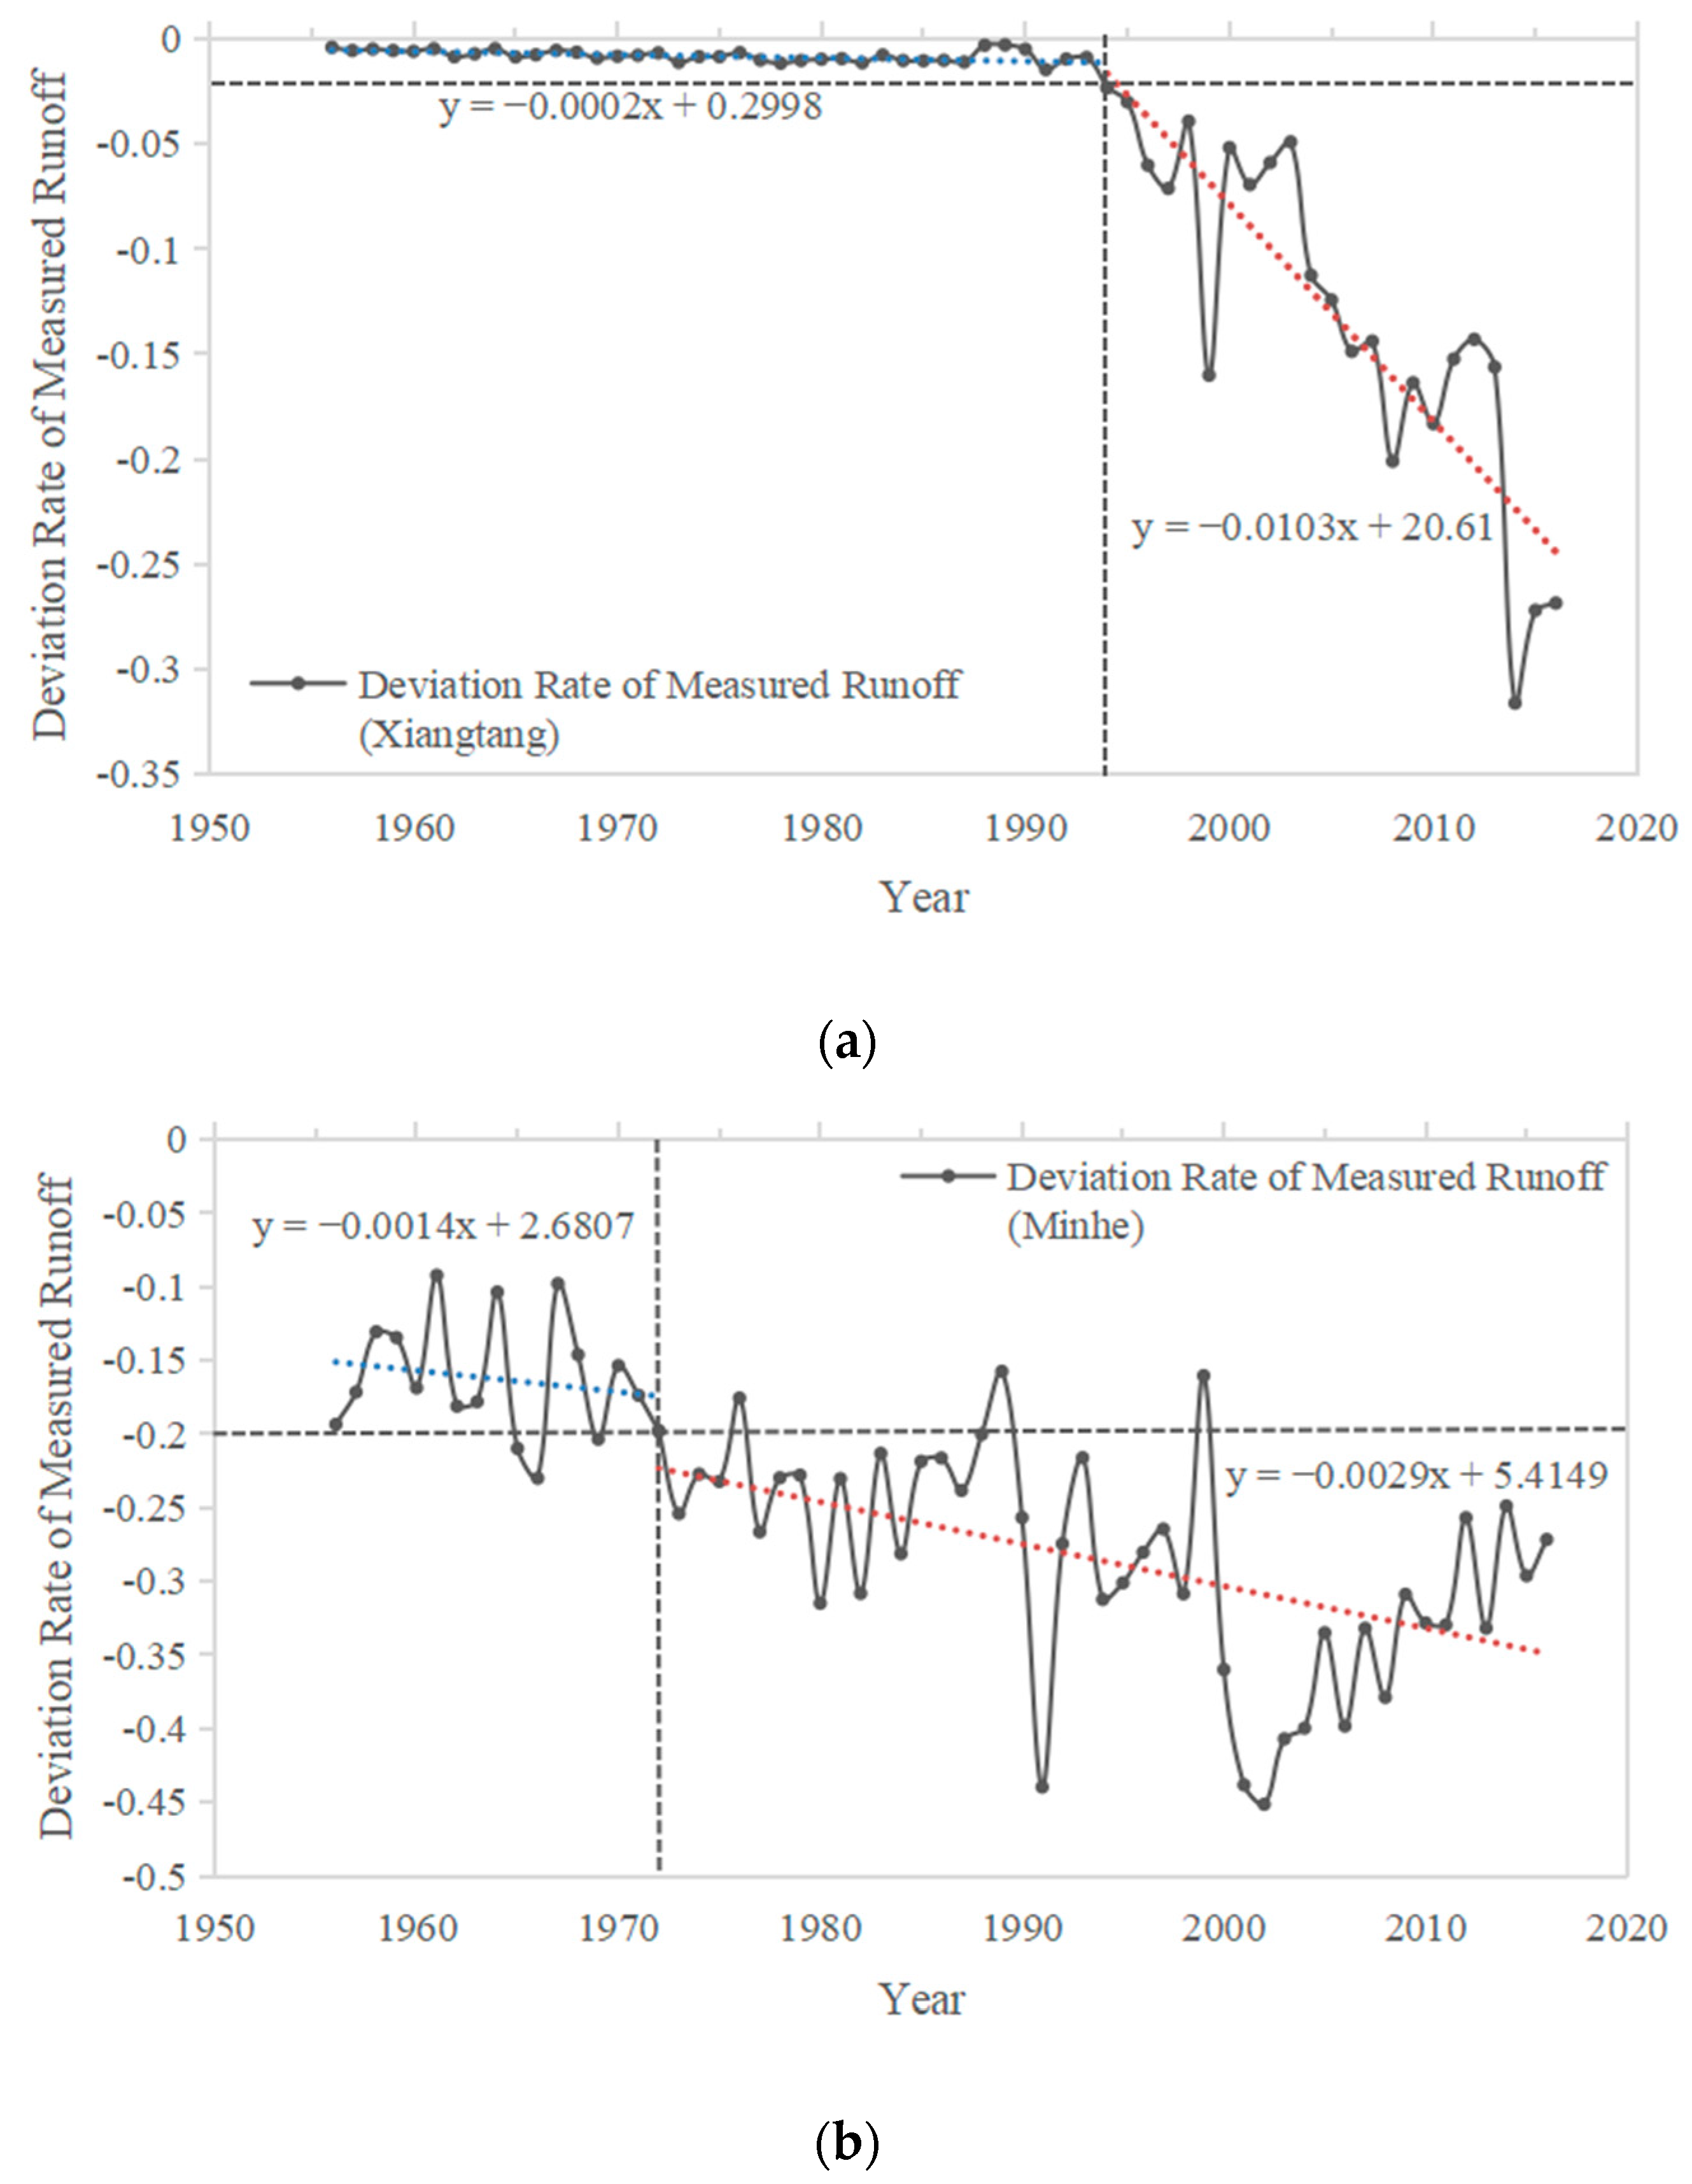
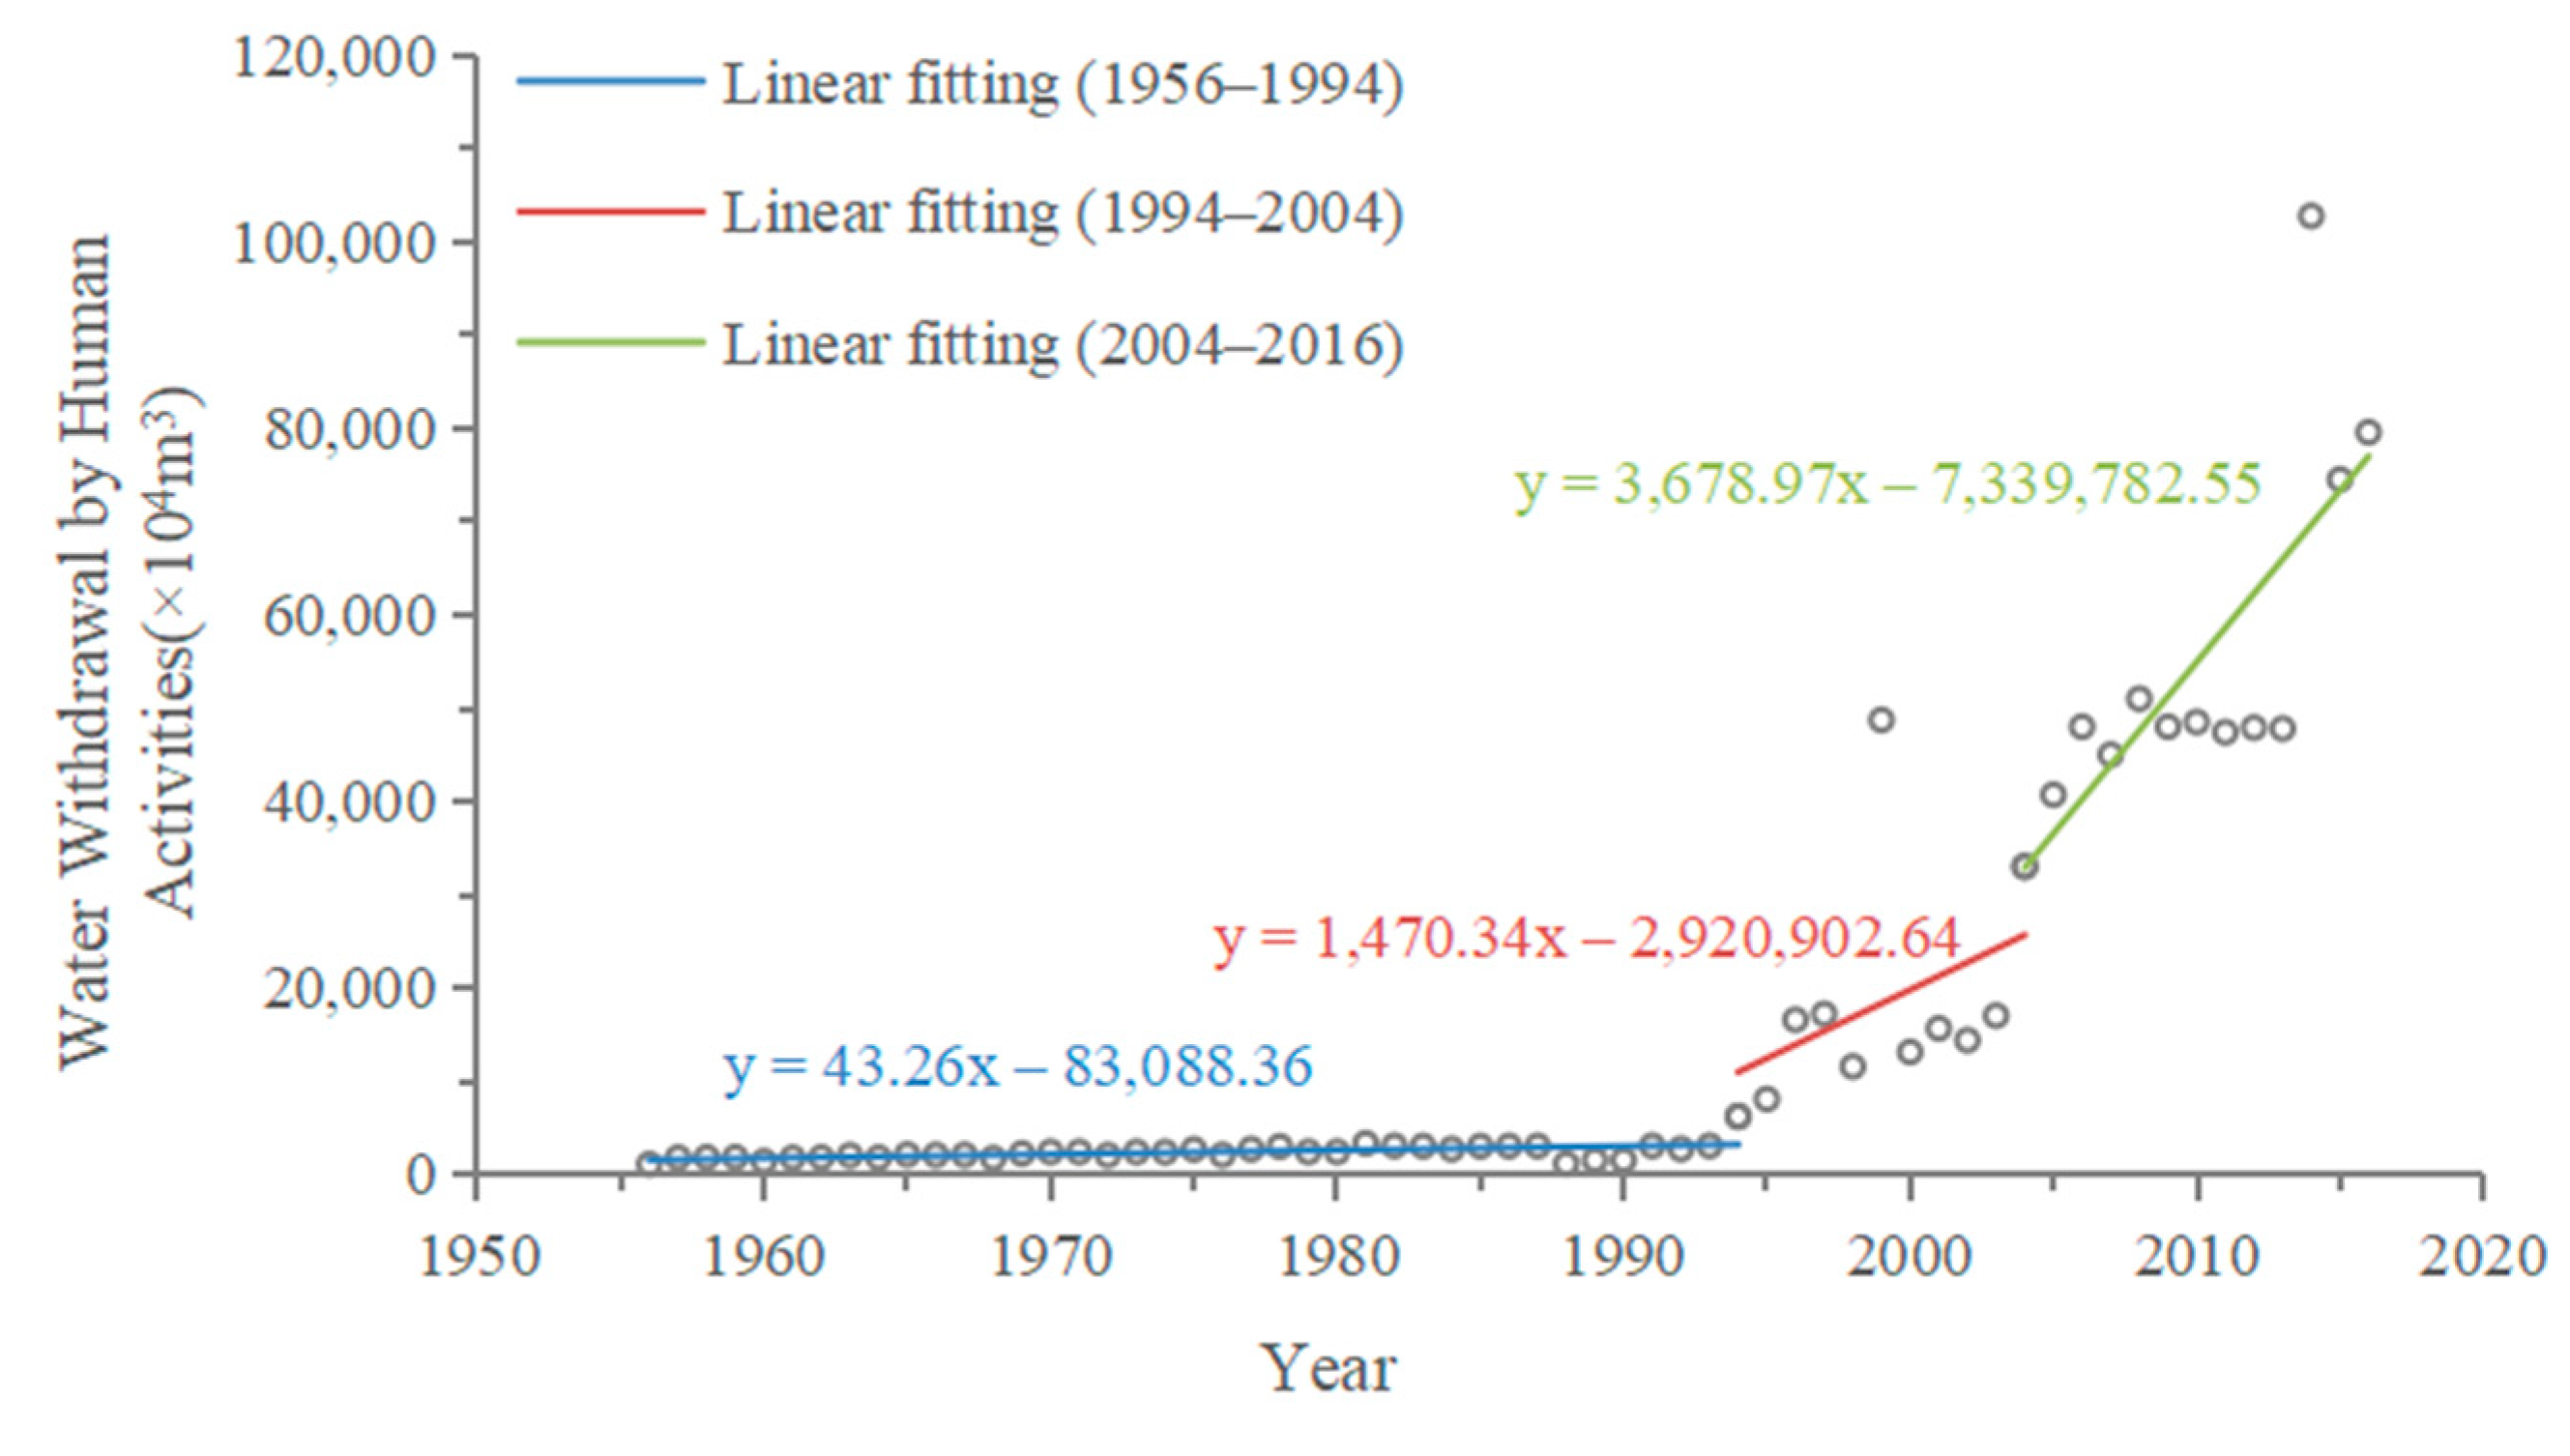
4.1. Hydrological Change Trends and Impact Analysis of Huangshui River and Datong River
4.2. Analysis of Ecological Flow Assurance Rate
5. Conclusions and Suggestions
Author Contributions
Funding
Data Availability Statement
Conflicts of Interest
References
- Kimmany, B.; Visessri, S.; Pech, P.; Ekkawatpanit, C. The Impact of Climate Change on Hydro-Meteorological Droughts in the Chao Phraya River Basin, Thailand. Water 2024, 16, 1023. [Google Scholar] [CrossRef]
- Sadio, C.A.A.S.; Faye, C.; Pande, C.B.; Tolche, A.D.; Ali, M.S.; Cabral-Pinto, M.M.S.; Elsahabi, M. Hydrological response of tropical rivers basins to climate change using the GR2M model: The case of the Casamance and Kayanga-Géva rivers basins. Environ. Sci. Eur. 2023, 35, 113. [Google Scholar] [CrossRef]
- Lv, X.; Liu, S.; Li, S.; Ni, Y.; Qin, T.; Zhang, Q. Quantitative Estimation on Contribution of Climate Changes and Watershed Characteristic Changes to Decreasing Streamflow in a Typical Basin of Yellow River. Front. Earth Sci. 2021, 9, 752425. [Google Scholar] [CrossRef]
- Wang, S.; Yan, M.; Yan, Y.; Shi, C.; He, L. Contributions of climate change and human activities to the changes in runoff increment in different sections of the Yellow River. Quat. Int. 2012, 282, 66–77. [Google Scholar] [CrossRef]
- Li, W.; Wang, W.; Wu, Y.; Quan, Q.; Zhao, S.; Zhang, W. Impact of Human Activities on Hydrological Drought Evolution in the Xilin River Basin. Atmosphere 2022, 13, 2079. [Google Scholar] [CrossRef]
- Tennant, D.L. Instream flow regimens for fish, wildlife, recreation and related environmental resources. Fisheries 1976, 1, 6–10. [Google Scholar] [CrossRef]
- Boner, M.C.; Furland, L.P. Seasonal treatment and variable effluent quality based on assimilative capacity. J. Water Pollut. Control Field 1982, 54, 1408–1416. [Google Scholar]
- Foufoula-Georgiou, E.; Kumar, P. Wavelets in Geophysics; Academic Press: Cambridge, MA, USA, 1994. [Google Scholar]
- Kumar, P.; Foufoula-Georgiou, E. Wavelet analysis for geophysical applications. Rev. Geophys. 1997, 35, 385–412. [Google Scholar] [CrossRef]
- Richter, B.; Baumgartner, J.; Powell, J.; Braunilz, D.P. A method for assessing hydrologic alteration within ecosystems. Conserv. Biol. 1996, 10, 1163–1174. [Google Scholar] [CrossRef]
- Richter, B.; Baumgartner, J.; Wigington, R.; Braun, D. How much water does a river need. Freshw. Biol. 1997, 37, 231–249. [Google Scholar] [CrossRef]
- Beven, K.J. Distributed Hydrological Modelling: Applications of the TOPMODEL Concept; John Wiley and Sons Ltd.: Hoboken, NJ, USA, 1997. [Google Scholar]
- Martz, L.W.; Garbrecht, J. Numerical definition of drainage network and subcatchment areas from Digital Elevation Models. Comput. Geosci. 1992, 18, 747–761. [Google Scholar] [CrossRef]
- Fodini, E. The ARNO rainfall-runoff model. J. Hydrol. 1996, 175, 339–382. [Google Scholar]
- Beven, K.J.; Calver, A.; Morris, E.M. The Institute of Hydrology Distributed Model; Water Resources Publications: Littleton, CO, USA, 1995. [Google Scholar]
- Mohammed, H.; Hansen, T.A. Spatial heterogeneity of low flow hydrological alterations in response to climate and land use within the Upper Mississippi River basin. J. Hydrol. 2024, 632, 130872. [Google Scholar] [CrossRef]
- Wang, X.; Ma, W.; Lv, J.; Li, H.; Liu, H.; Mu, G.; Bian, D. Analysis of changes in the hydrological regime in Lalin River basin and its impact on the ecological environment. Front. Earth Sci. 2022, 10, 987296. [Google Scholar] [CrossRef]
- Gao, B.; Li, J.; Wang, X. Analyzing Changes in the Flow Regime of the Yangtze River Using the Eco-Flow Metrics and IHA Metrics. Water 2018, 10, 1552. [Google Scholar] [CrossRef]
- Yan, M.; Fang, G.H.; Dai, L.H.; Tan, Q.F.; Huang, X.F. Optimizing reservoir operation considering downstream ecological demands of water quantity and fluctuation based on IHA parameters. J. Hydrol. 2021, 600, 126647. [Google Scholar] [CrossRef]
- Kannan, N.; Anandhi, A.; Jeong, J. Estimation of Stream Health Using Flow-Based Indices. Hydrology 2018, 5, 20. [Google Scholar] [CrossRef]
- Weidong, W.; Zheng, Y.; Dou, C. Mann-Kendall Mutation Analysis of Temporal Variation of Apparent Stress in Qinba Mountains and Its Adjacent Areas. IOP Conf. Ser. Earth Environ. Sci. 2021, 660, 012112. [Google Scholar]


| IHA Parameter Groups | Characteristics | Indicators |
|---|---|---|
| Average monthly runoff | Runoff Time | Average monthly runoff value |
| Annual extreme runoff | Runoff Duration | Annual maximum and minimum average runoff (1, 3, 7, 30, 90 d) Period of river interruption Base flow coefficient |
| Extreme runoff occurrence time | Time | Annual maximum and minimum 1-day runoff occurrence time |
| Frequency and duration of high and low runoff | Runoff Frequency Duration | Number of occurrences of high and low runoff per year Average duration of high and low runoff per year |
| Rate and frequency of runoff changes | Rate of change Frequency | Average rate of runoff increase and decrease Number of runoff reversals |
| Qualitative Description of Habitats | Recommended Base Flow Standard (Percentage of Annual Average Flow) | |
|---|---|---|
| General Water Use Period (from October to March of the Following Year) | Fish Spawning and Juvenile Period (from April to September) | |
| Maximum | 200 | 200 |
| Optimum flow | 60~100 | 60~100 |
| Excellent | 40 | 60 |
| Very good | 30 | 50 |
| Good | 20 | 40 |
| Become vestigial | 10 | 30 |
| Poor or minimum | 10 | 10 |
| Extremely poor | <10 | <10 |
| Index | Evaluation Criteria (%) | ||||
|---|---|---|---|---|---|
| Excellent | Good | Medium | Poor | Inferior | |
| Ecological flow assurance rate | 100 | 95~100 | 90~95 | 80~90 | <80 |
| Indicator (Average Runoff) | 1956—1993 (Approximate Natural State) | 1994—2016 (Human Activities + Climate Change) | ||||
|---|---|---|---|---|---|---|
| Mean Value | RVA Target Value (m3/s) | Mean Value | Deviation Rate (%) | Di (%) | ||
| Lower Limit | Upper Limit | |||||
| January | 19.52 | 16.95 | 22.30 | 21.29 | 9.07 | −52.17 (M) |
| February | 19.26 | 17.15 | 22.55 | 21.14 | 9.75 | −30.43 (L) |
| March | 25.97 | 22.80 | 28.45 | 25.66 | −1.17 | −43.48 (M) |
| April | 54.00 | 45.85 | 61.90 | 46.50 | −13.89 | −65.22 (M) |
| May | 99.19 | 75.79 | 118.00 | 62.65 | −36.84 | −73.91 (H) |
| June | 131.19 | 90.91 | 168.00 | 91.16 | −30.52 | −52.17 (M) |
| July | 213.18 | 174.51 | 241.00 | 172.20 | −19.23 | −60.87 (M) |
| August | 200.42 | 152.50 | 258.49 | 182.89 | −8.75 | −34.78 (M) |
| September | 171.60 | 116.51 | 199.50 | 167.51 | −2.38 | −43.48 (M) |
| October | 92.98 | 71.85 | 107.00 | 80.83 | −13.07 | −43.48 (M) |
| November | 45.25 | 38.51 | 52.41 | 43.43 | −4.00 | −65.22 (M) |
| December | 26.98 | 23.15 | 29.90 | 30.82 | 14.23 | −69.57 (H) |
| Indicator (Average Runoff) | 1956—1972 (Approximate Natural State) | 1973—2016 (Human Activities + Climate Change) | ||||
|---|---|---|---|---|---|---|
| Mean Value | RVA Target Value (m3/s) | Mean Value | Deviation Rate (%) | Di (%) | ||
| Lower Limit | Upper Limit | |||||
| January | 24.02 | 19.00 | 28.80 | 26.47 | 10.19 | −43.18 (M) |
| February | 26.92 | 21.70 | 32.16 | 26.25 | −2.48 | −36.36 (M) |
| March | 28.16 | 22.95 | 32.85 | 20.65 | −26.66 | −65.90 (M) |
| April | 33.51 | 18.30 | 44.10 | 28.96 | −13.55 | −36.36 (M) |
| May | 49.62 | 22.80 | 57.55 | 28.53 | −42.51 | −43.18 (M) |
| June | 46.76 | 19.00 | 73.36 | 42.28 | −9.58 | −25.00 (L) |
| July | 85.97 | 54.51 | 116.51 | 71.52 | −16.80 | −36.36 (M) |
| August | 115.88 | 63.84 | 171.50 | 87.39 | −24.59 | −38.64 (M) |
| September | 110.31 | 63.25 | 171.49 | 94.74 | −14.11 | −15.91 (L) |
| October | 81.52 | 58.36 | 97.24 | 72.74 | −10.77 | −40.91 (M) |
| November | 44.36 | 33.20 | 49.34 | 37.47 | −15.53 | −52.27 (M) |
| December | 32.48 | 25.80 | 37.04 | 31.98 | −1.54 | −34.09 (M) |
| Month | Hydrology Stations | |
|---|---|---|
| Xiangtang | Minhe | |
| January | 10 | 8.32 |
| February | 10 | 8.65 |
| March | 10 | 10.13 |
| April | 17.8 | 22.16 |
| May | 28.87 | 18.57 |
| June | 37.80 | 20.72 |
| July | 60.87 | 28.43 |
| August | 58.54 | 31.28 |
| September | 52.19 | 31.14 |
| October | 29.95 | 31.13 |
| November | 15 | 18.43 |
| December | 10 | 10.21 |
| Month | Ecological Flow Assurance Rate (%) | Ecological Flow Satisfaction | ||
|---|---|---|---|---|
| Datong River | Huangshui River | Datong River | Huangshui River | |
| January | 98 | 100 | Good | Excellent |
| February | 100 | 100 | Excellent | Excellent |
| March | 100 | 98 | Excellent | Good |
| April | 100 | 100 | Excellent | Excellent |
| May | 100 | 100 | Excellent | Excellent |
| June | 100 | 100 | Excellent | Excellent |
| July | 100 | 100 | Excellent | Excellent |
| August | 100 | 98 | Excellent | Good |
| September | 100 | 98 | Excellent | Good |
| October | 100 | 100 | Excellent | Excellent |
| November | 100 | 100 | Excellent | Excellent |
| December | 100 | 100 | Excellent | Excellent |
Disclaimer/Publisher’s Note: The statements, opinions and data contained in all publications are solely those of the individual author(s) and contributor(s) and not of MDPI and/or the editor(s). MDPI and/or the editor(s) disclaim responsibility for any injury to people or property resulting from any ideas, methods, instructions or products referred to in the content. |
© 2024 by the authors. Licensee MDPI, Basel, Switzerland. This article is an open access article distributed under the terms and conditions of the Creative Commons Attribution (CC BY) license (https://creativecommons.org/licenses/by/4.0/).
Share and Cite
Liu, L.; Fan, L.; Hu, J.; Li, C. Human Activities Impacts on Runoff and Ecological Flow in the Huangshui River of the Yellow River Basin, China. Water 2024, 16, 2331. https://doi.org/10.3390/w16162331
Liu L, Fan L, Hu J, Li C. Human Activities Impacts on Runoff and Ecological Flow in the Huangshui River of the Yellow River Basin, China. Water. 2024; 16(16):2331. https://doi.org/10.3390/w16162331
Chicago/Turabian StyleLiu, Lanxin, Lijuan Fan, Jing Hu, and Chunhui Li. 2024. "Human Activities Impacts on Runoff and Ecological Flow in the Huangshui River of the Yellow River Basin, China" Water 16, no. 16: 2331. https://doi.org/10.3390/w16162331
APA StyleLiu, L., Fan, L., Hu, J., & Li, C. (2024). Human Activities Impacts on Runoff and Ecological Flow in the Huangshui River of the Yellow River Basin, China. Water, 16(16), 2331. https://doi.org/10.3390/w16162331