Article

Denitrification Performance and Microbiological Mechanisms Using Polyglycolic Acid as a Carbon Source

1
College of Environment and Energy Resources, Inner Mongolia University of Science and Technology, Baotou 014010, China
2
Cooperative Innovation Center of Ecological Protection and Comprehensive Utilization in Inner Mongolia Section of the Yellow River Basin, Baotou 014010, China
3
State Key Laboratory of Environmental Criteria and Risk Assessment, Chinese Research Academy of Environmental Sciences, Beijing 100012, China
4
Institute of Water Ecology and Environment, Chinese Research Academy of Environmental Sciences, Beijing 100012, China
*
Author to whom correspondence should be addressed.
Water 2024, 16(9), 1277; https://doi.org/10.3390/w16091277
Submission received: 27 March 2024 / Revised: 24 April 2024 / Accepted: 25 April 2024 / Published: 29 April 2024
(This article belongs to the Special Issue Biological Wastewater Treatment Process and Nutrient Recovery)

Abstract

:
When treating municipal wastewater, nitrogen removal is often limited due to low C/N, which needs to be compensated for by additional carbon source injections. This study investigated the feasibility of using industrial-waste polyglycolic acid (PGA) as a carbon source for denitrification in an SBR to obtain an economical carbon source. The results revealed that an optimal denitrification performance in a methanol-fed activated sludge system was achieved with a PGA dosage of 1.2 mL/L, a pH of 7–8, and a dissolved-oxygen (DO) concentration of 3 ± 0.5 mg/L. Under these conditions, all quality parameters for effluent water met the required criteria [COD < 50 mg/L; TN < 15 mg/L; NH4+-N < 5(8) mg/L]. PGA enhanced the variety and richness of microbial communities, thereby markedly increasing the relative abundance of major phyla such as Proteobacteria and Bacteroidota and major genera such as Paracoccus and Dechloromonas. Furthermore, PGA upregulated the expression of nitrogen-metabolism-related genera, including amo, hao, nar, and nor, which improved the denitrification performance of the system. This study provides a reference for applying PGA as a carbon source for low-C/N-wastewater treatment and solid-waste utilization.

1. Introduction

With an increasing population and rapid economic development, global water resources are facing major challenges. Thus, water-pollution prevention and ecological conservation have always been hot topics of concern [1]. Recently, the discharge standards for effluents from sewage-treatment plants have gradually improved. Furthermore, biological denitrification has been widely applied to denitrify wastewater in many municipal wastewater-treatment plants [2]. However, these plants usually face the problem of a low influent water C/N ratio (C/N < 5); consequently, achieving class-A effluent quality per the standard established by the Pollutant Discharge Standards for Urban Sewage Treatment Plants (GB 18918-2002) [3] is difficult. [COD < 50 mg/L; TN < 15 mg/L; NH4+-N < 5(8) mg/L]. Therefore, introducing an additional carbon source is a crucial means to improve nitrogen-removal efficiency.
Currently, methanol, sodium acetate, and glucose are the commonly used carbon sources in most sewage-treatment plants [4,5,6]; however, all of these carbon sources have some disadvantages. Methanol exhibits high toxicity, and microorganisms take more time to adapt to it. Sodium acetate results in abundant sludge production and is expensive. Glucose usage easily leads to sludge expansion and affects the CODCr of effluents [7]. The demand for external carbon sources has escalated in tandem with the improved emission standards of sewage plants. The relevant statistics showed that the economic investment of all sewage plants in the country in terms of the introduction of four traditional carbon sources (methanol, acetic acid, sodium acetate, and glucose) was approximately CNY 3.9 billion in 2020 [8]. Consider the daily treatment capacity of 50,000 tons of medium-sized sewage-treatment plants, for example, assuming the removal of 30 mg/L nitrate nitrogen, the total amount of carbon sources needed to be added every day being 6.3 tons [9], according to the current market price, methanol costing CNY 3000/ton, glucose costing CNY 2500/ton, and the daily cost of methanol and glucose being CNY 15,960 and CNY 7450, which further increases the wastewater-treatment cost; thus, seeking efficient, economical, and environmentally friendly externally added carbon sources is important. Recent research on novel carbon sources has garnered much attention and has advanced remarkably. Zhang, W et al. [10] used agricultural waste such as straw, wood chips, and corn cobs as solid carbon sources to improve nitrogen-removal performance and showed that the NO3-N removal rate of these materials reached more than 80% after only 56 days of system operation, indicating that difficulties in the stage of biofilm formation and microbial acclimatization times were long when these wastes were used. Additionally, these wastes easily cause secondary pollution. Fu et al. [11] concluded that certain high-concentration industrial wastewaters can be used as carbon sources owing to their advantages, such as high resource utilization and good biodegradability; however, disadvantages such as issues with dosage and pH control and toxic effects on tailwater discharge may occur. Xu, C L et al. [12] investigated the effect of improving nitrogen removal by using food-waste leachates as an additional carbon source for urban wastewater plants and demonstrated that the TN-removal rate increased by approximately 10% after adding the waste leachates; however, the high water and oil contents of the food waste affected anaerobic fermentation. Additionally, activated sludge-fermentation solutions [13], citric acid-production wastewater [14], cyanobacterial fermentation solutions [15], and other high-concentration organic wastewaters have been used as carbon sources, and all of them have enhanced the performance of denitrification systems to a certain extent; however, there are some limitations to their practical applications.
Polyglycolic acid (PGA), also known as polyethylene glycol ester or polyhydroxyacetic acid, is a fully biodegradable material that has been found to rapidly degrade in nature in the presence of water and microorganisms, ultimately producing water and carbon dioxide, which are harmless to humans and the environment [16]. PGA possesses diverse desirable qualities, including high organic contents, effective carbon release capability, cost-effectiveness, non-toxicity, and safety, which contribute to its potential for widespread application. However, its improper utilization renders it highly wasteful and detrimental to the sustainable development of the urban economy and natural environment. PGA is widely used in various fields, including biomedical applications, food packaging, and agricultural production [17,18]; However, it has not been applied to sewage treatment.
In summary, to address the problem of insufficient carbon sources limiting biological denitrification in low-C/N domestic wastewater, this study used industrial-waste polyglycolic acid (PGA) as a carbon source for denitrification in an SBR. This turned waste into treasure and protected the environment while reducing the cost of additional carbon sources in the wastewater plant. Herein, we used artificially simulated domestic wastewater with a low C/N ratio (3–5) as an experimental influent and a sequencing-batch-activated sludge reactor. The feasibility of using PGA as an external carbon source for wastewater treatment was investigated using PGA as the only carbon source. The effects of PGA on the denitrification performance of an activated sludge system were analyzed to clarify the optimal dosage, optimal pH, and optimal DO of PGA. Furthermore, we investigated changes in the microbial community structure and diversity of the activated sludge system using high-throughput sequencing technology, and combined with PICRUSt2 function prediction, we analyzed differences in the relative abundance of microbial functional pathways and nitrogen-metabolism functional genes to reveal the mechanism underlying the enhanced denitrification performance of PGA. This study provides a new option for biological nitrogen removal plus carbon sources in wastewater-treatment plants, which can be used to treat waste effectively, and provides a reference for achieving the carbon-neutrality goal of wastewater-treatment plants.

2. Materials and Methods

2.1. Experimental Setup

SBR, also known as the sequencing batch-activated sludge method, involves homogenization, primary sedimentation, biodegradation, secondary sedimentation, and other functions in a system [19]. This process involves no sludge-reflux system, stable operation, shock load resistance, and excellent nitrogen- and phosphorus-removal efficiency. Five groups of small SBR reactors were used in the present study, a diagram of the experimental set-up is shown in Figure S1 (please see Supplementary Materials). The primary body of the reactor was composed of organic glass, which was 10 cm in diameter and 30 cm in height, with an effective volume of 2 L. The process’s operation mode was as follows: 12 h for a cycle, the aeration and mixing in the reactor was controlled by a timer, the water inflow lasted 0.2 h, the anaerobic mixing lasted 5 h, the aerobic aeration lasted 6 h, the static precipitation lasted 0.6 h, and the drainage lasted 0.2 h. After the mud–water mixture in the reactor had completely settled, manual drainage was started, with a volume of drainage equal to half the reactor capacity and a regular manual mud draining of approximately 100 mL.

2.2. Experimental Water and Inoculated Sludge

Domestic wastewaters with CODCr concentrations less than 200 mg/L and CODCr/TN ratios less than 5 are often referred to as domestic wastewater, with a low C/N ratio [20]. [PGA is a polymer formed by the polycondensation reaction of ethanoic acid units). Both ethanoic acid and methanol are alcohol compounds, and since they both contain hydroxyl groups (-OH), they have some similarities in chemical structure and properties. Methanol and PGA are both liquids, so the control group was chosen to compare the effects of methanol and PGA, and to maintain uniformity, methanol was also used as the carbon source in the feed water so that interference from other factors could be excluded]. Here, the influent water was artificially modeled as low-C/N (3–5) domestic wastewater, with CODCr provided by methanol and nitrogen and phosphorus provided by NH₄Cl and KH₂PO₄ (CODCr, 150–200 mg/L; NH4+-N, 40–45 mg/L; and TP, 2–4 mg/L), and the following trace elements required by microorganisms were added: FeCl3·6H2O (240 mg/L), ZnSO4·7H2O (120 mg/L), MnCl2·7H2O (120 mg/L), CoCl2·6H2O (150 mg/L), H3BO4 (150 mg/L), KI (30 mg/L), and NiCl2 (50 mg/L) [21].
The activated sludge used was collected from the aerobic tank of a wastewater facility in Baotou city, which exhibited a consistent performance in denitrification and phosphorus-removal, and the mixed-liquor suspended solid (MLSS) content of the sludge was evaluated weekly to maintain it between 2000 and 4000 mg/L. Simulated residential wastewater with a C/N ratio of approximately 3 was used to culture the activated sludge, and PGA was added once the removal rates of the different water-quality indices in the system stabilized. The PGA utilized here was a liquid with a purity of approximately 75% (Shanghai Pujing Chemical Technology Co., Ltd). (Minhang District, Shanghai, China).

2.3. Single-Factor Experimental Design

Three batches of experiments were set up, with a one-month experimental period for each of the dosage and pH investigations and a three-month experimental period for the DO investigation. The CODCr, NH4+-N, TN, NO3-N, and NO2-N indicators of the influent and effluent water were regularly monitored to analyze the denitrification performance after the system was operating steadily. The specific experimental setup is presented in Table 1.
(1) Dosage investigation: Five groups of SBR reactors were set up. T1 was a blank control group without any carbon source. Methanol was added as a carbon source in T2. Different amounts of PGA (0.5 mL/L, 1.2 mL/L, and 1.9 mL/L) were added to T3, T4, and T5, respectively;
(2) pH investigation: Four groups of SBR reactors (P1–P4) were set up, and PGA was added at pH values of 5–6, 6–7, 7–8, and 8–9;
(3) DO investigation: Three groups of SBR reactors (D1–D3) were injected with PGA, and DO was set at 1 ± 0.5 mg/L, 3 ± 0.5 mg/L, and 5 ± 0.5 mg/L.

2.4. Analytical Items and Methods

2.4.1. Conventional Indicators

A UV spectrophotometer (DR6000, HACH, Loveland, CO, USA) was used for the determination of TN, NO3-N, NO2-N, and NH4+-N. A rapid meter (DR 1010, HACH, USA) was used for the determination of COD. pH and DO were determined using a portable water-quality analyzer (HQ30D, HACH, USA). MLSS and mixed-liquor volatile suspended solids were determined using the gravimetric method.

2.4.2. Three-Dimensional Fluorescence Spectroscopy

Three-dimensional fluorescence spectroscopy was performed using a fluorescence spectrometer (Hitachi F7100, Japan). The samples were pretreated by filtration using a 0.45 µm filter membrane before determining the dissolved organic matter (DOM) in water, and then the samples to be tested were placed in a glass cuvette polished on all four sides. The following parameters were used for scanning: Em, 250–550 nm; Ex, 200–400 nm; emission and excitation slit widths, 5 nm; scanning speed, 2400 nm/min; and voltage, 700 V. Three-dimensional fluorescence spectral contour maps were generated using Origin8.5 software on the basis of the scanned fluorescence spectral data.

2.4.3. DNA Extraction, Polymerase Chain Reaction (PCR) Amplification, and High-throughput Sequencing

The activated sludge from the five groups of reactors was sampled separately, and all samples were sent to Shanghai Majorbio Bio-Pham Technology Co., Ltd. (Majorbio, Shanghai, China). for DNA extraction, PCR amplification, and 16S rRNA gene sequencing. The sequencing included DNA extraction, primer junction design and synthesis, PCR amplification, MiSeq library construction, and sequencing. The specific operation procedure was as follows: DNA extraction was completed using the E.Z.N.A.® soil kit [22], and 338F (5′-ACTCCTACGGGGAGGCAGCAG-3′) and 806R (5′GGAC-TACHVGGGGTWTCTAAT-3′) were selected as the primers. Then, 16S rRNA gene amplification was performed by targeting the V3-V4 variable region. Next, 5 min of predenaturation at 95 °C, 1 min of denaturation at 94 °C, 1 min and 30 s of annealing at 50 °C, and 1 min and 30 s of extension at 72 °C were performed for 27 cycles, with a final extension of 10 min at 72 °C [23]. The PCR products were mixed and detected by 2% agarose gel electrophoresis and then sequenced using the Illumina MiSeq PE300 platform. The raw data generated was then subjected to processing and analysis.

3. Results and Discussion

3.1. Investigation of the Optimum Dosage of PGA

3.1.1. Effect of PGA Dosage on Pollutant-Removal Effect

A PGA dose of 1.2 mL/L resulted in optimal rates of CODCr, NH4+-N, and TN removal (91.77 ± 0.68%, 98.24 ± 0.14%, and 84.65 ± 1.71%, respectively) when the system was stable. Moreover, the removal effect for each pollutant was low in the control group because of the lack of a carbon source. The CODCr of the influent water obtained from T1, T2, and T3 increased from approximately 179.52 ± 3.11 mg/L to approximately 319.67 ± 0.74 mg/L, 564.67 ± 1.58 mg/L, and 728.13 ± 2.73 mg/L, respectively, after the addition of different concentrations of PGA. In the beginning, the CODCr concentrations of the effluent water in the T3–T5 reactors were relatively high because the carbon source released more CODCr at the initial stage after it was added to the reactor, and the microorganisms did not yet fully utilize the products released from the carbon source. With increasing operation time, microorganisms gradually adapted to this carbon source after the end of the rapid-release period [24], and the CODCr decreased rapidly in the water samples after 6 days of the test (Figure 1a). During the stabilization phase, the CODCr removal from T1, T2, and T3 increased by 19.83%, 31.08%, and 27.41%, respectively, compared with that in T0. The effluent from T2 and T3 met the national level-A effluent standards.
No significant difference was observed in NH4+-N removal when using a PGA dose of 0.5 mL/L, 1.2 mL/L, or 1.9 mL/L, and the concentrations of NH4+-N in T1, T2, and T3 decreased from 45.36 ± 1.51 mg/L in the influent water to 3.23 ± 0.39 mg/L, 0.8 ± 0.06 mg/L, and 2.19 ± 0.29 mg/L, respectively (Figure 1b), which was similar to the treatment effect of using methanol as a carbon source. PGA addition exerted better effects on NH4+-N treatment, which was attributed to the presence of more nitrifying bacteria in the reactor, which was conducive to the conversion of NH4+-N into NO3-N in the influent [25]. Furthermore, the nitrification reaction was performed thoroughly so that a high NH4+-N-removal rate could be stably maintained. The TN-removal rate increased with increasing carbon-source dosage (Figure 1c), and the TN-removal rates increased by 24.12 ± 1.76%, 32.02 ± 1.94%, and 37.04 ± 1.11% in T1, T2, and T3, respectively, compared with those in the control group. Therefore, PGA addition can effectively alleviate a lack or insufficiency of carbon sources that a reactor often faces when treating wastewater with a low C/N ratio in the anoxic denitrification stage, thereby improving the TN-removal effect of the reactor.
The influent water did not contain NO3-N or NO2-N during the whole experimental cycle; however, the NO3-N concentration in the effluent water was high in the pre-experimental period because the bacteria were in the growth and reproduction stage, and they underwent a denitrification reaction with colony stabilization which converted NO3-N into N2 and reduced the nitrogen concentration in the water [26]. The average NO3-N concentrations in the effluent during stabilization in T1, T2, and T3 were 8.16 ± 0.44 mg/L, 3.46 ± 0.37 mg/L, and 1.76 ± 0.15 mg/L, respectively, and NO3-N accumulation occurred in T1 because of the lack of a carbon source to fulfill the energy demand of microorganisms for denitrification (Figure 1d). The NO3-N concentration in the effluent was maintained at a low level, and no NO2-N accumulation was observed on the 30th day in T2 and T3, which indicated that PGA exhibited a long-lasting denitrification performance, and the effluent indicators of various pollutants could reach the class-A discharge standard as per the Standard for Pollutant Discharge from Urban Wastewater-Treatment Plants (GB 18918-2002). As the treatment cost should be considered when adding a carbon source, the optimum PGA dosage for reactor operation was 1.2 mL/L.

3.1.2. DOM Analysis of Influent and Effluent Water

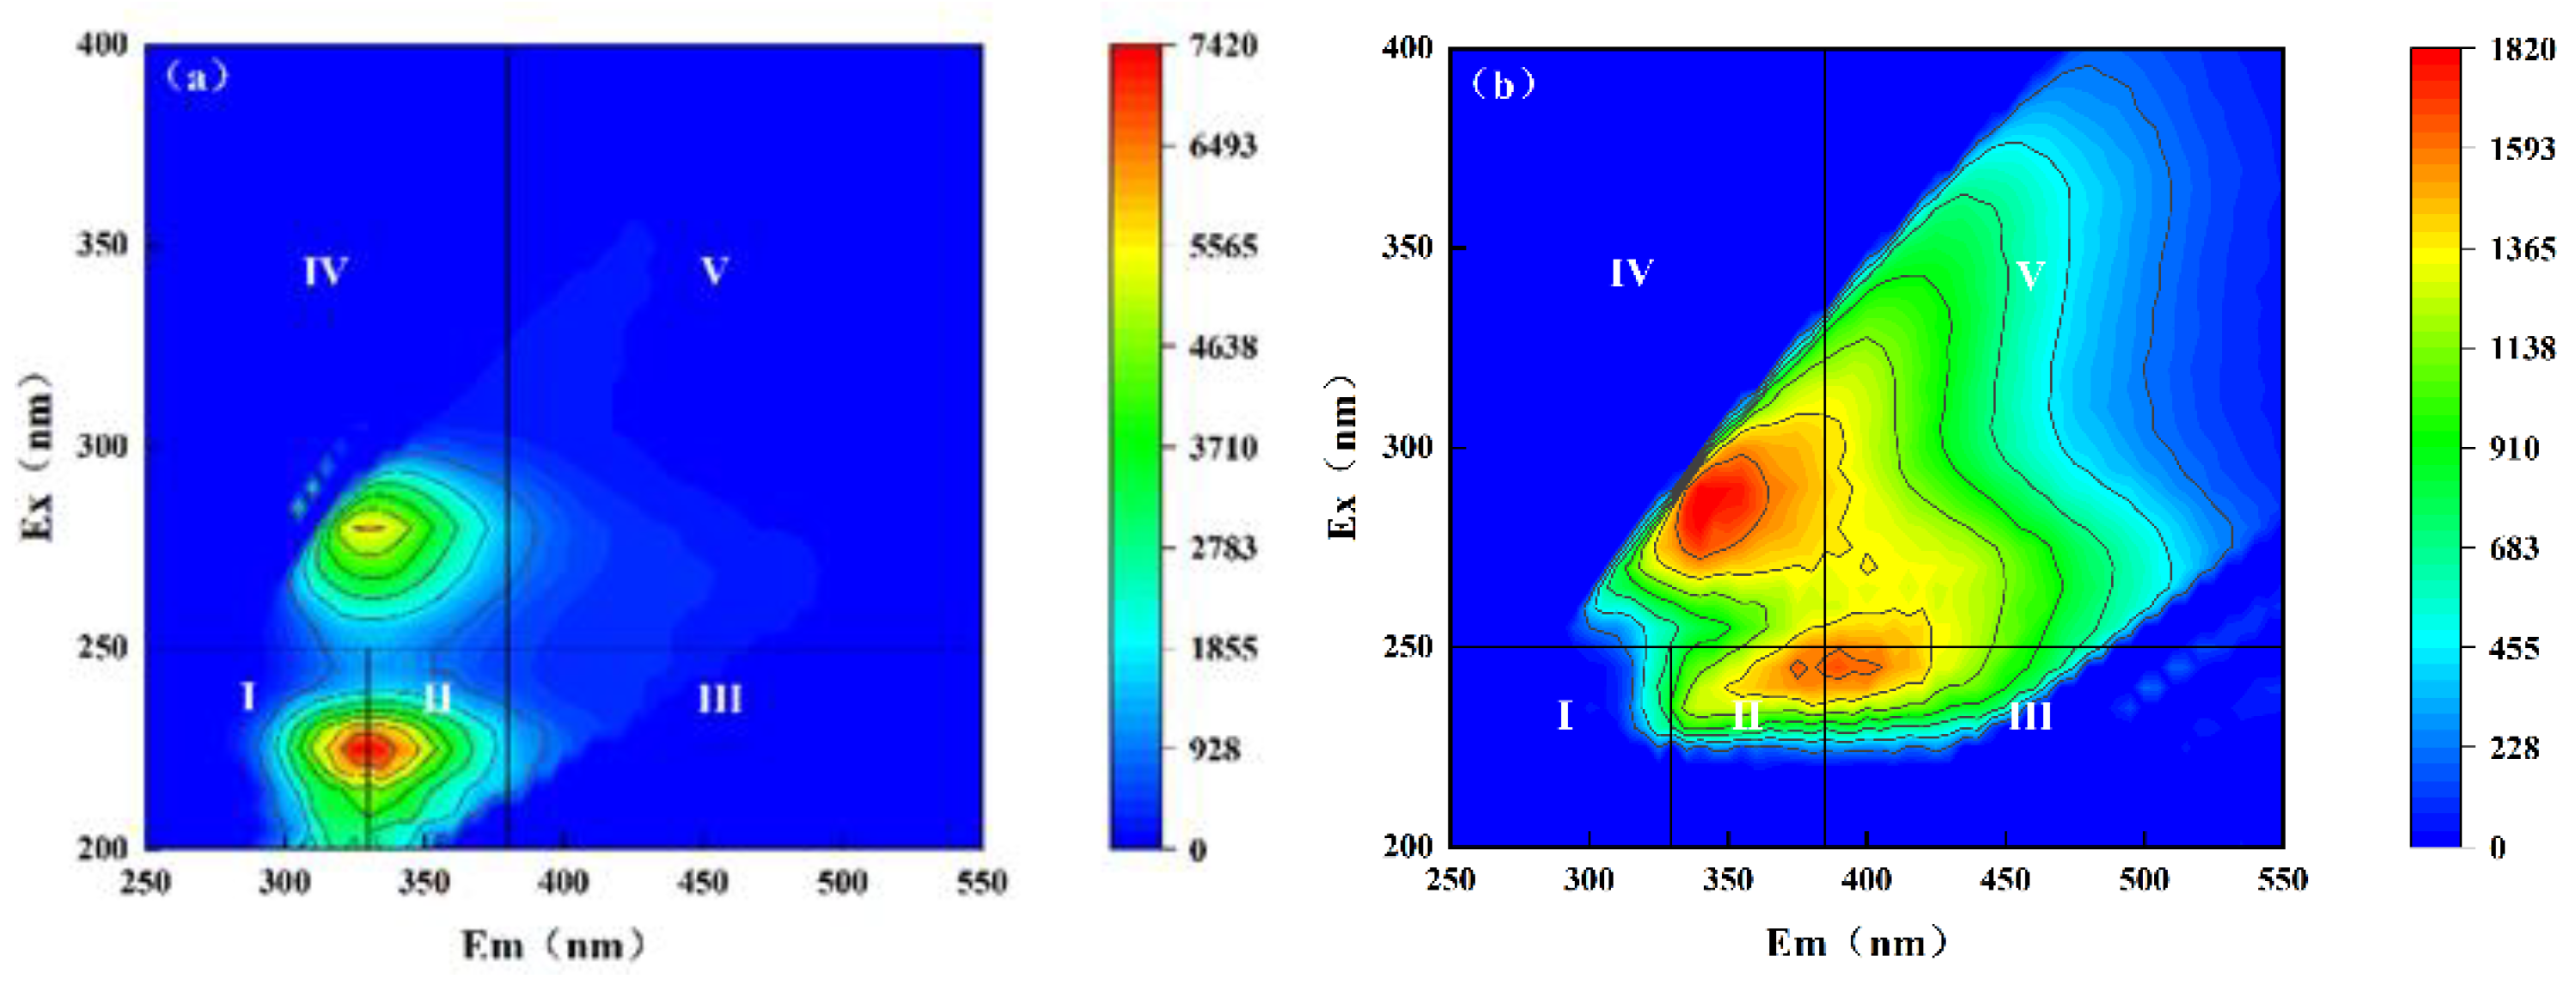
The organic components of the influent and stabilized effluent water samples in T1–Twere qualitatively and quantitatively analyzed by the three-dimensional fluorescence region-integration method, and the three-dimensional fluorescence spectra are shown in Figure 2 after removing Rayleigh and Raman scattering. Five regions are shown in the figure as follows: region I is mainly tyrosine-like proteins (Ex/Em = 220–250 nm/280–330 nm), region II is tryptophan-like proteins (Ex/Em = 220–250 nm/280–330 nm), region III is fulvic acid-like organic matter (Ex/Em = 250–400 nm/280–380 nm), region IV is dissolved microbial metabolites (Ex/Em = 250–400 nm/250–380 nm), and region V is humic-like organic matter (Ex/Em = 250–400 nm/380–550 nm), which is mainly abundant in humic-like acids [27].
Figure 2a shows the three-dimensional fluorescence spectra of the influent water after diluting it five times, which shows that these samples are mainly proteinaceous organic matter abundant in tryptophan, tyrosine, and microbial metabolites, thereby indicating a high content of proteins and organic pollutants in the influent water. The three-dimensional fluorescence spectra of the control group and the effluent water during stable operation in T1–T3 were analyzed, and a comparison with those of the influent water showed that tryptophan-rich proteins and microbial metabolites were present in the blank group, as well as an increase in the peak value of the fulvic acid-like organic matter (Figure 2b). The main components in the effluent water with PGA as a carbon source were microbial metabolites and humus organic matter, and the fluorescence peaks of tyrosine and tryptophan organic matter were significantly weakened (Figure 2c–e), indicating that the PGA addition strengthened the denitrification performance of the sewage and further degraded organic pollutants in the sewage. The PGA in the effluent of T1 was better utilized by the microorganisms in the sewage, and the organic matter was degraded. Consequently, the effluent mainly contained microbial metabolites. The humic acid contents of T2 and T3 increased significantly in the effluent for the following reasons. First, PGA is a low-molecular-weight organic acid; thus, the microorganisms did not utilize it completely. Second, the metabolites of the organic pollutants after PGA degradation were humic acid (the effluent humic acid was within the normal range and did not affect the water quality).

3.2. Exploration of the Optimum External Conditions for the Use of PGA as a Carbon Source

3.2.1. The Optimum pH of PGA as a Carbon Source

Figure 3 shows the changes in the inlet and outlet water concentrations of each pollutant under various pH conditions, and the results indicated that the efficiency of CODCr, NH4+-N, and TN removal was greatest when PGA was added at pH 7–8. The rates of CODCr removal under P1–P4 conditions were 55.79 ± 0.56%, 71.63 ± 0.43%, 92.48 ± 0.11%, and 84.12 ± 0.29%, respectively (Figure 3a). The rate of NH4+-N removal increased with increasing pH, and the maximum removal was achieved at pH 8–9. The effluent concentration was only 1.37 ± 0.2 mg/L (Figure 3b). The efficiency of removing nitrogen species was low under a slightly acidic environment (pH approximately 5), and when the pH increased from 5 to 6 to 7 to 8, the efficiency of TN removal gradually increased, reaching 86.62% ± 0.65% (Figure 3c). NO3-N and NO2-N accumulation was the lowest under these conditions, and the effluent concentration was less than 1 mg/L (Figure 3d,e). NO2-N accumulation occurred at 6 > pH > 8, and the effluent concentrations were 2.48 ± 0.08 mg/L and 5.55 ± 0.43 mg/L, respectively. NO2-N accumulation was greater under acidic conditions than under an alkaline conditions, whereas NO3-N accumulation occurred at pH < 7; the lower the pH was, the greater the accumulation was. Moreover, the activity of the sludge decreased significantly at pH values lower than 6. This was attributed to the highly acidic nature of PGA, because an acidic environment inhibits microorganisms such as heterotrophic bacteria [28], thereby reducing their ability to degrade pollutants in effluent.
A comparison of removal rates under the two conditions showed that the removal rate under alkaline conditions was greater than that under acidic conditions, which indicated that the alkaline environment was more beneficial for the growth of activated sludge microorganisms. Thus, considering nitrification and denitrification, the best nitrogen removal effect can be achieved at a pH of 7–8.

3.2.2. The Optimum DO of PGA

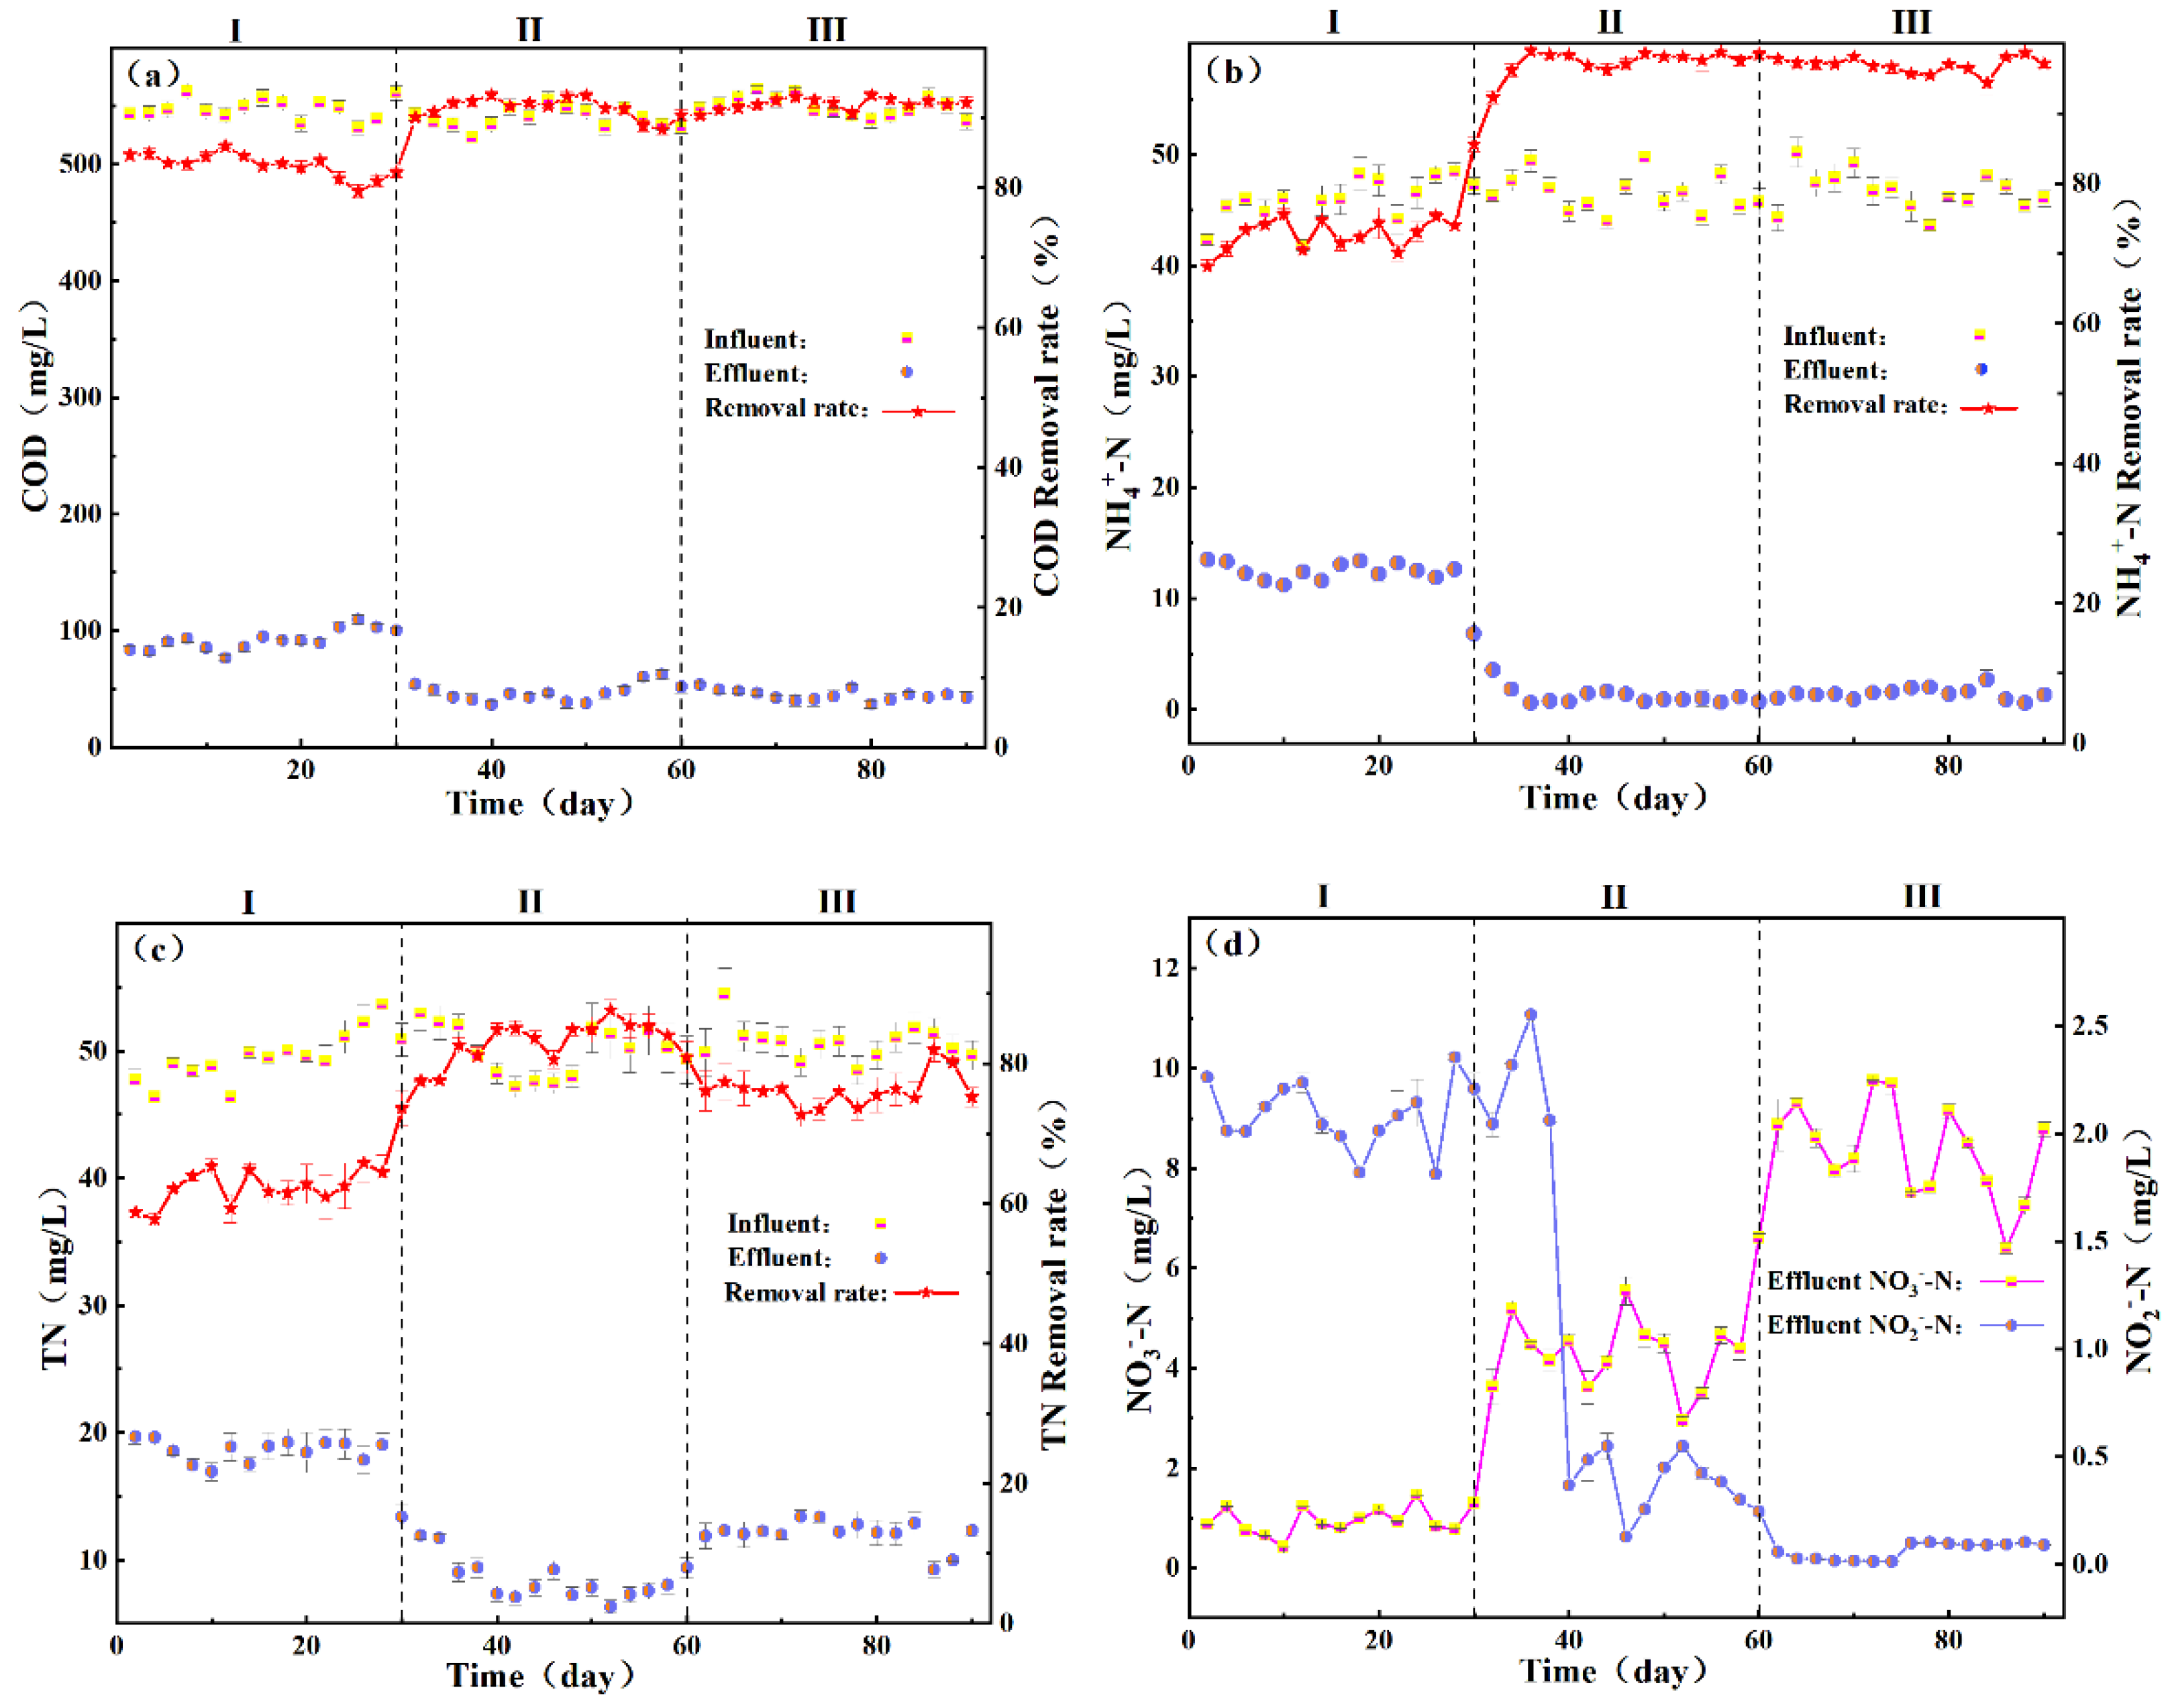
The rate of CODCr removal increased from 83.56 ± 0.84% to 92.67 ± 0.42% when the DO concentration increased from 1 mg/L to 5 mg/L (Figure 4a), which indicated that higher DO concentrations were more conducive to organic carbon degradation. The average concentration of NH4+-N in the influent in the three stages was 46.38 ± 0.91 mg/L (Figure 4b), and that in the effluent decreased with increasing DO. The rate of NH4+-N removal reached 97.13% ± 0.52% when the DO concentration was approximately 5 mg/L, and the average concentration of NH4+-N in the effluent was only 1.33 ± 0.24 mg/L. The present results showed that most of the carbon source was oxidatively decomposed by microorganisms in the aerobic stage at higher DO concentrations [29], the carbon source was effectively utilized in the reactor, and nitrification was completed at a DO concentration of approximately 5 mg/L. The magnitude of the DO concentration markedly affected TN removal [30], and only the highest rate of TN removal was achieved at a DO concentration of 3 mg/L during the entire reaction cycle (83.08 ± 1.25%). The average concentration of the effluent was less than 10 mg/L (Figure 4c).
The NO2-N and NO3-N contents in the effluent water under different DO conditions were significantly different (Figure 4d). The influent water was almost free of NO3-N and the NO2-N, and NO2-N concentration in the effluent water decreased with increasing DO (minimum < 0.5 mg/L), indicating that the activity of denitrifying bacteria was not high under lower DO conditions and that nitrite reductase synthesis was inhibited, which led to the denitrification and nitrite accumulation during the process [31]. When the DO concentration increased from 1 mg/L to 5 mg/L, NO3-N significantly accumulated in the effluent, and the average effluent concentration increased from 0.95 ± 0.03 mg/L to 8.35 ± 0.16 mg/L. A higher DO concentration in the system probably inhibited the gene expression of the essential enzyme system involved in denitrification, which prevented nitrate reduction and resulted in nitrate accumulation in the effluent [32]. Comprehensive analysis revealed that a DO concentration of 3 mg/L was optimal for the application of PGA to the activated sludge system. This DO concentration maintained the anoxic microenvironment in the inner layer of the biofilm and ensured that nitrifying bacteria in the system received sufficient oxygen. Consequently, the nitrification and denitrification rates in the system reached equilibrium [33].

3.3. Analysis of Microbial-Community Structure and Diversity

3.3.1. Microbial Alpha Diversity

High-throughput sequencing was performed on the sludge samples from all the reactors and 889,825 optimized sequences were obtained, with a total sequence length of 370,243,359 bp and an average sequence length of 416 bp. The statistics of the species annotation results were as follows: kingdom: 1, phylum: 34, class: 107, order: 251, family: 402, genus: 709, and species: 1315, and the total number of OTUs was 3694.
The alpha diversity of the microorganisms was analyzed because the alpha diversity index reflects the richness and diversity of microbial communities. The microbial-diversity-index statistics of the five groups of samples are presented in Table 2. The coverage index was used to determine the sequencing coverage of the species, and Table 2 shows that the coverage of sample libraries sequenced for each group of the samples was greater than 0.99, indicating that all the genetic information of the samples was obtained by sequencing and that the results were reliable and could be used as a basis for analysis [34]. The Shannon and Simpson indices reflect the diversity of a bacterial community; the greater the Shannon index and Simpson index are, the greater the diversity of the community. The Chao1 and Ace indices reflect the abundance of the microbial flora; the higher the value is, the greater the abundance of the flora [35]. The number of OTUs and the Shannon and Chao1 indices in the reactor with PGA as a carbon source were greater than those in the blank group without a carbon source. The indices mentioned above increased as the quantity of the carbon source added increased. The Simpson indices of the reactor groups were lower than those of the blank group, which indicated that the PGA dose improved the diversity and abundance of the microbial communities in the reactor.

3.3.2. Microbial-Community Structure

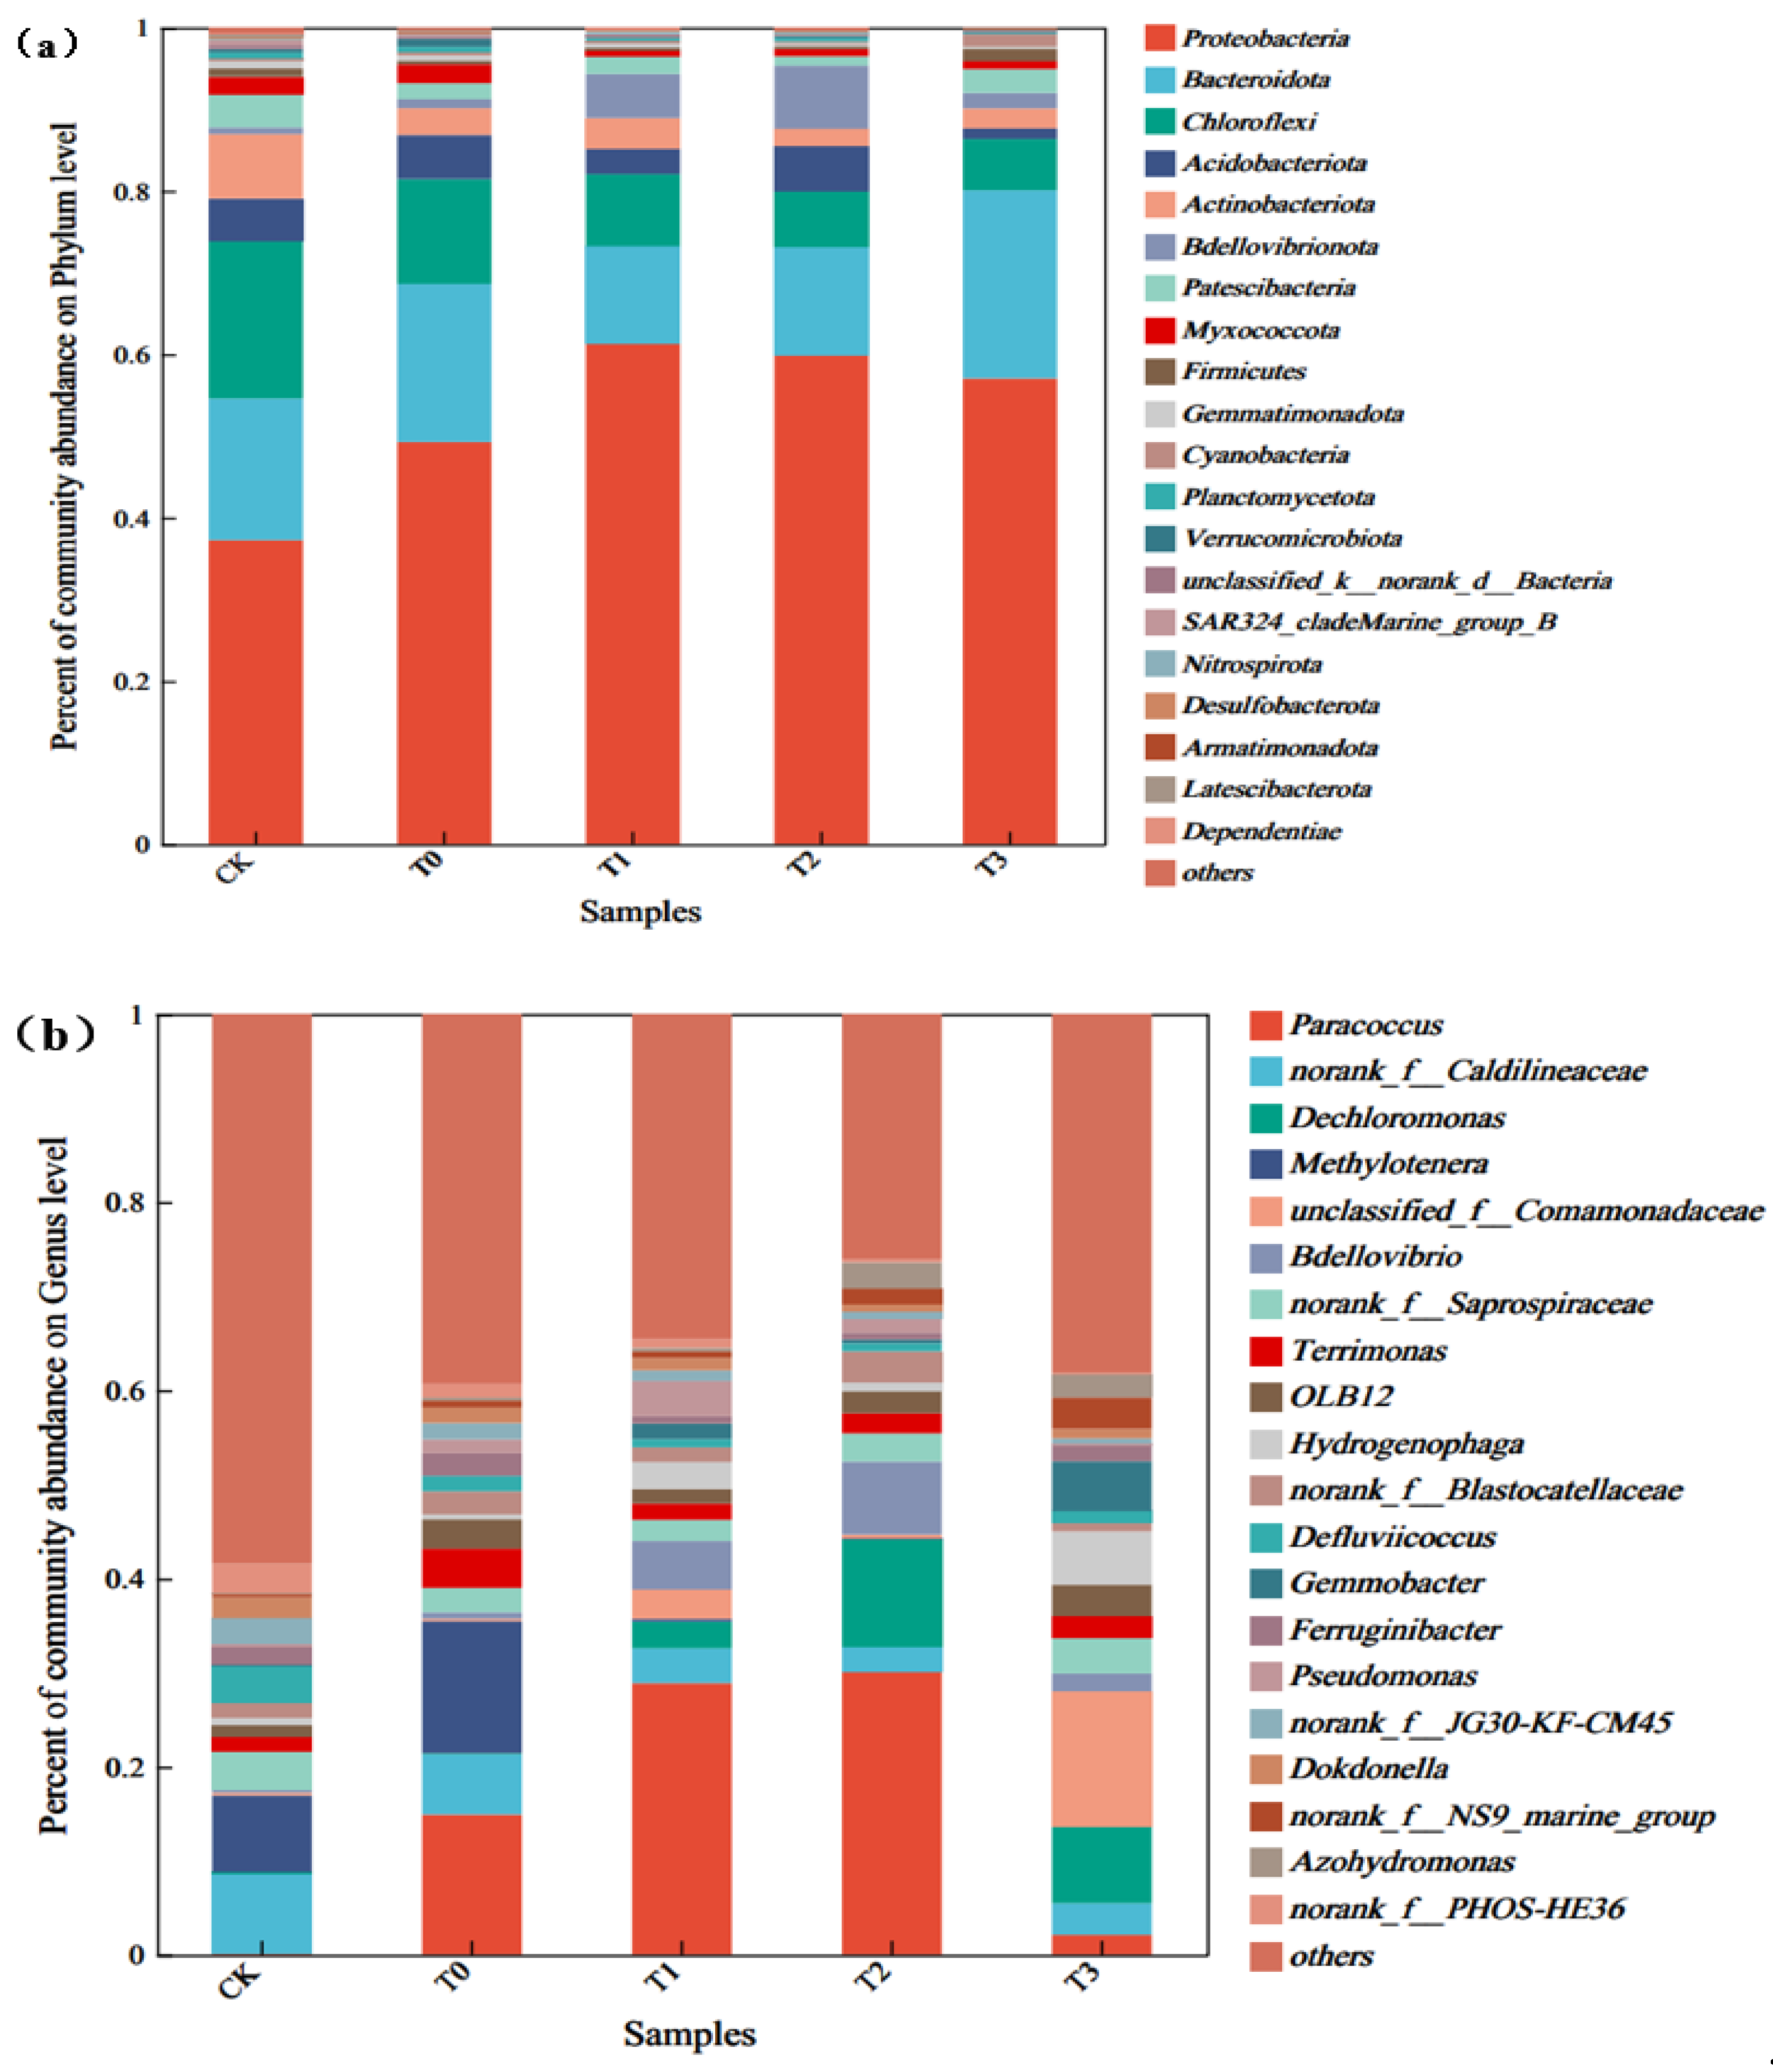
The microbial-community structure at the phylum level was analyzed for the five groups of samples (Figure 5a), and 33 phyla were identified in these groups. The microbial population structures of CK, T0, T1–T3 were similar. Proteobacteria, Bacteroidota, and Chloroflexi were the dominant phyla, with Proteobacteria being the most dominant phylum. Proteobacteria are the most common denitrifying bacteria in biological wastewater-treatment systems, and most of them are parthenogenetic or specialized anaerobes, which play a key role in organic-matter removal and denitrification [36]. PGA addition increased the abundance of Proteobacteria in T1–T3 by 23.8%, 22.35%, and 19.36%, respectively, compared with that in the control group, and an increase in the relative abundance of this phylum probably increased the denitrification capacity of PGA, which is in line with the results of the aforementioned studies on nitrogen-removal performance. The second most dominant phylum was Bacteroidota, which is involved mainly in the degradation of dissolved macromolecular organic carbon (polysaccharides and proteins) [37,38]. The abundance of Bacteroidota decreased in T1 and T2 (5.58% and 4.18%, respectively) compared with that in the control group; however, its relative abundance increased by 5.5% in T3. This indicated that different PGA dosages exerted different effects on Bacteroidota, and higher dosages promoted Bacteroidota production to decompose organic carbon [39]. Chloroflexi and Acidobacteriota were the phyla with the greatest percentages; however, their abundances decreased after the addition of the carbon source, indicating that PGA exerted certain inhibitory effects on these two microorganisms. Hence, PGA has different effects on different types of microorganisms.
The addition of the PGA carbon source influenced the composition of the microorganisms at the genus level, resulting in significant differences in the dominant genera and their relative abundances compared with those in the control group (Figure 5b). In the control group, the dominant genera were norank_f_Caldilineaceae (8.47%), Mehtylotenera (8.16%), and norank_f_Saprospiraceae (4.03%), whereas the three genera with the highest abundance in T2 were Paracoccus (30.09%), Dechloromonas (11.40%), and Bdellovibrio (7.74%). Paracoccus and Dechloromonas are crucial genera of functional bacteria in wastewater-treatment processes [40,41], with Paracoccus being one of the most dominant denitrifying microorganisms in wastewater [42]. The PGA carbon source promoted the growth and reproduction of Paracoccus, thereby enhancing the denitrification performance of the system. The unclassified_f_Comamonadaceae are denitrifying bacteria that use biopolymers as a carbon source. The content of unclassified_f_Comamonadaceae was significantly greater in T3 because the PGA carbon source is an alcoholic organic polymer; hence, the best denitrification was achieved in T3. The organic nitrogen in sewage releases ammonia nitrogen via the decomposition of nitrogenous organic matter by the ammonification of Bdellovibrio, a genus that efficiently recycles organic nitrogen [43]. The abundance of Dechloromonas in activated sludge directly indicates the utilization of carbon sources in the effluent, which can play a crucial role in denitrification and improve phosphorus removal by polyphosphorus bacteria [44]. The highest percentage of Dechloromonas was found in the T2 reactor, suggesting that the addition of the PGA carbon source promoted the enrichment of denitrifying bacteria and triggered the proliferation of more functional bacteria. An increase in the percentage of these functional bacteria improved the removal of pollutants, such as nitrogen, in the system. Therefore, we conclude that the use of a PGA carbon source can increase microbial diversity while improving the ability of microbes to degrade organic pollutants.

3.3.3. Microbial Species Diversity

As the carbon source is primarily involved in the denitrification phase of the nitrogen-removal process, the denitrifying bacteria were analyzed in the five groups of samples. As shown in Figure 6, the relative abundance of the same denitrifying bacteria differed significantly among the reactors, and most denitrifying bacteria accounted for a greater fraction of the relative abundance in T1–T3 than in the controls. The dominant genus in the blank group was norank_f_Caldilineaceae, and the abundances of Paracoccus in T1 and T2 were 28.61% and 30.09%, respectively, which were significantly greater than those in the control group (0.08%), as were the relative abundances of other genera with denitrifying ability, such as Dechloromonas and Bdellovibrio (Figure 6a,b). The dominant genus in T3 was unclassified_f_Comamonadaceae, and the other genera with greater relative abundances were Dechloromonas (8.11%), Hydrogenophaga (5.65%), Flavobacterium (5.10%), and Gemmobacter (5.25%), which were more abundant than in the control (0.26%, 0.90%, 0.28%, and 0.08%) (Figure 6c). Hydrogenophaga is a hydrogen autotrophic denitrifying bacteria that promotes nitrogen removal under anoxic conditions by denitrification with hydrogen as an electron source [45]. Flavobacterium and unclassified_f_Comamonadaceae are frequent filamentous bacteria in the activated sludge of sewage plants. Flavobacterium can induce denitrifying bacteria to perform anaerobic respiration to extract nitrate from sewage [46], and it also collaborates with unclassified_f_Comamonadaceae to break down complex organic molecules and hazardous compounds in sewage. Gemmobacter uses organic contaminants in wastewater as a carbon source for metabolic processes, thereby decomposing polluting organic materials in sewage. It can also use organic matter as a carbon source for photosynthetic metabolic reactions. Hence, the addition of a PGA carbon source cultivated a number of denitrifying bacteria, as the amount of added PGA carbon source promoted the growth of unclassified_f_Comamonadaceae, which inhibited the growth of Paracoccus and accelerated the denitrification reaction of the system.

3.4. Functional Genes for Nitrogen Metabolism

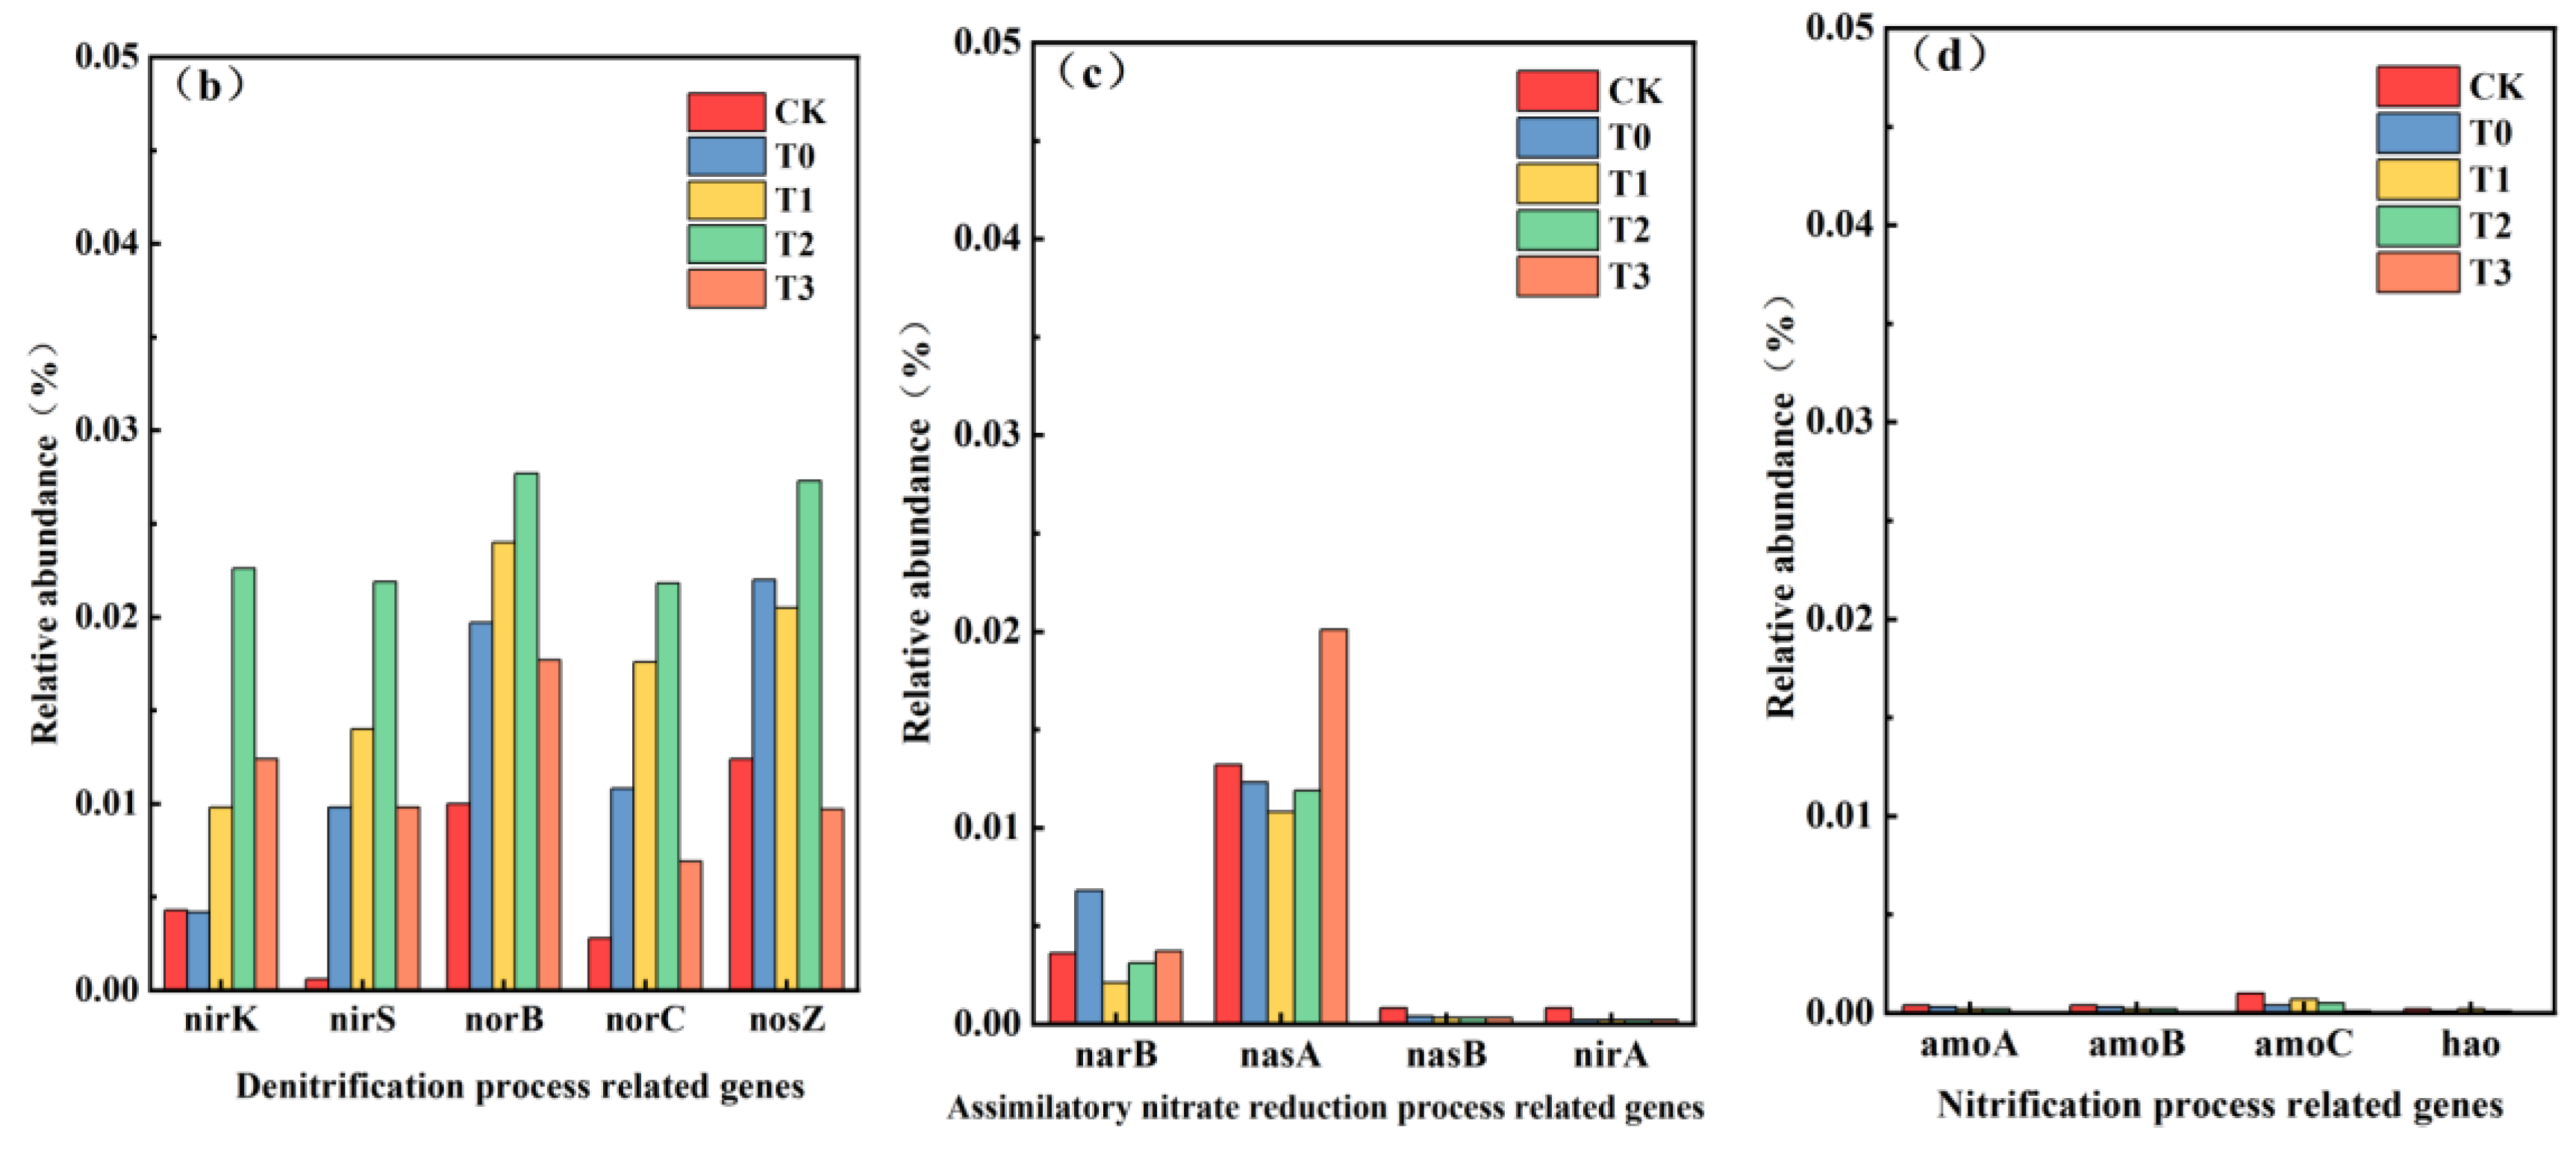
Nitrogen metabolism involves a series of reactions driven by enzymes encoded by functional genes. To further determine the effect of the PGA carbon source on the denitrification performance of the activated sludge system, we predicted the abundance of functional genes involved in the denitrification process using PICRUSt2 (Figure 7).
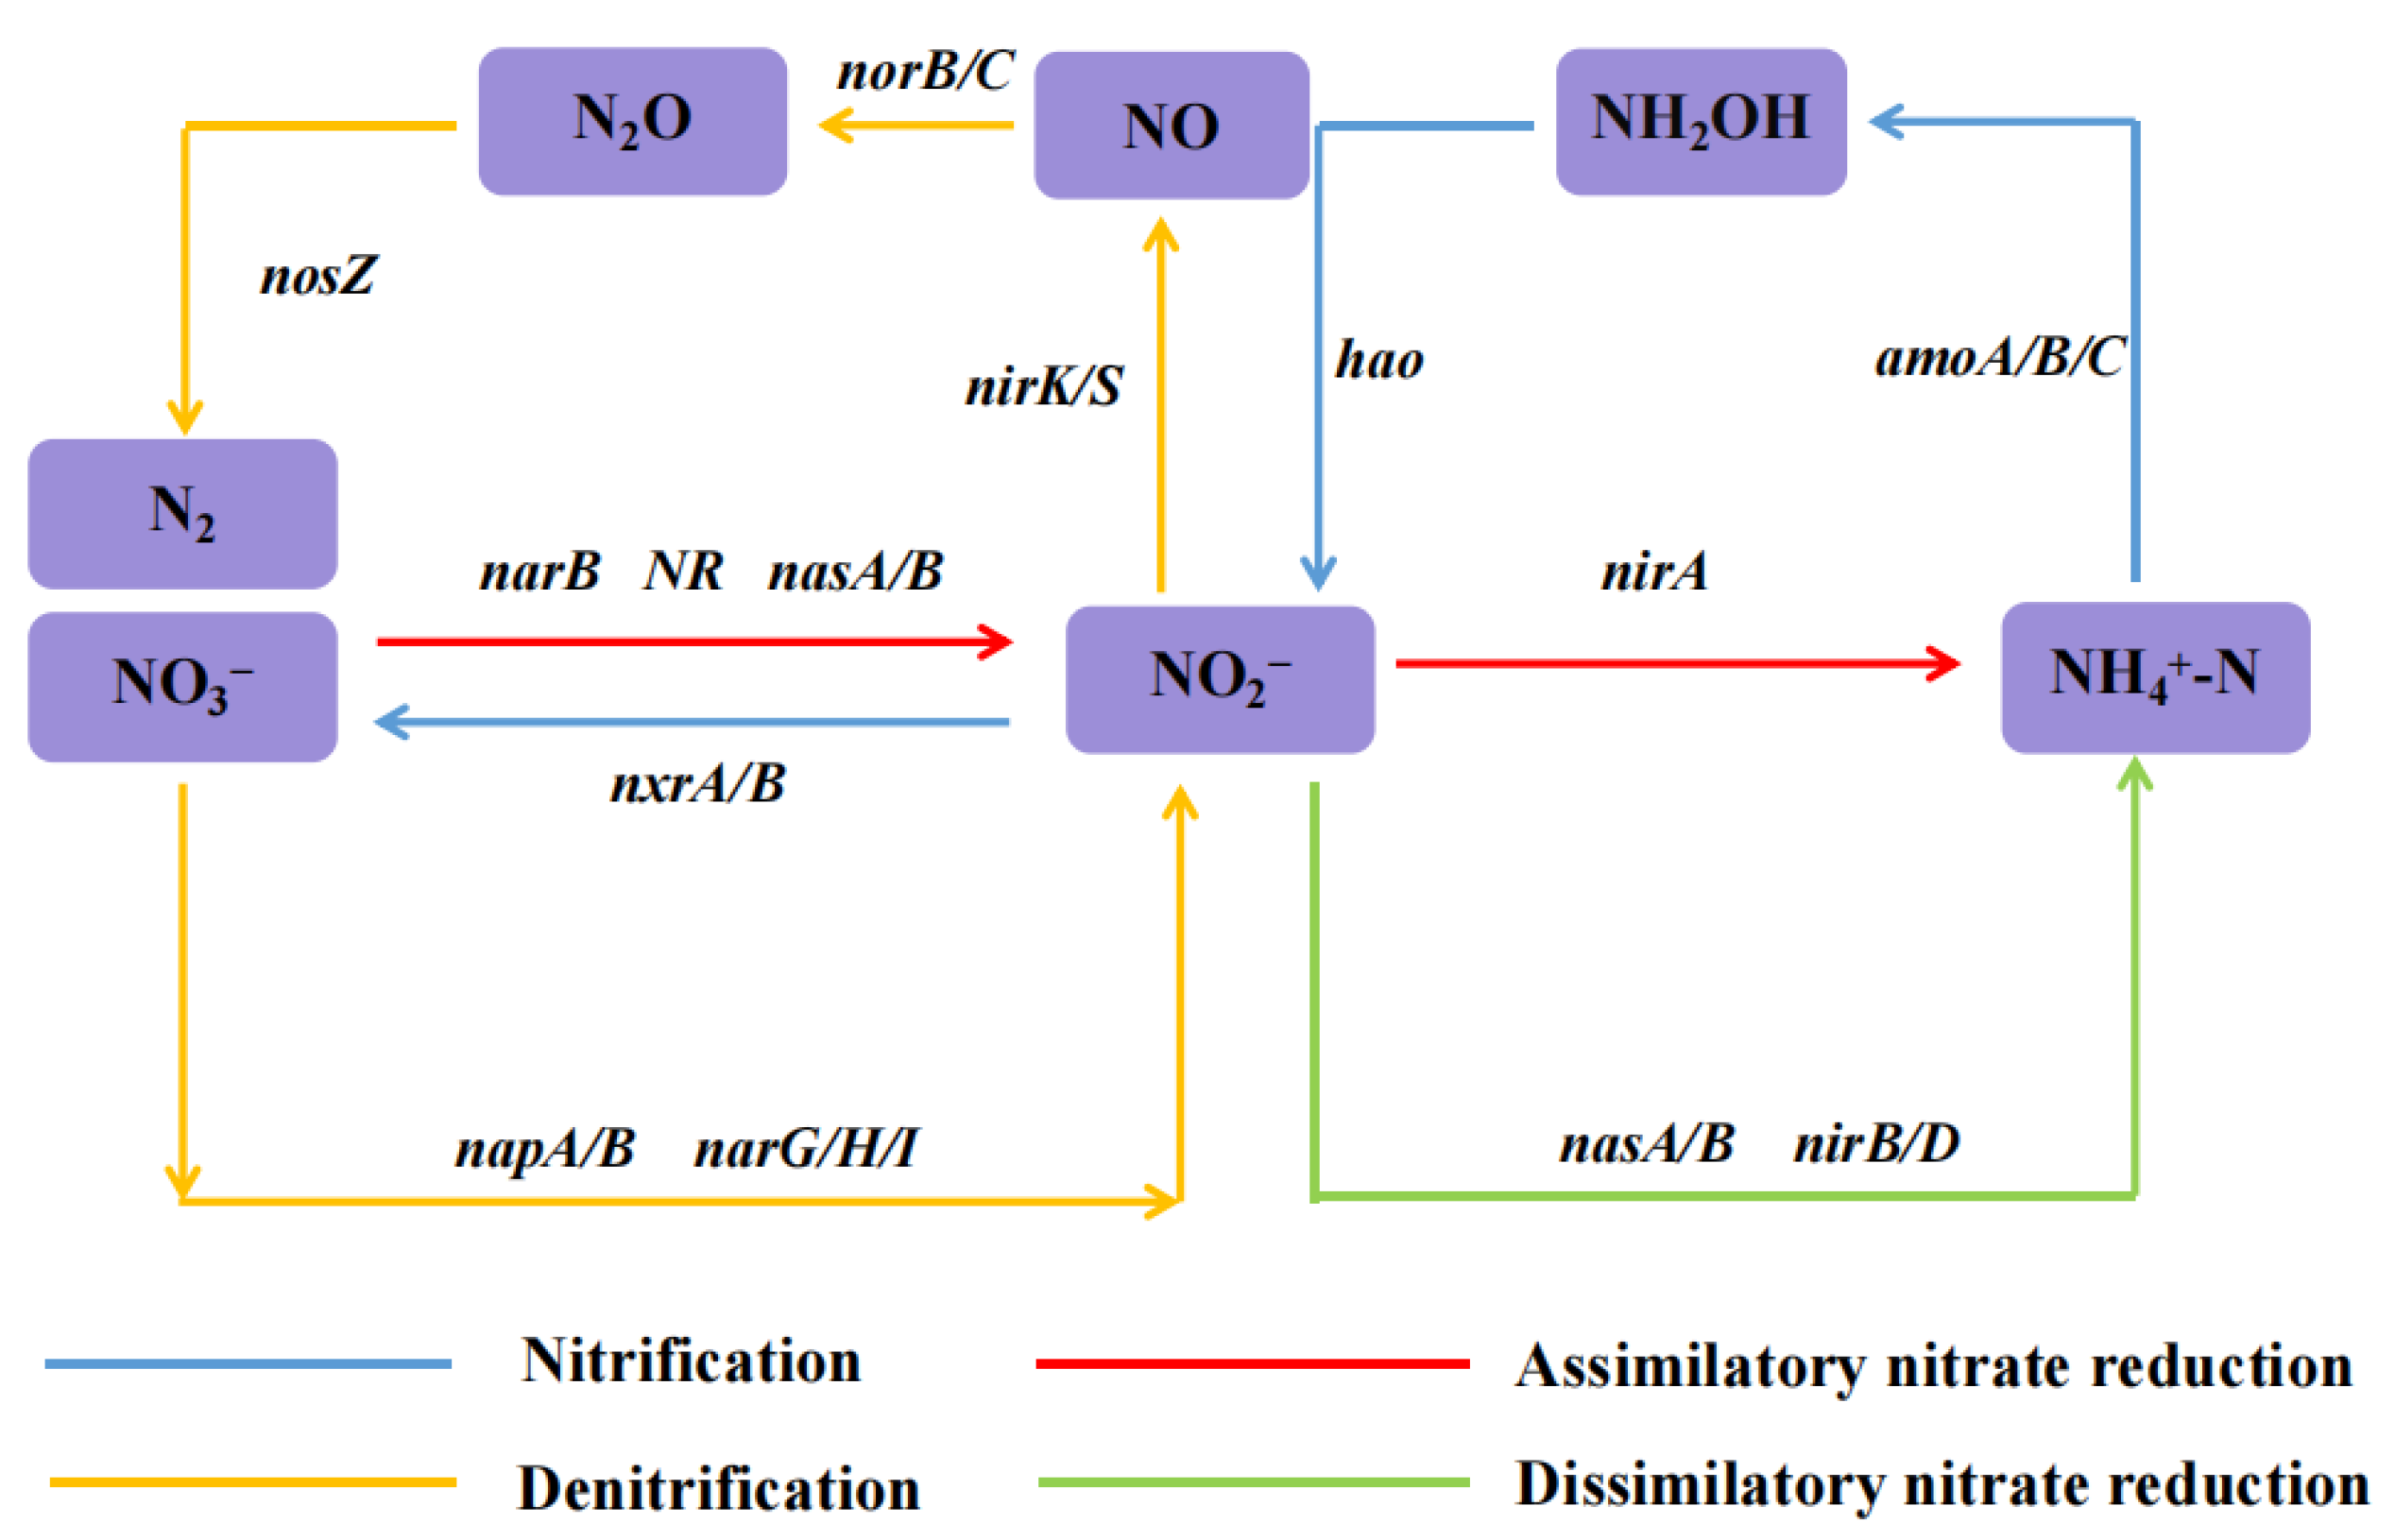
Important functional genes involved in the nitrification process include amoA/B/C, hao, and nxr (nxrA/B) (Figure 8). Amo encodes an ammonia monooxygenase (amo) that oxidizes NH4+-N to NH2OH, which is rapidly converted to NO2 catalyzed by the hydroxylamine oxidoreductase (hao) encoded by hao. The reaction involves these two enzymes and is the rate-limiting step of the nitrification process [47]. On the other hand, nxr encodes nitrite oxidoreductase, which further oxidizes NO2 to NO3, with increased amo abundance and promotes the rate of ammonia oxidation. The abundances of amo and hao increased significantly after the addition of the PGA carbon source (Figure 7d), indicating that the PGA carbon source can increase the ammonia-oxidation rate and promote the entire nitrification process. The genes involved in denitrification include nar (narG/H/I), nap (napA/B), nir (nirK/S), nor (norB/C), and nosZ [48]. nar and nap, which encode heterogeneous nitrate reductases, which are the two key genes involved in the initial denitrification step, were highly abundant in the T1 to T3 reactors (Figure 7a) [49] and could reduce NO3 to NO2. Therefore, we concluded that the use of a PGA carbon source favored the synthesis of nitrate reductase. The nitrite reductases encoded by nirK and nirS primarily control the conversion of nitrite to nitric oxide. They are major rate-limiting enzymes in the denitrification process [50]. nirS and NirK exhibited high abundances in T1–T3 (Figure 7b), corresponding to the absence of nitrite accumulation in the system. NorB/C and nosZ encode nitric oxide reductase (nor) and nitrous oxide reductase (nos), respectively, facilitating NO- and N2O-reduction processes and finalizing denitrification [51]. The abundance of norB exceeded that of norC in all reactors, and the abundance of nosZ was greater in T1–T3, indicating that the PGA carbon source promoted the process of NO2-N→NO→N2O→N2. This facilitated the denitrification process in the system [52]. The abundance of nosZ in T1–T3 was 2.18, 2.48, and 2.73 times greater than that in the control group. This corresponded to the removal rate of TN by different dosages of PGA in the system, and a higher abundance indicated a higher removal rate. PGA is as effective as methanol when used as an additional carbon source, both in improving the nitrogen-removal performance of the system and in controlling the emission of NO and N2O GHG gases. The high abundance of genes associated with the process of heterogeneous nitrate reduction (nirB/D) in T1–T3 indicates that the genes encoding nitrite reductase increased the process of the NO2 heterogeneous reduction of NH4+ after the addition of the PGA carbon source. This prevents the accumulation of harmful bacteria due to the accumulation of nitrite [53], which increases nitrogen metabolism of in microorganisms.

4. Domestic and International Research Status about Carbon Source

At present, there have been a lot of domestic and foreign research on the external carbon source of wastewater treatment, Table 3 lists some relevant research content and conclusions.

5. Conclusions

In this study, we confirmed the possibility of using PGA as an external carbon source for wastewater treatment by evaluating the reactor performance, the microbial community, and metabolic gene abundance through the activated sludge technique. The results showed that all effluent-water-quality indices fulfilled the standard [COD < 50 mg/L; TN < 15 mg/L; NH4+-N < 5(8) mg/L] when the dosage of the PGA carbon source was 1.2 mL/L, with external conditions set at pH 7–8 and a DO concentration of 3 mg/L. A PGA carbon source improved the richness and diversity of the microbial community, thereby providing a solid bacterial foundation for efficient nitrogen removal. Furthermore, the PGA carbon source significantly improved the functional metabolic pathways of most microorganisms in the activated sludge system. The PGA carbon source effectively improved most of the functional metabolic pathways of the microorganisms in the activated sludge system. It increased the abundance of key nitrogen metabolism genes, consequently improving nitrification and denitrification performance within the activated sludge system. To summarize, PGA is both economical and efficient as an externally added carbon source in wastewater treatment. This study provides novel insights for improving the denitrification performance of wastewater-treatment processes.

Supplementary Materials

The following supporting information can be downloaded at: https://www.mdpi.com/article/10.3390/w16091277/s1, Figure S1: Diagram of the experimental setup.

Author Contributions

Z.W.: Investigation, Methodology, Conceptualization, Supervision, Writing—review and editing. C.L.: Writing—original draft, material preparation, data collection, and analysis. W.Y.: Writing—review and editing. Y.W.: Review, Visualization. W.L.: Project administration and Funding updates. All authors have read and agreed to the published version of the manuscript.

Funding

This research was funded by the Science and Technology Plan Project of Inner Mongolia Autonomous Region, grant number (2023KJHZ0026; 2023YFHH0041) and the Basic Scientific Research Business Fee Project for Directly Affiliated Universities of Inner Mongolia Autonomous Region, grant number (2022038; 2023CXPT005).

Data Availability Statement

Some or all data, models, or codes that support the findings of this study are available from the corresponding author upon reasonable request.

Conflicts of Interest

The authors declare no conflicts of interest.

References

  1. Lu, Y.C.; Zhang, C.M. Analysis and prospect of spatial and temporal distribution of urban sewage in China. City Town Water Supply 2020, 73–78. [Google Scholar] [CrossRef]
  2. Zhang, M.; Liu, Y.; Fan, J. Preparation of a new efficient composite carbon source and its application in denitrification and nitrogen removal. Water Wastewater Eng. 2019, 55, 153–155, 158. [Google Scholar] [CrossRef]
  3. Li, Z.L.; Zhang, K.H. Treatment of pharmaceutical wastewater by Fenton Pre-oxidation and MBR process. China Water & Wastewater 2022, 38, 160–165. [Google Scholar] [CrossRef]
  4. Wang, W.; Zhao, Z.Y.; Zhang, X.; You, Z.P.; Huang, Z.J.; Peng, Y.Z. Effects of external carbon sources on ultimate nitrogen removal performance and microbial community in secondary effluent treating process. Environ. Sci. 2022, 43, 4717–4726. [Google Scholar] [CrossRef] [PubMed]
  5. Xu, Z.; Dai, X.; Chai, X. Effect of different carbon sources on denitrification performance, microbial community structure and denitrification genes. Sci. Total Environ. 2018, 634, 195–204. [Google Scholar] [CrossRef] [PubMed]
  6. Zou, L.; Zhou, M.; Luo, Z.; Zhang, H.; Yang, Z.; Cheng, H.; Li, R.; He, Q.; Ai, H. Selection and synthesization of multi–carbon source composites to enhance simultaneous nitrification–denitrification in treating low C/N wastewater. Chemosphere 2022, 288, 132567. [Google Scholar] [CrossRef] [PubMed]
  7. Saleem, M.; Lavagnolo, M.C.; Concheri, G.; Stevanato, P.; Squartini, A.; Spagni, A. Application of anaerobic dynamic membrane bioreactor (AnDMBR) for the successful enrichment of Anammox bacteria using mixed anaerobic and aerobic seed sludge. Bioresour. Technol. 2018, 266, 532–540. [Google Scholar] [CrossRef] [PubMed]
  8. Jiang, H.C.; Li, J.C.; Yang, M.X.; Guo, Z.Z.; Lin, S.J.; Hu, Q. Environment and economic benefit analysis of external carbon source under double carbon target and management suggestions. In Proceedings of the 2022 Annual Scientific and Technical Conference of the Chinese Society of Environmental Sciences—Environmental Engineering Technology Innovation and Application Session (III), Nanchang, China, 20 August 2022; pp. 824–829. [Google Scholar]
  9. Chen, M.F.; Zheng, K.K.; Wang, Y.; Gao, J.X.; Wang, S.; Li, J. Optimized operation of a wastewater treatment plant with high nitrate nitrogen concentration influent based on whole process analysis method. China Water Wastewate 2019, 35, 118–122+128. [Google Scholar] [CrossRef]
  10. Zhang, W.; Zhang, Y.; Yin, L.; Ruan, X. The characteristics of carbon sources for denitrification in groundwater from ten kinds of agricultural wastes. Acta Sci. Circumstant. 2017, 37, 1787–1797. [Google Scholar] [CrossRef]
  11. Fu, X.; Hou, R.; Yang, P.; Qian, S.; Feng, Z.; Chen, Z.; Wang, F.; Yuan, R.; Chen, H.; Zhou, B. Application of external carbon source in heterotrophic denitrification of domestic sewage: A review. Sci. Total Environ. 2022, 817, 153061. [Google Scholar] [CrossRef]
  12. Xu, C.; Yin, Z.; Li, C.; Bi, X.; Gu, R. Nitrogen removal enhancement with landfill leachate as supplemental carbon source for denitrification. Chin. J. Environ. Eng. 2019, 13, 1106–1112. [Google Scholar]
  13. Wang, X.; Zhang, Y.; Zhang, T.; Zhou, J.; Chen, M. Waste activated sludge fermentation liquid as carbon source for biological treatment of sulfide and nitrate in microaerobic conditions. Chem. Eng. J. 2016, 283, 167–174. [Google Scholar] [CrossRef]
  14. Liu, W.; Zheng, Z.; Sun, F.; Miao, M.; Cui, M.-H.; Liu, H.; Zhang, H.; Zhang, C.; Hu, Z.; Liu, H. Valorization of citric acid production wastewater as alternative carbon source for biological nutrients removal: A pilot-scale case study. J. Clean. Prod. 2020, 258, 120576. [Google Scholar] [CrossRef]
  15. Li, X.; Zhi, Y.; Jia, M.; Wang, X.; Tao, M.; Wang, Z.; Xing, B. Properties and photosynthetic promotion mechanisms of artificial humic acid are feedstock-dependent. Carbon Res. 2024, 3, 4. [Google Scholar] [CrossRef]
  16. Dong, L.Q.; Xu, F.; Wen, Y.X. Research progress in modification and application of poly(glycolic acid). China Plast. 2022, 36, 166–174. [Google Scholar]
  17. Matsuda, Y.; Karino, M.; Okui, T.; Kanno, T. Complications of poly-l-lactic acid and polyglycolic acid (PLLA/PGA) osteosynthesis systems for maxillofacial surgery: A retrospective clinical investigation. Polymers 2021, 13, 889. [Google Scholar] [CrossRef] [PubMed]
  18. Feng, S.; Wen, L.; Sun, Z.Y.; Ji, Y. Properties and applications of PGA/PBAT composites. China Plast. 2020, 34, 36–40. [Google Scholar] [CrossRef]
  19. Zhong, W.M.; Liu, L.P.; Wei, Z.Y. Synthesis and industrialization of biodegradable plastics PGA. China Synth. Resin Plast. 2021, 38, 80–84. [Google Scholar] [CrossRef]
  20. Gao, S.; He, W.; Wang, S.K.; Qin, W. Demonstration for application of denitrifying phosphorus removal process in rural domestic sewage treatment. China Water Wastewater 2023, 39, 114–119. [Google Scholar] [CrossRef]
  21. Wang, Y.; Sun, Z.; Qiang, Z. Start-up of solid-phase denitrification process for treatment of nitrate-rich water in recirculating mariculture system: Carbon source selection and nitrate removal mechanism. Chemosphere 2023, 338, 139568. [Google Scholar] [CrossRef] [PubMed]
  22. Wang, Z.; Zheng, M.; He, C.; Hu, Z.; Yu, Y.; Wang, W. Enhanced treatment of low-temperature and low carbon/nitrogen ratio wastewater by corncob-based fixed bed bioreactor coupled sequencing batch reactor. Bioresour. Technol. 2022, 351, 126975. [Google Scholar] [CrossRef] [PubMed]
  23. Yan, C.; Wang, F.; Geng, H.; Liu, H.; Pu, S.; Tian, Z.; Chen, H.; Zhou, B.; Yuan, R.; Yao, J. Integrating high-throughput sequencing and metagenome analysis to reveal the characteristic and resistance mechanism of microbial community in metal contaminated sediments. Sci. Total Environ. 2020, 707, 136116. [Google Scholar] [CrossRef]
  24. Liu, C.; Li, Q.; Song, Z.Y.; Hu, P.; Jing, S.Y.; Li, W.P. Analysis of microbial community characteristics and function prediction of MBBR with magnetic biocarriers at low temperature. Environ. Sci. 2023, 44, 889–899. [Google Scholar] [CrossRef] [PubMed]
  25. Zhang, J.; Xia, Z.; Wei, Q.; Luo, F.; Jiang, Z.; Ao, Z.; Chen, H.; Niu, X.; Liu, G.-h.; Qi, L. Exploratory study on the metabolic similarity of denitrifying carbon sources. Environ. Sci. Pollut. Res. 2024, 31, 19961–19973. [Google Scholar] [CrossRef] [PubMed]
  26. Huang, Q.; Alengebawy, A.; Zhu, X.; Raza, A.F.; Chen, L.; Chen, W.; Guo, J.; Ai, P.; Li, D. Performance of Paracoccus pantotrophus MA3 in heterotrophic nitrification–anaerobic denitrification using formic acid as a carbon source. Bioprocess Biosyst. Eng. 2022, 45, 1661–1672. [Google Scholar] [CrossRef] [PubMed]
  27. Zhang, J.; Chen, M.Y.; Hao, Z.N.; Zhong, H.; He, H.; Lei, P. Dynamic changes of dissolved organic matter derived from algal decomposition and the environmental effects in eu-trophiclakes. Environ. Sci. 2024, 45, 1539–1552. [Google Scholar] [CrossRef] [PubMed]
  28. Pan, Y.; Sun, R.Z.; Wang, Y.; Chen, G.L.; Fu, Y.Y.; Yu, H.Q. Carbon source shaped microbial ecology, metabolism and performance in denitrification systems. Water Res. 2023, 243, 120330. [Google Scholar] [CrossRef]
  29. Leng, J.; Lu, J.; Hai, C.; Liu, X.; Wu, P.; Sun, Y.; Yuan, C.; Zhao, J.; Hu, B. Exploring influence mechanism of small-molecule carbon source on heterotrophic nitrification-aerobic denitrification process from carbon metabolism, nitrogen metabolism and electron transport process. Bioresour. Technol. 2023, 387, 129681. [Google Scholar] [CrossRef]
  30. Zhu, K.; Zhou, J.; He, Q.; Zhou, J.; Meng, H.; He, X.J. Comprehensive impact of carbon to nitrogen ratio, dissolved oxygen and temperature on advanced phosphorus and nitrogen removal efficiencies in sequencing batch biofilm reactor(SBBR) system. Environ. Eng. 2020, 38, 45–50. [Google Scholar] [CrossRef]
  31. Yi, K.; Wang, D.; Li, X.; Chen, H.; Sun, J.; An, H.; Wang, L.; Deng, Y.; Liu, J.; Zeng, G. Effect of ciprofloxacin on biological nitrogen and phosphorus removal from wastewater. Sci. Total Environ. 2017, 605, 368–375. [Google Scholar] [CrossRef]
  32. Xing, Y.; Zhang, D.; Cai, L.; Xie, Y.; Wang, L.; Li, Q.; Hua, Y. An innovative double-layer microsphere used as slow-release carbon source for biological denitrification. Water Air Soil Pollut. 2020, 231, 1–12. [Google Scholar] [CrossRef]
  33. Loh, Z.Z.; Zaidi, N.S.; Yong, E.L.; Bahrodin, M.B.; Aris, A. Simultaneous nitrification and denitrification of real domestic wastewater using novel biodegradable Cocos Nucifera fibre as biofilter media and carbon source: Performances and microbial community composition. J. Water Process Eng. 2024, 57, 104592. [Google Scholar] [CrossRef]
  34. Tian, Z.; Li, G.; Xiong, Y.; Cao, X.; Pang, H.; Tang, W.; Liu, Y.; Bai, M.; Zhu, Q.; Du, C. Step-feeding food waste fermentation liquid as supplementary carbon source for low C/N municipal wastewater treatment: Bench scale performance and response of microbial community. J. Environ. Manag. 2023, 345, 118434. [Google Scholar] [CrossRef] [PubMed]
  35. Wang, X.; Chen, Z.; Shen, J.; Kang, J.; Zhang, X.; Li, J.; Zhao, X. Effect of carbon source on pollutant removal and microbial community dynamics in treatment of swine wastewater containing antibiotics by aerobic granular sludge. Chemosphere 2020, 260, 127544. [Google Scholar] [CrossRef] [PubMed]
  36. Liu, L.; Wang, F.; Xu, S.; Sun, W.; Wang, Y.; Ji, M. Woodchips bioretention column for stormwater treatment: Nitrogen removal performance, carbon source and microbial community analysis. Chemosphere 2021, 285, 131519. [Google Scholar] [CrossRef]
  37. An, R.; Guan, J.; Li, G.; Li, Z.; Sheng, L.; Bian, H.; Lu, N. The electrode strategy and its coordination mechanism in constructed wetland-microbial fuel cell (CW-MFC): A review. Carbon Res. 2024, 3, 17. [Google Scholar] [CrossRef]
  38. Jiang, L.; Zhang, Y.; Shen, Q.; Mao, Y.; Zhang, Q.; Ji, F. The metabolic patterns of the complete nitrates removal in the biofilm denitrification systems supported by polymer and water-soluble carbon sources as the electron donors. Bioresour. Technol. 2021, 342, 126002. [Google Scholar] [CrossRef] [PubMed]
  39. Matar, G.K.; Bagchi, S.; Zhang, K.; Oerther, D.B.; Saikaly, P.E. Membrane biofilm communities in full-scale membrane bioreactors are not randomly assembled and consist of a core microbiome. Water Res. 2017, 123, 124–133. [Google Scholar] [CrossRef] [PubMed]
  40. Cao, G.; Gao, J.; Song, J.; Jia, X.; Liu, Y.; Niu, J.; Yuan, X.; Zhao, Y. Performance and mechanism of chromium reduction in denitrification biofilm system with different carbon sources. Sci. Total Environ. 2024, 906, 167191. [Google Scholar] [CrossRef]
  41. Long, Y.; Ma, Y.; Wan, J.; Wang, Y.; Tang, M.; Zheng, Q.; Ma, Y. Hydrolysate from the enzymatic treatment of corn cob as a carbon source for heterotrophic denitrification process. J. Water Process Eng. 2023, 51, 103473. [Google Scholar] [CrossRef]
  42. Miao, H.; Zeng, W.; Li, J.; Liu, H.; Zhan, M.; Dai, H.; Peng, Y. Simultaneous nitrate and phosphate removal based on thiosulfate-driven autotrophic denitrification biofilter filled with volcanic rock and sponge iron. Bioresour. Technol. 2022, 366, 128207. [Google Scholar] [CrossRef] [PubMed]
  43. Li, D.; Zhang, S.; Li, S.; Zeng, H.; Zhang, J. Aerobic granular sludge operation and nutrients removal mechanism in a novel configuration reactor combined sequencing batch reactor and continuous-flow reactor. Bioresour. Technol. 2019, 292, 122024. [Google Scholar] [CrossRef] [PubMed]
  44. Jing, S.Y.; Song, Z.Y.; Liu, C.; Li, W.P.; Li, Q.; Zhang, T.J. Start-up and performance study on the simultaneous nitrification endogenous denitrification phosphorus remov-al (SNEDPR)in the biological process of the moving bed biofilm reactor (MBBR). China Environ. Sci. 2022, 42, 3121–3129. [Google Scholar] [CrossRef]
  45. Li, J.; Gong, B.Z.; Zhang, Y.; Wei, W.Q.; Cao, M.; Zhou, J. Performance of two-stage constructed wetland for advanced nitrogen and phosphorus removal from wastewater treatment plant effluent. China Water Wastewater 2023, 39, 75–81. [Google Scholar] [CrossRef]
  46. Niu, T.; Zhu, H.; Shutes, B.; He, C. Gaseous carbon and nitrogen emissions from microbial fuel cell-constructed wetlands with different carbon sources: Microbiota-driven mechanisms. J. Clean. Prod. 2024, 435, 140404. [Google Scholar] [CrossRef]
  47. Liang, D.; He, W.; Li, C.; Wang, F.; Crittenden, J.C.; Feng, Y. Remediation of nitrate contamination by membrane hydrogenotrophic denitrifying biofilm integrated in microbial electrolysis cell. Water Res. 2021, 188, 116498. [Google Scholar] [CrossRef] [PubMed]
  48. Sun, H.; Shi, W.; Cai, C.; Ge, S.; Ma, B.; Li, X.; Ding, J. Responses of microbial structures, functions, metabolic pathways and community interactions to different C/N ratios in aerobic nitrification. Bioresour. Technol. 2020, 311, 123422. [Google Scholar] [CrossRef] [PubMed]
  49. Wang, Z.; Zhu, Z.H.; Ding, Y.N. Effect of low temperature on nitrogen removal in a CANON-type sequencing batch biofilm reactor. China Environ. Sci. 2019, 39, 1533–1541. [Google Scholar] [CrossRef]
  50. Chen, Z.W.; Zuo, Q.Y.; Liu, C.H.; Li, L.; Katherine, Y.; He, Q. Insights into solid phase denitrification in wastewater tertiary treatment: The role of solid carbon source in carbon biodegradation and heterotrophic denitrification. Bioresour. Technol. 2023, 376, 128838. [Google Scholar] [CrossRef] [PubMed]
  51. Huang, W.; Gong, B.Z.; Wang, Y.M.; Lin, Z.Y.; He, L.; Zhou, J.; He, Q. Metagenomic analysis reveals enhanced nutrients removal from low C/N municipal wastewater in a pilot-scale modified AAO system coupling electrolysis. Water Research. 2020, 173, 115530. [Google Scholar] [CrossRef]
  52. Li, J.; Feng, Y.; Qiu, Y.; Chen, D.; Liang, D.; Zhou, J.; Liu, G. Recovery of electron and carbon source from agricultural waste corncob by microbial electrochemical system to enhance wastewater denitrification. Sci. Total Environ. 2023, 878, 162926. [Google Scholar] [CrossRef] [PubMed]
  53. Yılmaz, H.; İbici, H.N.; Erdoğan, E.M.; Türedi, Z.; Ergenekon, P.; Özkan, M. Nitrite is reduced by nitrite reductase NirB without small subunit NirD in Escherichia coli. J. Biosci. Bioeng. 2022, 134, 393–398. [Google Scholar] [CrossRef] [PubMed]
  54. Long, Y.; Ma, Y.; Wan, J.; Wang, Y.; Tang, M.; Fu, H.; Cao, J. Denitrification efficiency, microbial communities and metabolic mechanisms of corn cob hydrolysate as denitrifying carbon source. Environ. Res. 2023, 221, 115315. [Google Scholar] [CrossRef] [PubMed]
  55. Li, X.; Li, X.; Li, C.; Li, N.; Zou, P.; Gao, X.; Cao, Q. Nitrogen removal performances and metabolic mechanisms of denitrification systems using different volatile fatty acids as external carbon sources. Chem. Eng. J. 2023, 474, 145998. [Google Scholar] [CrossRef]
  56. Han, L.; Han, Y.; Dai, Y.; Zhang, J.; Zhong, C.; Zhuo, Y. Performance of sludge thermal hydrolyzed liquor as carbon source for sewage denitrification. Zhongguo Huanjing Kexue/China Environ. Sci. 2021, 41, 3653–3659. [Google Scholar]
Figure 1. Effect of polyglycolic acid dosage on the removal of (a) CODCr, (b) NH4+-N, (c) TN, and (d) NO3-N and NO2-N.
Water 16 01277 g001
Figure 2. Three-dimensional fluorescence spectra of influent and effluent water (a) influent; (b) CK effluent; (c) T1 effluent; (d) T2 effluent; and (e) T3 effluent.
Water 16 01277 g002aWater 16 01277 g002b
Figure 3. Effect of pH on the removal of (a) CODCr, (b) NH4+-N, (c) TN, and (d) NO3-N, and (e) NO2-N.
Water 16 01277 g003
Figure 4. Effect of dissolved oxygen on (a) CODCr; (b) NH4+-N; (c) TN; and (d) NO3-N and NO2-N removal effects. (I: DO is 1 ± 0.5 mg/L; II: DO is 3 ± 0.5 mg/L; III: DO is 5 ± 0.5 mg/L).
Water 16 01277 g004
Figure 5. Microbial-community structure and relative abundance at the (a) phylum level and (b) genus level.
Water 16 01277 g005
Figure 6. Variance analysis of denitrifying bacteria in different reactors. (a) T1 and blank groups; (b) T2 and blank groups; (c) T3 and blank groups.
Water 16 01277 g006
Figure 7. The relative abundance of genes related to (a) dissimilatory nitrate reduction; (b) denitrification; (c) assimilatory nitrate reduction; and (d) nitrification in nitrogen metabolism at three stages.
Water 16 01277 g007aWater 16 01277 g007b
Figure 8. Main nitrogen metabolism pathways (colored arrows indicate different nitrogen metabolism processes).
Water 16 01277 g008
Table 1. Experimental setup.
Serial NumberCarbon SourceDosage
(mL/L)
Serial NumberCarbon SourcepHSerial NumberCarbon SourceDO
(mg/L)
CK//P1PGA5–6D1PGA1 ± 0.5
T0methanol0.45P26–7
T1PGA0.5P37–8D23 ± 0.5
T21.2P48–9
T31.9 D35 ± 0.5
Table 2. Table of microbial-diversity indices.
SpecimensOTUsShannonChao1AceSimpsonCoverageNumber of Original Sequences
T16473.9191347.7351398.3320.08040.995580,133
T27224.4861353.3201417.2810.06980.995389,153
T37464.5991556.7271627.0180.07110.995691,248
T47534.7881627.0131697.3620.03880.996289,561
T57875.6221725.5221746.8110.01410.995784,138
Table 3. Domestic and international research status about carbon source.
Serial NumberTitleResearch ContentsFindingReference
1Denitrification efficiency, microbial communities, and metabolic
mechanisms of corn cob hydrolysate as denitrifying carbon source
In this study, the denitrification efficacy of corn cob hydrolysate (CCH) was compared and analyzed with that of
glucose and acetate to determine its feasibility as an additional carbon source, and its metabolic mechanism as a
denitrification carbon source was investigated in depth.
By constructing a denitrification reactor, it was found that the TN-removal rate exceeded 97% and the effluent COD remained below 70 mg/L during the stable operation with CCH as the carbon source[54]
2The nitrogen-removal performances and metabolic mechanisms of
denitrification systems using different volatile fatty acids as external
carbon sources
In this study, denitrification
using acetate, propionate, or butyrate as a sole carbon source was compared.
Propionate and butyrate systems had obviously higher denitrification efficiencies than the acetate system (the maximum nitrate-removal rates were 122.58, 110.67, and 80.79 mg N/(L · h) in propionate, butyrate, and acetate systems, respectively).[55]
3Performance of sludge thermal hydrolyzed liquor as a carbon source for sewage denitrification.The denitrification performance of sludge thermal hydrolyzed liquor was investigated using sludge thermal hydrolyzed liquor as an external carbon source and compared with that of sodium acetate, a conventional carbon source.The total nitrogen (TN) concentrations of the effluent were reduced from 27.64 mg/L to 12.05 mg/L with the dosage of TH liquor and 7.98 mg/L with the dosage of sodium acetate, respectively, indicating that the nitrogen-removal ability could be improved by them.[56]
Disclaimer/Publisher’s Note: The statements, opinions and data contained in all publications are solely those of the individual author(s) and contributor(s) and not of MDPI and/or the editor(s). MDPI and/or the editor(s) disclaim responsibility for any injury to people or property resulting from any ideas, methods, instructions or products referred to in the content.