
Evaluating the Human–Water Relationship over the Past Two Decades Using the SMI-P Method across Nine Provinces along the Yellow River, China


Abstract
1. Introduction
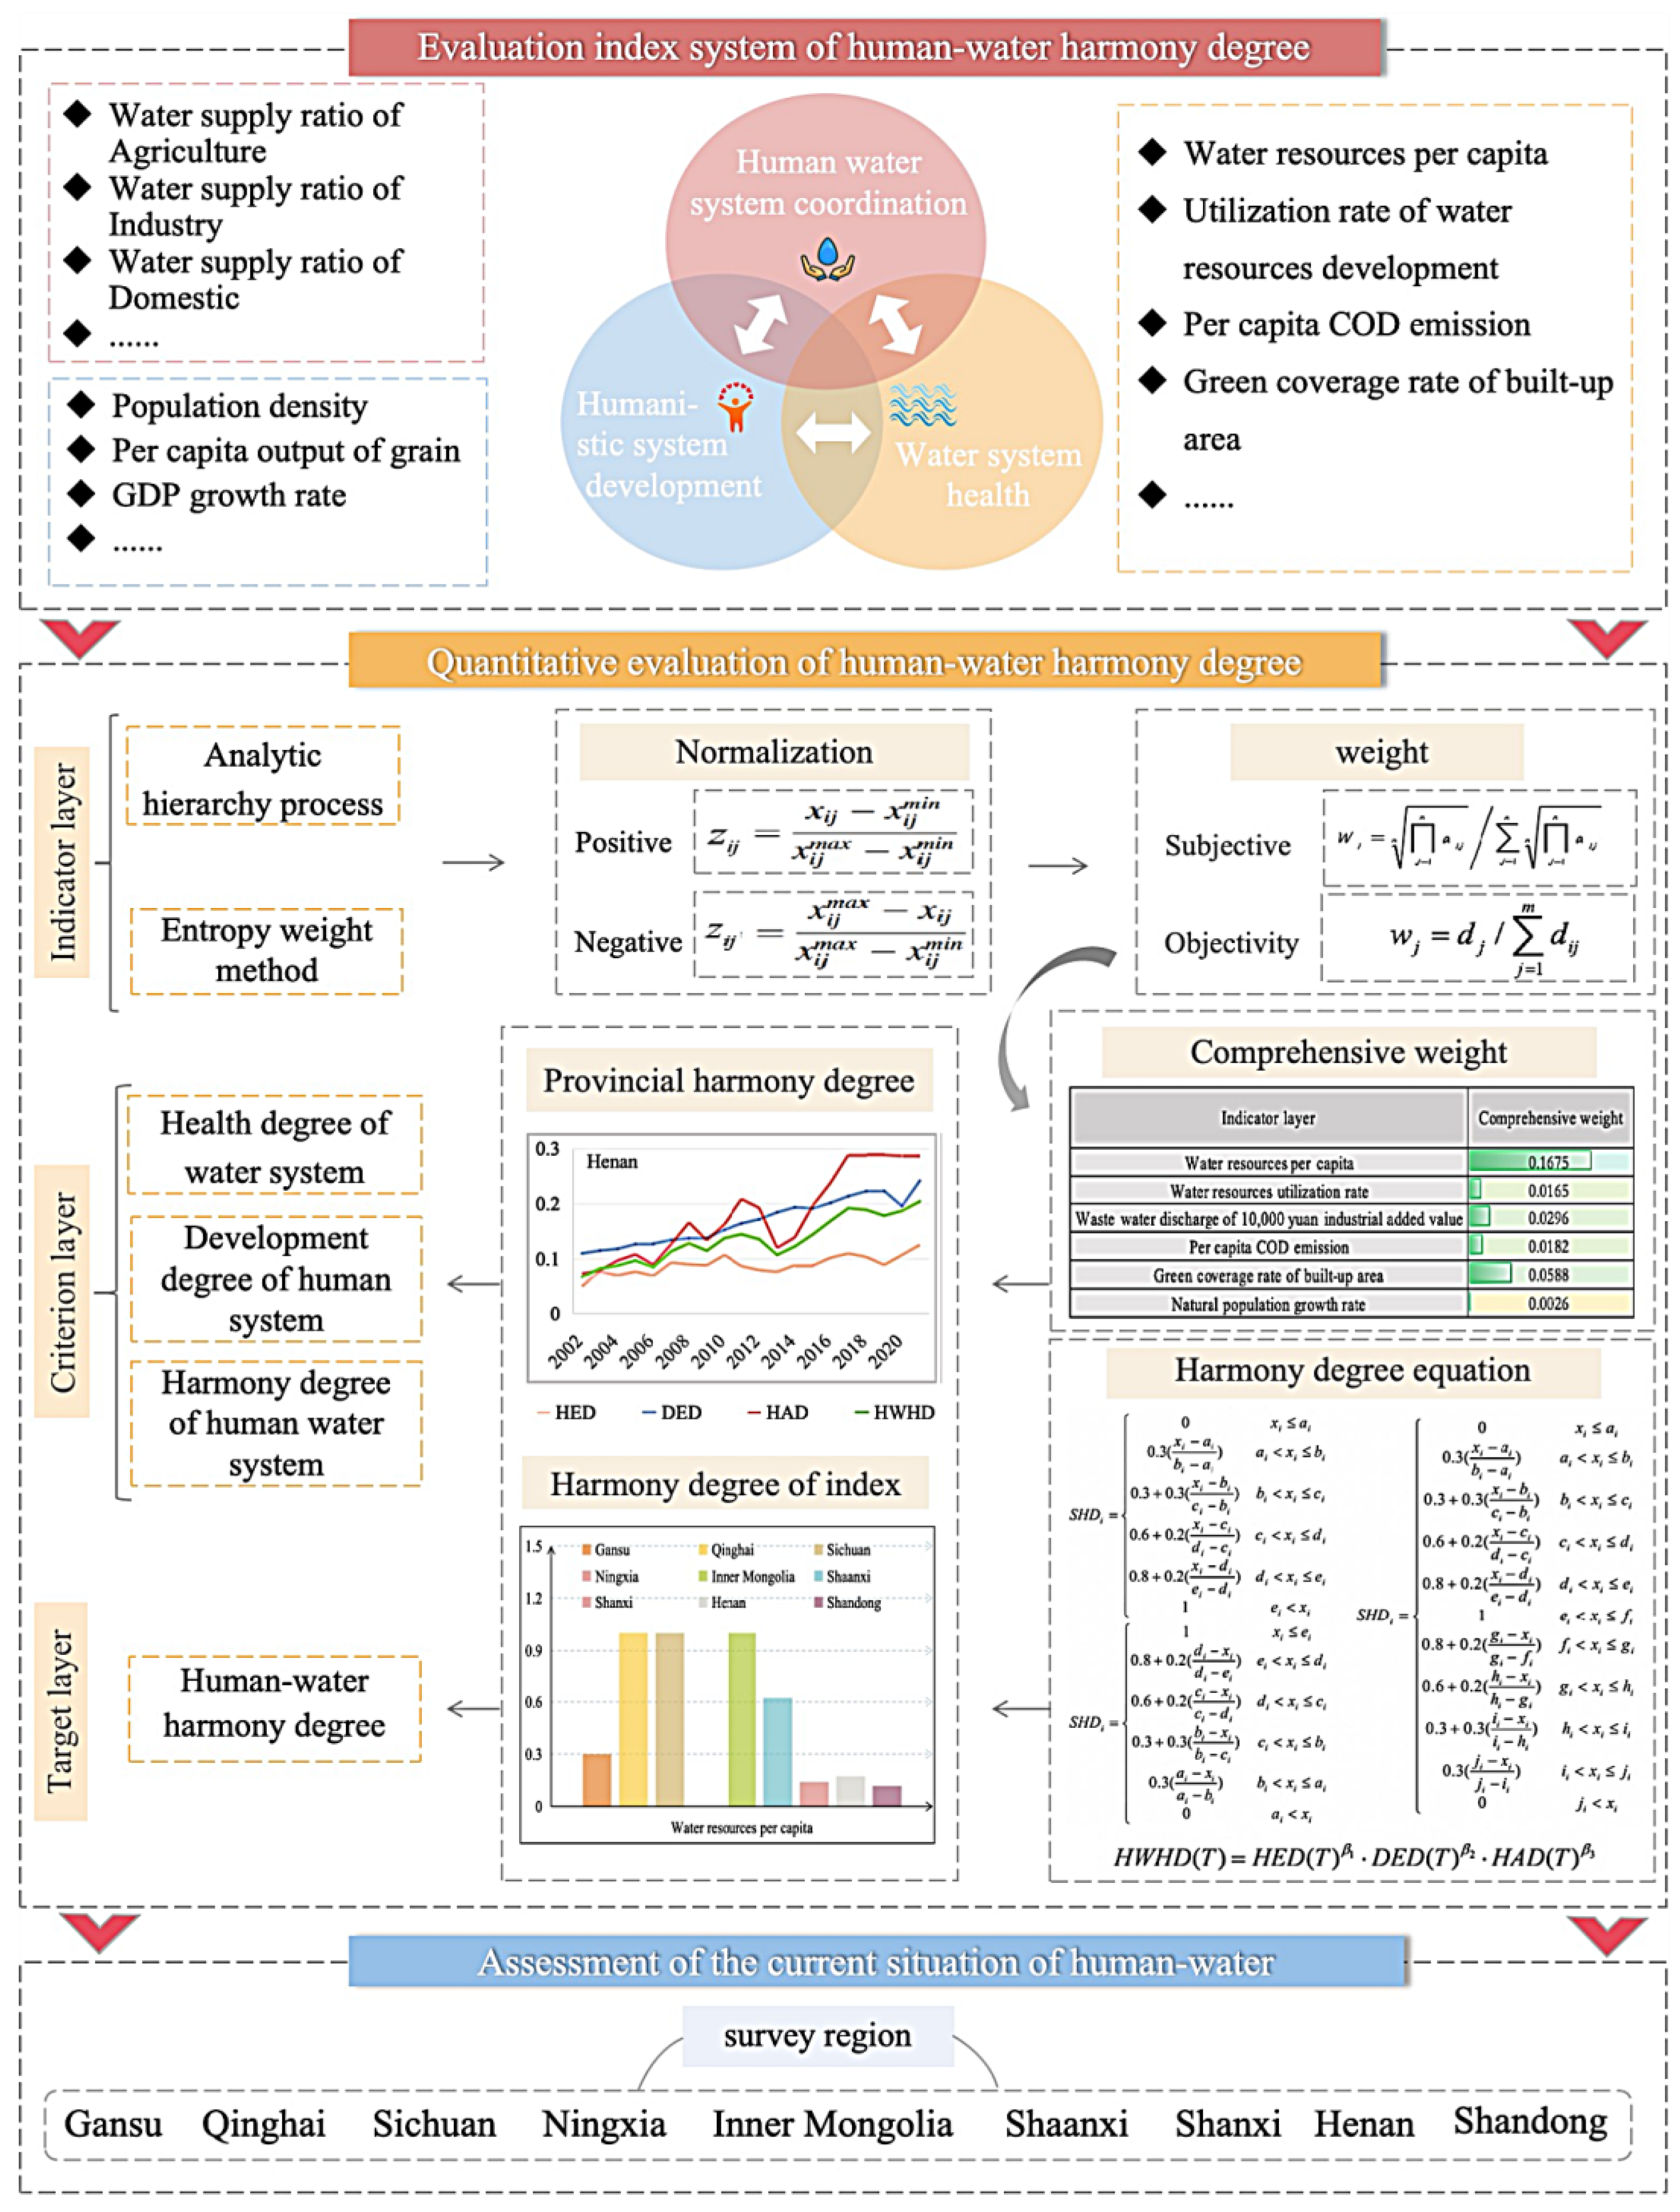
2. Methods
2.1. Calculation of Comprehensive Weight
2.2. Calculation of HWHD
3. Case Study
4. Results
4.1. Result of Weight
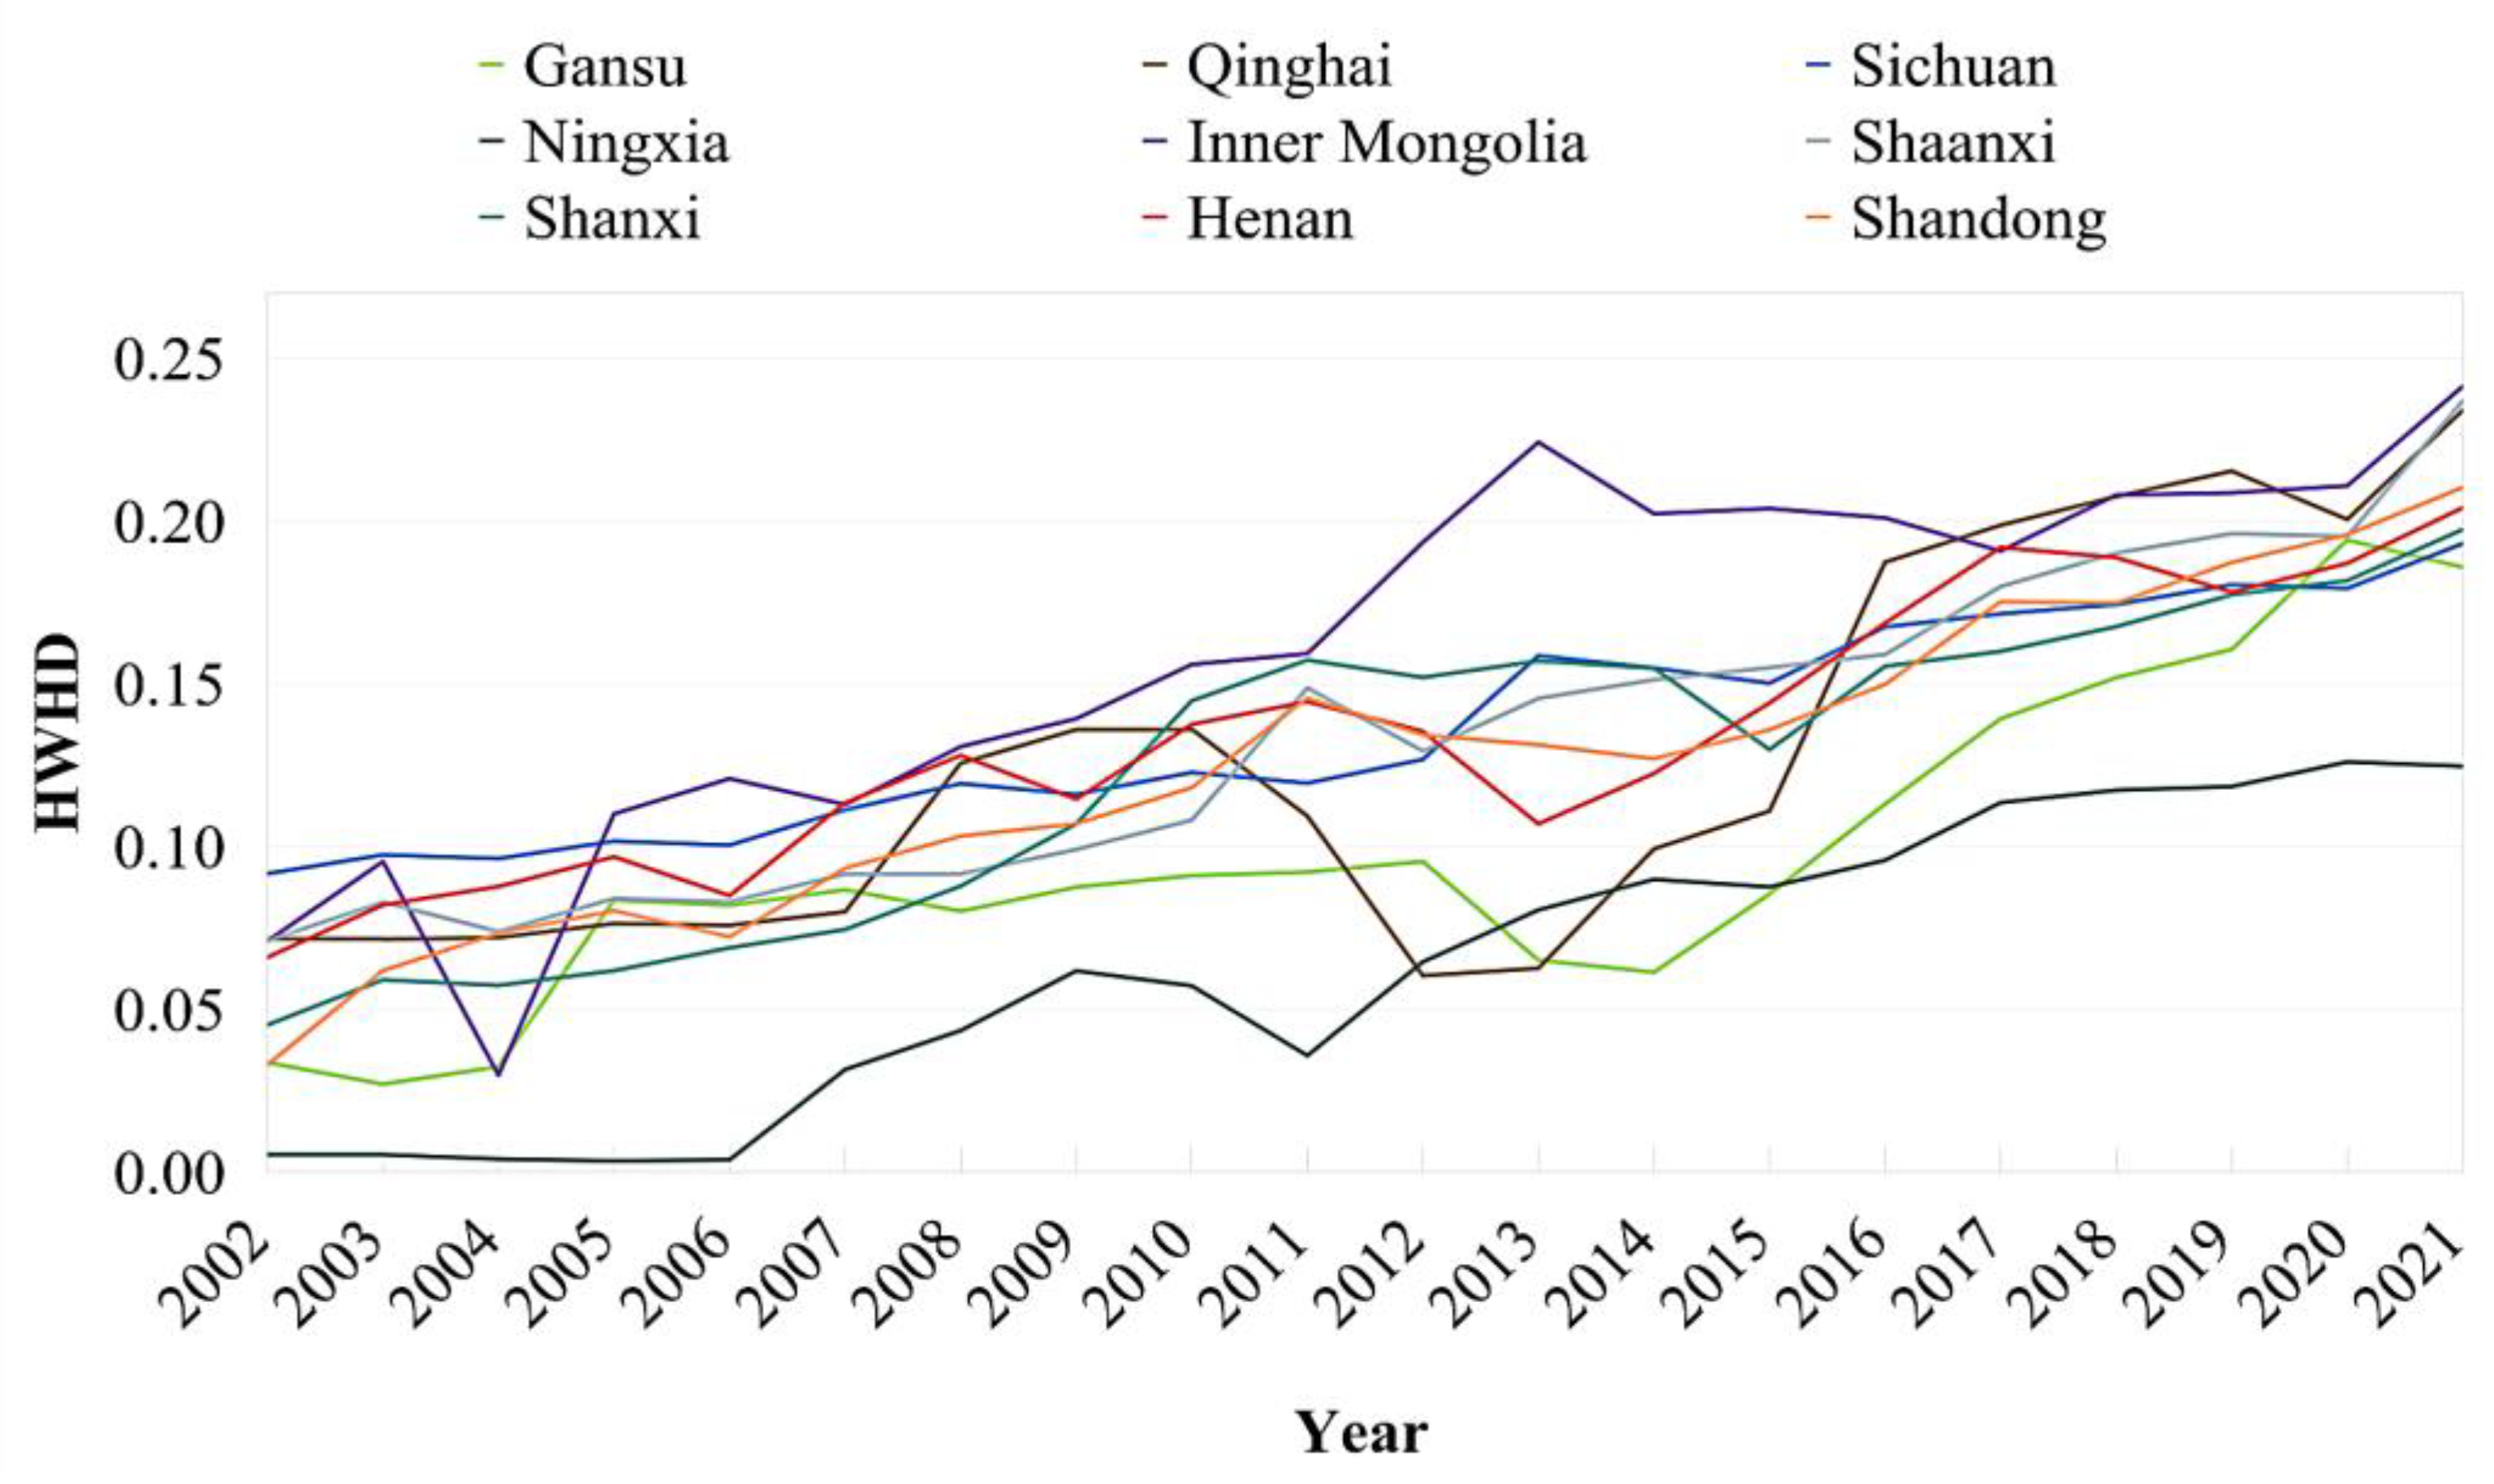
4.2. Temporal Variation of HWHD

| Indicator Layer | Subjective Weight | Objective Weight | Comprehensive Weight |
|---|---|---|---|
| Water resources per capita | 0.0238 | 0.1859 | 0.1675 |
| Water resources utilization rate | 0.1190 | 0.0037 | 0.0165 |
| Waste water discharge per CNY 10,000 of industrial added value | 0.1071 | 0.0073 | 0.0296 |
| Per capita COD emission | 0.0357 | 0.0135 | 0.0182 |
| Green coverage rate of built-up area | 0.1429 | 0.0109 | 0.0588 |
| Natural population growth rate | 0.0039 | 0.0178 | 0.0026 |
| Urbanization rate | 0.0317 | 0.0216 | 0.0259 |
| population density | 0.0025 | 0.0339 | 0.0033 |
| Proportion of employees in the tertiary industry | 0.0051 | 0.0294 | 0.0057 |
| Engel’s coefficient for urban residents | 0.0204 | 0.0139 | 0.0107 |
| Per capita disposable income of urban residents | 0.0089 | 0.0586 | 0.0197 |
| Per capita disposable income of rural residents | 0.0089 | 0.0634 | 0.0214 |
| Per capita grain yields | 0.0143 | 0.0550 | 0.0298 |
| Per capita comprehensive water consumption | 0.0470 | 0.0142 | 0.0252 |
| Per capita GDP | 0.0145 | 0.0536 | 0.0294 |
| Per capita fiscal revenue | 0.0243 | 0.0634 | 0.0584 |
| Per capita total social fixed asset investment | 0.0131 | 0.0674 | 0.0335 |
| Proportion of output value of tertiary industry in GDP | 0.0183 | 0.0288 | 0.0199 |
| GDP growth rate | 0.0504 | 0.0206 | 0.0392 |
| Growth rate of output value of tertiary industry | 0.0223 | 0.0033 | 0.0028 |
| Water consumption per CNY 10,000 of GDP | 0.0251 | 0.0047 | 0.0045 |
| Water consumption per CNY 10,000 of industrial added output | 0.0381 | 0.0047 | 0.0067 |
| Irrigation water per mu of farmland | 0.0089 | 0.0116 | 0.0039 |
| Reuse rate of urban industrial water | 0.0138 | 0.0135 | 0.0071 |
| College students per 10,000 people | 0.0570 | 0.0288 | 0.0621 |
| Water supply ratio of agriculture | 0.0168 | 0.0237 | 0.0151 |
| Water supply ratio of industry | 0.0079 | 0.0395 | 0.0117 |
| Water supply ratio of domestic | 0.0376 | 0.0348 | 0.0496 |
| Water supply ratio of ecology | 0.0805 | 0.0725 | 0.2209 |
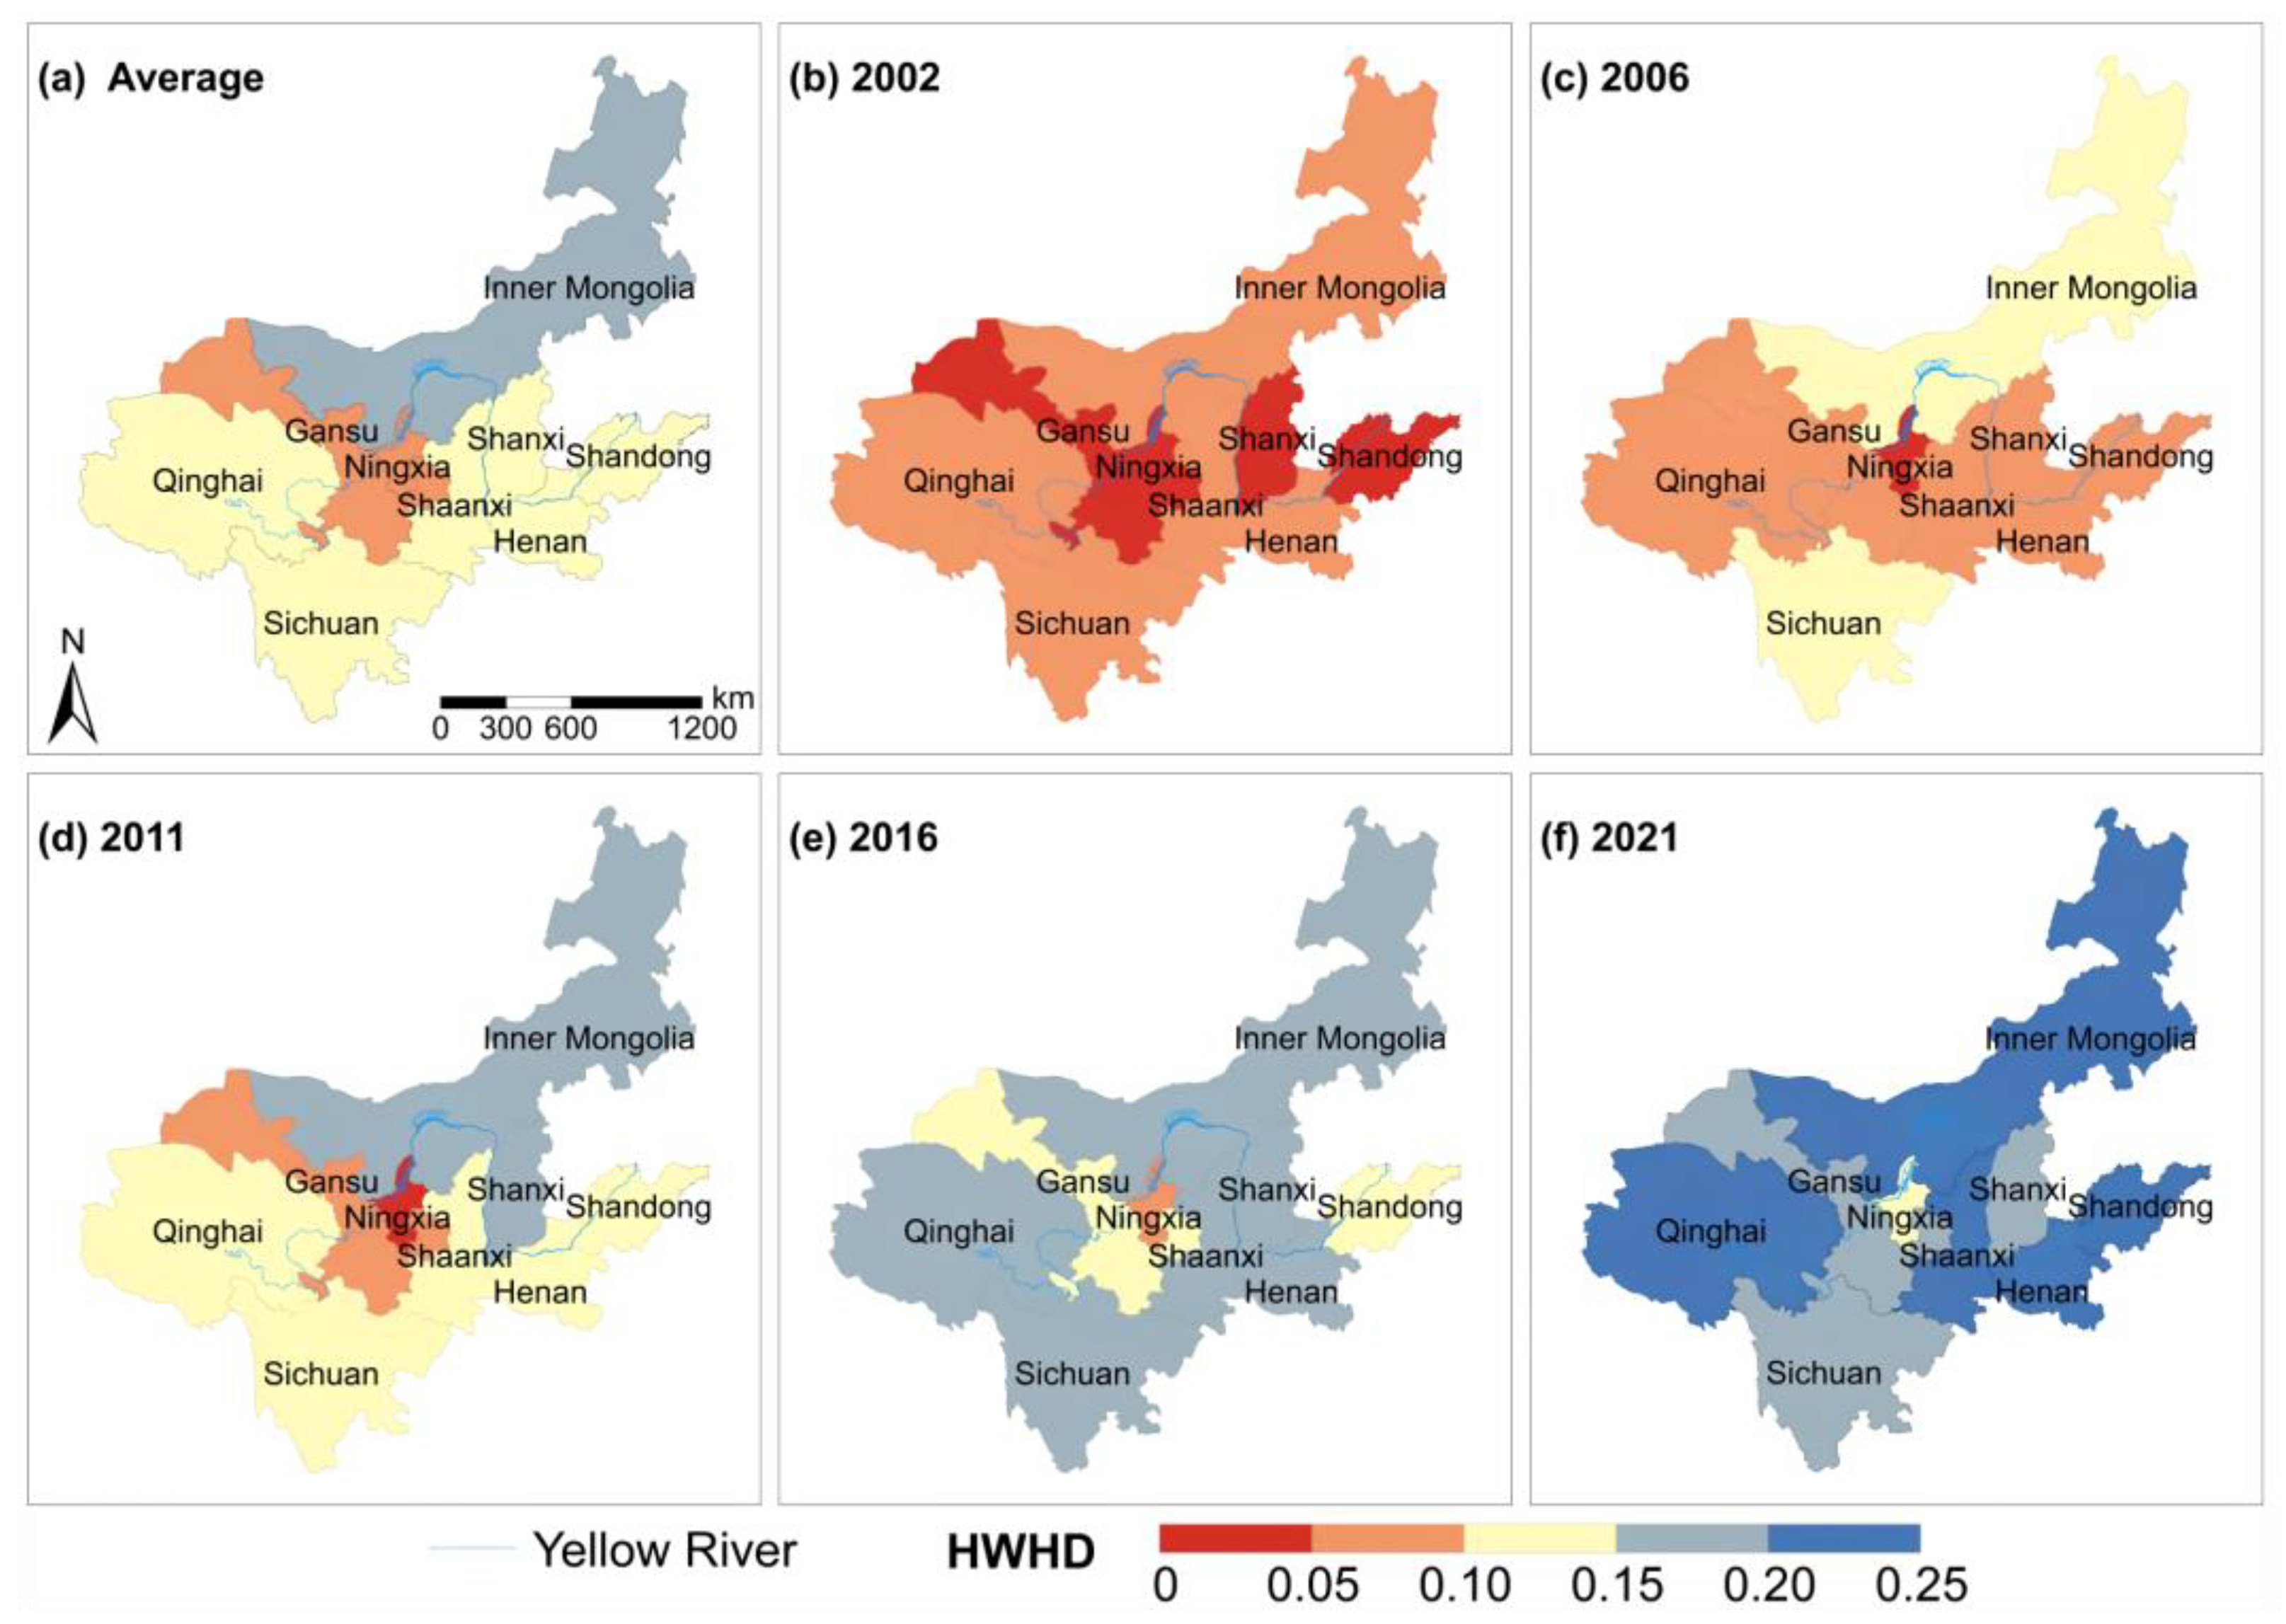
4.3. Spatial Variation of HWHD
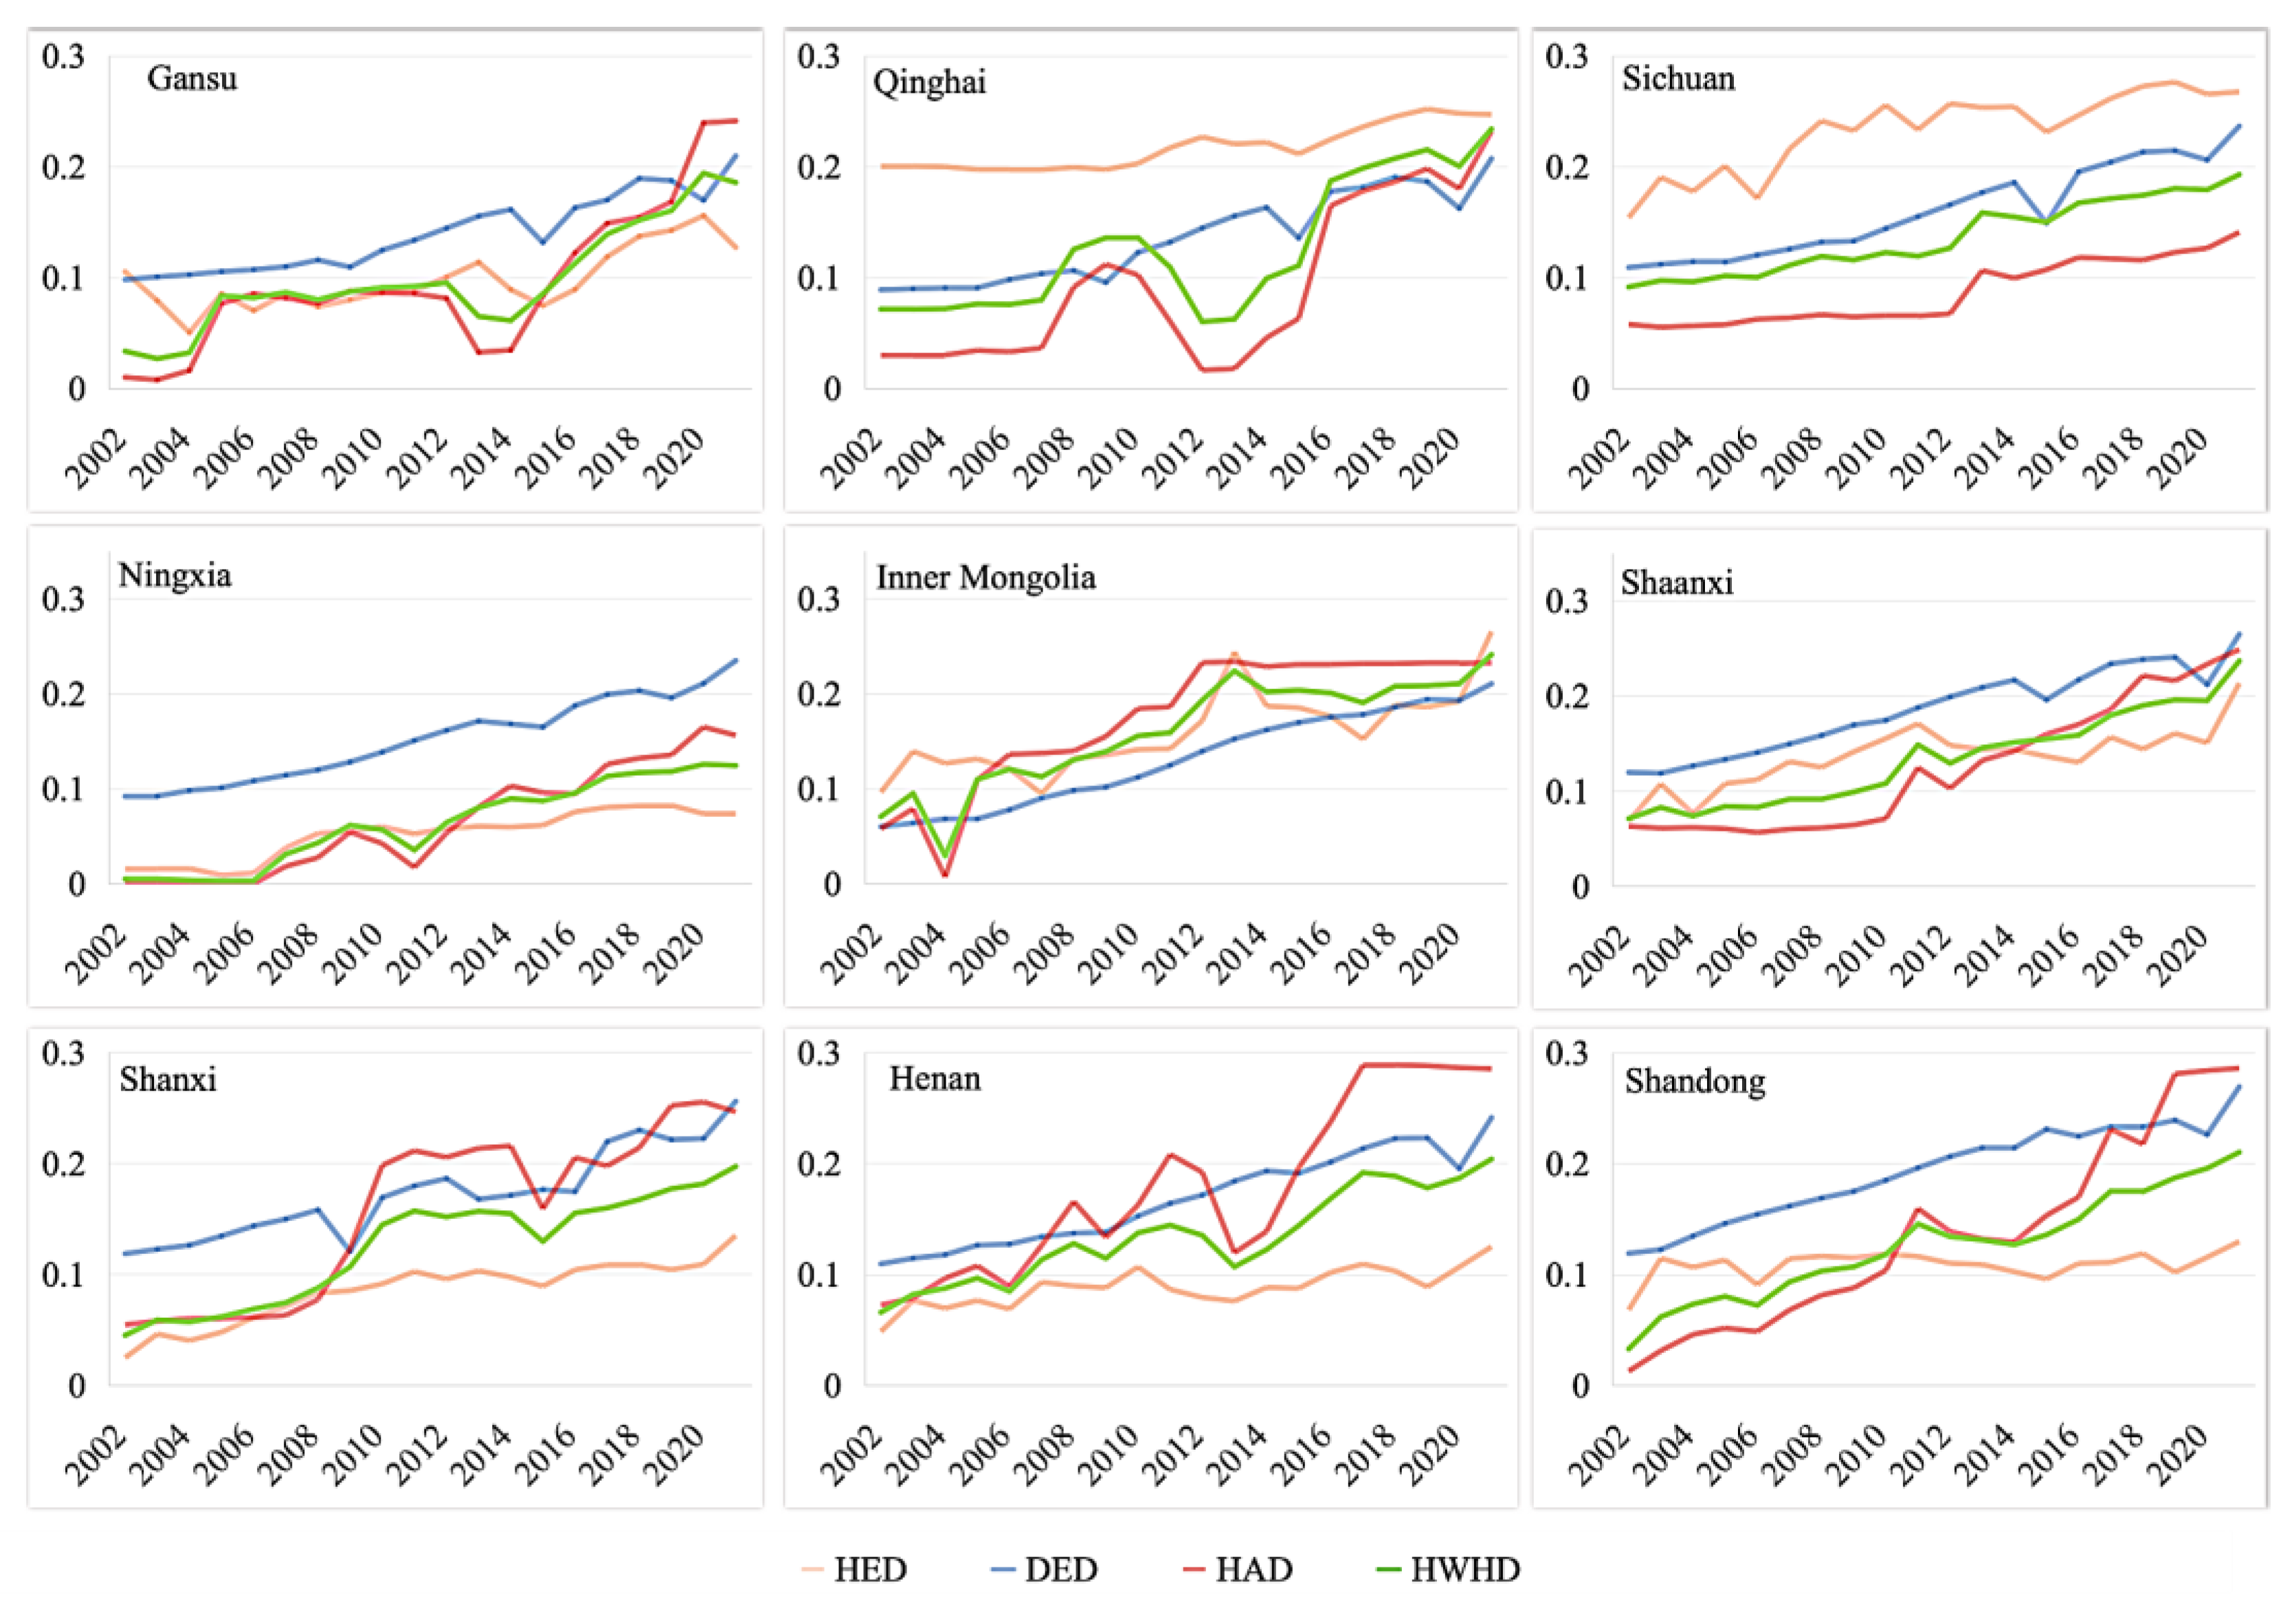
4.4. The Evaluation Results of Three Subsystems
5. Discussion
6. Conclusions and Limitations
Author Contributions
Funding
Data Availability Statement
Conflicts of Interest
References
- Vörösmarty, C.J.; McIntyre, P.B.; Gessner, M.O.; Dudgeon, D.; Prusevich, A.; Green, P.; Glidden, S.; Bunn, S.E.; Sullivan, C.A.; Liermann, C.R.; et al. Global threats to human water security and river biodiversity. Nature 2010, 467, 555–561. [Google Scholar] [CrossRef]
- Mehta, L. Water and human development. World Dev. 2014, 59, 59–69. [Google Scholar] [CrossRef]
- Oki, T.; Kanae, S. Global hydrological cycles and world water resources. Science 2006, 313, 1068–1072. Available online: http://webofscience.clarivate.cn.libproxy.v.zzu.edu.cn/wos/alldb/full−record/INSPEC:13105253 (accessed on 30 December 2023). [CrossRef]
- Srinivasan, V.; Lambin, E.F.; Gorelick, S.M.; Thompson, B.H.; Rozelle, S. The nature and causes of the global water crisis: Syndromes from a meta−analysis of coupled human−water studies. Water Resour. Res. 2012, 48, W10516. [Google Scholar] [CrossRef]
- He, C.; Liu, Z.; Wu, J.; Pan, X.; Fang, Z.; Li, J.; Bryan, B.A. Future global urban water scarcity and potential solutions. Nat. Commun. 2021, 12, 4667. [Google Scholar] [CrossRef]
- Boulange, J.; Hanasaki, N.; Yamazaki, D.; Pokhrel, Y. Role of dams in reducing global flood exposure under climate change. Nat. Commun. 2021, 12, 417. [Google Scholar] [CrossRef]
- Nerubasska, A.; Palshkov, K.; Maksymchuk, B. A systemic philosophical analysis of the contemporary society and the human: New potential. Postmod. Open. 2020, 11, 275–292. [Google Scholar] [CrossRef]
- Zhou, A.; Zhang, Y.; Xie, S.; Chen, Y.; Li, X.; Wang, J.; Zou, J. Microplastics and their potential effects on the aquaculture systems: A critical review. Rev. Aquac. 2021, 13, 719–733. [Google Scholar] [CrossRef]
- Yoo, C.; Jun, C.; Zhu, J.; Na, W. Evaluation of Dam Water−Supply Capacity in Korea Using the Water−Shortage Index. Water 2021, 13, 956. [Google Scholar] [CrossRef]
- Schlosser, C.A.; Strzepek, K.; Gao, X.; Fant, C.; Blanc, É.; Paltsev, S.; Jacoby, H.; Reilly, J.; Gueneau, A. The future of global water stress: An integrated assessment. Earth’s Future 2014, 2, 341–361. [Google Scholar] [CrossRef]
- Mathias, J.M.; Thomas, R.B. Global tree intrinsic water use efficiency is enhanced by increased atmospheric CO2 and modulated by climate and plant functional types. Proc. Natl. Acad. Sci. USA 2021, 118, e2014286118. [Google Scholar] [CrossRef]
- Yu, L.; Gao, X.; Zhao, X. Global synthesis of the impact of droughts on crops’ water−use efficiency (WUE): Towards both high WUE and productivity. Agric. Syst. 2020, 177, 102723. [Google Scholar] [CrossRef]
- Garriga, R.G.; Foguet, A.P. Improved method to calculate a water poverty index at local scale. J. Environ. Eng. 2010, 136, 1287–1298. [Google Scholar] [CrossRef]
- Ladi, T.; Mahmoudpour, A.; Sharifi, A. Assessing impacts of the water poverty index components on the human development index in Iran. Habitat Int. 2021, 113, 102375. [Google Scholar] [CrossRef]
- Jia, Z.; Cai, Y.; Chen, Y.; Zeng, W. Regionalization of water environmental carrying capacity for supporting the sustainable water resources management and development in China. Resour. Conserv. Recycl. 2018, 134, 282–293. [Google Scholar] [CrossRef]
- Assefa, Y.T.; Babel, M.S.; Sušnik, J.; Shinde, V.R. Development of a generic domestic water security index, and its application in Addis Ababa, Ethiopia. Water 2018, 11, 37. [Google Scholar] [CrossRef]
- Ding, Y.; Tang, D.; Dai, H.; Wei, Y. Human−water harmony index: A new approach to assess the human water relationship. Water Resour. Manag. 2014, 28, 1061–1077. [Google Scholar] [CrossRef]
- Zuo, Q.; Diao, Y.; Hao, L.; Han, C. Comprehensive evaluation of the human−water harmony relationship in countries along the “belt and road”. Water Resour. Manag. 2020, 34, 4019–4035. [Google Scholar] [CrossRef]
- Zhou, Y.; Zou, S.; Duan, W.; Chen, Y.; Takara, K.; Di, Y. Analysis of energy carbon emissions from agroecosystems in Tarim River Basin, China: A pathway to achieve carbon neutrality. Appl. Energy 2022, 325, 119842. Available online: http://www.sciencedirect.com.libproxy.v.zzu.edu.cn/science/article/pii/S0306261922011114 (accessed on 30 December 2023). [CrossRef]
- Zhang, J.; Tang, D.; Wang, M.; Ahamd, I.; Hu, J.; Meng, Z.; Pan, S. A Regional Water Resource Allocation Model Based on the Human–Water Harmony Theory in the Yellow River Basin. Water 2023, 15, 1388. [Google Scholar] [CrossRef]
- Shi, Y.; Yang, S.; Chen, W.; Wang, X.; Feng, C. Research on the construction of a human−water harmony model in the Yellow River Basin. Water Policy 2023, 25, 742–757. [Google Scholar] [CrossRef]
- Ahmad, I.; Waseem, M.; Lei, H.; Yang, H.; Yang, D. Harmonious level indexing for ascertaining human–water relationships. Environ. Earth Sci. 2018, 77, 125. [Google Scholar] [CrossRef]
- Yin, L.; Feng, X.; Fu, B.; Wang, S.; Wang, X.; Chen, Y.; Tao, F.; Hu, J. A coupled human−natural system analysis of water yield in the Yellow River basin, China. Sci. Total Environ. 2021, 762, 143141. [Google Scholar] [CrossRef]
- Zuo, Q.; Zhang, Z.; Ma, J.; Li, J. Solutions to Difficult Problems Caused by the Complexity of Human–Water Relationship in the Yellow River Basin: Based on the Perspective of Human–Water Relationship Discipline. Water 2022, 14, 2868. [Google Scholar] [CrossRef]
- Xie, P.; Zhuo, L.; Yang, X.; Huang, H.; Gao, X.; Wu, P. Spatial−temporal variations in blue and green water resources, water footprints and water scarcities in a large river basin: A case for the Yellow River basin. J. Hydrol. 2020, 590, 125222. [Google Scholar] [CrossRef]
- Liu, S.; Zhao, L. Development and synergetic evolution of the water–energy–food nexus system in the Yellow River Basin. Environ. Sci. Pollut. Res. 2022, 29, 65549–65564. [Google Scholar] [CrossRef]
- Shannon, C.E. A mathematical theory of communication. Bell Syst. Tech. J. 1948, 27, 379–423. Available online: https://ieeexplore.ieee.org/document/6773024 (accessed on 30 December 2023). [CrossRef]
- Saaty, T.L. A scaling method for priorities in hierarchical structures. J. Math. Psychol 1977, 15, 234–281. [Google Scholar] [CrossRef]
- Ma, Y.; Shi, T.; Zhang, W.; Hao, Y.; Hung, J.; Lin, Y. Comprehensive policy evaluation of NEV development in China, Japan, the United States, and Germany based on the AHP−EW model. J. Clean. Prod. 2019, 214, 389–402. Available online: http://www.sciencedirect.com.libproxy.v.zzu.edu.cn/science/article/pii/S0959652618338277 (accessed on 30 December 2023). [CrossRef]
- Zuo, Q.; Zhang, Y.; Lin, P. Index system and quantification method for human−water harmony. J. Hydraul. Eng. 2008, 39, 440–447. Available online: http://webofscience.clarivate.cn.libproxy.v.zzu.edu.cn/wos/alldb/full−record/CSCD:3287618 (accessed on 30 December 2023).
- Zuo, Q.; Zhao, H.; Mao, C.; Ma, J.; Cui, G. Quantitative Analysis of Human−Water Relationships and Harmony−Based Regulation in the Tarim River Basin. J. Hydrol. Eng. 2015, 20, 1–11. [Google Scholar] [CrossRef]
| Criterion Layer | Classification Layer | Indicator Layer | Unit | Criterion Attribute | Worst Value | Difference Value | Pass Value | Optimal Value | Optimal Value |
|---|---|---|---|---|---|---|---|---|---|
| Health degree of water system | Water resources subsystem | Water resources per capita | Person | Positive | 130 | 1115 | 2100 | 2600 | 3100 |
| Water resources utilization rate | % | Negative | 100 | 80 | 60 | 42 | 24 | ||
| Water environment subsystem | Waste water discharge per CNY 10,000 of industrial added value | Ton | Negative | 80 | 53 | 26 | 20 | 14 | |
| Per capita COD emission | Ton | Negative | 0.04 | 0.03 | 0.02 | 0.011 | 0.002 | ||
| Water ecological subsystem | Green coverage rate of built-up area | % | Positive | 29 | 32 | 35 | 40 | 45 | |
| Development degree of human system | Social development subsystem | Natural population growth rate | ‰ | Negative | 10 | 8 | 6 | 4 | 2 |
| Urbanization rate | % | Positive | 37 | 43.5 | 50 | 65 | 80 | ||
| population density | Person/km2 | Negative | 4000 | 2300 | 650 | 400 | 148 | ||
| Proportion of employees in the tertiary industry | % | Positive | 20 | 34 | 48 | 59 | 70 | ||
| Engel’s coefficient for urban residents | % | Negative | 60 | 55 | 50 | 40 | 30 | ||
| Per capita disposable income of urban residents | Yuan | Positive | 7700 | 16,350 | 25,000 | 62,500 | 100,000 | ||
| Per capita disposable income of rural residents | Yuan | Positive | 2500 | 5650 | 8800 | 26,900 | 45,000 | ||
| Per capita grain yields | Kilogram | Positive | 14 | 232 | 450 | 1225 | 2000 | ||
| Per capita comprehensive water consumption | m3 | Negative | 800 | 610 | 420 | 290 | 160 | ||
| Economic development Subsystem | Per capita GDP | Yuan | Positive | 39,000 | 60,000 | 81,000 | 190,500 | 300,000 | |
| Per capita fiscal revenue | Yuan | Positive | 3500 | 8750 | 14,000 | 19,500 | 25,000 | ||
| Per capita total social fixed asset investment | Yuan | Positive | 17,000 | 68,500 | 120,000 | 1,060,000 | 2,000,000 | ||
| Proportion of output value of tertiary industry in GDP | % | Positive | 20 | 32.5 | 45 | 57.5 | 70 | ||
| GDP growth rate | % | Positive | 2 | 3.5 | 5 | 7 | 9 | ||
| Growth rate of output value of tertiary industry | % | Positive | 7 | 9 | 11 | 12 | 13 | ||
| Science and technology development subsystem | Water consumption per CNY 10,000 of GDP | m3 | Negative | 450 | 250 | 50 | 30 | 10 | |
| Water consumption per CNY 10,000 of industrial added output | m3 | Negative | 65 | 47 | 28 | 17 | 5 | ||
| Irrigation water per mu of farmland | Cubic meter | Negative | 450 | 400 | 350 | 245 | 140 | ||
| Reuse rate of urban industrial water | % | Positive | 22 | 55 | 88 | 93 | 98 | ||
| College students per 10,000 people | Person | Positive | 32 | 181 | 330 | 415 | 500 | ||
| Harmony degree of human water system | Water supply subsystem | Water supply ratio of Agriculture | % | Negative | 91 | 77 | 63 | 46.5 | 30 |
| Water supply ratio of Industry | % | Positive | 3 | 11.5 | 20 | 32.5 | 45 | ||
| Water supply ratio of Domestic | % | Positive | 5 | 9 | 13 | 15 | 17 | ||
| Water supply ratio of Ecology | % | Positive | 1 | 2.5 | 4 | 6 | 8 |
Disclaimer/Publisher’s Note: The statements, opinions and data contained in all publications are solely those of the individual author(s) and contributor(s) and not of MDPI and/or the editor(s). MDPI and/or the editor(s) disclaim responsibility for any injury to people or property resulting from any ideas, methods, instructions or products referred to in the content. |
© 2024 by the authors. Licensee MDPI, Basel, Switzerland. This article is an open access article distributed under the terms and conditions of the Creative Commons Attribution (CC BY) license (https://creativecommons.org/licenses/by/4.0/).
Share and Cite
Liu, L.; He, L.; Zuo, Q. Evaluating the Human–Water Relationship over the Past Two Decades Using the SMI-P Method across Nine Provinces along the Yellow River, China. Water 2024, 16, 916. https://doi.org/10.3390/w16070916
Liu L, He L, Zuo Q. Evaluating the Human–Water Relationship over the Past Two Decades Using the SMI-P Method across Nine Provinces along the Yellow River, China. Water. 2024; 16(7):916. https://doi.org/10.3390/w16070916
Chicago/Turabian StyleLiu, Lu, Liuyue He, and Qiting Zuo. 2024. "Evaluating the Human–Water Relationship over the Past Two Decades Using the SMI-P Method across Nine Provinces along the Yellow River, China" Water 16, no. 7: 916. https://doi.org/10.3390/w16070916
APA StyleLiu, L., He, L., & Zuo, Q. (2024). Evaluating the Human–Water Relationship over the Past Two Decades Using the SMI-P Method across Nine Provinces along the Yellow River, China. Water, 16(7), 916. https://doi.org/10.3390/w16070916